assessing investment advice to participants in defined
TRANSCRIPT

Assessing Investment Advice Provided to Participants in Defined Contribution Retirement Plans
Brian Bell Christopher J. Denney
Brian Quinn Lillian Shields
Holden B. Weisman
May 2010
Public Affairs 869 Workshop in Public Affairs

©2010 Board of Regents of the University of Wisconsin System All rights reserved.
For additional copies: Publications Office
La Follette School of Public Affairs 1225 Observatory Drive, Madison, WI 53706
www.lafollette.wisc.edu/publications/workshops.html [email protected]
The Robert M. La Follette School of Public Affairs is a teaching
and research department of the University of Wisconsin–Madison. The school takes no stand on policy issues; opinions expressed in these
pages reflect the views of the authors.
ii

Table of Contents
List of Tables ........................................................................................................ iv List of Figures ...................................................................................................... iv Foreword ............................................................................................................... v Acknowledgments ............................................................................................. vii Key Terms and Acronyms ............................................................................... viii Results in Brief ................................................................................................... xiii Introduction .......................................................................................................... 1 Background ........................................................................................................... 4 Description of Retirement Savings and Savings Strategies ....................... 4 Perceived Deficiencies in Defined Contribution Plan Balances ............ 5 Why Retirement Savings Shortfalls May Exist ........................................ 6
Fee Structure for Defined Contribution Plans ........................................... 10 Legal Framework ........................................................................................... 11 Heightened Fiduciary Duties Under the Employee Retirement Income Security Act of 1974 ....................... 11 The Pension Protection Act of 2006 ......................................................... 13
Findings ............................................................................................................... 16 1. No empirical research is available to provide a comprehensive understanding of how participants receive advice; the advice that is available comes from many sources. ........................................... 16
2. Willingness to seek investment advice is highest among women and participants with higher incomes, and it increases with age. ...... 19
3. Most defined contribution plan participants have a poor understanding of the nature of advisor and investment fees or the significant impact of fees on returns. ........................................... 22
4. Available evidence is ambiguous about the impact of investment advice on defined contribution retirement plan outcomes. ................ 26
Conclusion and Recommendations for Further Study ................................. 29 Recommendations for Further Study .......................................................... 30
Works Cited ........................................................................................................ 32 Appendix A: Characteristics of Defined Benefit and Defined Contribution Plans ................................................................. 37 Appendix B: Trends of Defined Benefit and Defined Contribution Plan Contributions and Assets, 1975‐2007 ......................................................... 38 Appendix C: Types of Defined Contribution Plans ...................................... 40 Appendix D: Adequate Retirement Savings Levels ..................................... 42 Appendix E: Defined Contribution Plan Fees ............................................... 44
iii

Appendix F: Disclosure of Fees to Participants ............................................. 47 Appendix G: Changes in Plan Design and Effects on Default Contributions and Asset Allocations ......................................................... 48 List of Tables
Table 1: 401(k) Plan Participant Balances by Age Group ............................... 6 Table 2: Reported Advisor Use for Individual Recommendations
in Defined Contribution Plans in 2008 ........................................... 21 Table 3: Characteristics of Defined Benefit
and Defined Contribution Plans ..................................................... 37 Table 4: Administrative Fees Associated
with Defined Contribution Plans .................................................... 44 Table 5: Management Fees Associated with Three
Common Securities in Defined Contribution Plans ..................... 45 Table 6: Individual Service Fees Associated with Three
Common Securities in Defined Contribution Plans ..................... 46 Table 7: Disclosure of Fees to Participants ..................................................... 47 Table 8: Default Contribution Rate as a Percentage of Pre‐Tax Income .... 49 List of Figures
Figure 1: Number of Plan Participants by Type of Plan, 1975‐2007 ............. 2 Figure 2: 401(k) Balances under Differing Contribution Rates for
Individual with $40,000 Income ........................................................ 8 Figure 3: Defined Contribution Plan Account Balances
Under Differing Fee Regimes .......................................................... 25 Figure 4: Plan Contributions by Type
of Retirement Plan by Year, 1975‐2007 ........................................... 38 Figure 5: Total Assets Held by Type
of Retirement Plan by Year, 1975‐2007 ........................................... 39 Figure 6: Percentage of Plans with Automatic Enrollment Increasing ...... 48 Figure 7: Changes in Default Asset Allocations in 401(k) Plans ................. 49
iv

Foreword
This report is the result of collaboration between the Robert M. La Follette School of Public Affairs at the University of Wisconsin–Madison, and the Chicago office of the U.S. Government Accountability Office (GAO). Our objective is to provide graduate students at La Follette the opportunity to improve their policy analysis skills while contributing to the capacity of the GAO to provide the U.S. Congress with high quality analysis on important public policy issues.
The La Follette School offers a two‐year graduate program leading to a master’s degree in public affairs. Students study policy analysis and public management, and they pursue a concentration in a policy focus area of their choice. They spend the first year and a half of the program taking courses in which they develop the expertise needed to analyze public policies.
The authors of this report are all in their last semester of their degree program and are enrolled in Public Affairs 869, Workshop in Public Affairs. Although acquiring a set of policy analysis skills is important, there is no substitute for doing policy analysis as a means of learning policy analysis. Public Affairs 869 gives graduate students that opportunity.
This year the students in the workshop were divided into six teams, three under my supervision and three supervised by my La Follette School colleague Professor Susan Yackee. The authors of this report were assigned to work on a research project for the GAO on the adequacy of investment advice provided to participants in defined contribution retirement plans.
Over the past few decades much of the risk and burden of financing retirement has shifted from employers to employees as employers have increasingly relied on defined contribution plans, in which employees accumulate balances in self‐directed individual accounts. It is thus very important that retirement plan participants are given appropriate infor‐mation to make sound decisions about contributions and investments. The authors of this report have done a careful analysis of what is known about the quality of the investment advice that plan participants are receiving and the impacts of this advice on investment outcomes. The report con‐cludes with recommendations for additional research needed to explore
v

ways to improve the quality of investment advice provided to pension fund participants.
This report would not have been possible without the support and encouragement of Sharon Hermes, an economist in the Chicago GAO office. Dr. Hermes proposed the research topic and provided the authors of the report with advice and guidance throughout the semester. A num‐ber of other people also contributed to the success of the report. Their names are listed in the acknowledgements section of the report.
The report also benefited greatly from the support of the staff of the La Follette School. Mary Mead contributed logistic support and Karen Faster, the La Follette Publications Director, edited the report and managed production of the final bound document.
By involving La Follette students in one of many important issues facing government, I hope that they not only have learned a great deal about doing policy analysis but have gained an appreciation of the complexities and challenges facing governments and policy makers. I also hope that this report will contribute to the work of the GAO and to the ongoing public debates about how best to encourage people to save adequately for their retirement.
Andrew Reschovsky May 2010
Madison, Wisconsin, USA
vi

Acknowledgments
Our report would not have been possible without the support and guidance of numerous people. The authors would first like to thank the U.S. Government Accountability Office; in particular, Sharon Hermes, Anjali Tekchandani, and Amber Yancey‐Carroll, who were instrumental to the success of the report through their direction and feedback. The authors would also like to give special thanks to Rob McCalla of the University of Wisconsin–Madison Department of Consumer Science for his patience and assistance in helping us understand the financial services industry. Additional thanks is expressed to Karen Holden of the La Follette School of Public Affairs, Michael Collins of the Depart‐ment of Consumer Science, Barry Gerhart of the Business School, all at the University of Wisconsin–Madison, and Yan Xu of Hewitt Associates for sharing their expertise and pointing us toward valuable resources. Finally, we offer sincere gratitude to Andrew Reschovsky and Karen Faster at the UW‐Madison La Follette School of Public Affairs for their ongoing support and guidance on the content of the paper and its editing.
vii

Key Terms and Acronyms
Asset Allocation: An investment strategy that tries to balance risk and reward by choosing how much to invest in each asset class based on an individual’s investment goals, risk tolerance, and investment horizon (length of investing). Asset Class: A specific category of investment such as cash, bonds, equities, and real estate. Assets within the same class generally exhibit similar characteristics, behave similarly in the marketplace, and are subject to the same laws and regulations. Basis Point: One one‐hundredth of one percent. One hundred basis points is one percent. Defined Benefit (DB) Plan: A retirement plan providing a specified benefit to an employee upon reaching the plan‐designated retirement age (e.g. a pension). Defined benefit plans are funded actuarially. For a given benefit level, the annual funding amount is greater for employees who are older at entry into the plan since the time to fund the benefit is shorter (Leimberg & McFadden, 2009). (See Appendix A for a comparison of Defined Benefit and Defined Contribution plan characteristics.) Defined Contribution (DC) Plan: A retirement investment plan in which an employer or employer organization establishes and maintains an individual account for each participant. Benefits are available at retirement or termination of employment. The employer does not guarantee the amount of benefit available; the contributions from the employee and employers determine the account balance (Leimberg & McFadden, 2009). DOL: U.S. Department of Labor ERISA: Employee Retirement Income Security Act of 1974 Equity: A stock or any other security representing an ownership interest. ETF: Exchange traded fund. A class of security that tracks an index, but can be traded like an equity.
viii

Expense Ratio: A percentage of the assets under management that are charged as fees in order to cover management and trading costs for the funds. Fee‐leveling: An eligible investment advice arrangement as defined in the Pension Protection Act of 2006. Fee‐leveling requires that any fees (including commission or other compensation) received by the fiduciary advisor for investment advice or with respect to the investment of plan assets do not vary depending on the basis of any investment option selected (U.S. Department of Labor [DOL], 2007). Fiduciary: A person who is required to act for the benefit of another person on all matters within the scope of their relationship; a fiduciary must exercise a high standard of care in managing another’s money or property (Black’s Law Dictionary, 1996). According to ERISA, a fiduciary must carry out his or her duty with the exclusive purpose of providing benefits to participants and plan beneficiaries (DOL, n.d.d). Financial Advisor: A broad term for any professional helping an indivi‐dual develop a detailed plan to address personal financial needs. This plan can include but is not limited to: budgeting, tax planning, education investment planning, retirement planning, risk and insurance manage‐ment, and estate planning. A financial advisor can be an attorney, certified public accountant, certified financial advisor, insurance consultant, or an investment advisor. Certified financial advisors receive professional certification and must earn continuing education credits to retain their licenses. Financial Literacy: An individual’s ability to make informed judgments and effective decisions about the use and management of their money. Fixed Annuity: A contract between an insurance company and an indivi‐dual in which the insurance company guarantees that the individual will earn a set minimum rate of interest during the vesting period. The insur‐ance company also guarantees that periodic payments will be a guaran‐teed dollar amount per year for a definite or indefinite period. (Securities and Exchange Commission, n.d). Investment Advisor: A person who receives compensation for advising others as to the value of securities or as to the advisability of investing in,
ix

purchasing, or selling securities, or who, for compensation and as part of a regular business, issues or promulgates analyses or reports concerning securities. An investment advisor does not include attorneys, accountants, engineers, or teachers whose provision of such services is solely incidental to the practice of his or her profession (Investment Advisors Act, 1940b). IRA: Individual Retirement Account IRS: Internal Revenue Service Plan Participant: An employee who maintains an employer‐sponsored retirement account, whether the plan is a defined benefit or defined con‐tribution plan. Plan Provider: A firm or other entity contracted by employers and respon‐sible for developing a defined contribution plan or other employer‐spon‐sored plan to be offered to employees, e.g. Fidelity Investments. Plan Sponsor: Employers become a sponsor when they establish retire‐ment plans for their employees. Their roles can include any of the follow‐ing: contributing to participants’ accounts, deciding the investment options from which participants may choose, processing contributions to send to investment service providers, record keeping, and paying costs associated with plan maintenance (Government Accountability Office [GAO], 2009). PPA: Pension Protection Act of 2006 Rebalancing: Selling or buying certain asset classes within one’s investment portfolio to achieve or maintain a desired asset allocation. Retirement Confidence Survey: Annual survey cosponsored by the Employee Benefit Research Institute, the American Savings Education Council, and Matthew Greenwald & Associates. For further information on the survey, see http://www.ebri.org/surveys/rcs/ (Employee Benefit Research Institute, n.d). Security: Any note, stock, treasury stock, security future, bond, debenture, evidence of indebtedness, or certificate of interest (Investment Advisors Act, 1940c).
x

Stockbroker: Person who engages in the business of effecting transactions in securities for the accounts of others. Also known as a broker. (Invest‐ment Advisors Act, 1940a). Target Date Funds/Life Cycle Funds: A form of mutual fund that automatically changes the allocation from more aggressive asset allocations to more conservative allocations as an investor approaches retirement. Target Risk Funds: Mutual funds that attempt to maintain a specified amount of risk. Generally labeled in categories such as “conservative,” “moderate risk,” and “aggressive.” Variable Annuity: A contract between an individual and an insurance company in which the individual makes a lump‐sum payment or series of payments. In exchange, the insurer agrees to make periodic payments to the individual immediately or at some future date. The individual invests in a range of securities, although mutual funds are the most common security in a variable annuity (Securities and Exchange Commission, n.d).
xi

xii

Results in Brief
Enrollment in employer‐sponsored retirement plans continues to shift away from defined benefit plans and toward defined contribution (DC) plans. As a result of this shift, plan participants assume a significantly greater level of responsibility for ensuring that their retirement invest‐ments will provide sufficient income throughout retirement. This shift in responsibility makes retirement investment advice increasingly influential in determining the retirement income and quality of retirement life for Americans. The U.S. Government Accountability Office (GAO) commissioned this report to explore the investment advice available to participants in DC plans, including the sources of such advice, the level of participant com‐prehension and utilization of advice, and the factors that affect participant comprehension and utilization. Our methodology includes qualitative interviews with academic and professional experts, as well as a compre‐hensive literature review of academic and professional research, govern‐ment regulations and guidelines, briefs from think tanks, and survey data analysis. We first describe the structure of DC retirement savings plans, as well as the current state of retirement savings and trends in saving strategies. We briefly describe the current fee structure for DC plan participants. We also explain the federal regulatory structure pertaining to investment advice for participants of employer‐sponsored retirement accounts. In this section, we highlight relevant provisions from the Employee Retirement Income Security Act of 1974, including the fiduciary responsibilities of advisors, and the Pension Protection Act of 2006. We find that participants generally lack access to comprehensive, unbiased investment advice and sometimes fail to heed the offered advice. Most participants do not receive advice from any single source, though a lack of empirical research about the sources of advice makes it challenging to draw conclusions. Willingness to seek investment advice is highest among women and participants with higher incomes, and it increases with age. Most DC plan participants have a poor understanding of the nature of advisor and investment fees or the significant impact of fees on returns.
xiii

xiv
Finally, the evidence is ambiguous about the impact of investment advice on DC retirement plan outcomes. We recommend that the GAO perform additional research to fill gaps in the literature relating to investment advice. This research should specifically target the sources of advice and its impact on participant behaviors. To better understand the development of such behaviors, we further recommend developing a clear comprehension of who seeks advice and what lasting effects this active participation may have on returns. Recognizing a scarcity of available information, we propose additional research about how to improve participants’ understanding regarding the impact of fees on returns and how to potentially make these improvements at the plan level. Such research would allow the GAO and other stakeholders to make informed policy recommendations to improve the inadequate saving strategies of many Americans.

1
Introduction
Throughout the latter half of the twentieth century, pension plans served as a primary source of personal retirement funds for many households in the United States. Most pensions were in the form of defined benefit (DB) plans that provided specified benefits to the employee upon retirement (Ezra, 2007). Combined with Social Security and personal savings, the system enabled millions to gain financial security during retirement (Hardy, 2002). By the 1980s, companies transitioned to offering defined contribution (DC) retirement plans instead of pensions.1 In DC plans, the amount of employee and employer contributions and the performance of the investments determine the account balance; the employer does not guarantee the amount of benefits available upon retirement (Leimberg & McFadden, 2009). Unlike DB plans, DC plan participants are responsible for contributing to and managing their investments (Purcell, 2007). While some employees have both DB and DC retirement plans, DC plans are increasingly more common. By 2007, the number of DB plan participants had risen to 42 million from 33 million in 1975, while the number of DC plan participants surpassed 82 million from 11.5 million in 1975 (Figure 1). A corresponding increase in DC plan contributions and total plan assets during this period also reflects the shift from DB plans to DC plans (see Appendix B for figures illustrating the historical trend of DB and DC plan contributions and assets) (DOL, 2010b). Together these facts suggest DC plans now have a prominent position in financing the retirement of millions of Americans.
1 A primary driver of the shift to DC plans was the rising numbers of individuals retiring, combined with new federal legislation that increased employee security but made DB plans more costly (Hardy, 2002). Pressure on corporations in the 1980s to produce shareholder value also reduced corporate willingness to fund pensions (Ezra, 2007).

2
Figure 1: Number of Plan Participants by Type of Plan, 1975-2007
Source: DOL, 2010b, p. 5.
In addition to the growing number of Americans who rely on DC plan balances to fund retirement, the federal government has an incentive to heed the rise of DC plans because of their cost. The deferred tax treat‐ment of DC plans constitutes one of the largest tax expenditures by the federal government. In fiscal year 2011, tax expenditures on 401(k) plans alone are expected to reach $67 billion (Employee Benefit Research Insti‐tute, 2010). DC plan participants have the responsibility to ensure adequate savings upon retirement. To effectively manage their account balances, partici‐pants must possess a working knowledge of financial principles such as compounding, asset allocation, diversification, and investment risk. Given the complexity of navigating modern financial markets, many participants would benefit from some form of advice from a financial advisor to ensure adequate funds upon retirement. Yet, many participants have not found a financial advisor to assist them and lack the level of financial literacy necessary to effectively manage their DC plans (Lusardi, 2009). Conse‐quently, many DC retirement plans are not funded to an adequate level (Brady, 2009).
0
20
40
60
80
100
120
140
Numb
er of
Plan
s Held
(in m
illion
s)
Year
Total Plans Held Defined Benefit Plans Defined Contribution Plans

The U.S. Government Accountability Office (GAO) commissioned this report to explore the investment advice available to participants in DC plans, including the sources of such advice, the level of participant com‐prehension and utilization of advice, and the factors that affect participant comprehension and utilization. Our methodology includes qualitative interviews with academic and professional experts, as well as a compre‐hensive literature review of academic and professional research, gov‐ernment regulations and guidelines, briefs from think tanks, and survey data analysis. We find that participants generally lack access to compre‐hensive, unbiased investment advice and sometimes fail to heed the offered advice. We recommend further empirical research on the sources of advice and the impact of advice on investment returns.
3

Background
Several forms of DC plans exist, each named for and defined by specific sections of the Internal Revenue Code. (See Appendix C for a summary of DC plan types.) Employees can make contributions to these retirement savings accounts, and employers can choose to match these contributions. The contributions and earnings are not taxed until the funds are with‐drawn from the accounts. The DC plan balance fluctuates over time as the value of investments rises and falls. DC plans also allow employees to choose the level of desired risk by distributing contributions across several asset classes including equities, bonds, and money market accounts (GAO, 2009). The role of employers and employees in maintaining DC plans varies according to how the plan is structured and to the preferences of employ‐ers and employees. As plan sponsors, employers play a number of roles, including financially contributing to individual accounts, deciding the investment options from which employees may choose, and processing contributions to send to plan providers. Employees are considered the participants in DC plans and have several responsibilities: deciding to participate, contributing to their accounts, choosing among investment options, transferring assets between plans, and paying all or part of the plan fees (GAO, 2009).
Description of Retirement Savings and Savings Strategies
Although DC plans allow participants greater flexibility in financial planning and include significant incentives to save for retirement, effective financial planning requires active oversight and strong investment knowledge by the participant. However, there is substantial evidence that individuals may not be managing their plans effectively or are unaware of how to manage their plans. The following two sections discuss the perceived deficiencies in DC plan balances and the practices and behaviors on the part of plan sponsors and participants that contribute to these deficiencies.
4

Perceived Deficiencies in Defined Contribution Plan Balances
Expert opinion varies regarding what is an adequate level of post‐retire‐ment savings. As a consequence, the extent to which DC plan balances are perceived to be deficient also varies. The purpose of personal retirement savings, including DC plan savings, is to augment income from Social Security, other retirement savings, and DB pension plans in order to restore anywhere between a large portion and all of a plan participant’s income before retirement. The required level of replacement income depends greatly on the living situation of the retirees and pre‐retirement income. As a result, the amount of savings needed to provide for those replacement levels varies consider‐ably. In particular, the level of replacement needed is affected by the pre‐retirement income of an individual (Brady, 2009; Weller, 2002). For exam‐ple, high‐income retirees do not require nearly as large of a proportion of their pre‐retirement income as lower income earners. For instance, those with $90,000 in pre‐retirement income may only require 78 percent of their pre‐retirement income while those with less than $30,000 may need 94 percent or more (Aon Consulting, 2008). Additionally, financial experts rely on a number of different assumptions, including the cost of long term care, that strongly influence what are considered to be adequate levels of private savings. Appendix D outlines some of these assumptions. By most of the standards commonly used by practitioners in the field and in academia, many DC plan balances are at insufficient levels to ade‐quately fund retirement. The median 401(k) balance in 2007 was $57,933 (VanDerhei et al., 2009). Due to the financial crisis in 2008 and the large declines in asset values that accompanied it, the median balance fell to $43,700. Similar data for 2009 were not available as of the writing of this report, but balances undoubtedly recovered a large portion of these declines as the market improved. Average balances were considerably higher than the median balances, at nearly double the median values in both 2007 and 2008, reflecting an uneven distribution of plan balances across participants, as displayed in Table 1. Table 1 illustrates the changes in average and median account balances, since 2003, from survey data of 24 million 401(k) plan participants the Employee Benefit Research Institute conducted. The table also demonstrates differences in average 401(k) balances by age group.
5

Table 1: 401(k) Plan Participant Balances by Age Group
Year All Participants
60s Average Balance
50s Average Balance
40s Average Balance
30s Average Balance
20s Average Balance
Median Balance
Average Balance
2003 $25,507 $61,106 $105,663 $79,627 $48,092 $19,316 $4,579 2004 33,278 73,253 120,541 95,049 59,727 26,660 8,286 2005 40,006 83,441 130,743 107,945 70,115 33,816 12,335 2006 49,777 99,864 148,882 129,073 86,165 43,915 17,568 2007 57,933 114,337 162,290 148,043 100,744 53,464 22,851 2008 43,700 86,513 125,052 113,070 74,148 39,883 18,598
Source: VanDerhei et al., 2009 An examination of the average account balances of those nearing retirement illustrates several key points about the adequacy of retirement accounts. Among those in their 50s, the average account balance stood at $148,043 in 2007 and $113,070 in 2008, while the average balance for those in their 60s fell from $162,290 in 2007 to $125,052 in 2008 (VanDerhei et al., 2009). These values highlight two important findings about the state of DC plans. First, it is evident that retirees or those nearing retirement witness high levels of volatility in their retirement accounts, even though investment advisors generally recommend that those closer to retirement should take a more conservative investment posture. Second, these balances are likely insufficient to assist in maintaining an adequate portion of a retiree’s pre‐retirement income. Although standards about the adequacy of retirement accounts vary based on assumptions regarding what proportion of pre‐retirement income is necessary and what additional costs retirees may encounter, most standards indicate that the present balances are insufficient. See Appendix D for a more detailed discussion including how standards vary with income levels.
Why Retirement Savings Shortfalls May Exist
Investment decisions made by plan participants regarding asset allocations, contribution rates, and risk tolerances have a large effect on the long‐term performance and accumulation of DC plan balances. A large body of evi‐dence suggests that plan participants engage in strategies and behaviors that significantly reduce their long‐term rates of return. Deficiencies in the provi‐sion and the quality of investment advice for DC plan participants, along with poor financial literacy, could explain these behaviors and practices.
6

7
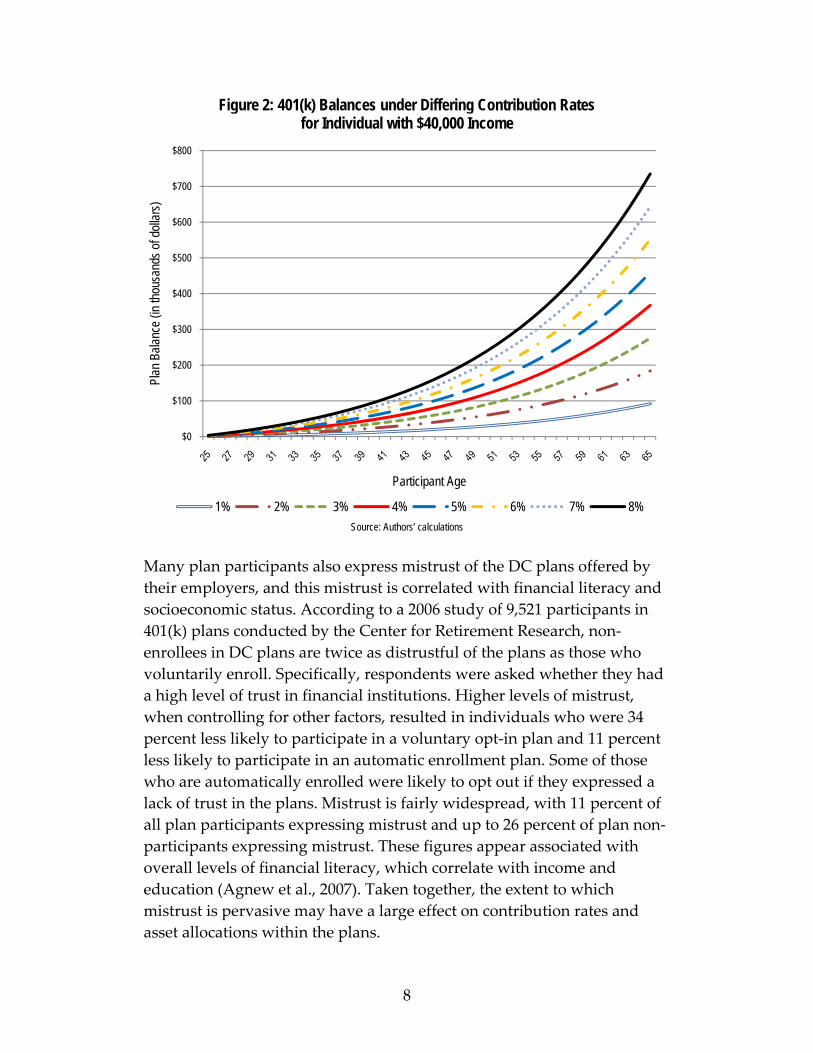
If DC plans are viable as an adequate source of retirement income, then attention should center on why the plans appear to be falling short of their objective of maintaining adequate proportions of the participants’ pre‐retirement incomes along with other sources. A significant contributor to the shortfall is individuals’ behavior, which, at least partially, appears to be a factor of low levels of information or poor understanding of rudi‐mentary financial concepts. For instance, in many cases DC plan partici‐pants do not fully understand or take advantage of the employer match (Robert B. McCalla, in person interview, February 25, 2010).2 Lack of knowledge about the employer match might explain a great deal of plan balance deficiencies. The extent to which employees do not contribute adequate amounts to their plans damages long‐term returns. Among other factors, low contribution rates are heavily influenced by default contribution rates in DC plans. Most employers choose default contribution rates for their employees well below the permissible limit. Often these rates are only 2 to 3 percent of income instead of the maximum of 10 percent. Employees working at a firm for a short period of time are unlikely to change these default participation rates while employees with greater levels of tenure are more likely to increase their contribution levels. Because of these ten‐dencies, default rates are vital in influencing employees’ savings behavior, and thus sponsors’ plan design is a significant source of DC plan deficien‐cies. Poor plan design can lead to both lower participation and contribu‐tion rates (Choi et al., 2004). Figure 2 demonstrates the differential under contribution rates of between 1 percent and 8 percent of pre‐tax income for an individual earning $40,000 a year, calculated using a 7 percent average return with reinvested dividends and interests.
2 Robert B. McCalla, Ph.D., CLU, ChFC, CFP®, is the Director of the Personal Finance Program for the Department of Consumer Science, School of Human Ecology, University of Wisconsin‐Madison.
8
Figure 2: 401(k) Balances under Differing Contribution Rates for Individual with $40,000 Income
Source: Authors’ calculations
Many plan participants also express mistrust of the DC plans offered by their employers, and this mistrust is correlated with financial literacy and socioeconomic status. According to a 2006 study of 9,521 participants in 401(k) plans conducted by the Center for Retirement Research, non‐enrollees in DC plans are twice as distrustful of the plans as those who voluntarily enroll. Specifically, respondents were asked whether they had a high level of trust in financial institutions. Higher levels of mistrust, when controlling for other factors, resulted in individuals who were 34 percent less likely to participate in a voluntary opt‐in plan and 11 percent less likely to participate in an automatic enrollment plan. Some of those who are automatically enrolled were likely to opt out if they expressed a lack of trust in the plans. Mistrust is fairly widespread, with 11 percent of all plan participants expressing mistrust and up to 26 percent of plan non‐participants expressing mistrust. These figures appear associated with overall levels of financial literacy, which correlate with income and education (Agnew et al., 2007). Taken together, the extent to which mistrust is pervasive may have a large effect on contribution rates and asset allocations within the plans.
$0
$100
$200
$300
$400
$500
$600
$700
$800Pl
an B
alanc
e (in
thous
ands
of do
llars)
Participant Age
1% 2% 3% 4% 5% 6% 7% 8%

Plan participant behavior with regard to the administration of their accounts appears to be a possible contributor to poor performance. For example, market shocks like the 2008 financial crisis affect the behavior of DC participants; many participants decided not to continue contributions to their retirement plans in the wake of this downturn, even if they were close to retirement. Rather than attempt to rebuild their savings or take advantage of depressed financial asset prices, many of those near retire‐ment instead focused on improving their personal finances by spending less and paying off existing debt (Sass et al., 2010). Some reallocated away from stocks and into cash or bonds, which locked in losses into their retirement plans that may prove difficult to recover. These practices run counter to the advice of investment professionals, which is to retain the allocation determined to be the best for the investor. When prices are low, the portion of all assets devoted to equities decrease. As equities histor‐ically provide the best long‐term returns, maintaining the desired asset allocation is crucial to the long‐term appreciation in DC plan account bal‐ances. In short, participant behavior demonstrates that, in response to large declines in the value of their DC plans, some are predisposed to engage in behavior that damages the long‐term viability of their accounts. The degree of plan participant involvement in monitoring and managing their investments is strongly related to the performance of DC plans. Rebalancing, whether active or passive, is important to ensure that a retirement account avoids overexposure to a single asset class. As asset allocations change with market returns, rebalancing shifts the plan’s assets to a targeted optimal allocation among different kinds of investment pro‐ducts. Based on data from over one million DC accounts, only 10 percent of participants engage in any form of rebalancing. Participants who pas‐sively rebalance by exclusively owning funds that are automatically rebalanced, such as balanced mutual funds or lifecycle funds, outperform those who did not rebalance by 84 basis points (or 0.84 percent) per year; those who actively rebalance outperform those who do not rebalance by 26 basis points. On the other hand, the small proportion of participants with very high turnover rates (those who trade assets frequently) under‐perform compared to those who did not manage their accounts at all (Yamaguchi et al., 2006). Implicitly these trends suggest that most plan participants are not following generally accepted investment advice regarding portfolio rebalancing, as they either do not rebalance at all or have very high turnover rates that harm their returns.
9

The issues uncovered in this discussion point to deficiencies in the provision of investment advice, including a basic lack of educational information provided by both plan providers and plan sponsors. Plan participants are also accountable, as balance deficiencies may be explained by their willingness to ignore or their failure to understand advice. When participants actively utilize investment advice, however, there is some evidence that they perform better although results have been inconsistent. A more in‐depth discussion of these results follows in the findings section.
Fee Structure for Defined Contribution Plans
Fees associated with DC plans fall into one of three categories: administra‐tive fees, management fees, and individual service fees. Plan administra‐tive fees account for the provision of the daily expenses accrued for ser‐vicing DC plans including accounting, record‐keeping, and legal services. Management fees cover the costs associated with activities such as moni‐toring and adjusting the securities in a particular fund. Individual service fees include the buying and selling of shares and other optional services provided by plans (GAO, 2009; DOL, n.d.a). For a more complete discussion of these fees, see Appendix E.
No single or centralized source of information exists for participants to learn about the fees charged to their accounts. However, several items may help a participant identify fees in a piecemeal fashion. Participants in DC plans subject to the Employment Retirement Income Security Act of 1974 (ERISA) must receive a summary plan description, account state‐ments, and a summary annual report. None of these documents must disclose the fees incurred by individual participants although companies may elect to provide some fee information. Only the summary annual report must disclose the total plan costs collectively paid by participants. Most securities in DC plans are also subject to oversight by the Securities and Exchange Commission, and each plan provider must furnish plan sponsors with a prospectus that includes the expense ratio, which is the percentage of the assets under management that is subject to fees. Although many plan sponsors pass the prospectus along to participants in DC plans, they are under no obligation to do so (GAO, 2006).
It is unclear to what extent participants are aware of the fees their DC plans charge. The findings section of this paper explores this topic further
10

by detailing the impact of fees on retirement savings and discussing how some securities may be more conducive to growing DC plan balances.
Legal Framework
The Employee Benefits Security Administration within the U.S. Depart‐ment of Labor (DOL) administers and enforces the fiduciary, reporting, and disclosure requirements of federal legislation that regulates retire‐ment plans (DOL, 2010a). Since 2000, Congress and the DOL have re‐examined the legal standards for investment advice in light of the shift from DB to DC retirement plans and increasing concerns that plan parti‐cipants exhibit a low degree of financial literacy regarding fees and advisable investment strategies.
Heightened Fiduciary Duties Under the Employee Retirement Income Security Act of 1974
ERISA imposes extensive employer reporting and disclosure requirements for employer‐provided retirement plans. This legislation is the foundation of the modern federal regulatory structure for retirement accounts. ERISA improves transparency for plan participants by, for example, requiring employers to provide participants a summary plan description of the plan’s major provisions in plain language (Leimberg & McFadden, 2009). ERISA establishes a heightened fiduciary duty for those who administer and manage qualified retirement plans (DOL, n.d.b). A fiduciary must act with a “prudent man standard of care,” which requires that plans be man‐aged for the exclusive benefit of plan participants (Employee Retirement Income Security Act [ERISA], 1974). ERISA creates a heightened fiduciary duty beyond that established in the Investment Advisers Act of 1940, in which the fiduciaries who provide consulting services have an obligation to provide disinterested advice and to disclose material documents (Securities and Exchange Commission, 2005). Fiduciary responsibilities under ERISA are expanded to include: acting solely in the interest of plan participants and their beneficiaries with the exclusive purpose of providing benefits to them; carrying out their duties prudently; following the plan documents (unless inconsistent with ERISA); diversifying plan investments; and paying only reasonable plan expenses (DOL, n.d.d). ERISA allows independent investment advisors to render advice to DC plan participants as fiduciaries.
11
12
As such, they are compensated whether or not a sale is made because the advice is considered the product. Compensation is a flat fee that is not influenced by the selection of particular securities or insurance tools in a DC plan (Robert B. McCalla, in person interview, April 14, 2010).
The Employee Benefits Security Administration monitors fiduciary compli‐ance. A fiduciary advisor who fails to follow the prescribed standards of conduct may be personally liable for losses. Moreover, employers, unions, plan fiduciaries, and service providers may not engage in prohibited trans‐actions. A prohibited transaction protects against the use of plan assets for the fiduciary’s own interest and generally bars a fiduciary from having a financial interest in both the buying and selling of products for a qualified plan. The DOL may grant exemptions from prohibited transactions (DOL, 2008). In 2001, the DOL issued an advisory opinion in response to a request by SunAmerica Retirement Markets Inc. for an exemption from the ERISA prohibition on giving investment advice to ERISA‐covered retirement plan participants (DOL, 2001). In the advisory opinion, the DOL deemed it allowable for an investment firm whose profits might increase based on products sold to render asset allocation services to plan participants in limited circumstances. Under the SunAmerica Opinion, advice must be based on the output of a computer program that applies methodology developed, maintained, and overseen by an independent third‐party financial expert who is external and unconnected to the investment firm. Further, the advisory opinion explicitly specifies the fees that SunAmerica and the independent financial expert could receive.3 The opinion also clar‐ifies that a firm giving investment advice for a fee would be acting as a fiduciary and is thus subject to the ERISA regulations to act prudently in
3 According to the SunAmerica Opinion, the investment advisor may receive a fixed percentage of the assets invested, up to a maximum of 100 basis points (i.e. up to one percent of the total assets invested). The advisor may additionally receive a maximum of 25 basis points as a fixed percentage of plan assets for facilitator fees and for direct expenses (as defined in 29 C.F.R. section 2550‐408c‐2) that the advisor paid to unaffiliated third parties for goods and services provided in connection with operating the program. These fees will not vary based on the asset allocations made or recommended by the independent financial expert. The financial expert receives compensation from the investment advisor for his or her services. According to the SunAmerica Opinion, the financial expert’s compensation will not be affected by the participant’s decisions regarding asset investment (DOL, 2001).
the client’s best interest; the independent third‐party financial expert, however, would not be acting as a fiduciary (DOL, 2001). No research specifies how many firms operate under the SunAmerica Opinion. In the early 2000s, elected officials introduced several pieces of federal legislation to address the growing concern about the default of several large pension plans and the inadequate advice received by plan partici‐pants. The SunAmerica Opinion was an acknowledgment that ERISA fiduciary and prohibited transaction regulations resulted in participants receiving insufficient advice to make informed decisions.
The Pension Protection Act of 2006
The Pension Protection Act of 2006 (PPA), which amends ERISA, is the first major federal legislation to address pensions and retirement plans since the enactment of ERISA in 1974. While a primary goal of the act is to address under‐funded pensions, the PPA includes several significant provisions relevant to investment advice for DC plan participants. The PPA creates an exemption from the prohibited transactions provision; it allows fiduciary advisors, with some limitations, to give DC plan parti‐cipants investment advice for compensation. Prior to this exemption, fiduciaries could not give investment advice to plan participants if it led to the payment of additional fees to fiduciaries or their affiliates (DOL, 2009). The PPA requires an annual audit of investment advice arrangements. It requires advisors to disclose fee arrangements to plan participants. Advisors must also inform participants if the advisor has affiliations with the investment products recommended or with the developer of the computer model (Purcell, 2006). The DOL has proposed regulations to implement the PPA that have not yet been approved. The SunAmerica Opinion and the PPA increase the avenues by which a fiduciary may give investment advice. Prior to these changes, those advisors with a fiduciary duty could only offer investment advice if they worked on a flat fee basis and independently from those overseeing the financial products. After the opinion and the new legislation, fiduciary advisors have several additional mechanisms by which they can give investment advice. While the SunAmerica Opinion enabled advisors to give advice based on the output of a computer model designed by an independent third‐party expert, in contrast, the proposed PPA regulations allow a financial services firm to develop the computer model in‐house
13

14
and to certify it via an independent third party.4 The purpose of advice based on computer models is to objectively assist participants selecting investment options within DC plans. Therefore, the advisor can recom‐mend products to the participant based on the computer model, even if that advice would increase advisor fees. Alternatively, lenders can provide advice under a flat‐fee arrangement, meaning advisors cannot increase their compensation by influencing participant selection of securities; advisors who use fee‐leveling may choose whether to use a computer model (Purcell, 2006). The PPA requires plan advisors to disclose certain information to partici‐pants. Plan advisors are firms contracted to provide recommendations regarding the securities included in a DC plan. Information to be disclosed includes: the role of any party that has a material affiliation or contractual arrangement with the advisor; the past performance of securities included in the plan; and the fees or other compensation the advisor receives in connection to the provision of advice and the sale, acquisition, or holding of any security (Pension Protection Act, 2006). Currently, many firms that provide services similar to plan advisors attempt to divest themselves of such responsibilities by using contract language that indicates no advice is rendered, but rather, information is merely provided for the corporation to make independent decisions. Thus, in many instances plan participants do not receive this disclosure (GAO, 2008). Although the PPA regulations have not yet been adopted, when imple‐mented, the act would likely have widespread impact given the number of people who work with or possess DC accounts. The DOL estimates more than 83,000 DC plans for approximately 2 million participants would be affected by better access to quality, expert investment advice. Approxi‐mately 16,000 investment advisory firms, including broker‐dealers, would be affected by the new PPA regulations. The firms would face extra costs: the annual preparation and distribution of 15 million disclosure state‐ments to plan participants; the preparation and maintenance of records; the preparation of policies and procedures to assure compliance with the
4 The computer model must apply generally accepted investment theories that take into account the historic risks and returns of different asset classes. The computer model may consider information specific to the participant, such as age, time horizons, risk tolerance, current investments in designated investment options, and other assets (DOL, 2010c).

investment advice exemption; the certification of the computer model; and the audit of the investment advice arrangement (DOL, 2010a). In addition to these provisions, the PPA contains changes that are impli‐citly relevant to an analysis of investment decisions in DC plans. First, the act enables employers to automatically enroll employees in their DC plans, which means that employers can now instigate participation on an opt‐out basis rather than an opt‐in basis (Internal Revenue Service [IRS], 2007). Comprehensive research on the number of companies who offer opt‐out investment plans rather than opt‐in plans is not available. Yet, research available from firms that administer DC plans indicate that participation rates are dramatically higher in firms that automatically enroll employees in retirement plans (Choi et al., 2004). Second, the legi‐slation allows employers to choose default investment options for plan participants who did not make an election and would otherwise have their assets automatically placed in to a low yield money market account (IRS, 2007). Third, the PPA requires employers to allow DC plan partici‐pants to divest employer securities into other investment options. Em‐ployers must offer at least three alternative investments, in addition to employer securities, so that participants can diversify their securities beyond employer stock (Purcell, 2006). Fourth, the PPA requires the DOL to draft a model notice for employers to distribute to participants regarding fee disclosures related to advice. This provision encourages increased transparency regarding fees for investment advice (IRS, 2007).
15

Findings
This report identifies key issues and concerns with the current state of investment advice for DC plans and suggests opportunities for future research. Our methodology includes qualitative interviews with academic and professional experts, as well as a comprehensive literature review of academic and professional research, government regulations and guidelines, briefs from think tanks, and survey data analysis. Our review led to the following four findings.
1. No empirical research is available to provide a comprehensive understanding of how participants receive advice; the advice that is available comes from many sources.
Academic and professional literature does not offer a comprehensive overview of how plan participants receive advice. Specifically, there exists a dearth of information related to where people get advice and the process by which they acquire it (Hung & Yoong, 2010). Data that private firms collect about participant use of advice are proprietary and unavailable for public use. Advice comes from a number of places. When an employee starts a job that offers a retirement plan, he or she might receive general information about plan participation from a human resources representative employed by the company. The human resource employee is not authorized to give investment advice and will likely direct investment questions to the investment plan’s general phone numbers (Robert B. McCalla, in person interview, February 25, 2010). Some firms offering retirement plans bring in financial advisors to give general advice to employees. A firm may choose not to require new em‐ployees and retirement plan participants to seek advice, though general information about the plan might be part of a mandatory orientation session for new hires. A large firm might have hiring cycles with new employees starting regularly and might choose to bring in a financial advisor to talk about alternative retirement savings strategies. Small to medium firms might not regularly hire new employees but still may have an incentive to bring in financial advisors to encourage all employees to participate in the plan (Robert B. McCalla, in person interview, February
16
17
25, 2010). An incentive exists for small and medium size firms because Internal Revenue Service (IRS) regulations tie the amount that highly compensated employees are allowed to contribute to a tax‐deferred plan to the contribution rates of non‐highly compensated employees. Raising overall participation at small or medium size firms allows highly compen‐sated employees to invest more in their own tax‐deferred retirement funds (IRS, 2005). The financial advisor has an incentive to participate in order to attract new paying clients for individual follow‐up sessions on plan in‐vestments (Robert B. McCalla, in person interview, February 25, 2010). Some employees probably receive advice informally through discussions with co‐workers, friends, and family (J. Michael Collins, in person inter‐view, February 26, 2010).5 Our research revealed no empirical examina‐tions of informal advice processes through which plan participants receive investment advice. Given the likelihood of informal advice networks influencing investment decisions, research on this topic would address a substantial deficiency in the literature. Beyond seeking investment advice through the workplace, DC plan participants can seek out publicly available advice. The internet is one such source of information. Online advice offered by insurance and mutual fund companies is usually generic information that encourages portfolio diversification across asset classes. The longer the investor’s time horizon, the larger the suggested proportion of assets that should be in equities (Bodie, 2002). Information from the internet is generic for two primary reasons. First, advisors do not want to provide specific information to the general public about how to balance a portfolio because of their fiduciary obligations to work in a client’s best interest. Without knowing specific information regarding an individual, it is impossible to tailor information available on the internet. Second, online advice works as a marketing tool for financial advisors. They want to raise consumer awareness so that consumers become engaged in thinking about asset management and financial planning but they do not want to give away services for free. Via internet access, consumers may become aware that asset diversification is in their best interest but they do not gain specific information on which funds to
5 J. Michael Collins, Ph.D., is an Assistant Professor of Consumer Science, School of Human Ecology, University of Wisconsin‐Madison.

18
buy. Taken together, online tools offer too little information about how to address all the decisions prospective investors must make (Robert B. McCalla, in person interview, February 25, 2010). Generic advice provided on the internet might not be optimal. Such advice relies on two general assumptions that are common among investment advisors: (1) that investors should diversify across asset classes, and equities should be diversified across industries and com‐panies; and (2) the longer the investor’s time horizon, the larger the percentage of assets he or she should invest in equities (Bodie, 2002; Robert B. McCalla, in person interview, February 25, 2010). Advice from internet sites may also measure returns using an average compounding rate over the investor’s time horizon rather than taking into account the fact that losses may be incurred at specific points in time. Additionally, even for a person who indicates a strong aversion to risk or one who is nearing retirement, online investment advice may tend to recommend equity investments. Online advice may overlook risks to the stability of one’s income that would affect the investor’s ability to contribute (Bodie, 2002). Therefore, although there is not a definitive research finding that internet investment advice is inadequate, the general consensus is that such advice is too generic and may rely on faulty assumptions. A plan participant seeking information about investing in a retirement plan can consult a financial advisor.6 If the financial advisor has a height‐ened fiduciary responsibility under ERISA, he or she has a duty to act prudently and “solely in the interest of plan participants and their beneficiaries and with the exclusive purpose of providing benefits to them” (DOL, 2008). Prior to the SunAmerica Opinion and the PPA, a fiduciary advisor could not render investment advice about financial products if it would result in an increase in compensation. An advisor whose compensation could increase based on the product sold was lim‐ited to giving participants advice about risk allocation and the amount necessary to contribute to the plan in order to reach financial goals for retirement. With the rendering of the SunAmerica Opinion and the PPA, fiduciary advisors may give investment advice if the advice is based on the output of a computer model designed by an independent third party,
6 A financial advisor can be self‐employed or work for a financial services firm that assesses clients’ financial situation and goals to help them choose investments, manage tax laws, and make insurance decisions (Bureau of Labor Statistics, n.d.).

the advice is based on a computer model designed in‐house and certified independently, or the advisor works under a flat‐fee arrangement. Yet, the DOL rules implementing the PPA are not yet in effect. Conse‐quently, it is unclear to what extent financial advisors constrained by ERISA fiduciary standards have been giving investment advice in the four years since the legislation’s passage. It is possible that financial advisors have started cautiously giving investment advice in order to cultivate new clients and retain current clients, with caveats to mitigate liability (Robert B. McCalla, email exchange, March 10, 2010). In short, the effects of PPA on how people receive advice and whether it changes their investment decisions cannot yet be determined with certainty or specificity.
2. Willingness to seek investment advice is highest among women and participants with higher incomes, and it increases with age.
Basic research into the willingness of those with DC plans to seek invest‐ment advice is largely absent from the literature on retirement financial planning. As a result, few generalizations can be made about the popula‐tion of advice seekers beyond an overall lack of advice‐seeking by plan participants. This inability is limited further by significant potential for survey bias resulting from participant‐respondent self‐reporting and the conflicting interests of several of the research entities gathering data. Without further evidence that more precisely identifies the demographic characteristics of advice‐seekers, the success of policy implementations and regulations relating to the conduct and distribution of investment advice may be constrained. Empirical work on willingness to seek advice for retirement plans identi‐fies several demographic features of advice seekers. Econometric analysis conducted by an independent academic research study of retirement investment behaviors from the 1998 eighth annual Retirement Con‐fidence Survey reveals that, of observed advice seekers, women and those with higher incomes are more likely to seek and use advice from professionals who are either associated with or unassociated and external to their plans (Joo & Grable, 2001). Men, particularly Caucasian married men, rely on personally held financial knowledge or seek peer‐based informal advice rather than professional planning assistance for retire‐ment financial decision‐making. Additionally, people with higher in‐
19
20
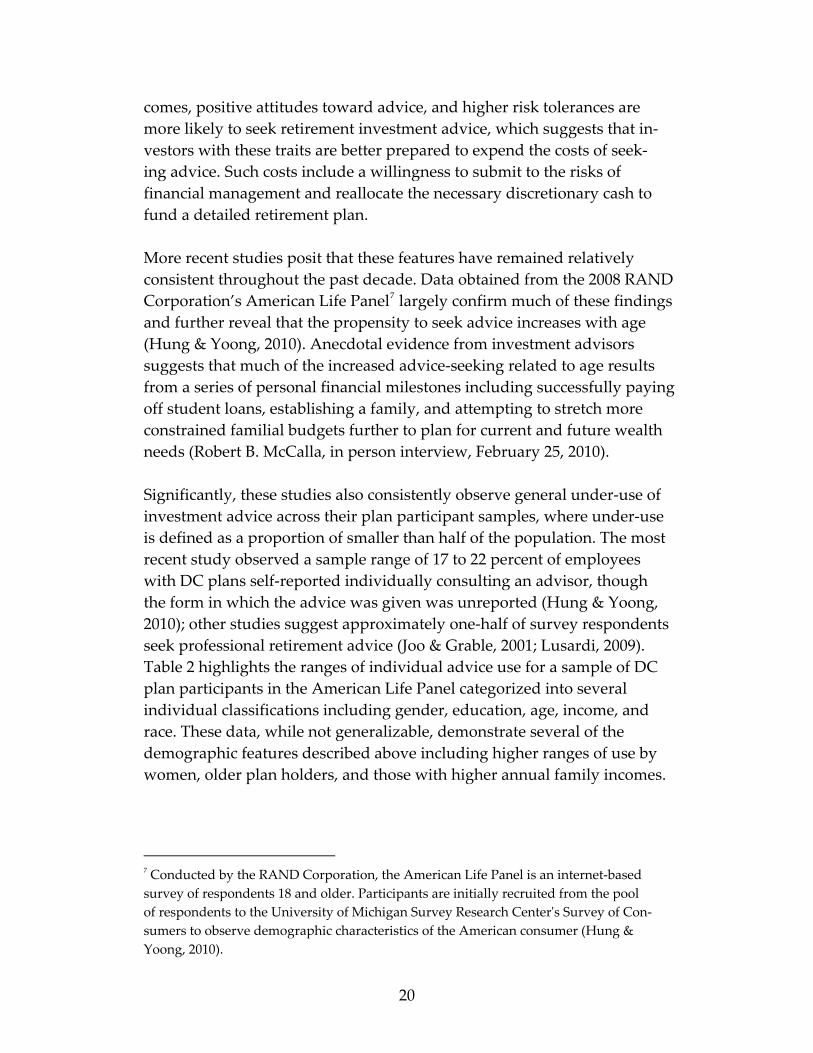
comes, positive attitudes toward advice, and higher risk tolerances are more likely to seek retirement investment advice, which suggests that in‐vestors with these traits are better prepared to expend the costs of seek‐ing advice. Such costs include a willingness to submit to the risks of financial management and reallocate the necessary discretionary cash to fund a detailed retirement plan. More recent studies posit that these features have remained relatively consistent throughout the past decade. Data obtained from the 2008 RAND Corporation’s American Life Panel7 largely confirm much of these findings and further reveal that the propensity to seek advice increases with age (Hung & Yoong, 2010). Anecdotal evidence from investment advisors suggests that much of the increased advice‐seeking related to age results from a series of personal financial milestones including successfully paying off student loans, establishing a family, and attempting to stretch more constrained familial budgets further to plan for current and future wealth needs (Robert B. McCalla, in person interview, February 25, 2010). Significantly, these studies also consistently observe general under‐use of investment advice across their plan participant samples, where under‐use is defined as a proportion of smaller than half of the population. The most recent study observed a sample range of 17 to 22 percent of employees with DC plans self‐reported individually consulting an advisor, though the form in which the advice was given was unreported (Hung & Yoong, 2010); other studies suggest approximately one‐half of survey respondents seek professional retirement advice (Joo & Grable, 2001; Lusardi, 2009). Table 2 highlights the ranges of individual advice use for a sample of DC plan participants in the American Life Panel categorized into several individual classifications including gender, education, age, income, and race. These data, while not generalizable, demonstrate several of the demographic features described above including higher ranges of use by women, older plan holders, and those with higher annual family incomes.
7 Conducted by the RAND Corporation, the American Life Panel is an internet‐based survey of respondents 18 and older. Participants are initially recruited from the pool of respondents to the University of Michigan Survey Research Centerʹs Survey of Con‐sumers to observe demographic characteristics of the American consumer (Hung & Yoong, 2010).

Table 2: Reported Advisor Use for Individual Recommendations
in Defined Contribution Plans in 2008
Participant attribute
Percentage who consulted advisor in 2008*
Maximum possible range†
Male 16.2% 15.3% - 20.5%
Female 19.8 18.8 - 23.6
No college degree 16.8 15.5 - 20.9
College degree 19.2 18.8 - 22.9
Age <45 17.3 16.8 - 19.6
Age >=45 18.3 17.2 - 23.7
AFIº < $50,000 13.7 13.0 - 17.6
AFIº >=$50,000 19.2 18.2 - 23.3
Black or Hispanic 22.2 20.1 - 29.7
Total 17.9% 17.0% - 22.0% N 590 615
* “Consulted advisor” refers to any self-reported advice-seeking by plan participants through any form of advice internal or external to the plan itself. †Twenty-eight respondents were inadvertently omitted by the survey used to compile these data for this specific survey question. Maximum possible range, therefore, refers to the full possible sample statistic range for each attribute under the lower bound assumption of 0 percent take-up of respon-dents omitted from the sample to 100 percent additional take-up of omitted respondents. ºAFI = annual family income
Source: Hung & Yoong (2010) and edited by authors Table 2 additionally draws attention to differences in levels of educational attainment and advice‐seeking, which indicates that those with less edu‐cation are slightly less likely to use an advisor. This connection between education and advice‐seeking is likely the result of those with less educa‐tion relying on friends, family, and other “crude sources” for investment information (Lusardi, 2009). A similar association exists between financial literacy and reliance on informal sources of advice to further account for low levels of advice‐seeking. However, empirical evidence into the will‐ingness of DC plan participants to seek advice identifies a lack of correla‐tion between financial literacy and advice‐seeking, as well as a lack of opting for investment advice on a voluntary basis associated with financial ability (Hung & Yoong, 2010). While this illustrates discrepancies as to the effect of financial literacy, it is important to note that financial literacy is consistently regarded as one of
21
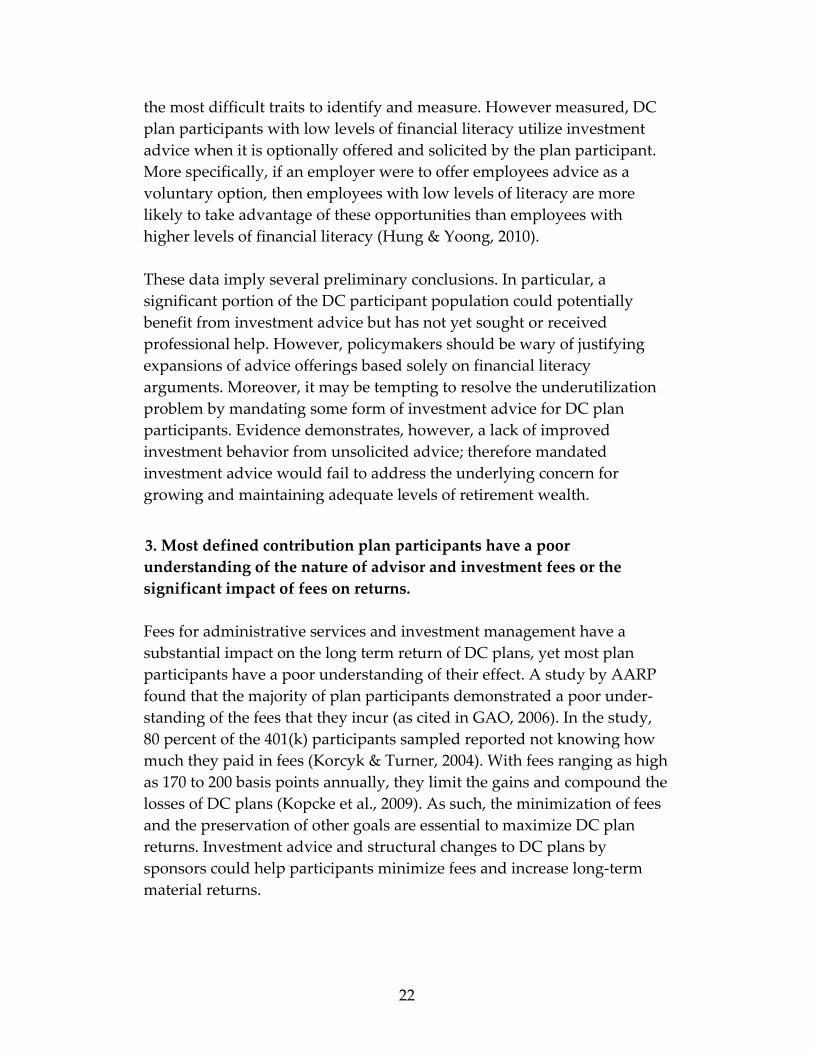
the most difficult traits to identify and measure. However measured, DC plan participants with low levels of financial literacy utilize investment advice when it is optionally offered and solicited by the plan participant. More specifically, if an employer were to offer employees advice as a voluntary option, then employees with low levels of literacy are more likely to take advantage of these opportunities than employees with higher levels of financial literacy (Hung & Yoong, 2010). These data imply several preliminary conclusions. In particular, a significant portion of the DC participant population could potentially benefit from investment advice but has not yet sought or received professional help. However, policymakers should be wary of justifying expansions of advice offerings based solely on financial literacy arguments. Moreover, it may be tempting to resolve the underutilization problem by mandating some form of investment advice for DC plan participants. Evidence demonstrates, however, a lack of improved investment behavior from unsolicited advice; therefore mandated investment advice would fail to address the underlying concern for growing and maintaining adequate levels of retirement wealth.
3. Most defined contribution plan participants have a poor understanding of the nature of advisor and investment fees or the significant impact of fees on returns.
Fees for administrative services and investment management have a substantial impact on the long term return of DC plans, yet most plan participants have a poor understanding of their effect. A study by AARP found that the majority of plan participants demonstrated a poor under‐standing of the fees that they incur (as cited in GAO, 2006). In the study, 80 percent of the 401(k) participants sampled reported not knowing how much they paid in fees (Korcyk & Turner, 2004). With fees ranging as high as 170 to 200 basis points annually, they limit the gains and compound the losses of DC plans (Kopcke et al., 2009). As such, the minimization of fees and the preservation of other goals are essential to maximize DC plan returns. Investment advice and structural changes to DC plans by sponsors could help participants minimize fees and increase long‐term material returns.
22

Most DC plans participants demonstrate a limited understanding of how fees are charged and what fees apply to their accounts (Appendix E provides greater detail about the types of fees common to securities in DC plans). Management fees are most often expressed in the form of an expense ratio. Though the concept of an expense ratio is not complex, educational efforts by plan sponsors and providers have not been effective in explaining its role in their plans (Kopcke et al., 2009). Consequently, individuals do not attempt to minimize such fees. It is also likely that participants do not understand the impact that actively managed funds have on fees. The cumulative effect of paying 50, 100, or 150 basis points more in fees for such funds, in comparison to lower fee products including index funds, is considerable. Part of the difficulty associated with fees is that they are not expressed in each account as a dollar charge. Rather, fees are embedded into the total return of the fund, and are not itemized for their various component costs including trading, management, and administration. Disclosure practices vary and although some funds do provide a breakdown of fees on a mon‐thly basis, most do not (Kopcke et al., 2009). For a view of the methods used to communicate fees to plan participants, see Appendix F. Some employers also demonstrate a lack of knowledge regarding the fees they pay to sponsor plans for their employees. Employers typically pay ven‐dor fees to cover the basic administrative costs of a DC plan. While these costs are not as large on a percentage basis as what plan participants pay in management and trading fees, they can still have a significant impact on total costs (Kopcke et al., 2009). Depending on the plan, administrative costs can be as high as 15 percent of total costs. If employers do not attempt to reduce their fee structures, participant returns will be further reduced. The effect of fees on the long‐term rate of DC plan return is significant, as highlighted in Figure 3. Research demonstrates that DC plans consistently underperformed DB plans from 1988 through 2004, despite the fact that DC plans are weighted more toward equities that average a higher rate of return than other securities. Such underperformance appears to be as high as 100 basis points per year. A substantial portion of this shortfall appears to be the product of fees charged by plan providers. DB plans typically incur very low costs due to their large pools of investments and management styles that attempt to minimize the fees incurred to plan participants. By
23

contrast, many actively managed mutual funds in DC plans can incur costs up to three times those of index funds (Munnell et al., 2006). Figure 3 demonstrates long‐term returns under a series of different fee regimes. The simulation used to construct these figures reinvested divi‐dends and incorporated historical stock market returns as represented by the Standard & Poor’s 500 index. Under this simplified simulation, the employee from 1961 to 2001 had a constant income of $40,000 and made participant contributions that combined with employer matches equaled $1,600 each year. Fees were assessed at the end of each year. The employee begins to withdraw at a five percent annual rate after 2001. In actuality, however, the withdrawal patterns of a DC plan participant would vary. The result is that at peak balance in 2000, a plan with a medium fee structure of 100 basis points has a 24 percent lower balance than a plan with a fee totaling 10 basis points. In 2009, the difference widens to 29 percent as high fees compound more rapidly with withdrawals in a down market. The 160 basis point regime results in balances in 2000 and 2009 that is 36 percent and 44 percent lower respectively.
24

25
Figure 3: Defined Contribution Plan Account Balances Under Differing Fee Regimes8
Source: Data from Robert Shiller (2010) and edited by authors.
One of the reasons DC plans incur higher fees than DB plans is that the participants make little effort to minimize their fees (Munnell et al., 2006). Some participants observe the equity rate of return in the absence of fees and assume they are performing better than they actually are. Thus, greater levels of disclosure might well help make plan participants more aware of the effects of fees on their long‐term returns.
Plan sponsors also incur levels of fees that are not commensurate with the levels of service they utilize from plan providers. One of the hidden costs of many managed funds is the high level of trading costs. These costs are a product of high levels of security trading in managed funds. It is note‐worthy that actively managed funds often perform no better than a broad 8 The simulation demonstrates the evolution of account balances under differing fee regimes from 1961 to 2009 with withdrawals commencing in 2002. The fee regimes chosen were in 30 basis point intervals starting at 10 basis points. Under the assumptions of the simulation, fees are assessed at the end of each year for all years between 1961 and 2009. Additional investments are made at the beginning of the year for purposes of simplification until the withdrawal period commences in 2002. The assumed returns in each simulation are the actual annual returns with reinvested dividends for an all equity portfolio allocation.
$0
$200
$400
$600
$800
$1,000
$1,200
$1,400
$1,600
$1,800
$2,000
Acco
unt B
alanc
e (in
thous
ands
of do
llars)
Year
10 40 70 100 130 160

26
basket of similar index funds (Kopcke et al., 2009). One method for plan sponsors to reduce these unnecessary costs is by offering exchange‐traded funds (ETFs) that have lower expense ratios. These funds can offer lower expense ratios because the lower levels of service provided to investors more closely matches the services needed by plan sponsors and partici‐pants. In particular ETFs more closely resemble index funds in that most of them track a specific index or similar product and as such, management fees are more in line with index funds rather than actively managed funds. Adjusted for similar risk‐reward profiles, ETFs could help save as much as 70 basis points in expenses annually (Kopcke et al., 2009). Advice could serve an important role in this context if plan participants were made aware of the potential savings of instruments such as ETFs. Evidence suggests that plan sponsors have taken a more active role in reducing their fees in the past several years. Human resources consulting firms have made an effort to advise employers on better plan design for new and existing accounts (Yan Xu, telephone interview, March 30, 2010).9 Determining the precise magnitude of these changes is difficult, but there is evidence of greater recognition among plan sponsors of the importance of proper plan design. The extent to which plan sponsors attempt to minimize fees could have a significant effect on the long‐term perfor‐mance of DC plans.
4. Available evidence is ambiguous about the impact of investment advice on defined contribution retirement plan outcomes.
Evidence on the effect of investment advice on DC plan participants is ambiguous. Some studies suggest that there is a large, positive effect given the higher levels of advice received by investors or the existence of auto‐matic enrollment. Yet others find there is a negligible effect. However, strong evidence exists showing that plans are increasingly implementing better management strategies to alleviate some of the deficiencies identi‐fied. Because these changes have been implemented recently, it is difficult to determine whether they will have positive impacts on plan performance.
A major study by Hewitt Associates, a national human resources consult‐ing firm, indicates that those plan participants who sought advice and in‐ 9 Yan Xu has a Master’s in Economics and is a research at Hewitt Associates LLC specializing in DC plan research.

corporated it into the management of their DC plans significantly outper‐formed those that did not seek advice. The median increase in returns was 186 basis points per year after fees. The forms of advice that the partici‐pants of the study took were target date funds, managed accounts, and on‐line advice. Those participants who follow these forms of advice are pro‐jected to have balances at retirement that are up to 47 percent higher than for those not incorporating investment advice. Specifically, those who in‐corporated advice took on lower levels of risk, especially closer to retire‐ment, leaving their plan balances less vulnerable to market shocks. Impor‐tantly, the range of risk taken by those incorporating advice was narrow compared to those not seeking advice, indicating a consistency in the advice given to plan participants (Hewitt Associates, 2010). Yet, other evidence suggests that the provision of advice has a negligible impact on plan participants’ investment outcomes. In a RAND study, advice that was provided automatically was shown to have little impact on the investment behaviors of plan participants (Hung & Yoong, 2010). Part of what drives this phenomenon may be that, despite receiving advice, participants are either disinterested or unable to synthesize and utilize the advice they are given. For advice to play an effective role plan participants need to be actively engaged in the process; automatically provided advice may not necessarily engage the participants. The long‐term effect of the adoption of strategies such as target date or target risk funds has yet to be determined. Such strategies are relatively new and, while they may have strong conceptual bases, their efficacy has not been tested over several market cycles. However, there is substantial evidence that plan sponsors have been increasingly adopting recommended strategies for default enrollments. According to a 2009 study by Hewitt Associates, the default investments in DC plans have shifted away from more conservative investments such as money market funds and into life cycle and target risk funds (Hewitt Associates, 2009; Yan Xu, telephone interview, March 30, 2010). Sixty‐eight percent of assets in plans defaulted into money market funds in 2001 while in 2009, only 5 percent of assets defaulted into money market funds. Target date and target risk funds now attract nearly 80 percent of new assets. While these trends do not reflect a greater provision or adoption of investment advice by plan participants, they do indicate stronger efforts by plan sponsors to improve outcomes for their employees. See Appendix G for further details.
27

An important distinction is the extent to which individual investment advice may be effective and how improved plan structures may be effective in improving investment outcomes. Broadly construed, the mandatory opt‐out levels of contribution rates and the change in default investments toward target date and target risk funds can be interpreted as an adoption of investment advice. However, this is distinct from the provision of individual investment advice that individual plan partici‐pants obtain from different sources. The movement by plan sponsors toward implementing the best practices of the industry could be consi‐dered a greater adoption of investment advice, though it is arguably without the knowledge or endorsement of plan participants. As these are newer trends, the efficacy of the changes is difficult to assess.
28
Conclusion and Recommendations for Further Study
Enrollment in employer‐sponsored retirement plans continues to shift away from DB plans and toward DC plans. As a result of this shift, plan participants assume a significantly greater level of responsibility for ensuring that their retirement investments will provide sufficient income throughout retirement. This shift in responsibility makes retirement investment advice increasingly influential in determining retirement income and quality of life for retired Americans. DC plans can provide adequate retirement income if plan participants follow best practices, such as contributing 6 to 10 percent of their incomes on a regular basis, rebalancing regularly (through passive or active man‐agement), and selecting an asset allocation appropriate for their circum‐stances. However, most DC plan accounts do not contain sufficient bal‐ances to ensure adequate retirement income. Among the possible expla‐nations, the absence of investment advice and failure to heed advice received contribute to the account balance deficiencies. Our research identifies several trends on the current state of investment advice that affect account balances upon retirement. No standardized process exists for participants to receive advice. Plan participants may passively receive or actively seek advice from a number of sources includ‐ing their peers, the internet, and financial advisors. In general, women tend to seek out advice more than men, who typically rely on informal sources of advice. People with higher income or at higher ages are more likely to seek advice. Mandatory advising appears to have minimal, if any, impact on investment planning. Advice that is sought out is much more likely to be followed; however, studies produced conflicting results as to whether sought after advice improves investment performance. In light of the absence of comprehensive data and research on this subject, our findings are limited by the validity and scope of the research avail‐able. For example, some of the data may suffer from a self‐reporting bias. As discussed below, additional empirical evidence from a neutral researcher is essential to a more comprehensive understanding about the current state of investment advice for DC plan participants.
29
30
Recommendations for Further Study
We have several recommendations for future study. Comprehensive research on sources of advice is essentially absent from academic and professional literature. For example, our research revealed no empirical examinations of informal advice processes through which plan participants receive investment advice. Given the likelihood of informal advice networks influencing investment decisions, research on this topic would address a substantial deficiency in the literature. Survey data comparing the effective‐ness of different forms of advice are also underdeveloped. Most of the data that might prove useful are proprietary and thus unavailable to many researchers. Additionally, researchers have not identified a consistent meth‐odology to capture the effects of advice. a standardized methodological approach to evaluating this research question would strengthen the validity of findings and allow for policy recommendations based on robust evidence. To implement the new PPA provisions, the DOL published proposed reg‐ulations in March 2010, after withdrawing previously proposed rules in response to public comments that the first set of proposed rules did not pro‐vide adequate consumer protection (DOL, 2010c). The proposed regulations are available for public comment and will not be adopted until summer 2010 at the earliest. The proposed regulations expand the ability of financial advisors to provide investment advice and prescribe measures to prevent conflicts of interest for fiduciaries and their affiliates. These provisions are designed to strengthen consumer protections. We recommend research on the state of investment advice after adoption of the PPA regulations. Another potential area for future study is financial literacy. Disagreement exists as to how extensive an investor’s knowledge of financial and numer‐ical concepts must be for a person to be considered financially literate (Lu‐sardi, 2009). This makes it challenging to compare studies of the relationship between financial literacy and advice‐seeking, advice‐implementation, and investment performance. To date, evidence is inconclusive as to the effect of increased levels of financial literacy on DC plan participants. It may be worthwhile to administer a longitudinal study of the retirement investment decisions of students who participate in financial literacy programs in order to evaluate the long‐term effects of early education.10
10 For example, the National Endowment for Financial Education (n.d.) has a high school financial planning program that has reached more than five million people.

31
Along with researching advice given to plan participants, we recommend researching the advice given to plan participants who are no longer con‐tributing to their account balances. For example, retirees may have options they should be advised about regarding how to receive their account bal‐ances.11 In addition to retirees, those who have been terminated or who elected to discontinue their employment should be informed that their DC plan is often portable and could be rolled over into another DC plan or an IRA (DOL, n.d.e). This class of DC plan participants requires a separate analysis about the sources and effectiveness of investment advice to ensure that people continue to maximize their potential returns when they draw down the account. DC plan participants, as well as investors in general, would greatly benefit from identifying better methods of communicating investment fees. More‐over, we recommend that investment advice be explicitly required to disclose the types of fees and the impact of fees on investment returns. It would also be beneficial to explore the effectiveness of comparing fees between different investment types, such as index funds, target‐date funds, and ETFs. Finally, an important concept to consider in future research and discussion of policy recommendations is the distinction between what advice can be implemented at the plan level and how to improve the investment deci‐sions of the individual through investment advice. Much of the research in this report indicates that even when adequate investment advice is available, low degrees of financial literacy and mistrust of financial insti‐tutions, among other factors, limit the extent to which advice is sought and then implemented. Many of the basic recommendations by financial advisors are being increasingly implemented by plan sponsors to improve default allocations and contribution rates. As changes at the plan sponsor level have proven effective at correcting many of the adverse practices of plan participants, research focusing on whether the best focus for im‐proving outcomes in DC plans lies with the plan sponsors rather than focusing solely on improving the investment decisions of individuals.
11 Options include retirees receiving their account balance as lump‐sum payments or via annuities with monthly lifetime payments (DOL, n.d.e.).
Works Cited
Agnew, Julie R., Szykman, Lisa, Utkus, Stephen P., & Young, Jean A. 2007. Do Financial Literacy and Mistrust Affect 401(k) Participation? Chestnut Hill: Center for Retirement Research.
Aon Consulting. 2008. 2008 Replacement Ratio Study. Chicago: Aon Consulting.
Black’s Law Dictionary. 1996. Bryan Garner (Ed.), 3rd Edition. St. Paul, MN: West Publishing Co.
Brady, Peter J. 2009. Can 401(k) Plans Provide Adequate Retirement Resources? Philadelphia: Pension Research Council.
Bodie, Zvi. 2002. An Analysis of Investment Advice to Retirement Plan Participants. Pension Research Council. The Wharton School. PRC WP 2002‐15. Retrieved February 17, 2010, from http://www.pensionresearchcouncil.org/publications/document.php?file=123.
Bureau of Labor Statistics. n.d. Occupational Outlook Handbook, 2010‐2011 Edition: Personal Financial Advisors. Retrieved March 10, 2010, from http://www.bls.gov/oco/ocos302.htm.
Choi, James, Laibson, David, & Madrian, Brigitte. 2004. Plan Design and 401(k) Savings Outcomes. Prepared for the National Tax Journal Forum.
Department of Labor. 2001. Advisory Opinion. 2001‐09A. Retrieved March 20, 2010, from http://www.dol.gov/ebsa/regs/AOs/ao2001‐09a.html.
Department of Labor: Employee Benefits Security Administration. 2007. Field Assistance Bulletin No. 2007‐01. Retrieved March 29, 2010, from http://www.dol.gov/ebsa/regs/fab_2007‐1.html.
Department of Labor: Employee Benefits Security Administration. 2008. Meeting Your Fiduciary Responsibilities. Retrieved March 9, 2010, from http://www.dol.gov/ebsa/pdf/fiduciaryresponsibility.pdf.
32

Department of Labor: Employee Benefits Security Administration. 2009. Final Rule: Investment Advice ‐ Participants and Beneficiaries. Federal Register. 75:40, 9360.
Department of Labor: Employee Benefits Security Administration. 2010a. Fact Sheet: Proposed Regulation to Increase Workers’ Access to High Quality Investment Advice. Retrieved March 27, 2010, from http://www.dol.gov/ebsa/newsroom/fsinvestmentadvice.html.
Department of Labor: Employee Benefits Security Administration. 2010b. Pension Plan Bulletin Historical Tables and Graphs. Retrieved April 2, 2010, from http://www.dol.gov/ebsa/pdf/1975‐2007historicaltables.pdf.
Department of Labor: Employee Benefits Security Administration. 2010c. Proposed Rule: Investment Advice ‐ Participants and Beneficiaries. Federal Register. 74:12, 3822‐3853.
Department of Labor. n.d.a. A Look at 401(k) Plan Fees. Retrieved March 6, 2010, from http://www.dol.gov/ebsa/pdf/401kFeesEmployee.pdf.
Department of Labor. n.d.b. Employee Retirement Income Security Act ‐ ERISA. Retrieved March 9, 2010, from http://www.dol.gov/dol/topic/health‐plans/erisa.htm.
Department of Labor, Employee Benefits Security Administration. n.d.c. Form 5500 Series. Retrieved April 17, 2010, from http://www.dol.gov/ebsa/5500main.html.
Department of Labor. n.d.d. What are Fiduciary Responsibilities? Retrieved April 14, 2010, from http://www.dol.gov/elaws/ebsa/fiduciary/q4b.htm#.
Department of Labor: Employee Benefits Security Administration. n.d.e. What You Should Know About Your Retirement Plan. Retrieved April 13, 2010, from http://www.dol.gov/ebsa/publications/wyskapr.html.
Employee Benefit Research Institute. 2010. Tax Expenditures and Employee Benefits: Estimates from the FY 2011 Budget. Retrieved April 20, 2010, from http://www.ebri.org/pdf/publications/facts/FS‐209_Mar10_Bens‐Rev‐Loss.pdf.
33
34
Employee Benefit Research Institute. n.d. Retirement Confidence Survey (RCS). Retrieved March 1, 2010, from http://www.ebri.org/surveys/rcs/.
Employee Retirement Income Security Act of 1974, 29 U.S.C. Sec. 1104(a), 1974.
Ezra, Don. 2007. Defined‐Benefit and Defined‐Contribution Plans of the Future. Financial Analysts Journal, 63 (1), 26‐30.
Government Accountability Office. 2006. Private Pensions: Changes Needed to Provide 401(k) Participants and the Department of Labor Better Information on Fees. Washington, D.C. GAO‐07‐21.
Government Accountability Office. 2008. Private Pensions: Fulfilling Fiduciary Obligations Can Present Challenges for 401(k) Plan Sponsors. Washington, D.C. GAO‐08‐774.
Government Accountability Office. 2009. Retirement Savings: Better Information and Sponsor Guidance Could Improve Oversight and Reduce Fees for Participants. Washington, D.C. GAO‐09‐641.
Hardy, Melissa A. 2002. The Transformation of Retirement in Twentieth‐Century America: From Discontent to Satisfaction. Generations, 26 (2). Retrieved March 19, 2010, from Academic Search Premier Database.
Hewitt Associates. 2009. Trends and Experience in 401(k) Plans. Lincolnshire: Hewitt Associates LLC.
Hewitt Associates. 2010. Help in Defined Contribution Plans: Is It Working and for Whom? Lincolnshire: Hewitt Associates LLC.
Hung, Angela, & Yoong, Joanne. 2010. Asking for Help: Survey and Experimental Evidence on Financial Advice and Behavior Change. RAND. Working Paper. WR‐714‐1.
Internal Revenue Service. 2005. Retirement Plans; Cash or Deferred Arrangements under Section 401(k) and Matching Contributions or Employee Contributions under Section 401(m) Regulations. Internal Revenue Bulletin: 2005‐5. T.D. 9169. Retrieved March 27, 2010, from http://www.irs.gov/irb/2005‐05_IRB/ar06.html.

Internal Revenue Service. 2007. All I want for Christmas is Some Pension Protection Act Guidance. Employee Plans News. Vol. 6. Retrieved March 9, 2010, from http://www.irs.gov/pub/irs‐tege/win07.pdf#page=3.
Investment Advisers Act of 1940, 15 U.S.C. Sec. 78(c)(a)(4)(A), 1940a.
Investment Advisers Act of 1940, 15 U.S.C. Sec. 80b‐2(a)(11), 1940b.
Investment Advisers Act of 1940, 15 U.S.C. Sec. 80b‐2(a)(18), 1940c.
Joo, So‐Hyun, & Grable, John E. 2001. Factors Associated with Seeking and Using Professional Retirement‐Planning Help. Family and Consumer Sciences Research Journal, 30, 37‐63.
Kopcke, Richard W., Vitagliano, Francis, & Muldoon, Dan. 2009. The Structure of 401(k) Fees. Chestnut Hill: Center for Retirement Research.
Korcyk, Sophia & Turner, John. 2004. Pension Participant Knowledge about Fee Plans. Data Digest. AARP Public Policy Institute.
Leimberg, Stephan, & McFadden, John. 2009. Employee Benefit and Retirement Planning. Erlanger, KY: The National Underwriter Company.
Lusardi, Annamaria. 2009. Household Savings Behavior in the United States: The Role of Literacy, Information, and Financial Education. In Christopher L. Foote, Lorenz Goette, & Stephan Meier (Eds.), Policymaking Insights from Behavioral Economics (pp.109‐149), Boston: Federal Reserve Bank of Boston.
Munnell, Alicia H., Soto, Mauricio, Libby, Jerilyn, & Prinzivalli, John. 2006. Investment Returns: Defined Benefit vs. 401(k) Plans. Chestnut Hill: Center for Retirement Research.
National Endowment for Financial Education. n.d. NEFE High School Financial Planning Program. Retrieved April 23, 2010, from http://www.nefe.org/HighSchoolProgram/tabid/146/Default.aspx.
Pension Protection Act of 2006, Pub. L. No. 109‐280, 120 Stat. 780, 2006.
35
Purcell, Patrick. 2006, October 23. Summary of the Pension Protection Act of 2006. Congressional Research Service: Report for Congress. Order Code RL33703.
Purcell, Patrick. 2007, April 8. Retirement Savings and Household Wealth in 2007. Congressional Research Service: Report for Congress. Order Code R40707. Retrieved March 2, 2010, from http://assets.opencrs.com/rpts/RL30922_20090408.pdf.
Sass, Steven A., Monk, Courtney, & Haverstick, Kelly. 2010. Workers’ Response to the Market Crash: Save more, work more? Chestnut Hill: Center for Retirement Research.
Shiller, Robert J. 2010. Online Data Robert Shiller. Retrieved March 7, 2010, from Home Page of Robert J. Shiller: http://www.econ.yale.edu/~shiller/data.htm.
Securities and Exchange Commission. 2005. Staff Report Concerning Examinations of Select Pension Consultants. Retrieved April 23, 2010, from http://www.sec.gov/news/studies/pensionexamstudy.pdf.
Securities and Exchange Commission. n.d. Variable Annuities. Retrieved March 29, 2010, from http://www.sec.gov/answers/annuity.htm.
VanDerhei, Jack, Holden, Sarah, & Alonso, Luis. 2009. 401k Plan Asset Allocation, Account Balances, and Loan Activity in 2008. Washington D.C.: Employee Benefit Research Institute.
VanDerhei, Jack. 2006. Measuring Retirement Income Adequacy: Calculating Realistic Income Replacement Rates. Washington D.C.: Employee Benefit Research Institute.
Weller, Christian E. 2002. Retirement Out of Reach. Retrieved March 30, 2010, from Economic Policy Institute: http://www.epi.org/publications/entry/briefingpapers_bp129/.
Yamaguchi, Takeshi, Mitchell, Olivia S., Mottola, Gary R., & Utkus, Stephen P. 2006. Winners and Losers: 401(k) Trading and Portfolio Performance. Philadelphia: Pension Research Council.
36

Appendix A: Characteristics of Defined Benefit and Defined Contribution Plans
Table 3 presents characteristics of DB and DC plans to clarify the key details relating to their overall structure. For a description of particular DC plan types, see Appendix C.
Table 3: Characteristics of Defined Benefit and Defined Contribution Plans Defined Benefit Plan Defined Contribution Plan
Employer contributions and/or matching contributions
Employer funded. Federal rules set amounts that employers must contribute to plans in an effort to ensure that plans have enough money to pay benefits when due. There are penalties for failing to meet these requirements.
There is no requirement that the employer contribute, except in the SIMPLE 401(k) and Safe Harbor 401(k)s, money purchase plans, SIMPLE IRA, and SEP. The employer may have to contribute in certain automatic enrollment 401(k) plans. Employer may match portion of employee’s contributions or to contribute without employee contributions. In some plans, employer contri-butions may be in form of employer stock.
Employee contributions
Generally, employees do not contribute to these plans.
Many plans require the employee to contribute in order for an account to be established.
Managing the investment
Plan officials manage investment and employer is responsible for ensuring that the amount it has put in the plan plus investment earnings will be enough to pay the promised benefit.
Employee often is responsible for managing the investment of his or her account, choosing from investment options offered by the plan. In some plans, plan officials are responsible for investing all the plan’s assets.
Amount of benefits paid upon retirement
Promised benefit is based on a formula in the plan, often using a combination of the employee’s age, years worked for the employer, and/or salary.
The benefit depends on contributions made by the employee and/or the employer, performance of the account’s investments, and fees charged to the account.
Type of retirement benefit payments
Traditionally, these plans pay retiree monthly annuity payments for life. Plans may offer other payment options.
Retiree may transfer the account balance into an individual retirement account from which the retiree withdraws money, or may receive it as a lump sum payment. Some plans also offer monthly payments through an annuity.
Guarantee of benefits
Federal government, through the Pension Benefit Guaranty Corp., guarantees some amount of benefits.
No federal guarantee of benefits.
Leaving the company before retirement age
If an employee leaves after vesting in a benefit but before the plan’s retirement age, the benefit generally stays with the plan until the employee files a claim for it at retirement. Some defined benefit plans offer early retirement options.
Employee may transfer account balance to individual retirement account (IRA) or, in some cases, another employer plan, where it can continue to grow based on investment earnings. The employee may take the balance out of the plan but will owe taxes and possibly penalties, thus reducing retirement income. Plans may cash out small accounts.
Source: DOL, n.d.e.
37

38
Appendix B: Trends of Defined Benefit and Defined Contribution Plan Contributions and Assets, 1975‐2007
The trend toward DC plans that began in the latter quarter of the twenti‐eth century is evident by various data available from the Employee Bene‐fits Security Administration. The information provided in the figures below reflects data collected from Form 5500. This form was designed to solicit information regarding employee benefit plans and is required under ERISA Title I and Title IV (DOL, n.d.c). Figure 4 illustrates contributions made to DB and DC plans for each year between 1975 and 2007. In 1975, DB plan contributions totaled $24 billion while DC plan contributions approached $13 billion. By 2007, DB plan contributions amounted to $68 billion while DC plan contributions had surpassed $325 billion (DOL, 2010b).
Figure 4: Plan Contributions by Type of Retirement Plan by Year, 1975-2007
Source: DOL, 2010b, p. 17.
$0
$50
$100
$150
$200
$250
$300
$350
$400
Total
Yea
rly C
ontrib
ution
by A
ll Par
ticipa
nts (in
billio
ns of
dolla
rs)
YearTotal Contributions Contributions to DB plans Contributions to DC Plans
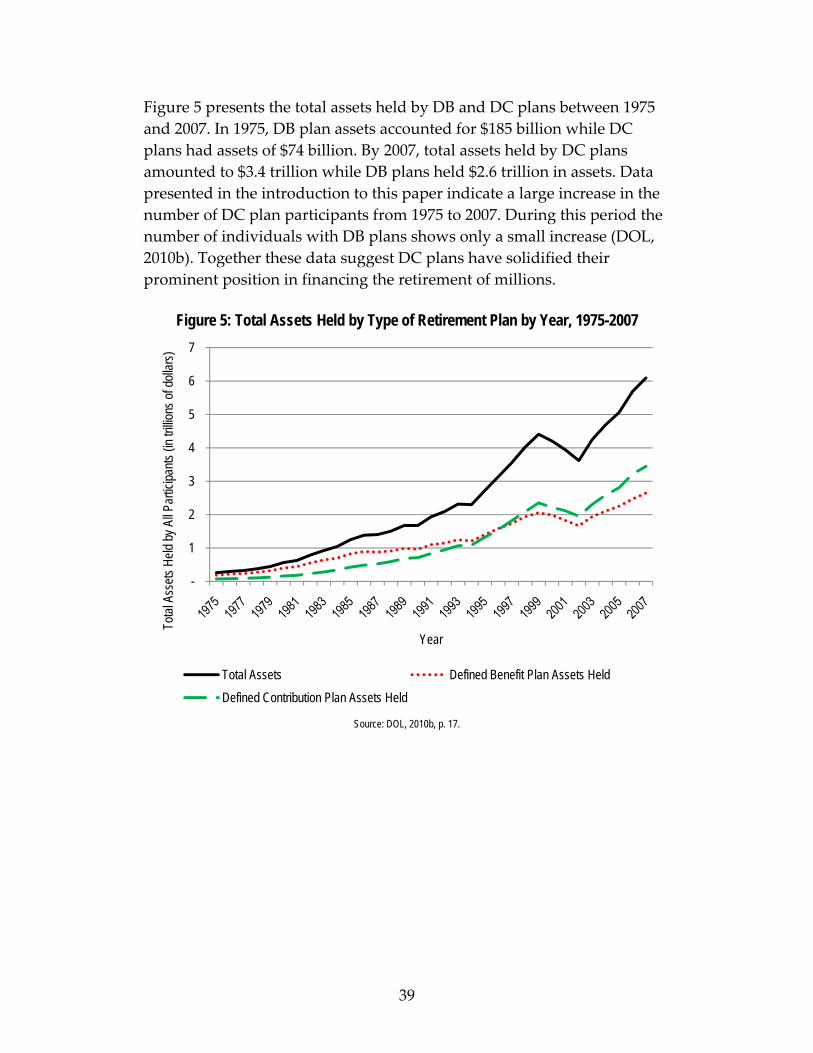
39
Figure 5 presents the total assets held by DB and DC plans between 1975 and 2007. In 1975, DB plan assets accounted for $185 billion while DC plans had assets of $74 billion. By 2007, total assets held by DC plans amounted to $3.4 trillion while DB plans held $2.6 trillion in assets. Data presented in the introduction to this paper indicate a large increase in the number of DC plan participants from 1975 to 2007. During this period the number of individuals with DB plans shows only a small increase (DOL, 2010b). Together these data suggest DC plans have solidified their prominent position in financing the retirement of millions.
Figure 5: Total Assets Held by Type of Retirement Plan by Year, 1975-2007
Source: DOL, 2010b, p. 17.
-
1
2
3
4
5
6
7
Total
Ass
ets H
eld by
All P
artic
ipants
(in tr
illion
s of d
ollar
s)
Year
Total Assets Defined Benefit Plan Assets HeldDefined Contribution Plan Assets Held

Appendix C: Types of Defined Contribution Plans
There are several different forms of DC plans each named for and defined by specific sections of the Internal Revenue Code. 401(a) plans are an over‐arching form of plan that encompasses 401(k)s (GAO, 2009). 401(a) plans can be money purchase plans that require sponsors to contribute to their employees’ funds as well as profit‐sharing plans that make contributions optional. All of the plans in this section are tax‐deferred, meaning that employees make contributions that are not subject to taxes but pay taxes on the distributions when they are drawn down. 401(k)s are a subset of the 401(a) plans that allow plan participants to make pre‐tax contributions to their retirement plans. These are typically structured in the form of a profit‐sharing plan allowing employers to optionally contribute a match to the employee’s contribution. Under cur‐rent law, participants may contribute up to $16,500 or 10 percent of their salary, whichever is less, to their plans. There is a 10 percent penalty for withdrawal from the plan before the age of 59½. 403(b) plans are fundamentally similar to 401(k)s. They also allow both employers and employees to make contributions on a pre‐tax basis; however, the plans are intended for those working in non‐profits and educational institutions rather than for most private employers. Invest‐ments are limited to three major categories: custodial accounts managed by mutual funds, annuity contracts issued by insurance companies, and a retirement income account established for church employees. The maxi‐mum contribution limit for 403(b) plans also stands at $16,500 or 10 percent of their salary, whichever is less. There are differing forms of 457 plans. 457(b) plans are split into govern‐mental and tax exempt categories. The governmental plans are function‐ally different from 401(k) or 403(b) plans in those employee contributions are set aside in a trust. There is no penalty for early withdrawal as there is with 401(k) plans. 457(f) plans are a subset of 457 plans generally desig‐nated for executives and other highly paid employees because they have no contribution limits. The assets held in this plan type are technically held by the employer until granted to the employee.
40

Individual Retirement Accounts (IRAs) and other similar plans outside the purview of employers are not under the scope of DC plans. Tradi‐tional IRAs allow individuals to make tax deductible contributions to their account while the distributions from the account are taxable. Roth IRAs largely protect the distributions from tax while the contributions are after‐tax.
41

Appendix D: Adequate Retirement Savings Levels
There is considerable variation in what is considered to be an “adequate” level of retirement savings. These varying standards are significant because depending on which level is used, the perceived deficiencies in DC plan balances can appear more or less severe. Some studies suggest that retirees need to preserve close to 100 percent of their pre‐retirement income (Brady, 2009), though even these advocates grant that very high income earners do not need to achieve post‐retire‐ment income of that magnitude. Other studies, including one conducted by Aon Consulting, on retirement replacement rations, suggest that for middle to upper middle income earners a more appropriate level of income replacement is approximately 80 percent. For the lowest income earners, the necessary replacement ratios are closer to 100 percent. Those with pre‐retirement income of $20,000 a year or less need 94 percent of that income in retirement. The reason for higher replacement ratios for lower income earners than upper income earners is that expenses for lower income earners either remain constant or decline while expenses for higher income earners decline markedly (Aon Consulting, 2008). The sources of replacement income also vary with income status. For those with $30,000 in pre‐retirement income, Social Security will replace 59 percent of their earnings, while private savings must replace 31 percent to obtain an appropriate gross replacement ratio. In the case of those earn‐ing $90,000 in pre‐retirement income, Social Security will replace only 36 percent of their earnings while personal savings must replace 42 percent in order to have adequate income (Aon Consulting, 2008). At $250,000, the ratios tilt much more heavily toward private savings with only 14 percent of pre‐retirement income replaced by Social Security, while 74 percent of pre‐retirement income needs to be replaced by private savings. Just as the adequate replacement rate varies across income groups, so do the necessary multiples of pre‐retirement income in order to support with‐drawals sufficient to fund the private portion of income replacement. Determining what this multiple should be is not a straightforward exer‐cise, as it depends on the composition of the retirement savings as well as assumptions about the path of post‐retirement costs. If the retiree uses a mixed stock and bond portfolio, the multiple of final earnings required to
42

provide an adequate income is different than if they purchase an annuity. Under the assumptions in the Aon study, if the retiree purchases an an‐nuity, then the necessary multiple ranges from 4.0 times for low income earners ($20,000 to $30,000 final salaries) to 6.8 times for higher income earners (Aon Consulting, 2008). For an individual with a $70,000 pre‐retirement income, these ratios would translate into approximately $400,000 in necessary private savings at the prescribed replacement ratios of 5.6 times for a male and 6.3 times for a female. However, a 2006 study conducted by the Employee Benefit Research Insti‐tute (VanDerhei, 2006) indicates far higher ratios needed by low income earners in particular. The study considers the high costs of long‐term care such as nursing homes and hospice as part of its simulations. Under these assumptions, low income earners (those retirees with less than $15,000 per year in income outside of Social Security) need a multiple of 10 times just to have a 50 percent probability of adequacy. Related to the rising costs of long‐term care, the Aon study demonstrated that the required replace‐ment ratios have risen during the past decade (Aon Consulting, 2008). As such, the replacement ratios may also be a moving target. The existing literature demonstrates the wide variety of opinion on what necessary savings levels are. Depending on the assumptions used, the necessary replacement rates and savings levels at retirement are widely disparate. Under virtually any definition, however, existing DC plan balances are insufficient to serve their role in replacing pre‐retirement income. Even using low standards of 5 to 6 times multiple of pre‐retire‐ment earnings, average plan balances for those close to retirement are at most one‐third to one‐half as large as they should be.
43

Appendix E: Defined Contribution Plan Fees
Fees associated with DC plans fall into one of three categories: admini‐strative fees, management fees, and individual service fees. Plan admini‐strative fees, shown in Table 4, account for the provision of the daily expenses accrued for servicing DC plans including accounting, record‐keeping, and legal services. The employer either absorbs the admin‐istrative fees or passes them on to plan participants. Plan participants can be charged flat fees or assessed a charge in proportion to the total plan assets held in the account (DOL, n.d.a).
Table 4: Administrative Fees Associated with Defined Contribution Plans Fee Type Fee Description
Record-keeping fee
A fee that is usually charged by a service provider to set up and maintain the plan. This fee can cover a variety of activities, such as enrolling plan participants, processing participant fund selections, preparing and mailing account statements, and other related administration activities.
Communication fee
A fee to cover the cost of educating participants about the plan such as providing participants with access to toll-free phone services, internet service, and ongoing educational seminars.
Custodial or trustee fee
A fee that is charged by an individual bank or trust company to securely maintain plan assets.
Audit fee A fee that is imposed by a service provider in connection with the annual audit that is required of ERISA-covered plans with more than 100 participants.
Marketing fee A fee that is commonly known as a 12b-1 fee.
Legal fee A fee that is charged by an attorney or law firm to provide legal support for administrative activities, such as ensuring the plan is in compliance with ERISA or representing the plan in a divorce settlement.
Source: Table created by GAO (2009, p. 16) and edited by authors. Management fees, described in Table 5, cover the costs associated with activities such as monitoring and adjusting the securities in a particular fund. These fees are usually charged as a percentage of the value of assets held in a given fund (DOL, n.d.a). For instance, most mutual funds will have a fund manager who receives a portion of all assets under manage‐ment. Plan sponsors may also consult advisors to select the initial investments available to participants (GAO, 2009).
44
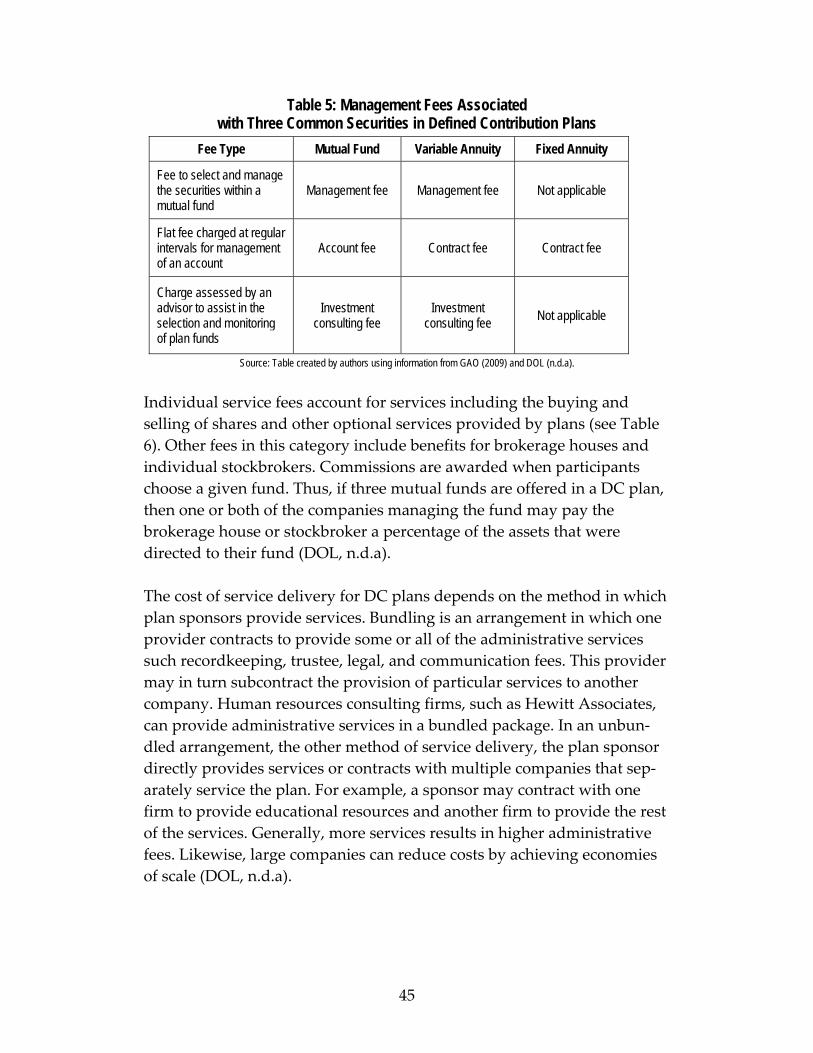
Table 5: Management Fees Associated with Three Common Securities in Defined Contribution Plans
Fee Type Mutual Fund Variable Annuity Fixed Annuity
Fee to select and manage the securities within a mutual fund
Management fee Management fee Not applicable
Flat fee charged at regular intervals for management of an account
Account fee Contract fee Contract fee
Charge assessed by an advisor to assist in the selection and monitoring of plan funds
Investment consulting fee
Investment consulting fee Not applicable
Source: Table created by authors using information from GAO (2009) and DOL (n.d.a).
Individual service fees account for services including the buying and selling of shares and other optional services provided by plans (see Table 6). Other fees in this category include benefits for brokerage houses and individual stockbrokers. Commissions are awarded when participants choose a given fund. Thus, if three mutual funds are offered in a DC plan, then one or both of the companies managing the fund may pay the brokerage house or stockbroker a percentage of the assets that were directed to their fund (DOL, n.d.a). The cost of service delivery for DC plans depends on the method in which plan sponsors provide services. Bundling is an arrangement in which one provider contracts to provide some or all of the administrative services such recordkeeping, trustee, legal, and communication fees. This provider may in turn subcontract the provision of particular services to another company. Human resources consulting firms, such as Hewitt Associates, can provide administrative services in a bundled package. In an unbun‐dled arrangement, the other method of service delivery, the plan sponsor directly provides services or contracts with multiple companies that sep‐arately service the plan. For example, a sponsor may contract with one firm to provide educational resources and another firm to provide the rest of the services. Generally, more services results in higher administrative fees. Likewise, large companies can reduce costs by achieving economies of scale (DOL, n.d.a).
45

Table 6: Individual Service Fees Associated with Three Common Securities in Defined Contribution Plans
Fee Description Mutual Fund Variable Annuity Fixed Annuity Fee charged upon investing that reduces the initial investment
Sales charge or front-end load
Sales charge or front-end load Not applicable
Fee charged as commission to a stockbroker 12b-1 fee 12b-1 fee Not applicable
Fee charged upon the sale of fund shares or contract expiration
Deferred sales charge or back-end load or redemption
fee
Deferred sale load or surrender fee
Surrender or withdrawal charge
Fee charged for the transfer of one fund to another within the same family of funds
Exchange fee Exchange fee Not applicable
Fee charged for optional services provided as a part of DC plan
Various fees Various fees Various fees
Fee charged to compensate for risks assumed by the insurance company
Not applicable Mortality and expense risk charge
Mortality and expense risk charge
Source: Table created by authors using information from GAO (2009) and DOL (n.d.a).
46

Appendix F: Disclosure of Fees to Participants
Fee disclosure to plan participants varies across plans, but generally fees are not presented in a separate document. According to Hewitt Associ‐ate’s “Survey of Trends and Experience in 401(k) Plans,” most manage‐ment fees are only disclosed in a plan prospectus where they are including with a wide array of other information. Only 25 percent are disclosed within account statements or in a specific communication. Table 7 demonstrates the variations in disclosure practices.
Table 7: Disclosure of Fees to Participants Administration
Fees Investment
Management Fees Method 2007 2009 2007 2009
Disclose in fact sheets/prospectus 24% 28% 65% 60%
With account statements 22% 23% 15% 18%
Disclose in periodic general communications 21% 20% 10% 9%
Only upon request 28% 18% 4% 6%
Disclose in specific communications 5% 10% 6% 7% Source: Hewitt Associates, 2009.
47

48
Appendix G: Changes in Plan Design and Effects on Default Contributions and Asset Allocations
Changes in plan design have led to higher default contribution rates and asset allocations that incorporate more target‐date and target‐risk funds. Additionally, plans are making greater use of automatic enrollment to attempt to increase participation rates. The following figures and tables demonstrate that all of these trends have been significant in the past decade. Figure 6 demonstrates the large increase in the usage of automatic enroll‐ment since 2003. In 2003 only 14 percent of plans utilized automatic enroll‐ment for plan participants. Fifty‐eight percent of all plans surveyed by Hewitt Associates utilized automatic enrollment by 2009.
Figure 6: Percentage of Plans with Automatic Enrollment Increasing
Source: Hewitt Associates, 2009.
Figure 7 details the change in default asset allocations in DC plans. In 2001, most plans chose money market funds as the default investment. By 2009, the overwhelming majority of plans defaulted into target date or target risk funds with a very small percentage defaulting into money market funds.
14% 14%
19%
34%
58%
0%
10%
20%
30%
40%
50%
60%
70%
2001 2003 2005 2007 2009
Perce
ntage
of P
lans
Year

Figure 7: Changes in Default Asset Allocations in 401(k) Plans
49
0%
10%
20%
30%
40%
50%
60%
70%
80%
2001 2003 2005 2007 2009
Perce
ntage
of P
lan A
ssets
Target Date Fund Target Risk Fund Balanced FundMoney Market Mutual Fund Managed Accounts Others
Source: Hewitt Associates, 2009
Table 8 demonstrates the significant rise in default contribution rates in DC plans surveyed by Hewitt Associates. In 2001, 33 percent of plans had default contribution rates of 2 percent or less. By 2009, only 11 percent of plans had default contribution rates of 2 percent or less while 22 percent had contribution rates of 5 percent or greater.
Table 8: Default Contribution Rate as a Percentage of Pre-Tax Income
Year 1% 2% 3% 4% 5% 6% 7%
2001 5% 28% 59% 3% 2% 3% 0%
2003 6% 27% 46% 10% 6% 5% 0%
2005 6% 28% 49% 9% 3% 5% 0%
2007 2% 15% 51% 14% 11% 6% 1%
2009 2% 9% 54% 13% 10% 11% 1% Source: Hewitt Associates, 2009