assessing natural water quality in areas of special ... of special biological significance (asbs)...
TRANSCRIPT

Assessing Natural Water Quality In Areas Of Special Biological Significance (ASBS)
Quality Assurance Project Plan
Southern California Coastal Water Research Project 3535 Harbor Blvd, Suite 110
Costa Mesa, CA 92626
October 2008

Quality Assurance Project Plan Natural Water Quality In ASBS
October 2008
ii
Quality Assurance Project Plan
Southern California Coastal Water Research Project PROJECT: Assessing Natural Water Quality in Areas of Special Biological Significance PREPARED BY: Southern California Coastal Water Research Project 3535 Harbor Blvd. Suite 110 Costa Mesa, CA 92626
1. APPROVED BY: Grant Organization _________________________________________ ____________________ Ken Schiff, Project Director Date Southern California Coastal Water Research Project _________________________________________ ____________________ Greg Lyon, QA Officer Date Southern California Coastal Water Research Project _________________________________________ ____________________ Richard Gossett, Chemistry Laboratory Manager Date CRG Marine Laboratories. _________________________________________ ____________________ Dominic Gregorio, Contract Manager Date State Water Resources Control Board _________________________________________ ____________________ William Ray, Contract QA Officer Date State Water Resources Control Board

Quality Assurance Project Plan Natural Water Quality In ASBS
October 2008
iii
2. TABLE OF CONTENTS page
Group A Project Management
1. Approval Sheet ..........................................................................................................i
2. Table of Contents......................................................................................................iii
3. Distribution List ......................................................................................................... 1
4. Project/Task Organization......................................................................................... 2
5. Problem Definition / Background .............................................................................. 5
6. Project/Task Description ........................................................................................... 7
7. Quality Objectives and Criteria ............................................................................... 10
8. Special Training Needs/Certification....................................................................... 13
9. Documents and Records ........................................................................................ 14
Group B Data Generation and Acquisition ............................................................................ 16
10. Sampling Process Design....................................................................................... 16
11. Sampling Methods .................................................................................................. 17
12. Sample Handling and Custody ............................................................................... 18
13. Analytical Methods.................................................................................................. 19
14. Quality Control ........................................................................................................ 22
15. Instrument/Equipment Testing, Inspection, and Maintenance ................................ 24
16. Instrument/Equipment Calibration and Frequency.................................................. 25
17. Inspection/Acceptance for Supplies and Consumables.......................................... 26
18. Non-direct Measurements....................................................................................... 27
19. Data Management .................................................................................................. 28
Group C Assessment and Oversight ..................................................................................... 29
20. Assessments and Response Actions...................................................................... 29
21. Reports to Management ......................................................................................... 30
Group D Data Validation and Usablility ................................................................................. 31
22. Data Review, Verification, and Validation ............................................................... 31
23. Verification and Validation Methods........................................................................ 32
24. Reconciliation with User Requirements............................................................ 33
Appendix A Study Workplan Appendix B Standard Operating Procedure for Sampling Appendix C Standard Operating Procedure for Chemistry

Quality Assurance Project Plan Natural Water Quality In ASBS
October 2008
iv
LIST OF TABLES page
Table 1. (Element 4) Personnel responsibilities. .......................................................................3
Table 2. (Element 6) Analytical constituents and method requirements...Error! Bookmark not defined.
Table 3. (Element 6) Project schedule. .....................................................................................7
Table 4. (Element 7) Measurement quality objectives.............................................................11
Table 5. (Element 9) Document and record retention, archival, and disposition information. .15
Table 6. (Element 10). Number and frequency of water samples. .........................................16
Table 7. (Element 11) Sample handling ..................................................................................17
Table 8. (Element 13). Analytical methods.............................................................................19
Table 9. (Element 15). Testing, inspection and maintenance of sampling equipment and analytical instruments. ......................................................................................................24
Table 10. (Element 21) QA management report......................................................................30
LIST OF FIGURES page
Figure 1. Organization chart ......................................................................................................4
Figure 2. Study locations in Orange and San Diego Counties. .................................................8
Figure 3. Sampling stations in each of the four study areas......Error! Bookmark not defined.
Quality Assurance Project Plan Natural Water Quality In ASBS
October 2008
1
3. DISTRIBUTION LIST The final QAPP will be kept on file at SCCWRP. The following individuals will receive copies of the approved QAPP and any subsequent revisions:
Ken Schiff Southern California Coastal Water Research Project 3535 Harbor Blvd. Suite 110 Costa Mesa, CA 92626 [email protected] 714/755-3202 Greg Lyon Southern California Coastal Water Research Project 3535 Harbor Blvd. Suite 110 Costa Mesa, CA 92626 [email protected] 714/755-3226 Richard Gossett CRG Marine Labs 2020 Del Amo Blvd, Suite 200 Torrance, CA 90501 [email protected] 310/533.5190 x106 Dominic Gregorio State Water Resources Control Board 1001 I St. Sacramento, CA [email protected] 916/341-5488 Bill Ray State Water Resources Control Board 1001 I St. Sacramento, CA [email protected] 916/341-5583

Quality Assurance Project Plan Natural Water Quality In ASBS
October 2008
2
4. PROJECT/TASK ORGANIZATION 4.1 Involved Parties and Roles. Southern California Coastal Water Research Project (SCCWRP) is a joint powers agency that was formed by several government agencies with a common mission to gather the necessary scientific information to effectively, and cost-efficiently, protect the Southern California aquatic environment. As the lead agency in this project, SCCWRP will organize the sample collection, field and in-house analysis of samples and data, the maintenance of contracts with CRG Marine Laboratories, and all report preparation. Ken Schiff will be the SCCWRP coordinator for this study and will establish a project team for planning and conducting the study (Table 1, Figure 1). The CRG Marine Laboratory located in Torrance, CA will perform the chemical analyses of the water samples. Richard Gossett will oversee these analyses. 4.2 Quality Assurance Officer Role Greg Lyon is SCCWRP’s Quality Assurance Officer (QAO). The QAO’s role is to establish the quality assurance and quality control procedures found in this QAPP as part of the sampling, field analysis, and laboratory analysis procedures. The QAO will also work with the Laboratory Manager from CRG and SCCWRP by communicating all quality assurance and quality control issues contained in this QAPP. The QAO will also review and assess all procedures during the life of the contract against QAPP requirements. The QAO will report all findings to the Study Director, including all requests for corrective action. The QAO may stop all actions, including those conducted by subcontractors if there are significant deviations from required practices or if there is evidence of a systematic failure. 4.3 Persons Responsible for QAPP Update and Maintenance. Changes and updates to this QAPP may be made after a review of the evidence for change by SCCWRP’s Project Director and Quality Assurance Officer, and with the concurrence of the both SWRCB’s Contract Manager and Quality Assurance Officer. The Project Director will be responsible for making the changes, submitting drafts for review, preparing a final copy, and submitting the final for signature.

Quality Assurance Project Plan Natural Water Quality In ASBS
October 2008
3
Table 1. (Element 4) Personnel responsibilities.
Name Organizational Affiliation Title Contact Information (Telephone number, fax number, email address)
Ken Schiff SCCWRP Project Director Tel: (714) 372-9202 Fax: (714) 894-9699 [email protected]
Greg Lyon SCCWRP Project QA Officer Tel: (714) 372-9226 Fax: (714) 894-9699 [email protected]
Richard Gossett CRG Marine Laboratories Laboratory Manager Tel (310) 533-5190x130 Fax: (310) 833-0211 email: [email protected]
Dominic Gregorio SWRCB SWRCB Contract ManagerTel (916) 341-5488 Fax: (916) 341-5470 email: [email protected]
Bill Ray SWRCB SWRCB QA officer Tel: (916) 341-5583 Fax: (916) 341-5470 Email [email protected]

Quality Assurance Project Plan Natural Water Quality In ASBS
October 2008
4
4.4 Organizational Chart and Responsibilities
Figure 1. Organization chart
Contract Manager Dominic Gregorio
(SWRCB) (916) 341-5488
Project Director Ken Schiff
(SCCWRP) (714) 755- 3202
Project Quality Assurance Officer Greg Lyon (SCCWRP)
(714) 755-9266
Chemistry Analysis Rich Gossett
(CRG) (310) 533-5190x130
RWQCB Quality Assurance Officer Bill Ray
(SWRCB) (916) 341-5583

Quality Assurance Project Plan Natural Water Quality In ASBS
October 2008
5
5. PROBLEM DEFINITION / BACKGROUND 5.1 Problem Statement The coastal environment of California is an important ecological and economic resource. It is home to diverse and abundant marine life and has some of the richest habitats on earth including forests of the giant kelp, Macrocystis pyrifera. The State Water Resources Control Board (SWRCB) has created 34 Areas of Biological Significance (ASBS) in order to preserve and protect these especially valuable biological communities. California’s coasts are also a repository for waste discharges from the State’s ever-increasing population. Treated municipal and industrial wastewaters, urban runoff, and power generating station discharges all represent a number of risks to aquatic life from human activities. As a result, the SWRCB, in the California Ocean Plan (SWRCB 2005), has prohibited the discharge of waste to ASBS. All ASBS are State Water Quality Protection Areas that require special protection under state law. Despite the prohibition against waste discharges to ASBS, a recent survey of ASBS has observed approximately 1,658 outfalls (SCCWRP 2003). As a result, the SWRCB has initiated regulatory actions, establishing special protections through the Ocean Plan’s exception process. The intent of these regulatory actions is to maintain natural water quality within the ASBS. One large problem faced by both ASBS dischargers and regulators is a lack of information. The lack of information falls into at least three categories. First, it is uncertain what constitutes natural water quality. Second, it is uncertain which discharges exceed natural water quality limits. Finally, it is uncertain what the extent and magnitude of natural water quality impacts are on a statewide basis. 5.2 Decisions or Outcomes In response to the need for additional information, the SWRCB is working with ASBS dischargers to collaboratively conduct a statewide ASBS monitoring program. The goal of this monitoring program is to answer three questions:
1) What is the range of natural conditions at reference locations? 2) How do conditions along ASBS coastline compare to the natural conditions at
reference locations? Answering question one will help translate the narrative standard to a numerical interpretation of natural water quality. Answering question number two will help to assess if ASBS discharges are meeting the translated narrative standard.

Quality Assurance Project Plan Natural Water Quality In ASBS
October 2008
6
5.3 Water Quality Regulatory Criteria There are two narrative criteria for ASBS discharges in the California Ocean Plan. 1) no discharge of waste 2) maintenance of natural water quality These narrative standards differ from typical NPDES ocean discharges that must meet numerical standards for a long list of constituents (Table A, Table B). Standards for NPDES dischargers, which are based on toxicological studies to predict human health of aquatic health impacts, imply that some waste can be discharged so long as it is below levels that will result in adverse effects. The narrative standards for ASBS discharges are potentially more restrictive. However, no numerical standards for ASBS discharges currently exist.

Quality Assurance Project Plan Natural Water Quality In ASBS
October 2008
7
6. PROJECT/TASK DESCRIPTION 6.1 Work Statement and Produced Products This project will consist of three primary tasks including sampling, analysis, and reporting. Sampling will be focused on the water column for chemistry and toxicity. In total, there will be 18 sites in the southern California; 8 reference sites and 10 discharge sites. Site selection criteria are described in the project workplan (Appendix A). The product for this task will be a sampling summary memo indicating sampling success during the field program. The second task will involve laboratory analysis. Laboratory analysis includes chemical measurements in seawater. Laboratory analysis also includes toxicity testing using the sea urchin Strongylocentrotus pupuratus. The product for this task will be a laboratory analysis summary memo indicating analytical success for all samples delivered to laboratory. The final task will be reporting. This task involves information management, data analysis, and a final report. Information management will ensure consistency with the State’s Surface Water Ambient Monitoring Program (SWAMP). Report writing will provide a description of all methods, tabulations of raw data, and interpretation of results. The product for this task will include a SWAMP compliant relational database for study results (including metadata) and a written final report. 6.2 Constituents to be Monitored and Measurement Techniques For this element of the study, we will analyze salinity, total suspended solids, dissolved organic carbon, total and dissolved trace metals, polynuclear aromatic hydrocarbons, chlorinated hydrocarbons, and organophosphorus pesticides (See Section __, Table 8). Toxicity will be measured by assessing fertilization success using the echinoderm Strongylocentrotus purpuratus. 6.3 Project Schedule
Table 2. (Element 6) Project schedule.
Activity Anticipated
date of completion
Deliverable Deliverable due date
QAPP Production 10/31/08 QAPP 10/31/08
Sampling 4/30/09 Sampling Summary Memo 5/31/09
Laboratory Analysis 7/30/09 Laboratory Analysis Summary Memo 8/31/09

Quality Assurance Project Plan Natural Water Quality In ASBS
October 2008
8
Activity Anticipated
date of completion
Deliverable Deliverable due date
Draft Report 2/28//10 Draft Report 2/28/10
Final Report 3/31/10 Final report 3/31/10 6.4 Geographic Setting There are 34 ASBS located throughout California. Fourteen ASBS are located in southern California including the Channel Islands (Figure 2). ASBS include some of the most pristine coastline in the region. Most are also protected from the taking of game. In southern California, there are no publicly owned treatment works that discharge to ASBS. Two ASBS receive nonstormwater discharges (Scripps Institute of Oceanography, US Navy). The remaining discharges are all stormwater discharges from urban and/or agricultural land uses.
Figure 2. ASBS in California.
6.5 Constraints There are three constraints identified for this study. The first constraint is the ability to capture the full range of reference condition. Identifying and sampling reference sites

Quality Assurance Project Plan Natural Water Quality In ASBS
October 2008
9
in southern California, particularly along the mainland, is difficult due to the extensive urbanization of the coast. All of the sites selected for sampling have met pre-established reference site criteria. The second constraint is sampling wet weather events. Three storms have been selected at each site, but sampling teams are at the mercy of the weather. Sampling teams will be properly trained in weather forecasting, storm activation, and minimization of false starts, but sampling teams have no control over drought conditions should they occur. The third constraint is sample transport. Some sampling sites are located on the Channel Islands and if unsafe travel conditions exist, samples may exceed holding times for those analyses that require 48 hr turnaround. This constraint will be minimized through the use of proper sample handling, preservatives where applicable, and optimizing sample transport options.

Quality Assurance Project Plan Natural Water Quality In ASBS
October 2008
10
7. QUALITY OBJECTIVES AND CRITERIA Data Quality Objectives (DQOs) are quantitative and qualitative statements that specify the tolerable levels of potential errors in the data (U. S. EPA, 2000) and ensure that the data generated meet the standards for published data in the peer-reviewed literature. As defined in this plan, DQOs specify the quantity and quality of data required to support the study objectives. Each data quality category is described below. Numerical DQOs for the constituents being sampled are listed in Table 3. 7.1 Precision Precision describes how well repeated measurements agree. The precision objectives in this study apply to laboratory duplicate samples and matrix spike samples for chemical measurements (see Section 14). Precision for chemical measurements is quantified using relative percent difference (RPD) between duplicate samples (Table 3). Precision objectives for toxicity measurements focus on replicate reference toxicant exposures. Precision for toxicity measurements is quantified relative to the mean and standard deviation of previous reference toxicant exposures (Table 4). 7.2 Accuracy Accuracy describes how close the measurement is to its true value. The accuracy of chemical measurements in this study applies to laboratory control standards (LCS) and matrix spike (MS) samples (See section 14). The accuracy of chemical measurements is quantified as percent recovery (Table 3). Accuracy objectives for toxicity measurements focus on reference toxicant survival or larval development. Accuracy for toxicity measurements is quantified relative to the mean and standard deviation of previous reference toxicant exposures (Table 4). 7.3 Completeness Completeness describes the success of sample collection and laboratory analysis, which should be sufficient to fulfill the statistical criteria of the project (Table 4). Completeness is measured as the fraction of samples sampled and/or analyzed relative to the quantity targeted in the study design (See Section 10). While no specific statistical criteria have been established for this study, it is expected that 90% of all measurements could be taken when anticipated. This DQO accounts for adverse weather conditions, safety concerns, and equipment problems. A loss of 10% of the samples in this study would represent a minimal loss in statistical power to address the study objectives. 7.4 Representativeness

Quality Assurance Project Plan Natural Water Quality In ASBS
October 2008
11
Representativeness describes how characteristic the sample is of the actual condition attempting to be assessed. Representativeness in this study is addressed at two scales: 1) multiple reference sites to cover a range of reference conditions; and 2) multiple storm events to cover a range of storm conditions. 7.4 Bias Bias describes the tendency for under or overprediction of sampled or measured values relative to the true value. Bias is typically assessed through the use of matrix spikes and reference materials. Commercially available proficiency samples spiked with known concentrations are tested annually by CRG as part of their ELAP requirements. Bias will as be assessed through negative controls (Blanks). Detectable quantities in the blank would indicate positive bias.
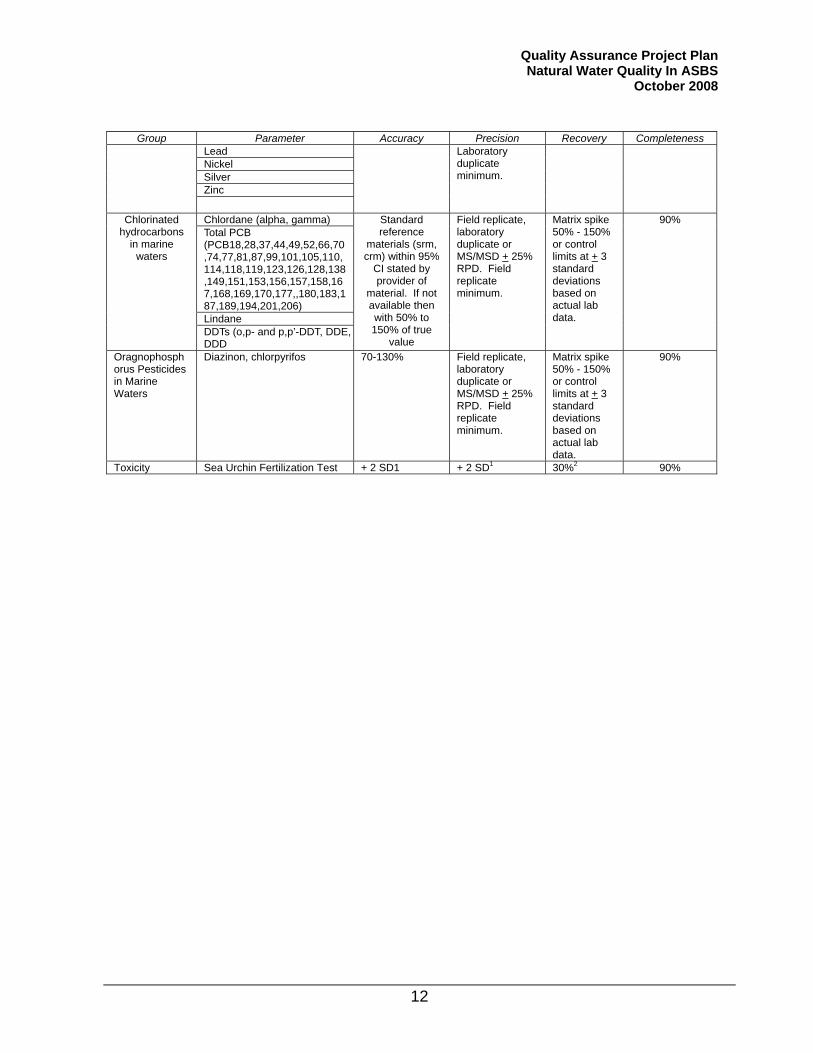
Table 3. (Element 7) Measurement quality objectives.
Group Parameter Accuracy Precision Recovery Completeness
Conventional Constituents in marine waters
TSS, Ammonia-N, Nitrate-N, NitN, Total Phosphate as P
Standard Reference Materials (SRM, CRM) within 95% CI stated by provider of material. If not available then with 80% to 120% of true value
Laboratory duplicate, Blind Field duplicate, or MS/MSD 25% RPD Laboratory duplicate minimum.
Not Applicable.
90%
1-Methylnaphthalene
2,6-Dimethylnaphthalene 2,3,5-Trimethylnaphthalene 2-Methylphenanthrene Acenaphthene Acenaphthylene Anthracene Benz[a]anthracene Benzo[a]pyrene Benzo[g,h,i]perylene Benzo[k]fluoranthene Biphenyl Chrysene Dibenz[a,h]anthracene Fluoranthene Fluorene Methylanthracene Indeno[1,2,3-c,d]pyrene Naphthalene Perylene Phenanthrene
Polynuclear aromatic hydrocarbons in marine waters
Pyrene
Standard Reference Materials (SRM, CRM) within 95% CI stated by provider of material. If not available then with 50% to 150% of true value
Field replicate, laboratory duplicate or MS/MSD + 25% RPD. Field replicate minimum.
Matrix spike 50% - 150% or control limits at + 3 standard deviations based on actual lab data.
90%
Arsenic Cadmium Chromium Copper
Trace Metals in marine waters
Iron
Standard Reference Materials (SRM, CRM, PT) 75% to 125%.
Field replicate, laboratory duplicate, or MS/MSD + 25% RPD.
Matrix spike 75% - 125%.
90%
Quality Assurance Project Plan Natural Water Quality In ASBS
October 2008
12
Group Parameter Accuracy Precision Recovery Completeness Lead Nickel Silver Zinc
Laboratory duplicate minimum.
Chlordane (alpha, gamma) Total PCB (PCB18,28,37,44,49,52,66,70,74,77,81,87,99,101,105,110,114,118,119,123,126,128,138,149,151,153,156,157,158,167,168,169,170,177,,180,183,187,189,194,201,206) Lindane
Chlorinated hydrocarbons
in marine waters
DDTs (o,p- and p,p’-DDT, DDE, DDD
Standard reference
materials (srm, crm) within 95%
CI stated by provider of
material. If not available then with 50% to 150% of true
value
Field replicate, laboratory duplicate or MS/MSD + 25% RPD. Field replicate minimum.
Matrix spike 50% - 150% or control limits at + 3 standard deviations based on actual lab data.
90%
Oragnophosphorus Pesticides in Marine Waters
Diazinon, chlorpyrifos 70-130% Field replicate, laboratory duplicate or MS/MSD + 25% RPD. Field replicate minimum.
Matrix spike 50% - 150% or control limits at + 3 standard deviations based on actual lab data.
90%
Toxicity Sea Urchin Fertilization Test + 2 SD1 + 2 SD1 30%2 90%

Quality Assurance Project Plan Natural Water Quality In ASBS
October 2008
13
8. SPECIAL TRAINING NEEDS/CERTIFICATION 8.1 Specialized Training or Certifications CRG analytical lab holds state certification for analysis of water and wastewater. No other specialized training is required for this study. 8.2 Training and Certification Documentation Both SCCWRP and CRG maintain records of their training. Those records can be obtained, if needed, through each agency. The Contractor’s QA Officer is responsible for overseeing training. 8.3 Training Personnel SCCWRP and CRG maintain rigorous field and laboratory training programs based on written, oral and performance-based guidelines. Training and performance are also evaluated on an ongoing basis based, in part, on the QA parameters defined in this plan. Standard Operating Procedures (SOPs) for field, laboratory, and data management tasks have been developed and will be updated on a regular basis in order to maintain procedural consistency. The maintenance of an SOP Manual will provide project personnel with a reference guide for training new personnel as well as a standardized information source that personnel can access.

Quality Assurance Project Plan Natural Water Quality In ASBS
October 2008
14
9. DOCUMENTS AND RECORDS All documents generated by this project will be stored at SCCWRP (Table 4). Sampling records and toxicity testing laboratory records will be stored and maintained at SCCWRP. Chemical testing records pertinent to this study will be maintained at the CRG laboratory. Copies of all records held by CRG or SCCWRP will be provided to the Project QA Officer or Project Director upon request. Persons responsible for maintaining records for this project are as follows. Ken Schiff will maintain all sample collection, sample transport, chain of custody, field analyses forms, all records associated with the receipt and analysis of samples analyzed for all parameters, and all records submitted by CRG. Rich Gossett will maintain CRG’s records. The Study Director will oversee the actions of these persons and will arbitrate any issues relative to records retention and any decisions to discard records. All data will be entered into an electronic database using a set of standardized data protocols for data entry and sharing. Database tables will include information on the location and character of each sampling site, physical and biological features, and results of toxicity and chemistry analyses, including QA Data. All field results will be recorded at the time of completion, using standardized field data sheets. Data sheets will be reviewed for outliers and omissions before leaving the sample site. Chain of custody forms will be completed for all water samples before leaving each sampling site. Data sheets and chains of custody will be stored by SCCWRP in hard copy form for five years from the time the study is completed. The directory where electronic files are stored will be backed up nightly on a second hard drive, and backed up monthly off-site. Copies of this QAPP will be distributed to all parties involved with the project, including field collectors and laboratory analysts. Copies will be sent to CRG for distribution within this lab. Any future amended QAPPs will be distributed in the same fashion. All originals of this and subsequent amended QAPPs will be held at SCCWRP. Copies of versions, other than the most current, will be discarded so as to avoid confusion. All data from this project will be made publicly available. Release of data will include comprehensive documentation. This documentation will include database table structures (including table relationships) and lookup tables used to populate specific fields in specific tables. Release to the public will also include quality assurance classifications of the data (i.e. flags, as appropriate) and documentation of the methods by which the data were collected (metadata). Data will be released to the general public once a final report documenting the study has been prepared. Final deposition of databases and reports will be passed to the State Board Contract Manger.

Quality Assurance Project Plan Natural Water Quality In ASBS
October 2008
15
Table 4. (Element 9) Document and record retention, archival, and disposition information.
Identify Type Needed Retention Archival Disposition
Notebook Paper Notebook 5 years Station Occupation Log Field data sheet Paper Notebook 5 years Sample Collection Records
Chain of Custody Paper Notebook 5 yeas
Lab notebooks Paper Notebook 3 years
Lab Results QA/QC Paper and electronic Notebook/Excel 3 years Analytical Records
Electronic data file Electronic Database 3 years
Data Records Data Entry Electronic Database Indefinite
QA/QC assessment Paper and electronic Document Indefinite Assessment Records Final Report Paper and electronic Document Indefinite

Quality Assurance Project Plan Natural Water Quality In ASBS
October 2008
16
GROUP B DATA GENERATION AND ACQUISITION
10. SAMPLING PROCESS DESIGN A total of 18 targeted sites will be sampled for this study (Table 5). Eight sites are reference locations and 10 are ASBS discharge sites. Site selection criteria are listed in the Project Workplan. Sampling will occur at each site immediately prior to and immediately following at least three storm events. Samples will be collected from the ocean directly in front of the discharge. All pre- and post-storm samples will be analyzed for chemistry. Toxicity will be analyzed from post storm samples only.
Table 5. (Element 10). Number and frequency of water samples.
Sample Location ASBS Number Latitude Longitude
Number of Storms
Total Number of Chemistry Samplesa
Total Number of Toxicity Samplesb
ASBS Discharge Sites Broad Beach ASBS 24 34.02002 118.51028 3 6 3 Birdview Ave/Westward Beach Rd ASBS 24 34.01065 118.81670
3 6 3
Buck Gully (NEW018) ASBS 32 33.58885 117.86750 3 6 3 Heisler Pk ASBS 33 32.54227 117.78919 3 6 3 SIO Headwall (Outfall 001) ASBS 29 TBD TBD
3 6 3
SIO Headwall (Outfall 003) ASBS 29 TBD TBD
3 6 3
Avenida De La Playa (SDL062) ASBS 31 32.85465 117.25895 3 6 3
Catalina Express Pier (TH1-SW) ASBS 25 33.44194
-118.49821
3 6 3
Reverse Osmosis Site ASBS 23 33.24659 119.44876 3 6 3 Barge Landing Site ASBS 23 33.21948 119.44761 3 6 3
ASBS Reference Sites
Arroyo Sequit ASBS 24 34.04558 118.93336 3 6 3 Nicholas Canyon ASBS 24 34.02310 118.54557 3 6 3 El Morro Canyon ASBS 33 33.56050 117.82194 3 6 3 San Onofre Creek (not in
ASBS) 33.38098 117.57854 3 6 3
Italian Gardens at Catalina Island
(not in ASBS) 33.41011 118.38176
3 6 3
Goat Harbor (not in ASBS) TBD TBD
3 6 3
North end of San Nicolas Island
ASBS 21 33.26648 119.49822
3 6 3
San Clemente Island ASBS 23 3 6 3
a Pre and Post-storm samples b Post-storm samples only

Quality Assurance Project Plan Natural Water Quality In ASBS
October 2008
17
11. SAMPLING METHODS
Sampling requires the manual collection of grab samples by direct bottle filling. The complete sampling SOP appears in Appendix B. Sample containers and preservatives are identified in Table 6. Appropriate pre-cleaned sample containers will be used. Sample bottles and caps will be protected from contact with solvents, dust, or other contaminants. Sample bottles for this project will not be reused. The sampling coordinator has responsibility for assessing the safety of sampling teams. A two-person team will conduct all sampling, and the sampling team will have access to a cellular phone in order to alert rescue agencies should an accident occur. Sampling will be postponed if the sampling team determines that the conditions are unsafe. Failure to collect a sample due to safety concerns or technical issues will be promptly reported to the Project Director, who will determine if any corrective action is needed and make arrangements to collect a replacement sample (if possible). The Quality Assurance Officer will document sampling failures and the effectiveness of corrective actions.
Table 6. (Element 11) Sample handling.
Analyte Bottle Type/Size
No. Bottles per
Sample Preservative Maximum Holding Time
TSS 1L HDPE 1 Cool at <4oC 7 days
Dissolved Organic Carbon
250mL Glass 1 Cool at <4oC
8 h filtration and acidification, 6 months
analysis Nitrite, Nitrate 250mL HDPE 1 Cool at <4oC 48 h Ammonia, Total P 250mL Glass 1 Cool at <4oC
with H2SO4 28 days
Metals 500mL HDPE 1 Cool at <4oC
48 h filtration and acidification, 6 months
analysis
Organics (PAH, CHC, OP)
1L Amber Glass with Teflon Lid
2 Cool at <4oC 7 days till extraction, 40
days till analysis
Toxicity 250mL I-Chem Series 400 HDPE
1 Cool at <4oC 36 h preferred, 48 h max
Quality Assurance Project Plan Natural Water Quality In ASBS
October 2008
18
12. SAMPLE HANDLING AND CUSTODY Samples will be kept properly chilled (< 4°C) and will be transferred to the analytical laboratories within the holding times specified in Error! Reference source not found. 7. To provide for proper tracking and handling of the samples, documentation will accompany the samples from the initial collection to the final extractions and analysis. All bottles will be pre-labeled. Once sample containers are filled, they will be placed on ice, in a cooler, in the dark and transported to the laboratory for processing. Field data sheets and chains of custody will accompany the collection of water samples. All samples will be labeled with the sample date and time, and numbered with a unique code that will be used to track the sample throughout its analyses. These identification labels are also entered directly onto field and laboratory data sheets. All observations recorded in the field as well as information recorded during processing of samples in the laboratory will be kept in the project database. Hard copies of these field and laboratory data sheets will be maintained in a project notebook. Chain-of-Custody Forms for the samples will be completed and transport of the samples to the analytical laboratory will be coordinated to ensure that all samples are handled and analyzed within the proper holding time. An example of the Chain-of-Custody form is shown in Appendix B. The Field Supervisor is required to ensure all sampling handling and custody is done properly.

Quality Assurance Project Plan Natural Water Quality In ASBS
October 2008
19
13. ANALYTICAL METHODS 13.1 Analysis Methods The samples will be analyzed for chemistry and toxicity as indicated below. 13.1.1 Chemistry Inductively coupled plasma-mass spectrometry (ICP-MS, EPA 1640) will be used in order to analyze concentrations of trace metals in seawater samples. Gas Chromatagraphy/Mass Spectrometry (GC-MS, EPA 625) will be used in order to analyze concentrations of organic analytes in seawater samples. EPA Method 625 has been modified to quantify 41 PCB congeners. Method verification data are available from the laboratory upon request of the QA Officer. 13.1.2 Toxicity The mussel embryo development test (EPA/600/R-95/136) will be used to assess the toxicity of the surface water samples. Toxicity Identification Evaluation (TIE) will be used to characterize the cause(s) of toxicity, where appropriate, using EPA/600/R-96/054.
Table 7. (Element 13). Analytical methods. NA = not applicable. Analytical Method
Analyte Project Quantitation Limit (units, wet or dry weight) Analytical
Method/ SOP
Modified for Method yes/no
Total Suspended Solids 4 mg/L SM 2540 D No
Ammonia 0.05 mg/L SM 4500-NH3 F
No
Nitrite-N 0.05 mg/L EPA 300 No
Nitrate-N 0.05 mg/L EPA 300 No
Total P 0.05 mg/L SM 4500-P E No
Toxicity (Sea Urchin fertilization) NA EPA/600/R-95/136
No
Arsenic 0.01 ug/L EPA 1640 No
Cadmium 0.005 ug/L EPA 1640 No
Chromium 0.025 ug/L EPA 1640 No
Copper 0.01 ug/L EPA 1640 No
Iron 0.5 ug/L EPA 1640 No
Lead 0.005 ug/L EPA 1640 No
Nickel 0.005 ug/L EPA 1640 No
Silver 0.02 ug/L EPA 1640 No

Quality Assurance Project Plan Natural Water Quality In ASBS
October 2008
20
Analytical Method
Analyte Project Quantitation Limit (units, wet or dry weight) Analytical
Method/ SOP
Modified for Method yes/no
Zinc 0.005 ug/L EPA 1640 No
1–Methylnaphthalene 5 ng/L 625* Yes
1–Methylphenanthrene 5 ng/L 625 Yes
2,6-Dimethylnaphthalene 5 ng/L 625 Yes
2,3,5-Trimethylnaphthalene 5 ng/L 625 Yes
2-, Methylphenanthrene 5 ng/L 625 Yes
Acenaphthene 5 ng/L 625 Yes
Acenaphthylene 5 ng/L 625 Yes
Anthracene 5 ng/L 625 Yes
Benz[a]anthracene 5 ng/L 625 Yes
Benzo[a]pyrene 5 ng/L 625 Yes
Benzo[g,h,i]perylene 5 ng/L 625 Yes
Benzo[k]fluoranthene 10 ng/L 625 Yes
Biphenyl 10 ng/L 625 Yes
Chrysene 5 ng/L 625 Yes
Dibenz[a,h]anthracene 5 ng/L 625 Yes
Fluoranthene 5 ng/L 625 Yes
Fluorene 5 ng/L 625 Yes
Methylanthracene 10 ng/L 625 Yes
Indeno[1,2,3-c,d]pyrene 5 ng/L 625 Yes
Naphthalene 5 ng/L 625 Yes
Perylene 10 ng/L 625 Yes
Phenanthrene 5 ng/L 625 Yes
Pyrene 5 ng/L 625 Yes
Dieldrin 1 ng/L 625 Yes
Lindane 1 ng/L 625 Yes
Total DDT (o,p and p,p isomers of DDT, DDE, DDD) 1 ng/L 625 Yes
Chlordane 1 ng/L 625 Yes
Total PCB (PCB18,28,37,44,49,52,66,70,74,77,81,87,99,101,105,110,114,118,119,123,126,128,138,149,151,153,156,157,158,167,168,169,170,177,,180,183,187,189,194,201,206)
1 ng/L
625 Yes
Diazinon 1 ng/L 625 Yes
Chlorpyrifos 1 ng/L 625 Yes
*The method modification includes increasing the sample volume to 2 liters and tuning the GCMS to increase the sensitivity to higher masses.
13.2 Sample Disposal

Quality Assurance Project Plan Natural Water Quality In ASBS
October 2008
21
After analysis, including QA/QC procedures, any excess sample will be disposed of by the analytical laboratories. All samples will be disposed of in a manner consistent with the SOP (Appendix C) 13.3 Corrective Action Corrective action is taken when an analysis is deemed suspect for some reason. These reasons include exceeding RPD ranges and/or problems with spike recoveries or blanks. The corrective action will vary on a case-by-case basis, but at a minimum involves the following:
• A check of procedures. • A review of documents and calculations to identify possible errors. • Correction of errors. • A re-analysis of the sample digest, if sufficient volume is available, to determine
if results can be improved. • A complete reprocessing and re-analysis of additional sample material, if
sufficient volume is available and if the holding time has not been exceeded. The SCCWRP and the CRG analytical lab each have systems in place to document problems and make corrective actions. All corrective actions will be documented to the Project Manager.

Quality Assurance Project Plan Natural Water Quality In ASBS
October 2008
22
14. QUALITY CONTROL Samples for QA/QC will be collected both in the field and in the lab. Field QA/QC samples are used to evaluate potential contamination and sampling error occurring prior to sample delivery to the analytical laboratory. Field QA/QC samples include field blanks. Lab QA/QC samples are used to evaluate the analytical process for contamination, accuracy, and reproducibility. Internal laboratory quality control checks will include method blanks, matrix spike/matrix spike duplicate (MS/MSDs), and duplicates (See Section 7). These QA/QC activities are discussed below. 14.1 Blanks Blanks help verify that the equipment, sample containers, and reagents are not a source of contamination, and that the sampling techniques used are non-contaminating. Both field and laboratory blanks are included in the program. Field blanks will be used to determine if field sampling activities are a potential source for contamination. These blanks will be collected by sampling "blank water" (contaminant-free deionized water) in the field during a sampling event. The same equipment used for collection of the grab samples will be used to transfer the blank water into the blank sample containers. Method blanks will be run by the analytical laboratory to determine the level of contamination associated with laboratory reagents and equipment. A method blank is a clean sample in a known matrix that has been subjected to the same complete analytical procedure as the submitted samples to determine if contamination has been introduced into the samples during processing. Results of method blank analysis should be less than the reporting limits for each analyte, or less than 5% of the native sample concentration. For toxicity tests, blanks are represented by negative control samples. In this study, filtered seawater from an uncontaminated location will be used. 14.2 Spikes and Duplicates Matrix spike/matrix spike duplicates (MS/MSD) will be used to assess precision and accuracy of the laboratory analytical method. A MS is created when the laboratory adds a known quantity of analyte to an aliquot of field sample. After accounting for native concentrations, the percent recovery is calculated as the proportion of the known compound in the sample. The acceptable recovery limits are shown in Table 3. Percent recovery is calculated as: Percent Recovery = ((spike concentration – sample concentration)*100)/spike concentration

Quality Assurance Project Plan Natural Water Quality In ASBS
October 2008
23
A MSD will be the reanalysis of the MS. The MSD results are compared to the MS results to assess the precision of the laboratory analytical method. MS/MSD results are evaluated by calculating the relative percent difference (RPD) between the two sets of results. The acceptable RPD limits are shown in Table 3. The RPD is calculated as: Relative Percent Difference = (100 * (MS – MSD/2))/(MS + MSD)/2) 14.3 Reference Toxicants Organism health can be impacted by how the animals were collected, handled or shipped, and exposure parameters. To increase precision as a result of test exposure variability, environmental parameters are kept to a strict range of temperature, pH, salinity, light intensity, photoperiod, and dissolved oxygen. To ensure that a particular batch of organisms is not overly sensitive or tolerant, concurrent toxicity tests are conducted using spiked reference toxicants in laboratory dilution water. Copper will be the reference toxicant in this study. The results of these reference toxicity tests are compared with the mean response for the same organism from previous tests conducted in the SCCWRP laboratory. Acceptable reference toxicants limits are achieved if the results are within 2 standard deviations of the grand mean for the laboratory’s control chart (Table 4).

Quality Assurance Project Plan Natural Water Quality In ASBS
October 2008
24
15. INSTRUMENT/EQUIPMENT TESTING, INSPECTION, AND MAINTENANCE 15.1 Sampling Equipment The Sampling SOP (Appendix B) lists all equipment to be used for sampling. Sampling equipment shall be checked prior to departure. Duplicate or back-up equipment shall be taken where possible. 15.2 Analytical Instruments The chemistry analytical laboratory maintains its equipment in accordance with its SOPs, which include those specified by the manufacturer and those specified by the method. Problems with the instrumentation during analysis will require repair, recalibration, and re-analysis of the sample. Table 8. (Element 15). Testing, inspection and maintenance of sampling equipment and analytical instruments.
Equipment / Instrument
Responsible Person Frequency SOP Reference
Sampling gear Ken Schiff Refer to SOP Appendix B
GC/MS Rich Gossett Refer to SOP Appendix C
ICP/MS Rich Gossett Refer to SOP Appendix C
Quality Assurance Project Plan Natural Water Quality In ASBS
October 2008
25
16. INSTRUMENT/EQUIPMENT CALIBRATION AND FREQUENCY All laboratory equipment is calibrated based on manufacturer recommendations and accepted laboratory protocol. The CRG analytical laboratory maintains calibration practices as part of the method SOPs. The instrument will be recalibrated if the calibration curve does not meet acceptable limits. Problems with the instrument calibration will be documented by the analyst if the problem is persistent, or if the resulting data are questionable.

Quality Assurance Project Plan Natural Water Quality In ASBS
October 2008
26
17. INSPECTION/ACCEPTANCE FOR SUPPLIES AND CONSUMABLES Glassware, sample bottles, and collection equipment will all be inspected prior to their use for chips, cracks, leaks, contamination, and other deformities that can affect the outcome of the study results. Sampling bottles will be purchased from VWR (vwr.com, 800-932-2500) or comparable vendor. Supplies will be examined for damage as they are received. Precleaned containers will be used for sampling (Table 7). Sea urchins will be collected from a noncontaminated area of the southern California Bight. The field manager will be responsible for acquisition and inspection of sampling containers. The toxicity manager will be responsible for acquisition and inspection of test organisms. The chemistry manager will be responsible for acquisition and inspection of chemical supplies including standards.

Quality Assurance Project Plan Natural Water Quality In ASBS
October 2008
27
18. NON-DIRECT MEASUREMENTS This study will not incorporate existing data or other non-direct measurements. Weather forecasting information will be obtained from the National Weather Service (http://www.wrh.noaa.gov/lox/).

Quality Assurance Project Plan Natural Water Quality In ASBS
October 2008
28
19. DATA MANAGEMENT The management of water quality and toxicological data will be initiated with the use of field and laboratory data sheets. Analysis results will be electronically sent to the Project Director following the completion of quality control checks by each of the laboratories. Data will be screened for the following major items:
• A 100 percent check between electronic data provided by the laboratory and the hard copy reports
• Conformity check between the Chain-of-Custody Forms and laboratory reports • A check for laboratory data report completeness • A check for typographical errors on the laboratory reports • A check for suspect values
CRG laboratories will provide data in both hard copy and electronic format. The required form of electronic submittals will be provided to the laboratories to ensure the files can be imported into the project database with a minimum of editing. The data will be managed in SCCWRP’s project database, which has a relational structure and is compatible for incorporation into the SWAMP database. This database has been inspected and validated through use on other programs including Southern California Regional Monitoring Efforts (2003 Southern California Regional Marine Monitoring Information Management Plan ftp://ftp.sccwrp.org/pub/download/PDFs/BIGHT03/bight03_infoplan.pdf). The Project Director will be responsible for ensuring that data are entered into the database. Following the initial screening, a more complete QA/QC review process will be performed, which will include an evaluation of holding times, method and equipment blank contamination, and analytical accuracy and precision. Accuracy will be evaluated by reviewing MS/MSD and LCS recoveries; precision will be evaluated by reviewing MSD and laboratory sample duplicate RPDs.

Quality Assurance Project Plan Natural Water Quality In ASBS
October 2008
29
GROUP C ASSESSMENT AND OVERSIGHT
20. ASSESSMENTS AND RESPONSE ACTIONS The Project Director will be responsible for the day-to-day oversight of the project. The Project QA Officer will conduct systematic reviews of the data for the specified DQOs every time data packets are delivered and entered into the SCCWRP database. Any problems will be relayed to the Project Director. The Project QA Officer has the power to halt all sampling and analytical work if the deviation(s) noted are considered detrimental to data quality. Problems that cannot be corrected, will be documented by the QA Officer, flagged in the database, and acknowledged in the final report.
Quality Assurance Project Plan Natural Water Quality In ASBS
October 2008
30
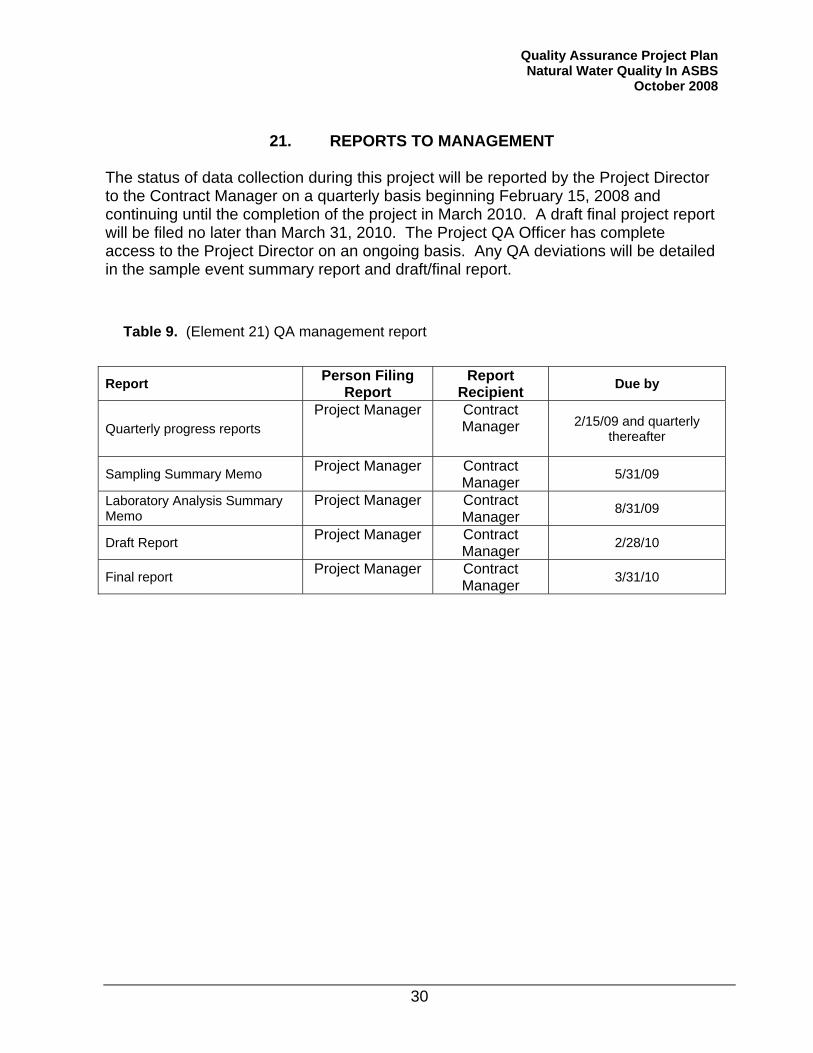
21. REPORTS TO MANAGEMENT The status of data collection during this project will be reported by the Project Director to the Contract Manager on a quarterly basis beginning February 15, 2008 and continuing until the completion of the project in March 2010. A draft final project report will be filed no later than March 31, 2010. The Project QA Officer has complete access to the Project Director on an ongoing basis. Any QA deviations will be detailed in the sample event summary report and draft/final report.
Table 9. (Element 21) QA management report
Report Person Filing
Report Report
Recipient Due by
Quarterly progress reports Project Manager Contract
Manager 2/15/09 and quarterly thereafter
Sampling Summary Memo Project Manager Contract Manager 5/31/09
Laboratory Analysis Summary Memo
Project Manager Contract Manager 8/31/09
Draft Report Project Manager Contract Manager 2/28/10
Final report Project Manager Contract Manager 3/31/10
Quality Assurance Project Plan Natural Water Quality In ASBS
October 2008
31
GROUP D DATA VALIDATION AND USABLILITY
22. DATA REVIEW, VERIFICATION, AND VALIDATION Laboratory validation and verification of the data generated is the responsibility of the laboratory. The laboratory manager will maintain analytical reports in a database format as well as all QA/QC documentation for the laboratory. SCCWRP will review all data packages received for adherence to guidelines set forth in this QAPP. COC forms will be reviewed to ensure adherence to collection, transport, and receipt requirements, including test initiation within the required holding time. Toxicity data will be evaluated for completeness, adherence to test methodology, passing acceptability criteria, choice of appropriate statistical methods, and proper reporting. Laboratories will conduct a 100 percent raw data versus electronic data audit before delivering results to SCCWRP. If data validation issues arise, the corrective action process will include: 1) review of original field or laboratory procedures or documents (i.e., field sheets or laboratory bench sheets); 2) severity determination of field or laboratory deviation on resulting data and its impact on the study conclusions; 3) resampling and/or reanalysis of sample(s) as necessary. All deviations will be documented by the Study Director in the quarterly and/or final reports to the contract manager. Deviations in field sampling or laboratory analysis shall be noted on the field or laboratory sheets and in the project database.

Quality Assurance Project Plan Natural Water Quality In ASBS
October 2008
32
23. VERIFICATION AND VALIDATION METHODS Data collected in the field will be validated and verified by the Project QA Officer. Reconciliation and correction will be the responsibility of the Project Director. Laboratory validation and verification of the data generated is the responsibility of the laboratory. Each laboratory supervisor maintains analytical reports in a database format as well as all QA/QC documentation for the laboratory. The Project Director is responsible for oversight of data collection and the initial analysis of the raw data obtained from the field and the contracted laboratory. The Project Director responsibilities also include the generation of rough drafts of quarterly and final reports. The Project Director has final oversight on the submission of quarterly and final reports.

Quality Assurance Project Plan Natural Water Quality In ASBS
October 2008
33
24. RECONCILIATION WITH USER REQUIREMENTS
These data will be used to answer the project questions. These data can be used directly by the SWRCB for assessment of ASBS condition. These data can also be used by SWAMP in their assessment of California’s waterbodies by inclusion in the State’s 305(b) report. Data analysis will address study uncertainty (see section 6.5).
The reports produced by this project will describe some of the limitations of the data. This includes constraints (Section 6.5) and ability to meet project DQO’s (Section 7.0). For data that do not meet DQOs, management has two options:
1. Retain the data for analytical purposes, but flag these data for QA deviations. 2. Do not retain the data and exclude them from all calculations and
interpretations.
The choice of option is the decision of the Project Manager. If qualified data are to be used, then it must be made clear in the final report that these deviations do not alter the conclusions of the study.

Quality Assurance Project Plan Natural Water Quality In ASBS
October 2008
1
APPENDIX A
Project Workplan

Southern California Bight 2008 Regional Monitoring Survey
(Bight’08)
Areas of Special Biological Significance (ASBS) Workplan
Prepared by:
Bight’08 ASBS Planning Committee
Prepared for:
Commission of the Southern California Coastal Water Research Project 3535 Harbor Blvd, Suite 110
Costa Mesa, CA 92626
October 2008
Final Draft Bight’08 ASBS Workplan
i
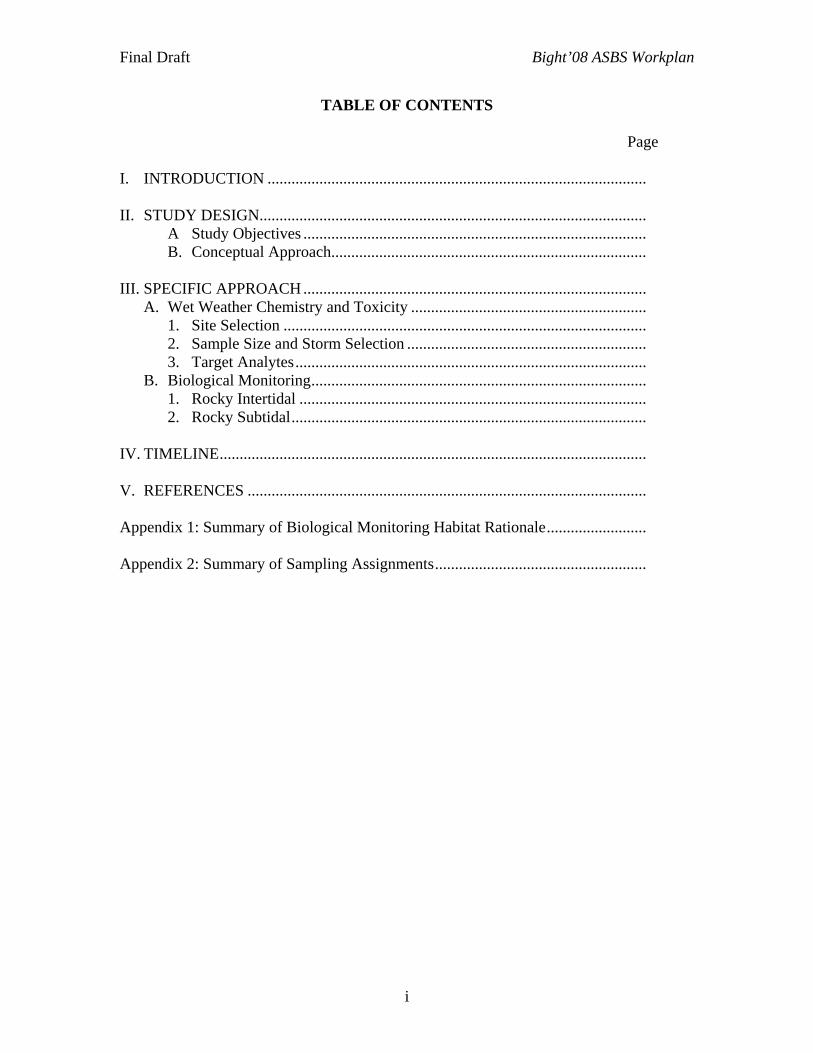
TABLE OF CONTENTS Page I. INTRODUCTION ............................................................................................... II. STUDY DESIGN.................................................................................................
A Study Objectives ...................................................................................... B. Conceptual Approach...............................................................................
III. SPECIFIC APPROACH ......................................................................................
A. Wet Weather Chemistry and Toxicity ........................................................... 1. Site Selection ........................................................................................... 2. Sample Size and Storm Selection ............................................................ 3. Target Analytes........................................................................................
B. Biological Monitoring.................................................................................... 1. Rocky Intertidal ....................................................................................... 2. Rocky Subtidal.........................................................................................
IV. TIMELINE........................................................................................................... V. REFERENCES .................................................................................................... Appendix 1: Summary of Biological Monitoring Habitat Rationale......................... Appendix 2: Summary of Sampling Assignments.....................................................

Final Draft Bight’08 ASBS Workplan
1
I. INTRODUCTION The coastal environment of California is an important ecological and economic resource. It is home to diverse and abundant marine life and has some of the richest habitats on earth including forests of the giant kelp, Macrocystis pyrifera. The State Water Resources Control Board (SWRCB) has created 34 Areas of Biological Significance (ASBS) in order to preserve and protect these especially valuable biological communities. California’s coasts are also a repository for waste discharges from the State’s ever-increasing population. Treated municipal and industrial wastewaters, urban runoff, and power generating station discharges all represent a number of risks to aquatic life from human activities. As a result, the SWRCB, in the California Ocean Plan (SWRCB 2005), has prohibited the discharge of waste to ASBS. All ASBS are State Water Quality Protection Areas that require special protection under state law. Despite the prohibition against waste discharges to ASBS, a recent survey of ASBS has observed approximately 1,658 outfalls (SCCWRP 2003). As a result, the SWRCB has initiated regulatory actions, establishing special protections through the Ocean Plan’s exception process. The intent of these regulatory actions is to maintain natural water quality within the ASBS. One large problem faced by both ASBS dischargers and regulators is a lack of information. The lack of information falls into at least three categories. First, it is uncertain what constitutes natural water quality. Second, it is uncertain which discharges exceed natural water quality limits. Finally, it is uncertain what the extent and magnitude of natural water quality impacts are on a statewide basis. II. STUDY DESIGN A Study Objectives
In response to the need for additional information, the SWRCB is working with ASBS dischargers to collaboratively conduct a statewide ASBS monitoring program. The goal of this monitoring program is to answer three questions:
1) What is the range of natural conditions at reference locations? 2) How do conditions along ASBS coastline compare to the natural conditions at
reference locations? 3) How does the extent of natural conditions compare among ASBS with or without
discharges?

Final Draft Bight’08 ASBS Workplan
2
B. Conceptual Approach The conceptual approach integrates targeted and probabilistic surveys of water chemistry and biological conditions in receiving waters along the coastline of California. A targeted design will be used for defining natural water quality at reference sites. A targeted design will also be used for comparing individual ASBS to natural water quality in order to examine discharge-specific impacts. A probabilistic design will be used to answer the third question as it pertains to ASBS as a whole. In all designs, sampling for water chemistry will be focused on wet weather events. The biological samples, which are more integrative over time, will be collected during a preselected index period when communities are most stable. A series of three analytical steps will be required to answer the monitoring questions. These include: 1) providing information used to define natural conditions; 2) compare ASBS to natural conditions; and 3) assess percent of shoreline-miles in ASBS that exceed natural conditions. Questions 1 and 2 will include chemistry, toxicity and biology, but question 3 focuses solely on chemistry. The first step is to generate information to help define natural water quality. In conjunction with the Natural Water Quality Committee1, natural water quality will be defined as the ambient water quality in the vicinity of reference watersheds. A statistical approach (i.e., tolerance limits, reference envelope, population intervals, etc.) from this distribution of ambient water quality near reference watersheds will be used to define natural (See example Fig 1).
Figure 1. Developing a definition of natural water quality. The second analytical step is to compare ASBS to natural water quality limits (Question 2). This can be done by simply comparing receiving water concentrations within 1 The ASBS Natural Water Committee is a team of scientists commissioned by the State Water Resources Control Board.
Fake Data From Reference Sites
Concentration
0 2 4 6 8 10 12
Freq
euen
cy (%
)
0
5
10
15
20
25
30
35
Ref
eren
ce L
imits
Ref
eren
ce L
imits

Final Draft Bight’08 ASBS Workplan
3
individual ASBS to our definition of natural water quality (Fig 2). Maps are also convenient data analysis tools for stakeholders. The goal of this monitoring is to sample at locations in the immediate vicinity of the discharge to determine if natural water quality limits are exceeded in the presumed location of greatest impact.
Figure 2. Comparing ASBS water quality to natural The third analytical step is an assessment of percent of shoreline-miles in ASBS that exceed natural water quality (Fig 3). ASBS areas with and without discharges will be stratified. This will take into account discharges outside of the ASBS that are impacting water quality inside the ASBS (i.e., a large river plume from upcoast or downcoast).
Fake Data From ASBS Sites
ASBS No.
0 2 4 6 8 10 12
Con
cent
ratio
n
0
5
10
15
20
25
30
35
Reference Limits
Fake Data From ASBS
Discharges Present?
No YesAre
a th
at e
xcee
ds N
atur
al W
ater
Qua
lity
(% o
f AS
BS
)
0
20
40
60
80
100

Final Draft Bight’08 ASBS Workplan
4
Figure 3. Extent of impact at ASBS The biological monitoring is best conceptualized by habitat. There are several habitats that could be evaluated and the Planning Committee has decided to prioritize on rocky intertidal and subtidal habitat (See Appendix 1). The sampling design to address biology will be very similar to the chemistry design (except for rocky habitat). The analysis will also look similar (i.e., substitute concentration on the y-axis for biodiversity or other biological endpoint on Fig 2). Comparisons between chemistry and biological responses will be conducted such as frequency of co-occurrence, correlations, or regressions. There is no direct cause-and-effect (water quality-to-biology) linkage implicit in this design. Rather, the monitoring design should be used as an adaptive trigger for indicating if additional, site-specific investigations need to be undertaken. III. SPECIFIC APPROACH A. Wet Weather Chemistry and Toxicity
1. Site Selection Since there is little or no historic water quality data available in ASBS sites prior to anthropogenic discharges, reference sites will be selected that will be used to determine natural water quality and natural condition of marine life. The following primary criteria were established for reference sites:
• Located in receiving water at the mouth of watersheds with limited anthropogenic influences and with no offshore discharges in the vicinity.
• Limited anthropogenic influence defined as a minimum of 90% open space. Preferably, the few anthropogenic sources in a reference watershed will be well attenuated (e.g., natural space buffers between a highway and the high tide line).
• There should be no 303(d) listed waterbodies either in the reference watershed or in the coastal zone.
There are additional secondary criteria that are deemed important, but may not lead to complete exclusion:
• A range of reference watershed sizes that are inclusive of the ranges observed in watersheds that discharge to ASBS.
• A range of reference watershed geologies that are inclusive of the geologies observed in watersheds that discharge to ASBS
• A range of reference beach substrate that includes sand, cobble, and rock. • Reference watersheds that include channel island and mainland sites.
A total of nine reference sites have been selected for sampling as part of the regional monitoring survey (Table 1). In addition to reference sites, receiving water sites near ASBS discharges will also be sampled (Table 2). These receiving water sites are located directly in front of discharges

Final Draft Bight’08 ASBS Workplan
5
from regulated ASBS outfalls. The number of sites in ASBS was based on the following criteria:
• Minimum of 1 site/stakeholder/ASBS • Sample receiving waters near at least 10% of all regulated outfalls in an ASBS (>
18 inches opening) • Discharge must reach receiving water (i.e., ocean) • Approval by RWQCB and SWRCB
A total of 13 receiving water sites near discharges have been targeted for sampling. Additional sites may be selected for contingency measures due to impaired sampling logistics or limited rainfall. Appendix 2 lists the site and sampling responsibilities. Table 1. List of receiving water reference sampling sites. Site Name ASBS Number Latitude Longitude Southern California Mainland
Arroyo Sequit ASBS 24 34.04558 118.93336 Nicholas Canyon ASBS 24 34.02310 118.54557 El Morro Canyon ASBS 33 33.56050 117.82194 2nd Orange County ASBS 33 TBD TBD San Onofre Creek (not in ASBS) 33.38056 117.57722
Southern California Islands
Italian Gardens at Catalina Island (not in ASBS) 33.41011 118.38176 Goat Harbor at Catalina Island (not in ASBS) 33.41667 118.39583 North end of San Nicolas Island ASBS 21 33.26648 119.49822 San Clemente Island ASBS 23 32.97722 118.53404
Table 2. List of receiving water sampling sites near ASBS discharges. Site Name ASBS Number Latitude Longitude Southern California Mainland
Broad Beach ASBS 24 34.02002 118.51028 Westward Beach ASBS 24 34.01065 118.81670 Buck Gully (NEW018) ASBS 32 33.58885 117.86750 Heisler Pk ASBS 33 33.54227 117.78919 SIO Headwall ASBS 31 32.85000 117.25750 Avenida De La Playa (SDL062) ASBS 29 32.85465 117.25895
Southern California Islands
Connolly Pacific ASBS 28 33.32665 118.30458 Two Harbors ASBS 26 33.44489 118.49325 Catalina Express Pier (TH1-SW) ASBS 25 33.44194 118.49821 San Clemente Island (Outfall 27) ASBS 23 33.00483 118.55641

Final Draft Bight’08 ASBS Workplan
6
San Clemente Island (Outfall 21) ASBS 23 33.00540 118.55844 San Nicholas Island (Reverse Osmosis) ASBS 21 33.24659 119.44876 San Nicholas Island (Barge Landing) ASBS 21 33.21948 119.44761
2. Sample Size and Storm Selection A total of three sample events will be collected during the wet season. The primary goal is to capture storms where discharge is sufficient to reach receiving waters. Especially at beaches with large sand berms, sampling receiving waters with direct discharges is not a certainty. In order to maximize the probability of capturing these events, small storms are discouraged. Receiving water samples will be collected immediately prior to (< 48 h) and immediately following (< 24 h) wet weather events. Surface water sampling will be performed from shore (grab samples) in the surf zone (0.5 – 1.0m depth) at the mouth of a reference watershed stream. Sampling procedures should focus on direct bottle filling, but in the case of safety, a pre-cleaned intermediate container may be used. Sampling details can be found in the Bight’08 ASBS Field Standard Operating Procedure (See Appendix 2).
3. Target Analytes The target analytes for this program focus on constituents that have natural and anthropogenic sources. Nine different analyte classes are targeted for analysis including:
• salinity • total suspended solids (TSS) • dissolved organic carbon • total and dissolved trace metals • nutrients (nitrate, nitrite, ammonia, toal nitrogen, total phosphorus) • polynuclear aromatic hydrocarbons (PAHs) • chlorinated and organophosphorus pesticides • toxicity (sea urchin fertilization test)
Salinity and TSS are not necessarily toxic, but can serve as excellent markers of the stormwater plume as the turbid freshwater runoff mixes with ambient seawater. Organic carbon has natural sources such as terrestrial debris, but also arises from anthropogenic sources such as oil, grease, or gasoline spilled on roadways. Organic carbon can also serve as a sequestering agent binding trace metals and reducing their bioavailability. Trace metals are a natural component of the earth’s crust and can be found in varying quantities in every geological formation. Anthropogenic sources of trace metals such as tire and break wear debris are also commonly found in urban stormwater runoff. While the total fraction is the required measurement for comparison to Ocean Plan thresholds, dissolved trace metals is considered bioavailable to marine life. It is also this dissolved bioavailable fraction that can potentially bind with dissolved organic carbon. PAHs have natural sources such as plants waxes or can be generated during wildfires. However, PAHs are abundant in fuel and are a common signature of combustion byproducts from

Final Draft Bight’08 ASBS Workplan
7
vehicular traffic. Most pesticides are synthetic chemicals and by definition are man-made. However, the ubiquity of many persistent organic pesticides has led to their worldwide distribution including such remote areas as the Antarctic. We will measure these compounds to observe their distribution in ASBS. Toxicity serves a dual function. First toxicity is a tool to check for unmeasured constituents that could result in marine life impacts. Second, toxicity serves as a negative control reinforcing our selection of reference locations. B. Biological Monitoring Biological parameters are critical in the evaluation of natural water quality because marine life is the primary beneficial use being protected by state regulations. However, biological monitoring is expensive to collect and difficult to interpret. Therefore, the Bight’08 ASBS regional monitoring study is coordinating its efforts with existing large-scale monitoring programs; the Multi-Agency Rocky Intertidal network (MARINe) and the Bight’08 rocky reef regional monitoring program for subtidal habitats (B’08 Rocky). The following specific approaches are separated by habitat in order to delineate the interactions among these programs.
1. Rocky Intertidal MARINe is a partnership of local, State, and Federal agencies, universities and private organizations that monitor 98 rocky intertidal sites along the coast of California, Channel Islands, and Oregon on a long-term basis. It represents the largest program of its kind on the west coast of the United States. Sites have been monitored consistently for periods up to 26 years, with 60 sites monitored for > 10 years. MARINe and Bight’08 ASBS investigators worked together to identify what sampling design specifics would be needed to integrate the two programs. The needs fell into two categories; sampling protocol and site selection. MARINe uses two different monitoring protocols; core monitoring and biodiversity monitoring. The Bight’08 ASBS Planning Committee has selected the biodiversity protocol for use during this survey. The biodiversity protocol is designed to be intensive and reef specific, utilizing a series of permanent transects running perpendicular to the shore. The biodiversity protocol has been used to map rocky intertidal habitats and derive comprehensive, field-identifiable species diversity and abundance data. These data are extremely useful for comparing species diversity and abundances across sites, detecting and assessing spatial changes in zonation and community composition as well as key species populations, and to perform robust analyses that can be extrapolated to the site-level. This data collection is mostly conducted by a MARINe partner, the Partnership for Interdisciplinary Study of Coastal Oceans (PISCO). Existing sites are sampled by a team of experienced biologists based at UC Santa Cruz. Sampling for
Final Draft Bight’08 ASBS Workplan
8
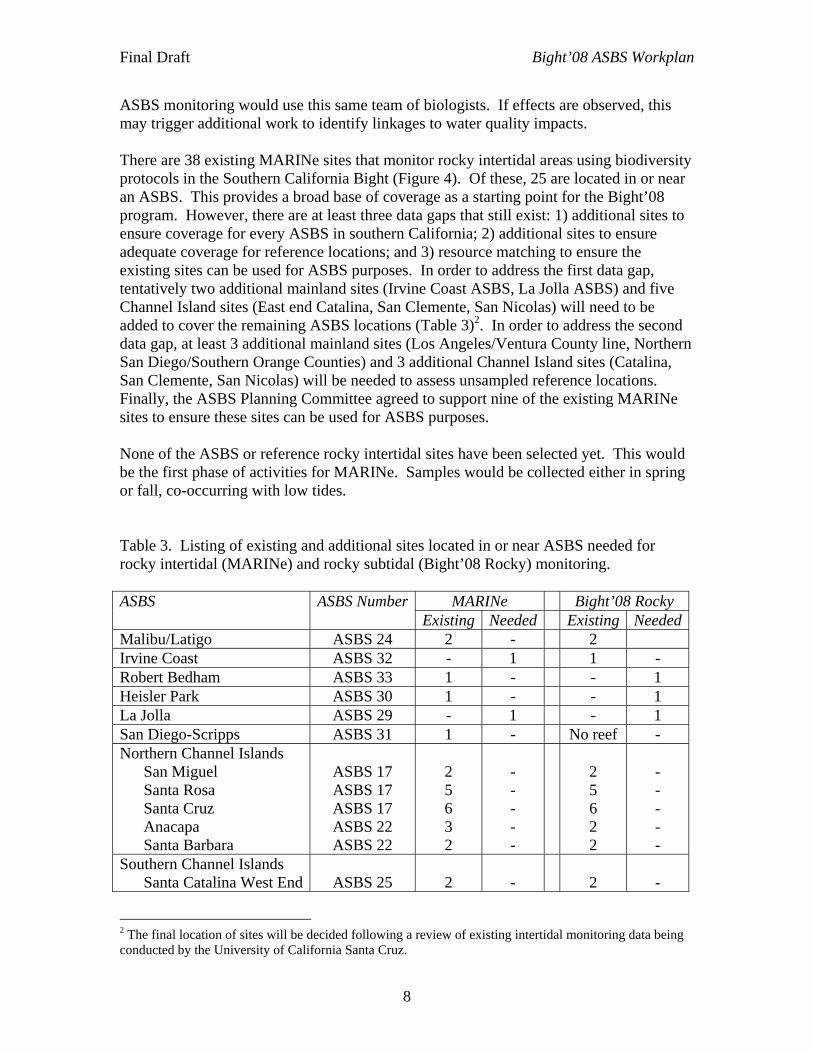
ASBS monitoring would use this same team of biologists. If effects are observed, this may trigger additional work to identify linkages to water quality impacts. There are 38 existing MARINe sites that monitor rocky intertidal areas using biodiversity protocols in the Southern California Bight (Figure 4). Of these, 25 are located in or near an ASBS. This provides a broad base of coverage as a starting point for the Bight’08 program. However, there are at least three data gaps that still exist: 1) additional sites to ensure coverage for every ASBS in southern California; 2) additional sites to ensure adequate coverage for reference locations; and 3) resource matching to ensure the existing sites can be used for ASBS purposes. In order to address the first data gap, tentatively two additional mainland sites (Irvine Coast ASBS, La Jolla ASBS) and five Channel Island sites (East end Catalina, San Clemente, San Nicolas) will need to be added to cover the remaining ASBS locations (Table 3)2. In order to address the second data gap, at least 3 additional mainland sites (Los Angeles/Ventura County line, Northern San Diego/Southern Orange Counties) and 3 additional Channel Island sites (Catalina, San Clemente, San Nicolas) will be needed to assess unsampled reference locations. Finally, the ASBS Planning Committee agreed to support nine of the existing MARINe sites to ensure these sites can be used for ASBS purposes. None of the ASBS or reference rocky intertidal sites have been selected yet. This would be the first phase of activities for MARINe. Samples would be collected either in spring or fall, co-occurring with low tides. Table 3. Listing of existing and additional sites located in or near ASBS needed for rocky intertidal (MARINe) and rocky subtidal (Bight’08 Rocky) monitoring.
MARINe Bight’08 Rocky ASBS ASBS NumberExisting Needed Existing Needed
Malibu/Latigo ASBS 24 2 - 2 Irvine Coast ASBS 32 - 1 1 - Robert Bedham ASBS 33 1 - - 1 Heisler Park ASBS 30 1 - - 1 La Jolla ASBS 29 - 1 - 1 San Diego-Scripps ASBS 31 1 - No reef - Northern Channel Islands
San Miguel Santa Rosa Santa Cruz Anacapa Santa Barbara
ASBS 17 ASBS 17 ASBS 17 ASBS 22 ASBS 22
2 5 6 3 2
- - - - -
2 5 6 2 2
- - - - -
Southern Channel Islands Santa Catalina West End
ASBS 25
2
-
2
-
2 The final location of sites will be decided following a review of existing intertidal monitoring data being conducted by the University of California Santa Cruz.

Final Draft Bight’08 ASBS Workplan
9
Santa Catalina East End San Clemente San Nicholas
ASBS 26 ASBS 23 ASBS 21
- - -
1 2 2
- - -
1 2 2
TOTAL 25 7 22 8

Final Draft Bight’08 ASBS Workplan
10
Figure 4. Map of existing sampling sites: A) MARINe biodiversity; and B) Bight’08 Rocky.
A
B
Final Draft Bight’08 ASBS Workplan
11
2. Rocky Subtidal
The southern California Bight 2008 Regional Monitoring Program for subtidal rocky reefs (B’08 Rocky) consists of 24 university, local, state, and federal agency programs located between Santa Barbara and San Diego. This cooperative research program currently monitors approximately 150 sites annually in the Southern California Bight using similar protocols established by the Cooperative Research Assessment of Nearshore Ecosystems (CRANE), a Department of Fish and Game program conducted in 2003-2004. B’08 Rocky constitutes the reorganization of CRANE and is focused on integrating with SCCWRP’s bight wide assessment and continuing the long-term cooperative monitoring and research of rocky reefs in California. The B’08 Rocky regional monitoring program is focused on assessing the status of biological communities associated with rocky subtidal reefs located between 1 and 30 m (3 and 90 feet) depth. High and low relief substrates, nearshore and offshore reefs, as well as areas of persistent kelp are all included in this regional monitoring program. For the B’08 Rocky program to assess the spatial distribution among reefs, a probabilistic sampling design is used that consists of 60 sites stratified by mainland vs. islands and warm temperature vs. cold temperature marine habitats. The sampling methodology utilizes a modified PISCO/CRANE style biodiversity protocol that is conducted using trained scuba divers. The protocols include transects and unified point contact grids to quantify invertebrate, algal and vertebrate species assemblages. B’08 Rocky and Bight’08 ASBS investigators worked together to identify what sampling design specifics would be needed to integrate the two programs. Since the Bight’08 Rocky program is already a portion of the Bight Regional Survey, the primary data gap was site selection. Other important design specifics, such as sampling methods, have already been developed for the survey. While 60 sites are targeted for the Bight’08 Rocky program, many have yet to be sampled (Table 3). In fact, approximately 40 sites are currently being sampled (Figure 4). Of these, 22 are located in or near an ASBS. This provides a broad base of coverage as a starting point for the Bight’08 ASBS program. Like the rocky intertidal program, there are at least three data gaps that still exist: 1) additional sites to ensure coverage for every ASBS in southern California; 2) additional sites to ensure adequate coverage for reference locations; and 3) resource matching to ensure the existing sites can be used for ASBS purposes. In order to address the first data gap, at least three additional mainland sites (Robert Bedham ASBS, Heisler Park ASBS, La Jolla ASBS) and five Channel Island sites (East end Catalina, San Clemente, San Nicolas) will need to be added to cover the remaining ASBS locations (Table 3). In order to address the second data gap, at least 2 additional mainland sites (Santa Barbara/Ventura Counties, Northern San Diego/Southern Orange Counties) and 3 additional Channel Island sites (Catalina, San Clemente, San Nicolas) will be needed to assess unsampled reference locations. Finally, the ASBS Planning Committee agreed to support nine of the existing Bight’08 Rocky sites to ensure these sites can be used for ASBS purposes.

Final Draft Bight’08 ASBS Workplan
12
IV. TIMELINE This project will take at least 24 months to complete (Table 4). The first task is planning, which includes milestones such as training, site reconnaissance, and this workplan. The second task is subtidal biological sampling. The Bight’08 Rocky subtidal sampling window extends from July to Dec 2008, so subtidal sampling should occur during the 3rd and 4th quarters of 2008. The third task is intertidal biological sampling. The MARINe sampling window is during the spring or fall when tides are lowest. Therefore, sampling will occur during the 2nd and 3rd quarters of 2009. The third task is water chemistry sampling. The sampling window for chemistry sampling will occur during the 4th and 1st quarter 2008-09 since it is focused on wet weather. Laboratory analysis of the chemistry sampling will occur immediately following the wet season during the 2nd quarter of 2009. Reporting will take nearly a full year and be completed by the end of the 2nd quarter 2010. Reporting will include a final assessment report as well as a compiled database with metadata. Table 4. Timeline for project activities.
2008 2009 2010 Task 3rd Q 4th Q 1st Q 2nd Q 3rd Q 4th Q 1st Q 2nd Q
Planning Subtidal Biology Sampling Intertidal Biology Sampling Chemistry Sampling Lab Analysis Reporting V. REFERENCES SWRCB. 2005. California Ocean Plan. State Water Resources Control Board. Sacramento, CA. 45 pp SCCWRP. 2003. Final Report: Discharges into State Water Quality Protection Areas. Prepared for State Water Resources Control Board. Sacramento, CA. Contract 01-187-250. Southern California Coastal Water Research Project. Westminster, CA.

APPENDIX 1

Table A1. ASBS Biological Assessment Options Habitat Approach Measures Pros Cons Estimated
Cost Comments Intertidal Rocky Reef
Various techniques:
quadrat and/or transect counts
of species to determine
diversity and abundance.
Community condition focused on benthic
invertebrates and algae.
Creates site-specific baseline data and allows comparison
over a wide geographic area to other program datasets (e.g.
MARINe/PISCO).
Field protocol / species identification training may be
required.
High amount of natural variation in rocky intertidal areas, potentially making data difficult to interpret.
$3,000-7,000
per site
Additional species and/or sample techniques may be used to detect a variety of anthropogenic impacts to
sites (i.e. trampling from public use).
Replicate sample sites may be distributed within ASBS to assess
impacts from discharges or other site-specific sources.
Subtidal Rocky Reef
Coordinate with Bight ’08 Rocky
Reef Group.
Community condition of benthic invertebrates,
algae and fish.
Receiving water for discharges to ASBS.
Allows assessment of full ASBS
community
Relevant to MPAs.
Field sampling requires specialized
training/equipment.
High amount of natural variation in subtidal habitats,
potentially making data difficult to interpret.
Being developed by Rocky
Reef Group.
Being developed by Rocky Reef Group.
Intertidal and
Subtidal Soft
Bottom
Replicate sediment core samples along
transects.
Community condition for macrofaunal
composition >0.5mm.
EPA support for analysis techniques of benthic
macroinvertebrate data in freshwater and coral reef systems. EPA-defined
processes may be applied to temperate marine systems.
Additional samples may be collected and archived with
minimal effort
Widespread historical datasets not readily available.
Laboratory sample
processing effort can be somewhat significant.
$2,000-3,000 per site- field sampling
$1,000-2,000 per
replicate- laboratory processing
A variety of data analysis techniques can be applied (species
presence/absence, diversity indices, length and weight measurements, and
biotic indices based on pollution tolerance).
Replicate sample sites may be
distributed within ASBS to assess impacts from discharges or other site-
specific sources. Subtidal (<5m) Sandy
Substrate
Bongo nets and seines
Community condition for fish and plankton (zooplankton and ichthyo-plankton).
Samples can be archived with relatively minimal effort.
Comparative data is readily
available from previous studies within the region.
Hard to interpret, since fish and plankton communities
are transient.
Potential avoidance issues by highly mobile species.
$3,000-5,000
per site- field
sampling
$2,000-4,000 per
site- laboratory processing
A variety of data analysis techniques can be applied (species presence/
absence, diversity indices, length and weight measurements).
Replicate sample sites may be
distributed within ASBS to assess impacts from discharges or other site-
specific sources.

Habitat Approach Measures Pros Cons Estimated Cost Comments
Subtidal (>5m) Sandy
Substrate
Possible coordination with Coastal
Ecology Group.
Community condition of benthic infauna and
fishes.
Creates site-specific baseline data and allows comparison
over a wide geographic area to other program datasets.
Sampling protocol for Coastal Ecology Group is not
currently targeted for ASBS.
$5,000-6,000 per
site
A variety of data analysis techniques can be applied (species presence/
absence, diversity indices, length and weight measurements, and biotic
indices based on pollution tolerance). Intertidal and/or
Subtidal
Bioaccumulation Water quality trends. Creates site-specific baseline data and allows comparison
over a wide geographic area to other datasets (NOAA Mussel
Watch).
Sand crab data is difficult to interpret due to patchy
distribution of organisms and gravid conditions.
$6,000-8,000 per
site- mussels
Mussel work being conducted separately by SCCWRP/NOAA.
Replicate sample sites may be
distributed within ASBS to assess impacts from discharges or other site-
specific sources.

APPENDIX 2

Sample Site Assignments
Site Name ASBS Number Latitude Longitude Mainland
or Island
Reference or
Discharge
No. Storm samples
(preStorm)
Responsible Agency
Sampling Team Chemistry Toxicity
Arroyo Sequit 24 34.04558 118.93336 M R 3 (3) LACDPW Mactec CRG Nautilus
Nicholas Canyon 24 34.02310 118.54557 M R 3 (3) City Malibu ABC CRG ABC
Broad Beach 24 34.02002 118.51028 M D 3 (3) City Malibu ABC CRG ABC Westward
Beach 24 34.01065 118.81670 M D 3 (3) LACDPW Mactec CRG Nautilus
Buck Gully 32 33.58885 117.86750 M D 3 (3) City Newport Weston CRG Weston El Morro Canyon 33 33.56050 117.82194 M R 3 (3) City Newport Weston CRG Weston
Heisler Pk 33 33.54227 117.78919 M D 3 (3) City Laguna CRG Nautilus San Onofre
Creek - 33.38056 117.57722 M R 3 (1) City San Diego Weston CRG Weston
Avenida De La Playa 29 32.85465 117.25895 M D 3 (1) City San Diego Weston CRG Weston
SIO Headwall 31 32.85000 117.25750 M D 3 (1) Weston CRG Weston
2nd Orange County TBD TBD M R 3 (3) San Diego/SIO? CRG
Two Harbors 26 33.44489 118.49325 I D 3 (3) USC Wrigley CRG Nautilus Catalina
Express Pier (TH1-SW)
25 33.44194 118.49821 I D 3 (3) SCICo Wrigley CRG Nautilus
Goat Harbor at Catalina
Island - 33.41667 118.39583 I R 3 (3) USC/SCICo/ConPacific Wrigley CRG Nautilus
Italian Gardens at Catalina Island
- 33.41011 118.38176 I R 3 (3) USC/SCIC/ConPacific Wrigley CRG Nautilus

Site Name ASBS Number Latitude Longitude Mainland
or Island
Reference or
Discharge
No. Storm samples
(preStorm)
Responsible Agency
Sampling Team Chemistry Toxicity
Connolly Pacific 28 33.32665 118.30458 I D 3 (3) ConPacific Wrigley CRG Nautilus
North end of San Nicolas
Island 21 33.26648 119.49822 I R 3 (3) US Navy Mactec CRG Nautilus
San Nicholas Island
(Reverse Osmosis)
21 33.24659 119.44876 I D 3 (3) US Navy Mactec CRG Nautilus
San Nicholas Island (Barge
Landing)
21 33.21948 119.44761 I D 3 (3) US Navy Mactec CRG Nautilus
San Clemente
Island (Outfall 21)
23 33.00540 118.55844 I D 3 (3) US Navy ABC CRG Nautilus
San Clemente
Island (Outfall 27)
23 33.00483 118.55641 I D 3 (3) US Navy ABC CRG Nautilus
San Clemente
Island 23 32.97722 118.53404 I R 3 (3) US Navy ABC CRG ABC

APPENDIX B
Sampling SOP
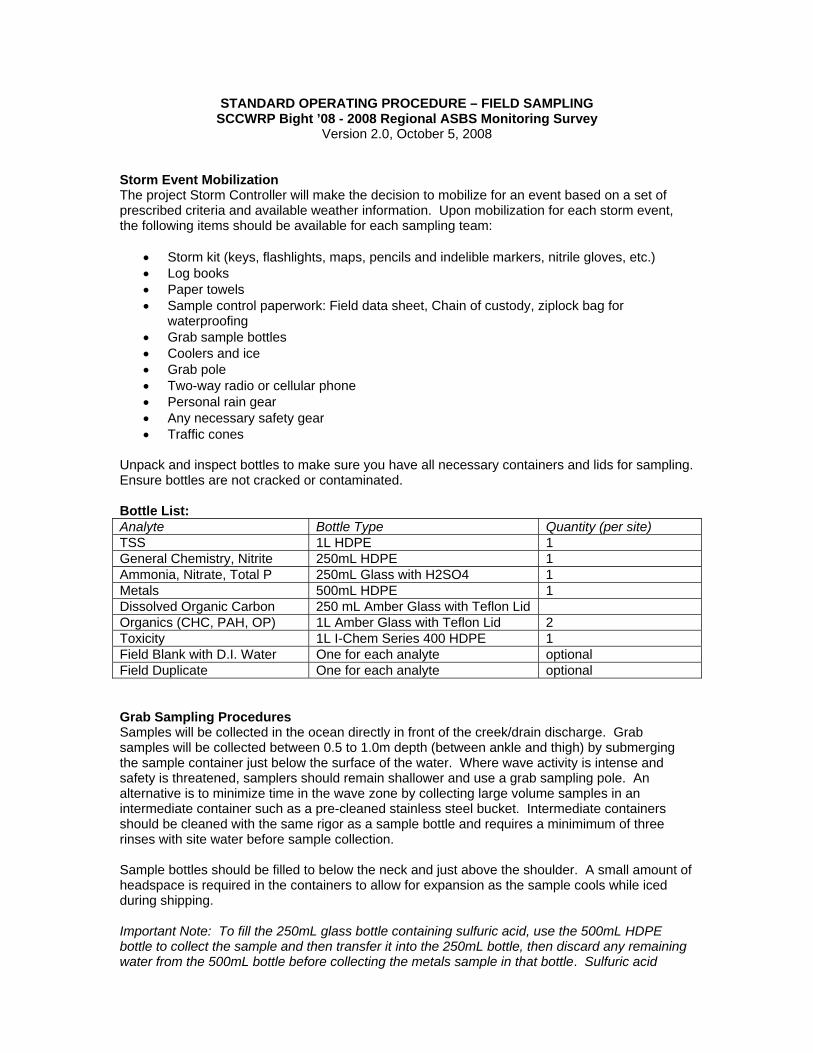
STANDARD OPERATING PROCEDURE – FIELD SAMPLING SCCWRP Bight ’08 - 2008 Regional ASBS Monitoring Survey
Version 2.0, October 5, 2008 Storm Event Mobilization The project Storm Controller will make the decision to mobilize for an event based on a set of prescribed criteria and available weather information. Upon mobilization for each storm event, the following items should be available for each sampling team:
• Storm kit (keys, flashlights, maps, pencils and indelible markers, nitrile gloves, etc.) • Log books • Paper towels • Sample control paperwork: Field data sheet, Chain of custody, ziplock bag for
waterproofing • Grab sample bottles • Coolers and ice • Grab pole • Two-way radio or cellular phone • Personal rain gear • Any necessary safety gear • Traffic cones
Unpack and inspect bottles to make sure you have all necessary containers and lids for sampling. Ensure bottles are not cracked or contaminated. Bottle List: Analyte Bottle Type Quantity (per site) TSS 1L HDPE 1 General Chemistry, Nitrite 250mL HDPE 1 Ammonia, Nitrate, Total P 250mL Glass with H2SO4 1 Metals 500mL HDPE 1 Dissolved Organic Carbon 250 mL Amber Glass with Teflon Lid Organics (CHC, PAH, OP) 1L Amber Glass with Teflon Lid 2 Toxicity 1L I-Chem Series 400 HDPE 1 Field Blank with D.I. Water One for each analyte optional Field Duplicate One for each analyte optional Grab Sampling Procedures Samples will be collected in the ocean directly in front of the creek/drain discharge. Grab samples will be collected between 0.5 to 1.0m depth (between ankle and thigh) by submerging the sample container just below the surface of the water. Where wave activity is intense and safety is threatened, samplers should remain shallower and use a grab sampling pole. An alternative is to minimize time in the wave zone by collecting large volume samples in an intermediate container such as a pre-cleaned stainless steel bucket. Intermediate containers should be cleaned with the same rigor as a sample bottle and requires a minimimum of three rinses with site water before sample collection. Sample bottles should be filled to below the neck and just above the shoulder. A small amount of headspace is required in the containers to allow for expansion as the sample cools while iced during shipping. Important Note: To fill the 250mL glass bottle containing sulfuric acid, use the 500mL HDPE bottle to collect the sample and then transfer it into the 250mL bottle, then discard any remaining water from the 500mL bottle before collecting the metals sample in that bottle. Sulfuric acid

preservative is a concentrated acid, so care must be taken to ensure that the preservative does not come into contact with the skin. Powder-free nitrile gloves must be worn when handling sample containers. To ensure that grab samples are representative of the storm water discharged, the following procedures will be followed:
• Vehicle engines will be turned OFF to minimize exposure of samples to exhaust fumes. • Sample containers will be labeled prior to the sampling event. • Samples will be promptly put into a cooler with ice. • Samples should be collected if the discharge flow is reaching the receiving water. • Sampling will not stir up sediments at the bottom of a channel. • The inside of the sampling container will not be touched. • Uncharacteristic floating debris will not be collected. • Safety precautions will be taken.
Sample Tracking and Handling Each sample will receive a unique alphanumeric code (sample I.D. number) for tracking. This code will be standard for all samples and contain information as to the station, sample interval number, and sequential monitoring event number. Samples will be kept properly chilled and transferred to the analytical laboratory within holding times to achieve the highest quality data possible. To ensure proper tracking and handling of the samples, documentation will accompany the samples from the initial pickup to the final extractions and analysis. This documentation will be in the form of Chain-of-Custody Forms (see attached). These forms, or equivalent, will be used to track and handle samples. All samples collected will be labeled with the following information:
• Project name. • Date. • Time. • Sampling location name and number • Preservative • Collector’s initials • Sample I.D. number • Analyte(s) to be analyzed
A limited number of field duplicates may be obtained along with additional basic laboratory QA/QC procedures Health and Safety Sampling can introduce many potentially dangerous situations. It is imperative that field crews remain alert and aware of the environmental conditions surrounding them at all times. Safety takes top priority while performing any field sampling. Carefully review the following basic list of potentially hazardous conditions and always keep them in mind while performing the tasks at hand:
• Roadways can become very dangerous during rain events. Generally, the roadways are the most slippery during the first few hours of a rain event as all the oils which have accumulated during the antecedent dry period are brought to the surface. Also, be aware of any ponded water on roadways as hydroplaning can occur.
• Be aware of errant vehicles. Just as the roadways pose a danger to you, they pose the same danger to other drivers. Remain aware of the vehicles around you and general traffic.
• Never enter a flowing waterway, conveyance or receiving water during storm water sampling. The depth and speed of waterways can be deceptive, particularly at night. It does not require very much flow to cause people to lose balance and be swept away.

During storm water discharge there is typically a high amount of debris that can also cause you to lose balance in otherwise manageable waters.
• Use extra caution during night-time conditions. All potential hazards associated with storm water sampling are heightened during dark conditions.
These are just some basic, common hazards encountered during storm water sampling and are not intended to be a complete list for any and all sites or conditions. Please refer to your municipal or corporate Health and Safety Plan for a thorough discussion of potential hazards while storm water sampling.

CHAIN OF CUSTODY
Client: Ken Schiff Southern California Coastal Water Research Project 3535 Harbor Blvd, Suite 110, Costa Mesa, CA 92626 714.755.3200 Project: Bight’08 ASBS Sample ID Date Time # of
bottlesMatrix Container Temp <4°C
(Y/N)Analysis
Relinquished Received Agency: ____ _____ Date / Time: Agency: __________________________ Name: ____________________________ Name: ___________________________
Signature: ___________ Signature: ________________________ Agency: __________________________ Date / Time: Agency: __________________________ Name: ___________________________ Name: ___________________________ Signature: ________________________ ___________ Signature: ________________________ Agency: __________________________ Date / Time: Agency: __________________________ Name: ___________________________ Name: ___________________________ Signature: _________________________ ___________ Signature: ________________________ Comments _____________________________________________________________________ _____________________________________________________________________ _____________________________________________________________________ _____________________________________________________________________


APPENDIX C
Chemistry Laboratory SOP

Laboratory Operating Procedure Method 625, Revision D Page 1 of 18
CRG MARINE LABORATORIES 2020 Del Amo Blvd., Suite 200, Torrance, CA 90501 (310) 533-5190
SEPARATORY FUNNEL LIQUID-LIQUID EXTRACTION AND ANALYSIS BY GAS
CHROMATOGRAPHY/MASS SPECTROMETRY
Approved by: ________________ Richard Gossett, Laboratory Manager Date

Laboratory Operating Procedure Method 625, Revision D Page 2 of 18
METHOD 625: SEPARATORY FUNNEL LIQUID-LIQUID EXTRACTION AND ANALYSIS BY GAS CHROMATOGRAPHY/MASS SPECTROMETRY REFERENCES: U.S. EPA 40CFR Part 136 1.0 SCOPE AND APPLICATION 1.1 This method covers the extraction and concentration procedures
required for the determination of chlorinated pesticides and PCBs and semi-volatile base/neutral and acid-extractable compounds in Laboratory Operating Procedure Methods (LOPM) 625. It is applicable to liquid samples.
1.2 The glassware cleaning procedure for extraction glassware is listed
in this method. Table 1. Target Compound List
COMPOUND RETENTION TIME
DB-5 COLUMN
METHOD DETECTION
LIMIT (µg/kg)
D5-Phenol (Recovery Surrogate)
8.00 *
Naphthalene-d8 (Recovery Surrogate)
13.34 *
2-Fluorophenol (Recovery Surrogate)
15.00 *
Acenaphthene-d10 (Recovery Surrogate)
21.49 *
2,4,5,6-Tetrachloro-m-xylene (Recovery Surrogate)
26.45 *
2,4,6-Tribromophenol (Recovery Surrogate)
27.17 *
PCB030 (Recovery Surrogate)
31.66 *
Phenanthrene-d10 (Recovery Surrogate)
32.29 *
Anthracene-d10 (Internal Standard)
32.84 *
PCB112 (Recovery Surrogate)
46.29 *
2,2’-5,5’-Tetrabromobiphenyl (Internal Standard)
52.07 *

Laboratory Operating Procedure Method 625, Revision D Page 3 of 18
Chrysene-d12 (Recovery Surrogate)
56.25 *
PCB198 (Recovery Surrogate)
60.57 *
Perylene-d12 (Recovery Surrogate)
68.49 *
Phenol 8.21 100 2-Chlorophenol 10.56 50 Aniline 11.37 100 2,4-Dimethylphenol 11.11 100 bis(2-Chloroethoxy) methane 11.44 50 1,3-Dichlorobenzene 11.98 10 1,4-Dichlorobenzene 12.13 10 1,2-Dichlorobenzene 12.39 10 Benzyl Alcohol 12.23 100 2-Nitrophenol 12.41 100 bis(2-Chloroisopropyl) ethane 12.61 50 2,4-Dichlorophenol 12.83 50 N-nitrosodi-n-propylamine 12.95 50 N-nitrosodimethylamine 12.97 50 Hexachloroethane 13.15 50 Nitrobenzene 13.32 50 Naphthalene 13.39 1.0 Isophorone 13.99 50 Dichlorvos 14.52 10 bis(2-Chloroethyl) ether 14.59 50 1,2,4-Trichlorobenzene 14.81 10 Benzidine 15.31 50 4-Chloro-3-methylphenol 15.59 100 4-Chloroaniline 15.74 50 2-Methylnaphthalene 15.98 1.0 Hexachlorobutadiene 16.24 50 1-Methylnaphthalene 16.39 1.0 2,4,6-Trichlorophenol 17.42 50 Benzoic Acid 17.70 100 Biphenyl 18.30 1.0 2,6-Dimethylnaphthalene 19.05 1.0 Mevinphos 19.55 10 Hexachlorocyclopentadiene 19.83 50 Acenaphthylene 20.47 1.0 Dimethyl Phthalate 20.56 5 Acenaphthene 21.74 1.0 4-Nitroaniline 21.82 50

Laboratory Operating Procedure Method 625, Revision D Page 4 of 18
2,4-Dinitrophenol 22.27 100 4-Nitrophenol 23.30 100 2,3,5-Trimethylnaphthalene 24.42 1.0 3-Nitroaniline 24.57 50 Fluorene 25.18 1.0 Diethyl Phthalate 25.45 5 2,6-Dinitrotoluene 25.89 50 2-Methyl-4,6-dinitrophenol 26.04 100 Dibenzofuran 26.12 50 Demeton 26.21 10 2,4-Dinitrotoluene 26.55 10 Ethoprop 26.83 10 4-Chlorophenyl phenyl ether 28.97 50 2-Nitroaniline 29.13 50 Phorate 29.17 10 N-nitrosodiphenylamine 30.04 50 Azobenzene 30.21 50 Dimethoate 30.60 5 Pentachlorophenol 31.70 50 Phenanthrene 32.67 1.0 4-Bromophenyl phenyl ether 32.96 50 Anthracene 32.96 1.0 alpha-BHC 33.26 1.0 Diazinon 33.48 5 Disulfoton 33.65 10 Hexachlorobenzene 33.90 1.0 beta-BHC 35.29 1.0 gamma-BHC 35.79 1.0 Methyl Parathion 36.69 10 delta-BHC 37.56 1.0 Fenchlorophos 37.91 10 1-Methylphenanthrene 38.01 1.0 Dibutyl Phthalate 39.46 5 Malathion 39.91 5 Fenthion 40.38 10 Chlorpyrifos 40.53 5 Heptachlor 41.36 1.0 Trichloronate 41.44 10 Fluoranthene 42.98 1.0 Aldrin 43.99 1.0 Pyrene 44.85 1.0 Tetrachlorvinphos 45.61 10 Tokuthion 46.91 10 Heptachlor Epoxide 47.00 1.0
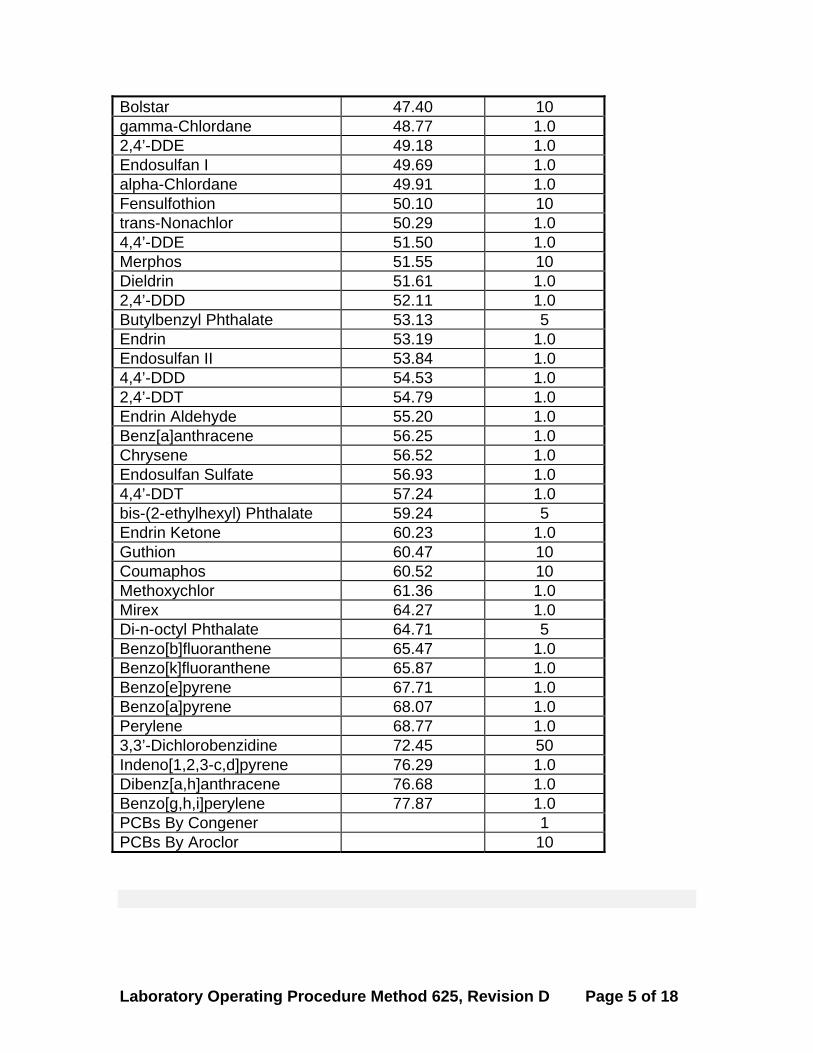
Laboratory Operating Procedure Method 625, Revision D Page 5 of 18
Bolstar 47.40 10 gamma-Chlordane 48.77 1.0 2,4’-DDE 49.18 1.0 Endosulfan I 49.69 1.0 alpha-Chlordane 49.91 1.0 Fensulfothion 50.10 10 trans-Nonachlor 50.29 1.0 4,4’-DDE 51.50 1.0 Merphos 51.55 10 Dieldrin 51.61 1.0 2,4’-DDD 52.11 1.0 Butylbenzyl Phthalate 53.13 5 Endrin 53.19 1.0 Endosulfan II 53.84 1.0 4,4’-DDD 54.53 1.0 2,4’-DDT 54.79 1.0 Endrin Aldehyde 55.20 1.0 Benz[a]anthracene 56.25 1.0 Chrysene 56.52 1.0 Endosulfan Sulfate 56.93 1.0 4,4’-DDT 57.24 1.0 bis-(2-ethylhexyl) Phthalate 59.24 5 Endrin Ketone 60.23 1.0 Guthion 60.47 10 Coumaphos 60.52 10 Methoxychlor 61.36 1.0 Mirex 64.27 1.0 Di-n-octyl Phthalate 64.71 5 Benzo[b]fluoranthene 65.47 1.0 Benzo[k]fluoranthene 65.87 1.0 Benzo[e]pyrene 67.71 1.0 Benzo[a]pyrene 68.07 1.0 Perylene 68.77 1.0 3,3’-Dichlorobenzidine 72.45 50 Indeno[1,2,3-c,d]pyrene 76.29 1.0 Dibenz[a,h]anthracene 76.68 1.0 Benzo[g,h,i]perylene 77.87 1.0 PCBs By Congener 1 PCBs By Aroclor 10

Laboratory Operating Procedure Method 625, Revision D Page 6 of 18
2.0 SUMMARY OF METHOD A measured volume of sample, usually 2 liters, is serially extracted with
methylene chloride at pH >11 and again at pH <2 using a separatory funnel. The methylene chloride extract is concentrated in preparation for instrumental analysis. Samples are to be stored at 4 °C, extracted within 7 days of collection, and analyzed within 40 days of extraction.
A 1-3 µL sample is injected into a gas chromatograph (GC) equipped with a mass selective detector. The GC is temperature programmed to separate the compounds and confirmation is achieved for the single component peaks using ions specific to each target compound. Compounds eluting from the GC are identified by matching the retention times of the unknown peaks with those from a known calibration standard and the concentration of each identified component is measured by comparison of the responses.
3.0 PREVENTION OF INTERFERENCES
3.1 Solvents, glassware, and other processing apparatus are to be free
of any interferences. A procedural blank is be analyzed with each sample batch to demonstrate the absence of any method interferences.
3.2 High purity solvents are to be used to minimize interferences.
3.3 Phthalate esters and PCBs are contaminants found in many types of
products commonly used in the laboratory. Care should be taken to avoid or eliminate the use of plastic products during sample processing and handling.
3.4 Impurities in the carrier and makeup gases may be avoided by using
Ultra-High purity gases and/or gas purifying cartridges. See the instrument manufacturer for guidelines.
3.5 Contamination by carryover may occur whenever high level and low-
level samples are sequentially analyzed. To reduce carryover, the syringe used for sample injection shall be rinsed a minimum of 5 times between samples using n-hexane. Whenever possible, samples shall be analyzed from low to high concentrations.
3.6 A procedural blank shall be analyzed with each batch of 20 or less
samples to check for contamination during sample processing. 4.0 SAFETY

Laboratory Operating Procedure Method 625, Revision D Page 7 of 18
4.1 It is mandatory to wear a laboratory coat, closed-toe shoes and safety glasses in the laboratory. Gloves are to be worn when working with samples.
4.2 All glassware cleaning and extraction procedures involving any
solvent exposure shall take place in a fume hood. Use of a respirator and appropriate safety gloves are recommended for working with solvents.
4.3 Material Safety Data Sheets (MSDS) are on file in the laboratory and
are available to all personnel involved in the use of hazardous materials during any procedure.
4.4 Extreme caution and the proper use of safety equipment are required
during the handling of any hazardous material. If the analyst has any questions regarding safety, he or she should contact a supervisor or the laboratory director prior to the start of this procedure.
5.0 APPARATUS AND MATERIALS
5.1 Glassware
A. Separatory funnel: 2 L, with Teflon stopcock
B. Round-bottom flasks: 250 mL C. Pear-shaped flasks: 25 mL D. Graduated cylinder: 100 mL
E. Erlenmeyer flask: 1 L F. Glass filter funnel
G. Pasteur pipettes H. Gastight volumetric syringes: 100, 500 μL I. Autosampler vials with Teflon-lined screw caps: 2 mL
5.2 Glass wool 5.3 pH indicator paper: pH 0-6 5.4 Graduated cylinder: 2 L

Laboratory Operating Procedure Method 625, Revision D Page 8 of 18
5.5 Heavy duty aluminum foil
5.6 Roto-evaporator system with aspirator pump and water bath set at 30 ± 5 °C
5.7 Chiller unit set at 10 ± 5 °C or cool tap water 5.8 High-temperature oven set at 1000 ± 50 °F 5.9 Non-ionic detergent
5.10 Hewlett Packard 6890 GC equipped with a Mass Selective Detector, an HP7673 Low-volume Autosampler and an on-column injector
5.11 J&W Scientific XLB Column (or equivalent), 30 meters in length, 0.25
µm film thickness, and 0.25 mm I.D 5.12 10 µL syringe for the HP7673 Autosampler 5.13 Ultra-high purity helium 5.14 Fused Silica Retention Gap, 5 meters in length, 0.53 mm I.D.
6.0 REAGENTS
6.1 Deionized water
6.2 Pesticide grade hexane and methylene chloride
6.3 Method 625 spike solutions prepared from stock solutions obtained
from an accredited supplier. The solution used is dependent on the clients target analyte list.
Chlorinated Pesticides PCB Congeners Base/Neutral Extractables Acid Extractables
6.4 Anhydrous granular sodium sulfate 6.5 Concentrated sulfuric acid
6.6 Stock solutions. All stock solutions are purchased from NIST traceable commercial suppliers. Store at or below 4 °C and protect

Laboratory Operating Procedure Method 625, Revision D Page 9 of 18
from light. Stock standards shall be replaced after one year or sooner if comparison with check standards indicates a problem.
6.7 Calibration Standards. Prepare a minimum of five concentration
levels for each parameter of interest. One of the concentration levels shall be near the method detection limit. The remaining concentration levels shall bracket the expected concentrations found in the samples. Calibration solutions shall be replaced after 6 months or sooner if a problem is indicated.
6.8 Internal Standards. Select one or more internal standards that are
similar in analytical behavior to the compounds of interest. The analyst shall demonstrate that the selected compound(s) is not affected by the method or matrix interference.
6.8.1 Just prior to analysis, add a known constant amount of
internal standard to all calibration solutions, blanks, and samples. 6.9 Recovery Surrogates. Select one or more internal standards that are
similar in analytical behavior to the compounds of interest. 6.9.1 Prior to the extraction of the samples, add a known amount
of recovery surrogate to all blanks and samples. See Methods 3510 and 3545 for additional information about this procedure.
6.10 Sodium Hydroxide
7.0 CALIBRATION AND MAINTENANCE
7.1 Shimadzu QP2010 or HP5972 GC/MS 7.1.1 GC Oven Operating Conditions: Initial Oven Temperature = 45 °C Initial Hold = 5 min Ramp 1 = 2.5 °C/min to 285 °C Hold Time = 15 min 7.1.2 Injector Operating Conditions: Injector = Splitless or On-Column Mode = Track Oven Temperature (On-Column Only) Nominal Initial Pressure = 35.0 psi (on) 7.1.3 Column Operating Conditions: Max Temp = 325 °C Mode = Constant Flow

Laboratory Operating Procedure Method 625, Revision D Page 10 of 18
Initial Flow = 1.5 mL/min Average Carrier Velocity = 40 cm/sec Carrier Gas = Helium 7.1.4 Detector Operating Conditions: Transfer Line Temperature = 285 °C Ionization Voltage = 70 ev Gain = +100 to +300 volts over standard sensitivity target
tune 7.1.5 Autosampler Operating Conditions (Back Injector): Sample Washes = 2 Sample Pumps = 2 Injection Volume = 2.0 µL Syringe Size = 10 µL Post Injection Washes Solvent A = 3 Post Injection Washes Solvent B = 3 Plunger Speed = Fast 7.1.6 System Maintenance Prior to each set of samples, remove ca. 30 cm of the
retention gap or column, replace injector septum if needed, and refill the solvent wash bottles.
Replace the gas cartridges every 6 months. Replace the GC columns as needed. Enter all maintenance actions into the instrument
maintenance logbook. 8.0 QUALITY CONTROL
8.1 With each batch of samples (maximum 20 samples per batch), a
procedural blank is extracted and analyzed to demonstrate that procedural interferences are under control. Deionized water is used as the blank matrix.
8.2 With each batch of samples, a duplicate sample and/or matrix
spike/matrix spike duplicate (MS/MSD) set of samples is analyzed with the appropriate extraction procedure to measure the precision of the extraction procedure. A non-spiked sample of an MS/MSD set is analyzed to determine background concentrations for each parameter of interest. The MS/MSD samples are spiked with specific

Laboratory Operating Procedure Method 625, Revision D Page 11 of 18
parameters at a concentration greater than ten times the method detection limit and analyzed to determine the percent recovery of the spiked compounds. For concentrations at ten times the method detection limit, a precision factor between the duplicate samples or MS/MSD samples is calculated and compared to the corresponding QC acceptance criteria.
8.3 Every sample, spike set, and blank is spiked with an appropriate
surrogate spike solution consisting of 1 to 6 surrogate compounds. The surrogate spike is used to demonstrate the efficiency of the extraction and analytical procedure by allowing calculation of the percent recovery of each surrogate compound.
Control charts and control limits are generated by measuring the
mean and standard deviation of the surrogate percent recovery for the previous 20 samples. Upper and lower warning limits are calculated at two times the standard deviation from the mean. Upper and lower control limits are calculated at three times the standard deviation from the mean. Surrogate control limits and results are presented with the analytical results. When surrogate results indicate atypical method performance, a quality control check sample is analyzed and an evaluation of the procedure and instrumentation is made.
8.4 If any individual parameter falls outside of the designated range for
percent recovery, that parameter has failed the acceptance criteria. An evaluation of the method procedure and instrumentation shall be made to uncover evidence of any atypical performance. If there is atypical performance of the method procedure and/or instrumentation, the problem shall be immediately identified and corrected prior to the analysis of any further samples. A re-spike and/or quality control check sample shall be analyzed and evaluated. If possible, all samples from the suspect batch shall be re-analyzed under corrected method conditions. If samples can not be re-analyzed, the analytical results for the non-spiked samples are suspect and shall be reported with the result flagged and followed by an explanation of the problem.
8.5 QA/QC records are maintained to document the quality of data
generated. If any constituent falls outside the designated range, that compound has failed the acceptance criteria. Failure to meet the stated requirement shall require that corrective action be taken to eliminate the problem prior to the analysis of any samples. Samples from the batch being analyzed at the time the failure is detected shall be reanalyzed after the corrective action has been taken. A batch is defined as 20 or less samples. If any sample cannot be reanalyzed,

Laboratory Operating Procedure Method 625, Revision D Page 12 of 18
the result for that element shall be flagged and a detailed report is included with the result.
8.5.1 Initial Calibration Check- Prior to analyzing any samples,
using a second-source calibration standard an initial calibration of the instrument is performed with each batch of samples. This calibration shall be within 15% of the initial calibration curve.
8.5.2 Calibration Check- Using a second-source calibration
standard, a calibration check will be performed every 12 hours and at the end of every batch of samples. The calibration check shall be within 15% of the initial calibration curve.
8.5.3 Matrix Spikes- Matrix spike and matrix spike duplicates as
well as duplicate samples shall be analyzed with each batch of samples to determine the precision for each compound. A control chart is generated to document the precision. Control limits are established by using the mean and standard deviation from 20 results. Upper and lower warning limits are two times the standard deviation and upper and lower “out of control” limits are three times the standard deviation for those compounds that are greater than 10 times the method detection limit.
8.5.4 CRM/LCM- Certified reference materials and/or lab control
materials shall be analyzed with each batch of samples. The reported value shall be within the limits set forth by the agency providing the material.
8.5.5 Blanks- Lab reagent blanks shall be analyzed with each
batch of samples. No compound shall be detected at greater than 3 times the method detection limit.
8.5.6 QCS- A method standard is extracted along with each batch
of samples. Prepare the QC check standard to 1L of reagent water.
8.5.6 Internal Standards- Internal standards shall be added in
known amounts to blanks, calibration standards, continuing calibration check solutions, and samples to compensate for instrumental drift.
8.5.7 Recovery Surrogates- Recovery surrogates shall be added
in known amounts to all blanks and samples to indicate

Laboratory Operating Procedure Method 625, Revision D Page 13 of 18
sample processing efficiency. Sample results shall not be adjusted for surrogate recovery efficiency unless specifically requested by the client.
8.5.8 Daily GCMS Performance Test- At the beginning of each
batch of samples, the GCMS system must be checked to see of acceptable performance criteria are achieved for DFTPP. The criteria are presented in the following table.
Mass m/z Abundance Criteria
51 30-60 percent of Mass 198 68 < 2 percent of Mass 69 70 < 2 percent of Mass 69
127 40-60 percent of Mass 198 197 < 1 percent of Mass 198 198 Base peak, 100 percent relative
abundance 199 5-9 percent of Mass 198 275 10-30 percent of Mass 198 365 > 1 percent of Mass 198 441 Present but < Mass 443 442 > 40 percent of Mass 198 443 17-23 percent of Mass 442
9.0 SAMPLE COLLECTION, PRESERVATION, AND HANDLING
9.1 All samples are collected in amber glass jars with Teflon-lined screw
caps. All samples are kept at 4 ± 2 °C from the time of collection until extraction.
9.2 If Residual Chlorine is present, add 80mg of sodium thiosulfate per
liter of sample and mix well. Please refer to the SOP for Residual Chlorine determination.
10.0 PROCEDURE
10.1 Glassware cleaning procedure: High-temperature oven option Wash glassware with non-ionic detergent and water. Rinse
glassware thoroughly with tap water, then rinse once with deionized water. Place glassware in high temperature oven and bake at a minimum of 1000 ± 50 °F for 2 hours according to the following conditions:
Set initial temperature ramp to 536°C over 1 hours then hold
for 3 hours. Once the oven program shuts off, the oven begins

Laboratory Operating Procedure Method 625, Revision D Page 14 of 18
to cool back down to 30 ºF. Consecutive oven runs can be done once the oven has cooled to less than 150 °F.
CAUTION: Do not open oven door or turn off blower until
over temperature is below 570 °F. Once the glassware has cooled, cover all exposed areas that
will touch the sample with aluminum foil or place it upside down onto foil until use.
10.2 Glassware cleaning procedure: Solvent rinse option
Wash glassware with non-ionic detergent and water. Rinse glassware thoroughly with tap water, then rinse once with deionized water. Let dry, then use Teflon squeeze bottles to rinse three times with methylene chloride and three times with hexane.
10.3 Sodium sulfate cleaning procedure
Clean sodium sulfate either by heating in the high-temperature oven using the same program as the glassware cleaning procedure or by rinsing with several mLs of methylene chloride.
10.4 Glass wool cleaning procedure
Clean glass wool either by heating in the high-temperature oven using the same program as the glassware cleaning procedure or by rinsing with several mLs of methylene chloride.
10.5 Sample extraction
10.5.1 Remove sample from the refrigerator and bring to room temperature.
10.5.2 Decant some of the sample into the sink, if necessary, to
allow for the addition of solvent. 10.5.3 Use a gas-tight volumetric syringe to pipette the appropriate
QC surrogates into the sample. The surrogate solution(s) should be at room temperature prior to use. Record the sample ID, name and volume of surrogate used, standard solutions logbook page number containing details of solution preparation, and analyst initials in the laboratory notebook.

Laboratory Operating Procedure Method 625, Revision D Page 15 of 18
10.5.4 For matrix spike/matrix spike duplicate samples, use a gas-
tight volumetric syringe to pipette the appropriate QA/QC spikes into the sample. The spike solution(s) should be at room temperature prior to use. Record the sample ID, name and volume of spike used, standard solutions logbook page number containing details of solution preparation, and analyst initials in the laboratory notebook.
10.5.5 Adjust the pH to >11 using NaOH solution. Then use the
100 mL graduated cylinder to measure 100mL of methylene chloride and add it directly to the sample bottle. Recap the bottle tightly and shake it continuously and vigorously for at least 2 minutes.
10.5.6 Allow the sample bottle to sit untouched for 5 minutes so that
the organic solvent and aqueous layers can separate. 10.5.7 Decant approximately half of the sample into the 2 L
Erlenmeyer flask and the remainder, including the solvent layer, into the separatory funnel. Allow the organic and aqueous layers in the separatory funnel to separate for 5 minutes.
10.5.8 Prepare the collection flask as follows:
Place a small amount of glass wool into the bottom of a glass filter funnel, then add approximately 50 g of anhydrous sodium sulfate. Place the funnel into the neck of a 250 mL round bottom flask.
10.5.9 Filter the solvent extract through the sodium sulfate and
collect it in the 250 mL round bottom flask. 10.5.10 Add 75 mL methylene chloride to the empty sample bottle
and swirl it around thoroughly to wash down the walls of the bottle. Pour the sample portions from the Erlenmeyer flask and the separatory funnel back into the sample bottle and repeat the shaking step in 10.4.5. Allow for layer separation, decant, and collect the extract in the same 250 mL flask.
10.5.11 For samples being analyzed only for Base/Nuetral
compounds only, the third extraction is identical to the second. For samples being analyzed for acid extractable compounds, adjust the sample pH to less than 2 by adding a small amount of concentrated sulfuric acid prior to the

Laboratory Operating Procedure Method 625, Revision D Page 16 of 18
shaking step of the third extraction. The third extraction is otherwise identical to the second.
10.5.12 After the third extraction is complete, measure the total
volume of the sample using the 2 L graduated cylinder and record it in the laboratory notebook.
10.6 Sample concentration
10.6.1 Prepare the roto-evaporator for use according to the following parameters:
water bath temperature at 30 ± 5 °C chiller temperature at 10 ± 5 °C or cool tap water
10.6.2 Attach the 250 mL round bottom flask to the distillation trap
and secure it with a plastic spring clip. 10.6.3 Close the stopcock and lower the flask into the water bath.
Turn on the roto-evaporator motor and adjust the rotation to a medium speed. Adjust the vacuum so that no solvent flashes up into the distillation trap.
10.6.4 Concentrate the sample to approximately 10 mL. Break the
internal vacuum by opening the stopcock. Stop the motor, raise the arm, and remove the flask from the trap.
10.6.5 Use a Pasteur pipette to transfer the sample to a 25 mL
pear-shaped flask. Rinse the 250 mL flask three times with approximately 1 mL methylene chloride and transfer each rinse to the 25 mL flask.
10.6.6 Attach the 25 mL pear-shaped flask to the distillation trap
using the adaptor and concentrate the sample to approximately 500 μL. Take care not to let the sample go to dryness.
10.6.7 Transfer the sample to an autosampler vial using a Pasteur
pipette. Rinse the 25 mL flask three times with approximately 250 μL methylene chloride, transfering each rinse to the autosampler vial.
10.6.8 The sample extract is now ready for instrumental analysis.
10.7 Using the Hewlett Packard data system, load the appropriate method
for the parameters of choice.
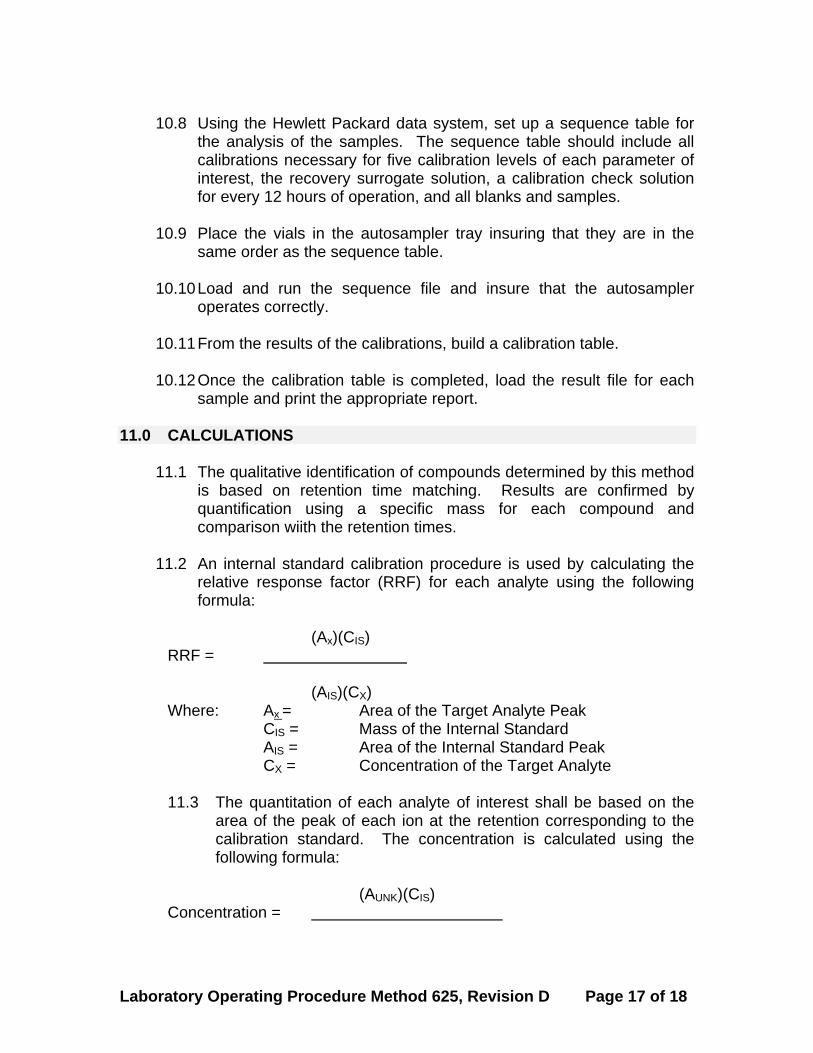
Laboratory Operating Procedure Method 625, Revision D Page 17 of 18
10.8 Using the Hewlett Packard data system, set up a sequence table for
the analysis of the samples. The sequence table should include all calibrations necessary for five calibration levels of each parameter of interest, the recovery surrogate solution, a calibration check solution for every 12 hours of operation, and all blanks and samples.
10.9 Place the vials in the autosampler tray insuring that they are in the
same order as the sequence table. 10.10 Load and run the sequence file and insure that the autosampler
operates correctly. 10.11 From the results of the calibrations, build a calibration table. 10.12 Once the calibration table is completed, load the result file for each
sample and print the appropriate report. 11.0 CALCULATIONS
11.1 The qualitative identification of compounds determined by this method
is based on retention time matching. Results are confirmed by quantification using a specific mass for each compound and comparison wiith the retention times.
11.2 An internal standard calibration procedure is used by calculating the
relative response factor (RRF) for each analyte using the following formula:
(Ax)(CIS) RRF = (AIS)(CX) Where: Ax = Area of the Target Analyte Peak CIS = Mass of the Internal Standard AIS = Area of the Internal Standard Peak CX = Concentration of the Target Analyte 11.3 The quantitation of each analyte of interest shall be based on the
area of the peak of each ion at the retention corresponding to the calibration standard. The concentration is calculated using the following formula:
(AUNK)(CIS) Concentration =

Laboratory Operating Procedure Method 625, Revision D Page 18 of 18
(AIS)(RRFTA)(SW) Where: AUNK = Peak area of the sample CIS = Mass of the Internal Standard AIS = Area of the Internal Standard Peak RRFTA = Relative Response Factor for the Target
Analyte SW = Weight of sample extracted
11.4 The Method Detection Limit (MDL) is defined as the minimum concentration of a compound that can be measured and reported with 99% confidence that the value is greater than zero. The MDLs listed in Table 1 were determined using a clean marine sediment sample following US EPA guidelines in 40CFR.
CRG MARINE LABORATORIES 2020 Del Amo Blvd., Suite 200, Torrance, CA 90501-1206, (310)533-5190
EXTRACTION AND QUANTIFICATION OF TRACE METALS IN SEAWATER USING INDUCTIVELY COUPLED PLASMA MASS SPECTROMETRY
Approved by: ______________________________________ 2 Richard Gossett Date Laboratory Manager
2 Laboratory Operating Manual Procedure Method 1640 Page 1 of 20

METHOD 1640: EXTRACTION OF TRACE METALS IN SEAWATER AND SEDIMENT
REFERENCES: Battelle Pacific Northwest Laboratories, Marine Sciences
Laboratory. Standard Operating Procedure MSL-M-034-01. APDC Extraction of Metals in Seawater.
Bloom, N.S. and Crecelius, B.A. 1984. Determination of Silver in
Seawater by Coprecipitation with Cobalt Pyrrolidine Dithiocarbamate and Zeeman Graphite-Furnace Atomic Absorption Spectrometry, Analytica Chimica Acta, 156, pp.139-145.
Danielsson, L., Magnusson, B., and Westerlund, S. 1978. An
Improved Metal Extraction Procedure for the Determination of Trace Metals in Sea Water by Atomic Absorption Spectrometry with Electrothermal Atomization, Analytica Chimica Acta, 98, pp. 47-57.
Jan, T.K. and Young, D.R. 1978. Determination of Microgram
Amounts of Some Transition Metals In Seawater by Methyl Isobutyl Ketone-Nitric Acid Successive Extraction and Flameless Atomic Absorption Spectrophotometry. Analytical Chemistry, 50, No. 9, pp. 1250-1253.
U.S. Environmental Protection Agency, Office of Water Engineering
and Analysis Division (4303): Method 1640.
EPA Methods for Chemical Analysis of Water and Wastes, Method 200.8, Revision 5.4 (May, 1994); NOAA Sampling and Analytical Methods of the National Status and Trends Program, Volume III, (1993)
1.0 SCOPE AND APPLICATION 1.1 This method provides procedures for the extraction and preconcentration
of dissolved and particulate elements from aqueous samples using chelation and precipitation for subsequent analysis by inductively coupled plasma mass spectrometry (ICP-MS). It includes stringent quality control (QC) and sample handling guidelines necessary to avoid contamination and ensure the validity of analytical results 3
3 Laboratory Operating Manual Procedure Method 1640 Page 2 of 20

during sampling and analysis. The method contains QC procedures that will ensure that any possible contamination will be detected when blanks accompanying samples are analyzed.4
Table 1. ANALYTE SYMBOL AMU CASRN
Aluminum (Al) 27 7429-90-5 Antimony (Sb) 123 7440-36-0 Arsenic (As) 75 7440-38-2 Beryllium (Be) 9 744-38-2 Cadmium (Cd) 111 7440-43-9 Chromium-total (Cr) 52 7440-47-3 Cobalt (Co) 59 7440-48-4 Copper (Cu) 63 7440-50-8 Iron (Fe) 56 or 57 7439-89-6 Lead (Pb) 206, 207, or 208 7439-92-1 Manganese (Mn) 55 7439-96-5 Mercury (Hg) 202 7439-97-6 Molybdenum (Mo) 98 7439-98-7 Nickel (Ni) 60 7440-02-0 Selenium (Se) 82 7782-49-2 Silver (Ag) 107 7440-22-4 Thallium (Tl) 205 7440-28-0 Tin (Sn) 118 7440-31-5 Titanium (Ti) 48 Vanadium (V) 51 7440-62-2 Zinc (Zn) 66 7440-66-6
Table 1. Target analytes in seawater samples extracted from both the APDC and iron-palladium procedures. The CASRN is the Chemical Abstract Services Registry Number.
Table 2.
PARAMETER
METHOD DETECTION LIMIT (ug/L)
ACCEPTANCE RANGE (%)
REPORTING LIMIT (ug/L)
Aluminum (Al) 0.01 52-149 0.025 Antimony (Sb) 0.01 44-97 0.025 Arsenic (As) 0.01 71-112 0.025 Barium (Ba) 0.5 70-130 1
4Laboratory Operating Manual Procedure Method 1640 Page 3 of 20

Beryllium (Be) 0.005 62-113 0.01 Boron (B) 0.5 70-130 1 Cadmium (Cd) 0.005 69-100 0.01 Calcium (Ca) 0.5 70-130 2 Chromium (Cr) 0.005 85-133 0.01 Cobalt (Co) 0.005 75-124 0.01 Copper (Cu) 0.005 72-108 0.01 Iodine (I) 0.5 70-130 1 Iron (Fe) 0.01 35-97 0.025 Lead (Pb) 0.005 56-116 0.01 Lithium (Li) 0.01 70-130 Magnesium (Mg) 5 70-130 10 Manganese (Mn) 0.005 64-120 0.01 Mercury (Hg) 0.005 68-117 0.01 Molybdenum (Mo) 0.005 59-125 0.01 Nickel (Ni) 0.005 68-118 0.01 Potassium (K) 5 70-130 10 Selenium (Se) 0.01 55-110 0.025 Silver (Ag) 0.005 66-125 0.01 Sodium (Na) 5 70-130 10 Strontium (Sr) 0.01 70-130 0.025 Thallium (Tl) 0.005 66-92 0.01 Tin (Sn) 0.005 68-110 0.01 Titanium (Ti) 0.005 95-143 0.01 Vanadium (V) 0.005 95-140 0.01 Zinc (Zn) 0.005 62-108 0.01
Table 2. The Approximate detection limits, acceptance range, and reporting limits for the target analytes in aqueous samples. 2.0 SUMMARY OF METHODS
2.1 An aliquot of a well-mixed, homogeneous sample is accurately measured for sample processing. Target metals are chelated out of the aqueous sample using ammonium pyrrolidine dithiocarbamate (APDC). The chelated precipitate is filtered onto a membrane filter and then digested in a nitric acid solution.5
2.2 An aliquot of a well-mixed, homogeneous seawater sample is accurately
measured for sample processing. Target metals are co-precipitated out of the sample using borohydride Iron-Palladium reductive precipitation. The
5 Laboratory Operating Manual Procedure Method 1640 Page 4 of 20

precipitate is centrifuged out of the seawater matrix. The metal-containing pellet is then digested with nitric acid.
2.3 An aliquot of sample is diluted from 10-100 times before it is acidified
using HNO3 until the pH is <2. The diluted, acidified sample must sit for a minimum of 16 hours before it can be analyzed.
2.4 The sample is then analyzed using Inductively Coupled Plasma Mass
Spectrometry (ICPMS) by pumping the sample through a nebulizer producing a fine spray. An argon carrier gas atomizes the sample which is ionized and detected with a mass spectrometer. Qualitative identification is based on the mass to charge ratio for each element. It is recommended that samples be analyzed within 1 day of digestion.
3.0 PREVENTION OF INTERFERENCE
3.1 Samples may be contaminated by numerous routes. Contamination by trace
metals can occur due to the use of metallic or metal-containing labware (e.g., talc gloves which contain high levels of zinc), containers, sampling equipment, reagents, and reagent water during sampling. Contamination also results from improperly cleaned and stored equipment, labware, and reagents, as well as from atmospheric inputs such as dirt and dust.
3.2 The avoidance of contamination can be achieved by carrying out the
following procedures:
3.2.1 Clean sample containers, nucleopore filters, and filtration apparatus with acid and rinse with Milli-Q water. Upon cleaning, store the labware in clean zip-type bags and place them in a plastic box.
3.2.2 Keep samples and glassware covered when possible.
3.2.3 Ensure all materials that come into contact with the sample are
nonmetallic. Only the following materials should come into contact with samples: fluoropolymer (FEP, PTFE), conventional or linear polyethylene, polycarbonate, polypropylene, polysulfone, or ultrapure quartz. All materials that will directly or indirectly contact the sample must be cleaned or must be known to be clean and metal free before proceeding.6
3.2.4 Minimize exposure of sample to an uncontrolled atmosphere.
3.3 ICPMS Interferences
6 Laboratory Operating Manual Procedure Method 1640 Page 5 of 20

3.3.1 Chemical interferences are characterized by molecular compound formation, ionization effects and solute vaporization effects. These effects are not usually pronounced with the ICPMS technique due to the high temperature of the torch.
3.3.2 Isobaric interferences are caused by isotopes of different elements
which form singly or doubly charged ions of the same nominal mass-to-charge ratio and which cannot be resolved by the mass spectrometer. All elements determined by this method have one isotope free of isobaric elemental interference except Selenium-82, which has isobaric interference from the Krypton impurities in the Argon gas supply. This interference can be minimized by using high purity argon. All data must be corrected by measuring the signal from another isotope of the interfering element and subtracting the appropriate signal ratio from the isotope of interest.
3.3.3 Wing overlap interferences may occur when a small ion peak is
being measured adjacent to a large one. The potential for these interferences should be recognized and the spectrometer resolution adjusted to minimize them.
3.3.4 Polyatomic interferences are caused by ions consisting of more
than one atom which have the same nominal mass-to-charge ratio as the isotope of interest, and which cannot be resolved by the mass spectrometer. The ions may be formed in the plasma or interface system from support gases or sample components. Most of the common interferences have been identified and are listed within the instrument data system along with the elements affected. All data shall be corrected by measuring the signal from another isotope of the interfering element and subtracting the appropriate signal ratio from the isotope of interest. Equations for the correction of the data are presented below in Table 3.7
Table 3.
ELEMENT MASS EQUATION Vanadium 51 (51)*1 - (53)*3.127 + (52)*0.353 Arsenic 75 (75)*1 - (77)*3.132 + (82)*2.736 - (83)*2.761 Selenium 82 (82)*1 - (83)*1.0087 Molybdenum 98 (98)*1 - (99)*.0146 Cadmium 111 (111)*1 - (108)*1.073 + (106)*0.764
3.3.5 Physical interferences are effects associated with the sample
nebulization and transport processes. Properties such as the change in viscosity and surface tension can cause significant
7 Laboratory Operating Manual Procedure Method 1640 Page 6 of 20
inaccuracies, especially in samples that may contain high dissolved solids and/or acid concentrations. These interferences are greatly reduced in this procedure by the use of mass flow controllers for the control of the argon flow rate, the use of a peristaltic pump for sample introduction, and the use of internal standards.
4.0 SAFETY
4.1 It is mandatory to wear a laboratory coat, closed-toe shoes, and safety glasses in the Laboratory. Gloves shall be worn while working with samples and acids.
4.2 All steps involving the use of concentrated acids shall be performed in a
fume hood.
4.3 Material Safety Data Sheets (MSDS) are on file and available at all times to personnel using hazardous materials. It is the responsibility of everyone using these materials to be familiar with the potential hazards to the chemicals in their work area. If the analyst is uncertain of the potential hazards of specific chemicals, contact a supervisor prior to using these chemicals.
4.4 Extreme caution, awareness and knowledge of the location and safe use
of fire extinguishers, eye wash fountains, and safety showers are required.
4.5 Personnel performing this procedure shall be instructed in the safe use of acids, the requirements for protective equipment, and acid spill cleanup procedures.8
5.0 APPARATUS AND MATERIALS
5.1 APDC procedure
5.1.1 250 ml polyethylene screw cap extraction bottles (Nalgene)
5.1.2 Teflon forceps
5.1.3 Polycarbonate filters; 47 mm, 0.45 μm pore size (Nucleopore)
5.1.4 15 ml polyethylene screw cap centrifuge tubes
5.1.5 Sonicator with heated water bath maintained at 65 ± 2 oC
5.2 Iron-palladium procedure
8 Laboratory Operating Manual Procedure Method 1640 Page 7 of 20

5.2.1 50 ml polycarbonate tapered centrifuge tubes with caps. 5.2.2 Centrifuge system
5.2.3 Sonicator with heated water bath maintained at 65 ± 2 oC
6.0 REAGENTS
6.1 APDC
6.1.1 Cobalt nitrate stock solution, 2000 mg/L- Dissolve 2.0 g cobalt metal (Fisher Scientific, certified) in 950 ml of Milli-Q water and 50 ml HNO3 (Optima)
6.1.2 Cobalt nitrate, 200 mg/L – Dilute 10 ml stock solution (6.1) to 100
ml with Milli-Q water.
6.1.3 Ammonium Pyrrolidine Dithiocarbamate (APDC), 2% solution (Fisher Scientific)- Dissolve 2.0 g APDC in 100 ml Milli-Q water. Store solution at 4 oC; but use at room temperature.
6.1.4 Nitric acid 10%, ultrapure (Optima, Fisher Scientific)- Mix 10
ml HNO3 into 90 ml Milli-Q water.
6.1.5 Milli-Q water9
6.2 Iron-palladium
6.2.1 Nitric acid 20%, ultrapure (Optima, Fisher Scientific)- Mix 20 ml HNO3 into 80 ml Milli-Q water.
6.2.2 Pure iron and palladium solution made 1:1, 1000 μg/ml (SPEX).
6.2.3 Ammonium hydroxide, concentrated, ultrapure (Optima, Fisher
Scientific).
6.2.4 Sodium borohydride, 5% (Fisher Scientific)- Dissolve 0.5 g sodium borohydride in 10 ml Milli-Q water. A fresh solution is made on day of extraction.
6.2.5 Ammonium Pyrrolidine Dithiocarbamate (APDC), 2% (Fisher Scientific)- Dissolve 2.0 g APDC in 100 ml Milli-Q water. Store solution at 4 oC; but use at room temperature.
9 Laboratory Operating Manual Procedure Method 1640 Page 8 of 20

6.2.6 Milli- Q water
6.3 Reagent water-Water that is free from the metal(s) that would potentially interfere at the MDL for the metals listed in Tables 1 and 2. The water is prepared by distillation, deionization, reverse osmosis, anodic/cathodic stripping voltammetry, or other techniques that remove the metals and potential interferants.
6.4 Standard Stock Solutions- purchased from a reputable commercial source
(Claritas ppt, SPEX CertiPrep Inc; Plasma Cal, SPC Science). 7.0 CALIBRATION AND MAINTENANCE OF THE ICPMS
7.1 Trace metal concentrations are determined by comparing the response
of a known standard obtained from a certified source traceable to NIST.
7.2 An initial calibration curve is performed on the instrument covering the
expected range of concentrations in the samples before each batch of samples is run and every 12 hours during sample analyses.10
7.2.1 Two different commercially available standard solutions are run at
three or more concentrations. The calibration standards are diluted to the appropriate levels of the operating range using reagent water containing 1% (v/v) nitric acid.
7.2.2 The standard solutions are prepared the day the samples are run.
All calibration solutions are spiked with 1 ml of internal standard solution containing 1000ng/ml of Rhodium and Thulium.
7.3 The response factor is computed as follows:
RF= As x Cis Ais x Cs
As: height or area of the response at the m/z for the analyte Cis: concentration of the internal standard in the solution Ais: height or area of the m/z for the internal standard Cs: concentration of the analyte in the standard or blank solution 7.3.1 Compute the mean RF for each analyte using the individual
response factors at each concentration.
7.3.2 If the RF value range is constant (<20%), the RF value is assumed
10 Laboratory Operating Manual Procedure Method 1640 Page 9 of 20

to be invariant and thus used for calculations. If the range varies significantly, the results can be used to plot a calibration curve of response ratios, As/Ais vs. RF.
7.4 Calibration Verification- Initial calibration verification is performed immediately following calibration. The ICPMS is adjusted until verification criteria are met. After the criteria are met, the blanks and samples may be analyzed.
7.5.1 A second-source calibration standard at a mid-level concentration is
analyzed before running the samples and then again every 20 samples.
7.5.2 Using the mean RF value, the percent recovery of each metal is
obtained using the calibration curve in the initial calibration.11
7.5.3 Compare the recovery of each metal with the corresponding limit for the calibration verification in Table 4. The response for the initial calibration can be used for the blanks and the samples if all of the metals meet the accepted criteria. If a value fails to meet the acceptance range, the system’s performance is unacceptable for that compound. The problem should be identified and amended, or a new calibration check standard should be prepared and the test repeated.
Table 4.
METAL CALIBRATION VERIFICATION
Arsenic 85-115 Cadmium 85-115 Copper 85-115 Lead 85-115 Nickel 85-115 Silver 85-115 Zinc 85-115
Table 4. Quality control acceptance criteria for performance tests for freshwater and effluent samples in EPA method 1640. All specifications are represented as percents. The specifications for cadmium, copper, lead and nickel were calculated from validation conducted on ambient, freshwater samples.
7.5 Tuning solution- this solution is used for mass calibration and instrument
tuning before analysis. The solution is composed of the same stock
11 Laboratory Operating Manual Procedure Method 1640 Page 10 of 20

solutions that are used to obtain the calibration curve. Internal standards are not added to this solution.
7.6 Continuing calibration verification (CCV)- Aliquots of multi-element stock
standard is added to an aliquot of reagent water. The CCV is treated as a sample and digested as the other samples, when applicable. The internal standards are added to the CCV as well.
7.7 An instrument maintenance schedule is maintained for the Hewlett
Packard 4500 ICPMS. Dates and initials are recorded in a notebook located near the instrument.
7.7.1 The instrument is serviced by the manufacturer at least once per
year.
8.0 QUALITY CONTROL
8.1 QA/QC records are maintained to document the quality of data generated. If any element falls outside the designated range, that element has failed the acceptance criteria. Failure to meet the stated requirement shall require that corrective action be taken to eliminate the problem prior to the analysis of any samples. Samples from the batch being analyzed at the time the failure is detected shall be reanalyzed after the corrective action has been taken. A batch is defined as 20 or less samples. If any sample cannot be reanalyzed, the result for that element shall be flagged and a detailed report is included with the result.12
8.1.1 Lab Blanks- Two process blanks (reagent blanks), where Milli-Q
water is treated as a sample, are run with each batch of samples (15 or less samples). The process blanks are used to assess if there is any internal contamination in the instrument. No element shall be detected at greater than 3 times the method detection limit. A rinse blank is used to flush out the instrument between samples to avoid contamination between samples.
8.1.2 Field Blanks- At least one field blank consisting of distilled water in
a similar container as the sample container is transported to the sampling site. The blank is exposed to the environment while the actual samples are being collected.
8.1.3 Matrix Spikes- A matrix spike and matrix spike duplicate shall be
analyzed with each batch of samples to determine precision for each element. A control chart is generated to document the precision. The relative standard deviation for all elements
12 Laboratory Operating Manual Procedure Method 1640 Page 11 of 20

combined shall be within 15% and no single element shall be greater than 20% for those elements that are greater than 10 times the method detection limit.
8.1.4 Duplicate Samples- Each sample is extracted and analyzed in
duplicate. If the duplicates are not in agreement, then the sample is re-extracted and reanalyzed.
8.1.5 CRM/LCM- Certified reference materials and/or lab control
materials shall be analyzed with each batch of samples to evaluate accuracy for each element. The reported value shall be within 15% of the true value.
8.1.6 Initial Calibration Check- Prior to analyzing any samples, an initial
calibration of the instrument is performed with each batch of samples (15 or less). This calibration shall be within 15% of the initial calibration curve (see Section 7.2).
8.1.7 Internal Standards- Internal standards shall be added in known
amounts to blanks, calibration standards, continuing calibration verification solutions, and samples to compensate for instrumental drift. Elements that may be used are presented in Table 5. Relative response factors are used to correct responses of the target analytes.13
Table 5. Internal Standards
INTERNAL STANDARD MASS Scandium (Sc) 45
Yttrium (Y) 89 Rhodium (Rh) 103 Terbium (Tb) 159 Thulium (Tm) 169 Bismuth (Bi) 209
9.0 SAMPLE COLLECTION, PRESERVATION AND HANDLING
9.1 Sampling personnel are required to wear clean, nontalc gloves at all times when handling sampling equipment and sample containers. 9.2 Before samples are collected, all sampling equipment and sample
containers are cleaned by soaking in a 10% nitric acid solution for a minimum of 24 hours followed by five rinses with Milli-Q water. The bottles are capped and individually double-bagged and placed in a clean plastic box.
13 Laboratory Operating Manual Procedure Method 1640 Page 12 of 20
9.3 Sample bottles are opened only to collect the seawater sample and to add
acid preservative. Samples are preserved (at the sampling site or upon return to the lab) with 1 ml of Optima concentrated nitric acid per liter of sample that will bring the pH ≤ 2.
9.3.1 Samples must be acidified within 48 hours of sampling at 4 ± 2 oC
until acidified. 9.3.2 Once acidified, the samples must sit for at least 48 hours allowing
the acid to completely dissolve the metals absorbed on the walls of the container.
9.3.3 The sample must have a pH<2. If the pH of the samples is >2,
more acid will be added and they must sit for 16 hours. The pH must be verified to be <2 before analysis.
9.4 With each sample set, preserve a field blank, a method blank and a CCV
(continuing calibration check) in the same way as the sample(s).14 10.0 PROCEDURE
10.1 APDC METHOD
10.1.1 Before a sample can be processed, the sample pH should be verified/adjusted to pH ≤ 2. Do not measure the pH directly from the original sample; rather, pour a small aliquot of sample into a separate container to verify the pH.
10.1.2 Transfer a 200 ml aliquot from a well-mixed, acid preserved sample
to a pre-calibrated polyethylene bottle.
10.1.3 To the 200 ml sample add 1 ml of 200 mg/L cobalt nitrate solution. Cap the bottle and mix by shaking. Let the solution stand for 2 minutes.
10.1.4 Remove the cap, add 1 ml of 2% APDC and re-cap the bottle and shake gently for 1 minute. This mixture is set aside to react for a minimum of 30 minutes.
10.1.5 The mixture is filtered through an acid cleaned 0.45 μm Nucleopore
filter using an acid cleaned Millipore vacuum filtration system. The Nucleopore filter is handled with Teflon forceps.
14 Laboratory Operating Manual Procedure Method 1640 Page 13 of 20

10.1.6 The empty polyethylene bottle that once contained the sample is subsequently rinsed with 5 ml of Milli-Q water (acidified to pH 2.0 with Optima HNO3) and this is filtered through the Nucleopore filter. This is repeated 2 times. Finally, the Millipore vacuum filtration cup is rinsed with an adequate amount of acidified Milli-Q water to ensure any particles sticking to the sides are rinsed onto the filter. This final step also ensures that all seawater matrix has been rinsed through the filter.
10.1.7 The filter containing the filtrate is removed from the filtration
system and folded into quarters ensuring no contact is made with the filtrate. This is then inserted into a 15 ml acid cleaned centrifuge tube.
10.1.8 Add 2 ml of 10 % Optima nitric acid into the centrifuge tube
containing the filter using a clean pipette.15
10.1.9 The tube containing the filter is placed in a sonicator with a water bath maintained at 65 ± 2 oC and allowed to digest for 2 hours.
10.1.10 Dilute sample (with filter) by adding 8 ml Milli-Q water, re-cap and
allow to cool. The sample is now ready for analysis by ICP-MS. 10.1.11 The extracts can be stored at 4 ± 2 oC until analysis; however, they should be analyzed as soon as possible after the extraction. 10.1.12 Internal standards are added just prior to analysis by ICP-MS. 10.2 IRON-PALLADIUM METHOD
10.2.1 Before a sample can be processed, the sample pH should be verified/adjusted to pH ≤ 2. Do not measure the pH directly from the original sample; rather, pour a small aliquot of sample into a separate container and verify the pH.
10.2.2 Transfer a 50 ml aliquot from a well-mixed, acid preserved
sample to an acid cleaned 50 ml polycarbonate centrifuge tube.
10.2.3 10.2.4 To the 50 ml sample add 0.5 ml 1:1 1000 μg/ml of Fe/Pd solution
with a clean pipette.
10.2.5 Next, add 0.3 ml ammonium hydroxide to the sample and mix by shaking.
15 Laboratory Operating Manual Procedure Method 1640 Page 14 of 20
10.2.6 Then add 0.5 ml 5% NaBH4 solution, 0.25 ml 2% APDC solution
and mix by shaking. This sample is set aside to react for a minimum of 1 hour.
10.2.7 After a minimum of 1 hour, the sample is centrifuged at 2500 rpm
for 30 minutes. Upon completion, the seawater matrix is carefully decanted and discarded.
10.2.8 To the remaining pellet, add 1 ml 20% Optima nitric acid with a
clean pipette.
10.2.9 The centrifuge tube is placed in a sonicator with a water bath maintained at 65 ± 2 oC and allowed to digest for 2 hours or until all precipitate is dissolved.16
10.2.10 After the digestion is complete and the extract(s) have reached
room temperature, the sample(s) can be stored at 4 ± 2 oC until analysis by ICP-MS; however, they should be analyzed as soon as possible. Internal standards can be added just prior to analysis by ICP-MS.
10.3 Sample Analysis- Standards are prepared by serial dilutions before each
run on the ICPMS. The pipettes and autosampler tubes used for analysis and standards are calibrated before standards are run. Pipettes are calibrated by weighing 1.000 ml of DI water (=1.000 gram) and calibration marks on the autosampler tubes are checked.
10.3.1 Use volumetric flasks and calibrated pipettors to make calibration
standards by diluting 10 mL of a commercially prepared stock solution to 100 mL. The standard source laboratory and lot number of each of the standards used for each ICPMS run are recorded in the laboratory notebook.
10.3.2 Mix standards by inverting and shaking a minimum of 10 times. A
dilution stock of 2% HNO3 and 1% HCl is used for all dilutions. Prepare 5 concentrations of calibration standards ranging from the method detection limit to at or above the maximum expected concentration in the sample. The standards in the boxes below are used in the calibration curves(see diagrams on pages 16 and 17).
16 Laboratory Operating Manual Procedure Method 1640 Page 15 of 20

GENERAL CALIBRATION MIX (ng/ml) DILUTIONS FOR LOW CONCENTRATION SAMPLES
100,000 (or as provided by source laboratory) 10,000 1,000 500 100
50 10
5 2 1
GENERAL CALIBRATION MIX (ng/ml) DILUTIONS FOR HIGH CONCENTRATION SAMPLES
(continuation of calibration mix of low concentrations)17 100,000 (or as provided by source laboratory) 10,000 5,000 2,000 1,000
17 Laboratory Operating Manual Procedure Method 1640 Page 16 of 20
Element Composition of Low Mix:
Ag, Al, As, Ba, Be, Ca, Cd, Co, Cr, Cu, Fe, K, Mg, Mn, Mo, Na, Ni, Pb, Sb, Se, Sn, Sr, Ti, Tl, V,
Zn
10x
10x
10x 2x
2x 10x
2x 5x
10x
Element Composition of High Mix:
Al, Ba, Ca, Cr, Cu, Fe, K, Mg, Mn, Mo, Na, Ni, Pb, Sr, Ti, V, Zn
10x
2x 5x
10x

CALIBRATION DILUTION FOR MERCURY STANDARDS (ng/ml) 100,000 (or as provided by source laboratory) 1,000 100 10 5 2 1
10.3.3 Instrument parameters are stored in the computer program that
operates the ICPMS. These parameters are listed in Table 7.18
10.3.4 Table 7. Instrument Parameters
PARAMETER SETTING RF Power 1350 watts
Acquisition Mode Spectrum Analysis Detector Mode Auto
Acquisition Points/Mass 3 Acquisition Repetitions 3
Argon Flow Rate 16 L/min Nebulizer Concentric
Sample Uptake Rate 0.4 mL/min Sample Uptake Time 90 sec
Pump Stabilization Time 45 sec Rinse Time 15 sec
Carrier Gas Flow Rate 1.26 L/min Auxilliary Gas Flow Rate 1.0 L/min
Spray Chamber Temperature 2 °C Sample Depth 7.5 mm19
18 Laboratory Operating Manual Procedure Method 1640 Page 17 of 20
10x
10x
10x
2x 5x
10x

10.3.5 Fill the autosampler rinse container with deionized water.20 10.3.6 Empty the spray chamber drain bottle and fill to approximately 1/4
full with tap water. It is important that the drain line from the spray chamber be immersed in water to prevent fluctuations in the plasma.
10.3.7 Turn on the argon gas supply.
10.3.8 Ignite the plasma and allow a minimum of 30 minutes for
stabilization.
10.3.9 Check the system operating conditions by tuning the instrument according to the parameters listed in Table 8. If parameters do not fall within these limits, retune the instrument per manufacturer’s procedures. Once you are satisfied with the tune, save the parameters and print out a copy for the laboratory notebook.
Table 8 Optimal Tune Results
PARAMETER OPTIMAL RESULT Sensitivity for AMU 2 7,000 counts
Sensitivity for AMU 89 15,000 counts Sensitivity for AMU 205 10,000 counts
RSD for AMU 2, 89, & 205 < 5% Pulse to Analog Factors 100 ± 1
Doubly Charged Ions < 3% Oxides < 1%
Axis ± 0.05 AMU Peakwidth 0.65 - 0.75 AMU at 10%
10.3.10 Load the appropriate method file into the Chemstation data system.
Complete the sample sequence table with the specified sample information and dilution factors. Load the samples into the autosampler according to the order listed in the sequence file. Double check to make sure the standards, blanks, and samples are in the correct autosampler position assigned in the sequence file.
NOTE: The instrument may be set for automatic shutoff at the
end of the sequence by adding the following command in the last line of the sequence file:
Laboratory Operating Manual Procedure Method 1640 Page 18 of 20

TYPE = Keyword
KEYWORD = Command21 KEYWORD COMMAND = tune ”macro`shutdown.mac’,go” (this must be typed exactly as written here)
10.3.11 Start the analytical sequence and make sure that it is operating
properly. 11.0 CALCULATIONS 11.1 For water samples, concentration factors necessary for the subsequent
ICP-MS analyses are calculated by dividing the original seawater volume by the final digestate volume.22
23
21 22 Laboratory Operating Manual Procedure Method 1640 Page 19 of 20

CRG MARINE LABORATORIES 2020 Del Amo Blvd., Suite 200, Torrance, CA, 90501-1206, (310) 533-5190
EXTRACTION AND QUANTIFICATION OF TRACE METALS IN SEAWATER USING INDUCTIVELY COUPLED PLASMA MASS SPECTROMETRY24
Approved by: ________________________________________ ___________ Richard Gossett, Laboratory Manager Date ________________________________________ ___________ G. Patrick Hershelman, Senior Project Chemist Date
24 Laboratory Operating Manual Procedure Method 1640 Page 20 of 21
