assessing the barriers to equity in smart mobility systems
TRANSCRIPT

Portland State University Portland State University
PDXScholar PDXScholar
Urban Studies and Planning Faculty Publications and Presentations
Nohad A. Toulan School of Urban Studies and Planning
12-1-2019
Assessing the Barriers to Equity in Smart Mobility Assessing the Barriers to Equity in Smart Mobility
Systems: A Case Study of Portland, Oregon Systems: A Case Study of Portland, Oregon
Aaron Golub Portland State University, [email protected]
Vivian Satterfield Verde
Michael Serritella Portland Bureau of Transportation
Jai Singh Asian Pacific American Network of Oregon
Senna Phillips Cornell University
Follow this and additional works at: https://pdxscholar.library.pdx.edu/usp_fac
Part of the Urban Studies and Planning Commons
Let us know how access to this document benefits you.
Citation Details Citation Details Golub, A., Satterfield, V., Serritella, M., Singh, J., & Phillips, S. (2019). Assessing the barriers to equity in smart mobility systems: A case study of Portland, Oregon. Case Studies on Transport Policy.
This Post-Print is brought to you for free and open access. It has been accepted for inclusion in Urban Studies and Planning Faculty Publications and Presentations by an authorized administrator of PDXScholar. Please contact us if we can make this document more accessible: [email protected].

ASSESSING THE BARRIERS TO EQUITY IN SMART MOBILITY SYSTEMS: A CASE STUDY OF PORTLAND, OREGON
Aaron GolubAssociate Professor and DirectorNohad A. Toulan School of Urban Studies and PlanningPortland State University560 SW Mill St.Portland, OR [email protected] +1-503-725-4069
Vivian [email protected]
Michael SerritellaPortland Bureau of [email protected]
Jai SinghAsian Pacific American Network of [email protected]
Senna PhillipsCornell [email protected]
Acknowledgements: This project was funded by grants from Forth (https://forthmobility.org/ ), the 11th Hour Project (of the Schmidt Family Foundation), and the National Institute for Transportation and Communities (NITC) at Portland State University (Project #1163), a U.S. DOT University Transportation Center, with assistance from the City of Portland.

1
2 ASSESSING THE BARRIERS TO EQUITY IN SMART MOBILITY SYSTEMS: A 3 CASE STUDY OF PORTLAND, OREGON
4 ABSTRACT
5 There is an active debate about the potential costs and benefits of emerging “smart mobility” 6 systems, especially in how they will serve communities already facing transportation challenges. 7 This paper describes the results of an assessment of these equity issues in the context of lower-8 income areas of Portland, Oregon, based on a mixture of quantitative and qualitative research. 9 The study found that by lowering costs and improving service for public transit, ridesharing and
10 active transportation, smart mobility systems could address many of the needs of transportation 11 disadvantaged communities. Similar to those found in other case studies, significant barriers 12 prevent smart mobility technologies from benefiting all communities. For example, lower 13 income survey respondents and respondents of color had significantly lower access to the “smart 14 mobility ecosystem” including bank accounts and credit cards, they rely more heavily on paying 15 cash for transit tickets, had lower access to internet at home and work, and were more likely to 16 reduce data use or cancel cell plans because of cost or data restrictions. Respondents were also 17 concerned about information security, as the impacts of loss or theft, especially identity theft can 18 be devastating for lower-income residents. Since integrating payment systems and relying on 19 internet and cell data for mobile applications is a core feature of smart mobility ecosystem, these 20 disparities are significant barriers to the equitable transition to smart mobility. Policy 21 recommendations to address barriers include expanding free and public WiFi, better real-time 22 transit information, improved training, and language translation for phone applications, among 23 other things. 242526 Keywords: Equity, smart mobility, autonomous, justice27

2
1 INTRODUCTION2 There is an active and ongoing debate about the potential costs and benefits of emerging 3 Information and Communication Technologies (ICT), autonomous, electric, connected and 4 shared mobility technologies and services – broadly classified here as “smart mobility” systems. 5 This project focuses on the user end of these systems – how users will access information and 6 reserve and pay for services provided through a smart mobility “ecosystem” of technologies, 7 accounts and devices. One particular dimension of the debate is how these new technologies will 8 affect communities already facing transportation disadvantage, who are often marginalized 9 within transportation planning or decision-making processes, who often don’t benefit from
10 investments in transportation (e.g. because of affordability or lack of access to a private vehicle), 11 and who often bear the burdens from investments (e.g. infrastructure impacts on neighborhoods). 12 This project explores these overlapping issues – present-day transportation disadvantage and the 13 potential for new investments and technologies to either alleviate or exacerbate existing 14 disadvantages. 1516 Innovation in smart mobility systems has been primarily driven by a consortium of private 17 interests including automobile manufacturers (Ford, GM, Volvo, etc.), transportation network 18 companies (TNCs) (e.g. Uber, Lyft, etc.), and major technology companies (Google, Apple, 19 etc.). The City of Portland, TriMet (Portland’s regional public transit provider) and other local 20 leaders, neighborhoods, and community organizations are working to design and implement a 21 smart mobility plan to insure issues important to the public are protected as smart mobility 22 systems are deployed. This plan was heavily shaped by The Portland Smart Cities UB Mobile 23 PDX proposal (PBOT 2018), developed in response to a request for proposals from the United 24 States Department of Transportation (the application was a national finalist, yet was not chosen). 25 The proposal focused strongly on developing mobility solutions that would serve traditionally 26 underserved populations (low-income, communities of color, older adults, and residents with 27 mobility challenges). This paper won’t break out results for residents with mobility challenges as 28 those issues are being analyzed in a subsequent project. 2930 The research described in this paper is part of this planning effort by developing an equity 31 assessment of smart mobility systems in the Portland context. This project was carried out 32 through a collaboration between the City of Portland, Forth, OPAL Environmental Justice, a 33 non-profit organization focused on housing, transportation and environmental justice, and 34 Portland State University (Golub et al. 2018). Specifically, this project explores the following 35 research questions:36 1. How can smart mobility technologies address the current and future needs of 37 transportation disadvantaged communities (defined here as racial/ethnic minorities, low-income, 38 and older adults)?39 2. What are the barriers to using smart mobility technologies experienced by transportation 40 disadvantaged communities?41 3. What potential solutions show the most promise in overcoming these barriers?4243 In the first sections of this paper, the relevant existing literature is reviewed and related to our 44 research questions. Then, the project’s research approach and methodologies are presented, along 45 with some background on the Portland case study area. The next section reviews the focus 46 groups and their results. The next section explores the larger sample survey, detailing the survey

3
1 methods and study area followed by results. The report concludes with a discussion of these 2 results and their implications.
3 LITERATURE REVIEW
4 The broad introduction of ICT, autonomous vehicle (AV) technologies, and more generally 5 “transportation as a service” using shared and or connected vehicles will significantly alter 6 transportation systems and traveler behavior. To conveniently utilize these smart mobility 7 systems, however, the user must access various support systems and resources which form a 8 smart mobility ecosystem, including internet and cell data, banking and credit accounts, all 9 linked into an on-line and smartphone environment. Therefore, even as virtual mobility (via ICT)
10 grows as a potential replacement for physical mobility, disparities in access to ICT resources and 11 skills could translate into disparities in mobility in the physical world. Setting the stage for this 12 study, there is a growing and important literature on these disparities which both explores 13 currently available smart mobility applications (“apps” offering shared cars or bicycles, rides 14 sourced through TNCs, or other real-time information such as routing or transit vehicle arrivals 15 and payment) as well as future smart mobility systems based on autonomous vehicles (AVs). 1617 To begin, racial and ethnic minorities and low income households are more likely to face 18 transportation challenges due to a combination of lower incomes, lower rates of private car 19 ownership, a greater dependence on public transit and in many regions, jobs and housing spatial 20 mismatch (Kramer and Goldstein 2015, Lubitow et al. 2016, Mattioli and Colleoni 2016). 21 Therefore, providing reliable, diverse and affordable transportation options is critical for 22 ensuring basic levels of social inclusion of all groups. The potential for currently available smart 23 mobility systems (e.g. TNCs, bike sharing or car sharing) to expand access to automobiles for 24 car-less households has been noted by previous studies (McNeil et al. 2017, Howland et al. 2017, 25 Dill et al. 2017, Schaller 2016, Brown 2017, 2019). Other literature postulates that future smart 26 mobility systems (e.g. Mobility As A Service (MAAS) subscription services would further 27 reduce the need for car ownership and licensure, two significant barriers to transportation equity 28 (Acheampong et al. 2018, Iacobucci et al. 2017, Gruel et al. 2016, Grush and Niles 2017, Hörl et 29 al. 2016, Litman 2017). Additionally, real-time information may improve the public 30 transportation experience overall (Alessandrini et al. 2015, Rode et al. 2017, Velaga et al. 2012) 31 and could allow for more demand-based scheduling and improved paratransit. 3233 Alongside potential benefits, the literature uncovers significant barriers to broader access to 34 smart mobility systems. Barriers to the smart mobility ecosystem, due to “digital divide” or 35 “banking divide” create significant barriers to broader access (Dinning and Weisenberger 2017, 36 Schaller 2016, Kodransky and Lewenstein 2014, Brakewood and Kocur 2013, Brown 2017 and 37 2019). The Federal Deposit Insurance Corporation (FDIC) regular measures banking access, and 38 its most recent 2017 study showed that 6.5% of the US population was completely unconnected 39 to the mainstream banking system, with another 18.7% relying on some financial services 40 outside of the insured banking system (FDIC 2018). The smart mobility ecosystem, relying on 41 seamless integration with mainstream banking and credit system, may leave these individuals 42 behind. Mattioli and Colleoni (2016) address the rise in virtual mobility payments and King and 43 Saldarriaga (2017) document significant potential inequities from taxis moving to credit-card 44 based payment systems in New York City. Similarly, Brakewood and Kocur (2013) address

4
1 issues facing unbanked riders in Chicago and identify potential solutions. McNeil et al. (2017) 2 explore barriers to bike share access, and illustrate the difficulties for low income and people of 3 color when bike share programs fail to accept diverse payment methods and rely on private data 4 access. Kodransky and Lewenstein (2014) highlight how many low-income riders may not trust 5 institutions with their private and financial information. Detailed case studies in Los Angeles 6 (Brown 2017, 2019) and Boston (Gehrke et al. 2018) explore equity issue in existing TNC 7 service coverage and use, finding that coverage of services are broad and equitable, while actual 8 use is higher among ethnic and racial minorities. (Other work by Feigon and Murphy (2018), 9 however, seems to question the extent of this higher use).
1011 Age is also a dimension of potential transportation disadvantage due to technological illiteracy, 12 lack of trust, and other access barriers (Shaheen et al. 2017). A qualitative study by Shirgaokar 13 (2018) uncovered several key barriers to the use of TNCs by older adults in Canada, including a 14 basic lack of knowledge about smartphone and internet, concerns about financial privacy and 15 security issues with smartphone and internet applications, alongside physical safety using TNCs. 1617 Synthesizing from this literature, barriers exist along the social dimensions of race, ethnicity, 18 language, class and age (and Shaheen et al. (2017) also emphasizes dimensions of space and 19 time-of-day availability as creating additional barriers). In Table 1, we summarized some of the 20 major equity issues existing along these different social dimensions for some of the key 21 components of the smart mobility ecology, including banking, credit, smartphone ownership, cell 22 service affordability, internet access at home and access to and use of existing new mobility 23 services. In most cases the disparities are clear, while in some, such as in smartphone ownership, 24 internet access and use of existing smart mobility options, the literature is mixed. We can return 25 to these issues when we analyze our results from this case studies. 2627

5
1 Table 1. Key disparities in access to the smart mobility ecosystemAge Income Race/Ethnicity Overall averages
Ban
king
Older population higher access (FDIC 2018B Table A1, also Brakewood and Kocur 2013)
Higher income population higher access (FDIC 2018B Table A.1, also Brakewood and Kocur 2013)
White households higher access (FDIC 2018B Table A.1, also Brakewood and Kocur 2013)
87% use some banking resources, 67% “fully banked” (FDIC 2018 p. 2)
Cre
dit Very young and very
old have lower access to credit (FDIC 2018B Table F.1)
Higher income population higher access (FDIC 2018B Table F.1)
White and Asian households higher access (FDIC 2018B Table F.1)
80.3% access to some credit (FDIC 2018 p. 10)
Smar
tpho
ne
Ow
ners
hip
Younger, higher ownership (FDIC 2018B, Table B.16, p 65 and Pew 2015, p. 13) (Also Shirgaokar 2018)
Higher income population higher ownership (FDIC 2018B Table B.16, and Pew 2015 p. 13)
Mixed results: FDIC (2018B): Black lower, and Asian higher than average ownership (Table B.16); Pew (2015): Black and Hispanic higher rate of ownership (p. 13).
2017: 72.7% (FDIC 2018B Table B.16)
Cel
l ser
vice
da
ta p
lan
affo
rdab
ility
Younger more likely than average to let service lapse (Pew 2015 p. 14)
Low-income households about twice as likely as average to let service lapse (Pew 2015 p. 14)
African Americans and Latinos are around twice as likely aswhites to let service lapse (Pew 2015, p. 14)
23% of smartphone owners let cell service lap (Pew 2015 p. 14)
Inte
rnet
acc
ess a
t ho
me
Mixed results: High (0ver 75%) across the age groups until tapering off over 55 (FDIC 2018B Table B.17). Pew (2015) reports higher access (more than 94%) for those over 50 (p. 18).
Higher income population higher access (FDIC (2018B) Table B.17 and Pew (2015) p. 18)
Black lower, and Asian higher, than average (FDIC 2018B Table B.16). Pew (2015) shows lower access among African American and Hispanics compared to whites (p. 18).
72.6% of households have internet access at home (FDIC 2018B Table B. 17). Pew (2015) reports 90% have access to broadband.
New
mob
ility
Se
rvic
es,
acce
ss to
No spatial deficiencies in access to TNC services in L.A. case (Brown 2019 p. 87)
No spatial deficiencies in access to TNC services in L.A. (Brown 2019 p. 87). Bikeshare and carshare availability appears to be equitable (Schaller 2016)
No spatial deficiencies in access to TNC services in L.A. case (Brown 2019 p. 87). Bikeshare and carshare availability appears to be equitable (Schaller 2016)
Geography of services varies by region
New
mob
ility
Ser
vice
s, us
e of
Barriers to use due to technology proficiency (Shirgaokar 2018); Higher TNC use among younger population (Schaller 2016 p. 24)
Mixed results: Schaller (2016) reports higher use of TNCs among higher income (p. 26). Rayle et al. (2016) report moderate income (and collage educated) highest users of TNCs. Gehrke et al (2018) report incomes of users similar to the rest of the Boston region.
Mixed results: Higher frequency (per capita trips) of TNC use among ethnic and racial minorities (Shaheen 2017, Brown 2019, and Schaller 2016). Feigon and Murphy (2018) report is inconclusive – whiter neighborhoods generate more trips, but not in all regions studied (p. 23)
A few percent of all trips (varies by region – no national data
23 Finally, the literature points to a variety of potential solutions to closing many of these important 4 disparities in access. The literature suggests expanding payment options to create alteratives to 5 the need for credit or banking (McNeil et al. 2017), investing in public internet or wi-fi networks

6
1 (Shaheen et al. 2017), building more robust outreach and educational programs (Shirgaokar 2018 2 and McNeil et al. 2017), and addressing important data privacy issues throughout the smart 3 mobility ecosystem (Kodransky and Lewenstein 2014). 45 This project will supplement the existing literature by adding another city-specific case study to 6 the national debate and as a comparison to the other city-specific cases. Notably, this study’s 7 focus on a particular area of a medium-sized metro will differ from the previous case studies 8 based in major metros (Boston, Los Angeles, San Francisco) and also that it is focused on a low-9 income area of the region.
10 PORTLAND CASE STUDY
11 The focus of this study is the smart mobility planning process being developed based on The 12 Portland Smart Cities UB Mobile PDX proposal (PBOT 2018). Portland is the largest metro area 13 in the state of Oregon, with a population of around 2 million, and is located in the northwest 14 region of the United States. This study was designed to illuminate the transportation challenges 15 of lower-income residents and residents of color in the Portland region, so the study area focused 16 on East Portland and west Gresham neighborhoods which are known to have higher 17 concentrations of residents of color and households below the poverty line. East Portland is one 18 of several outer areas of the region that have been “receiving” lower-income residents displaced 19 from rapidly gentrifying neighborhoods in the desirable core of the region, while it is also the 20 site of first settlement for international refugees (such as Somalia) and lower-income immigrants, 21 especially Asian and Hispanic. These areas of the region are becoming increasingly recognized 22 for this important role, and transportation policy and investment attention is being directed 23 towards this area (for example, bus services were recently added to this area). Significant 24 existing research has been carried out recently in East Portland-area communities about 25 transportation challenges and disadvantages (e.g., Lubitow et al., 2016). That research illustrated 26 some clear dimensions of transportation disadvantage experienced by these communities, 27 including lower rates of car ownership and access, existing transit services deficiencies (network 28 coverage, service time of day, travel times, headways and wait times, and costs); lack of 29 sidewalk coverage and resulting safety concerns; and general transportation costs and distances 30 to opportunities create barriers to mobility. Figure 1 shows the study area outlined in red. 31

7
1 FIGURE 1. Map of study area (red outline) and the locations of survey respondents by zip 2 code
34 Source: Spatial Data - RLIS (accessed via PSU server)5
6 RESEARCH METHODS
7 To answer the research questions listed above, it was decided that a mixture of both quantitative 8 and qualitative research would be appropriate. Qualitative methods typically employed with 9 research of this nature include interviews and focus groups. Quantitative methods include larger
10 sample surveys which can reveal numerical and statistical patterns in data. Combined, these 11 methods can create an interwoven and layered understanding of the issues where deeper stories 12 from individuals and small groups can be juxtaposed by data from a larger sample survey. 13 Further, the qualitative information was used to inform the design of the larger sample survey 14 instrument. By spending time in conversation with communities the research team could better 15 understand the specific issues, terminologies and dimensions of the equity challenges. This 16 project began with focus groups and interviews which were followed by a larger sample survey 17 administered both online and in-person. The following sections present the results of the focus 18 groups and then the larger sample survey.

8
1 FOCUS GROUPS
2 The primary goal of the focus groups was to better understand how individuals perceive the 3 relative benefits and burdens of shared mobility within the local context of East Portland. Both 4 focus groups were two-hour conversations administered in community spaces in East Portland 5 during the summer of 2017. The first focus group engaged twelve members from Bus Riders 6 Unite! (a bus riders’ “union”). A second focus group was organized through the Latino Network 7 community organization. Overall, the Latino Network group consisted of drivers, all middle-aged 8 Hispanic females, who rarely use public transportation. The Bus Riders Unite! group was more 9 diverse in terms of ethnicity and age, and had less access to private vehicles and used public
10 transportation almost exclusively. Both groups were mostly lower to moderate income. The 11 summaries which follow describe the major themes from the discussions. 1213 Participants expressed a strong interest in opportunities for education and training on how to use 14 smart mobility technology - especially smartphone applications (apps). These apps need to be 15 available in users’ native languages and should be translated to reflect the diversity of languages 16 spoken by residents in East Portland. To maximize effective use of the apps, participants 17 indicated that they would be interested in attending in-person trainings at trusted neighborhood 18 institutions such as neighborhood schools, libraries, and nonprofit organizations or at TriMet 19 stations. The need for cheaper, or free, access to data through public Wi-Fi type services was 20 also highlighted. 2122 Participants discussed multiple barriers to utilizing app-based technology. While most 23 participants had some form of access to the internet either through a computer or via their 24 smartphone, many raised concerns about security of mobility related apps. Some expressed 25 concerns related to privacy of personal mobility (ability of data to be used to track movement). 26 Participants also expressed major apprehensions about linking their bank accounts or credit cards 27 to a smartphone apps citing concerns around security of their financial information (if phones 28 were lost, stolen or hacked) and/or ‘glitches’ in the system that would delete their balances, 29 credits or tickets. Roughly a third of participants did not have a checking or savings account, or 30 even if they did, were afraid to connect them to their phone apps. One participant commented: “I 31 have had my identity stolen before so I'm weary of anything automated.” and another said: “I do 32 have a bank account, but am afraid TriMet will use it and share it.” There was a noticeable 33 generational divide however between those with these concerns and younger participants, who 34 were more trusting of the devices.
35 SURVEYS36 As mentioned above, the study focus is on East Portland communities and so the survey 37 sampling strategy focused on those areas. The use of an online survey, however, meant that it 38 was harder to control exactly where survey participants lived. In the end, the sample included 39 participants from all over Portland and Gresham, though still more concentrated in East Portland 40 as was desired. Figure 1 shows the numbers of survey respondents from different areas of the 41 region (mapped by zip code). The survey was implemented both online and in person using 42 identical instruments and responses were merged. The study team visited groups and events led 43 by people of color, and conducted intercept surveys on-board transit vehicles and at transit hubs 44 in East Portland. The online survey was hosted on the OPAL website (OPAL 2017) and was

9
1 open for responses during August and September of 2017. The link was shared through social 2 media and emails from OPAL. A total of 308 surveys were received, 155 online and 153 in-3 person. 45 Even though a significant number of survey participants were from outside of the desired study 6 area, the demographic profiles of the desired East Portland study area and the survey sample are 7 fairly similar. A greater number of black or African-American respondents appear in the survey 8 compared to their proportion of the study area, while Asians and Hispanics are underrepresented. 9 Overall, the proportion of respondents of color in the survey (41%) is similar to their proportion
10 in the study area (47%) (American Community Survey 2013-2017). The survey sample is over-11 representative of those under 54 years old, likely due to the internet-based distribution of the 12 survey and the particular events in which the survey was administered in person (American 13 Community Survey 2013-2017). The survey sample had lower annual incomes (a median of 14 $35,000) than the study area population ($43,700) (American Community Survey 2013-2017).
15 Equity Analysis Methodology16 The equity analysis is built only on the survey responses, and we compare results with focus 17 group responses where applicable. This analysis looks at both the overall survey responses and 18 also makes comparisons between subgroups to better understand the magnitude and significance 19 of disparities in access to elements of the smart mobility ecosystem. To design our subgroups for 20 comparison, this project reviewed key demographic indicators included in equity frameworks or 21 analyses used in the Portland Metropolitan area (Metro 2018, TriMet 2017). To be consistent 22 with those approaches, this analysis breaks the survey sample along the following three 23 demographic dimensions: race/ethnicity, household income, and age. All of results in the tables 24 presented in this paper are broken down into these groups. The responses were split fairly evenly 25 between respondents of color (N = 142) (herein POC) and white (N = 158) (herein Non-Hispanic 26 White (NHW)) respondents, while there were more low income (incomes less than 50,000 27 dollars per year) respondents (N = 170) than high income (N = 120). Looking at the survey 28 responses broken down by age, Millennials (under 34 years old) represented half of the 29 responses (N = 155), with the remainder split between Baby Boomer (over 55 years old, herein 30 called “Boomers”) (N = 40) and Generation X (35 to 54 years old, herein called “Gen-X”) (N = 31 97). Grouping survey response data into these sub-groups allows the use of Chi-Square statistical 32 tests to test whether the differences between groups are statistically significant. Where possible, 33 we will also compare our results from national studies from the FDIC (2018 and 2018B) and 34 Pew Research Center (2015). 3536 The survey contains nearly 40 questions and this paper presents a subset of the results and 37 analyses from them. In the sections which follow, general results are presented followed by 38 differences between our demographic groups. Sometimes tables are used to present the results, 39 where overall results are shown alongside comparative analyses by the aforementioned 40 demographic dimensions (age, income and race/ethnicity).
41 Basic transportation access42 This initial section addresses access to vehicles, licensing and transportation benefits at school 43 and work (Table 2) to establish some baseline equity issues in transportation access. Overall,

10
1 about 70% of respondents had access to a vehicle and 80% had a driver’s license. Average 2 access to vehicles was quite low, however, with 1.13 vehicles per household. This is much lower 3 than the average for the City of Portland (1.49) (Governing.com 2017) and the country as a 4 whole (1.88) (McGuckin and Fucci 2018, p. 10). This area of East Portland in many ways 5 exemplifies the struggle among lower-income households for mobility, where automobiles offer 6 the best service though at high costs. While public transit service are fairly good in the region, 7 many residents in these more exurban areas, especially those wholly dependent on public transit, 8 end up trapped into smaller geographies of opportunity because of lower levels of mobility (see 9 Lubitow et al. (2016) for further exploration of these issues in this region).
1011 Fewer, however received transportation benefits at work or school. Transit passes, free parking 12 and bicycle parking were the most common benefits with around a quarter receiving each while 13 very few people received the other benefits (company cars, electric vehicle charging and bike 14 sharing subscriptions). Almost 10% of the respondents experienced some mobility challenges.1516 Driver’s licensing rates varied significantly by race and income, with higher income and NHW 17 respondents having higher rates of licensing. This finding is not surprising considering the State 18 of Oregon requires proof of legal residence to secure a driver’s license. Among the other 19 dimensions, higher income respondents generally had better access to vehicles and transportation 20 benefits at the work or school location. For some benefits, younger respondents had better access 21 than older respondents (or perhaps were more aware of these benefits). Older respondents 22 reported significantly higher rates of mobility related disabilities.2324

11
1 TABLE 2. Basic transportation access (part 1) (“Generation, Income and Race/ethnicity” 2 columns present data for each subgroup; NHW = Non-Hispanic White, POC = people of color; 3 Bolded numbers are differences which are statistically significant at p ≥ 0.1).
Generation Income Race/Ethnicity
Overall
BoomerN= 40
GenXN= 97
Mill.N= 155
HighN= 120
LowN= 170
NHWN= 158
POCN = 142
How many cars, trucks, vans, or motorcycles are available in your household for you to use? 1.14 1.20 1.27 1.08 1.42 0.92 1.18 1.09Of the cars available to you, do you lease, make payments, or own them? [Multiple choice] (%) 53 63 55 47 67 41 57 45Do you have a driver’s license? [Y/N] (%) 79 80 79 80 95 70 89 67Do you experience some kind of mobility related impairment or disability? [Y/N] (%) 9.3 18 9.6 4.6 7.6 9.8 8.9 8.8Does your employer / school provide you: Transit pass? [Y/N] (%) 29 20 25 35 35 24 27 31 Free parking? [Y/N] (%) 23 28 25 23 28 19 26 21 Secure bicycle parking? [Y/N] (%) 26 13 23 32 35 20 28 23 Company vehicle? [Y/N] (%) 2.6 2.5 2.1 3.2 3.3 2.4 1.9 3.5 Onsite electric vehicle charger? [Y/N] (%) 5.2 5.0 5.2 5.8 10 1.8 7.6 2.8 Biketown subscription? [Y/N] (%) 4.2 0.0 1.0 7.7 3.3 5.3 3.8 4.9
45 The second set of questions concerned modes of travel to work and methods of payment for 6 TriMet tickets (Table 3). Overall, the survey respondents were extremely diverse in their travel 7 mode choices, with only 27.5% driving alone to work, much lower than the metro area’s 70% 8 (Metro 2018B) and nation’s 76% (McGuckin and Fucci 2018, p. 78). Consequently, rates of 9 bicycling, public transportation and walking are considerably higher than the metro area’s
10 (cycling, ~2.5%, public transit, ~7%, and walking, ~3.5%) and nation’s (cycling, ~1.1%, public 11 transit, ~6.9%, and walking, ~2.9%) (McGuckin and Fucci 2018, p. 78). This diversity of travel 12 modes used reflects the general lack of private vehicle ownership and lower incomes. While this 13 diversity is often the goals of implementing “smart mobility” policies and investments, many in 14 this group are captive to non-private vehicle modes out of necessity, facing longer travel times 15 and distances without the safer cycling, walking and transit infrastructure enjoyed by residents 16 closer to the core of Portland. 1718 It is well known that for car-less households, car use is facilitated through taxis, informally 19 borrowed cars, carsharing or TNCs; the use of these modes by car-less households is 20 disproportional to their share of the population (Brown 2019). While Rayle et al. (2015) showed 21 that in San Francisco TNC users had higher incomes than the city residents overall, that doesn’t 22 necessarily contradict this study which focused only on the travel of relatively suburban low-

12
1 income travelers with low car access. Brown’s work indeed showed that low-income users of 2 TNCs made more trips per user than higher income users, corroborating our finding of higher 3 TNC use for work trips. Results by age group here corroborate disparities found in San Francisco 4 by Rayle et al (2015) and nationally (Schaller 2016) while the higher use by respondents of color 5 here is similar to the national finding (Schaller 2016)67 There are important issues in how transit fare is paid for, with a significant number, around 40%, 8 still relying on paying fares on board with cash. This poses a significant challenge to moving 9 towards cashless mobility systems integrating with bank accounts and credit cards. This was a
10 common theme brought up in the focus groups presented earlier, and is similarly born out in 11 these quantitative survey results. Significantly, however, more than one third of respondents 12 have moved to using online or phone applications to purchase fares. This is a positive 13 development for the transition to smart mobility technologies. Cash payment showed significant 14 differences along the dimensions of race/ethnicity and class, with lower income and respondents 15 of color indicating a higher reliance on cash payment on board. On the contrary, higher income 16 and NHW respondents showed more reliance on online and smart phone payments for fares. 1718 TABLE 3. Basic transportation access (continued) (“Generation, Income and Race/ethnicity” 19 columns present data for each subgroup; NHW = Non-Hispanic White, POC = people of color; 20 Bolded numbers are differences which are statistically significant at p ≥ 0.1).
Overall Generation Income Race/Ethnicity
BoomerN= 40
GenXN= 97
Mill.N= 155
HighN= 120
LowN= 170
NHWN= 158
POCN = 142
The most common mode of travel to work: Drive alone [Y/N] (%)
28 25 31 26 34 22 27 29
Carpool [Y/N] (%) 5.2 2.5 3.1 7.7 2.5 7.6 3.8 7.0 Public transportation [Y/N] (%)
36 23 32 43 31 41 28 46
Walked [Y/N] (%) 12 5.0 11 14 7.5 15 9.5 15 Bicycle [Y/N] (%) 23 5.0 19 31 24 23 23 23 Transportation Network Companies (TNCs) [Y/N] (%)
2.3 0.0 3.1 2.6 0.0 4.1 1.3 3.5
Work at home [Y/N] (%) 5.5 12.5 8.2 2.6 10.0 2.9 8.9 2.1How do you typically pay for the TriMet fare: On board [Y/N] (%)
42 35 47 42 33 51 37 49
TriMet or retail store [Y/N] (%)
10 20 10 6.5 9.2 11 11 7.0
School or Work [Y/N] (%) 15 7.5 13 17 19 11 15 14 Online or Phone App [Y/N] (%)
35 35 33 39 42 32 41 31
Social service agency [Y/N] (%)
2.9 2.5 3.1 3.2 0.0 4.7 2.5 3.5
21

13
1 Access to data and internet2 The questions in this section address the issue of access to data, internet and smartphones (Table 3 4). Overall, access to internet was very high, with a small share, around 10%, having no access to 4 the internet at home or work. This is significantly higher than national rates of access at home of 5 around 73% (FDIC 2018, p.28). Similarly, smartphone use was very high at 89%, again much 6 higher than national rates of around 73% (FDIC 2018, p.28). In contrast to the high rates of 7 access to smartphones is the significant number (25%) of respondents who had to cancel cell 8 phone service because of cost, similar to the 23% nationally who had to cut back on phone data 9 use due to data limitations (Pew 2015, p. 14).
1011 Although statistical analyses showed there are significant disparities among the income and 12 racial/ethnic groups, data and internet access across all groups was still quite high. For example, 13 although nearly 100% of the NHW and higher income respondents had access to the internet at 14 home and work, and more than 87% of respondents of color and low-income respondents had 15 access. While there were disparities in smartphone use, they were because lower income and 16 respondents of color had greater access than their counterparts, corroborating research from Pew 17 (2015) but opposing results from FDIC (2018B). Boomers had markedly lower access to 18 smartphones, at only 73%.but this rate is higher than national rates 1920 A significant and troubling disparity was in the area of cell data access. Lower income and 21 respondents of color were about 10 percentage points more likely than average to have canceled 22 cell service because of data plan limits and costs. And lower income and younger respondents 23 were more likely to need to connect to Wi-Fi to reduce data use. This corresponds well with the 24 previous research on this issue, as well as feedback from our focus group discussions where 25 access to public Wi-Fi was seen as an important solution to improving the transition to smart 26 mobility tools. 2728 TABLE 4. Access to data and internet (“Generation, Income and Race/ethnicity” columns 29 present data for each subgroup; NHW = Non-Hispanic White, POC = people of color; Bolded 30 numbers are differences which are statistically significant at p ≥ 0.1).
Generation Income Race/Ethnicity
Overall
BoomerN= 40
GenXN= 97
Mill.N= 155
HighN= 120
LowN= 170
NHWN= 158
POCN = 142
How frequently do you use email and/or the internet? [Frequency, times per month – translated from the different frequency options (daily, weekly, etc.) in the survey]
89 73 90 94 96 84 93 85
At your home, do you have access to the internet? [Y/N] (%)
92 88 94 94 98 88 97 87
If you work, at your workplace, do you have access to the internet? [Y/N] (%)
93 91 94 93 99 87 97 89
Is your cell phone a smartphone? [Y/N] (%)
89 73 89 94 89 89 89 91
If you have a cell phone, how frequently do you use public Wi-Fi in order to reduce your data
68 43 67 74 63 72 68 68

14
use? [Multiple Choice] (% choosing “whenever possible” or “occasionally”)Have you ever had to cancel your cell phone service for a period of time because of cost? [Y/N] (%)
25 16 25 26 13 35 18 33
1
2 Access to banking and credit3 Overall, access to banking and credit is high with 72% having access to credit and 90% having 4 access to banking services (Table 5). These results are similar to those found by the FDIC (2018) 5 showing that 6.5% of the overall population was completely unconnected to the mainstream 6 banking system (p. 1) and 31% lacked access to credit (p. 48), with higher rates of exclusion for 7 low-income and minority households. Rates found here for low-income respondents and 8 respondents of color are similar to the findings from New York (King and Saldarriaga 2017). 9 Notably, comfort with linking personal financial information to phone applications was
10 significantly higher for younger, NHW and higher income respondents, even though younger 11 respondents had less access to banking and credit compared to older respondents. Older 12 residents, who showed the least comfort of any group, may need additional training for them to 13 become comfortable trusting these applications (corroborating Shirgaokar (2018)).1415 TABLE 5. Access to banking and credit (“Generation, Income and Race/ethnicity” columns 16 present data for each subgroup; NHW = Non-Hispanic White, POC = people of color; Bolded 17 numbers are differences which are statistically significant at p ≥ 0.1).
Generation Income Race/Ethnicity
Overall
BoomerN= 40
GenXN= 97
Mill.N= 155
HighN= 120
LowN= 170
NHWN= 158
POCN = 142
Do you have a credit card or prepaid card account? [Y/N] (%)
72 85 78 66 90 60 79 64
Do you have a checking or savings account? [Y/N] (%)
90 95 93 86 98 85 95 84
How comfortable are you in linking your bank account or credit card to transportation apps on your phone? [Likert scale – range 1 to 5] (Average score)
3.3 2.7 3.2 3.6 3.7 3.1 3.6 3.0
18
19 Smart mobility applications20 This section of questions focused on the use of currently existing smart mobility applications, 21 including public transportation information, navigation, ridesourcing and bike sharing (Table 6). 22 The use of smart phone applications for public transit and navigation was quite high, with overall 23 usage averaging around four times per week. The use of smart phone applications for TNCs and 24 bike sharing were much lower at only a day or two per month. Interestingly, there were fewer 25 equity concerns as lower income respondents and respondents of color used these applications 26 similarly, and sometimes more than their counterparts. The one significant disparity in these

15
1 results is that younger respondents use these applications more frequently by a significant margin 2 (more than twice as much). This may be due to the higher access and use of private vehicles by 3 respondents in the Boomer generation compared to Millennials; there is simply less need for 4 these tools for the Boomer respondents. These results corroborate those found in the Los Angeles 5 case (Brown 2019) but differ from the national study by Feigon and Murphy (2018) which 6 showed higher use in whiter neighborhoods (other than Seattle). 78 TABLE 6. Use of smart mobility applications (“Generation, Income and Race/ethnicity” 9 columns present data for each subgroup; NHW = Non-Hispanic White, POC = people of color;
10 Bolded numbers are differences which are statistically significant at p ≥ 0.1). Generation Income Race/
EthnicityOverall
BoomerN= 40
GenXN= 97
Mill.N= 155
HighN= 120
LowN= 170
NHWN= 158
POCN = 142
If you have a smartphone, how often do you use your phone to get public transportation information? [Days per Month]
13.4 6.7 11.8 15.6 9.0 16.3 11.5 15.1
If you have a smartphone, how often do you use your phone for navigation? [Days per Month]
15.8 7.6 14.8 18.1 14.8 17.1 14.8 16.7
If you have a smartphone, how often do you use your phone to reserve a ridesourcing or carsharing service? [Days per Month]
2.2 1.4 2.0 2.4 1.8 2.7 1.5 2.9
If you have a smartphone, how often do you use your phone to use bikesharing? [Days per Month]
1.2 1.3 0.6 1.2 1.0 1.3 1.0 1.5
11
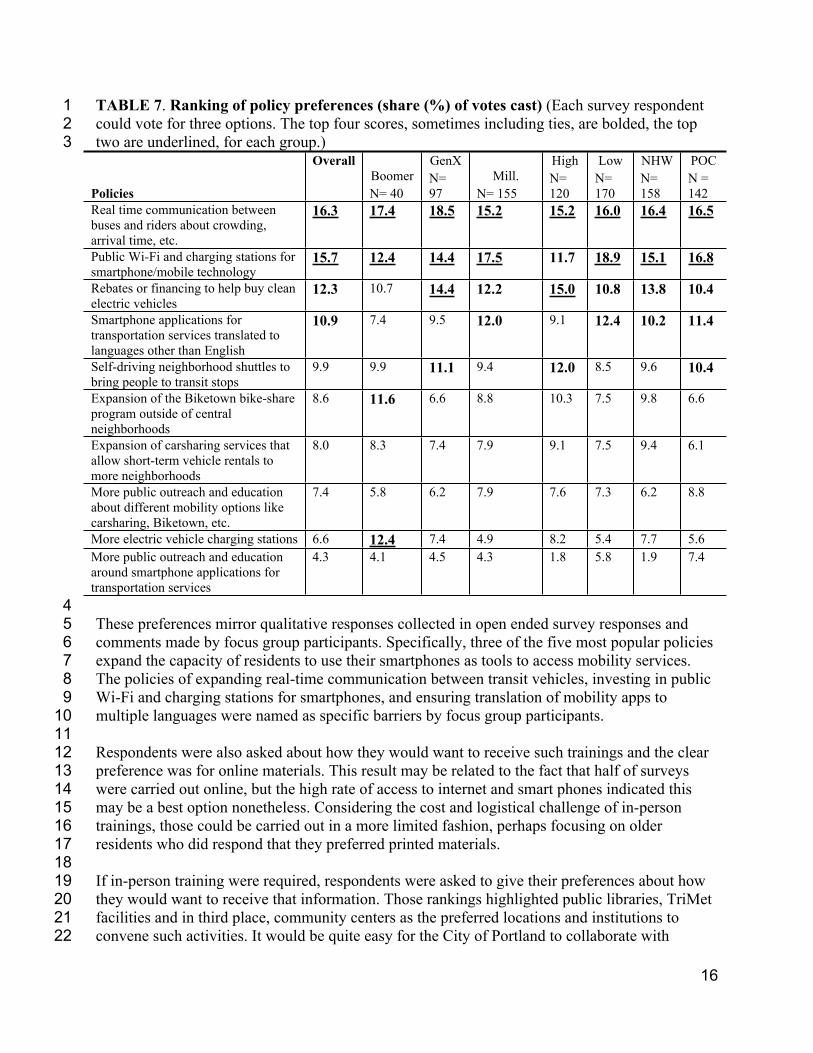
12 Policy recommendations13 Survey respondents were given a list of 10 policies from which they could vote for their favorite 14 three to address barriers to using smart mobility systems (Table 7). Improved real-time 15 transportation information for public transit users and public Wi-Fi and charging stations were 16 closely matched as the two most preferred overall. Interestingly, low income, Millennials, and 17 respondents of color preferred the public Wi-Fi as their top choice while Boomers, Gen-X, 18 wealthier and NHW respondents preferred the real-time communication as their top choice. 19 Third and fourth choices included addressing language issues in smart phone applications and 20 providing financial assistance for the purchase of electric vehicles. Coming in fifth was interest 21 in autonomous neighborhood shuttles to access transit stations. Boomers were especially 22 interested in expansion of Bikeshare availability and more electric vehicle charging stations, 23 things the other groups ranked much lower. Interestingly, Boomers were not any more interested 24 in outreach and education than other groups. 2526
16
1 TABLE 7. Ranking of policy preferences (share (%) of votes cast) (Each survey respondent 2 could vote for three options. The top four scores, sometimes including ties, are bolded, the top 3 two are underlined, for each group.)
Policies
OverallBoomerN= 40
GenXN= 97
Mill.N= 155
HighN= 120
LowN= 170
NHWN= 158
POCN = 142
Real time communication between buses and riders about crowding, arrival time, etc.
16.3 17.4 18.5 15.2 15.2 16.0 16.4 16.5
Public Wi-Fi and charging stations for smartphone/mobile technology
15.7 12.4 14.4 17.5 11.7 18.9 15.1 16.8
Rebates or financing to help buy clean electric vehicles
12.3 10.7 14.4 12.2 15.0 10.8 13.8 10.4
Smartphone applications for transportation services translated to languages other than English
10.9 7.4 9.5 12.0 9.1 12.4 10.2 11.4
Self-driving neighborhood shuttles to bring people to transit stops
9.9 9.9 11.1 9.4 12.0 8.5 9.6 10.4
Expansion of the Biketown bike-share program outside of central neighborhoods
8.6 11.6 6.6 8.8 10.3 7.5 9.8 6.6
Expansion of carsharing services that allow short-term vehicle rentals to more neighborhoods
8.0 8.3 7.4 7.9 9.1 7.5 9.4 6.1
More public outreach and education about different mobility options like carsharing, Biketown, etc.
7.4 5.8 6.2 7.9 7.6 7.3 6.2 8.8
More electric vehicle charging stations 6.6 12.4 7.4 4.9 8.2 5.4 7.7 5.6More public outreach and education around smartphone applications for transportation services
4.3 4.1 4.5 4.3 1.8 5.8 1.9 7.4
45 These preferences mirror qualitative responses collected in open ended survey responses and 6 comments made by focus group participants. Specifically, three of the five most popular policies 7 expand the capacity of residents to use their smartphones as tools to access mobility services. 8 The policies of expanding real-time communication between transit vehicles, investing in public 9 Wi-Fi and charging stations for smartphones, and ensuring translation of mobility apps to
10 multiple languages were named as specific barriers by focus group participants. 1112 Respondents were also asked about how they would want to receive such trainings and the clear 13 preference was for online materials. This result may be related to the fact that half of surveys 14 were carried out online, but the high rate of access to internet and smart phones indicated this 15 may be a best option nonetheless. Considering the cost and logistical challenge of in-person 16 trainings, those could be carried out in a more limited fashion, perhaps focusing on older 17 residents who did respond that they preferred printed materials. 1819 If in-person training were required, respondents were asked to give their preferences about how 20 they would want to receive that information. Those rankings highlighted public libraries, TriMet 21 facilities and in third place, community centers as the preferred locations and institutions to 22 convene such activities. It would be quite easy for the City of Portland to collaborate with

17
1 regional service providers such as TriMet or the Multnomah County Library to develop outreach 2 and educational programs about smart mobility options.
3 CONCLUSIONS4 We organize the key overall conclusions from these results by the original research questions 5 guiding this study. The first question was: “How can smart mobility technologies address the 6 current and future needs of transportation disadvantaged communities?”78 Various results from this study address this question. One of the most interesting takeaways was 9 how the low income and respondents of color (and others, though to a lesser extent) in East
10 Portland are highly diverse in their mode choices compared to their regional and national 11 counterparts. Lower vehicle ownership, lower incomes, and lower licensure rates mean that the 12 transportation disadvantaged communities in East Portland rely heavily on modes other than the 13 private automobile. Unfortunately, this also means they are able to reach fewer of the region’s 14 opportunities, as transit service is less dense outside of the regional core. As far as smart mobility 15 technologies can facilitate, and make cheaper and more convenient, alternatives to private 16 automobile ownership it is clear that smart mobility technologies have the potential to address 17 many of the current and future transportation needs of transportation disadvantaged 18 communities. Indeed, low income respondents and respondents of color not only chose more 19 diverse travel options, but they are more regular users of currently available mobility tools such 20 as smartphone applications for accessing public transportation and ridesharing services such as 21 Uber and Lyft. This pattern corroborates findings in the literature about the use of taxis and 22 TNCs among low-income and car-less households, seeking improved (but costly) mobility from 23 automobiles through these other means (e.g. Shaller 2016, Brown 2019, Dill et al. 2017). (The 24 important social justice questions surrounding TNC driver rights, earnings, etc. should not be 25 forgotten, though it is well outside of the scope of this discussion.) Considering the interest in 26 improving real-time public transportation information and scheduling applications, it seems that 27 smart mobility technologies are particularly poised to address those needs. Furthermore, low 28 income respondents and respondents of color had similar access to smartphones compared to 29 their counterparts (even though access to cell data may still be deficient). 3031 The second research question guiding this work was the following: “What are the barriers to 32 using smart mobility technologies experienced by different communities?” Several barriers were 33 highlighted in this work, most of which corroborate results from the wider literature. One barrier 34 is the lower access to drivers’ licenses, bank accounts and credit cards among lower income 35 respondents and respondents of color in East Portland. These disparities mirror national data on 36 these issues, and is a concern noted in much of the existing literature. While licensing may be 37 less relevant as new smart mobility services often replace individuals driving themselves, it is 38 still important as the current offerings include various carsharing options (and in some places e-39 scooters). Since integrating convenient payment systems, like credit cards, into the transportation 40 applications is a core feature of smart mobility systems, this disparity is a severe barrier to the 41 equitable transition to smart mobility. This disparity is also evident in how low income 42 respondents and respondents of color rely more heavily on paying cash on board for transit fares. 43 While there are some ways to address this problem, they tend to be less than ideal; Some systems 44 have begun to offer cash payment workarounds including making cash payments to drivers, 45 offering debit card programs, using money orders or paying in cash at retail locations to load

18
1 accounts using systems like “PayNearMe” (Shaller 2016). The case presented here further 2 corroborates the evidence that digital and banking access remain a serious issue for many 3 communities. Interestingly, this case differed from previous work 45 There is also the lower comfort in connecting financial information to applications and the lower 6 ownership of smart phones among Baby-Boomer respondents, similar to results found in the 7 Canadian study (Shirgaokar 2018). A transition to smart mobility, which may render traditional 8 single occupant automobile travel more costly or difficult, will be more challenging for these 9 Boomer respondents without an effort to train them. Shirgaokar (2018) also makes other
10 recommendations to improve the user experience and trust and adapt new mobility technologies 11 to the needs of older residents. 1213 This discomfort with sharing personal financial information should not be underestimated by 14 planners and city staff. As many low income and older community members are already in 15 precarious financial situations, identity theft or losing funds from online or smart phone accounts 16 could have devastating impacts. Older adults are under constant pressure from schemes to steal 17 identity and financial information. Higher income households can often absorb these losses or 18 use banks or credit card companies which forgive fraudulent activity when it happens against 19 their accounts. These insurances are not shared by everyone, so the idea of information security 20 should be taken quite seriously. This concern was expressed many times during the focus groups 21 and in open-ended survey responses.2223 Another barrier is the access to data and internet, an issue noted throughout the existing 24 literature. Higher income and NHW respondents had greater access to internet both at home and 25 at work and were less likely to need to reduce data use or cancel cell plans because of cost or 26 data restrictions. As the emerging smart mobility ecosystem will rely on smartphones and larger 27 data transmissions, these issues are especially important. Indeed, public Wi-Fi was the highest 28 ranked policy recommendation among the options offered for selection in the survey, and was 29 mentioned numerous times during the focus groups.3031 The third research question guiding this project was: “What potential solutions show the most 32 promise in overcoming these barriers?” The overall highest ranked recommendation from the 33 surveys was to facilitate public transportation information, scheduling and route finding through 34 improved real-time communication to users through smart applications and open data sharing 35 through APIs (even for private sector services). How this improves on current tools available is 36 an open question but for many public transit users facing crowding on certain routes or needing 37 additional room for strollers, carts or wheelchairs, better information about in-vehicle conditions 38 and crowding were common requests. It seems very much within the purview of smart mobility 39 applications to provide these improved tools, though it will also be important for mobility 40 companies and public transit operators to facilitate open data access and sharing through APIs – 41 something that is not currently available for TNCs and many other companies. 4243 Based on the survey responses but also the extensive comments received through the focus 44 groups and open-ended survey questions it was clear that more public support for data access 45 (such as though public Wi-Fi or information kiosks) was also a top priority. Policies or 46 investment to improve internet and data access could also be pinpointed to a small number of

19
1 households to yield a large reduction in this disparity. Also high priorities were to lower barriers 2 to purchasing or using electric vehicles and expanding translation for important transportation 3 applications into languages other than English. The latter recommendation was very common in 4 the focus group discussions, and would integrate clearly with the public mission of a publicly 5 managed smart mobility platform with the goal of providing universal access and usability. 6 While respondents preferred to receive trainings using online methods, if trainings or outreach 7 were to occur they preferred public spaces such as community centers, TriMet facilities, or 8 public libraries (in contrast with individual organizations or churches). 9
10 Overall, this case study largely corroborates previous research on these issues and points to some 11 significant and positive contributions that smart mobility technologies could have to improve the 12 mobility of transportation disadvantaged communities in Portland. As smart mobility 13 technologies facilitate mobility without the private automobile, this can improve transportation 14 systems already used by the transportation disadvantaged by improving service or lowering 15 costs. Still, there are formidable barriers, especially in access to credit, banking, and affordable 16 cell and internet service, which could leave many people behind. Just as the freeway, the suburb 17 and the private automobile left many behind, while few planners at the time predicted any 18 negative impacts, we can do better. This research project is part of an effort of anticipatory 19 governance for the Portland region: Understanding barriers and posing questions as the 20 technologies are being developed, and not after. Hopefully this case study can be relevant to 21 similar processes of smart mobility deployment in other cities around the world. 22

20
1 ACKNOWLEDGEMENTS2 This project was funded by grants from Forth, the 11th Hour Project (of the Schmidt Family 3 Foundation), and the National Institute for Transportation and Communities (NITC) at Portland 4 State University (Project #1163), a U.S. DOT University Transportation Center, with assistance 5 from the City of Portland.
21
1
2 REFERENCES
3 Acheampong, R.A., Thomoupolos, N., Marten, K., Beyazit, E., Cugurullo, F., & Dusparic, I. 4 (2018). Literature Review on the Social Challenges of Autonomous Transport. Short Term 5 Scientific Mission Report for COST Action CA16222 “Wider Impacts and Scenario 6 Evaluation of Autonomous and Connected Transport (WISE-ACT).7 Alessandrini, A., Campagna, A., Site, P. D., Filippi, F., & Persia, L. (2015). Automated Vehicles 8 and the Rethinking of Mobility and Cities. Transportation Research Procedia, 5, 145-160. 9 Brakewood, C. & Kocur, G. (2013). Unbanked Transit Riders and Open Payment Fare
10 Collection. Transportation Research Record, Volume 2351, pp. 133–141.11 Brown, A. (2019) Redefining Car Access, Journal of the American Planning Association, 85:2, 12 83-95. 13 Brown, A. (2018) Ridehail Revolution: Ridehail Travel and Equity in Los Angeles. UCLA 14 Doctoral Dissertation.15 Coalition of Communities of Color, Ecotrust, Futurewise, & 1000 Friends of Oregon (2017) 16 Regional Equity Atlas. http://www.regionalequityatlas.org/home 17 Dill, J., McNeil, N. & Howland, S. (2017) Peer-To-Peer Carsharing: Short-Term Effects on 18 Travel Behavior in Portland, OR. TREC-RR-1144. Portland, OR: Transportation Research 19 and Education Center.20 Dinning, M. & Weisenberger, T. (2017). Multimodal Transportation Payments Convergence–21 Key to Mobility. Disrupting Mobility, 121-133.22 Feigon, S. & Murphy, C. (2018) Broadening Understanding of the Interplay Among Public 23 Transit, Shared Mobility, and Personal Automobiles. Washington, DC: The National 24 Academies Press25 Federal Deposit Insurance Corporation (FDIC) (2018). 2017 National Survey of Unbanked and 26 Underbanked Households. https://www.fdic.gov/news/news/press/2018/pr18077.html 27 Federal Deposit Insurance Corporation (FDIC) (2018B). 2017 National Survey of Unbanked and 28 Underbanked Households – Appendix Tables. 29 Gehrke, S., Felix, A., & Reardon, T. (2018). Fare choices: A survey of ride-hailing passengers in 30 metro Boston. Metropolitan Area Planning Council Research Brief.31 Golub, A., M. Serritella, V. Satterfield & J. Singh. (2018) Community-Based Assessment of 32 Smart Transportation Needs in the City of Portland. NITC-RR1163. Portland, OR: 33 Transportation Research and Education Center (TREC).34 Governing.com. Vehicle Ownership in U.S. Cities Data and Map. 35 https://www.governing.com/gov-data/car-ownership-numbers-of-vehicles-by-city-map.html 36 Gruel, W. & Stanford, J. (2016). Assessing the Long-Term Effects of Autonomous Vehicles: A 37 Speculative Approach. Transportation Research Procedia, 13, 18-29.38 Grush, B. & Niles, J. (2017). Transit Leap: A Deployment Path for Shared-Use Autonomous 39 Vehicles that Supports Sustainability. Disrupting Mobility, 291-305.40 Hörl, S., Ciari, F., & Axhausen, K. (2016). Recent Perspectives on the Impact of Autonomous 41 Vehicles. Institute for Transportation Planning and System, 1-37.42 Howland, S., McNeil, N., Broach, J., Rankins, K., MacArthur, J., & Dill, J. (2017). Current 43 Efforts to Make Bikeshare More Equitable: Survey of System Owners and Operators. 44 Transportation Research Record, 2662(1), 160–167. https://doi.org/10.3141/2662-18

22
1 Iacobucci, J., Hovenkotter, K., & Anbinder, J. (2017). Transit Systems and the Impact of Shared 2 Mobility. Disrupting Mobility, 65-76.3 King, D & Saldarriaga, J. (2017). Access to Taxicabs for Unbanked Households: An Exploratory 4 Analysis in New York City. Journal of Public Transportation, 20 (1): 1-19. 5 Kodransky, M., & Lewenstein, G. (2014). Connecting Low-Income People to Opportunity with 6 Shared Mobility. Institute for Transportation and Development Policy and Living Cities. 7 https://www.itdp.org/wp-content/uploads/2014/10/Shared-Mobility_Full-Report.pdf 8 Kramer, A. & Goldstein, A. (2015). Meeting the Public’s Need for Transit Options: 9 Characteristics of Socially Equitable Transit Networks. Institute of Transportation Engineers
10 Journal, 85:9, 23-30.11 Litman, T. A. (2017). Autonomous Vehicle Implementation Predictions: Implications for 12 Transport Planning. Victoria Transport Policy Institute, 1-23.13 Lubitow, A., Mahmoudi, D., & Lillard, L. (2016). Understanding Spatial Equity in Portland, 14 Oregon. 1-27. Portland State University Working paper. 15 https://www.pdx.edu/sociology/sites/www.pdx.edu.sociology/files/Spatial%20Equity%20Re16 port.pdf 17 Mattioli, G. & Colleoni, M. (2016). Transportation Disadvantage, Car Dependence and Urban 18 Form. Understanding Mobilities for Designing Contemporary Cities, 171-190.19 McNeil, N., Dill, J., MacArther, J., Broach, J., & Howland, S. (2017). Breaking Barriers to Bike 20 Share: Insights on Equity. Transportation Research and Education Center (TREC). 1-20 21 OPAL. (2017) Transportation survey. http://www.opalpdx.org/2017/08/transportation-needs-22 assessment/ Accessed July. 5, 2018. 23 McGuckin, N. & Fucci, A. (2018) Summary of Travel Trends: 2017 National Household Travel 24 Survey. Washington D.C.: Federal Highway Administration (Report FHWA-PL-18-019).25 Metro (Portland, Oregon) (2018) 2018 Regional transportation plan – Public Review Draft, 26 Appendix E – Transportation Equity Evaluation 27 https://www.oregonmetro.gov/sites/default/files/2018/06/29/RTP-28 Appendix_E_2018_RTP_Transportation_Equity_Evaluation_with_attachments.pdf Accessed 29 July. 5, 2018.30 Metro (Portland, Oregon) (2018B) Oregon Metro’s Regional Snapshots 31 https://www.oregonmetro.gov/regional-snapshots Accessed July 7, 2018.32 Pew Research Center (Pew) (2015) The Smartphone Difference. Available at: 33 http://www.pewinternet.org/2015/04/01/us-smartphone-use-in-2015/34 Portland Bureau of Transportation (PBOT) (2018) Smart Cities Framework 35 https://www.portlandoregon.gov/transportation/6999936 Rayle, L., Dai, D., Chan, N., Cervero, R., & Shaheen, S. (2016). Just a better taxi? A survey 37 based comparison of taxis, transit, and ridesourcing services in San Francisco. Transport 38 Policy 45, 168–178.39 Rode, P., Floater, G., Thomopoulos, N., Docherty, J., Schwinger, P., Mahendra, A., & Fang, W. 40 (2017). Accessibility in Cities: Transport and Urban Form. Disrupting Mobility, 239-273.41 Schaller, B. (2016). Between public and private mobility examining the rise of technology-42 enabled transportation services: Taxi, sedan, and limousine industries and regulations. TRB 43 Special Report 319. Washington, DC: Transportation Research Board44 Shaheen, S., Bell, C., Cohen, A., & Yelchuru, B. (2017). Travel behavior: Shared mobility and 45 transportation equity. Federal Highway Administration Report No. PL-18-007.

23
1 Shirgaokar, M. (2018) Expanding Seniors’ Mobility through Phone Apps: Potential Responses 2 from the Private and Public Sectors. Journal of Planning Education and Research, 1. 1.3 TriMet (2017) Communities of concern, definitions. 4 https://www.arcgis.com/home/item.html?id=a411529283e34385a853f41dc8742e29 5 Accessed July. 5, 2018.6 Velaga, N., Beecroft, M., Nelson, J., Corsar, D., & Edwards, P. (2012). Transport poverty meets 7 the digital divide: accessibility and connectivity in rural communities. Journal of Transport 8 Geography, 21, 102-112.9