assessing the effectiveness of dynamic symbols in...
TRANSCRIPT

DOI 101179000870404X13300
The Cartographic Journal Vol 41 No 3 pp 229ndash244 December 2004copy The British Cartographic Society 2004
R E F E R E E D P A P E R
Assessing the Effectiveness of Dynamic Symbolsin Cartographic Communication
Poh-Chin Lai and Anthony Gar-On Yeh
Department of Geography The University of Hong Kong Pokfulam Road Hong KongEmail pclaihkucchkuhk Centre of Urban Planning and Environmental Management The University of Hong Kong Pokfulam RoadHong KongEmail AnthonyYehhkucchkuhk
The age of the Internet poses new challenges to cartography While cartographic animation has become a practicalalternative it is mostly used to depict both spatio-temporal and non-temporal changes The paper concentrates on the use ofdynamic symbols on a static base map A visual test was carried out to obtain some perspectives about the cartographiccommunication of blinking point and line symbols The results confirmed that dynamic symbols tended to attract the atten-tion of the users in general and even in situations when the foregroundndashbackground contrasts were poor Their effectivenesswas more pronounced with symbols of a larger size but tended to diminish with an increasing number of blinking symbols Itwas also observed that users were able to perceive differences in the frequency of flickering particularly when the variationwas large The line animation method (marquee and grow-out) did not yield a substantial difference in visual responses inthe case of blinking line symbols
1 INTRODUCTION
Internet mapping has caused a shift in the mappingparadigm mdash from the static illustration to lively animationThe early cartography of staticprinted maps aimed prima-rily at achieving a balance between maximizing the amountsof contained information and satisfying a non-cluttered mapdesign The use of multimedia supplements (such as photoand video clips by means of lsquomouse-onrsquo option) and theconcern for temporal variation as further design consider-ations in the digital graphics world have caused a seriousreview of the cartographic design principles (Kraak andBrown 2001 Cartwright et al (eds) 1999 MacEachrenet al 1998 Wood and Keller 1996 Monmonier andGluck 1994) Various cognitive and usability studies ofanimated or dynamic maps in recent years could be a sign ofrekindled interests in the study of map design Kousoulakouand Kraak (1992) examined the communicative aspects ofthe spatio-temporal maps McGuinness (1994) reportedthat expert and novice use of visualization tools can differ interms of not only extracting meaning from a single display ofpatterns but also in composing and sequencing patternsMonmonier and Gluck (1994) identified the range of userreactions preferences likes and dislikes of various techni-ques of animations and dynamic representations Patton andCammack (1996) appraised the effects of sequencingscripts of choropleth maps Edsall et al (1997) examinedthe relative effectiveness of three types of temporal legends
to communicate information and facilitate spatio-temporaldata presentation and exploration MacEachren et al(1998) further extended the use of geographic visualizationmethods in exploratory data analysis
Maps have reportedly become more widely distributedover the Internet simply because it is cheaper than printingthem on paper and shipping them (Peterson nd Cart-wright 1997 Plewe 1997 Green 1997) There is also theadded advantage of dynamic presentation and the flexibilityof customizing these maps to onersquos satisfaction The termlsquodynamic mappingrsquo has at least two meanings (i) dynamismin terms of the currency of data presentation or real-timemapping and (ii) dynamism in terms of the vigour ofsymbolization brought about by motion andor animationIn the first instance a map is renewed typically at set timeintervals to convey the most up-to-date information tothe readers Some common applications involve traffic mapscurrent up to the minute to communicate the presenttraffic conditions weather maps to reveal subtle changes intemperature and barometer readings within the hour andthe continuous tracking of hurricanes as they sweep acrossthe communities (Appendix 1 mdash Real-time maps) In thesecond instance much has been said about the animation ofmaps to display spatio-temporal or non-temporal changesthrough a series of maps presented in quick succession(Appendix 1 mdash Temporal and non-temporal maps) Spatio-temporal maps show spread of diseases or urban sprawl overtime as a series of maps in succession The rate of change and
230 The Cartographic Journal
motion over a particular area may alert the concentration ofan event in space Non-temporal maps highlight differentvisual impacts as a result of dissimilar display methods(as in data classification techniques for statistical maps) orsequential displays of picture frames (as in the progressivetransformation of landscapes in virtual tours)
Animation has been used to enhance visualization ofchanges motion and drawing attention to these processes(Mitas et al 1997 Peterson 1995 Campbell and Egbert1990 Shortridge 1982) and Internet mapping has enco-uraged the development of a dynamic and interactivevisualization environment (Cartwright et al (eds) 1999DiBiase et al 1994 Mitasova et al 1993 Dorling1992 Buja et al 1991 Becker et al 1988) While anima-tion has become more common a significant numberof interactive traffic maps on the Internet (Appendix 2)seem inhibited by cartographic principles established forthe making of a single map of the static nature For exampletraffic congestion maps are displayed with point andline symbols Point symbols take the form of geometric(eg circles squares diamonds or triangles) or iconic
rep-resentation to indicate the presence of traffic incidentsor roadwork projects These point symbols are colouredmostly in red or in high contrast against the backgroundimage to become more visible Line symbols are usedto represent road segments and coloured to indicate differ-ent speeds or traffic flows following the convention fortraffic signalling devices green to flag free-flowingor normal traffic yelloworange for queues and
redblack for heavy congestion These maps havefrequent updates of 1ndash2 new frames per minute mdash eachframe may contain new point symbols to indicate the latestoccurrences of traffic incidents
While static in nature these real-time traffic maps couldarguably be made more effective through dynamic symbol-ization principally to aid geographic and exploratory dataanalyses (Monmonier 1996 Monmonier and Gluck 1994)An example of a city map laden with streets and landmarkscould have blinking points added to alert its users about thelocations of lsquoevents-of-the-dayrsquo The blinking points wouldvary locations from day to day and pointing to selectedpoints would display further details of an event on the spotIn this case a street map would serve as a static base mapupon which blinking points were added to highlight loca-tionsjunctions of traffic incidents in real-time Moreoverspecific segments of a road could be animated to alertclosure or a severe delay The use of animated symbolsappeared quite effective in drawing attention of the readersespecially when they needed to get information quickly onthe Internet or mobile computing devices such as PDAsmobile phones and vehicle navigators There are howeverthe questions of how many blinking symbols are consideredtoo many and at what rate of blinking is considered suitableThere is clearly a need to study the effectiveness of dynamicsymbols in cartographic communication particularly whenthe Internet has emerged as the preferred platform andmedium to disseminate spatio-temporal and real-timeinformation
2 VISUAL VARIABLES
Much work has been done to deal with issues of com-munication effectiveness and symbolization on static mapsVisual experiments were carried out to test legibility of pointsymbols on printed tourist maps against various factors suchas colour association resemblance between the object andsymbol familiarity or convention size and subject charac-teristics (Clarke 1989 Blok 1987 Forrest and Castner1985) Evaluation of legibility and effectiveness of graphicsymbols on a computer screen was evident in the 1980s(Remington and Williams 1986) More recent perceptionexperiments were attempted on computer-based touristmaps to test symbol effectiveness against a white back-ground in map context and some selected factors (Leungand Li 2002 Morrison and Forrest 1995) These experi-ments made use of either percent correct responses oridentification times as a measure or indicator of symboleffectiveness
Dynamic map representation in addition to designconsiderations of static maps must also take into accountthe presentation style and time delay factors of animatedsymbols (Ehlschlaeger et al 1997 Hearnshaw and Unwin1994 DiBiase et al 1992) Hayward (1984 p 9) identi-fied seven visual or graphical variables of animationsize shape position speed viewpoint distance scene andtexture Gersmehl (1990) further classified animation intoframe-based and cast-based Most temporal displays areframe-based in which many frames or pages are displayedin sequence for a few seconds of animation Cast-based ani-mation comprises many lsquocelsrsquo per frame Individual cels aremade to change position shape or texture for the illusion ofmotion Dynamic symbols operate as a form of cast-basedanimation in which the symbols are made the foregroundcels that flash against a background cel (or a static base map)
Different combinations of the graphical variables canproduce a variety of animated point line or area symbolsWhile numerous authors have provided guidance onselected visual variables of a dynamic symbol (Couclelis1998 Kraak 1998 MacEachren and Olson 1996 DiBiaseet al 1992) some have suggested that blinking symbols areproblematic (Monmonier and Gluck 1994 Dorling 1992)Koussoulakou and Kraak (1992) suggested that an animatedmap may not necessarily increase the accuracy of carto-graphic communication but it can enable users to receivethe message in shorter time Kanwisher and Driver (1992)argued that visual attention could be directed to a locationor to one or more moving objects While the exact neuralmechanisms to achieve this have remained debatable itappears to have become acceptable to use animation as avisual stimulus particularly for the online and the visualsystems
Given that Internet users are not very patient1 the ulti-mate goal is to optimize the map to make it easy to interpretand to improve the map as a form of data representationand communication system In this sense the use of blinkingsymbols as a means to call users attention in a short time iswarranted A few essential questions needs addressing
bull Density Is there an optimum number offlashing or animated symbols on asingle map
231Dynamic Symbols in Cartographic Communication
bull Contrast Does contrast between animatedsymbols and the map base matter
bull Frequency Is it possible to associate magnitudesto different flickering or animationspeeds
bull SizeThickness What effects do symbol sizes or linethickness have on perception
bull Method Does one animation method appearmore effective than others
3 DYNAMIC SYMBOLS AND THEIR EFFECTIVENESS ASVISUAL CLUES
31 Background
A visual experiment was designed to assess the utility ofblinking point and line symbols collectively referred to asdynamic symbols on static base maps The test comprisedthree parts and was carried out in a totally interactive andcomputerized setting (sample questions from the test areavailable at httpgeoghkuhkpclaiAnimSymhtml)The program was powered by JavaScript and operated ina Local Area Network which supported 20 simultaneoususers A pre-test with 45 students (none of whom becamethe test subjects) provided feedbacks to modify the test to itspresent state The pre-test suggested making allowance forsubjects to read instructionsquestions at their own paceA start button was thus added at the beginning of each testto allow subjects to start the clock having read the instruc-tionsquestions and when they are ready A short practicewas also added to familiarize subjects with the procedure
The visual map test was conducted in May 2001 on agroup of 83 (out of 103) students enrolled in a first yearGeography course which satisfied the University broaden-ing requirement At the beginning of the test the subjectswere asked a few questions about their map reading habitsvisual abilities and computer usage to compile a profile ofthe test subjects The students came from seven differentfaculties (Architecture Arts Business and EconomicsEducation Engineering Science Social Sciences) and hadvaried backgrounds The group of 83 test subjects could notbe considered as homogeneous even though they all wereenrolled in an lsquoIntroductory Map Usersquo course The majorityof test subjects were female (65) and occasional users(63) of maps (Table 1) Their ages ranged between 17 to29 of which 69 wore glasses or contact lenses but with nocolour blindness reported Over 90 of the subjects wereregular users of the Internet This combination of subjectsmore or less accounted for the diversity of Internet users 2
The test was made a bonus and voluntary exercise for thecourse and it was conducted close to the end of the 12-weeksemester after the students had been introduced some basicmap reading skills The subjects were asked to reserve anhour time slot and could login the system at any time duringthe 5-day test period to undertake the visual map test Thetest session lasted 30ndash45 minutes on average A brief instruc-tion was provided at the beginning of each question andthe subjects would press the start button to initiate each testReaction TIME (in milliseconds) and the ACCURACY (ienumber of trials needed to obtain the correct response) wererecorded for each user and stored in a data file There were
three parts to the visual experiment (A) static versus blink-ing point symbols (B) blinking speeds of point symbols and(C) animated line symbols
Part A of the test was comprised of a series of visual teststo evaluate if there was a statistically significant difference inthe reading times between static and blinking point symbols(Figure 1) The effects between static and blinking pointsymbols size and number of symbols and foreground-background contrast were tested In this part of the test weattempted to evaluate the following (i) if blinking pointsymbols were more visible compared to their static counter-parts (ii) whether the size of a symbol has an effect onvisibility (iii) was there a threshold on the number of blink-ing point symbols a display could sustain until the flickeringbecame distracting (iv) would classificationcombinationof symbols help in a situation where many point symbolswere needed and (v) would blinking enhance the visibilityof a symbol when the foregroundndashbackground contrast waspoor
The subjects were required to undertake simple tasksof locating point symbols on the computer screen The firstscreen contained a static red dot on a white screen and thesubjects were asked to identify its presence by clicking on itsposition on the screen The second screen contained a blink-ing red dot on a white screen and the subjects must identifyits location by clicking on it The times needed to locate thepair of static and blinking symbols were recorded separatelyas a measure of experimental control (Question 1 Figure 1)The experiment involving a pair of static and blinkingpoint symbols was repeated to examine the effect of a largersymbol size (Question 2 Figure 1) It continued with 5static symbols on a white screen followed by 5 blinkingsymbols (Question 3 Figure 1) The times required to com-plete these tasks were recorded The same was repeated for15 dot symbols 15 classed symbols (5 each of dots squaresand triangles) and for 5 dot symbols against two types ofbackground mdash a reddish base map or a bluish base photo(Questions 4ndash7 Figure 1)
The point symbol test above was extended in Part Bto study the perception of blinking speeds The primaryresearch question concerned the ability of a map userto differentiate point symbols in varied blinking rates(Figure 2) The findings might suggest a suitable range ofblinking rates as visual cues on a traffic map to alert travellers
Table 1 A breakdown of test subjects by map use habits
Code Map Use Habits Count Description
0 Competent 4 You know a variety of maps andare very competent in readingthem
1 Comfortable 22 You are familiar with maps andwould prefer to use maps whenthey are available
2 Occasional 52 You know how to use a mapand try to use maps when theyare available
3 Inexperienced 5 You rely mostly on non-mappedcommunication even when mapsare available
4 Outsider 0 You have not used a map onyour own
Total 83
232 The Cartographic Journal
about changes in road conditions caused by unscheduledtraffic events (such as collisions breakdowns emergencyroadwork vehicle fire spill road conditions etc) Theblinking symbols were presented in pairs and in a randomorder and the test subjects were asked to select from a list ofcombination of speeds (same or two or three or five times
the speed ie 1x or 2x or 3x or 5x) until the correct answerwas found (Question 1 Figure 2) The reaction timesrequired to complete these tasks were recorded The per-ception of blinking speeds was also tested on larger symbols(Question 2 Figure 2) and on static bases of differentcontrast levels (Questions 3ndash4 Figure 2)
Figure 1 Part A Point Symbols (Static versus Blinking)
233Dynamic Symbols in Cartographic Communication
A similar test was implemented in Part C to examine theperception of animated line symbols (Figure 3) The attempthere was to draw a difference between line symbols of vary-ing lengths thickness and animation styles and whethersuch variables would affect the perception of animationspeeds It was hoped that the experiments might suggestsome guidelines for the design of online congestion maps(see Appendix 2) that make use of different line symbolsto signal various levels of traffic flow Two methods ofanimation for line symbols were used in the experiment (i)marquee or interlaced flashing and (ii) grow-out or incre-mental lengthening of lines within bounds (see httpgeoghkuhkpclaiLineSymhtml) The effects of linelength and thickness were tested against three animationspeeds (two or three or five times the speed ie 2x or 3xor 5x) As before the animated symbols were displayedin random pairs and the subjects were presented a list ofanswers to choose from until the correct response wasfound The reaction times required to complete these taskswere recorded
32 Analyses and Results
321 Part A
The results of Part A were summarized in Figures 4ndash5 andCharts 1ndash4 Figure 4 and Chart 1 indicated that the meanreaction times for reading blinking symbols (in quantitiesof 1 5 or 15 and with the exception of 15-classed) weregenerally a smaller value than those of static symbols indi-cating that animation did help in drawing attention Theexperiment also revealed that a larger symbol size improvedvisibility In fact we could say that a larger symbol size
was eminent in aiding visibility as evident by a great reduc-tion in the mean reading times (from 2521 down to 899milliseconds for static symbols and from 1149 down to 849milliseconds for blinking symbols) The experimental resultalso inferred that animation might not be essential whensymbols were visibly large given the relatively similar meanreading times between the static and blinking symbols Wealso examined if there was disparity in the reading times bygender groups and found no significant difference
Chart 2 was compiled to examine if there was a differencefor subjects of different map use habits (as identified inTable 1) in seeing the symbols It was indicated that lsquoinexpe-riencedrsquo users needed more time in all situations The differ-ence in the mean reading times varied by not more than248 seconds amongst the various groups with five or fewersymbols When the number of symbols increased readingtimes increased correspondingly for all levels of map usersand appeared to follow a curvilinear upward pattern (Chart3) Blinking in a group of 15 symbols seemed more usefulfor inexperienced users when the symbols were not classified(ie only one symbol type was used) Symbol classification(ie the use of a combination of point symbols where15 symbols were displayed as 5 squares 5 circles and 5triangles) seemed particularly confusing for inexperiencedusers and worsen when combined with animation
Even though the experiment did not yield an optimumnumber of animated symbols on a single display it appearedthat blinking was still desirable with 15 unclassed symbolsIt was evident that when the size of a point symbol hadremained constant the blinking symbols did improve visibil-ity Symbol classification or visual layering which makesa lot of cartographic sense in terms of organizing a large
Figure 2 Part B Point Symbols (Blinking Rates on Different Backgrounds)
234 The Cartographic Journal
Figure 3 Part C Line Symbols (Length vs Thickness vs Animation Method)
235Dynamic Symbols in Cartographic Communication
number of like symbols into a few but smaller groups ofdistinctive symbols appeared to have similar effects asanimations for other than inexperienced users We may inferfrom this experiment that blinking was preferred to symbolclassification particularly if the display was meant for thegeneral public or non-regular map users
With regard to the question on whether blinking wouldenhance the visibility of a symbol when the foreground-background contrast was poor we can infer from Figure 5and Chart 4 that blinking symbols tended to improve visibil-ity (with statistical significance) when the contrast waspoor (eg red symbols on a reddish base map) When theforegroundndashbackground contrast was reasonably distinctive(eg red symbols against a bluish background or bluesymbols against a reddish background) we found that blink-ing symbols did not enhance the mean reaction times whencompared with their static counterparts We can thus con-clude that blinking is an effective method to enable pointsymbols to stand out against a submerged background
322 Part B
The results of Part B were summarized in Figures 6ndash7 andCharts 5ndash6 Figure 6 and Chart 5 indicated that subjectswere able to differentiate within a shorter time span blinking
speeds in larger (ie 4 mm as opposed to 2 mm in size)symbols When the rate of blinking was kept constantsymbol sizes seemed to make a difference and subjects coulddetermine blinking speeds more readily (ie in shorter timeand correct in the first attempt) in larger symbols
It also appeared that a situation of extreme high contrast(red blinking symbols against a white background) mightwork against the perception of speeds As perception islargely determined by the sensitivity of human eyes tovarious graphical objects some graphical codes may notget through as readily with interference Nonetheless theexperiment showed that it was possible to associate blinkingrates for a pair of point symbols on different backgroundsFigure 7 indicated significant differences in associatingblinking rates between white and image (map or photo)bases We could also infer from the results that map or photobackgrounds would not adversely disadvantage the readingof blinking rates There was no observable difference inspeed appreciation between map and photo backgroundsexcept when the blinking rate was fast Indeed it wasevident that the animation speed was more comprehensibleagainst image backgrounds as the mean reading times werebetter than those against the white background
Figure 4 Results of Part A Mean response time for static versus blinking point symbols
Figure 5 Results of Part A Static versus Blinking Point Symbols on Different Backgrounds
236 The Cartographic Journal
Chart 1 Mean response time for static and blinking point symbols
Chart 2 Mean response time by map use habits
Chart 3 Mean response time ndash 1515 point symbols
Chart 4 Effect of colour contrast on point symbols
237Dynamic Symbols in Cartographic Communication
Figure 6 Results of Part B Point Symbols (Blinking Rates on Different Backgrounds)
Figure 7 Results of Part B Point Symbols (Significance Tests of Blinking Rates on Different Backgrounds)
Chart 5 Mean response time for reading blinking speeds of point symbols
Chart 6 also revealed that inexperienced userstended to need more time in reading blinking speeds Theperformance of comfortable and occasional map users
seemed less consistent however It was also clear thatblinking rates two times apart were most confusingto interpret whereas it was generally easier to associate
238 The Cartographic Journal
values for pairs of symbols with a larger variation (ora difference of 3 or 5 times) in the blinking rates Theexperiment would suggest that different blinking ratescould be used to signal different messages (such as variationsin the degree of urgency or seriousness) although wedid not test for the value association (whether a fasterblinking rate would connote a higher degree of urgencyor seriousness)
323 Part C
The results of Part C were summarized in Figures 8ndash9 andCharts 7ndash8 Figure 8 showed that line thickness and variablelengths had a significant impact on the perception of anima-tion speeds when the animation method was held constantIt also suggested that the effect of line thickness on theperception of animation speeds seemed more significantwhen animation speeds were fast Chart 7 illustrated
Chart 6 Mean response time for reading blinking speeds by map use habits
Figure 9 Results of Part C Line Symbols (Effect of Thickness by Animation Method)
Figure 8 Results of Part C Line Symbols (Length vs Thickness by Animation Method)
239Dynamic Symbols in Cartographic Communication
that the Grow-out method for line animation required lesstime to differentiate speeds and seemed easier in relatingmagnitudes It was also observed that thicker lines were lessambiguous in projecting differences in animation speeds
Figure 9 revealed that when the line length was keptconstant there was no difference in speed appreciationbetween the two animation methods except in the caseof slower-flashing thick lines There was also an observabledifference in the perception of animation speeds by theMarquee and Grow-Out methods on line symbols of variablelengths when line thickness had remained constant
A comparison among subjects of differing map use habitsindicated that both competent and inexperienced usersfound the Marquee method of line animation more difficultto comprehend in comparison with the Grow-out method(Chart 8) The other groups of users were less consistentin their readings although the Grow-out method seemedto have an edge over the Marquee method in terms of read-ability as shown by the faster reaction times It was alsoclear that a thicker line symbol tended to help in the appre-ciation of animation speeds irrespective of the methods ofanimation
Chart 8 Mean response time for reading linear symbols by map use habits
Chart 7 Mean response time for reading animation speeds of linear symbols
240 The Cartographic Journal
4 DISCUSSION
Findings of our visual experiment seemed to confirm thegeneral expectation First we found that dynamic symbolswere more visible compared to their static counterpartseven in situations where the foreground-background con-trast was poor While we were unable to identify a thresholdon the number of blinking symbols a display could sustainbefore the flickering became distracting (ie the trend linein Chart 3 would show a turning point with a sharp increasein the reaction time) we managed to show that readingtimes increased substantially for a larger number of symbolsalthough the performance was also a function of map useabilities
Whereas the classification of symbols makes excellentcartographic sense when a large number of symbols wereneeded on a single display we found that blinking or ani-mated symbols were equally if not more readily discernableIn fact we would not recommend simultaneous use of ani-mation and symbol classification because the combinationseemed to increase the level of reading complexity forinexperienced users
Our experiment revealed that subjects with differentmap use experiences could differentiate between dissimilaranimation speeds although inexperienced users had greaterdifficulties It was shown that less time was needed to discernanimation speeds of a larger variation (ie 3 or 5 times indifference) Generally speaking larger symbol sizes (ie 4mm as opposed to 2 mm) and thicker lines (ie 9 pixel versus3 pixel in width) were found easier to read and they werealso instrumental to the interpretation of animation speeds
With reference to linear symbols our findings may not beconclusive as only two methods of animation (ie Marqueeand Grow-out) were tested It was indicated that the meth-ods of animation had some effect on value association givendiffering reaction times of statistical significance for longerlines All things being equal the Grow-out method wasfound easier to comprehend than the Marquee method inanimating line symbols as reflected by faster reading times
Our experiment was targeted to address very basicquestions about animated symbols (i) Is there an optimumnumber of flashing or animated symbols on a single mapOur result was inconclusive although we were able to showthat 15 blinking point symbols on a single display were stillacceptable (ii) Does contrast between animated symbols andthe map base matter We managed to show that contrastdid matter in a static map representation but animationblinking symbols improved visibility even in a low contrastdisplay (iii) Is it possible to associate magnitudes to differentflickering or animation speeds Our experiment demon-strated that users were able to discern animation speeds ofa larger variation (ie 3 or 5 times difference in speeds) forboth point and line symbols (iv) What effects do symbol sizesor line thickness have on perception We learnt that a largersymbol of 4 mm in size and a thicker line symbol of 9 pixelwide were preferred as they required less time to read andincurred a higher degree of accurate reading (v) Does oneanimation method for line symbols appear more effective thanothers While we were not able to make specific recommen-dations it appeared that different animation methods hadvarying effects on symbol readability and more tests arewarranted
It is hoped that the results from this research will bebeneficial to future implementation of hypermedia and web-based maps for conveying real-time traffic conditions andother spatial-temporal visualizations We would have likedthe experiment to include more tests on image bases butwas constrained by the duration of the experiment to within45 minutes Future studies of this type should examinefurther the issues of simultaneous use of point and linesymbols There should also be questions to identify howmuch or little of the animation the subjects would favourA slider bar to allow the subjects to choose their preferredanimation speeds in an interactive situation for examplewould enable us to collect specifications for more effectiveanimated displays
ACKNOWLEDGEMENT
The research was supported in part by the Area of Excellencein Information Technology Grant from the UniversityGrants Committee of the Hong Kong Special Administra-tive Region (HKU Project Code AOE9899EG01)
ENDNOTES1 According to World Wide Web User Statistics (httpwww
why-notcomcompanystatshtm) 40 of online users watchTV and PC screens simultaneously 12 of the people remember abanner ad from a website and 10 of the people remember a TV ad
2 In August 1996 a comprehensive survey by CommerceNet AndNielsen (httpwwwcommercenetworkpilotnielsen_96exechtml) found that Internet access in the United States andCanada was up by 50 from AugustSeptember 1995 (23 millionestimated users) to MarchApril 1996 (34 million) The survey alsofound that new internet users lsquoshare a different profile from thosereported earlier indicating that the Internet market is wideningto include a range of user typesrsquo The StudentNet (httpwwwstudentnet) also reported that around 98 of the 88 millionfour-year college students in the US had free access to the Internetand spent more time online than any other group mdash about five hoursper week
REFERENCES
Becker R A Cleveland W S and Wilks A R (1988) lsquoDynamicgraphics for data analysisrsquo Dynamic Graphics for Statisticsed by Cleveland W S and McGill M E pp 331ndash50Wandsworth California
Blok C (1987) lsquoTesting symbols on a Dutch tourist map scale 150000rsquo ITC Journal 1 67ndash71
Buja A McDonald J A Michalak J and Stuetzle W (1991) lsquoInter-active data visualisation using focusing and linkingrsquo in ProceedingsVisualisation lsquo91 IEEE San Diego CA pp 156ndash63
Campbell C S and Egbert S L (1990) lsquoAnimated cartographyThirty years of scratching the surfacersquo Cartographica 27 24ndash46
Cartwright W Peterson M P Gartner G (eds) (1999)Multimedia Cartography Springer-Verlag Berlin HeidelbergGermany
Cartwright W (1997) lsquoNew media and their application to theproduction of map productsrsquo Computers and Geosciences 23447ndash56
Clarke L M (1989) lsquoAn experimental investigation of the com-municative efficiency of point symbols on tourist mapsrsquo TheCartographic Journal 26 105ndash10
Couclelis H (1998) lsquoWorlds of information the geographic metaphorin the visualisation of complex informationrsquo Cartography andGIS 25 209ndash20
241Dynamic Symbols in Cartographic Communication
DiBiase D MacEachren A M Krygier J B and Reeves C (1992)lsquoAnimation and the role of map design in scientific visualisationrsquoCartography and GIS 19 201ndash14
DiBiase D Reeves C Krygier J MacEachren A M von WyssM Sloan J and Detweiller M (1994) lsquoMultivariate display ofgeographic data Applications in earth system sciencersquo inVisualisation in Modern Cartography ed by MacEachren A Mand Taylor D R F pp 287ndash312 Pergamon Oxford
Dorling D (1992) lsquoStretching space and splicing time From carto-graphic animation to interactive visualisationrsquo Cartography andGIS 19 215ndash27
Edsall R Kraak M J Peuquet D and MacEachren A M (1997)lsquoAssessing the effectiveness of temporal legends in environmentalvisualisationrsquo Proceedings of GISLIS lsquo97 Cincinnati 28ndash30October 1997 pp 677ndash85
Ehlschlaeger C R Shortridge A M Goodchild M F (1997)lsquoVisualizing spatial data uncertainty using animationrsquo Computersin Geosciences 23 387ndash96
Forrest D and Castner H W (1985) lsquoThe design and perceptionof point symbols for tourist mapsrsquo The Cartographic Journal 2211ndash19
Gersmehl PJ (1990) lsquoChoosing tools nine metaphors of four-dimensional cartographyrsquo Cartographic Perspectives 5 3ndash17
Green D R (1997) lsquoCartography and the Internetrsquo TheCartographic Journal 34 23ndash27
Hayward S (1984) Computers for Animation Focal Press LondonHearnshaw H M and Unwin D J (eds) (1994) Visualisation in
Geographic Information Systems John Wiley amp Sons New YorkKanwisher N and Driver J (1992) lsquoObjects attributes and visual
attention Which what and wherersquo Current Directions inPsychological Science 1 26ndash31
Koussoulakou A and Kraak M J (1992) lsquoSpatio-temporal maps andcartographic communicationrsquo The Cartographic Journal 29101ndash08
Kraak M J (1998) lsquoThe cartographic visualisation process frompresentation to explorationrsquo The Cartographic Journal 3511ndash15
Kraak M J and Brown A (2001) Web Cartography Developmentsand Prospects Taylor amp Francis New York
Leung L F and Li Z (2002) lsquoExperimental evaluation of theeffectiveness of graphic symbols on tourist mapsrsquo Cartography 3111ndash20
MacEachren A M and Olson J M (1996) lsquoSome truth with mapsa primer on symbolisation and designrsquo The ProfessionalGeographer 48 118ndash23
MacEachren A M Boscoe F P Haug D and Pickle L W (1998)lsquoGeographic visualisation designing manipulable maps for explor-ing temporally varying georeferenced statisticsrsquo Proceedings ofIEEE Information Visualisation rsquo98 Symposium pp 87ndash94Reliegh-Durham NC Oct 19ndash20 1998
McGuinness C (1994) lsquoExpertNovice use of visualisation toolsrsquo inVisualisation in Modern Cartography ed by MacEachren A Mand Taylor D R F pp 185ndash200
Pergamon OxfordMitas L Brown W and Mitasova H (1997) lsquoRole of dynamic
cartography in simulations of landscape processes based on multi-variate fieldsrsquo Computers and Geosciences 23 437ndash46
Mitasova H Brown W Gerdes D P Kosinovsky I and Baker T(1993) lsquoMultidimensional interpolation analysis and visualisationfor environmental modellingrsquo Proceedings GISLIS lsquo93 vol 2Minneapolis pp 550ndash56
Monmonier M (1996) lsquoMaps that speak for themselvesrsquoMarketing Tools Magazine Cowles Business Media httpwwwmarketingtoolscompublicationsmt96_mt9603_mt9603MD03htm
Monmonier M and Gluck M (1994) lsquoFocus groups for designimprovement in dynamic cartographyrsquo Cartography and GIS21 37ndash47
Morrison C and Forrest D (1995) lsquoA study of point symbol designfor computer based large scale tourist mappingrsquo The CartographicJournal 32 126ndash36
Patton D K and Cammack R G (1996) lsquoAn examination ofthe effects of task type and map complexity on sequenced andstatic choropleth mapsrsquo in Cartographic Design theoretical andpractical perspectives ed by Wood C H and Keller C P JohnWiley amp Sons Chichester pp 237ndash52
Peterson M P (1995) Interactive and Animated CartographyPrentice Hall Englewood Cliffs NJ
Peterson M P (nd) lsquoCartography and the Internet implicationsfor modern cartographyrsquo httpmapsunomahaeduNACISpaperhtml
Plewe B (1997) GIS Online Information Retrieval Mappingand the Internet OnWord Press Sante Fe NM
Remington R and Williams D (1986) lsquoOn the selection andevaluation of preferred shapes for warning labelsrsquo Human Factors28 407ndash20
Shortridge B G (1982) lsquoStimulus processing models from psychol-ogy can we use them in cartographyrsquo American Cartographer 9155ndash67
Wood C H and Keller C P (eds) (1996) Cartographic Designtheoretical and practical perspectives John Wiley amp SonsChichester
242 The Cartographic Journal
APPENDICES
Appendix 1 A sample of dynamic animations on the Internet
Dynamic maps URL RemarksA Realtime maps
Arctic Theme Page httpwwwarcticnoaagovdatahtml Realtime data and climate indices from the NorthPole Environmental Observatory
Hong Kong Weather httpyeahplazacom Current weather and forecast mdash coastal upperInformation Channel level aviation and tropical cyclones
NASA Human SpaceFlight httpspaceflightnasagovrealdataindexhtml Live coverage of all space missions Earthobservation Mission Control Center activitiesand realtime orbital tracking data for stationshuttle and Russian vehicles
Real-time data from Space Science httpwwwssecwiscedudataindexhtml Realtime satellite images from NASA GOES-8and Engineering Center GOES-10 and TERRA as well as images of sea
surface temperatures weather forecasts andvolcanic activities
Smart Trek httpwwwsmarttrekorg Seattle and Puget Sound realtime trafficinformation
Up-to-the-minute Southern httpwwwcrustalucsbeduscecwebquakes Approximately 500 of the most recent earthquakesCalifornia Earthquake Map detected by seismographs in southern California
Earthquake locations are updated based onCaltechrsquos realtime picker over e-mail and usuallywithin a few minutes of the earthquakersquosoccurrence
WWW Virtual Library httpwwwbtsgovvirtualibroadchtml Realtime traffic and road conditions for variousTransportation mdash Road cities in Arizona California and WashingtonConditions by US Bureau of Transportation Statistics
B Temporal and non-temporal mapsTemporal
Animated gif illustrating httpwwwtdhstatetxusgisOutbreakgifhtm An animated gif illustrating the pattern of a diseasethe patterns of disease outbreak by the Texas Department of Health
Data and Images mdash httpedcdgs9crusgsgovurbandatahtml Data from Earth resource monitoring satellitesUrban Dynamics illustrate the rates at which human-inducedResearch Program changes and urban growths have occurred
A Global View of Sunburn Hotspots httpwwwgsfcnasagovtopstory Annual UV levels throughout the world for August20010815uvhtml 2000ndashJuly 2001 from NASA
Metro Denver Temporal httpwwwrrcc-onlinecom Animated images showing population changes inGIS Map Animations ~gey235animationhtml Metropolitan Denver for various periods in time
Washington County mdash Single httpwwwcowashingtonorusdeptmts An animated map showing shaded relief ofFamily Development Patterns lutgisintermapdev_pat1htm Washington County from 1805 to 1990
22 Hours in the life of http1425117253resources A cartographic animation of the movement of aFRAN on Sept 5 1996 webgissession4typhoonhtm hurricane
Non-temporal
Classification animation httpmapsunomahaedubooks An animation depicting a variety of classificationIACartbookhtml option
Generalization cartographic animation An animation about the effect of number of dataclasses on a mapped distribution
Geographic trend animation An animation depicting a spatial trend and therelationship of a series of related variables
Fly-through of the Grand Canyon httpmapsunomahaeduAnimArtarticlehtml A large number of oblique views are chained tosimulate flying through a terrain in 3-D
Virtual Worlds and the Internet httpwwwcasauclacukvirtualworldshtm Virtual built environment in VRML and virtualCASA tours with photo-realistic virtual reality
243Dynamic Symbols in Cartographic Communication
Appendix 2 A sample of real-time traffic maps on the Internet
City URL Primary Map Alternate Map (if available) Motorist Information More Information
Amsterdam The Netherlands Real-Time Traffic Regional maps Map doesnrsquot show speeds Traffic incidentshttpwwwtrafficnetnl Map (19 Kbytes) (click on area)amsterdamhtm
Athens Greece httpwww Real-Time Congestion Travel Time Map Congestion Light About the Maptransportntuagrmap Map (18 Kbytes) (24 Kbytes) Moderate Medium volume travel timevcmaphtml Increased Heavy
Atlanta GA httpwww Real-Time Traffic Downtown and other Speed 0ndash15 15ndash35 35+ Incidents roadworkgeorgianavigatorcomtraffic (25 Kbytes) Commute Areas travel time
(17-22 Kbytes)
Baltimore-Washington Real-Time Traffic Pull-down menus of select Speed 0ndash30 30ndash50 50+ Lane closuresMD DOT httpwwwchart (23 Kbytes) areas and counties within no report weather speedsstatemdusmapping Maryland videos and camerasCHARTMapasp
Boston MA httpwww Area Index Map Site Index (list of textual Map Doesnrsquot Show Speeds Interactive Telephonesmartravelercomscripts traffic reports available) (click on area) Systembosmapaspcity=bosampcityname=Boston
Caltrans CA http Statewide Real-time Zoom-in of various Speed 0ndash20 20ndash35 35+ Interactive real-timewwwdotcagovtraffic Freeway Speed Map localities traffic traffic
incidents weather
Chicago IL httpwww GCM Corridor Gary Chicago Milwaukee Congestion none light Interactive with roadgcmtravelcomgcmmaps_ Congestion Map Congestion Map medium heavy no data work report VMSchicagojspand Milwaukee (36 Kbytes) (25-28 Kbytes each) Messages Camerahttpwwwtravelinfoorg ViewsGCM FAQsmilwaukeehtml
Cincinnati OH http Area Traffic Index Map Site Index (list of textual Map doesnrsquot show speeds Interactive Telephonewcpocincinnaticomtraffic traffic reports avail) (click on area) System
Copenhagen Denmark Motorway Network mdash Speed normal slow Danish Roadhttpwwwtrafikkendk Surrounding very slow no data Directorate Trafficwimpdocasppage= Copenhagen Management Pagedocumentampobjno=7297 (50 Kbytes)
Helsinki Finland http Real-Time Congestion Regional congestion Speed free-flowing Finnish Roadwwwtiehallintofialkenglish map (66 Kbytes) maps (10-39 Kbytes) heavy slow queuing Administrationframesliikenne-framehtml stationary no data Information on
weather roadworkand ferries
Houston TX http Real-Time Traffic Camera Map Speed 0ndash19 20ndash29 30ndash39 Frequently Askedtraffictamueduincmap Map (11 Kbytes) (11 Kbytes) 40ndash49 50+ Questions (FAQ)
traffic incidentscamaras
London UK http Area map (95 Kbytes Click and drag map Speed 0510152025 Help Page flashingbuypowervauxhallcouk requires Shockwave) window to navigate MPH (color-coded arrows) and color-codedtrafficnet arrows to alert
direction of slow traffic
Madrid Spain http Traffic on Real-Time Zoomed-in maps Speed free-flow heavy More informationwwwcitiesmunimadrides (6 Kbytes) (6 Kbytes) traffic queues congestion (in Spanish) onMapaTraficoViasp no traffic allowed no data incidents parking
roadwork andhospitals
Minneapolis MN DOT Real-time Traffic Freeway camera page Traffic Flow free flowing Road incidents httpwwwdotstate Map (21 Kbytes) (56 Kbytes) slow congested no data weather camerasmnustmctrafficinfomap FAQsrefreshmaphtml
Prince Edward Island Road conditions mdash Clear slippery section Visibility ratingsCanada httpwwwgov partially covered closedpecaroadconditions snow covered no dataindexphp3
Oakland County MI Real-Time Traffic Zoom-in of localities Congestion none light Roadwork weatherhttp6610026232 Map (56 Kbytes) via an index map moderate heavy
(45-65 Kbytes each)
244 The Cartographic Journal
Appendix 2 Continued
City URL Primary Map Alternate Map (if available) Motorist Information More Information
Paris France Real Time Traffic Clickable index map Traffic free-flow stoppages Le Trafic En Tempshttpwwwsytadintmfr Map (14 Kbytes) (10-16 Kbytes each) roadwork accidents Reel (in French)
Phoenix AZ http Current Freeway Clickable Map of Camera Speed 0ndash22 23ndash37 38ndash45 Camera imageswwwazfmscomTravel Conditions Locations (43 Kbytes) 46ndash50 51ndash55 56+ closures andfreewayhtml (23 Kbytes) restrictions weather
San Antonio TX DOT Current Freeway Maps of five sub-regions Congestion normal Camera images traffichttpwwwtransguidedot Conditions (32-38 Kbytes each) congested heavily incidentsstatetxusTraffic (40 Kbytes) congested no dataccmapphp
San Francisco CA http Real-time traffic map mdash Speed lt20 20ndash35 gt35 Transit informationwwwsmartravelercom no data cameras incidentsscriptssnfspeedaspcity=snfampcityname=San_Franciscoamparea=max
Seattle WA (WSDOT) Traffic Conditions North Map (31 Kbytes) Traffic level stop-n-go WebFlow Incidenthttpwwwwsdotwagov (39 Kbytes) (one of several alt maps) heavy moderate wide open MessagesPugetSoundTraffic
Seattle WA (TranSmart Trafficview Trafficview Speed lt25 25ndash35 35ndash45 WeatherTech Inc) http Java-enabled Map Non-Java Map 45ndash55 55+ constructionincidentwwwtrafficonlinecom travel timetol15SeattleSeattlehtml
Traffic411 Dashboard Real-time freeway Los Angeles Orange Co Speed lt16 16ndash35 gt35 Traffic incidents ashttpwwwtraffic411com map of traffic speeds Santa Clarita Ventura flashing triangles
Riverside San Diego constructionSan Francisco San JoseSeattle Chicago MinneapolisSt Paul Milwaukee Atlanta
TrafficBee http Current Traffic Los AngelesVentura Central Speed 0ndash1011ndash20 21ndash30 Traffic incidentswwwtrafficbeecom Conditions Los Angeles North Los Angeles 31ndash40 41ndash50 51+ weatherresourcesrealtimeshtml (32ndash54 Kbytes) East Los Angeles Inland Empire
North Orange CountySouth Orange CountySan Diego Carpool Lanes
Adapted from lsquoThe Definitive Table of Real-Time Trafficrsquo httpwwwitsonlinecomrttablehtml by ITS Online [renamed as the ITS CooperativeDeployment Network the table was discontinued in 2002] Web links on this page were updated in February 2003
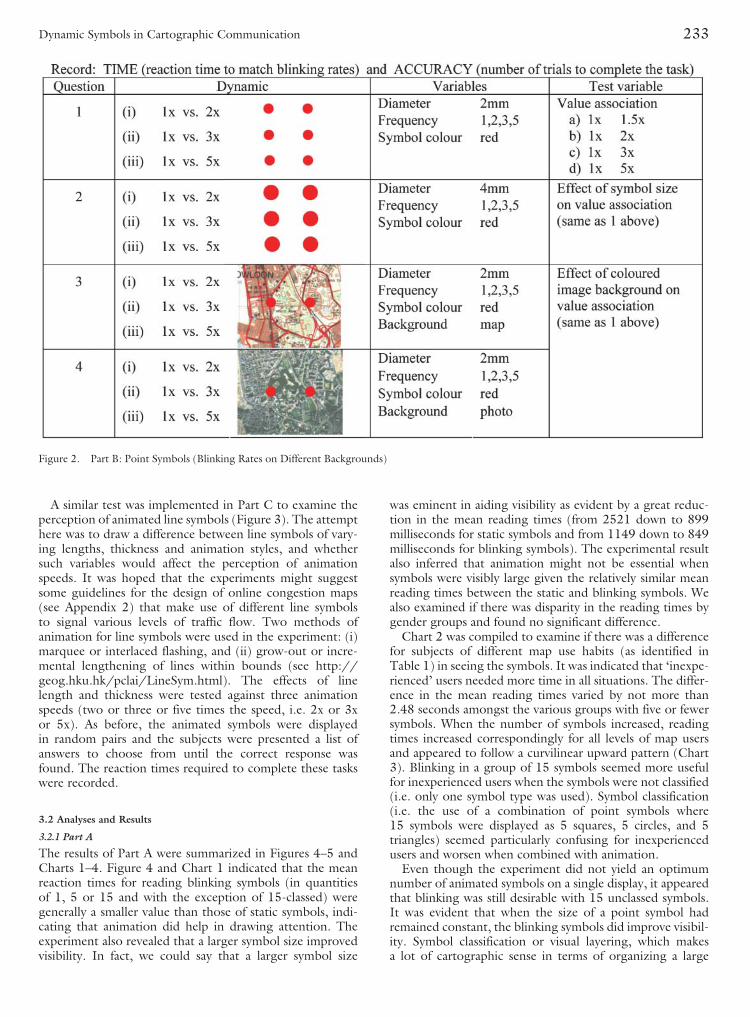