assessing the financial impacts of the world trade center attacks on publicly-held corporations
DESCRIPTION
Assessing the Financial Impacts of the World Trade Center Attacks On Publicly-Held Corporations. The Institute for Crisis, Disaster and Risk Management. Outline. Background Company Selection Process Stock Data Collection Process Display Products (Charts and Diagrams) - PowerPoint PPT PresentationTRANSCRIPT

ICDRM
Assessing the Financial Impacts of the World Trade Center Attacks On Publicly-Held Corporations
The Institute for Crisis, Disaster and Risk Management

ICDRM
• Background• Company Selection
Process• Stock Data Collection
Process• Display Products
(Charts and Diagrams)• Preliminary Conclusions• Upcoming Project Tasks
Outline

ICDRM
September 11, 2001
• 19 terrorists hijacked 4 aircraft for suicide attacks
• Almost 3000 people killed
• In Manhattan: - 34.5 million ft2 office space lost
- $50-70 billion in insured losses
Most of these direct economic losses were incurred by the private sector

ICDRM
September 11, 2001
The WTC burning… The twin towers collapsed…

ICDRM
Terrorist Groups are Targeting U.S. And World Economy
“The settlement of this overburdened account will indeedbe heavy. We will also aim to continue, by permission of Allah, the destruction of the American economy.”
Ayman Al-Zawahiri, head of Al-Qaeda operational planning(6 October, 2002)

ICDRM
Long-Term, Overall Research Questions
1. How did the 911 attacks affect long-term economic and financial performance of corporations directly or indirectly impacted?
2. What unanticipated inter-org. adaptive responses involving large publicly held corp’s emerged during the recovery from the 9/11 attacks?
3. How have mgmnt. perceptions changed toward the req’s for investment in disaster recovery, security, and crisis mgmnt. as a result of these attacks?
4. How has the terrorist threat changed the perceived crisis mgmt, security, and disaster recovery best practices for large publicly held corporations?
5. What skills and knowledge are required for corporate crisis managers?
6. Can corporate preparedness for extreme events be evaluated based on internal and inter-organizational factors?
ICDRM
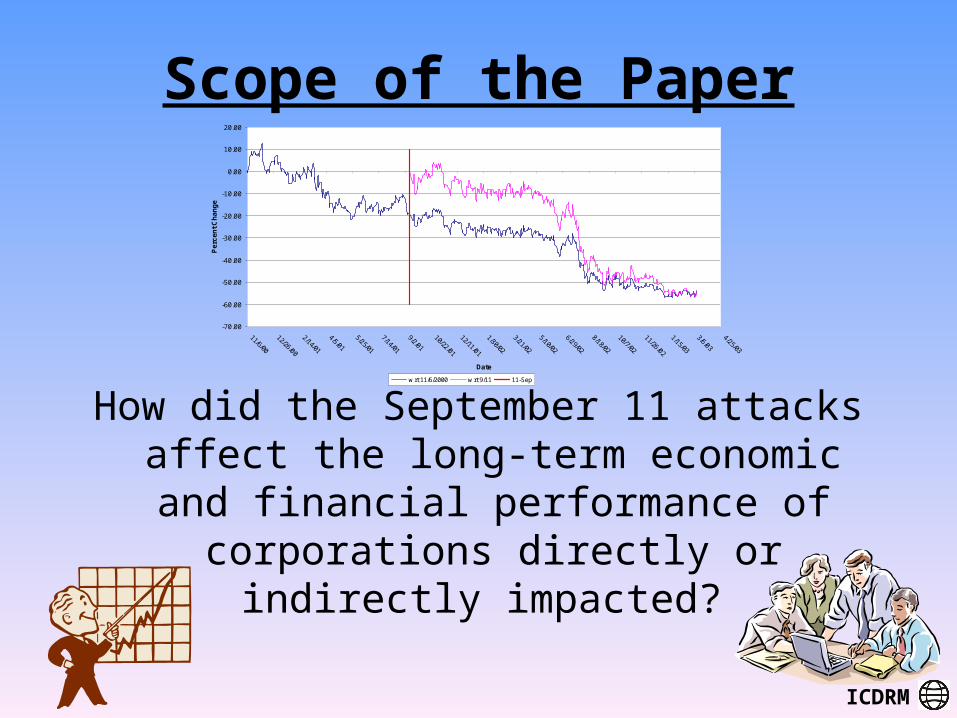
Scope of the Paper
How did the September 11 attacks affect the long-term economic and financial
performance of corporations directly or indirectly impacted?
-70.00
-60.00
-50.00
-40.00
-30.00
-20.00
-10.00
0.00
10.00
20.00
11/6/00
12/26/00
2/14/01
4/5/01
5/25/01
7/14/01
9/2/01
10/22/01
12/11/01
1/30/02
3/21/02
5/10/02
6/29/02
8/18/02
10/7/02
11/26/02
1/15/03
3/6/03
4/25/03
Date
Pe
rce
nt
Ch
an
ge
w rt 11/6/2000 w rt 9/11 11-Sep

ICDRM
Previous Research• Private sector impacts have not been the subject of significant, in-depth
research• General lack of data and models describing impacts at
corporate/organizational level• Focus on small businesses (Alesch, Webb, Tierney)• Tied to particular events for specific companies
(Knight and Pretty)– Everglades Air Crash, ValuJet, 1996– Tylenol Poisoning, J&J, 1982– Bhopal Gas Leak, Union Carbide, 1984– Norco Explosion, Shell Oil, 1988– Lockerbie Air Crash– Alaskan Oil Pollution, Exxon Valdez, 1989
ICDRM
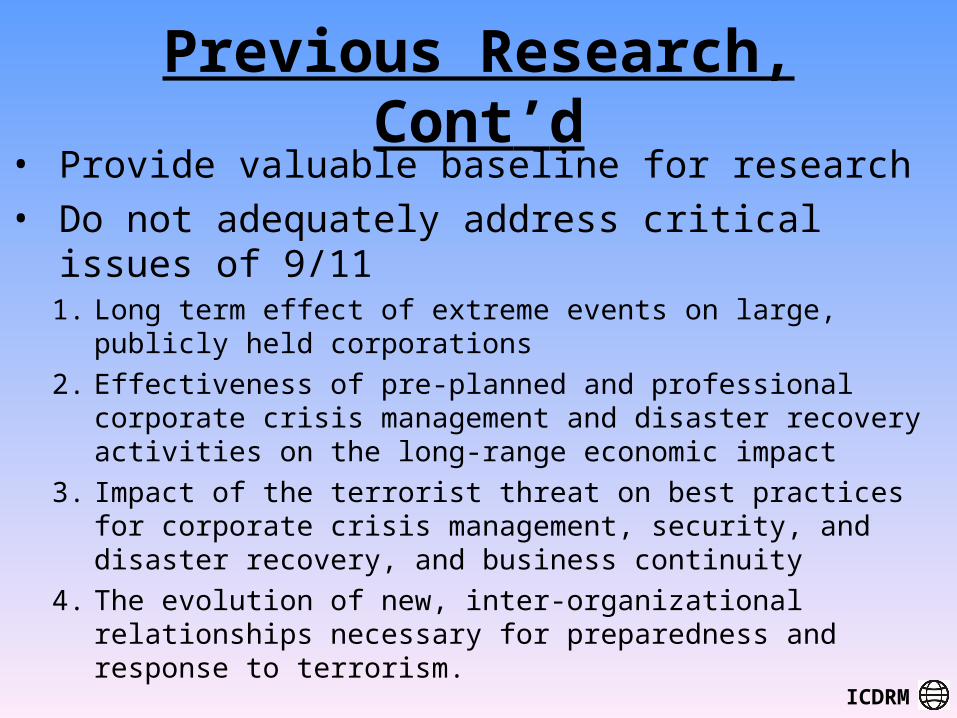
Previous Research, Cont’d• Provide valuable baseline for research
• Do not adequately address critical issues of 9/111. Long term effect of extreme events on large, publicly held
corporations
2. Effectiveness of pre-planned and professional corporate crisis management and disaster recovery activities on the long-range economic impact
3. Impact of the terrorist threat on best practices for corporate crisis management, security, and disaster recovery, and business continuity
4. The evolution of new, inter-organizational relationships necessary for preparedness and response to terrorism.

ICDRM
Methodology
• Selection of Companies
• Collection of Data
• Analysis of Data
• Presentation of Results
ICDRM
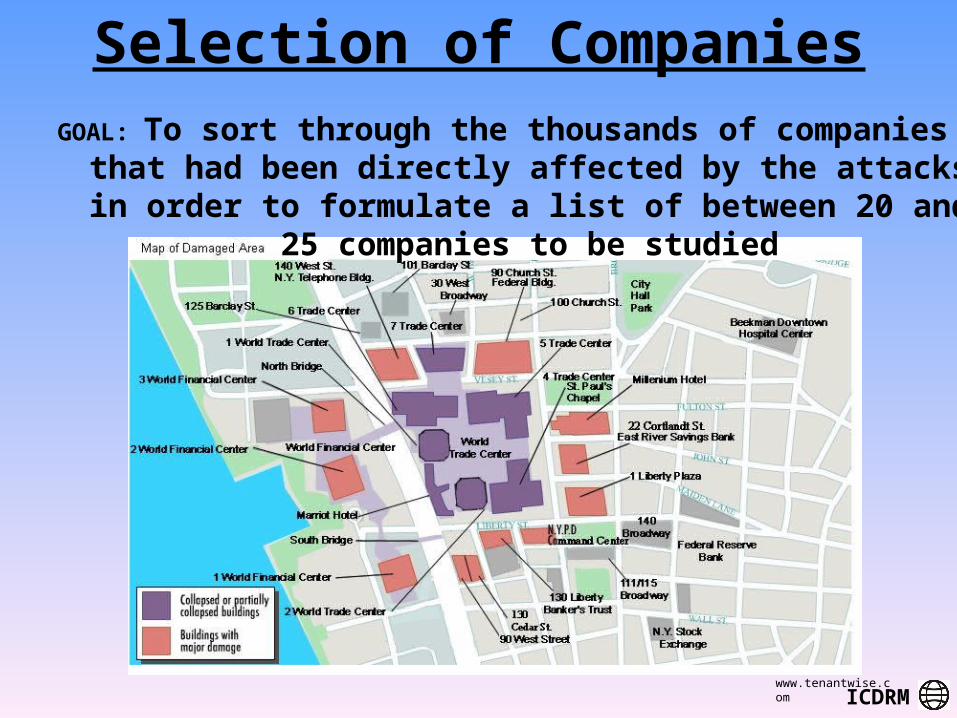
Selection of Companies
www.tenantwise.com
GOAL: To sort through the thousands of companies that had been directly affected by the attacks in order to formulate a list of
between 20 and 25 companies to be studied

ICDRM
Selection Criteria
• Sustained a direct impact in the attacks
• Publicly traded
• Could not be classified as a ‘small’ business
• Maintained at least one additional office, outside the impacted area
• Maintained a significant level of operation in the impacted area
• Headquarters within the United States
• Financial Information available

ICDRM
Selected Companies
• 23 selected for study
• Total number of worldwide employees ranged from 231 – 443,808
• Annual revenues ranged from $279 million to $17 billion

ICDRM
The value of a public corporation is its market capitalization – the total value of its publicly held
stock.

ICDRM
Stock Data Collection Process
• Historical Stock Prices – 3 years of data– Starting Date: March 10, 2000– Midpoint: September 11, 2001– End Date: March 11, 2003
• Challenges– Cleaning– Standardization– Data gaps

ICDRM
Results • Company 30, Fast Recovery Example

ICDRM
Results • Company 33, Non-Recovery Example

ICDRM
Results• Ranked Average change in Stock price between
3/10/2000 and 3/11/2003 (whole period)
ICDRM
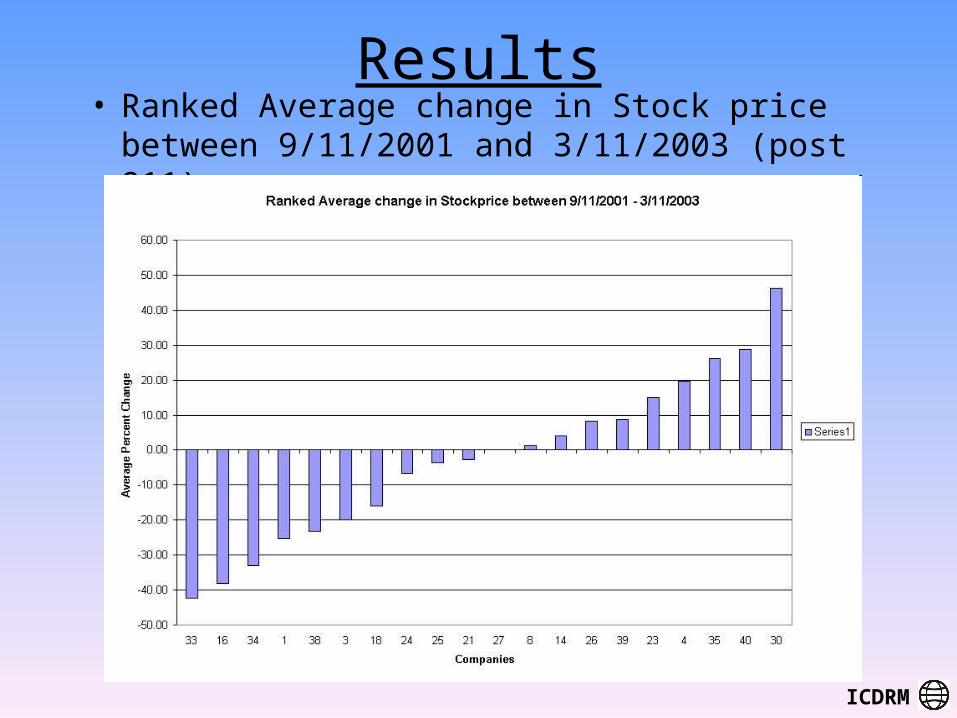
Results• Ranked Average change in Stock price between
9/11/2001 and 3/11/2003 (post 911)
ICDRM
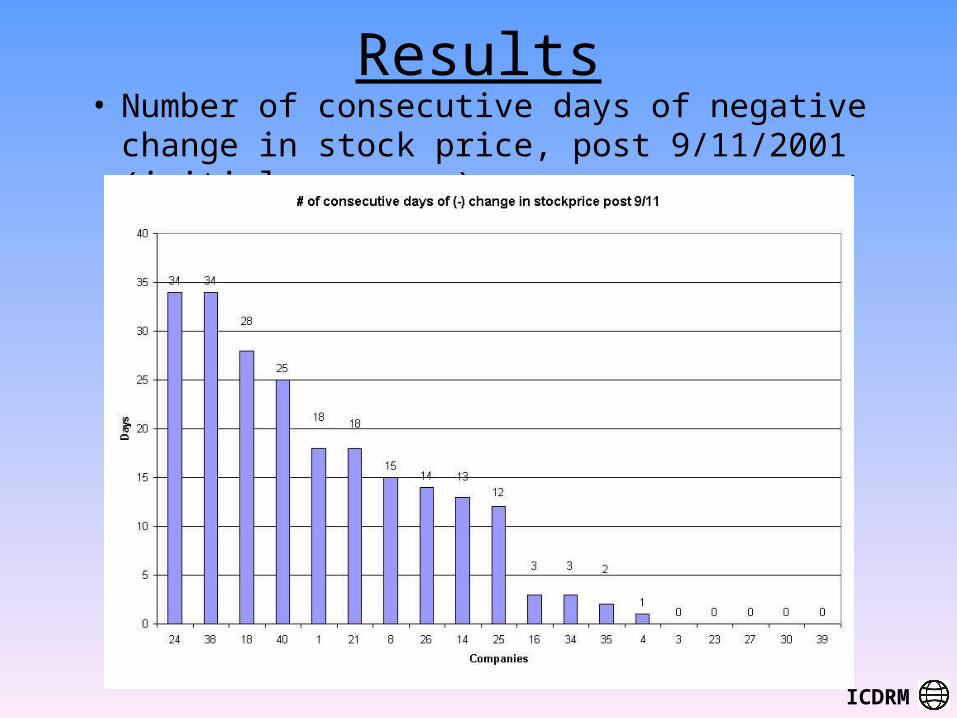
Results• Number of consecutive days of negative change in
stock price, post 9/11/2001 (initial recovery)

ICDRM
Analysis• Stock Beta values
Index Change
for Stock Beta
Stock Change
for Stock Beta
Stock Beta 60 pri 9-11
X Y
-0.003671 0.002610 1.473275
-0.000361 0.046330 1.477889
-0.010239 0.007338 1.431617
-0.011708 -0.010372 1.440429
-0.009015 -0.003119 1.423795
-0.006487 -0.014643 1.421400
0.003928 0.006097 1.429084
-0.004261 -0.005934 1.423007
-0.010961 -0.013462 1.395666
-0.018623 -0.018538 1.368312
-0.020678 -0.033972 1.371687
0.002580 0.023082 1.379688
-0.048947 -0.089184 1.501673
-0.001574 -0.027393 1.506270
-0.015514 0.000150 1.494916
-0.036994 -0.026064 1.397560
-0.014614 0.029529 1.281202
0.048754 0.041679 1.171881
0.015157 -0.006884 1.130375
0.006868 -0.002455 1.122311
0.017176 -0.013607 1.067492
0.025601 0.035515 1.116787
-0.002250 0.030045 1.117167
0.013265 0.001376 1.117982
0.015998 0.042045 1.153415
-0.009355 0.030063 1.130586

ICDRM
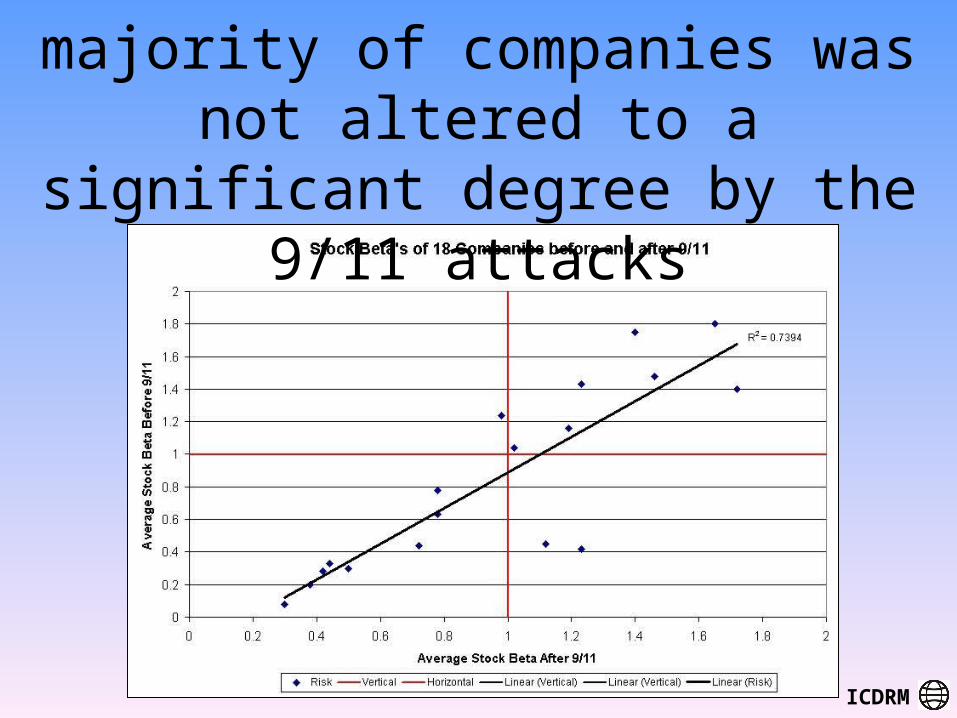
Results• Stock Beta values before and after 9/11/2001.

ICDRM
Preliminary Findings• 9/11 events inflicted severe and immediate
physical impacts to all businesses, government offices, and other organizations located in and around the WTC complex.
• Affected companies needed to manage, primarily by themselves, an event that involved dead, injured, missing, physically displaced and traumatized employees, losses of data, information, and institutional knowledge, and an unprecedented uncertainty in market behavior.

ICDRM
For the vast majority of large, publicly traded companies directly impacted by the WTC attacks, it appears that the bulk of financial impacts were
absorbed by the markets/industries rather than the individual companies themselves and therefore transferred quickly to the economy as a whole.
ICDRM
Risk behavior of the majority of companies was not altered to a
significant degree by the 9/11 attacks

ICDRM
There have emerged implications showing that there exist mechanisms to absorb or transfer severe economic and
financial impacts of large-scale disasters affecting large businesses.
ICDRM
Next TasksDetermine what caused discrepancies between the outliers, and confirm our findings regarding market absorption of financial loss,
Investigate strategic impact on corporations not directly impacted by WTC attack (20-25 companies) and compare with sample companies.
•Personal Interviews (40-60)
•Surveys (150)

ICDRM
What wasin place?
What wasimprovised?
How wasit used?
How did it work?
What waslearned?
What was modified orchanged?
Pre Event Response/ Post Event Recovery
Framework for Analysis of Strategic Impacts
Revised Corporate Strategy
Investments in preparedness

ICDRM
Expected Results
Unique evaluation of financial impacts of WTC attacks on large corporations.
Evaluation of corporate preparedness, disaster recovery and business continuity strategies Procedures, and technology.
Better understanding of impact of extreme eventson corporate strategy, plans, and investment.

ICDRM
Questions?
References for used Images:
satellite.jpg - http://256.com/gray/thoughts/2001/20010912/pictures/
newyork.jpg - http://www.allposters.com/gallery.asp?aid=426124&item=337506
P1010018.jpg, P1010021.jpg - www.sikh.net/AOA/wtcpics.htm
alive.jpg, search3.jpg http://economics.wustl.edu/~e110em/disaster/
IM001017.jpg - http://www.markallencam.com/nycblowup.html
before007.jpg - http://groundzero.nyc.ny.us/photos/before/before007.html
image002.jpg - http://www.twin-towers.net/before.htm
For additional information contactJohn R. Harrald at [email protected], (202) 994-7153www.gwu.edu/~icdrm

ICDRM
Analysis
• Daily Percent Changes in stock price with respect to March 10th, 2000
GS % change GS % change ^DJUSFN % change ^DJUSFN % change GS-^DJUSFN
Date GS wrt 3/10/2000 wrt 9/11/2001 ^DJUSFN wrt 3/10/2000 wrt 9/11/2001 Difference wrt 3/10/2000
9/4/2001 78.74 0.000000 399.60 0.000000 0.000000
9/5/2001 77.68 -1.346203 395.22 -1.096096 -0.250107
9/6/2001 76.24 -3.175006 387.86 -2.937938 -0.237068
9/7/2001 73.65 -6.464313 379.84 -4.944945 -1.519368
9/10/2001 75.35 -4.305309 0.000000 380.82 -4.699700 0.000000 0.394391
9/17/2001 68.63 -12.839726 -8.918381 362.18 -9.364364 -4.894701 -3.475361
9/18/2001 66.75 -15.227330 -11.413404 361.61 -9.507007 -5.044378 -5.720323
9/19/2001 66.76 -15.214630 -11.400133 356.00 -10.910911 -6.517515 -4.303720
9/20/2001 65.02 -17.424435 -13.709356 342.83 -14.206707 -9.975842 -3.217728
9/21/2001 66.94 -14.986030 -11.161248 337.82 -15.460460 -11.291424 0.474430
9/24/2001 69.73 -11.442723 -7.458527 354.29 -11.338839 -6.966546 -0.103884
9/25/2001 69.25 -12.052324 -8.095554 359.66 -9.994995 -5.556431 -2.057329

ICDRM
Analysis
• Daily percent changes in stock price with respect to September 11th, 2001.
GS % change GS % change ^DJUSFN % change ^DJUSFN % change GS-^DJUSFN
Date GS wrt 3/10/2000 wrt 9/11/2001 ^DJUSFN wrt 3/10/2000 wrt 9/11/2001 Difference wrt 9/11/2001
9/4/2001 78.74 0.000000 399.60 0.000000
9/5/2001 77.68 -1.346203 395.22 -1.096096
9/6/2001 76.24 -3.175006 387.86 -2.937938
9/7/2001 73.65 -6.464313 379.84 -4.944945
9/10/2001 75.35 -4.305309 0.000000 380.82 -4.699700 0.000000 0.000000
9/17/2001 68.63 -12.839726 -8.918381 362.18 -9.364364 -4.894701 -4.023680
9/18/2001 66.75 -15.227330 -11.413404 361.61 -9.507007 -5.044378 -6.369026
9/19/2001 66.76 -15.214630 -11.400133 356.00 -10.910911 -6.517515 -4.882618
9/20/2001 65.02 -17.424435 -13.709356 342.83 -14.206707 -9.975842 -3.733515
9/21/2001 66.94 -14.986030 -11.161248 337.82 -15.460460 -11.291424 0.130176
9/24/2001 69.73 -11.442723 -7.458527 354.29 -11.338839 -6.966546 -0.491981
9/25/2001 69.25 -12.052324 -8.095554 359.66 -9.994995 -5.556431 -2.539123