assessing the iron status · assessing the iron status of populations 4 • to identify priorities...
TRANSCRIPT

Iron StatuSof populations
Assessing the
Second editionIncluding Literature Reviews
Centers for Disease Control and PreventionDivision of Nutrition and Physical ActivityInternational Micronutrient Malnutrition Prevention and Control Program
Department of Nutrition for Health and Development

WHO Library Cataloguing-in-Publication Data:
Joint World Health Organization/Centers for Disease Control and Prevention Technical Consultation on the Assessment of Iron Status at the Population Level (2004 : Geneva, Switzerland).
Assessing the iron status of populations : including literature reviews : report of a Joint World Health Organization/Centers for Disease Control and Prevention Technical Consultation on the Assessment of Iron Status at the Population Level, Geneva, Switzerland, 6–8 April 2004. – 2nd ed.
1.Iron, Dietary 2.Nutritional status 3.Nutrition assessment 4.Health status indicators I.Title.
ISBN 978 92 4 159610 7 (electronic version) (NLM classification: WD 105)
© World Health organization 2007
All rights reserved. Publications of the World Health Organization can be obtained from WHO Press, World Health Organization, 20 Avenue Appia, 1211 Geneva 27, Switzerland (tel.: +41 22 791 3264; fax: +41 22 791 4857; e-mail: [email protected]). Requests for permission to reproduce or translate WHO publications – whether for sale or for noncommercial distribution – should be addressed to WHO Press, at the above address (fax: +41 22 791 4806; e-mail: [email protected]).
The designations employed and the presentation of the material in this publication do not imply the expression of any opinion whatsoever on the part of the World Health Organization concerning the legal status of any country, territory, city or area or of its authorities, or concerning the delimitation of its frontiers or boundaries. Dotted lines on maps rep-resent approximate border lines for which there may not yet be full agreement.
The mention of specific companies or of certain manufacturers’ products does not imply that they are endorsed or rec-ommended by the World Health Organization in preference to others of a similar nature that are not mentioned. Errors and omissions excepted, the names of proprietary products are distinguished by initial capital letters.
All reasonable precautions have been taken by the World Health Organization to verify the information contained in this publication. However, the published material is being distributed without warranty of any kind, either expressed or implied. The responsibility for the interpretation and use of the material lies with the reader. In no event shall the World Health Organization be liable for damages arising from its use.
Designed by minimum graphics

Contents
Report of a Joint World Health Organization/Centers for Disease Control and Prevention Technical Consultation on the Assessment of Iron Status at the Population Level 1
1. Consultation 3
1.1 Rationale for the Consultation 3
1.2 Objectives of the Consultation 3
2. Working definitions of key terms 4
3. Selection of indicators 4
4. Literature reviews 5
5. Analysis of data from iron intervention studies 5
5.1 Indicators for evaluating the impact of interventions to control iron deficiency 6
5.2 Performance of indicators to predict a change in haemoglobin concentration in response to iron intervention 7
6. Indicators of inflammation 9
7. Recommendations 10
7.1 Assessing the iron status of populations 10
7.2 Evaluating the impact of interventions to control iron deficiency in populations 11
8. Priorities for research 12
9. References 12
10. Acknowledgements 13
11. List of participants 13
Appendix 1 16
Appendix 2 18
Annex 1. Indicators of iron status of populations: red blood cell parameters Sean Lynch 19
Annex 2. Indicators of iron status of populations: ferritin Mark Worwood 31
Annex 3. Indicators of iron status: free erythrocyte protoporphyrin and zinc protoporphyrin; serum and plasma iron, total iron binding capacity and transferrin saturation; and serum transferrin receptor John Beard 75
Annex 4. The interpretation of indicators of iron status during an acute phase response Christine A. Northrop-Clewes 95
iii


1
Report of a Joint World Health Organization/ Centers for Disease Control and Prevention technical Consultation on the assessment of Iron Status at the Population Level
GenevA, SWITzeRLAnD6–8 APRIL 2004


3
1. Consultation1.1 Rationale for the Consultation
Anaemia is one of the most common and intractable nutritional problems in the world
today. The World Health Organization (WHO) estimates that some two billion people
are anaemic defined as haemoglobin concentrations that are below recommended
thresholds. The main causes of anaemia are: dietary iron deficiency; infectious dis-
eases such as malaria, hookworm infections and schistosomiasis; deficiencies of
other key micronutrients including folate, vitamin B12
and vitamin A; or inherited
conditions that affect red blood cells (RBCs), such as thalassaemia.
Iron deficiency with or without anaemia has important consequences for human
health and child development: anaemic women and their infants are at greater risk
of dying during the perinatal period; children’s mental and physical development
is delayed or impaired by iron deficiency; and the physical work capacity and pro-
ductivity of manual workers may be reduced. There have been many efforts to fight
iron deficiency and anaemia over the past two decades but, despite these efforts, the
conditions are still common.
One of the reasons for the apparent failure to reduce the prevalence of anaemia
is that many programmes and their interventions have been designed with the as-
sumption that the only cause of anaemia is iron deficiency. This has meant that,
when trying to control anaemia, the role of other causes has been underestimated,
and that iron deficiency without anaemia has not been addressed as a major and
common health problem.
In the absence of international agreement on how to assess the iron status of popu-
lations, the prevalence of iron deficiency has often been derived from the prevalence
of anaemia using measurements of blood haemoglobin concentration. However not
all anaemic people are iron deficient and iron deficiency may occur without anaemia.
This means that the prevalence of anaemia and iron deficiency varies in different
populations and no consistent relationship between the two can be applied through-
out the world. When anaemia is considered from the point of view of programmes to
improve nutrition and health, an estimate of the prevalence derived from the hae-
moglobin concentration alone does not allow the contribution of iron deficiency to
anaemia to be estimated, and ignores the role of other causes of anaemia.
To plan effective interventions to combat both iron deficiency and anaemia there
is an urgent need to have better information on the iron status of populations. This
will enable the right interventions to be chosen in the first place and then, once pro-
grammes are in place, to have the right indicators to monitor their impact.
These were all reasons for holding the Joint WHO/Centers for Disease Control
and Prevention (CDC) Technical Consultation on the Assessment of Iron Status at
the Population Level. The Consultation took place in Geneva, Switzerland, from 6 to
8 April 2004.
1.2 Objectives of the Consultation
The objectives of the Consultation were:
• to review the indicators currently available to assess iron status;
• to select the best indicators to assess the iron status of populations;
• to select the best indicators to evaluate the impact of interventions to control iron
deficiency in populations;
REPORT Of A TECHNICAL CONSuLTATION ON THE ASSESSMENT Of IRON STATuS AT THE POPuLATION LEvEL

ASSESSING THE IRON STATuS Of POPuLATIONS
4
• to identify priorities for research related to assessing the iron status of popula-
tions.
2. Working definitions of key termsFor the sake of clarity and to achieve a consensus, several key terms were defined
during the Consultation.
In clinical terms anaemia is an insufficient mass of RBCs circulating in the blood;
in public health terms anaemia is defined as a haemoglobin concentration below the
thresholds given by WHO, UNICEF, UNU (1). These thresholds are set at the 5th per-
centile of the haemoglobin concentration of a normal population of the same sex and
age group. There is a separate threshold for pregnant women.
Although iron deficiency is probably the most common cause of anaemia, there
are other causes as well, including: acute and chronic infections that cause inflam-
mation; other micronutrient deficiencies, especially of folate, vitamin B12
and vita-
min A; and genetically inherited traits such as thalassaemia.
Iron deficiency is a state in which there is insufficient iron to maintain the normal
physiological function of tissues such as the blood, brain, and muscles. Iron defi-
ciency can exist in the absence of anaemia if it has not lasted long enough or if it has
not been severe enough to cause the haemoglobin concentration to fall below the
threshold for the specific sex and age group (1). Evidence from animals fed on iron-
deficient diets indicates that iron deficiency becomes detectable at about the same
time in the blood, brain, and tissue enzyme systems (2).
Storage iron is the pool of iron in the body that is not being used by tissues. Healthy
children and adults (apart from infants aged 6–11 months and pregnant women)
usually have some iron stores to act as a buffer against iron deficiency during periods
when dietary iron may be temporarily insufficient. Iron depletion is the state in which
storage iron is absent or nearly absent but the tissues that need iron are able to main-
tain normal physiological functions.
It is possible for a functional iron deficiency to develop even when iron stores are
present if the normal physiological systems for transporting iron to target tissues are
impaired. This occurs most commonly because of cytokines released during inflam-
mation caused by infectious diseases, and appears to be mediated by hepcidin (3).
Iron supplementation or fortification has no benefit in such circumstances. Deficien-
cies of other nutrients such as vitamin A may also cause a functional iron deficiency
even when iron stores are adequate (4).
3. Selection of indicatorsIn January 2004 a WHO/CDC working group met to review the literature on indica-
tors of iron status and to select the indicators considered to be the best for discussion
by the Consultation. Appendix 1 shows the indicators considered, each of which was
evaluated in terms of its theoretical advantage as an indicator of iron status and the
practicality of its measurement. Appendix 2 shows the five indicators selected to as-
sess iron status and an acute phase protein with the methods most commonly used
to measure them. The rationale for selecting these five was as follows.
• Haemoglobin concentration is a measure of anaemia, a condition that has impor-
tant outcomes for health and child development that are linked to international
development goals.

5
REPORT Of A TECHNICAL CONSuLTATION ON THE ASSESSMENT Of IRON STATuS AT THE POPuLATION LEvEL
• Zinc protoporphyrin reflects a shortage in the supply of iron in the last stages of
making haemoglobin so that zinc is inserted into the protoporphyrin molecule in
the place of iron. Zinc protoporphyrin can be detected in RBCs by fluorimetry and
is a measure of the severity of iron deficiency.
• Mean cell volume indicates whether RBCs are smaller than usual (microcytic),
which is a common sign of iron deficiency anaemia, or larger than normal (mac-
rocytic), a common sign of megaloblastic anaemia resulting from a deficiency of
vitamin B12
or folate.
• Transferrin receptor in serum is derived mostly from developing RBCs and so re-
flects the intensity of erythropoiesis and the demand for iron; the concentration
rises in iron deficiency anaemia and it is a marker of the severity of iron insuffi-
ciency only when iron stores have been exhausted, provided that there are no oth-
er causes of abnormal erythropoiesis. The concentration of transferrin receptor is
also increased in haemolytic anaemia and thalassaemia. Clinical studies indicate
that the serum transferrin receptor is less affected by inflammation than serum
ferritin (5).
• Serum ferritin is a measure of the amount of iron in body stores if there is no con-
current infection: when the concentration is ≥15 µg/l iron stores are present; high-
er concentrations reflect the size of the iron store; when the concentration is low
(<12–15 µg/l) then iron stores are depleted. When infection is present the concen-
tration of ferritin may increase even if iron stores are low; this means that it can be
difficult to interpret the concentration of ferritin in situations in which infectious
diseases are common.
4. Literature reviews The Consultation was provided with literature reviews on indicators of iron status,
including RBC parameters, ferritin, free erthyrocyte protoporphyrin, serum and
plasma iron, total iron binding capacity, transferrin saturation and serum trans-
ferrin receptor as well as a review on the interpretation of indicators of iron status
during an acute phase response. These reviews provide technical background to the
measurement, biology, interpretation and diagnostic value of the indicators. See an-
nexes.
5. analysis of data from iron intervention studiesIn order to assess the potential of indicators to detect a change in iron status as a
result of an intervention, the Consultation reviewed the results of an analysis of in-
dicators of iron status and acute phase proteins that were measured during 10 dou-
ble-blind, randomized controlled trials. The investigators provided iron either as
supplements or as food fortified with iron for periods between 4 and 18 months to
infants (1 study), preschool children (1 study), schoolchildren (2 studies), pregnant
women (2 studies) and non-pregnant women (4 studies). The studies were done in
Côte d’Ivoire (6), Jamaica (Simmons et al., unpublished data), Morocco (7), the Philip-
pines (Beard and Haas, unpublished data), one study done in Sweden and Honduras
(8), one study in the United Republic of Tanzania (9), two studies in the United States
of America (Beard, unpublished data and 10), and two studies in Viet Nam (Thuy et
al., unpublished data and 11). The original data sets from all trials were provided for
this analysis by the investigators, who are acknowledged at the end of this report.

ASSESSING THE IRON STATuS Of POPuLATIONS
6
Full details of the analysis will be submitted for publication in due course.
The haemoglobin and serum ferritin concentrations were measured in all ten tri-
als, serum transferrin receptor in nine, zinc protoporphyrin in six, and mean cell
volume by flow cytometry in four. For the nine studies that measured both serum
ferritin and transferrin receptor, the body iron stores were estimated using the meth-
od and constants given by Cook, Flowers, Skikne (12). Because both serum ferritin
and transferrin receptor concentrations have distributions skewed to the right, both
raw values and values transformed to logarithms were used in the analysis.
5.1 Indicators for evaluating the impact of interventions to control iron deficiency
The data from the ten studies were selected because the experimental designs were
considered to be adequate (duration of intervention, iron dosage and compound) to
show an improvement in iron status. The data were used to assess how well each indi-
cator predicted the changes in iron status. This change was estimated by calculating
the mean difference between each indicator at the beginning and end of each study
for the intervention group and then subtracting the mean difference calculated for
the control group. As each indicator had different units, the net difference between
the change in the intervention and control groups was divided by the standard devia-
tion of the baseline measurement of the indicator calculated for both study groups in
order to express it in standard deviation units (SDUs). For the purposes of analysis an
arbitrary change of ≥0.2 SDUs was defined as indicating a successful response to the
intervention. A power calculation indicated that this change could be detected with
a sample size of 400 subjects per study group.
In addition, using the same studies, the change that occurred in the subjects with
the lowest 10% of values was examined for indicators that were expected to rise, such
as haemoglobin concentration, and for the highest 10% of values for indicators that
were expected to fall, such as transferrin receptor. The change in values of these
10th or 90th percentiles was also expressed as SDUs. This analysis was based on the
assumption that the most iron deficient subjects would show the greatest change
as a result of the interventions. Table 1 shows how the indicators performed when
assessed in these two ways.
An analysis of the effect of using different thresholds of success varying between
0.1 and 0.5 SDUs did not change the inferences about each indicator in each study.
TAbLe 1 Success of indicators to detect changes in iron status in 10 controlled trials of treatments, estimated as the number of indicators showing a change of ≥0.2 standard deviation units (SDus)
Indicator of iron status Success of indicator based on mean change of ≥0.2 SDUs for all subjects
Success of indicator based on mean change of ≥0.2 SDUs for top or bottom 10%a
Haemoglobin 60%, 6 of 10 studies 80%, 8 of 10 studies
Mean cell volume 50%, 2 of 4 studies 75%, 3 of 4 studies
Serum ferritinb 90%, 9 of 10 studies 60%, 6 of 10 studies
Transferrin receptorc 56%, 5 of 9 studies 56%, 5 of 9 studies
Body iron stores 78%, 7 of 9 studies 78%, 7 of 9 studies
Zinc protoporphyrin 50%, 3 of 6 studies 67%, 4 of 6 studies
a Depends on whether the indicator was expected to rise or fall.b Transformed to logarithms.c Results were the same with or without transforming values to logarithms.

7
In the one study in which serum ferritin did not meet the criterion for success based
on the change for all subjects, neither did any other indicator. The indicator of body
iron stores calculated from serum ferritin and transferrin receptor did not perform
better than serum ferritin alone. It was not possible to distinguish between the per-
formance of haemoglobin, transferrin receptor, zinc protoporphyrin and mean cell
volume.
The analysis was based on trials that had a control group to account for secular
and random change. However, many programmes simply evaluate differences be-
tween before and after an intervention, and do not have a control group in the de-
sign. To examine whether different indicators would be selected in the absence of a
control group, two questions were asked.
First, in how many studies did the value of the indicator change in the control
group by ±0.2 SDUs? A change of this size in either direction would imply that the
indicator is not very stable. It could also indicate an additional source of iron other
than the intervention, or a change in exposure to hookworms or malaria, that re-
sulted in a change in iron status. Second, in how many studies would the wrong in-
ference have been made if there had been no control group to account for secular or
random changes?
Four studies were excluded from these analyses because they involved pregnant
women or young children among whom changes would have been expected any-
way, without any intervention. Of the remaining six studies, which were done among
schoolchildren or non-pregnant women, mean cell volume was only measured in
one study and zinc protoporphyrin in two. Table 2 shows the results of this analysis,
which indicate that serum ferritin and body iron stores performed best.
REPORT Of A TECHNICAL CONSuLTATION ON THE ASSESSMENT Of IRON STATuS AT THE POPuLATION LEvEL
TAbLe 2The results of an analysis of the stability of indicators of iron status in control groups during studies of interventions and of the inferences that would have been wrong without a control group
Indicator of iron status number of studies in which there was a significant change in the control
group of ± 0.2 SDUs
number of studies in which the inference would have been wrong
without a control group
Haemoglobin 4 of 6 2 of 6
Serum ferritin 1 of 6 1 of 6
Transferrin receptor 3 of 6 2 of 6
Body iron stores 1 of 6 1 of 6
Zinc protoporphyrin 2 of 2 1 of 2
SDus, Standard deviation units.
Based on results of the analysis presented in Table 1 and 2, it was concluded that
serum ferritin is the indicator of choice to evaluate the impact of interventions to
control iron deficiency in studies with or without control groups.
5.2 Performance of indicators to predict a change in haemoglobin concentration in response to iron intervention
A critical issue for the Consultation was to decide which current indicator represents
the best means to identify a true iron deficiency and could act as the “gold standard”
by which to evaluate alternative indicators. The change in haemoglobin concentra-
tion following intervention using iron was chosen based on the assumption that the
size of any change was likely to be strongly related to the degree of iron deficiency.
ASSESSING THE IRON STATuS Of POPuLATIONS
8
This measure has been used in previous studies (13). It has a disadvantage because
if factors other than iron deficiency contribute to anaemia, such as a vitamin A defi-
ciency, then the haemoglobin concentration will not respond to treatment with iron
alone.
A linear regression analysis was performed to examine the degree to which base-
line indicators of iron status predict a change in haemoglobin, using the following
model:
Y = β0 + β
1*X
1 + β
2*X
2 + β
3*X
1X
2 + ε
Where: Y is the change in haemoglobin concentration from baseline to follow-up
X1 is the group (control versus intervention)
X2 is the baseline iron indicator measured in SDUs
X1X
2 is the interaction between group and iron indicator
ε is the error or residual.
The coefficient of interest in this analysis is (β3) defined as the excess change in hae-
moglobin concentration for intervention over control for each additional SDU of the
selected iron indicator at baseline. A statistically significant interaction term (β3) was
interpreted to mean that the indicator was associated with a change in haemoglobin
concentration in response to intervention with iron, whether given as supplements
or as fortified food. An indicator was arbitrarily classified as successful if there was
an increase in haemoglobin concentration by ≥3 g/l for each SDU of the selected in-
dicator at baseline. An advantage of this approach is that it uses the control group to
take into account both secular trends in haemoglobin concentration and regression
to the mean. Variables that were not normally distributed were transformed to loga-
rithms to see if their predictive power could be improved.
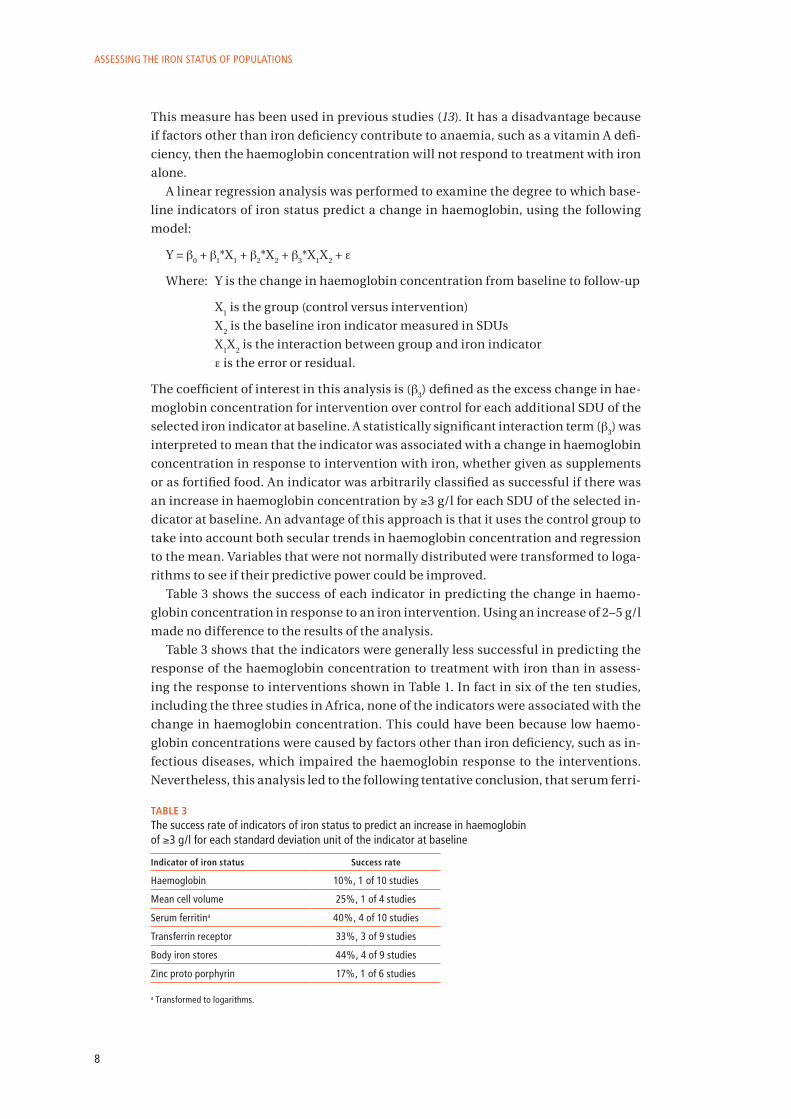
Table 3 shows the success of each indicator in predicting the change in haemo-
globin concentration in response to an iron intervention. Using an increase of 2–5 g/l
made no difference to the results of the analysis.
Table 3 shows that the indicators were generally less successful in predicting the
response of the haemoglobin concentration to treatment with iron than in assess-
ing the response to interventions shown in Table 1. In fact in six of the ten studies,
including the three studies in Africa, none of the indicators were associated with the
change in haemoglobin concentration. This could have been because low haemo-
globin concentrations were caused by factors other than iron deficiency, such as in-
fectious diseases, which impaired the haemoglobin response to the interventions.
Nevertheless, this analysis led to the following tentative conclusion, that serum ferri-
TAbLe 3The success rate of indicators of iron status to predict an increase in haemoglobin of ≥3 g/l for each standard deviation unit of the indicator at baseline
Indicator of iron status Success rate
Haemoglobin 10%, 1 of 10 studies
Mean cell volume 25%, 1 of 4 studies
Serum ferritina 40%, 4 of 10 studies
Transferrin receptor 33%, 3 of 9 studies
Body iron stores 44%, 4 of 9 studies
Zinc proto porphyrin 17%, 1 of 6 studies a Transformed to logarithms.

9
tin or transferrin receptor are the best indicators to predict a change in haemoglobin
concentration in response to iron intervention and, if both indicators are measured,
then body iron stores can be estimated as well. But these indicators were successful
in less than half of the studies analysed.
6. Indicators of inflammationThe Consultation considered that serum ferritin was the best indicator of the impact
of an iron intervention as well as being a useful indicator of depleted iron stores.
However serum ferritin is also an acute phase protein, which means that its concen-
tration rises during inflammation, so the customary thresholds to indicate an iron
deficiency of <12–15 µg/l may no longer apply. One way of dealing with this issue is
to set the threshold higher, and a threshold of <30 µg/l has been recommended in
the presence of infection, but only for children <5 years old (1). There is a need to
examine the value of using different thresholds among infected older children and
adults.
The Consultation proposed that the measurement of an acute phase protein could
help to interpret data on serum ferritin: if the concentration of the additional acute
phase protein is higher than the normal threshold it could indicate underlying in-
flammation and explain a high serum ferritin concentration in the presence of iron
deficiency.
One way of controlling for a high serum ferritin concentration resulting from in-
fection would be to use the concentration of another acute phase protein to exclude
individuals whose measurements of both indicators are above a certain threshold.
This approach is not considered feasible in many parts of sub-Saharan Africa where
many people are infected with Plasmodium spp., the cause of malaria, and are either
asymptomatic or have only mild disease and yet have high concentrations of acute
phase proteins in their blood (14). Many of the same individuals may also be chroni-
cally infected with one or more species of worms, which may also contribute to an
acute phase response as well as to anaemia and iron deficiency because of the blood
loss they cause. There may even be an acute phase response without a loss of blood.
Excluding individuals with high concentrations of acute phase protein may, in cir-
cumstances in which repeated or chronic infections are common, reduce the sample
size substantially and leave an atypical residual sample.
The Consultation felt that there was a need for the analysis of data on the relation-
ship between serum ferritin, transferrin receptor and different acute phase proteins
to assess which was best correlated with serum ferritin during different stages of in-
fection. For example, it may be possible to control for high serum ferritin concentra-
tions using one or more acute phase proteins. Several acute phase proteins could
be used for this purpose including C-reactive protein (CRP), α-1-antichymotrypsin
(ACT), α-1 acid glycoprotein (AGP), serum amyloid A, fibrinogen and haptoglobin.
The most frequently used acute phase proteins are CRP, which responds quickly
to inflammation but also subsides quickly in concentration; ACT which also rises
quickly but remains at a high concentration longer than CRP; and AGP which is slow-
er to respond than CRP or ACT but remains at a high concentration for longer than
either (15,16). The concentration of AGP maybe a better indicator than CRP or ACT of
the presence of chronic, sub-clinical infection, and may better reflect the changes in
the concentration of ferritin during infections.
REPORT Of A TECHNICAL CONSuLTATION ON THE ASSESSMENT Of IRON STATuS AT THE POPuLATION LEvEL
ASSESSING THE IRON STATuS Of POPuLATIONS
10
The Consultation proposed that data should be sought from studies in diverse
settings that have, if possible, measured haemoglobin concentration, serum ferritin
and transferrin receptor, and at least one acute phase protein, with CRP, ACT and
AGP as the first choices. Because an assay for transferrin receptor has only relatively
recently become available, data sets that do not include this measurement but have
measured another acute phase protein as well as serum ferritin would also be use-
ful. Data on the presence of infectious diseases or on malaria parasitaemia, and on
the intensity of worm infections would also be helpful to examine the relationship
between specific infections and acute phase proteins.
7. recommendations The Consultation made the following recommendations based on the analysis of
studies presented, the literature reviews, and on the debates during the Consulta-
tion.
7.1 Assessing the iron status of populations
The concentration of haemoglobin should be measured, even though not all anaemia
is caused by iron deficiency. The prevalence of anaemia is an important health indi-
cator and when it is used with other measurements of iron status the haemoglobin
concentration can provide information about the severity of iron deficiency.
Measurements of serum ferritin and transferrin receptor provide the best approach
to measuring the iron status of populations. In places where infectious diseases are
common, serum ferritin is not a useful indicator because inflammation leads to a
rise in the concentration of serum ferritin as a result of the acute phase response to
disease. If infectious diseases are seasonal, then the survey should be done in the
season of lowest transmission. In general the concentration of transferrin receptor
does not rise in response to inflammation so that, when combined with the concen-
tration of serum ferritin, it is possible to distinguish between iron deficiency and
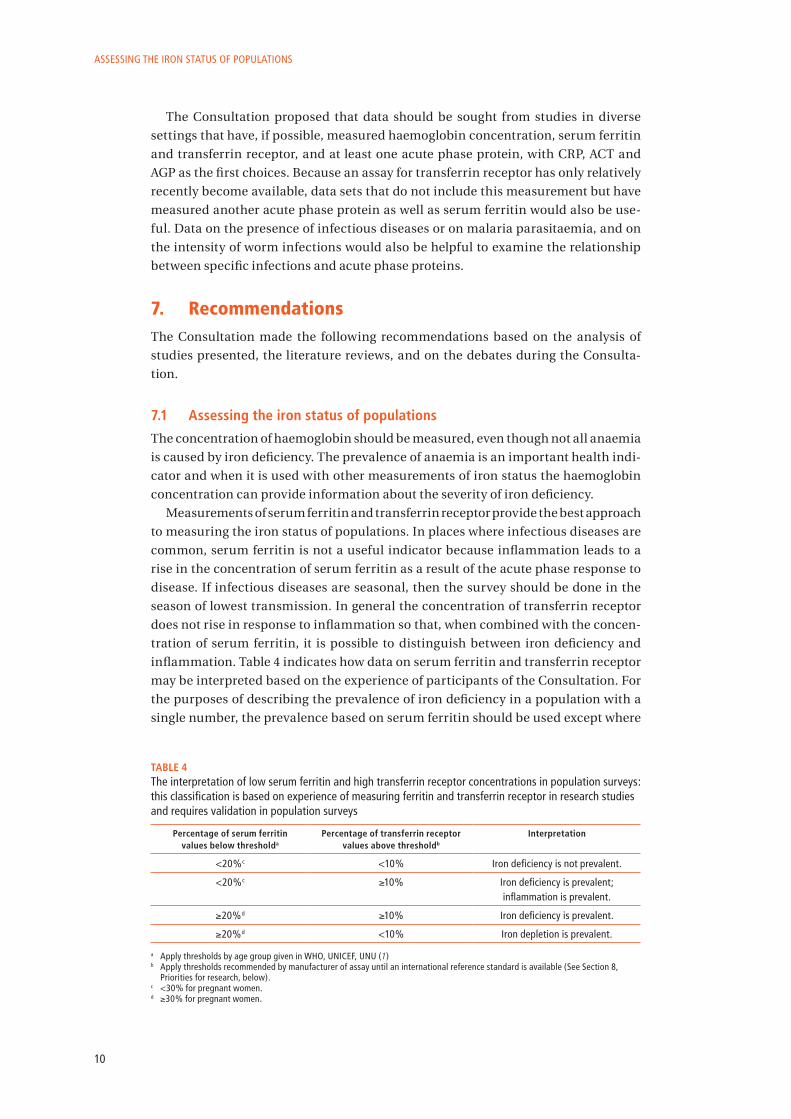
inflammation. Table 4 indicates how data on serum ferritin and transferrin receptor
may be interpreted based on the experience of participants of the Consultation. For
the purposes of describing the prevalence of iron deficiency in a population with a
single number, the prevalence based on serum ferritin should be used except where
TAbLe 4The interpretation of low serum ferritin and high transferrin receptor concentrations in population surveys: this classification is based on experience of measuring ferritin and transferrin receptor in research studies and requires validation in population surveys
Percentage of serum ferritin values below thresholda
Percentage of transferrin receptor values above thresholdb
Interpretation
<20%c <10% Iron deficiency is not prevalent.
<20%c ≥10% Iron deficiency is prevalent; inflammation is prevalent.
≥20%d ≥10% Iron deficiency is prevalent.
≥20%d <10% Iron depletion is prevalent.
a Apply thresholds by age group given in WHO, uNICEf, uNu (1)b Apply thresholds recommended by manufacturer of assay until an international reference standard is available (See Section 8,
Priorities for research, below).c <30% for pregnant women.d ≥30% for pregnant women.

11
inflammation is prevalent (Table 4, row 2) in which case the prevalence based on
transferrin receptor is more appropriate. However, the proposed classification still
requires validation in population surveys.
Studies are needed to determine the best procedures to process, transport and
store biological samples in which transferrin receptor will be measured, and to es-
tablish internationally applicable thresholds to classify the iron status of popula-
tions.
It can be useful also to measure the concentration of an acute phase protein, if
funding is available. The most commonly measured acute phase protein is CRP, but
there is evidence that AGP may better reflect the change in concentration of ferritin
in serum and may be the most useful acute phase protein to measure. A number of
commercial assays are available for measuring these proteins but, except for CRP,
there are no international reference standards available, resulting in reference rang-
es specific to each assay. In such circumstances, the threshold recommended by the
manufacturer should be used.
7.2 evaluating the impact of interventions to control iron deficiency in populations
Serum ferritin is the best indicator of a response to an intervention to control iron
deficiency and should be measured with the haemoglobin concentration in all pro-
gramme evaluations. In circumstances in which iron deficiency is the major cause of
anaemia, the haemoglobin concentration may improve more rapidly than the serum
ferritin concentration. In circumstances in which the serum ferritin concentration
improves (even when inflammation is common) but the haemoglobin concentration
does not, factors in addition to iron are likely to be the cause of anaemia.
If funding is available, it could also be useful to measure the concentration of one
or both of the acute phase proteins CRP or AGP, to account for a high serum ferritin
concentration caused by inflammation. Individuals with high values for the acute
phase protein should be excluded from the analysis, if possible, depending on the
limitations imposed by the sample size of the dataset and the consequent translation
of the results to define the iron status of the general population. This is particularly
important when repeated surveys are done and there is no control group for the in-
tervention.
If funding is available, the transferrin receptor should be measured during re-
peated surveys to classify populations according to the criteria shown in Table 4. The
combination of serum ferritin and transferrin receptor may also be used to estimate
body iron stores in populations (12). The calculation of body iron stores is not es-
sential but can be useful to estimate the amount of iron that is absorbed during an
intervention and to demonstrate a decrease in iron deficiency. However, since the
method uses measurements of serum ferritin concentration, infection may again be
a confounding factor, so an acute phase protein should be measured to exclude indi-
viduals with a high concentration.
A working group will be established to coordinate the analysis of data sets con-
taining estimates of serum ferritin, transferrin receptor and acute phase proteins
and to make suggestions about how to improve the assessment of iron status.
In three years time, another consultation will be held to evaluate the recommen-
dations made here based on the results of recent studies of assessing iron status.
REPORT Of A TECHNICAL CONSuLTATION ON THE ASSESSMENT Of IRON STATuS AT THE POPuLATION LEvEL

ASSESSING THE IRON STATuS Of POPuLATIONS
12
8. Priorities for research• There is an urgent need for an international reference material with a certified
concentration of transferrin receptor to standardize transferrin receptor assays.
• A review of existing data is needed to confirm the thresholds used in Table 4 to
derive a classification of iron status. The analysis should also examine alternative
approaches using serum ferritin alone, and with one or two acute phase proteins.
Thresholds for other indicators of iron status, such as zinc protoporphyrin, should
also be examined if possible.
• A review of existing data is needed to examine which acute phase proteins might
best be used to interpret data on serum ferritin during both acute and chronic
infections, and whether data on serum ferritin could be corrected rather than ex-
cluded. This review would identify the best acute phase protein to use and the
thresholds to apply for both the acute phase protein and serum ferritin, in health
and during infection.
• There is a need for simple instruments that can be used in the field to measure in-
dicators of iron status such as ferritin, transferrin receptor or acute phase proteins,
or simple methods to collect samples for analysis, such as dried spots of blood or
serum.
• The thresholds and ranges for all indicators of iron status need to be defined and
validated for children aged 6–24 months.
• Controlled studies are needed to further examine how body iron stores that have
been estimated using the ratio between transferrin receptor and ferritin change in
response to interventions to improve iron status.
• Additional iron intervention studies are required to assess the validity of the rec-
ommended indicators
9. references 1. WHO, UNICEF, UNU. Iron deficiency anaemia: assessment, prevention, and control.
A guide for programme managers. Geneva, World Health Organization, 2001. WHO/NHD/01.3.
2. Beard JL. Iron biology in immune function, muscle metabolism and neuronal func-tioning. Journal of Nutrition, 2001, 131:568S–579S.
3. Andrews NC. Anemia of inflammation: the cytokine-hepcidin link. Journal of Clinical Investigation, 2004, 113:1251–1253.
4. Semba RD, Bloem MW. The anemia of vitamin A deficiency: epidemiology and patho-genesis. European Journal of Clinical Nutrition, 2002, 56:271–281.
5. Beguin Y. Soluble transferrin receptor for the evaluation of erythropoiesis and iron status. Clinica Chimica Acta, 2003, 329:9–22.
6. Hess SY et al. Treatment of iron deficiency in goitrous children improves the efficacy of iodized salt in Côte d’Ivoire. American Journal of Clinical Nutrition, 2002, 75:743–748.
7. Zimmermann MB et al. Dual fortification of salt with iodine and microencapsulated iron: a randomized, double-blind, controlled trial in Moroccan schoolchildren. Amer-ican Journal of Clinical Nutrition, 2003, 77:425–432.
8. Domellof M et al. Iron supplementation of breast-fed Honduran and Swedish infants from 4 to 9 months of age. Journal of Pediatrics, 2001, 138:679–687.
9. Stoltzfus RJ et al. Low dose daily iron supplementation improves iron status and ap-petite but not anemia, whereas quarterly anthelminthic treatment improves growth, appetite and anemia in Zanzibari preschool children. Journal of Nutrition, 2004, 134:348–356.

13
10. Cogswell ME et al. Iron supplementation during pregnancy, anemia, and birth weight: a randomized controlled trial. American Journal of Clinical Nutrition, 2003, 78:773–781.
11. Thuy PV et al. Regular consumption of NaFeEDTA-fortified fish sauce improves iron status and reduces the prevalence of anemia in anemic Vietnamese women. American Journal of Clinical Nutrition, 2003, 78:284–290.
12. Cook JD, Flowers CH, Skikne BS. The quantitative assessment of body iron. Blood, 2003, 101:3359–3364.
13. Freire WB. Hemoglobin as a predictor of response to iron therapy and its use in screen-ing and prevalence estimates. American Journal of Clinical Nutrition, 1989, 50:1442–1449.
14. Beesley R et al. Impact of acute malaria on plasma concentrations of transferrin re-ceptors. Transactions of the Royal Society of Tropical Medicine and Hygiene, 2000, 94:295–298.
15. Fleck A, Myers MA. Diagnostic and prognostic significance of the acute phase proteins. In: Gordon AH, Koj A., eds. The acute phase response to injury and infection. Amsterdam, Elsevier Science Publishers B.V. (Biomedical Division), 1985: 249–271.
16. Gabay C, Kushner I. Acute phase proteins and other systemic responses to inflamma-tion. The New England Journal of Medicine, 1999, 340:448–454.
10. acknowledgementsThe World Health Organization and the Centers for Disease Control and Prevention
(CDC) would like to acknowledge the following scientists who provided data sets for
the analysis presented at the Consultation: S.Y. Hess, P. Adou, M. Zimmermann and
R. Hurrell (Côte d’Ivoire); W.K. Simmons, J.D. Cook, K.C. Bingham, M. Thomas, J. Jack-
son, M. Jackson, N. Ahluwalia, S.G. Kahn and A.W. Patterson (Jamaica); M.B. Zim-
mermann, C. Zeder, N. Chaouki, A. Saad, T. Torresani, and R.F. Hurrell (Morocco);
J. Beard and J. Haas (the Philippines); M. Domellöf, R.J. Cohen, K.G. Dewey, O. Her-
nell, L.L. Rivera and B. Lönnerdal (Sweden/Honduras); R.J. Stoltzfus, H.M. Chway,
A. Montresor, J.M. Tielsch, J.K. Jape, M. Albonico and L. Savioli (United Republic of
Tanzania); M.E. Cogswell, I. Parvanta, L. Ickes, R. Yip and G.M. Brittenham (United
States of America, Ohio); J. Beard (United States of America, Pennsylvania); P.V. Thuy,
J. Berger, Y. Nakanishi, N.C. Khan, S. Lynch, T.T. Mai, T.T. Nga, N.T. Lam (Viet Nam [ef-
fectiveness study]); P.V. Thuy, J. Berger, L. Davidsson, N.C. Khan, N.T. Lam, J.D. Cook,
R.F. Hurrell and H.H. Khoi (Viet Nam [efficacy study]). The financial support of the
CDC (Cooperative Agreement U50/CCU022336-01-1) is gratefully acknowledged.
11. List of participantsDr Pierre Adou, Country Director, Helen Keller International, Nutrition Department,
Abidjan, Côte d’Ivoire
Ms Maria Andersson, Technical Officer, Department of Nutrition for Health and
Development, World Health Organization, Geneva, Switzerland
Dr Bruno de Benoist, Medical Officer, Department of Nutrition for Health and Devel-
opment, World Health Organization, Geneva, Switzerland
Professor John Beard, Department of Nutrition Science, Pennsylvania State Univer-
sity, University Park, PA, USA
Dr Jacques Berger, Senior Researcher, Institut de Recherche pour le Développement
(IRD), Montpellier, France / Hanoi, Viet Nam
REPORT Of A TECHNICAL CONSuLTATION ON THE ASSESSMENT Of IRON STATuS AT THE POPuLATION LEvEL

ASSESSING THE IRON STATuS Of POPuLATIONS
14
Dr Francesco Branca, Istituto Nazionale di Ricerca per gli Alimenti e la Nutrizione,
Rome, Italy
Professor Gary Brittenham, Columbia University Medical Center, New York, NY,
USA
Professor Chunming Chen, Chinese Center for Disease Control and Prevention, Bei-
jing, China
Dr Christine Clewes, International Micronutritient Malnutrition Prevention and
Control (IMMPaCt) Program, Centers for Disease Control and Prevention, Atlanta,
GA, USA
Dr Mary Cogswell, Division of Nutrition and Physical Activity, Centers for Disease
Control and Prevention, Atlanta, GA, USA
Professor James Cook, Department of Medicine, University of Kansas, Kansas City,
KS, USA
Dr Lena Davidsson (formerly Swiss Federal Institute of Technology), Nutritional &
Health-Related Environmental Studies Section, International Atomic Energy
Agency, Vienna, Austria
Dr Ines Egli, Technical Officer, Department of Nutrition for Health and Development,
World Health Organization, Geneva, Switzerland
Dr Wilma Freire, Chief, Nutrition Unit, WHO Regional Office for the Americas, Pan
American Sanitary Bureau, Washington, DC, USA
Dr Laurence Grummer-Strawn, Branch Chief, Maternal and Child Nutrition, Divi-
sion of Nutrition and Physical Activity, Centers for Disease Control and Preven-
tion, Atlanta, GA, USA
Dr Andrew Hall, University of Westminster, London, UK (Rapporteur)
Dr Eva Hertrampf, Institute of Nutrition and Food Technology (INTA), University of
Chile, Santiago, Chile
Professor Lena Hulthén, Institute of Internal Medicine, Sahlgren Academy at Göte-
borg University, Sahlgren University Hospital, Göteborg, Sweden
Professor Richard Hurrell, Laboratory for Human Nutrition, Institute of Food
Science and Nutrition, Swiss Federal Institute of Technology, Zurich, Switzerland
Dr Sa’ad Kharabsheh, Secretary General, Ministry of Health, Amman, Jordan
Professor Prakash Kotecha, Preventive and Social Medicine, Government Medical
College, Vadodara, India
Professor Sean Lynch, Department of Clinical Medicine, Eastern Virginia Medical
School, Norfolk, VA, USA
Dr Zuguo Mei, Division of Nutrition and Physical Activity, Centers for Disease Con-
trol and Prevention, Atlanta, GA, USA
Dr Nguyen Xuan Ninh, Senior Researcher, Micronutrient Research Department,
National Institute of Nutrition, Hanoi, Viet Nam
Professor Omar Obeid, Department of Nutrition and Food Science, American Uni-
versity of Beirut, Beirut, Lebanon
Dr Ibrahim Parvanta, Chief, International Activities, Maternal and Child Nutrition
Branch, Division of Nutrition and Physical Activity, Centers for Disease Control
and Prevention, Atlanta, GA, USA
Dr Christine Pfeiffer, Chief, Nutrition Laboratory, Division of Laboratory Science
(DLS), National Center for Environmental Health, Centers for Disease Control and
Prevention, Atlanta, GA, USA

15
Professor Rebecca Stoltzfus, Division of Nutritional Sciences, Cornell University,
Ithaca, NY, USA (Chairperson)
Dr Anna Verster, WHO Senior Technical Advisor, Global Alliance for Improved Nutri-
tion, Geneva, Switzerland
Dr Salvador Villalpando, Instituto Nacional de Salud Publica, Center for Research on
Nutrition and Health, Cuernavaca, Mexico
Ms Trudy Wijnhoven, Technical Officer, Department of Nutrition for Health and
Development, World Health Organization, Geneva, Switzerland
Professor Pattanee Winichagoon, Deputy Director for Academic Affairs, Institute
of Nutrition, Department of Community Nutrition, Mahidol University, Nakhom
Pathom, Thailand
Professor Mark Worwood, Department of Haematology, College of Medicine, Univer-
sity of Wales, Cardiff, Wales
Dr Mark Young, Senior Health Adviser, Health Section, United Nations Children’s
Fund, New York, NY, USA
REPORT Of A TECHNICAL CONSuLTATION ON THE ASSESSMENT Of IRON STATuS AT THE POPuLATION LEvEL

ASSESSING THE IRON STATuS Of POPuLATIONS
16
App
endi
x 1.
The
mai
n bi
oche
mic
al in
dica
tors
of i
ron
stat
us
Mea
sure
men
tSa
mpl
eCo
mm
only
use
d m
etho
dsa
Uni
tsIn
dica
tor
ofA
dvan
tage
sD
isad
vant
ages
Bone
mar
row
iron
(h
aem
osid
erin
)Bo
ne m
arro
w
aspi
rate
Mic
rosc
opic
al e
xam
inat
ion
of s
tain
ed
mar
row
cel
ls
Sem
i-qua
ntita
tive
grad
ing
Dep
lete
d or
abs
ent b
ody
iron
stor
esIn
dica
tes
body
iron
sto
res
and
corr
elat
es w
ell w
ith o
ther
in
dica
tors
Inva
sive
and
trau
mat
ic to
col
lect
sa
mpl
e
Haem
oglo
bin
Who
le b
lood
Cyan
met
haem
oglo
bin
usin
g co
lorim
eter
or
spe
ctro
phot
omet
er o
r azi
de-
met
hhae
mog
lobi
n us
ing
e.g.
Hem
oCue
®
g/l
Ana
emia
Sim
ple
to m
easu
re; i
mpo
rtan
t fu
nctio
nal a
nd p
ublic
hea
lth
cons
eque
nces
Ana
emia
occ
urs
with
out i
ron
defic
ienc
y; a
djus
tmen
t of t
hres
hold
s ne
eded
for a
ge, s
ex, p
regn
ancy
, al
titud
e, s
mok
ing
and
som
e et
hnic
gr
oups
Haem
atoc
rit o
r pa
cked
cel
l vol
ume
(PCv
)
Who
le b
lood
Cent
rifug
atio
n of
who
le b
lood
in c
apill
ary
tube
or v
alue
der
ived
from
aut
omat
ed fl
ow
cyto
met
ry
Dec
imal
ratio
or %
Prop
ortio
nal v
olum
e of
RBC
s in
who
le b
lood
Sim
ple
to m
easu
re
Sam
e as
hae
mog
lobi
n; d
epen
ds
on fa
ctor
s af
fect
ing
cent
rifug
e e.
g.
stab
le p
ower
sup
ply
Mea
n ce
ll vo
lum
e (M
Cv)
Who
le b
lood
Calc
ulat
ed fr
om h
aem
atoc
rit a
nd R
BC c
ount
us
ing
haem
ocyt
o-m
eter
, or v
alue
der
ived
fr
om a
utom
ated
flow
cyt
omet
ry
fl (1
0-12 )
Aver
age
RBC
size
: low
is
mic
rocy
tic; h
igh
is
mac
rocy
tic
RBC
inde
x. A
vera
ge s
ize
of R
BCs
can
be c
hara
cter
istic
of t
ype
of
anae
mia
Requ
ires
expe
nsiv
e m
achi
ne to
be
relia
ble;
low
in th
alas
saem
ia a
nd
infla
mm
atio
n
Mea
n ce
ll
haem
oglo
bin
(M
CH)
Who
le b
lood
Haem
oglo
bin
conc
entr
atio
n an
d RB
C co
unt
usin
g ha
emoc
ytom
eter
, or v
alue
der
ived
fr
om a
utom
ated
flow
cyt
omet
ry
pg (1
0-9)
Haem
oglo
bin
in a
n av
erag
e RB
C; if
low
, hyp
ochr
omic
; if
norm
al, n
orm
ochr
omic
As
for M
Cv
Requ
ires
expe
nsiv
e m
achi
ne to
be
relia
ble;
slo
w to
resp
ond
to ir
on
defic
ienc
y
Red
cell
dist
ribut
ion
wid
th (R
DW)
Who
le b
lood
Auto
mat
ed fl
ow c
ytom
etry
cal
cula
tes
RDW
= S
tand
ard
de vi
atio
n of
MCv
MCv
%A
bnor
mal
rang
e in
siz
e of
RB
Cs <
11.5
% o
r >14
.5%
Size
dis
trib
utio
n of
RBC
s ca
n be
ch
arac
teris
tic o
f typ
e of
ana
emia
Requ
ires
expe
nsiv
e m
achi
ne to
be
relia
ble;
hig
h in
iron
defi
cien
cy; l
ow
in th
alas
saem
ia a
nd in
flam
mat
ion
Retic
uloc
yte
ha
emog
lobi
n co
ncen
trat
ion
Who
le b
lood
Auto
mat
ed fl
ow c
ytom
etry
g/
l ret
icul
ocyt
esCo
ncen
trat
ion
of
haem
oglo
bin
in n
ew R
BCs
Repr
esen
ts n
ew R
BCs
18-3
6 ho
urs
old,
thus
rece
ntly
aff
ecte
d by
defi
cien
cy
Requ
ires
expe
nsiv
e m
achi
ne to
be
relia
ble
Seru
m o
r pla
sma
iron
Seru
m o
r pla
sma
(not
usi
ng E
DTA
)Co
lorim
etry
µg
/dl
µmol
/lIro
n bo
und
to tr
ansf
errin
in
bloo
dM
easu
re o
f iro
n su
pply
to th
e bo
ne m
arro
w a
nd o
ther
tiss
ues
varie
s di
urna
lly a
nd a
fter
mea
ls;
sam
ple
easi
ly c
onta
min
ated
with
iro
n fr
om o
utsi
de s
ourc
es; l
ow in
ch
roni
c di
seas
e
Eryt
hroc
yte
prot
opor
phyr
in
Who
le b
lood
or
drie
d bl
ood
spot
su
sual
ly e
stim
ated
from
ZPP
(bel
ow);
expr
esse
d as
ratio
to h
aem
oglo
bin
conc
entr
atio
n
µg/d
l who
le b
lood
or
RBCs
Rest
ricte
d su
pply
of i
ron
to
deve
lopi
ng R
BCs
use
ful i
n yo
ung
child
ren;
who
le
bloo
d or
drie
d sp
ots
can
be
assa
yed
Incr
ease
d in
iron
defi
cien
cy,
infla
mm
ator
y di
sord
ers,
exp
osur
e to
lead
Zinc
pro
topo
rphy
rin
(ZPP
)W
hole
blo
od o
r dr
ied
bloo
d sp
ots
fluo
resc
ence
spe
ctro
phot
omet
ry o
r por
tabl
e Av
iv®
hae
mat
ofluo
rimet
erµm
ol/m
ol o
f ha
emog
lobi
nLa
ck o
f iro
n to
dev
elop
ing
RBCs
use
ful i
n yo
ung
child
ren;
who
le
bloo
d or
drie
d sp
ots
can
be
assa
yed
Incr
ease
d in
iron
defi
cien
cy,
infla
mm
ator
y di
sord
ers,
exp
osur
e to
lead

17
REPORT Of A TECHNICAL CONSuLTATION ON THE ASSESSMENT Of IRON STATuS AT THE POPuLATION LEvEL
Mea
sure
men
tSa
mpl
eCo
mm
only
use
d m
etho
dsa
Uni
tsIn
dica
tor
ofA
dvan
tage
sD
isad
vant
ages
ferr
itin
Seru
m o
r pla
sma
Imm
unoa
ssay
e.g
. enz
yme-
linke
d im
mun
osor
bent
ass
ay (E
LISA
) or
imm
unot
urbi
dom
etry
µg/l
Size
of i
ron
stor
es
Refle
cts
iron
stat
usfe
rriti
n is
an
acut
e ph
ase
prot
ein
so c
once
ntra
tion
is in
crea
sed
in
infla
mm
ator
y di
seas
e an
d su
b-cl
inic
al in
fect
ion
Tota
l iro
n bi
ndin
g ca
paci
ty (T
IBC)
Seru
m o
r pla
sma
Colo
rimet
ric a
ssay
of a
mou
nt o
f iro
n th
at
can
be b
ound
to u
nsat
urat
ed tr
ansf
errin
in
vitr
o; d
eter
min
atio
n fr
om tr
ansf
errin
co
ncen
trat
ion
mea
sure
d im
mun
olog
ical
ly
µg/d
lµm
ol/l
Tota
l cap
acity
of c
ircul
atin
g tr
ansf
errin
bou
nd to
iron
Incr
ease
d in
iron
defi
cien
cy, l
ow
in in
flam
mat
ory
diso
rder
sLa
rge
over
lap
betw
een
norm
al
valu
es a
nd v
alue
s in
iron
defi
cien
cy
Tran
sfer
rin s
atur
a-tio
nSe
rum
or
plas
ma
Calc
ulat
ed fr
om:
Seru
m ir
on
TIBC
%Sa
tura
tion
of <
15%
with
hi
gh T
IBC
indi
cate
s iro
n de
ficie
ncy
Prop
ortio
n of
tran
sfer
rin b
ound
to
iron
Sam
e as
for s
erum
iron
Tran
sfer
rin re
cep-
tor
Seru
m o
r pl
asm
aIm
mun
oass
ay e
.g. E
LISA
or i
mm
uno-
turb
idom
etry
µg/l
Refle
cts
bala
nce
betw
een
cellu
lar i
ron
requ
irem
ents
an
d iro
n su
pply
Sem
i-qua
ntita
tive
mea
sure
of
the
seve
rity
of ir
on d
efici
ency
ev
en in
pre
senc
e of
infla
mm
a-to
ry d
isor
ders
Affe
cted
by
the
rate
of e
ryth
ro-
poie
sis
Body
iron
sto
res
Seru
m o
r pl
asm
aRa
tio o
f tra
nsfe
rrin
rece
ptor
to fe
rriti
n–
[log
(TfR
/ferr
itin
ratio
) –2.
8229
] b
0.12
07
mg/
kgM
easu
re o
f bod
y iro
n st
atus
in
clud
ing
iron
defic
its,
stat
us o
f sto
rage
iron
and
iro
n ov
erlo
ad
Mea
sure
of f
ull r
ange
of i
ron
stat
us, v
alid
ated
by
phle
boto
my
stud
ies
in a
dult
volu
ntee
rs
Sam
e lim
itatio
ns a
s co
mpo
nent
pa
rts
Hep
cidi
ndi
nSe
rum
or
plas
ma,
urin
eIm
mun
oass
ay fo
r pro
-hep
cidi
n e.
g. E
LISA
ng/m
lRe
gula
tor o
f iro
n ab
sorp
tion
from
gut
Prod
uctio
n di
min
ishe
d w
hen
iron
rese
rves
dep
lete
dA
ssay
met
hods
and
inte
rpre
tatio
n of
resu
lts is
und
er d
evel
opm
ent
RBC,
red
bloo
d ce
ll.a
The
men
tion
of s
peci
fic c
ompa
nies
or o
f cer
tain
man
ufac
ture
rs’ p
rodu
cts
does
not
impl
y th
at th
ey a
re e
ndor
sed
or re
com
men
ded
by th
e W
orld
Hea
lth O
rgan
izat
ion
or th
e Ce
nter
s fo
r Dis
ease
Con
trol
and
Pre
vent
ion
in p
refe
renc
e to
oth
ers
of a
si
mila
r nat
ure
that
are
not
men
tione
d.b
Cook
, flo
wer
s, S
kikn
e (1
2).

ASSESSING THE IRON STATuS Of POPuLATIONS
18
App
endi
x 2.
Se
lect
ed b
ioch
emic
al in
dica
tors
of i
ron
stat
us a
nd a
n ac
ute
phas
e pr
otei
n w
ith
com
mon
met
hods
of m
easu
rem
ent,
cost
, var
iabi
lity,
thr
esho
lds
and
refe
renc
e m
ater
ial
Indi
cato
rCo
mm
on m
etho
d or
equ
ipm
enta
App
roxi
mat
e co
st
of e
quip
men
tU
S$
Cost
/tes
t of
sup
plie
s an
d m
ater
ials
US$
Min
imum
vol
ume
for
one
anal
ysis
Com
plex
ity
Sam
plin
g/ b
iolo
gica
l va
riab
ility
b
Thre
shol
dRe
fere
nce
mat
eria
l
Haem
oglo
bin
Hem
oCue
® p
hoto
met
er40
0<
150
µl w
hole
blo
odLo
wLo
w/lo
w11
0–13
0 g/
lcW
HO
Zinc
pro
topo
rphy
rinHa
emat
o-flu
orim
etry
e.g
. Av
Iv®
hem
ato-
fluor
imet
er5
000
150
µl w
hole
blo
odLo
wM
ediu
m/m
ediu
m>7
0–80
µg/
dl re
d bl
ood
cells
c
Not
ava
ilabl
e
Mea
n ce
ll vo
lum
ePa
rtic
le c
ount
er
e.g.
Cou
lter®
cou
nter
15 0
005
300
µl w
hole
blo
odLo
wLo
w/ l
ow<
67–8
1 flc
Not
ava
ilabl
e
Tran
sfer
rinre
cept
or
Imm
unoa
ssay
e.g
. ELI
SA5
000
10–1
510
0 µl
ser
um o
r pla
sma
Med
ium
Med
ium
/med
ium
Not
defi
nedd
Not
ava
ilabl
e
ferr
itin
Imm
unoa
ssay
e.g
. ELI
SA5
000
5–10
100
µl s
erum
or p
lasm
aM
ediu
mM
ediu
m/m
ediu
m<
12–1
5 µg
/lcW
HO
C-re
activ
e pr
otei
nIm
mun
oass
ay e
.g. E
LISA
Orio
n® Q
uick
Read
5 00
03
000
8 1050
µl s
erum
or p
lasm
a20
µl s
erum
or p
lasm
aM
ediu
mLo
wM
ediu
m/m
ediu
mM
ediu
m/m
ediu
m<
3–10
mg/
l<
5 m
g/l
IfCC
e
IfCC
e
ELIS
A, e
nzym
e-lin
ked
imm
unos
orbe
nt a
ssay
.a
The
men
tion
of s
peci
fic c
ompa
nies
or o
f cer
tain
man
ufac
ture
rs’ p
rodu
cts
does
not
impl
y th
at th
ey a
re e
ndor
sed
or re
com
men
ded
by th
e W
orld
Hea
lth O
rgan
izat
ion
or th
e Ce
nter
s fo
r Dis
ease
Con
trol
and
Pre
vent
ion
in p
refe
renc
e to
oth
ers
of a
si
mila
r nat
ure
that
are
not
men
tione
d.
b Sa
mpl
ing
varia
bilit
y de
pend
s on
ope
rato
r tra
inin
g.
c W
HO
, uN
ICEf
, uN
u (1
).d
use
thre
shol
ds re
com
men
ded
by m
anuf
actu
rer o
f ass
ay.
e In
tern
atio
nal f
eder
atio
n of
Clin
ical
Che
mis
try.

19
ANNEx 1
Indicators of the iron status of populations: red blood cell parametersSeAn LynCH

21
Contents1. Introduction 22
2. Relationship between anaemia and iron deficiency 23
2.1 Physiological control of haemoglobin levels 23
2.2 Relationship between iron deficiency and anaemia 24
3. Red blood cell parameters 26
3.1 Haemoglobin 26
3.2 Hematocrit or packed cell volume 26
3.3 Mean cell volume and mean cell haemoglobin 27
3.4 Red cell distribution width 27
3.5 Reticulocyte haemoglobin concentration and percentage of hypochromic red cells 27
4. Role of haemoglobin as a screening indicator for iron deficiency 27
5. Conclusions 28
6. References 29
INDICATORS Of THE IRON STATuS Of POPuLATIONS: RED BLOOD CELL PARAMETERS

ASSESSING THE IRON STATuS Of POPuLATIONS
22
1. IntroductionIron is an essential nutrient that plays a central role in many metabolic processes.
Aerobic metabolism is critically dependent on maintaining normal concentrations
of several iron-containing proteins that mediate oxygen transport, storage and utili-
zation, particularly when the tissue demand for oxygen is increased by physical ac-
tivity. Pioneering research over the last 50 years, much of it stemming from concepts
developed and validated experimentally by Dr Clement Finch and his coworkers, led
to the recognition that a negative iron balance resulting from an iron intake insuf-
ficient to match losses from the body despite compensatory changes in the rate of
absorption and, to a more limited extent, excretion could be divided into three stages
based on the severity of the potential effect on physiological functions. The evalua-
tion of functional impairment was related entirely to erythropoiesis for two reasons:
the effects of changes in iron status on blood elements are readily evaluated, while
the effect on the enzymes in other tissues necessitates obtaining biopsy samples.
The red blood cell pool is the largest functional iron compartment in the body. Its
requirements therefore have a dominant influence on studies of iron transport and
storage. The first stage (iron deficiency) is characterized by the absence of measur-
able iron stores; the second (iron deficient eythropoiesis) by evidence of a restricted
iron supply in the absence of anaemia; and the third (iron deficiency anaemia) by a
haemoglobin concentration that falls below the normal threshold for age and sex.
The iron indicators that can be used to identify the three stages of iron deficiency are
discussed in the other literature reviews in this annex.
WHO recognized the public health importance of nutritional anaemia over 50
years ago (1) and haemoglobin threshold values to classify anaemia were first pub-
lished in the report of a 1958 WHO Study Group (2). The thresholds were chosen arbi-
trarily. Revised thresholds were published in 1968 (3) based on a review of five earlier
reports. The following text dealing with the recommendations is taken from the 1968
report: “The report (2) of the 1958 WHO Study Group recommended haemoglobin
values below which anaemia could be considered to exist. These figures were cho-
sen arbitrarily and it is still not possible to define normality precisely (4). However,
more recent data (5–8) indicate that the values given previously should be modified.
It is recommended that, in future studies, anaemia should be considered to exist in
those whose haemoglobin levels are lower than the figures given below (the values
are given in g/100 ml of venous blood of persons residing at sea level):
children aged 6 months to 6 years: 11
children aged 6–14 years: 12
adult males: 13
adult females, non-pregnant: 12
adult females, pregnant: 11 ”
Five references were provided by WHO for the more recent data. Four referred to
published papers and one to unpublished observations. None of the published refer-
ences dealt specifically with the development of normal ranges. The first paper (5)
described a series of observations in 312 healthy Norwegian men, aged 15–21 years.
Capillary blood samples were used. A haemoglobin concentration <130 g/l was ob-
served in 3.5% of the sample. The second paper (6) was an evaluation of venous blood
samples from 149 pregnant women and did not provide any specific recommenda-
tions. The third paper (7) dealt with a series of experimental observations of venous

23
INDICATORS Of THE IRON STATuS Of POPuLATIONS: RED BLOOD CELL PARAMETERS
blood samples from 82 pregnant women. There were four groups of volunteers: one
group served as a control, one received 1000 mg iron intra-muscularly and the re-
maining two were given a dose of 39 mg oral iron either once or twice a day. The au-
thors suggested that a threshold of 104 g/l should be used to classify anaemia in the
last trimester of pregnancy. The fourth paper (8) was a report of 600 men aged 35–64
years and 200 women aged 55–64 years in Wales. Venous blood samples were used.
The study contained individuals who responded to iron therapy. No specific recom-
mendations for thresholds for anaemia were given.
The WHO thresholds cited above were used by DeMaeyer and Adiels-Tegman (9)
in their landmark paper which is still often quoted as the basis for estimates of the
global prevalence of both all anaemia and iron deficiency anaemia. DeMaeyer and
Adiels-Tegman recognized the importance of distinguishing between iron deficien-
cy and other causes of anaemia, and proposed deriving the prevalence of iron defi-
ciency anaemia by subtracting the prevalence of anaemia in men (assuming that the
prevalence of nutritional iron deficiency in this group would be negligible in most
countries) from the prevalence in other groups, thereby deriving the prevalence of
iron deficiency anaemia in these groups. By this means they calculated that gener-
ally a little less than 50% of the anaemia could be attributed to iron deficiency. They
had no way of estimating the prevalence of iron deficiency without anaemia.
The thresholds proposed by WHO in 1968 are, with minor modifications, still
regarded as the international standards for evaluating nutritional iron deficiency
anaemia. Moreover their validity has been confirmed by analyses of the US Second
National Health and Nutrition Examination Survey after excluding subjects with ab-
normal tests of iron status. The following thresholds are given in the most recent
WHO, UNICEF, UNU guide for programme managers (10):
Children 6 months to 59 months 110 g/l
Children 5–11 years 115 g/l
Children 12–14 years 120 g/l
Non-pregnant women (above 15 years of age) 120 g/l
Pregnant women 110 g/l
Men (above 15 years of age) 130 g/l
Most epidemiological surveys in developing countries have focused on women and
children. The prevalence of anaemia in men has only been used to evaluate nutri-
tional iron deficiency in a few studies. Iron deficiency anaemia is therefore still gen-
erally considered to account for about 50% of the anaemia in surveys that do not
include specific measurements of iron status.
2. relationship between anaemia and iron deficiency2.1 Physiological control of haemoglobin levels
Haemoglobin concentrations reflect the composite effects of mechanisms that con-
trol the sizes of both the red cell mass and the plasma volume. The red cell mass in
healthy human beings is maintained by the stimulation of red cell production by
the humoral factor erythropoietin. A sensing mechanism within the kidney that is
responsive to tissue oxygen concentration controls the release of eythropoietin from
renal peritubular cells.
Red cells circulate in the blood for about 90–120 days, necessitating the replace-
ment of about 1% of the red cell mass each day. In normal human beings red cell mass

ASSESSING THE IRON STATuS Of POPuLATIONS
24
is controlled by the rate of red cell production, because red cell loss due to senes-
cence is relatively fixed. Red cell mass is increased when oxygen delivery to the blood
in the lungs is reduced, such as by high altitude or smoking.
Plasma volume is determined by a complex set of hormonal and vascular factors
that control salt and water homeostasis, blood pressure and vascular permeability.
The range of normal haemoglobin concentrations used to evaluate individuals
for clinical diagnostic purposes is customarily determined from the distribution of
haemoglobin concentrations in healthy population groups. An arbitrary proportion
of the healthy population (usually 2.5%) is assumed to fall below the appropriate
threshold. The variation in haemoglobin values in healthy human beings is relatively
large; in women aged 18–49 years the mean haemoglobin concentration is 140 g/l
while the value 2 standard deviations (SD) below the mean is 120 g/l, a difference of
about 14%. Table 1 gives the normal mean values and lower limits for a Caucasian
population published in a popular current textbook of haematology.
TAbLe 1 The mean and lower standard deviation (–2 SD) of normal haemoglobin concentrations (g/l) in a Caucasian population
Age range Mean -2 SD
3–6 months 115 95
0.5–2 years 120 110
2–6 years 125 115
6–12 years 135 115
12–18 years females 140 120
12–18 years males 145 130
18–49 years females 140 120
18–49 years males 155 135
Adapted, from Hoffman (11), with permission of the publisher.
2.2 Relationship between iron deficiency and anaemia
Individuals with iron deficiency anaemia are a subset of all the anaemic individuals
in a population. They can be identified as iron deficient by using measurements of
laboratory indicator(s) that are more specifically influenced by iron status than the
haemoglobin concentration. However the proportion of low haemoglobin values is
often used alone to predict the prevalence of iron deficiency anaemia. This approach
is flawed for several reasons.
There is a significant overlap in the distribution of haemoglobin values of iron suf-
ficient individuals and those with true iron deficiency anaemia, meaning anaemia
that responds to treatment with iron. Garby et al. (12) demonstrated this by show-
ing an overlap in the distribution of haematocrit values between iron sufficient and
iron deficient individuals (determined by their responses to treatment with iron) in a
group of apparently healthy women of childbearing age from Uppsala in Sweden. In
this population a woman with a haemoglobin concentration at the WHO threshold of
120 g/l (equivalent to a haematocrit of 36%) would have a probability of only 58.5% of
being iron deficient (13). Margolis et al. (14) reported similar results for children. Two
other approaches have been used to demonstrate the overlap in the distributions of
haemoglobin values between iron deficient and iron sufficient samples of people.
Cook et al. (15) estimated the prevalence of anaemia in pregnant and non-pregnant

25
women in Latin America by resolving the distribution of haemoglobin values in the
sample into two Gaussian distributions. Using the WHO threshold for pregnant
women of 110 g/l, 23% of the women with anaemia were wrongly classified as normal
while 27% of the normal population were misclassified as suffering from anaemia.
Anaemia defined by the current WHO criteria was present in 38.5% of pregnant and
17.3% of non-pregnant women. The corresponding values based on an analysis of the
frequency distribution were 22% and 12% respectively. Cohen et al. (16) used a simi-
lar distribution analysis to identify iron deficiency anaemia in children aged 12–23
months in Guatemala. Dallman et al. (17) employed a “median shift” method to es-
timate the prevalence of iron deficiency anaemia in the United States of America.
All of these examples demonstrate the significant flaw arising from the assumption
that individuals with iron deficiency anaemia can be readily identified by applying
simple thresholds to the distribution of haemoglobin concentrations.
The value of using haemoglobin measurements to define the prevalence of iron
deficiency in healthy population groups is further diminished by the need to make
adjustments to the thresholds for individuals who live at high altitudes or smoke
regularly (18). There is also convincing evidence that there are small differences in
the distributions of haemoglobin values between different ethnic groups. Suggested
adjustments to thresholds for the ethnic groups that have been studied are given in
Table 2. It is important to note that differences in the distribution of haemoglobin
concentrations have only been established for a few ethnic groups.
TAbLe 2Suggested adjustments for several ethnic groups to the thresholds of haemoglobin concentration used by WHO to define anaemia
ethnic Group Suggested adjustment (g/l) References
African Americans -10.0 (18)
East Asian Americans 0 (18)
Hispanic Americans 0 (18)
Japanese Americans 0 (18)
American Indians 0 (18)
Jamaican girls (13–14 yrs) -10.7 (19)
Indonesians from West Indonesia 0 (20)
Thais 0 (21)
vietnamese -10.0 (22)
Greenland menGreenland women
-8.0-6.0
(23)
Several other factors limit the value of anaemia as a means to diagnose iron defi-
ciency. Iron deficiency is not the only cause of anaemia and in some circumstances
it may not be the most common cause. Vitamin A deficiency is probably the second
most frequent nutritional cause of mild anaemia, while deficiencies of folic acid,
vitamin B12
and possibly riboflavin may also cause anaemia. Inflammatory and in-
fectious diseases including malaria are undoubtedly as common as iron deficiency
as a cause of anaemia in many developing countries. Anaemia may also result from
inherited or acquired conditions that affect red cell production. People who are carri-
ers of alpha- or beta-thalassaemia are the most likely to be included in surveys. Both
carrier states may cause a mild microcytic anaemia. Finally, there may be seasonal
variations in haemoglobin concentration: variation was reported in a cross-sectional
INDICATORS Of THE IRON STATuS Of POPuLATIONS: RED BLOOD CELL PARAMETERS

ASSESSING THE IRON STATuS Of POPuLATIONS
26
study of men in Israel (24,25). Small variations may also occur during the menstrual
cycle with mean values 3 g/l lower during menses than during the luteal phase (26).
The prevalence of iron deficiency without anaemia can only be inferred if specific
iron indicators are not included in epidemiological surveys. Iron deficiency may have
functional consequences. An effect of iron deficiency without anaemia on the cogni-
tive and motor development of children has not been established although there is
considerable experimental evidence to support the contention that the functional
consequences result from tissue iron deficiency within the brain rather than from
the accompanying anaemia (27). Physical performance is known to be affected by
iron deficiency in the absence of anaemia. The maximum oxygen consumption was
reduced in iron deficient women without anaemia when compared with an iron suf-
ficient control group (28). Aerobic adaptation was improved by the administration of
iron supplements to trained and untrained women who were not anaemic (29,30).
Although functional consequences in the absence of anaemia may not have been
established for the effects of iron deficiency other than on physical performance, it
is important to emphasize again the difficulty of identifying anaemia in some indi-
viduals because of the overlap in the distribution of haemoglobin concentrations be-
tween iron deficient and iron sufficient people. Furthermore individuals whose iron
intake is marginal may or may not be anaemic at different times because of small
changes in iron intake or bioavailability.
3. red blood cell parameters3.1 Haemoglobin
The measurement of haemoglobin concentration and other red blood cell parameters is
well standardized. Laboratories that use particle counting and sizing equipment have
access to expert technical support and quality control procedures. However, practical
considerations will limit the use of such equipment, particularly during field studies in
remote regions, because it may be difficult to take blood samples to a laboratory on the
day of collection. It is therefore appropriate to focus on the use of instruments such as
the Hemocue (Hemocue AB, Ängelholm, Sweden). It is possible to get highly reproduc-
ible results when the Hemocue is used to measure the haemoglobin concentrations of
venous blood samples, but there may be considerable variability when the Hemocue
is used to measure the haemoglobin concentrations of capillary blood samples. This
variability is caused by poor capillary blood sampling techniques. The appropriate use
of the Hemocue and capillary sampling techniques is currently a very important issue
that is dealt with in a recent manual published by Helen Keller International (31). A
manual from the International Nutritional Anemia Consultative Group on “Measure-
ments of Iron Status” (32) also provides useful information.
3.2 Hematocrit or packed cell volume
The measurement of hematocrit does not supply any information about anaemia
that cannot be obtained from measuring the haemoglobin concentration. The hema-
tocrit is a derived value on particle counters. Values measured directly by centrifug-
ing blood samples in the field tend to have poor reproducibility unless a stable power
supply can be assured and the equipment is well standardized.

27
3.3 Mean cell volume and mean cell haemoglobin
Mean cell volume (MCV) and mean cell haemoglobin (MCH) provide identical in-
formation and are interchangeable in terms of their value in identifying nutritional
iron deficiency. MCV is the value that has been used most widely for the evaluation of
nutritional iron deficiency.
A low MCV is not specific to iron deficiency. Low values are encountered in thal-
assaemia (2 or 3 gene deletions for alpha thalassaemia, beta thalassaemia including
heterozygotes) and in about 50% of people with anaemia due to inflammation.
Reliable measurements of MCV require a particle counter and are therefore un-
likely to provide an advantage over specific measurements of iron status in terms of
cost and technical support.
3.4 Red cell distribution width
The initial enthusiasm for the use of red cell distribution width (RDW) to distinguish
between iron deficiency anaemia and the anaemia of inflammatory disorders has
not been supported by subsequent studies (33). Measurements of RDW are made us-
ing a particle counter.
3.5 Reticulocyte haemoglobin concentration and percentage of hypochromic red cells
Reticulocyte haemoglobin concentration has been shown to be a reliable method for
identifying iron deficiency and has been recommended for the evaluation of the ad-
equacy of the iron supply in patients undergoing dialysis for renal failure who are
receiving erythropoietin (34–38). The measurement has been compared to the “gold
standard” for iron deficiency, which is stainable bone marrow iron, and found to
be reliable. While it promises to be a useful tool for evaluating iron supply even in
clinically complex settings, it currently requires access to a specific brand of flow
cytometer. It is therefore unlikely to be helpful in developing countries. Moreover
reticulocyte haemoglobin concentrations seem to be unsuitable for evaluating iron
status in alpha and beta thalassaemias, including carrier states.
4. role of haemoglobin as a screening indicator for iron deficiency
It is generally assumed that worldwide “at least half the anaemia is due to nutritional
iron deficiency” (39) and that “up to a prevalence of iron deficiency anaemia of 40%,
the prevalence of iron deficiency will be about 2.5 times that of anaemia” (10). How-
ever, it is evident from the foregoing discussion that there are considerable variations
in both of these ratios depending on the age and sex of the people being studied,
the region of the world in which they live, and the prevalence rates of other causes
of anaemia. The prevalence of anaemia alone can therefore give only a very rough
estimate of the likely prevalence of iron deficiency anaemia. Attempts to analyse the
variation in the relationship between prevalence rates for iron deficiency and anae-
mia are confounded by the absence of a consistent standard for identifying iron defi-
ciency. There are very few studies that have used bone marrow iron, which is clearly
too invasive an indicator to be applied routinely in field studies. Various combina-
tions of iron indicators have been used, but the thresholds for iron deficiency vary.
INDICATORS Of THE IRON STATuS Of POPuLATIONS: RED BLOOD CELL PARAMETERS

ASSESSING THE IRON STATuS Of POPuLATIONS
28
For example: the threshold at which ferritin indicates iron deficiency may be set as
high as 30 µg/l in some developing countries because of the presence of infectious
diseases (40,41); thresholds for zinc protoporphyrin vary between 40 and 70 µmol/
mol haem depending on whether the cells have been washed before the assay or not
(42,43); and there is a lack of standardization between different commercial kits for
measuring the concentration of transferrin receptor.
The response of the haemoglobin concentration to treatment has long been the
primary indicator for evaluating the efficacy or effectiveness of intervention pro-
grams. It remains a satisfactory indicator for this purpose, but lacks sensitivity
when the prevalence of anaemia is low. Furthermore, if there is a significant residual
prevalence of anaemia at the end of the intervention (perhaps despite a considerable
reduction when compared with the baseline values) it may be impossible to deter-
mine whether the intervention was suboptimal or not as the residual anaemia may
be unrelated to iron deficiency. Despite the drawbacks outlined above it has been
suggested that the prevalence of anaemia may be the best epidemiological indicator
of iron status in infants and young children because of the poor performance of the
other currently available indicators (14).
5. Conclusions1. Anaemia is an inevitable consequence of iron deficiency of sufficient severity.
2. Nutritional iron deficiency anaemia is a mild anaemia because iron loss is reduced
to some extent in iron deficiency (44).
3. A significant overlap in the distributions of haemoglobin concentration of iron
deficient and iron sufficient individuals has been demonstrated in children, non-
pregnant women, and during pregnancy.
4. A low haemoglobin concentration is not a specific indicator of iron deficiency
anaemia. Other epidemiologically important causative factors include: infectious
and inflammatory disorders, the prevalence of genes for thalassaemia, vitamin A
deficiency, and deficiencies of folic acid and vitamin B12
in certain settings.
5. The current WHO thresholds provide the best separation between iron deficient
and iron sufficient individuals in a population. They should be adjusted for alti-
tude, smoking and, where information is available, ethnic origin.
6. Haemoglobin concentration can be used as an initial screening indicator. How-
ever, because of variations in the relationships between iron deficiency, iron defi-
ciency anaemia and anaemia from other causes, the prevalence of iron deficiency
cannot be predicted with any degree of accuracy. Further evaluation using spe-
cific iron indicators is necessary. It may be possible to agree on an anaemia preva-
lence below which further evaluation for iron deficiency would not be warranted
in certain age or sex groups.
7. The change in the haemoglobin concentration and the prevalence of anaemia can
be used to provide a qualitative or a semi-quantitative assessment of the efficacy
of intervention strategies, but the residual prevalence of iron deficiency cannot be
predicted.
8. Anaemia is a useful clinical and experimental criterion for defining the severity
of iron deficiency. It may be less useful in epidemiological surveys. Consideration
should be given to developing a new set of criteria, based on specific laboratory
indicators of iron status, for defining the severity of iron deficiency in epidemio-
logical surveys.

29
6. references 1. Baker SJ, DeMaeyer EM. Nutritional anemia: its understanding and control with
special reference to the work of the World Health Organization. American Journal of Clinical Nutrition, 1979, 32:368–417.
2. World Health Organization. Iron Deficiency Anaemia: Report of a Study Group. Geneva, World Health Organization, 1959. World Health Organization technical report series; no. 182.
3. World Health Organization. Nutritional anaemias: report of a WHO scientific group. Geneva, World Health Organization, 1968. World Health Organization technical report series; no. 405.
4. Wintrobe MM. Clinical Hematology. 6th ed. Philadelphia, Lea & Febiger, 1967. 5. Natvig K. Studies on hemoglobin values in Norway. V. Hemoglobin concentration and
hematocrit in men aged 15–21 years. Acta Medica Scandinavica, 1966, 180:613–620. 6. Kilpatrick GS, Hardisty RM. The prevalence of anaemia in the community. A survey of
a random sample of the population. British Medical Journal, 1961, 5228:778–782. 7. de Leeuw NK, Lowenstein L, Hsieh YS. Iron deficiency and hydremia in normal preg-
nancy. Medicine (Baltimore), 1966, 45:291–315. 8. Sturgeon P. Studies of iron requirements in infants. III. Influence of supplemental
iron during normal pregnancy on mother and infant. A The mother. British Journal of Haematology, 1959, 5:31–44.
9. Demaeyer E, Adiels-Tegman M. The prevalence of anaemia in the world. World Health Statistics Quarterly Rapport Trimestriel de Statistiques Sanitaires Mondiales, 1985, 38:302–316.
10. WHO, UNICEF, UNU. Iron deficiency anaemia: assessment, prevention, and control. A guide for programme managers. Geneva, World Health Organization, 2001. WHO/NHD/01.3.
11. Hoffman R. Hematology: Basic Principles and Practice. 3rd ed. New York, Churchill-Livingstone, 2000.
12. Garby L, Irnell L, Werner I. Iron deficiency in women of fertile age in a Swedish com-munity. 3. Estimation of prevalence based on response to iron supplementation. Acta Medica Scandinavica, 1969, 185:113–117.
13. Garby L. The normal haemoglobin level. British Journal of Haematology, 1970, 19:429–434.
14. Margolis HS et al. Iron deficiency in children: the relationship between pretreatment laboratory tests and subsequent hemoglobin response to iron therapy. American Jour-nal of Clinical Nutrition, 1981, 34:2158–2168.
15. Cook JD et al. Nutritional deficiencey and anemia in Latin America: A collaborative study. Blood, 1971, 38:591–603.
16. Cohen JH, Haas JD. The comparison of mixed distribution analysis with a three- criteria model as a method for estimating the prevalence of iron deficiency anaemia in Costa Rican children aged 12–23 months. International Journal of Epidemiology, 1999, 28:82–89.
17. Dallman PR, Yip R, Johnson C. Prevalence and causes of anemia in the United States, 1976 to 1980. American Journal of Clinical Nutrition, 1984, 39:437–445.
18. Nestel P. Adjusting Hemoglobin Values in Program Surveys. International Nutitional Anemia Consultative Group (INACG), 2002.
19. Himes JH et al. A method to estimate prevalence of iron deficiency and iron deficien-cy anemia in adolescent Jamaican girls. American Journal of Clinical Nutrition, 1997, 65:831–836.
20. Khusun H et al. World Health Organization hemoglobin cut-off points for the detec-tion of anemia are valid for an Indonesian population. Journal of Nutrition, 1999, 129:1669–1674.
21. Charoenlarp P, Polpothi T. The distribution of haemoglobin concentration in healthy Thai children. Southeast Asian Journal of Tropical Medicine and Public Health, 1987, 18:567–568.
INDICATORS Of THE IRON STATuS Of POPuLATIONS: RED BLOOD CELL PARAMETERS

ASSESSING THE IRON STATuS Of POPuLATIONS
30
22. Yip R. A Recommended Plan of Action for the Control of Iron Deficiency for Vietnam. Final Report of the 1995 Vietnam National Nutrition Anemia and Intestinal Helminth Survey. 1996.
23. Milman N et al. Iron status markers in 224 indigenous Greenlanders: influence of age, residence and traditional foods. European Journal of Haematology, 2001, 66:115–125.
24. Kristal-Boneh E et al. Seasonal changes in red blood cell parameters. British Journal of Haematology, 1993, 85:603–607.
25. Kristal-Boneh E et al. Seasonal differences in blood cell parameters and the associa-tion with cigarette smoking. Clinical and Laboratory Haematology, 1997, 19:177–181.
26. Kim I, Yetley EA, Calvo MS. Variations in iron-status measures during the menstrual cycle. American Journal of Clinical Nutrition, 1993, 58:705–709.
27. Grantham-McGregor S, Ani C. A review of studies on the effect of iron deficiency on cognitive development in children. Journal of Nutrition, 2001, 131:649S–666S.
28. Zhu YI, Haas JD. Iron depletion without anemia and physical performance in young women. American Journal of Clinical Nutrition, 1997, 66:334–341.
29. Hinton PS et al. Iron supplementation improves endurance after training in iron- depleted, nonanemic women. Journal of Applied Physiology, 2000, 88:1103–1111.
30. Brownlie T et al. Marginal iron deficiency without anemia impairs aerobic adaptation among previously untrained women. American Journal of Clinical Nutrition, 2002, 75:734–742.
31. Burger SE, Pierre-Louis JN. How to Assess Iron Deficiency Anaemia and Use of the Hemocue. Helen Keller Worldwide, 2002.
32. International Nutritional Anemia Consultative Group. Measurements of Iron Status. ILSI Press, 1985.
33. Baynes RD et al. Red blood cell distribution width in the anemia secondary to tuber-culosis. American Journal of Clinical Pathology, 1986, 85:226–229.
34. Bickford AK. Evaluation and treatment of iron deficiency in patients with kidney dis-ease. Nutrition in Clinical Care, 2002, 5:225–230.
35. Brugnara C et al. Reticulocyte hemoglobin content to diagnose iron deficiency in chil-dren. JAMA, 1999, 281:2225–2230.
36. Brugnara C. Iron deficiency and erythropoiesis: new diagnostic approaches. Clinical Chemistry, 2003, 49:1573–1578.
37. Mast AE et al. Clinical utility of the reticulocyte hemoglobin content in the diagnosis of iron deficiency. Blood, 2002, 99:1489–1491.
38. Tsuchiya K et al. Content of reticulocyte hemoglobin is a reliable tool for determining iron deficiency in dialysis patients. Clinical Nephrology, 2003, 59:115–123.
39. ACC/SCN. Third report on the world nutrition situation. Geneva, United Nations Administrative Committee on Coordination/Sub-Committee on Nutrition, 1997.
40. van den Broek NR, Letsky EA. Etiology of anemia in pregnancy in south Malawi. Amer-ican Journal of Clinical Nutrition, 2000, 72:247S–256S.
41. Asobayire FS et al. Prevalence of iron deficiency with and without concurrent anemia in population groups with high prevalences of malaria and other infections: a study in Cote d’Ivoire. American Journal of Clinical Nutrition, 2001, 74:776–782.
42. Hastka J et al. Washing erythrocytes to remove interferents in measurements of zinc protoporphyrin by front-face hematofluorometry. Clinical Chemistry, 1992, 38:2184–2189.
43. Hastka J et al. Central role of zinc protoporphyrin in staging iron deficiency. Clinical Chemistry, 1994, 40:768–773.
44. Bothwell TH et al. Iron metabolism in man. Oxford, Blackwell Scientific Publications, 1979.

31
ANNEx 2
Indicators of the iron status of populations: ferritinMARk WORWOOD


33
Contents1. Sources of data 35
2. Introduction 35
3. Genetics 35
4. Structure 36
5. Haemosiderin 36
6. Regulation of ferritin synthesis and breakdown 36
7. functions related to iron storage 37
8. Are there tumour specific ferritins? 37
9. ferritin as a regulator of erythropoiesis 38
10. Plasma (serum) ferritin 38
10.1 Relationship to storage iron levels 38
10.2 Serum ferritin in acute and chronic disease 40
10.3 Serum ferritin and liver disease 42
10.4 Serum ferritin concentration and malignancy (34) 42
10.5 Exceedingly high serum ferritin concentrations 43
10.6 High serum ferritin concentrations and congenital cataract 43
11. Biochemistry and physiology of plasma ferritin 44
11.1 Immunological properties and iron content 44
11.2 Glycosylation 44
11.3 Origin of serum ferritin and its clearance from the circulation 44
12. Red cell ferritin and its diagnostic use 45
13. ferritin in urine 46
14. Assay of serum ferritin 46
14.1 Samples 46
14.2 Pitfalls 46
14.3 Standardization 47
15. Methodological and biological variability of measures of iron status 48
16. The predictive value of indicators of iron metabolism 49
16.1 Iron deficiency anaemia in adults 50
16.2 detection of iron deficiency in acute or chronic disease 51
16.3 Iron deficiency in infancy and childhood 52
16.4 Treatment of iron deficiency anaemia 54
16.5 Screening blood donors for iron deficiency 54
16.6 Pregnancy 54
16.7 Genetic haemochromatosis 55
16.8 Secondary iron overload 55
INDICATORS Of THE IRON STATuS Of POPuLATIONS: fERRITIN

ASSESSING THE IRON STATuS Of POPuLATIONS
34
17. Population studies 55
17.1 Distribution of serum ferritin concentration in people in the united States of America and Europe 55
17.1.1 Age, sex and race 55
17.1.2 Genes modifying iron status 58
17.2 Prevalence of iron deficiency 59
17.3 Longitudinal and intervention studies 59
17.4 Iron stores in people in developing countries 60
17.5 Detection of subjects with genetic haemochromatosis 60
18. Threshold values of ferritin to determine iron status 61
18.1 Iron deficiency 61
18.2 Iron overload 61
19. using ferritin to determine the iron status of populations 62
20. using the ratio of serum transferrin receptor to serum ferritin to measure iron stores 62
21. Recommendations for future surveys of iron status 63
22. References 64
35
1. Sources of dataThis review summarises the genetics, biochemistry and physiology of serum ferritin,
discusses variables affecting the assay of ferritin, and examines how ferritin may be
used to assess the iron status of populations. It builds on a review of earlier studies
of serum ferritin concentration in health and disease by Worwood (1) and on several
national and international reviews of using serum ferritin to determine iron status
(2–4). The Centers for Disease Control and Prevention Nutrition Laboratory has re-
cently prepared a Reference Manual for Laboratory Considerations – Iron Status Indi-
cators for Population Assessments (2003), which covers all aspects of the processing of
blood samples.
2. IntroductionThe iron storage protein ferritin is found in both prokaryotes and eukaryotes. It con-
sists of a protein shell with a molecular mass of about 500 kDa composed of 24 sub-
units. The protein shell encloses a core of ferric-hydroxy-phosphate which can hold
up to 4 000 atoms of iron. Proteins with a similar overall structure are found through-
out the plant and animal kingdom as well as in bacteria, although bacterial ferritin
appears to have evolved separately as it has no amino acid sequence homology with
animal ferritins. Bacterial ferritin from Escherichia coli for example, contains haem
(about one per two subunits), as well as a core of non-haem iron. Ferritin is ancient in
evolutionary terms and also has a long biochemical history. Since it was first isolated
(5) two main issues have dominated ferritin research: its structure, and the mecha-
nism of iron uptake and release. Recently the molecular biology of ferritin has come
to the fore and the molecule has become a model for studies of how synthesis is regu-
lated at the level of genetic translation. A detailed review of the structure and func-
tion of ferritin has been published (6).
3. GeneticsA range of isoferritins is found in various human tissues. These are composed of
combinations of two types of subunit, H and L (7). The expressed gene for the H-sub-
unit is on chromosome 11 at 11q13 (8) and that for the L-subunit is on chromosome
19 at 19q13-ter. There are however multiple copies of the ferritin genes. Most of the
H sequences (about 15 copies) on a number of chromosomes appear to be processed
pseudogenes ( i.e. without introns) with no evidence for their expression. The same
applies to the other ‘L’ sequences found on chromosomes 19, 21 and X. However an
intronless gene on chromosome 5q23.1 codes for mitochondrial ferritin – a newly
identified H-type ferritin (9). For the expressed L-gene in the rat there are three in-
trons located between exons coding for the four major α-helical regions of the pep-
tide sequences. Human H and L genes have a similar structure although the introns
differ in size and sequence. The messenger ribonucleic acid (mRNA) for the human
ferritin genes contains about 1.1 kb. The H-subunit is slightly larger than the L-subu-
nit (178 amino acids compared with 174 amino acids) but on electrophoresis in poly-
acrylamide gels under denaturing conditions the apparent differences in relative
molecular mass are rather greater (21 kDa and 19 kDa). Human H and L sequences
are only 55% homologous whereas the degree of homology between L-subunits and
H-subunits from different species is of the order of 85% (6).
INDICATORS Of THE IRON STATuS Of POPuLATIONS: fERRITIN

ASSESSING THE IRON STATuS Of POPuLATIONS
36
4. StructureA ferritin subunit has five helices and a long inter-helical loop. The loop L and the
N-terminal residues are on the outside of the assembled molecule of 24 subunits. The
C-terminal residues are within the shell. H and L chains adopt the same conforma-
tion within the molecule. A description of the three-dimensional structure of apofer-
ritin will be found in a recent review (6).
In human tissues H-rich isoferritins (isoelectric point (pI) 4.5–5.0) are found in
heart muscle, red blood cells, lymphocytes, monocytes, HeLa cells and other, but
not all, cultured cells (10). L-rich isoferritins are more basic (pI 5.0–5.7) than H-rich
isoferritins and are found in the liver, spleen and placenta. The pI of ferritin is not
significantly affected by its iron content, which varies from tissue to tissue and with
the tissue iron content.
Ferritin is purified from tissues by taking advantage of three properties: the ability
to withstand a temperature of 75 °C; the high density of the iron-rich molecule, which
allows concentration by ultracentrifugation; and crystallisation in the presence of
cadmium sulphate. However it should be noted that, whereas ultracentrifugation
tends to concentrate molecules rich in H-subunits, crystallisation from cadmium
sulphate solution tends to give a lower overall recovery and selects molecules rich in
L-subunits (11).
5. Haemosiderin Ferritin is a soluble protein but is degraded to insoluble haemosiderin which accu-
mulates in lysosomes. Both ferritin and haemosiderin provide a store of iron that is
available for protein and haem synthesis. Normally much of the stored iron in the
body (about 1 g in men and less in pre-menstrual women and children) is present as
ferritin, but during iron overload the proportion present as haemosiderin increases.
Purified preparations of ferritin always contain a small proportion of molecules in
the form of dimers, trimers and other oligomers (12). These may be intermediates
in the formation of haemosiderin. Andrews et al. (13) isolated a soluble ferritin from
iron-loaded rat liver lysosomes which contained a peptide of molecular mass 17.3
kDa which may be a precursor of insoluble haemosiderin. Peptides extracted from
preparations of haemosiderin have been found to react with antibodies to ferritin
(14,15).
6. regulation of ferritin synthesis and breakdown Ferritin synthesis is induced by administering iron. In 1966 Drysdale and Munro (16)
showed that the initial response of apoferritin synthesis to the administration of iron
was by regulating translation rather than transcription. This requires the movement
of stored mRNA from the ribonucleoprotein fraction (RNP) to the polysomes (17) fol-
lowed by an increased rate of translation of ferritin subunits. This response is the
same for H and L subunits. However, after administering iron there is an eventual
increase in the rate of transcription of the L-subunit gene. This causes an increase
in the ratio of L- to H-subunits during ferritin synthesis after administering iron
(18). The translational control mechanism involves the 5’ untranslated region of the
ferritin mRNA which contains a sequence forming a ‘stem-loop’ structure. This is
called an ‘iron response element’ (IRE). Similar cytoplasmic proteins (IRP- and -2)

37
bind to the IRE in the absence of iron but are inactivated (IRP-1) or degraded (IRP-2)
when iron supply increases (19). Binding to mRNA prevents ferritin synthesis, but
in the absence of binding, polysomes form and translation proceeds. The protein
IRP-1 is the iron-sulphur protein, aconitase, encoded by a gene on chromosome 9
which functions as a cytosolic aconitase in its iron-replete state. A model involving
conformation changes which permit RNA binding has been proposed (20). A related
mechanism operates in reverse for the transferrin receptor. Here there are stem-loop
sequences in the 3’ untranslated region, and protein binding prevents degradation
of mRNA. Hence iron deficiency enhances transferrin receptor synthesis. Erythroid
ALA synthase, aconitase, DMT1 and ferroportin-1 also have IREs.
Although ferritin is generally considered to be an intra-cellular protein and most
of the mRNA in the liver is associated with free ribosomes, there is evidence of the
synthesis of ferritin on membrane-bound polysomes (21). This finding may be of spe-
cial relevance to the origin of plasma ferritin (see below).
The way in which ferritin is degraded remains largely a mystery. Studies of rat liver
cells (16) indicate that the half-life of a ferritin molecule is about 72 hours, and is
extended by iron administration. The relationship between ferritin breakdown and
formation of haemosiderin is unclear, as is the fate of the iron core after the degrada-
tion of the protein shell.
7. Functions related to iron storageThe major function of ferritin is clearly to provide a store of iron which may be used for
haem synthesis when required. Iron uptake in vitro requires an oxidizing agent, and
iron release requires a reducing agent (reviewed by Harrison and Arosio (6). There are
differences in the rate of iron uptake between apoferritins with varying proportions
of H and L-subunits; H-rich isoferritins having the highest rate of iron uptake in vitro
(22). Such isoferritins are found in cells which either have a high requirement for iron
for haem synthesis, such as nucleated red cells and cardiac muscle, or which do not
appear to be involved in iron storage, such as lymphocytes. In the tissues where iron
is stored, such as the liver and spleen, the ferritin contains mostly L-subunits. Recent
studies with recombinant H24
and L24
molecules have demonstrated that the ferroxi-
dase activity of ferritin is a property of the H-subunit and that L24 molecules have lit-
tle ability to catalyse iron uptake (6). The maturation of monocytes to macrophages
in vitro is associated with the loss of acidic isoferritins (23). Iron storage therefore
seems to require ferritin that is rich in L-subunits.
8. are there tumour specific ferritins?There has been considerable interest in specific ‘carcino-fetal’ ferritins , which are
molecules peculiar to fetal or malignant cells. This term originated in a paper by Al-
pert et al. (24) to describe the acidic ferritins found in rat fetal liver cells and in some
neoplastic tissues. It is now accepted that the variation in isoelectric point of ferritin
molecules from various tissues is effectively explained in terms of the two-subunit
model of Arosio et al. (7). Later, Moroz et al. (25) chose human placental ferritin as
a possible source of unique, antigenic “onco-fetal” ferritin, and produced a mono-
clonal antibody (H9) which bound to placental ferritin but not to liver or spleen ferri-
tin. Recently the unique subunit in placental ferritin has been fully characterised (26)
and named placental immunomodulatory ferritin (PLIF). The PLIF coding region is
INDICATORS Of THE IRON STATuS Of POPuLATIONS: fERRITIN

ASSESSING THE IRON STATuS Of POPuLATIONS
38
composed of ferritin heavy chain (FTH) sequence lacking the 65 C-terminal amino
acids, which are substituted with a novel 48 amino acid domain (C48). In contrast to
FTH, PLIF mRNA does not include the iron response element in the 5’-untranslated
region, suggesting that PLIF synthesis is not regulated by iron. The authors suggest
that the p43 subunit of PLF may represent a dimer of PLIF (22 kDa). Furthermore,
PLIF transcripts exist at a very low copy number compared with ferritin heavy chain
in placental tissues at term delivery (40 weeks). Despite the development of an im-
munoassay for placental isoferritin (27) the assay has not been widely exploited in
the diagnosis of cancer and its specificity for malignancy has not been established.
Low concentrations of placental ferritin in serum during pregnancy may indicate
abnormal gestation (28).
9. Ferritin as a regulator of erythropoiesisA role for ferritin in the regulation of haemopoiesis, apparently unrelated to iron stor-
age, was proposed by Broxmeyer et al. (29) who showed that the protein responsible
for a ‘leukaemia-associated inhibitory activity’ (LIA) was an acidic isoferritin. This
protein fraction, and an acidic isoferritin preparation from the spleen of a patient
with chronic myeloid leukaemia, suppressed colony formation in vitro of CFU-GM,
BFU-E and CFU-GEMM progenitor cells from the marrows of normal donors, but was
ineffective in marrow or blood from patients with acute leukaemia, myelodysplasia
and some other haematological disorders.
Ferritin appears to act in vitro on progenitors which are in the DNA synthesis (S)
phase of the cell cycle (30). Sala et al. (31) were unable to confirm the original results
of Broxmeyer et al. (29) and since 1992 there has been little work on this inhibitory
activity of ferritin.
10. Plasma (serum) ferritinIt was only after the development of a sensitive immunoradiometric assay (IRMA)
that ferritin was detected in the serum or plasma of normal individuals (32). Reli-
able assays, both radioimmunoassay (RIA) using labelled ferritin and IRMA using
labelled antibody, have been described in detail (33). These assays have since been
supplanted by enzyme linked immunoassays (ELISA) using colorimetric and fluo-
rescent substrates or by antibodies with chemiluminescent labels. The solid phase
may be a tube, bead, microtitre plate or magnetic particle. Numerous variations have
been described and serum ferritin is included in the latest batch and random access,
automated analysers for immunoassays.
10.1 Relationship to storage iron levels
Serum ferritin concentrations are normally within the range 15–300 µg/l and are
lower in children than adults (Table 1 and 2). Mean values are lower in women be-
fore the menopause than in men, reflecting women’s lower iron stores caused by the
losses during menstruation and childbirth. The changes in serum ferritin concentra-
tion during development from birth to old age reflect changes in the amounts of iron
stored in tissues (34). A mother’s iron status appears to have relatively little influence
on the concentration in cord serum, and mean values are in the range 100–200 µg/l.
There is a good correlation between serum ferritin concentration and storage iron

39
INDICATORS Of THE IRON STATuS Of POPuLATIONS: fERRITIN
TAbLe 1 The normal range in mean serum ferritin concentration (µg/l) of adults by sex and age groupa
Men Women
Age range (years)
Sample size Mean serum ferritin
concentration (µg/l)
5th percentile 95th percentile
Sample size
Mean serum ferritin
concentration (µg/l)
5th
percentile
95th percentile
18–24 107 80 15 223 96 30 5 73
25–34 211 108 21 291 226 38 5 95
35–44 202 120 21 328 221 38 5 108
45–54 166 139 21 395 177 60 5 217
55–64 140 143 22 349 162 74 12 199
65–74 127 140 12 374 138 91 7 321
75+ 80 110 10 309 99 77 6 209
Total 1033 121 16 328 1119 56 5 170
a Subjects being treated with drugs for iron deficiency (n = 26) were included.Adapted from White et al. (40), with permission of the publisher. for other surveys of populations in North America and Europe, see Cook et al. (42), finch et al. (43), Jacobs and Worwood (44), Milman et al. (45), valberg et al. (46), Custer et al. (47).
TAbLe 2 The mean and normal range in the serum ferritin concentration (µg/l) of infants, children and adolescents
Number of children
Age Population Selection Mean serum ferritin
concentration (µg/l)
Range serum ferritin
concentration (µg/l)
Reference
46 0.5 months Helsinki Non-anaemic 238 90–628 Saarinen and Siimes (48)
46 1 month Helsinki Non-anaemic 240 144–399 Saarinen and Siimes (48)
47 2 months Helsinki Non-anaemic 194 87–430 Saarinen and Siimes (48)
40 4 months Helsinki Non-anaemic 91 37–223 Saarinen and Siimes (48)
514 0.5–15 yearsa San francisco Non-anaemic 30b 7–142 Siimes et al. (49)
323 5–11 years Washington Low income families
21b 10–45c Cook et al. (42)
117 5–9 years Nutrition Canada Survey
Random 15d 2–107e valberg et al. (46)
335 6–11 years Denmark Random, urban 29a 12–67f Milman and Ibsen (50)
126 male 125 female
12–18 years Washington Low incomefamilies
23b
21b
10–63c
6–485Cook et al. (42)
98 male 106 female
10–19 years Nutrition Canada Survey
Random 18d
17d
3–125e 2–116e
valberg et al. (46)
269 male 305 female
12–17 years Denmark Random, urban 28b
25b
11-68f
6–65f
Milman and Ibsen (50)
a There were no significant differences in median values for ages 6–11 months, 1–2, 2–3, 4–7, 8–10 and 11–15 yearsb Medianc 10–90 percentile d Geometric meane Confidence intervalf 5–95% interval
ASSESSING THE IRON STATuS Of POPuLATIONS
40
mobilized as a result of phlebotomy. This suggests a close relationship between the
total amount of stored iron and the serum ferritin concentration in normal individu-
als (35). Serum ferritin concentration decreases with blood donation (36–38) and
increases with alcohol intake (36,39,40). The significant association with alcohol
consumption in both men and women has been confirmed in the Health Survey for
England (40). In this survey the ferritin concentration was also higher with increasing
body mass index. In women after the menopause the ferritin concentration increases
but remains lower than in men (Table 1 and 6). In unselected elderly patients a high
concentration of ferritin is often associated with disease (41). The serum ferritin con-
centration is relatively stable in healthy persons (see below). In patients with iron
deficiency anaemia, the serum ferritin concentration is typically less than 12–15 µg/l.
This threshold has been established in a number of studies by determining the se-
rum ferritin concentrations of patients with iron deficiency anaemia (see below) and
a reduction in the level of reticuloendothelial iron stores is the only, common, cause
of a low serum ferritin concentration. This is the key to the use of the serum ferritin
assay in clinical practice (34). A high concentration of serum ferritin is found during
iron overload, but there are other causes as well.
10.2 Serum ferritin in acute and chronic disease
The acute phase refers to a series of events that occur in response to infection or tis-
sue damage. The local reaction is termed inflammation and the systemic response
is referred to as the acute phase response. The acute phase response may be induced
by toxic chemicals, physical trauma, infection, inflammation, malignancy, tissue
necrosis (e.g. myocardial infarction) and immunisation. The clinical and metabolic
features of the acute phase response include fever, leucocytosis, thrombocytosis and
metabolic alterations, as well as changes in the concentration of a number of plasma
proteins. The changes in several plasma proteins including ferritin during infection,
inflammation and trauma are discussed in the review by Northrop-Clewes.
In the anaemia of chronic disease the most important factor controlling serum
ferritin concentration is the level of storage iron. However the serum ferritin con-
centration is higher than in patients with similar levels of storage iron but without
infection and inflammation. There is experimental evidence from studies of rat liver
cells that the rapid drop in serum iron concentration which follows the induction of
inflammation may be due to an increase in apoferritin synthesis which inhibits the
release of iron to the plasma (51). Interleukin-1 (IL-1) is the primary mediator of the
acute-phase response which, in iron metabolism, is indicated by a drop in plasma
iron concentration (52). There is direct evidence from studies of cultured human
hepatoma cells that IL-1ß (which also causes changes in protein synthesis which
mimic the acute phase response in cultured hepatoma cells) directly enhances the
rate of ferritin synthesis by control of translation (53).
Few longitudinal studies of serum ferritin have been reported. After experimen-
tally inducing fever in normal volunteers, ferritin concentrations reached a maxi-
mum after 3 days and gradually returned to normal values over the next 10 days (54).
The increases were relatively small, with ferritin concentrations increasing by about
20 µg/l per 24 hour after giving etiocholanolone. After acute infection, there were
increases of about 3 fold in serum ferritin concentration, with the maximum con-
centration reached within 1 week (55). Concentrations then declined slowly over sev-
eral weeks. After myocardial infarction, ferritin concentrations began to rise after 30

41
INDICATORS Of THE IRON STATuS Of POPuLATIONS: fERRITIN
hours, reached a peak after about 4 days, and then remained above initial levels for up
to two weeks (55,56). The increases in serum ferritin were smaller than those found
for acute infection. After surgery there was a rapid decline (in 2 days) in the concen-
tration of haemoglobin, serum iron and transferrin, with the greatest fall shown by
serum iron (57). The concentration of C-reactive protein (CRP) rose less rapidly from
<5 mg/l to over 100 mg/l, reaching a maximum value at 5 days, and then declined to
normal values over the subsequent 4 weeks. Most of the decrease was in the first 10
days. Ferritin increased to a maximum concentration at about 5 days, but the mean
increase was less than 50%. After 4 weeks values returned to those before surgery.
Serum transferrin receptor (sTfR) concentrations showed little change after surgery.
The combined effect of these changes on blood viscosity and erythrocyte aggrega-
tion may be detected by directly measuring plasma viscosity or the erythrocyte sedi-
mentation rate (ESR). Changes occur slowly and these measures are of greater use in
monitoring chronic disease than in detecting the immediate response to injury.
The Expert Panel on Blood Rheology of the International Committee for Stand-
ardization in Haematology (ICSH), has published guidelines on measuring the ESR
and blood viscosity (58). Suitable methods for determining the CRP concentration
include nepholometry and turbidimetry, and they should be able to detect the pro-
tein at concentration as low as 5 mg/l. An international reference standard is avail-
able (59).
Many clinical studies have demonstrated that patients with anaemia of chronic
disease and no stainable iron in the bone marrow may have a serum ferritin con-
centration considerably in excess of 15 µg/l and there has been much debate about
the practical application of the serum ferritin assay in this situation (60). A ferritin
concentration of <15 µg/l indicates the absence of storage iron while concentrations
>100 µg/l indicate the presence of storage iron. Concentrations in the range of 15–100
µg/l serum ferritin are difficult to interpret. It would seem logical to combine the
assay of serum ferritin with a measure of disease severity such as the ESR or the con-
centration of CRP. Witte et al. (61) described such an approach and claimed to be able
to confirm or exclude iron deficiency, defined as an absence of stainable iron in the
bone marrow, in almost all patients with secondary anaemia. However these findings
have not been confirmed (62). This lack of success in “correcting” serum ferritin con-
centrations for the effect of inflammation or infection is probably due to the different
responses to acute disease shown by ferritin and CRP. Although other acute phase
proteins may show similar responses in time, the small changes in concentration
reduce the value of the marker as an indicator of disease. Minor infections in chil-
dren, without changes in other markers of infection, may cause long-term increases
in serum ferritin concentration (63). Minimal inflammation, detected using a high-
ly sensitive assay for CRP, led to a low serum iron concentration in infants (64). As
described earlier, measurements of soluble transferrin receptor concentration may
provide a valuable diagnostic aid for this difficult area of nutritional assessment.
In assessing of the adequacy of iron stores to replenish haemoglobin, the degree of
anaemia must also be considered. Thus a patient with a haemoglobin concentration
of 100 g/l may benefit from iron therapy if the serum ferritin concentration is below
100 µg/l (65). This is discussed below in terms of the predictive power of diagnostic
tests.

ASSESSING THE IRON STATuS Of POPuLATIONS
42
10.3 Serum ferritin and liver disease
The other major influence confounding the use of the serum ferritin concentration
to estimate iron stores is liver disease. The liver contains much of the iron stored
in the body, and any process that damage liver cells will release ferritin. It is also
possible that liver damage may interfere with clearance of ferritin from the circula-
tion. It was suggested by Prieto et al. (66) that the ratio of serum ferritin to aspartate
aminotransferase activity might provide a good index of liver iron concentration.
Glycosylated ferritin concentrations might be related directly to storage iron con-
centrations, while the concentration of non-glycosylated ferritin would relate to the
degree of liver damage (67). However neither the ferritin:aspartate aminotransferase
ratio (68,69) nor the measurement of glycosylated ferritin concentration (33,70) have
proved to be any more reliable than the simple measurement of serum ferritin con-
centration as an index of liver iron concentration. In patients with liver damage a low
serum ferritin concentration always indicates absent iron stores, a normal concen-
tration indicates absent or normal iron stores but rules out iron overload, whereas a
high concentration may indicate either normal or high iron stores and further inves-
tigation may be necessary to distinguish between the two.
10.4 Serum ferritin concentration and malignancy (34)
A high concentration of ferritin is seen in most patients with pancreatic carcinoma,
lung cancer, hepatoma and neuroblastoma, although in most cases of cancer of the
oesophagus, stomach and colon, the serum ferritin concentration is within the nor-
mal range. In breast cancer, the concentration is usually raised in patients with met-
astatic disease, but the assay has not proved to be useful in predicting metastasis.
Patients with acute leukaemia generally have a higher serum ferritin concentration
than normal but this is not the case for patients with chronic leukaemia. In Hodg-
kin’s disease the concentration of ferritin increases with the stage of disease, but is
not related to the histological type of disease.
The concept of carcino-fetal ferritin has been introduced above and a logical ex-
tension of the concept is to search for changes in the immunological properties of
serum ferritin in order to detect malignant disease or monitor the effect of therapy.
A number of assays have been described using acidic isoferritins derived from HeLa
cells (71–73) or heart ferritin (74,75) and have been applied to serum from patients
with cancer. The results have been inconsistent, but later studies using a monoclonal
antibody (76) confirm some of the studies with polyclonal antisera and indicate that
the concentration of H-rich isoferritin in serum is very low compared with L-rich
isoferritins, even in patients with cancer. An assay for placental isoferritin has not
improved tumour specificity (see above). It is likely that the high concentration of
ferritin in the serum in malignancy is due to an increase in the concentration of stor-
age iron, to liver damage, or to inflammation, as well as a consequence of the direct
release of ferritin from the tumour. Whatever the cause is, the result is an increase
in the concentration of L-rich isoferrritin in the serum rather than accumulation of
‘tumour-specific’ isoferritins.

43
10.5 exceedingly high serum ferritin concentrations
The factors controlling plasma ferritin concentration are: 1) synthesis, 2) release from
cells), 3) clearance from the plasma (Figure 1). There are no instances yet known in
which a very high ferritin concentration is due to abnormalities in ferritin clearance,
but abnormalities occur in both synthesis and release.
In iron overload the serum ferritin concentration is unlikely to exceed 4 000 µg/l in
the absence of concomitant liver damage (33) but in liver necrosis the ferritin con-
centration may be in excess of 50 000 µg/l (66). The stimulation of synthesis by a com-
bination of iron and cytokines can lead to a ferritin concentration of >20 000 µg/l in
adult-onset Still’s disease (77,78). In the reactive haemophagocytic syndrome there
is an inappropriate activation of monocytes leading to haemophagocytosis and cy-
tokine release. A ferritin concentration of up to 400 000 µg/l has been reported in
children (79,80) and adults (81). Patients with acquired immunodeficiency syndrome
(AIDS) may also have a reactive haemophagocytosis syndrome and high concentra-
tions may also occur in AIDS sufferers with disseminated histoplasmosis (82).
INDICATORS Of THE IRON STATuS Of POPuLATIONS: fERRITIN
Cytosolic ferritin (O) is released directly from damaged cell membranes into plasma or secreted (top) after synthesis on membrane bound polysomes and glycosylation (O). In the circulation non-glycosylated ferritin may interact with ferritin binding proteins followed by removal of the complex from the circulation. Many cells also carry ferritin receptors, presumably for both secreted ferritin and cytosolic ferritin (see text). Injection of spleen ferritin into the circulation in man is followed by rapid uptake by the liver. Adapted from Worwood (83), with permission of the publisher.
FIGURe 1A diagrammatic representation of a macrophage (left), plasma in the centre, and on the right, a liver parenchymal cell
10.6 High serum ferritin concentrations and congenital cataract
An interesting cause of a high ferritin concentration in the absence of iron overload
is associated with inherited cataract formation. In has now been demonstrated that
mutations in the ‘stem loop’ structure of the ferritin L subunit may lead to synthesis
of the ‘L’ subunit of ferritin that is no longer regulated by iron concentration (84). This
causes an increase in the serum ferritin concentrations up to about 1 000 µg/l) in the
absence of iron overload.
Phagocytes HepatocytesPlasma

ASSESSING THE IRON STATuS Of POPuLATIONS
44
11. Biochemistry and physiology of plasma ferritin11.1 Immunological properties and iron content
Plasma ferritin resembles liver or spleen ferritin immunologically and is recognised
by polyclonal or monoclonal antibodies raised against these ferritins (see above). In
patients with iron overload plasma ferritin has a relatively low iron content in puri-
fied preparations of 0.02–0.07 µg iron/µg protein (85,86) or a mean of 0.06 µg iron/µg
protein when measured by immunoprecipitation (87). Purified horse serum ferritin
has an iron content of <0.01 µg iron/µg protein (88). In the liver and spleen of patients
with iron overload the iron content of ferritin is >0.2 µg iron/µg protein. Despite
these findings several recent papers have indicated that serum ferritin has a much
higher iron content. In 1997 ten Kate et al. (89) purified ferritin by immuno-precipita-
tion and measured the iron content by atomic absorption spectrophotometry. They
found a mean iron saturation of ferritin of 24% in normal serum giving a concentra-
tion of 0.13 µg iron/µg protein. They suggested that the extensive purification used
in earlier studies had lead to a loss of iron, although this is unlikely unless reducing
agents were present in the buffers used. Herbert et al. (90) claimed that the measure-
ment of serum ferritin iron by a similar procedure provided an accurate assessment
of the whole range of human body iron status, unconfounded by inflammation. Later
Nielsen et al. (91) determined the iron content of serum ferritin derived from patients
with iron overload and tissue damage using the method of ten Kate et al. (89). The
iron saturation was about 5% and they found that the assay for ferritin iron was of lit-
tle benefit in the diagnosis of iron overload. Yamanishi et al. (92) determined ferritin
iron concentrations from 0.02 to 0.04 µg iron/µg ferritin protein in serum samples
with ferritin concentrations greater than 2 000 µg/l. It should be pointed out that in
1956 Reissmann and Dietrich found that iron-rich ferritin was only detectable in the
circulation after liver necrosis (93). Another consideration is that, in a normal subject
with a serum iron concentration of 20 µmol/l and a serum ferritin concentration of
100 µg/l, the ferritin iron concentration would be only 1% of the transferrin iron con-
centration, even if the iron content is assumed to be high (0.15 g/µg protein). Clearly
specific antibodies and the effective washing of the immunoprecipitate are essential
if ferritin iron is to be detected.
11.2 Glycosylation
On isoelectric focusing both native and purified serum ferritin display a wide range
of isoferritins covering the pI range found in human tissues (85,94) yet on anion ex-
change chromatography, serum ferritin is apparently a relatively basic isoferritin
(85). The reason for this discrepancy and the heterogeneity of ferritin on isoelectric
focusing appears to be glycosylation. In normal serum about 60% of ferritin binds to
concanavalin A (67) whereas tissue ferritins do not bind. Incubation with neurami-
nidase converts the acidic ferritins of serum to the basic isoferritins but the pI of
acidic heart ferritin is unaffected (95). A carbohydrate containing G subunit has also
been identified in purified preparations of serum ferritin in addition to the H and L
subunits (86,96).
11.3 Origin of serum ferritin and its clearance from the circulation
These findings suggest that some ferritin may enter the circulation by secretion,
rather than by release from damaged cells. In hepatocytes there is direct evidence of

45
regulated secretion of glycosylated ferritin (97). Secreted ferritin may originate from
phagocytic cells that degrade haemoglobin (Figure 1). When there is tissue damage,
direct release of cytosolic ferritin through damaged cell membranes becomes im-
portant. In patients with ferritinaemia resulting from necrosis of the liver, the plas-
ma ferritin shows reduced binding to concanavalin A (67). Findings in patients with
haemophagocytosis or in the early stages of haemochromatosis confirm the impor-
tance of phagocytic cells (see below).
Another explanation for the differences between plasma and tissue ferritins may
be differences in their clearance from the circulation. Plasma ferritin labelled with
[131 I] was removed only slowly [T½<24h] from the plasma of normal subjects after
intravenous injection (98) but spleen ferritin labelled in the same way was cleared
very rapidly with a T½ of about 9 minutes (99). Such a rapid clearance may be due
to interaction with ferritin receptors on hepatocytes (100) which appear to have a
higher affinity for liver ferritin than for serum ferritin, at least in experiments on rats.
Rapid clearance may also be initiated by interaction with ferritin binding proteins
in the plasma (101–104). Several isoferritins may be released into the plasma but the
ones which normally accumulate are L24
molecules and glycosylated molecules that
are rich in L-subunits and again contain little iron. The L24
molecules take up iron
slowly in vitro and have been termed ‘natural apoferritin’ (105). These molecules may
accumulate in the plasma because their clearance by receptors, or their interaction
with binding proteins, requires at least some H-subunits. The glycosylated protein
may have little opportunity to acquire iron during secretion.
12. red cell ferritin and its diagnostic useThe ferritin present in circulating erythrocytes is but a tiny residue of the amount
in its nucleated precursors in the bone marrow. Normal erythroblasts contain fer-
ritin which is immunologically more similar to heart ferritin than liver ferritin (i.e.,
ferritin rich in H-subunits) and mean concentrations are about 10 fg ferritin protein/
cell (106). The concentration declines throughout the process of cell maturation and
only about 10 ag/cell (10-18 g/cell) remains in the erythrocyte when measured with
antibodies to L-ferritin, with a somewhat higher concentration detected using anti-
bodies to H-type ferritin (107,108). Red cell ferritin concentration has generally been
measured with antibodies to L-ferritin and reflects the iron supply to the erythroid
marrow. The concentration tends to vary inversely with the red cell protoporphyrin
concentration (107). Thus in patients with rheumatoid arthritis and anaemia, a low
concentration is found in those with microcytosis, and a low serum iron concentra-
tion is observed regardless of the serum ferritin concentration (109). The red cell fer-
ritin concentration does not therefore necessarily indicate the concentration of iron
in storage. The red cell ferritin concentration may be useful to differentiate between
hereditary haemochromatosis and alcoholic liver disease (110) and possibly to dis-
tinguish heterozygotes for haemochromatosis from normal subjects (107). The mean
red cell ferritin content in patients with untreated inherited haemochromatosis was
found to be about 70 times normal, and fell during phlebotomy. In some patients the
concentration was still high after phlebotomy even when the serum ferritin concen-
tration was within the normal range. This was shown to reflect the concentration of
iron in liver parenchymal cells, which was still higher than normal (110). Further-
more the ratio of red cell ferritin (ag/cell) to serum ferritin (µg/l) was found to be
about 0.5 in hereditary haemochromatosis but only 0.03 in patients with alcoholic
INDICATORS Of THE IRON STATuS Of POPuLATIONS: fERRITIN
ASSESSING THE IRON STATuS Of POPuLATIONS
46
cirrhosis, thus clearly separating the two conditions. There may also be advantages
of red cell ferritin over the assay of serum ferritin to estimate iron stores in patients
with liver damage because the red cell ferritin concentration should not be greatly
influenced by the release of ferritin from damaged liver cells. However, a high con-
centration of red cell ferritin is also found in individuals with thalassaemia (111,112),
megaloblastic anaemia (113) or myelodysplastic syndromes (108) presumably indi-
cating a disturbance of erythroid iron metabolism in these conditions.
Despite these specific diagnostic advantages (114) an assay for red cell ferritin has
seen little routine application. This is because it is necessary to have fresh blood in
order to separate the red from white cells, which have a much higher ferritin concen-
tration.
13. Ferritin in urineAlthough methods to estimate the concentration of ferritin in urine have been
described and urine ferritin concentration is correlated with the concentration in
serum (115,116) the technique has received little attention.
14. assay of serum ferritinMethods to prepare ferritin, raise antibodies to ferritin, and immunoassays for serum
ferritin have been fully described (33) along with a reliable enzyme immunoassay
(117,118). The serum ferritin assay is a routine measurement in most diagnostic labo-
ratories and further discussion is not warranted. Several immunoassays for ferritin
have been evaluated for the Medical Devices Agency of the UK (119,120). However
some discussion of possible pitfalls and standardization is justified.
14.1 Samples
In many assays both plasma and serum give the same results but in some cases
plasma collected in EDTA gives different values to serum. Samples may be stored at
-20 °C or -80 °C for several years. Several rounds of freezing and thawing do not lead to
changes in serum ferritin concentration, nevertheless freezing and thawing should
be kept to a minimum.
14.2 Pitfalls
There are a number of theoretical and practical problems associated with the assay of
serum ferritin. In theory, there may be problems because ferritin consists of a family
of isoferritins which differ in subunit composition and thus in isoelectric point, and
it is possible to generate specific antibodies which recognise particular isoferritins
(see above). In practice, this has not been a problem because, in general, the ferritin
found circulating in the plasma is similar to the L-rich ferritin found in liver or spleen
(see above). A more practical concern is the very wide range in ferritin concentra-
tion that can be encountered in serum. In hospital patients the ferritin concentration
can range from <1 µg/l in some patients with iron deficiency anaemia to in excess
of 100 000 µg/l in patients with necrosis of the liver. The early two-site immunora-
diometric assays suffered from a problem called the “high-dose hook” effect. In this
situation a very high ferritin concentration could give readings in the lower part of
the standard curve. In order to ensure that results were not artefactually low due to

47
the high dose hook effect, it is necessary to do the assay at two dilutions and to show
that the greater dilution reduced the apparent ferritin concentration.
Interference by non-ferritin proteins in serum may occur with any method, but
particularly with labelled antibody assays. Serum proteins may inhibit the binding
of ferritin to the solid phase when compared with the degree of binding in buffer
solution alone. Such an effect may be avoided by diluting the standards in a buffer
containing a suitable serum, or by diluting serum samples as much as possible. For
example, for two-site immunoradiometric assays, the sample may be diluted 20 times
with buffer while the standards are prepared in 5% normal rabbit serum (if antibod-
ies have been raised in rabbits) in buffer. Further dilution of the sera is then carried
out with this solution. Some methods give low recoveries of ferritin from plasma col-
lected in EDTA, and the use of the plasma samples should therefore be investigated
carefully.
Another problem has occurred because antibodies to some animal proteins are
sometimes present in human serum. These can interfere with the assay of serum fer-
ritin, giving a spuriously high ferritin concentration (121).
14.3 Standardization
The serum ferritin assay is often used in epidemiological surveys in which the iron
status of populations is examined. For such an assay to be comparable between sur-
veys it is important that a common standard is used and that the assays are calibrated
against this. The first WHO standard for the assay of serum ferritin was introduced
in 1990 (reagent 80/602), and was replaced by the second international standard in
1993 (reagent 80/578). A third international standard, which is a recombinant fer-
ritin, is now in use (reagent 94/572). The introduction of an international standard
has led to considerable improvements in the standardization of the assay for ferritin
(11,122) but differences in reference ranges were still being reported (123) and there
are problems with comparisons during longitudinal studies (see later). Almost all
commercial assays in current use have been calibrated against either the first or sec-
ond international standard, although these have not been available for some years.
The United Kingdom National External Quality Assessment Scheme (UK NEQAS)
has recently investigated the recovery of the third international standard for assay
systems used by UK participating laboratories. In most cases recoveries were accept-
able and ranged from 90 to 110%. However in two cases recoveries were 69% and
157%. Despite this, the performance of the assays of ferritin in serum samples in the
NEQAS haematinics scheme was considered to be acceptable (124). The authors con-
cluded that these results call into question the suitability of the third international
standard for calibration. However, another concern is that none of the assays ap-
peared to have been calibrated against the current standard which has been used for
the last ten years.
Discrepancies remain in the definition of normal ranges of serum ferritin con-
centration. Some manufacturers define a normal range as the ferritin concentra-
tion found in unselected, apparently normal subjects. However, a proportion of the
normal population have almost no storage iron without being anaemic, particularly
young women, and a smaller proportion will be anaemic. The “normal range” in
young females will thus include ferritin concentrations found in iron deficiency. This
confusion between “normality” and iron deficiency causes difficulties in the inter-
pretation of ferritin concentrations.
INDICATORS Of THE IRON STATuS Of POPuLATIONS: fERRITIN
ASSESSING THE IRON STATuS Of POPuLATIONS
48
Evaluation of several commercial assay systems suggests that most are free from
problems of protein interference or high dose “hook effects” and are well standard-
ized (119), but these points should be investigated before adopting a system for rou-
tine use.
15. Methodological and biological variability of measures of iron status
Assays of blood for indicators of iron status vary greatly in both methodological
and biological stability. Haemoglobin concentrations are stable and a simple and
well-standardized method ensures a relatively low day to day variation in individu-
als (Table 3). Automated cell counters can analyse at least 10 000 cells and thus re-
duce errors. The more complicated procedures involved in immunoassays lead to a
greater variation in ferritin assays, with a coefficient of variation of at least 5%. This
variation, coupled with some physiological variation, gives an overall coefficient of
variation for serum ferritin for an individual over a period of weeks of the order of
15%. There is however little evidence of any significant diurnal variation in serum
ferritin concentration (125). There is no information on seasonal factors influencing
most of these analyses, although seasonal change in red cell parameters have been
reported (126).
The effect of menstruation on indicators of iron status was examined in 1712 wom-
en aged 18-44 years during the Second National Health and Nutrition Examination
Survey (NHANES II) after adjusting for potential confounders. Adjusted mean values
of haemoglobin (Hb), transferrin saturation (TS), and serum ferritin (SF) concentra-
tion were lowest for women whose blood was drawn during their menses and highest
for women examined in the luteal or late luteal phase of their menstrual cycle (Hb =
130 vs 133 g/l; TS = 21.2% vs 24.8%, P < 0.01 for both; and SF = 17.2 vs 24.0 µg/l, P < 0.05).
The prevalence estimate of impaired iron status was significantly higher for women
whose blood was drawn during the menstrual phase than for women whose blood
was drawn during the luteal and late luteal phases. The authors concluded that cy-
clical variations in indicators of iron status are a potential source of error when iron
status is assessed in surveys of large populations that include women of reproductive
age (127).
Results from a number of studies of overall variation are shown in Table 3, but it
should be noted that the type of blood sample, the length of study period, and the
statistical analysis performed, vary from study to study. The somewhat higher vari-
ability in the haemoglobin and ferritin concentration reported by Borel et al. (128)
may be due to their use of capillary blood and plasma. Pootrakul et al. (129) have
demonstrated that the mean plasma ferritin concentration is slightly higher in capil-
lary blood specimens than in venous specimens and that the variation within and
between samples was approximately three times greater. Variability was less in cap-
illary serum but still greater than venous serum. However the increased variability
of capillary samples may be related to the blood sampling technique as Cooper and
Zlotkin (130) found little difference in variability between venous and capillary sam-
ples.
Starvation or even fasting for a short period can cause an increase in the serum
ferritin concentration (131) while a vitamin C deficiency may reduce the ferritin con-
centration (70). Moderate exercise has little effect on serum ferritin concentration

49
(132) although exhaustive exercise leads to an increase in serum ferritin concentra-
tion due to muscle damage and inflammatory reactions (133,134).
These variations have clear implications for the use of these assays in population
surveys (3,135) or in the assessment of patients (128). For accurate diagnosis either a
multi-parameter analysis is required or the assay of several samples (see below).
INDICATORS Of THE IRON STATuS Of POPuLATIONS: fERRITIN
TAbLe 3The coefficient of variation (%) reported in assays of iron status (within-subject, day-to-day variation in otherwise healthy subjects)
Haemoglobin Serum ferritin
Serum iron Total iron binding capacity
zinc protoporphyrin
Serum transferrin receptor
Reference
– 15 (Mf) – – Dawkins et al. (125)
2 (f) 15 (Mf) – – Gallagher et al. (136)
– – 29(f) – Statland and Winkel (137)
– – 27 (M) – Statland et al. (138)
3 (Mf) – – – Statland et al. (139)
– 15 (Mf) 29 (Mf) – Pilon et al. (140)
– 13 (Mf)a 33 (Mf)a 11 (Mf)a Romslo and Talstad (141)
4 (Mf) 14 (M)26 (f)
27 (M)28 (f)
––
Borel et al. (128)
– 27 (Mf) 29 (Mf) 7 (Mf) 14 (Mf) Maes et al. (142)
–
–
26 (f)b
15 (M)b
28 (f)c
12 (M)c
14 (f)12 (M)
11(f)10 (M)
Cooper and Zlotkin (130)
– – – – 5 (Mf) – Hastka et al. (143)
3 (f)d 11 (f)d 26 (f)d 4 (f)d 13 (f)d Ahluwalia (144)
M, males only; f, females only; Mf, males and femalesa Anaemic patientsb venous blood c Capillary bloodd 70–79 years old healthy women
16. the predictive value of indicators of iron metabolismDespite years of investigation there is little reliable comparative information on in-
dicators that will distinguish reliably between the presence and absence of storage
iron. Most investigators have used the grade of stainable iron in the bone marrow
as a “gold standard”. This involves an invasive procedure and so limits greatly the
number of patients that can be investigated. It is often difficult to justify bone mar-
row aspiration to determine the iron status of a patient, and it is even more difficult
in the case of normal volunteers. Furthermore, the examination of a stained bone
marrow aspirate is not a reproducible procedure as there can be observer error (145)
while inadequate specimens and a lack of correlation with response to iron therapy
have been described (146). An alternative is to demonstrate a change in haemoglob-
in concentration in response to oral iron therapy, and this has been the method of
choice in paediatric practice.
ASSESSING THE IRON STATuS Of POPuLATIONS
50
16.1 Iron deficiency anaemia in adults
Iron deficiency anaemia (IDA) in adults occurs typically due to a gradual decline in
the iron content of the body due to a loss of haemoglobin and a depletion of iron
stores. In the absence of malabsorption there is a good response to iron therapy.
Menstrual blood loss is the most common cause of IDA in pre-menopausal women,
but blood loss from the gastro-intestinal tract or malabsorption of iron are common
causes in men and post-menopausal women. People with asymptomatic colonic or
gastric carcinoma may present with IDA and it is essential to exclude these condi-
tions as the cause of anaemia in elderly men and women (147).
Early studies of patients with iron deficiency anaemia characterised by microcytic
anaemia, low serum iron concentration, high total iron binding capacity (TIBC), and
either an absence of stainable iron in the bone marrow or who had a subsequent re-
sponse to therapeutic iron, showed that serum ferritin concentrations were less than
12–16 µg/l (1). Hallberg et al. (148) determined the serum ferritin concentration of 203
women aged 38 years who had undergone bone marrow examination. They concluded
that a value of <15 µg/l was the best predictor of iron deficiency (confirmed by an ab-
sence of stainable iron in the bone marrow) and noted that this threshold was similar
to one derived from earlier population surveys and studies of clinical cases (148).
Almost all measures currently used to assess iron status show a high sensitivity
and specificity in distinguishing between subjects with iron deficiency and those
with iron stores and a normal haemoglobin concentration, but only in the absence
of any other disease process. Zanella et al. (149) examined the sensitivity and predic-
tive value of serum ferritin and zinc protoporphyrin (ZPP) concentrations to identify
iron deficiency. Iron deficiency anaemia was defined as a haemoglobin concentra-
tion below 13.5 g/dl for men and 11.8 g/dl for women, a transferrin saturation below
16%, and an increase in haemoglobin concentration after oral iron therapy (149). The
subjects with iron deficiency but without anaemia were blood donors whose haema-
tological profile over time indicated possible iron deficiency and whose haemoglobin
concentration improved in response to iron supplementation. The overall sensitivity
and specificity of diagnosis were 82% and 95% for serum ferritin and 61% and 95% for
ZPP. However while the sensitivity was over 90% for both ferritin and ZPP in cases of
severe anaemia, in the absence of anaemia the sensitivity dropped to 70% for ferritin
and less than 50% for ZPP. In a systematic review of the diagnostic value of various
laboratory tests to diagnose iron deficiency it was concluded that serum ferritin was
the most powerful test for simple iron deficiency in both populations and hospital
patients. However this analysis did not include the transferrin receptor (150).
16.2 Detection of iron deficiency in acute or chronic disease
In practice there are two different questions: first, identifying patients with inflam-
mation, infection, malignancy and renal failure and an absence of storage iron in re-
ticuloendothelial cells; and second, identifying a functional iron deficiency in which
there is an inadequate iron supply to the bone marrow in the presence of storage iron
in reticuloendothelial cells. This problem is usually encountered among patients
with renal failure receiving erythropoietin to correct anaemia.
Table 4 summarises a number of studies in which bone marrow iron has been
determined and the sensitivity and specificity of various assays to determine iron
status have been compared. Despite varying results between studies, some general
points may be made.

51
INDICATORS Of THE IRON STATuS Of POPuLATIONS: fERRITIN
TAbL
e 4
The
sens
itivi
ty/s
peci
ficity
of m
etho
ds to
dia
gnos
e iro
n de
ficie
ncy
in th
e pr
esen
ce o
f chr
onic
dis
ease
a
ref
eren
ce
van
Telli
ngen
et
al.
(156
)Le
e et
al.
(157
)b
Mas
t et
al.
(158
)ko
tru
et a
l. (1
52)
Punn
onen
et
al.(
159)
b
baum
ann
kure
r et
al.
(160
)bu
ltin
k et
al.
(161
)M
eans
et
al.
(162
)Jo
oste
n et
al.
(163
)ba
laba
n et
al
. (16
4)M
ast
et a
l. (1
65)
Fern
ande
z-Ro
drig
uez
et
al. (
166)
test
Mea
n ce
ll vo
lum
e–
–0.
32/0
.93
L0.
86–
–0.
42/0
.83
––
––
Mea
n ce
ll Ha
emog
lobi
n–
––
––
0.71
/0.7
1–
––
––
–
% h
ypo
––
––
–0.
77/0
.90
––
––
––
Retic
uloc
yte
haem
oglo
bin
conc
entr
atio
n
––
0.73
/0.7
4–
––
––
––
––
Seru
m ir
on
conc
entr
atio
n–
––
L0.
68L
––
NS
––
–
Tota
l iro
n bi
ndin
g ca
paci
ty–
––
L0.
84c
L–
––
––
< 0
.65b
Perc
enta
ge
satu
ratio
n–
–0.
65/0
.70
L0.
79d
L–
0.38
–0.8
9–
––
< 0
.65b,
c
Seru
m fe
rriti
n co
ncen
trat
ion
0.79
/0.9
70.
870
0.52
/0.9
390
/75
0.89
0.86
/0.9
01.
00/0
.81
0.25
/0.9
90.
94/0
.95
0.60
/0.9
00.
92/0
.98
0.83
b(0
.75/
0.75
)
Red
cell
ferr
itin
conc
entr
atio
n–
––
L–
––
––
0.82
/0.8
3–
0.68
b
Zinc
pr
otop
orph
yrin
0.74
/0.9
4–
––
L–
––
––
–
Seru
m tr
ansf
errin
re
cept
or
conc
entr
atio
n
0.63
/0.8
10.
704
––
0.98
L1.
00/0
.84
0.71
/0.7
40.
61/0
.68
–0.
92/0
.84
0.69
b
Seru
m tr
ansf
errin
re
cept
or
conc
entr
atio
n to
log
ferr
itin
conc
entr
atio
n
0.74
/0.9
70.
865
––
1.00
–1.
00/0
.97
0.67
/0.9
3–
––
–
L, L
ower
sen
sitiv
ity/s
peci
ficity
than
ser
um fe
rriti
n, in
divi
dual
ly o
r in
com
bina
tion.
The
com
bina
tion
of fe
rriti
n an
d er
ythr
ocyt
e se
dim
enta
tion
rate
or C
-rea
ctiv
e pr
otei
n di
d no
t im
prov
e ef
ficie
ncy.
a
Adu
lts, i
ron
stor
es d
eter
min
ed b
y st
aini
ng fo
r iro
n in
bon
e m
arro
w).
Opt
imum
dia
gnos
tic th
resh
olds
sel
ecte
d va
ry.
b A
rea
unde
r Rec
eive
r ope
ratin
g ch
arac
teris
tics
(RO
C) c
urve
c Tr
ansf
errin
con
cent
ratio
n (e
quiv
alen
t to
TIBC
, see
text
)d
Tran
sfer
rin In
dex
(equ
ival
ent t
o %
sat
urat
ion,
see
text
)

ASSESSING THE IRON STATuS Of POPuLATIONS
52
Conventional red cell parameters such as the haemoglobin concentration, mean
cell volume (MCV), mean cell haemoglobin (MCH), and reticulocyte counts do not
distinguish between the presence or absence of bone marrow iron in patients with
chronic disease.The serum iron concentration is almost invariably low in patients
with chronic disease and although the TIBC (or transferrin concentration) is higher
in patients with no storage iron, neither this measurement nor the transferrin satu-
ration derived from the serum iron and TIBC, provide useful means of identifying
patients with iron deficiency. In patients with chronic disease the serum ferritin con-
centration reflects the concentration of storage iron, but the concentration of ferritin
is higher than in healthy subjects. For this reason it is necessary to set a threshold of
30–50 µg/l of ferritin in order to distinguish between the presence and absence of
storage iron. Even when this threshold is applied the sensitivity of diagnosis is low.
Combinations of serum ferritin, ESR or CRP either in a discriminant analysis (151)
or logistic regression (152) provide only marginal improvement in the ability to de-
tect a lack of storage iron.
The serum transferrin receptor concentration is usually raised in patients with
chronic disease and an absence of storage iron in the bone marrow although there
is disagreement as to whether or not the assay is superior in predictive power than
the serum ferritin concentration. Several studies show that the ratio of sTfR/log10
SF
is superior to either test on its own. The use of the log of serum ferritin in this ratio
decreases the influence of the acute phase response on the ferritin component of
the ratio. Although the log10
(sTfR/SF) ratio is an excellent measure of iron stores in
healthy subjects (153) its use may not be not appropriate for clinical diagnosis of iron
deficiency. When the assay of sTfR is easily done on an immunoanalyser the sTfR/log
SF ratio may provide the best means of identifying the co-occurrence of iron defi-
ciency in chronic disease. However if this ratio is to gain wide acceptance, this will
also require the standardization of units and ranges for the various sTfR assays.
Measurements of the percentage of hypochromic erythrocytes or the reticulocyte
haemoglobin concentration also provide some power to identify people with iron
deficiency, but their sensitivity and specificity are not sufficiently high enough to
distinguish between the presence and absence of storage iron in acute or chronic
disease.
Patients with a functional iron deficiency will require parenteral iron therapy in
order to respond to erythropoietin with an acceptable rise in haemoglobin concen-
tration. The percentage of hypochromic erythrocytes has been shown to be a good
predictor of a response (154) and Table 5). Fishbane et al. (155) concluded that the
reticulocyte haemoglobin concentration (CHr) was a markedly more stable analyte
than serum ferritin or transferrin saturation, and that it predicted functional iron
deficiency more efficiently. Fishbane et al. (155) did not include the percentage of
hypochromic cells in their analysis.
16.3 Iron deficiency in infancy and childhood
Diagnostic thresholds for iron deficiency and iron deficiency anaemia in infants are
not universally agreed upon. There are rapid changes in iron status in the first year of
life as the fetal haemoglobin is replaced by haemoglobin A. The serum ferritin con-
centration is a less useful guide to iron deficiency than in adults partly because of
the changes in concentration that continue for the first 18 months (167) and the low
concentrations generally found in children. In a study of healthy, breastfed infants

53
INDICATORS Of THE IRON STATuS Of POPuLATIONS: fERRITIN
in Honduras and Sweden, Domellof et al. (168) evaluated the change in haemoglobin
concentration in response to oral iron supplementation. At 4–6 months of age the
initial haemoglobin concentration did not predict a response to iron therapy. At 6
months of age the haemoglobin concentration, the MCV and the ZPP concentration
predicted the response, but SF and sTfR did not. Table 9 shows the proposed thresh-
olds of ferritin concentration to diagnose iron deficiency in infants. In some studies
the ferritin concentration has been assayed in addition to MCV, zinc protoporphyrin,
transferrin saturation or serum transferrin receptor, in order to apply a multiple pa-
rameter approach to diagnosing iron deficiency and iron deficiency anaemia (see for
example (169,170).
Margolis et al. (171) found that, in children age 6 months to 17 years, the best predic-
tor of a response was the initial haemoglobin concentration, although the sensitivity
of this parameter was only 66% and the specificity 60%. The concentration of SF, TS
and erythrocyte protoporphyrin had even lower efficiencies, while a combination of
the various measures made little improvement. Hershko et al. (172) studied children
aged 1–6 years from villages in the Golan Heights and concluded that erythrocyte
protoporphyrin was a more reliable index of iron deficiency than serum ferritin and
serum iron. They suggested that a significant incidence of chronic disease affected
both ferritin and iron values. The concentration of ZPP provides a useful indicator
of iron-deficient erythropoiesis although high values may indicate lead poisoning
rather than iron deficiency. The small volume of blood needed to measure ZPP is also
an advantage in paediatric practice.
A recent report confirms the effect of low level infection on measures of iron
status. Abraham et al. (64) studied 101 healthy, 11 month old infants. On the morning
of blood sampling, slight clinical signs of an respiratory tract infection were observed
in 42 infants. Extensive blood analyses were done, including a highly sensitive assay
for CRP. While the concentration of CRP measured using routine methods gave val-
ues of <6 mg/l for all infants, the highly sensitive assay gave values that were higher
for many of the infants with symptoms of infection. The serum iron concentration
was low in these children and was significantly correlated with the CRP concentra-
tion. In those children for whom a second blood sample was taken, the serum ferritin
concentration was higher in the sample with the higher CRP concentration and the
serum iron concentration was reduced, but the sTfR and transferrin concentrations
were unchanged.
TAbLe 5The threshold of assays used to predict a response to treatment with intravenous iron in haemodialysis patients treated with erythropoietin, and the efficiency of the threshold in predicting a responsea
Assay Threshold efficiency (%)b
Hypochromic erythrocytes >6% 89.6
Reticulocyte haemoglobin concentration ≤29 pg 78.4
Soluble transferrin receptor concentration >1.5 mg/l 72.4
Erythrocyte zinc protoporphyrin concentration >52 µmol/mol haem 73.0
Transferrin saturation 19% 70.4
Serum ferritin concentration <50 µg/l 64.0
a Not all cell counters detect hypochromic red cells but this study indicates that the other tests have insufficient predictive power to justify cost beyond the blood count.
b Number of true positive and negative results/total number of testsAdapted from Tessitore et al. (146), with permission of the publisher.

ASSESSING THE IRON STATuS Of POPuLATIONS
54
16.4 Treatment of iron deficiency anaemia
Oral iron therapy given at conventional doses of 60 mg of iron, 3 times daily, has little
immediate effect on the serum ferritin concentration, which rises slowly as the hae-
moglobin concentration increases. However with double doses there is a rapid rise
in serum ferritin concentration in a few days to within the normal range, an increase
that probably does not represent an increase in storage iron (173). Intravenous iron
causes a rapid rise in serum ferritin concentration to a concentration that may be
above the normal range, but it gradually drops back to normal (174).
16.5 Screening blood donors for iron deficiency
A number of studies have shown that regular blood donation reduces storage iron
levels (see reviews by Skikne et al. (175) and Milman and Kirchhoff (37)). The conven-
tional screening test for anaemia, the “copper sulphate” test, lacks specificity so that
donors may be deferred unnecessarily. Despite the availability of the serum ferritin
assay for 30 years there has been little attention to the fundamental relationship be-
tween storage iron levels and the ability to donate blood. Screening blood donors by
routinely assaying serum ferritin may make it possible to predict the development
of iron deficiency anaemia (37) and may identify donors with high iron stores who
may give blood more frequently than is usually permitted. However the assay has
low predictive power to identify donors who are homozygous for HFE gene C282Y
(see below).
16.6 Pregnancy
In early pregnancy the serum ferritin concentration usually provides a reliable in-
dication of the presence of iron deficiency. Haemodilution in the second and third
trimesters of pregnancy reduces the concentration of all measures of iron status
and means that the threshold values for iron deficiency established in non-pregnant
women are not appropriate. In principle the calculation of values as ratios, such as
ZPP µmol/mol haem, transferrin saturation or sTfR/ferritin, should be more diag-
nostically reliable. In a study of healthy, non-anaemic women supplemented with
iron (176), the serum iron, TS and SF concentrations fell from the first to the third tri-
mester and increased after delivery while TIBC increased during pregnancy and fell
after delivery. The sTfR concentration showed a substantial increase of about 2-fold
during pregnancy, a change that probably reflects increased erythropoiesis (176). In
contrast, Carriaga et al. (177) reported that the mean sTfR concentration of pregnant
women in their third trimester did not differ from that in non-pregnant women, and
that the sTfR concentration was not influenced by pregnancy per se. Choi et al. (176)
suggest that the use of different assays and the different ages of subjects in the control
groups may explain this discrepancy. In practice the Institute of Medicine (USA) has
recommended that iron deficiency in the first and second trimester can be identified
by a haemoglobin concentration <110 g/l and a ferritin concentration <20 µg/l (178).
Women with low iron stores only should receive lower doses of oral iron than those
who are also iron deficient and anaemic. In the third trimester all women should
receive iron supplements. Other US guidelines recommend supplementation for all
women throughout pregnancy (179,180).

55
16.7 Genetic haemochromatosis
Iron overload in haemochromatosis begins with enhanced iron absorption leading
to an increase in plasma iron concentration and transferrin saturation followed by
an increasing iron concentration in liver parenchymal cells. As the serum ferritin
concentration reflects the iron concentration of macrophages (10), and macrophages
accumulate little iron initially, the serum ferritin concentration might be expected
to remain normal during the early stages of iron accumulation. The transferrin satu-
ration is therefore the most efficient test for detecting iron accumulation in genetic
haemochromatosis (181). The use of serum ferritin to detect genetic haemochroma-
tosis in populations is discussed later.
16.8 Secondary iron overload
The major aims of diagnostic tests are to estimate the degree of iron overload and to
monitor the success of chelation therapy in removing iron from the body. The only
reliable methods are the quantification of the amount of iron in the liver using biopsy
samples, an invasive procedure, or by measuring magnetic susceptibility (182) which
can only be done in three countries. In practice, the serum ferritin concentration
provides a combined index of storage iron concentration and liver damage, and gives
useful information to monitor the progress of treatment. The aim of treatment with
chelating agents is to reduce both the tissue iron concentration and tissue damage.
The reduction of the concentration of ferritin in serum below 1 000 µg/l is a realistic
aim. This topic has recently been reviewed (183).
17. Population studies
17.1 Distribution of serum ferritin concentration in people in the United States of America and europe
The first studies of serum ferritin concentrations in normal subjects including ne-
onates, infants, children and adults, were drawn from populations in the USA, Cana-
da, UK and Denmark (1). The sample sizes were usually relatively small and criteria to
exclude people with iron deficiency or chronic disease etc. were not usually applied.
The distribution of values has been summarized in several ways including the mean
and standard deviation, although the typically right-skewed distributions of serum
ferritin means that such parameters are inappropriate. Other ways of presenting the
distribution include the median and range, median, 5th and 95th percentiles and
geometric means. Much larger sample sizes were made available from the National
Health and Nutrition Examination Surveys (NHANES) II and III. These surveys were
designed to assess the health and nutritional status of the civilian, non-institution-
alised population of the USA.
17.1.1 Age, sex and race
Figure 2 shows the distribution of the serum ferritin concentration and transfer-
rin saturation of 20 040 men and women aged 17 to over 90 years using data from
NHANES III (184). The analysis was limited to white (n = 8477), black (n = 5484) and
Hispanic (n = 5304) subjects as only 775 people were of ‘other’ races. The values
shown are the geometric means for each age group. The minimum number of un-
weighted observations in each 10 year age category (except for 17–19 years) was 30
INDICATORS Of THE IRON STATuS Of POPuLATIONS: fERRITIN

ASSESSING THE IRON STATuS Of POPuLATIONS
56
and analyses were weighted to adjust for the probability of selection due to sample
design and non-response.
Figure 3 shows the distribution of the serum ferritin concentration by age and
race. The geometric mean ferritin concentration in men was always higher in blacks
than in whites or Hispanics. In women, the values for blacks were higher than the
other groups after the menopause. It is unlikely that the higher mean values of serum
ferritin concentration in US blacks are due to a greater intake of dietary iron. Popkin
et al. (185) and Zacharski et al. (184) suggested that these high ferritin concentrations
may indicate that higher iron stores contribute to the higher mortality and morbidity
rates among blacks when compared with whites for many common diseases. How-
ever, it may be that higher morbidity is the cause of the higher ferritin concentrations
later in life.
An alternative approach to examining the distribution of the serum ferritin con-
centration in a population was described by Custer at al. (47). Data were collected on
over 964 000 patients unselected by race and medical condition. Over 98% of samples
came from physicians’ offices or blood-drawing stations. Information included re-
sults on 29 tests as well as age and sex. They analysed the distribution of serum fer-
ritin according to age and sex for all subjects and then for a subgroup of 22 464 males
and 37 450 females who had normal values for the other 28 assays. The concentration
of ferritin was lower in the normal subgroup than in all subjects combined. Table 6
shows the 2.5th, 50th and 97.5th percentiles of the ferritin concentration for the sub-
group of normal males and females.
FIGURe 2The distribution of mean serum ferritin concentration (left y-axis) and transferrin saturation (right y-axis) by age group for American men and women participating in NHANES III surveys
Adapted from Zacharski et al. (184), with permission of the publisher.

57
INDICATORS Of THE IRON STATuS Of POPuLATIONS: fERRITIN
Adapted from Zacharski et al. (184), with permission of the publisher.
TAbLe 6 The values of serum ferritin concentration (µg/l) by percentiles in males and females with normal laboratory test results for indicators of iron deficiency (other than ferritin)
Age groups (years) Males Females
number 2.5% 50% 97.5% number 2.5% 50% 97.5%
12–<16 129 11 36 117 563 7 24 110
16–<20 616 17 56 171 1 143 6 27 100
20–<24 720 20 90 259 1 711 8 32 128
24–<28 1 085 25 105 311 2 175 7 35 140
28–<32 1 670 26 117 343 2 599 7 39 174
32–<36 1 508 23 123 385 3 007 7 38 174
36–<40 1 581 24 127 399 3 085 6 38 190
40–<44 1 734 19 122 427 3 241 7 38 193
44–<48 1 734 19 127 450 3 013 7 37 216
48–<52 1 657 19 128 481 2 457 7 41 232
52–<56 1 550 19 121 477 2 101 10 49 264
56–<60 1 463 20 127 486 1 826 13 60 308
60–<64 1 432 17 122 441 1 896 13 75 346
64–<68 1 541 14 120 488 1 873 13 80 369
68–<72 1 451 14 113 522 1 947 12 81 379
72–<76 1 148 15 111 485 1 718 12 78 381
76–<80 813 14 98 441 1 310 11 79 382
80–<90 766 16 107 474 1 523 13 76 369
Total 22 338 37 188 Adapted from Custer et al. (47), with permission of the publisher.
FIGURe 3Distribution of mean serum ferritin concentration by age group for American men and women by age and racial group from the NHANES III survey

ASSESSING THE IRON STATuS Of POPuLATIONS
58
17.1.2 Genes modifying iron status
Mutations of the HFE gene are common in Northern European populations (10–20%
carrying C282Y and 20–30% H63D). From 0.25–1 % of the population will be ho-
mozygous for HFE C282Y and are at risk from iron overload (186). About 2 % will be
compound heterozygotes (C282Y/H63D) and are at lesser risk. However, although
most subjects who are homozygous for C282Y will accumulate excess iron the clini-
cal penetrance is low and for compound heterozygotes is even lower. In population
surveys, slightly but significantly higher values for serum iron and transferrin satura-
tion have been found in heterozygotes for either C282Y (187–190) or H63D (187,189,190)
with subjects lacking these mutations. The differences in ferritin levels were smaller
and not significant except that Jackson et al. (190) found higher levels of serum fer-
ritin in men heterozygous for C282Y. In compound heterozygotes and subjects ho-
mozygous for H63D there are greater differences (189–191). In heterozygotes for C282Y
(188,189) and H63D (189) Hb levels were slightly higher than in subjects lacking muta-
tions. Beutler et al. (189) noted a lower prevalence of anaemia among women carrying
either mutation, but the differences were small and only significant if all subjects car-
rying mutations were compared with those lacking mutations. Serum ferritin concen-
trations in haemochromatosis may not accurately reflect tissue iron concentrations
during the early stages of iron accumulation, particularly in heterozygotes. Serum
ferritin concentrations are related to the levels of ferritin iron in macrophages and in
haemochromatosis the iron initially accumulates in hepatic parenchymal cells. Ed-
wards et al. (192) noted that liver iron concentrations in heterozygote family mem-
bers were above the reference range although serum ferritin concentrations were not
elevated. Thus iron accumulation may be underestimated in heterozygotes. Tables 7
and 8 illustrate population data for blood donors from South Wales.
Rare causes of genetic haemochromatosis include mutations in the HAMP (hep-
cidin) gene (193,194), transferrin receptor 2 (195), ferroportin 1 (196–198) and HFE2
(199) genes. Other genes may modify the phenotype involved in haemochromatosis.
It was found by Langlois et al. (200) that men with the 2-2 haplotype for haptoglobin
had a higher serum ferritin concentration than those with HP 1-1 or 2-1 but others
have not confirmed this finding (201–203). Until now, no mutations in genes coding
for iron transport or storage have been linked to iron deficiency.
TAbLe 7The mean (SD) of indicators of iron status for different genotypes among male blood donors
Genotypea number of donors (%)
Serum iron concentration
(µmol/l)
Unsaturated iron binding capacity
(µmol/l)
Total iron binding capacity
(µmol/l)
Transferrin saturation
(%)
Serum ferritin concentration
(µg/l)b
All donors 4952 (100%) 16.7 (6.4) 39.2 (11.2) 55.8 (10.6) 30.0 (12.1) 81 (24–196)
HHCC 2896 (58.5%) 16.0 (6.1) 40.8 (11.0) 56.8 (10.6) 28.3 (11.0) 79 (23–193)
HDCC 1167 (23.6%) 17.4 (6.5)*** 38.2 (10.5)*** 55.6 (10.4)** 31.8 (11.7)*** 81 (23–197)
HHCY 644 (13.0%) 17.3 (6.0)*** 35.8 (10.0)*** 53.1 (10.0)* 33.1 (11.5)*** 82 (29–201)*
DDCC 105 (2.1%) 19.1 (6.9)*** 34.4 (10.5)*** 53.5 (10.1)** 36.4 (13.1)*** 99 (33–210)***
HDCY 111 (2.2%) 20.2 (6.9)*** 31.2 (12.1)*** 51.4 (11.6)*** 40.5 ( 15.5)*** 107 (24–260) ***
HHYY 29 (0.59%) 27.5 (9.9)*** 15.6 ( 8.4)*** 43.1 (8.3)*** 63.6 (17.8)*** 154 (50–410)***
Significance of difference from wild-type donors * p < 0.01, ** p < 0.001, *** p < 0.0001 (Mann-Whitney test for significance)a HHCC, wild-type; HHYY, homozygous C282Y; DDCC etc, homozygous H63Db Median (95% range). Adapted from Jackson et al. (190), with permission of the publisher.

59
17.2 Prevalence of iron deficiency
Iron deficiency has generally been defined as an absence of iron stores while iron deficiency anaemia
as the same but with a haemoglobin concentration below a defined threshold. The absence of stored
iron may simply be defined as a serum ferritin concentration <15 µg/l (see below). However an analysis
of NHANES II data revealed that for those subjects with either a low ferritin concentration or trans-
ferrin saturation, the prevalence of anaemia was only slightly greater than in those with normal test
results. Iron deficiency was therefore defined as two abnormal results out of a panel of three: free eryth-
rocyte protoporphyrin concentration, serum ferritin concentration, and transferrin saturation (42). Not
surprisingly the results produced by the two diagnostic approaches were very different. Hallberg et al.
(148) estimated the prevalence of iron deficiency among women using a serum ferritin concentration of
<15 µg/l to be about 30% in the USA (NHANES II) and 33% in Sweden. Using the results of “two of three
tests abnormal” approach on data from NHANES II and III, about 10% of young women were iron defi-
cient but only 2–5% had iron deficiency anaemia (3).
These different diagnostic approaches may not entirely explain the very different prevalences of iron
deficiency reported in Sweden and the USA. Among pre-menopausal women surveyed in Denmark in
both 1984 and 1994 approximately 11% were iron deficient (defined as a serum ferritin concentration
<16 µg/l) while 2.7% had iron deficiency anaemia – prevalences very much closer to those in the USA
than for Sweden. Throughout Europe between 11 and 45 % of menstruating women were reported to
have a serum ferritin concentration below thresholds varying from 10 to 17 µg/l (204).
17.3 Longitudinal and intervention studies
For the last 30 years, serum ferritin has been an important tool for investigating changes in storage iron
concentration. However attempts to measure the changes in iron stores over several years or a decade
have been bedevilled by changes in assay methods, by changes in survey procedures (205), or changes
in other confounding factors such as the blood lead concentration (206,207). Milman et al. (207,208)
have compared changes in iron stores and the prevalence of iron deficiency and iron overload in a co-
hort of Danish men and women studied in 1984 and 1994. In 1987 the fortification of flour with iron was
abolished, thereby reducing daily iron intake significantly. Surprisingly perhaps, the prevalence of iron
deficiency or iron deficiency anaemia (ferritin <13 µg/l and a haemoglobin concentration <5th percen-
tile) did not increase, but in elderly women and men the prevalence of iron overload (ferritin >300 µg/l)
increased. Changes in the ferritin assay procedure required the correction of values to permit valid com-
parisons to be made. Changes in diet, alcohol consumption and smoking habits were probably respon-
sible for these findings.
INDICATORS Of THE IRON STATuS Of POPuLATIONS: fERRITIN
TAbLe 8 The mean (SD) of indicators of iron status for different genotypes among female blood donors
Genotypea number of donors (%)
Serum iron concentration
(µmol/l)
Unsaturated iron binding capacity
(µmol/l)
Total iron binding capacity
(µmol/l)
Transferrin saturation
(%)
Serum ferritin concentration
(µg/l)b
All donors 5372 (100%) 14.3 (6.3) 42.9 (12.9) 56.8 (11.2) 25.4 (12.4) 44 (9–130)
HHCC 3100 (57.7%) 13.8 (6.1) 44.2 (12.1) 58.1 (11.4) 24.6 (10.9) 44 (9–126)
HDCC 1277 (23.8%) 14.7 (6.2)** 41.5 (12.2)*** 56.2 (10.9)*** 27.0 (12.0)*** 43 (10–127)
HHCY 682 (12.7%) 14.6 (6.1)* 40.7 (12.5)** 55.1 (11.5)*** 27.3 (12.1)*** 44 (8–116)
DDCC 135 (2.5%) 15.6 ( 7.1)** 38.4 (11.8)*** 54.0 (11.1)*** 29.5 (13.8)*** 46.5 (11–140)
HDCY 138 (2.6%) 16.6 (6.8)*** 34.2 (10.5)*** 50.8 (8.6)*** 33.2 (14.0)*** 50 (10–180)*
HHYY 41 (0.76%) 21.4 ( 8.4)** 23.4 (12.6)*** 44.3 (10.4)*** 49.9 (20.5)*** 65 (8–238)**
Significance of difference from wild-type donors * p < 0.01, ** p < 0.001,*** p < 0.0001 (Mann-Whitney test for significance)a HHCC, wild-type; HHYY, homozygous C282Y; DDCC etc, homozygous H63Db Median (95% range)Adapted from Jackson et al. (190), by permission of the publisher.

ASSESSING THE IRON STATuS Of POPuLATIONS
60
17.4 Iron stores in people in developing countries
In many regions where iron deficiency is of great public health importance malaria,
hookworm and other parasitic infections are endemic. Whether or not serum fer-
ritin is a valid indicator of iron stores depends on the type and degree of infection.
Where malaria is “holo-endemic” serum ferritin appears to be little affected by para-
site load (209). However in malarial disease a high ferritin concentration results from
the destruction of red blood cells, an acute phase response, suppressed erythropoi-
esis, and ferritin released from damaged liver or spleen cells (210). In adults with
hookworm infection both the haemoglobin and serum ferritin concentrations are
inversely correlated with the intensity of infection (211). These authors also found
that serum ferritin was a valuable indicator of iron stores in populations infected
with the helminths Ascaris lumbricoides, Trichuris trichiura and Schistosoma man-
soni. To assess the value of iron status indicators in a population in which malnutri-
tion, Plasmodium falciparum malaria and helminths were highly endemic, Stoltzfus
et al. (212) examined the relationship between iron status indicators and erythropoi-
esis. The concentration of serum ferritin, erythrocyte protoporphyrin and sTfR were
all significantly influenced by Plasmodium spp. infection, and the concentration of
erythrocyte protoporphyrin and serum ferritin were also influenced by fever. The
authors concluded that it would be “nearly impossible” to estimate the prevalence of
iron deficiency in this population, except by a trial of therapeutic iron supplementa-
tion. A subsequent trial revealed that oral iron supplementation led to an increased
concentration of SF and EP but had only a small effect on anaemia (213). The au-
thors suggested that concurrent helminth infections may stimulate inflammatory
immune responses in young children, with harmful effects on protein metabolism
and erythropoiesis. Thus serum ferritin may be a valuable indicator of iron stores in
some populations with chronic infection, but only after determining the infecting
organisms and the relationship between the burden of infection and serum ferritin.
17.5 Detection of subjects with genetic haemochromatosis
Despite the first hopes that the serum ferritin assay would provide an effective way
of detecting subjects with haemochromatosis early in their disease, it soon became
clear that this was not the case. The first indication of iron accumulation is provided
by measuring transferrin saturation (181) for reasons described above. The sensitiv-
ity and specificity of methods to detect nascent haemochromatosis can now be ex-
amined by studying subjects found to be homozygous for HFE C282Y, because 90% of
patients with genetic haemochromatosis have this genotype in northern European
populations (214). Beutler et al. (215) identified 152 subjects homozygous for C282Y
among 41 038 individuals attending a clinic in California. Of these, 75% of men and
54% of women had a ferritin concentration greater than 250 µg/l and 200 µg/l respec-
tively. Similar percentages had a raised transferrin saturation (75% and 40%). The
mean age of these individuals was 57 years. In a prior analysis of the first 10 198 sub-
jects (189) the sensitivity and specificity of serum ferritin and transferrin saturation
to detect people with C282Y homozygosity was examined. Using optimal thresholds
of ferritin >200 µg/l for women, ferritin >250 µg/l for men and a transferrin saturation
of >45%, the sensitivities were 70% and 70%, and the specificities were 90% and 89%
respectively.
In blood donors with a mean age of 38 years, Jackson et al. (190) identified 72 sub-
jects who were homozygous for HFE C282Y from a total of 10 500 donors tested. Using

61
a transferrin saturation threshold of >50%, which was the 95th percentile of the value
of first-time donors, the sensitivity of diagnosis was 45% and 86% for females and
males respectively with a specificity of 97% and 95% respectively. Using a threshold
serum ferritin concentration in women of >130 µg/l (the 95th percentile) the sensitiv-
ity of diagnosis was 22% ; for men a threshold of >210 µg/l gave a sensitivity of 34%.
In both cases the specificity was high at 98%. The most powerful single diagnostic
measure examined, an unsaturated iron binding capacity threshold of <20 µmol/l,
showed a positive predictive value of 14% for men and 18% for women, with nega-
tive predictive values of >99.5% for both sexes. Although a combination of raised
transferring saturation and serum ferritin concentrations gave a positive predictive
value of 50% this was at the expense of sensitivity which only reached 22%. Of the 69
homozygotes for C282Y tested for iron status, only 15 had both a raised transferrin
saturation and serum ferritin concentration.
18. threshold values of ferritin to determine iron statusThere are two approaches to establishing a threshold value of an indicator at which
iron deficiency or iron overload is probable. The first is to identify subjects with iron
deficiency or haemochromatosis. A threshold may be established from the range of
values found in iron deficient or iron loaded patients. This approach has rarely been
applied although the ferritin concentration during iron deficiency anaemia provides
an example.
The second approach is to measure the concentration of the substance in healthy
subjects not likely to be either iron deficient or iron loaded, and to calculate appro-
priate threshold values based on either 90 or 95% confidence intervals. This requires
selecting subjects in order to exclude those with iron deficiency and possibly iron
overload.
Thresholds for iron deficiency will be described for infants, children, adolescents
and adults. In the case of iron overload, values are only available for adults.
18.1 Iron deficiency
Thresholds have been identified by examining the highest concentration found in
patients with iron deficiency anaemia classified as microcytic, who have either an
absence of stainable iron in their bone marrow or show a response to therapeutic
iron (1,148). The suggested upper limit was 15 µg/l in each case. Table 9 shows thresh-
olds derived from the analysis of iron replete populations. There are rapid changes
in storage iron concentrations in the first 6 months of life. The WHO thresholds (4)
appear to reflect results from clinical studies rather than an analysis of population
distributions. The WHO report suggests that a ferritin concentration of <30 µg/l in
children less than 5 years old in the presence of infection indicates depleted iron
stores, but there is no consensus about this value in the literature. No threshold was
suggested for adults with infection or inflammation.
18.2 Iron overload
The thresholds suggested for a serum ferritin concentration during iron overload
have varied widely. WHO (4) concluded that thresholds of >200 µg/l for men and
>150 µg/l for women were appropriate. In the UK values of >300 µg/l for men and eld-
erly women, and >200 µg/l for young women, have been suggested (216). Thresholds
INDICATORS Of THE IRON STATuS Of POPuLATIONS: fERRITIN

ASSESSING THE IRON STATuS Of POPuLATIONS
62
from 200 µg/l (217) to 400 µg/l (218) have been applied to men. For pre-menopausal
women 200 µg/l has been commonly selected as a threshold although Asberg et al.
(219) used a value of >100 µg/l. Where good data are available age related thresholds
should be applied (47).
19. using ferritin to determine the iron status of populations
There have been two general approaches to assessing iron deficiency in populations.
Iron deficiency has been defined as a serum ferritin concentration of <15 µg/l in stud-
ies conducted by Hallberg et al. (148) and Milman et al. (207) in Scandinavia. In the
USA the criteria set to classify an iron deficiency in NHANES II and III have been two
of three abnormal values for transferrin saturation, serum ferritin concentration and
erythrocyte protoporphyrin concentration (205).
The first approach may over-estimate the frequency of iron deficiency. This is par-
ticularly critical in paediatric practice where the low concentration of serum ferritin
is associated with a high coefficient of variation in the assay. The second approach
tends to under-estimate the frequency, unless thresholds are carefully selected (e.g.
a threshold at the 12th percentile for transferrin saturation instead of the 5th percen-
tile for data from NHANES III).
20. using the ratio of serum transferrin receptor to serum ferritin to measure iron stores
Recently Cook et al. (153) have demonstrated that in healthy subjects the concentra-
tion of stored iron may be estimated from the ratio of sTfR/SF (reported in µg/l for
both assays). The relationship between the sTfR/SF ratio and the concentration of
stored iron was estimated in a study in which serial measurements of serum trans-
ferrin receptor and serum ferritin were made during repeated phlebotomy of 14
healthy subjects (220). There was a close, linear relationship between the logarithm
of the sTfR/SF ratio and stored iron expressed as mg per kg body weight (Figure 4).
The value of the ratio may be negative, which represents a deficit in iron required to
maintain a normal haemoglobin concentration.
TAbLe 9Suggested thresholds for age groups to classify individuals as iron deficient during epidemiological studies
Age Serum ferritin concentration (µg/l) Reference
4 months <20 Domellof et al. (168)a
6 months <9 Domellof et al. (168)a
9 months <5 Domellof et al. (168)a
1–2 years <10 Looker et al. (3)b
3–5 years <10 Looker et al. (3)b
<5 years <12 WHO (4)
>5 years <15 WHO (4)
6–11 years <12 Looker et al. (3)
12–15 years <12 Looker et al. (3)
<16 years <12 Looker et al. (3)
a Data derived from studies of iron replete, breast-fed infants.b Data from NHANES III.

63
The equation of the regression line derived
from this study has been applied to three
situations: 1) estimating iron stores in the US
population; 2) estimating changes in body
iron after supplementation in pregnant Ja-
maican women; and 3) estimating changes in
body iron during an iron fortification trial in
anaemic Vietnamese women.
The results for people studied in the US
population survey (a subset of NHANES III)
confirmed a previous analysis (221), and the
supplementation studies gave results similar
to those found with earlier studies using ra-
dioactive iron or the “multiple measurement”
approach. In the Viet Nam study the efficacy
of the fortification strategy was demonstrat-
ed by studying only 30 subjects for 3 months.
Fortification trials have previously required
hundreds of participants and taken years to
conduct (see references in (153)). The sTfR/
SF ratio provided estimates of stored iron for
each person in the survey, and their degree of
anaemia due to iron deficiency could be cal-
culated from the tissue iron deficit.
Although a significant advance on previous methods, there are some qualifica-
tions: it will be difficult to validate the relationship between sTfR/SF ratio and body
iron stores in children and pregnant women, two groups with the highest incidence
of iron deficiency, by a similar process of quantitative phlebotomy, although non-
invasive methods such as Superconducting Quantum Interference Device (SQUID)
(182) may be applicable; and the ratio will be influenced by chronic disease because
serum ferritin is one component of the ratio. The serum transferrin concentration is
less influenced by infection than the ferritin concentration although there is debate
about the reliability of measuring sTfR to estimate iron status during chronic disease
and in populations where malaria is endemic. At present the only valid approach is to
identify subjects with inflammation, infection or chronic disease and remove them
from the analysis.
Currently the lack of standardization in assay ranges and units of measurement,
and the lack of reference samples, prevents the wider use of the sTfR assay.
21. recommendations for future surveys of iron status There are four important principles:
1. Use the best possible approach based on current knowledge. Define anaemia
based on the haemoglobin concentration. In principle, the serum ferritin concen-
tration provides an index of the concentration of stored iron, but its use is limited
because the ferritin concentration increases during acute and chronic disease.
Neither erythrocyte protoporphyrin nor transferrin saturation provide a better
index of stored iron concentration than serum ferritin concentration, although
INDICATORS Of THE IRON STATuS Of POPuLATIONS: fERRITIN
FIGURe 4 The variation in the serum transferrin receptor to serum ferritin concentration ratio with body iron. Positive values of body iron represent storage iron and negative values represent iron deficiency. Bars represent the standard error of the mean.
Adapted from Skikne et al. (220), with permission of the publisher.

ASSESSING THE IRON STATuS Of POPuLATIONS
64
they do identify iron-deficient erythropoiesis, but the value of TS is reduced by
high biological variation. Rather than measuring lots of parameters to define iron
deficiency, the sTfR/SF ratio should be further evaluated (see below).
2. An important feature of current work is to be able to compare results with previous
studies and to detect trends. For the UK and Scandinavia this compatibility may
require measurements of haemoglobin and serum ferritin in adults. For compari-
son with previous studies of infants and children in the USA (NHANES) and other
international studies, transferrin saturation and zinc protoporphyrin concentra-
tion should be measured.
3. Standardized and reliable assays calibrated against reference material should be
used.
4. Markers of inflammation or infection should be included. At the moment the re-
liable assessment of iron status is not possible in the presence of inflammation
or infection, and it is necessary to exclude such subjects. The measurement of
the concentration of C-reactive protein (CRP) provides indicator of acute disease
whereas other proteins, such as alpha-1-acid glycoprotein (AGP), may provide a
marker of chronic infection. An alternative is to measure the erythrocyte sedi-
mentation rate (ESR). However none of these will identify minor infections that
may increase the ferritin concentration for long periods (63) and a health ques-
tionnaire should be completed for each subject to identify possible infection. The
use of highly sensitive assays for CRP may be valuable to detect sub-clinical infec-
tions. The ideal marker of infection has not been identified but ideally would have
a similar response to disease as ferritin, but without being influenced by iron.
22. references 1. Worwood M. Serum ferritin. CRC Critical Reviews in Clinical Laboratory Sciences,
1979, 10:171–204. 2. Summary of a report on assessment of the iron nutritional status of the United States
population. Expert Scientific Working Group. American Journal of Clinical Nutrition, 1985, 42:1318–1330.
3. Looker AC et al. Prevalence of iron deficiency in the United States. Journal of the American Medical Association, 1997, 277:973–976.
4. WHO, UNICEF, UNU. Iron deficiency anaemia: assessment, prevention, and control. A guide for programme managers. Geneva, World Health Organization, 2001. WHO/NHD/01.3.
5. Laufberger M. Sur la cristallisation de la ferritine. Bulletin de la Societe de chimie biologique, 1937, 19:1575–1582.
6. Harrison PM, Arosio P. The ferritins: molecular properties, iron storage function and cellular regulation. Biochimica et Biophysica Acta (BBA) – Bioenergetics, 1996, 1275:161–203.
7. Arosio P, Adelman TG, Drysdale JW. On ferritin heterogeneity. Further evidence for heteropolymers. Journal of Biological Chemistry, 1978, 253:4451–4458.
8. Worwood M et al. Assignment of human ferritin genes to chromosomes 11 and 19q13.3----19qter. Human Genetics, 1985, 69:371–374.
9. Drysdale J et al. Mitochondrial ferritin: a new player in iron metabolism. Blood Cells, Molecules, and Diseases, 2002, 29:376–383.
10. Worwood M. Ferritin. Blood Reviews, 1990, 4:259–269. 11. Preparation, characterization and storage of human ferritin for use as a standard for
the assay of serum ferritin. International Committee for Standardization in Haema-tology (Expert Panel on Iron). Clinical and Laboratory Haematology, 1984, 6:177–191.
12. Williams MA, Harrison PM. Electron-microscopic and chemical studies of oligomers in horse ferritin. Biochemical Journal, 1968, 110:265–280.

65
INDICATORS Of THE IRON STATuS Of POPuLATIONS: fERRITIN
13. Andrews SC, Treffry A, Harrison PM. Siderosomal ferritin. The missing link between ferritin and haemosiderin? Biochemical Journal, 1987, 245:439–446.
14. Richter GW. Studies of iron overload. Rat liver siderosome ferritin. Laboratory Inves-tigation, 1984, 50:26–35.
15. Weir MP, Gibson JF, Peters TJ. Haemosiderin and tissue damage. Cell Biochemistry and Function, 1984, 2:186–194.
16. Drysdale JW, Munro HN. Regulation of synthesis and turnover of ferritin in rat liver. Journal of Biological Chemistry, 1966, 241:3630–3637.
17. Zahringer J et al. Mechanism of iron induction of ferritin synthesis. Biochemical and Biophysical Research Communications, 1975, 65:583–590.
18. White K, Munro HN. Induction of ferritin subunit synthesis by iron is regulated at both the transcriptional and translational levels. Journal of Biological Chemistry, 1988, 263:8938–8942.
19. Hentze MW, Kuhn LC. Molecular control of vertebrate iron metabolism: mRNA-based regulatory circuits operated by iron, nitric oxide, and oxidative stress. Proceedings of the National Academy of Sciences of the United States of America, 1996, 93:8175–8182.
20. Klausner RD, Rouault TA, Harford JB. Regulating the fate of mRNA: the control of cellular iron metabolism. Cell, 1993, 72:19–28.
21. Campbell CH, Ismail R, Linder MC. Ferritin mRNA is found on bound as well as on free polyribosomes in rat heart. Archives of Biochemistry and Biophysics, 1989, 273:89–98.
22. Wagstaff M, Worwood M, Jacobs A. Properties of human tissue isoferritins. Biochem-ical Journal, 1978, 173:969–977.
23. Worrall M, Worwood M. Immunological properties of ferritin during in vitro matu-ration of human monocytes. European Journal of Haematology, 1991, 47:223–228.
24. Alpert E, Coston RL, Drysdale JW. Carcino-foetal human liver ferritins. Nature, 1973, 242:194–196.
25. Moroz C et al. Preparation and characterization of monoclonal antibodies specific to placenta ferritin. Clinica Chimica Acta, 1985, 148:111–118.
26. Moroz C et al. PLIF, a novel human ferritin subunit from placenta with immunosup-pressive activity. Journal of Biological Chemistry, 2002, 277:12901–12905.
27. Moroz C et al. New monoclonal antibody enzymoassay for the specific measurement of placental ferritin isotype in hematologic malignancies. Experimental Hematology, 1987, 15:258–262.
28. Maymon R, Moroz C. Placental isoferritin: a new biomarker from conception to delivery. British Journal of Obstetrics and Gynaecology, 1996, 103:301–305.
29. Broxmeyer HE et al. Identification of leukemia-associated inhibitory activity as acid-ic isoferritins. A regulatory role for acidic isoferritins in the production of granulo-cytes and macrophages. Journal of Experimental Medicine, 1981, 153:1426–1444.
30. Broxmeyer HE. H-ferritin: a regulatory cytokine that down-modulates cell prolifera-tion. Journal of Laboratory and Clinical Medicine, 1992, 120:367–370.
31. Sala G, Worwood M, Jacobs A. The effect of isoferritins on granulopoiesis. Blood, 1986, 67:436–443.
32. Addison GM et al. An immunoradiometric assay for ferritin in the serum of nor-mal subjects and patients with iron deficiency and iron overload. Journal of Clinical Pathology, 1972, 25:326–329.
33. Worwood M et al. Binding of serum ferritin to concanavalin A: patients with homozygous beta thalassaemia and transfusional iron overload. British Journal of Haematology, 1980, 46:409–416.
34. Worwood M. Ferritin in human tissues and serum. Clinics in Haematology, 1982, 11:275–307.
35. Walters GO, Miller FM, Worwood M. Serum ferritin concentration and iron stores in normal subjects. Journal of Clinical Pathology, 1973, 26:770–772.
36. Leggett BA et al. Factors affecting the concentrations of ferritin in serum in a healthy Australian population. Clinical Chemistry, 1990, 36:1350–1355.

ASSESSING THE IRON STATuS Of POPuLATIONS
66
37. Milman N, Kirchhoff M. Influence of blood donation on iron stores assessed by serum ferritin and haemoglobin in a population survey of 1433 Danish males. Euro-pean Journal of Haematology, 1991, 47:134–139.
38. Milman N, Kirchhoff M. The influence of blood donation on iron stores assessed by serum ferritin and hemoglobin in a population survey of 1359 Danish women. Annals of Hematology, 1991, 63:27–32.
39. Milman N, Kirchhoff M. Relationship between serum ferritin, alcohol intake, and social status in 2235 Danish men and women. Annals of Hematology, 1996, 72:145–151.
40. White A, Nicolas G, Foster K. Health Survey for England 1991. Her Majesty’s Station-ary Office, 1993.
41. Touitou Y et al. Plasma ferritin in old age. Influence of biological and pathological factors in a large elderly population. Clinica Chimica Acta, 1985, 149:37–45.
42. Cook JD, Finch CA, Smith NJ. Evaluation of the iron status of a population. Blood, 1976, 48:449–455.
43. Finch CA et al. Effect of blood donation on iron stores as evaluated by serum ferritin. Blood, 1977, 50:441–447.
44. Jacobs A, Worwood M. Ferritin in serum. Clinical and biochemical implications. New England Journal of Medicine, 1975, 292:951–956.
45. Milman N, Andersen HC, Pedersen NS. Serum ferritin and iron status in ‘healthy’ elderly individuals. Scandinavian Journal of Clinical and Laboratory Investigation, 1986, 46:19–26.
46. Valberg LS et al. Serum ferritin and the iron status of Canadians. Canadian Medical Association Journal, 1976, 114:417–421.
47. Custer EM et al. Population norms for serum ferritin. Journal of Laboratory and Clini-cal Medicine, 1995, 126:88–94.
48. Saarinen UM, Siimes MA. Serum ferritin in assessment of iron nutrition in healthy infants. Acta Paediatrica Scandinavica, 1978, 67:745–751.
49. Siimes MA, Addiego JE, Jr., Dallman PR. Ferritin in serum: diagnosis of iron defi-ciency and iron overload in infants and children. Blood, 1974, 43:581–590.
50. Milman N, Kaas IK. Serum ferritin in Danish children and adolescents. Scandina-vian Journal of Haematology, 1984, 33:260–266.
51. Konijn AM, Hershko C. Ferritin synthesis in inflammation. I. Pathogenesis of impaired iron release. British Journal of Haematology, 1977, 37:7–16.
52. Dinarello CA. Interleukin-1 and the pathogenesis of the acute-phase response. New England Journal of Medicine, 1984, 311:1413–1418.
53. Rogers JT et al. Translational control during the acute phase response. Ferritin synthesis in response to interleukin-1. Journal of Biological Chemistry, 1990, 265:14572–14578.
54. Elin RJ, Wolff SM, Finch CA. Effect of induced fever on serum iron and ferritin con-centrations in man. Blood, 1977, 49:147–153.
55. Birgegard G et al. Serum ferritin during infection. A longitudinal study. Scandina-vian Journal of Haematology, 1978, 21:333–340.
56. Birgegard G et al. Serum ferritin during inflammation. A study on myocardial infarc-tion. Acta Medica Scandinavica, 1979, 206:361–366.
57. van Iperen CE et al. Iron metabolism and erythropoiesis after surgery. British Jour-nal of Surgery, 1998, 85:41–45.
58. Guidelines on selection of laboratory tests for monitoring the acute phase response. International Committee for Standardization in Haematology (expert panel on blood rheology). Journal of Clinical Pathology, 1988, 41:1203–1212.
59. WHO Expert Committee on Biological Standardization: Thirty-seventh report. Geneva, World Health Organization, 1987. (WHO Technical Report Series, No. 760).
60. Witte DL. Can serum ferritin be effectively interpreted in the presence of the acute-phase response? Clinical Chemistry, 1991, 37:484–485.
61. Witte DL et al. Predicting bone marrow iron stores in anemic patients in a commu-nity hospital using ferritin and erythrocyte sedimentation rate. American Journal of Clinical Pathology, 1988, 90:85–87.

67
62. Coenen JL et al. Measurements of serum ferritin used to predict concentrations of iron in bone marrow in anemia of chronic disease. Clinical Chemistry, 1991, 37:560–563.
63. Hulthen L et al. Effect of a mild infection on serum ferritin concentration – clini-cal and epidemiological implications. European Journal of Clinical Nutrition, 1998, 52:376–379.
64. Abraham K et al. Minimal inflammation, acute phase response and avoidance of misclassification of vitamin A and iron status in infants – importance of a high- sensitivity C-reactive protein (CRP) assay. International Journal for Vitamin and Nutrition Research, 2003, 73:423–430.
65. Cavill I, Jacobs A, Worwood M. Diagnostic methods for iron status. Annals of Clinical Biochemistry, 1986, 23( Pt 2):168–171.
66. Prieto J, Barry M, Sherlock S. Serum ferritin in patients with iron overload and with acute and chronic liver diseases. Gastroenterology, 1975, 68:525–533.
67. Worwood M et al. Binding of human serum ferritin to concanavalin A. Clinical Science, 1979, 56:83–87.
68. Batey RG et al. The role of serum ferritin in the management of idiopathic haemo-chromatosis. Scandinavian Journal of Gastroenterology, 1978, 13:953–957.
69. Valberg LS et al. Diagnostic efficacy of tests for the detection of iron overload in chronic liver disease. Canadian Medical Association Journal, 1978, 119:229–236.
70. Chapman RW et al. Binding of serum ferritin to concanavalin A in patients with iron overload and with chronic liver disease. Journal of Clinical Pathology, 1982, 35:481–486.
71. Hazard JT, Drysdale JW. Ferritinaemia in cancer. Nature, 1977, 265:755–756. 72. Jones BM, Worwood M, Jacobs A. Serum ferritin in patients with cancer: determi-
nation with antibodies to HeLa cell and spleen ferritin. Clinica Chimica Acta, 1980, 106:203–214.
73. Hann HW, Stahlhut MW, Evans AE. Basic and acidic isoferritins in the sera of patients with neuroblastoma. Cancer, 1988, 62:1179–1182.
74. Jones BM, Worwood M. An immunoradiometric assay for the acidic ferritin of human heart: application to human tissues, cells and serum. Clinica Chimica Acta, 1978, 85:81–88.
75. Niitsu Y et al. Evaluation of heart isoferritin assay for diagnosis of cancer. In: Albertini A, ed. Radioimmunoassay of hormones, proteins and enzymes. Amsterdam, Excerpta Medica, 1980: 256–266.
76. Cavanna F et al. Development of a monoclonal antibody against human heart fer-ritin and its application in an immunoradiometric assay. Clinica Chimica Acta, 1983, 134:347–356.
77. Choi JH et al. Serum cytokine profiles in patients with adult onset Still’s disease. Journal of Rheumatology, 2003, 30:2422–2427.
78. Ota T et al. Increased serum ferritin levels in adult Still’s disease. Lancet, 1987, 1:562–563.
79. Esumi N et al. Hyperferritinemia in malignant histiocytosis, virus-associated hemophagocytic syndrome and familial erythrophagocytic lymphohistiocytosis. A survey of pediatric cases. Acta Paediatrica Scandinavica, 1989, 78:268–270.
80. Esumi N et al. High serum ferritin level as a marker of malignant histiocytosis and virus-associated hemophagocytic syndrome. Cancer, 1988, 61:2071–2076.
81. Koduri PR et al. Elevated serum ferritin levels: associated diseases and clinical significance. American Journal of Medicine, 1996, 101:121–122.
82. Kirn DH et al. Marked elevation of the serum ferritin is highly specific for dissemi-nated histoplasmosis in AIDS. AIDS, 1995, 9:1204–1205.
83. Worwood M. The measurement of ferritin. In: Rowen RM, Van Assendelft OW, Pres-ton FE, eds. Advanced Laboratory Methods in Haematology. London, Arnold, 2002: 241–263.
84. Cazzola M. Hereditary hyperferritinaemia cataract syndrome. Best Practice & Research Clinical Haematology, 2002, 15:385–398.
INDICATORS Of THE IRON STATuS Of POPuLATIONS: fERRITIN

ASSESSING THE IRON STATuS Of POPuLATIONS
68
85. Worwood M et al. The purification and properties of ferritin from human serum. Biochemical Journal, 1976, 157:97–103.
86. Cragg SJ, Wagstaff M, Worwood M. Detection of a glycosylated subunit in human serum ferritin. Biochemical Journal, 1981, 199:565–571.
87. Pootrakul P et al. Quantitation of ferritin iron in plasma, an explanation for non-transferrin iron. Blood, 1988, 71:1120–1123.
88. Linder MC et al. Serum ferritin: does it differ from tissue ferritin? Journal of Gastro-enterology and Hepatology, 1996, 11:1033–1036.
89. ten Kate J et al. The iron content of serum ferritin: physiological importance and diagnostic value. European Journal of Clinical Chemistry and Clinical Biochemistry, 1997, 35:53–56.
90. Herbert V et al. Serum ferritin iron, a new test, measures human body iron stores unconfounded by inflammation. Stem Cells, 1997, 15:291–296.
91. Nielsen P et al. Serum ferritin iron in iron overload and liver damage: correlation to body iron stores and diagnostic relevance. Journal of Laboratory and Clinical Medi-cine, 2000, 135:413–418.
92. Yamanishi H et al. Interference of ferritin in measurement of serum iron concentra-tions: comparison by five methods. Clinical Chemistry, 1996, 42:331–332.
93. Reissmann K, Dietrich M. On the presence of ferritin in the peripheral blood of patients with hepatocellular disease. Journal of Clinical Investigation, 1956, 35:588–595.
94. McKeering LV et al. Immunological detection of isoferritins in normal human serum and tissue. Clinica Chimica Acta, 1976, 67:189–197.
95. Cragg SJ, Wagstaff M, Worwood M. Sialic acid and the microheterogeneity of human serum ferritin. Clinical Science, 1980, 58:259–262.
96. Santambrogio P et al. Human serum ferritin G-peptide is recognized by anti-L ferritin subunit antibodies and concanavalin-A. British Journal of Haematology, 1987, 65:235–237.
97. Ghosh S, Hevi S, Chuck SL. Regulated secretion of glycosylated human ferritin from hepatocytes. Blood, 2004, 103:2369–2376.
98. Worwood M et al. The clearance of 131I-human plasma ferritin in man. Blood, 1982, 60:827–833.
99. Cragg SJ et al. Turnover of 131I-human spleen ferritin in plasma. British Journal of Haematology, 1983, 55:83–92.
100. Adams PC, Powell LW, Halliday JW. Isolation of a human hepatic ferritin receptor. Hepatology, 1988, 8:719–721.
101. Covell AM, Jacobs A, Worwood M. Interaction of ferritin with serum: implications for ferritin turnover. Clinica Chimica Acta, 1984, 139:75–84.
102. Bellotti V et al. Characteristics of a ferritin-binding protein present in human serum. British Journal of Haematology, 1987, 65:489–493.
103. Santambrogio P, Massover WH. Rabbit serum alpha-2-macroglobulin binds to liver ferritin: association causes a heterogeneity of ferritin molecules. British Journal of Haematology, 1989, 71:281–290.
104. Arosio P et al. A mutational analysis of the epitopes of recombinant human H- ferritin. Biochimica et Biophysica Acta, 1990, 1039:197–203.
105. Arosio P, Yokota M, Drysdale JW. Characterization of serum ferritin in iron overload: possible identity to natural apoferritin. British Journal of Haematology, 1977, 36:199–207.
106. Hodgetts J, Hoy TG, Jacobs A. Iron uptake and ferritin synthesis in human erythrob-lasts. Clinical Science, 1986, 70:53–57.
107. Cazzola M et al. Biologic and clinical significance of red cell ferritin. Blood, 1983, 62:1078–1087.
108. Peters SW, Jacobs A, Fitzsimons E. Erythrocyte ferritin in normal subjects and patients with abnormal iron metabolism. British Journal of Haematology, 1983, 53:211–216.

69
109. Davidson A et al. Red cell ferritin content: a re-evaluation of indices for iron deficien-cy in the anaemia of rheumatoid arthritis. British Medical Journal (Clinical Research Ed), 1984, 289:648–650.
110. Van der Weyden MB et al. Erythrocyte ferritin content in idiopathic haemochroma-tosis and alcoholic liver disease with iron overload. British Medical Journal (Clinical Research Ed), 1983, 286:752–754.
111. Piperno A et al. Erythrocyte ferritin in thalassemia syndromes. Acta Haematologica, 1984, 71:251–256.
112. Van der Weyden MB et al. Red cell ferritin and iron overload in heterozygous beta-thalassemia. American Journal of Hematology, 1989, 30:201–205.
113. Van der Weyden MB, Fong H. Red cell basic ferritin content of patients with mega-loblastic anaemia due to vitamin B12 or folate deficiency. Scandinavian Journal of Haematology, 1984, 33:373–377.
114. Cazzola M, Ascari E. Red cell ferritin as a diagnostic tool. British Journal of Haema-tology, 1986, 62:209–213.
115. Lipschitz DA, Allegre A, Cook JD. The clinical significance of ferritinuria. Blood, 1980, 55:260–264.
116. Ishikawa K et al. Determination of ferritin in urine and in serum of normal adults with a sensitive enzyme immunoassay. Clinica Chimica Acta, 1982, 123:73–81.
117. Worwood M et al. Stable lyophilized reagents for the serum ferritin assay. Clinical and Laboratory Haematology, 1991, 13:297–305.
118. Worwood M. Iron deficiency anaemia and iron overload. In: Lewis SMBB, Bates I, eds. Dacie and Lewis’s Practical Haematology. London, Churchill Livingstone, 2001: 115–128.
119. Elin RJ, Henley R, Worwood M. Three commercial automated ferritin assays. Evalua-tion report MDA/97/41. London, Medical Devices Agency, 1997.
120. Worwood M. AutoDELFIA serum ferritin assay. London, Medical Devices Agency, 2000. MDS 00032 2000.
121. Boscato LM, Stuart MC. Heterophilic antibodies: a problem for all immunoassays. Clinical Chemistry, 1988, 34:27–33.
122. International Committee for Standardization in Haematology (Expert Panel on Iron). Proposed international standard of human ferritin for the serum ferritin assay. British Journal of Haematology, 1985, 61:61–63.
123. Dawson DW, Fish DI, Shackleton P. The accuracy and clinical interpretation of serum ferritin assays. Clinical and Laboratory Haematology, 1992, 14:47–52.
124. Hamilton MS, Blackmore S, Lee A. Variable recovery of the 3rd international ferri-tin standard 94/572 shown by the UKNEQAS haematinics survey of ferritin immu-noassays. British Journal of Haematology, 2004, 125(Suppl.1):60.
125. Dawkins S et al. Variability of serum ferritin concentration in normal subjects. Clini-cal and Laboratory Haematology, 1979, 1:41–46.
126. Kristal-Boneh E et al. Seasonal changes in red blood cell parameters. British Journal of Haematology, 1993, 85:603–607.
127. Kim I, Yetley EA, Calvo MS. Variations in iron-status measures during the menstrual cycle. American Journal of Clinical Nutrition, 1993, 58:705–709.
128. Borel MJ et al. Day-to-day variation in iron-status indices in healthy men and women. American Journal of Clinical Nutrition, 1991, 54:729–735.
129. Pootrakul P, Skikne BS, Cook JD. The use of capillary blood for measurements of circulating ferritin. American Journal of Clinical Nutrition, 1983, 37:307–310.
130. Cooper MJ, Zlotkin SH. Day-to-day variation of transferrin receptor and ferritin in healthy men and women. American Journal of Clinical Nutrition, 1996, 64:738–742.
131. Lundberg PA et al. Increase in serum ferritin concentration induced by fasting. Clini-cal Chemistry, 1984, 30:161–163.
132. Nikolaidis MG, Michailidis Y, Mougios V. Variation of soluble transferrin receptor and ferritin concentrations in human serum during recovery from exercise. Euro-pean Journal of Applied Physiology and Occupational Physiology, 2003, 89:500–502.
INDICATORS Of THE IRON STATuS Of POPuLATIONS: fERRITIN

ASSESSING THE IRON STATuS Of POPuLATIONS
70
133. Fallon KE. The acute phase response and exercise: the ultramarathon as prototype exercise. Clinical Journal of Sport Medicine, 2001, 11:38–43.
134. Stupnicki R et al. Day to day variability in the transferrin receptor/ferritin index in female athletes. British Journal of Sports Medicine, 2003, 37:267–269.
135. Wiggers P et al. Screening for haemochromatosis: influence of analytical impreci-sion, diagnostic limit and prevalence on test validity. Scandinavian Journal of Clini-cal and Laboratory Investigation, 1991, 51:143–148.
136. Gallagher SK, Johnson LK, Milne DB. Short-term and long-term variability of indices related to nutritional status. I: Ca, Cu, Fe, Mg, and Zn. Clin Chem, 1989, 35:369–373.
137. Statland BE, Winkel P. Relationship of day-to-day variation of serum iron concen-trations to iron-binding capacity in healthy young women. Am J Clin Pathol, 1977, 67:84–90.
138. Statland BE, Winkel P, Bokelund H. Variation of serum iron concentration in young healthy men: Within-day and day-to-day changes. Clin Biochem, 1976, 9:26–29.
139. Statland BE et al. Evaluation of biologic sources of variation of leukocyte counts and other hematologic quantities using very precise automated analyzers. Am J Clin Pathol, 1978, 69:48–54.
140. Pilon VA et al. Day-to-day variation in serum ferritin concentration in healthy sub-jects. Clin Chem, 1981, 27:78–82.
141. Romslo I, Talstad I. Day-to-day variations in serum iron, serum iron binding capacity, serum ferritin and erythrocyte protoporphyrin concentrations in anaemic subjects. Eur J Haematol, 1988, 40:79–82.
142. Maes M et al. Components of biological variation in serum soluble transferrin receptor: relationships to serum iron, transferrin and ferritin concentrations, and immune and haematological variables. Scandinavian Journal of Clinical and Labora-tory Investigation, 1997, 57:31–41.
143. Hastka J et al. Washing erythrocytes to remove interferents in measurements of zinc protoporphyrin by front-face hematofluorometry. Clinical Chemistry, 1992, 38:2184–2189.
144. Ahluwalia N. Diagnostic utility of serum transferrin receptors measurement in assessing iron status. Nutrition Reviews, 1998, 56:133–141.
145. Bentley DP, Williams P. Serum ferritin concentration as an index of storage iron in rheumatoid arthritis. Journal of Clinical Pathology, 1974, 27:786–788.
146. Tessitore N et al. The role of iron status markers in predicting response to intrave-nous iron in haemodialysis patients on maintenance erythropoietin. Nephrology, Dialysis, Transplantation, 2001, 16:1416–1423.
147. Goddard AF, McIntyre AS, Scott BB. Guidelines for the management of iron deficien-cy anaemia. British Society of Gastroenterology. Gut, 2000, 46(Suppl. 3–4):IV1–IV5.
148. Hallberg L et al. Screening for iron deficiency: an analysis based on bone-marrow examinations and serum ferritin determinations in a population sample of women. British Journal of Haematology, 1993, 85:787–798.
149. Zanella A et al. Sensitivity and predictive value of serum ferritin and free erythro-cyte protoporphyrin for iron deficiency. Journal of Laboratory and Clinical Medicine, 1989, 113:73–78.
150. Guyatt GH et al. Laboratory diagnosis of iron-deficiency anemia: an overview. Jour-nal of General Internal Medicine, 1992, 7:145–153.
151. Ahluwalia N et al. Iron deficiency and anemia of chronic disease in elderly women: a discriminant-analysis approach for differentiation. American Journal of Clinical Nutrition, 1995, 61:590–596.
152. Kotru M et al. Evaluation of serum ferritin in screening for iron deficiency in tuber-culosis. Annals of Hematology, 2004, 83:95–100.
153. Cook JD, Flowers CH, Skikne BS. The quantitative assessment of body iron. Blood, 2003, 101:3359–3364.
154. Macdougall IC et al. Detection of functional iron deficiency during erythropoietin treatment: a new approach. British Medical Journal, 1992, 304:225–226.
155. Fishbane S et al. A randomized trial of iron deficiency testing strategies in hemodi-alysis patients. Kidney International, 2001, 60:2406–2411.

71
156. van Tellingen A et al. Iron deficiency anaemia in hospitalised patients: value of various laboratory parameters. Differentiation between IDA and ACD. Netherlands Journal of Medicine, 2001, 59:270–279.
157. Lee EJ et al. Soluble transferrin receptor (sTfR), ferritin, and sTfR/log ferritin index in anemic patients with nonhematologic malignancy and chronic inflammation. Clinical Chemistry, 2002, 48:1118–1121.
158. Mast AE et al. Clinical utility of the reticulocyte hemoglobin content in the diagnosis of iron deficiency. Blood, 2002, 99:1489–1491.
159. Punnonen K, Irjala K, Rajamaki A. Serum transferrin receptor and its ratio to serum ferritin in the diagnosis of iron deficiency. Blood, 1997, 89:1052–1057.
160. Baumann Kurer S et al. Prediction of iron deficiency in chronic inflammatory rheu-matic disease anaemia. British Journal of Haematology, 1995, 91:820–826.
161. Bultink IE et al. Ferritin and serum transferrin receptor predict iron deficiency in ane-mic patients with rheumatoid arthritis. Arthritis and Rheumatism, 2001, 44:979–981.
162. Means RT, Jr. et al. Serum soluble transferrin receptor and the prediction of marrow aspirate iron results in a heterogeneous group of patients. Clinical and Laboratory Haematology, 1999, 21:161–167.
163. Joosten E et al. Serum transferrin receptor in the evaluation of the iron status in elderly hospitalized patients with anemia. American Journal of Hematology, 2002, 69:1–6.
164. Balaban EP et al. Evaluation of bone marrow iron stores in anemia associated with chronic disease: a comparative study of serum and red cell ferritin. American Journal of Hematology, 1993, 42:177–181.
165. Mast AE et al. Clinical utility of the soluble transferrin receptor and comparison with serum ferritin in several populations. Clinical Chemistry, 1998, 44:45–51.
166. Fernandez-Rodriguez AM et al. Diagnosis of iron deficiency in chronic renal failure. American Journal of Kidney Diseases, 1999, 34:508–513.
167. Sherriff A et al. Haemoglobin and ferritin concentrations in children aged 12 and 18 months. ALSPAC Children in Focus Study Team. Archives of Disease in Childhood, 1999, 80:153–157.
168. Domellof M et al. The diagnostic criteria for iron deficiency in infants should be reevaluated. Journal of Nutrition, 2002, 132:3680–3686.
169. Lozoff B et al. Behavioral and developmental effects of preventing iron-deficiency anemia in healthy full-term infants. Pediatrics, 2003, 112:846–854.
170. Male C et al. Prevalence of iron deficiency in 12-mo-old infants from 11 European areas and influence of dietary factors on iron status (Euro-Growth study). Acta Pae-diatrica, 2001, 90:492–498.
171. Margolis HS et al. Iron deficiency in children: the relationship between pretreatment laboratory tests and subsequent hemoglobin response to iron therapy. American Journal of Clinical Nutrition, 1981, 34:2158–2168.
172. Hershko C et al. Diagnosis of iron deficiency anemia in a rural population of chil-dren. Relative usefulness of serum ferritin, red cell protoporphyrin, red cell indices, and transferrin saturation determinations. American Journal of Clinical Nutrition, 1981, 34:1600–1610.
173. Wheby MS. Effect of iron therapy on serum ferritin levels in iron-deficiency anemia. Blood, 1980, 56:138–140.
174. Madi-Jebara SN et al. Postoperative intravenous iron used alone or in combination with low-dose erythropoietin is not effective for correction of anemia after cardiac surgery. Journal of Cardiothoracic and Vascular Anesthesia, 2004, 18:59–63.
175. Skikne B et al. Iron and blood donation. Clinics in Haematology, 1984, 13:271–287. 176. Choi JW, Im MW, Pai SH. Serum transferrin receptor concentrations during normal
pregnancy. Clinical Chemistry, 2000, 46:725–727. 177. Carriaga MT et al. Serum transferrin receptor for the detection of iron deficiency in
pregnancy. American Journal of Clinical Nutrition, 1991, 54:1077–1081. 178. Institute of Medicine. Iron deficiency anemia: recommended guidelines for the preven-
tion, detection and management among U.S. children and women of childbearing age. Washington DC, National Academy Press, 1993.
INDICATORS Of THE IRON STATuS Of POPuLATIONS: fERRITIN

ASSESSING THE IRON STATuS Of POPuLATIONS
72
179. Recommendations to prevent and control iron deficiency in the United States. Cent-ers for Disease Control. MMWR Recommendations and Reports, 1998, 47:1–29.
180. American Academy of Pediatrics. Guidelines for perinatal care. Elk Grover Village, IL, The Academy, 1997.
181. Edwards CQ, Kushner JP. Screening for hemochromatosis. New England Journal of Medicine, 1993, 328:1616–1620.
182. Fischer R et al. Monitoring long-term efficacy of iron chelation therapy by deferiprone and desferrioxamine in patients with beta-thalassaemia major: appli-cation of SQUID biomagnetic liver susceptometry. British Journal of Haematology, 2003, 121:938–948.
183. Porter JB, Davis BA. Monitoring chelation therapy to achieve optimal outcome in the treatment of thalassaemia. Best Practice & Research Clinical Haematology, 2002, 15:329–368.
184. Zacharski LR et al. Association of age, sex, and race with body iron stores in adults: analysis of NHANES III data. American Heart Journal, 2000, 140:98–104.
185. Popkin BM, Siega-Riz AM, Haines PS. A comparison of dietary trends among racial and socioeconomic groups in the United States. New England Journal of Medicine, 1996, 335:716–720.
186. Worwood M. Inherited iron loading: genetic testing in diagnosis and management. Blood Reviews, 2005, 19:69–88.
187. Burt MJ et al. The significance of haemochromatosis gene mutations in the general population: implications for screening. Gut, 1998, 43:830–836.
188. Datz C et al. Heterozygosity for the C282Y mutation in the hemochromatosis gene is associated with increased serum iron, transferrin saturation, and hemoglobin in young women: a protective role against iron deficiency? Clinical Chemistry, 1998, 44:2429–2432.
189. Beutler E et al. The effect of HFE genotypes on measurements of iron overload in patients attending a health appraisal clinic. Annals of Internal Medicine, 2000, 133:329–337.
190. Jackson HA et al. HFE mutations, iron deficiency and overload in 10,500 blood donors. British Journal of Haematology, 2001, 114:474–484.
191. Rossi E et al. Compound heterozygous hemochromatosis genotype predicts in-creased iron and erythrocyte indices in women. Clinical Chemistry, 2000, 46:162–166.
192. Edwards CQ et al. The iron phenotype of hemochromatosis is heterozygotes. In: Barton JC, Edwards CQ, eds. Hemochromatosis: Genetics, pathophysiology, diagnosis and treatment. Cambridge, Cambridge University Press, 2000: 411–418.
193. Roetto A et al. Mutant antimicrobial peptide hepcidin is associated with severe juve-nile hemochromatosis. Nature Genetics, 2003, 33:21–22.
194. Merryweather-Clarke AT et al. Digenic inheritance of mutations in HAMP and HFE results in different types of haemochromatosis. Human Molecular Genetics, 2003, 12:2241–2247.
195. Roetto A et al. Hemochromatosis due to mutations in transferrin receptor 2. Blood Cells, Molecules, and Diseases, 2002, 29:465–470.
196. Montosi G et al. Autosomal-dominant hemochromatosis is associated with a mu-tation in the ferroportin (SLC11A3) gene. Journal of Clinical Investigation, 2001, 108:619–623.
197. Njajou OT et al. A mutation in SLC11A3 is associated with autosomal dominant he-mochromatosis. Nature Genetics, 2001, 28:213–214.
198. Devalia V et al. Autosomal dominant reticuloendothelial iron overload associated with a 3-base pair deletion in the ferroportin 1 gene (SLC11A3). Blood, 2002, 100:695–697.
199. Papanikolaou G et al. Mutations in HFE2 cause iron overload in chromosome 1q-linked juvenile hemochromatosis. Nature Genetics, 2004, 36:77–82.
200. Langlois MR et al. The haptoglobin 2-2 phenotype affects serum markers of iron status in healthy males. Clinical Chemistry, 2000, 46:1619–1625.

73
201. Beutler E, Gelbart T, Lee P. Haptoglobin polymorphism and iron homeostasis. Clinical Chemistry, 2002, 48:2232–2235.
202. Kasvosve I et al. Iron status in black persons is not influenced by haptoglobin poly-morphism. Clinical Chemistry and Laboratory Medicine, 2002, 40:810–813.
203. Carter K et al. Haptoglobin type neither influences iron accumulation in normal subjects nor predicts clinical presentation in HFE C282Y haemochromatosis: phe-notype and genotype analysis. British Journal of Haematology, 2003, 122:326–332.
204. Hallberg L. Results of surveys to assess iron status in Europe. Nutrition Reviews, 1995, 53:314–322.
205. Looker AC, Gunter EW, Johnson CL. Methods to assess iron status in various NHANES surveys. Nutrition Reviews, 1995, 53:246–254.
206. Pirkle JL et al. The decline in blood lead levels in the United States. The National Health and Nutrition Examination Surveys (NHANES). Journal of the American Med-ical Association, 1994, 272:284–291.
207. Milman N et al. Iron status in Danish women, 1984–1994: a cohort comparison of changes in iron stores and the prevalence of iron deficiency and iron overload. Euro-pean Journal of Haematology, 2003, 71:51–61.
208. Milman N et al. Iron status in Danish men 1984–94: a cohort comparison of changes in iron stores and the prevalence of iron deficiency and iron overload. European Jour-nal of Haematology, 2002, 68:332–340.
209. Stoltzfus RJ et al. Serum ferritin, erythrocyte protoporphyrin and hemoglobin are valid indicators of iron status of school children in a malaria-holoendemic popula-tion. Journal of Nutrition, 1997, 127:293–298.
210. Phillips RE et al. The importance of anaemia in cerebral and uncomplicated falci-parum malaria: role of complications, dyserythropoiesis and iron sequestration. Quarterly Journal of Medicine, 1986, 58:305–323.
211. Olsen A et al. The contribution of hookworm and other parasitic infections to hae-moglobin and iron status among children and adults in western Kenya. Transactions of the Royal Society of Tropical Medicine and Hygiene, 1998, 92:643–649.
212. Stoltzfus RJ et al. Malaria, hookworms and recent fever are related to anemia and iron status indicators in 0- to 5-y old Zanzibari children and these relationships change with age. Journal of Nutrition, 2000, 130:1724–1733.
213. Stoltzfus RJ et al. Low dose daily iron supplementation improves iron status and appetite but not anemia, whereas quarterly anthelminthic treatment improves growth, appetite and anemia in Zanzibari preschool children. Journal of Nutrition, 2004, 134:348–356.
214. Merryweather-Clarke AT et al. Geography of HFE C282Y and H63D mutations. Genetic Testing, 2000, 4:183–198.
215. Beutler E et al. Penetrance of 845G--> A (C282Y) HFE hereditary haemochromatosis mutation in the USA. Lancet, 2002, 359:211–218.
216. Dooley J, Worwood M. Guidelines on diagnosis and therapy: Genetic haemochromato-sis. British Committe of Standards in Hematology. Abigdon, Oxford , Darwin Medical Communications Ltd, 2000.
217. Mainous AG, III, Gill JM, Pearson WS. Should we screen for hemochromatosis? An examination of evidence of downstream effects on morbidity and mortality. Archives of Internal Medicine, 2002, 162:1769–1774.
218. Looker AC, Johnson CL. Prevalence of elevated serum transferrin saturation in adults in the United States. Annals of Internal Medicine, 1998, 129:940–945.
219. Asberg A et al. Screening for hemochromatosis: high prevalence and low morbidity in an unselected population of 65,238 persons. Scandinavian Journal of Gastroenter-ology, 2001, 36:1108–1115.
220. Skikne BS, Flowers CH, Cook JD. Serum transferrin receptor: a quantitative measure of tissue iron deficiency. Blood, 1990, 75:1870–1876.
221. Cook JD et al. Estimates of iron sufficiency in the US population. Blood, 1986, 68:726–731.
INDICATORS Of THE IRON STATuS Of POPuLATIONS: fERRITIN


75
ANNEx 3
Indicators of the iron status of populations: free erythrocyte protoporphyrin and zinc protoporphyrin; serum and plasma iron, total iron binding capacity and transferrin saturation; and serum transferrin receptorJOHn beARD


77
Contents1. Introduction 78
2. free erythrocyte protoporphyrin, erythrocyte protoporphyrin and zinc protoporphyrin 78
2.1 Pregnancy 79
2.2 Infancy 79
2.3 Childhood 80
2.4 Response to iron therapy and complications 81
2.5 Measurement, confounding factors, and units of measurement 82
3. Serum iron, total iron binding capacity and transferrin saturation 85
3.1 Serum iron 85
3.2 Transferrin, total iron binding capacity, transferrin saturation 87
4. Soluble transferrin receptor 88
5. References 91
INDICATORS Of THE IRON STATuS Of POPuLATIONS

ASSESSING THE IRON STATuS Of POPuLATIONS
78
1. IntroductionThe aim of this paper is to review and evaluate the state of knowledge regarding sev-
eral indicators of iron status that may be used to assess the iron status of popula-
tions in developing countries. The indicators are: free erythrocyte protoporphyrin
and zinc protoporphyrin; serum and plasma iron, total iron binding capacity and
transferrin saturation; and serum transferrin receptor. In particular the epidemio-
logical value of each variable will be considered and the technical limitations and
advantages of each parameter when used in a public health setting.
2. Free erythrocyte protoporphyrin, erythrocyte protoporphyrin and zinc protoporphyrin
The conceptual basis for the measurement of protoporphyrin is a lack of iron in the
bone marrow for incorporation into newly synthesized globin and the protein por-
phyrin as the haemoglobin molecule is reaching its final steps in synthesis. The last
step in haemoglobin synthesis is the insertion of iron by the enzyme ferrochetalase.
Instead of iron, trace amounts of zinc are incorporated into protoporphyrin instead.
The normal ratio of iron to zinc in protoporphyrin is about 30 000:1, but a lack of iron
available to ferrochetalase during the early stages of iron deficient erythropoiesis re-
sults in a measurable increase in the concentration of zinc protoporphyrin. When
there is enough iron the reactions are as follows:
Reaction I:
Protoporphyrin + Fe++ → ferrous protoporphyrin + globin → haemoglobin
When there is a lack of iron then zinc replaces iron in a very small but measurable
proportion of molecules:
Reaction II:
Protoporphyrin + Zn++ → zinc protoporphyrin + globin → ZPP-globin
Free erythrocyte protoporphyrin (FEP) is the compound left over after the zinc moi-
ety has been removed using strong acids during the extraction and chemical meas-
urement process. A variation of the chemical extraction method does not require this
step and can provide direct measurements of ZPP and a very small amount of FEP.
Typically FEP is less than 5% of the total. Thus FEP measurements, for all intents
and purposes, are nearly identical to the ZPP measurements when the chemical ex-
traction protocols are utilized. In turn, both FEP and ZPP should be interchangeable
with the term “erythrocyte protoporphyrin” (EP).
The concentration of EP is expressed either as µg/dl of whole blood or µg/dl of
red blood cells. The conversion of values relies on the accurate measurement of the
packed cell volume.
A rise in the concentration of zinc protoporphyrin is one of the first indicators of
insufficient iron in the bone marrow (1,2). The rate at which the concentration of EP
rises in blood samples is proportional to the relative deficit in iron and the amount of
erythropoiesis that is occurring. For example, reticulocytes typically contain more
EP than mature red cells, so forms of haemolytic and aplastic anaemia which lead to
reticulocytosis would be expected to have a higher concentration of EP than normal
because the rate of erythropoiesis exceeds the supply of iron to the marrow. In un-
complicated iron deficiency, the concentration of EP is reported to increase within

79
1–2 weeks of a lack of iron in the bone marrow (3,4). After iron therapy begins, more
than a month is required to re-establish a normal concentration of EP, and well after
the restoration of normal plasma iron kinetics.
An increased concentration of EP and, in particular, the ratio of EP to haemoglob-
in (Hb), is an excellent indicator of a lack of iron to meet the normal demands of the
bone marrow (1). The rates of reactions I and II above are such that a blood sample
from a healthy normal individual will have an EP concentration of less than 40–50
µg EP/dl of red cells. Coincident with a fall in transferrin saturation below 15%, the
concentration of EP increases rapidly to more than 70–100 µg/dl. With a prolonged or
severe deficit in iron, the EP concentration may reach as high as 200 µg/dl.
Several stages in the human life cycle have large requirements for iron which the
normal diet is unlikely to meet, including pregnancy and early infant development.
In both of these stages of life the EP content of red blood cells has been examined
with regard to its usefulness as a predictor of iron status.
2.1 Pregnancy
The large expansion in blood volume and red cell mass during the first half of preg-
nancy often depletes iron stores and leads to iron deficiency anaemia by the late-
second or third trimester. An accurate diagnosis of iron status during all stages of
pregnancy presents challenges (5) because both a dilution of blood volume and nu-
trient deficiencies can, and do, occur together. The recent paper by de Azevedo et
al. (6) specifically examined the value of the several indicators of iron status during
pregnancy. The authors demonstrated that folate and B12
deficiency were of moderate
prevalence, and that the anaemia of pregnancy was not solely due to iron deficiency.
The concentration of EP alone did not distinguish between women with iron defi-
ciency and those without, because many women had an increased concentration of
EP and those whose other measurements indicated iron deficiency, such as a raised
serum transferrin concentration, were not predicted by a high EP concentration.
Soluble transferrin receptor was the only indicator of iron status that appeared to be
responsive to variations in iron status in this situation. Further evidence for a lack of
sensitivity of EP to iron deficiency comes from a study that compared the concentra-
tions of EP in mothers and their infants soon after birth, and observed little or no
correlation (7).
2.2 Infancy
There has been a large emphasis on the use of EP in children because of its value in
identifying children with lead poisoning, and because of the focus of many studies
on this important period of growth and development. The ratio of EP/Hb is believed
to be an accurate indicator of iron status in older children and adults (1,2), but its val-
ue in neonates is unclear. Erythropoiesis is very rapid in very young children which
makes it difficult to determine a finite “normative” ratio or concentration. Several
investigators have addressed this issue from the perspective of nutritional diagnosis.
Infants less than 9 months of age with severe anaemia (Hb <50 g/l) had an EP/Hb
ratio of >15 µg EP/g Hb while infants with less severe anaemia of Hb <90–100 g/l had
an EP/Hb ratio of around 5–10 µg EP/g Hb (8). Thus, on initial examination, it appears
that the EP/Hb ratio in infants can be used to diagnose iron deficiency even at young
ages. More recently the EP/Hb ratio was evaluated in 143 infants in the first week of
INDICATORS Of THE IRON STATuS Of POPuLATIONS

ASSESSING THE IRON STATuS Of POPuLATIONS
80
life by giving iron supplements (9). The EP/Hb ratio was responsive to iron treatment
in some, but not all, infants with a high ratio. This lack of certainty regarding a finite
“ratio” that predicts iron deficiency forced the authors to conclude that EP in this age
group was not a very useful means to identify individuals likely to respond to iron
therapy (9). In a similar study of the utility of the ratio in slightly older infants who
were born prematurely, Griffin et al. (10) concluded there was a correlation between
EP and other measures of iron status after 6 months of life, but not before this age.
Perhaps the study most pertinent to defining a proper threshold concentration of EP
for children in their first year of life comes from the comparative studies of Domel-
lof et al. (11,12). They examined by age and sex the differences in parameters of iron
status measured in Swedish and Honduran breast-fed children less than 9 months
old in an effort to better establish normative values in this age group. Boys had a
lower mean cell volume (MCV) and concentrations of Hb and ferritin than girls, but
had a higher concentration of ZPP and serum transferrin receptor (sTfR). When using
their entire data set of 263 infants the authors estimated that the concentration of EP
that was two standard deviations above the mean which was >70 µmol/mol for in-
fants <6 months and >90 µmol/mol for infants >9 months old. In looking at children’s
response to treatment with iron the authors concluded that EP, Hb, and MCV were
better predictors of iron status than sTfR and ferritin for infants <6 month old (13). A
sensitivity analysis revealed that EP and MCV were more sensitive to iron status after
controlling for confounding variables (11).
2.3 Childhood
The concentration of EP in children can easily rise to >200 µmol/mol during untreat-
ed iron deficiency anaemia; the rise in children with leukaemia and aplastic anaemia
is not as large (>100 µmol/mol) and suggests that EP is sensitive to multiple causes of
anaemia, and not just to iron deficiency (13).
In a study of children seen for general medical reasons, the ferritin concentration
and EP/Hb ratio were equal in their ability to identify children who are iron deficient
but otherwise apparently healthy (14). The children ranged in age from 8 months to 18
years and the EP/Hb ratio did not vary significantly with age or sex until the age of 13
years. A separate large sample of over 6 000 well nourished children was recently ana-
lyzed to generate normative values for boys and girls between birth and 18 years (15).
The data in Table 1 show that the age dependent threshold concentration of EP of
>70 µg/dl red cells that is used to indicate iron deficiency in adults, the threshold of
TAbLe 1 The threshold concentrations of erythrocyte protoporphyrin by age groups at which iron deficient erythropoiesis occurs according to Centers for Disease Control and Prevention (CDC) recommendations and the 97.5th percentile of the distribution of values in healthy subjects
Age Recommended thresholda
(µg/dl red cells)97.5th percentileb
(µg/dl red cells)
0–12 months >80 40
1–2 years >80 32
2–9 years >70 30
10–17 years (girls) >70 34
a CDC recommendation as the demarcation between iron deficient erythropoiesis and iron sufficient erythropoiesis (16).b Adapted from Soldin et al. (15), with permission of the publisher.

81
> 80 µg/dl in 1–2 year old children, and the threshold of >75 µg/dl for 3–4 year olds,
are much higher than the upper 97.5th percentile of values for healthy children. The
practice of establishing thresholds based on the statistical distribution of a parame-
ter would, in this recent study, have yielded very different thresholds from the values
suggested by CDC for each age and sex group.
2.4 Response to iron therapy and complications
In simple and uncomplicated iron deficiency it is not uncommon to see the EP con-
centration drop within 4–8 weeks of intensive oral iron therapy: concentrations of
>200 µmol/mol usually return to <60 µmol/mol within 2 months (17). In a study to
estimate the sensitivity of iron status indicators, 62 patients who had provided bone
marrow aspirates were studied (18). Reticulocyte production in response to iron
therapy was correlated with iron stores in the bone marrow, but the concentration of
ferritin, EP, and the sTfR to ferritin ratio, all had a significant predictive value to dif-
ferentiate iron deficiency anaemia (IDA) from non IDA. Ferritin was the only signifi-
cant and independent predictor of IDA in a multivariate analysis using a threshold
concentration of 32 µg/l. The low diagnostic sensitivity and specificity of EP and the
EP/Hb ratio meant that they were inadequate as single indicators of IDA in a group
of anaemic patients and did not add to the predictive value of measuring the ferritin
concentration. In contrast, Hastka et al. concluded from a small study of patients
with chronic inflammatory diseases that EP can be used effectively to monitor the
severity of the attenuated delivery of iron to marrow (19). Iron therapy does not al-
ways result in a decline in the concentration of EP if there is inflammatory or renal
disease that blocks or attenuates the response of the bone marrow (20). The type,
severity, and duration of this inflammatory effect seems likely to contribute to the
lack of agreement regarding the usefulness of measuring the EP concentration in
clinically complex situations.
A few papers have recorded a high ratio of EP/Hb in people with thalassaemia, but
this is believed to be a result of the relative iron deficiency that occurs in this condi-
tion (21,22). In populations in which thalassaemia is a likely contributor to anaemia,
measuring the concentration of EP may lead to a systematic bias (23).
The concentration of EP does not provide a specific indication of iron deficiency
as it does not distinguish between the different reasons for a lack of iron in the bone
marrow. A field trial was recently conducted in Côte d’Ivoire to assess if iron status
was better predicted by the concentration of EP, sTfR, or ferritin in circumstances in
which iron deficiency occurs concurrently with inflammatory disorders and infec-
tion (24). The investigators noted that the prevalence of iron deficiency was substan-
tially higher if the concentration of EP was used to estimate the prevalence than if the
ferritin concentration was used as the only indicator of iron deficiency. The authors
adjusted the threshold for the concentration of ferritin upwards to 30 µg/l, to account
for the fact that ferritin is an acute phase protein (24), and estimated the prevalence
of iron deficiency using this criterion. The authors concluded that the sTfR concen-
tration was a better indicator of depleted iron stores and of early iron deficiency in
such a situation. It is not clear why the concentration of EP did not provide a similar
estimate of the prevalence of iron deficiency as both of these indicators should be
sensitive to the long term inflammation and infection caused by endemic malaria in
this population.
INDICATORS Of THE IRON STATuS Of POPuLATIONS
ASSESSING THE IRON STATuS Of POPuLATIONS
82
2.5 Measurement, confounding factors, and units of measurement
Two general approaches are used to measure the concentration of erythrocyte pro-
toporphyrin in blood samples. The older, chemical extraction method requires sig-
nificant laboratory expertise and a sophisticated fluorescence spectrophotometer
(25,26). The more popular and newer method requires only a dedicated hematofluo-
rimeter, which measures reflective emissions from EP in a drop of blood.
Neither the chemical extraction method, nor the hematofluorimetric assay, re-
quire a fasting blood sample. This means that blood does not have to be collected at
a particular time of day. A number of studies have demonstrated that both capillary
and venous blood provide similar estimates. There is also not a need for any par-
ticular anticoagulant to be used unless long term storage of samples is desired (see
below). However, both methods require that fresh blood samples should be used un-
less the blood is protected in some way from degradation by light of the fluorescent
compounds. Blood samples collected on filter paper have been used successfully for
several decades and provide a means to collect and transport samples collected in
remote rural areas.
Porphyrin compounds fluoresce when exposed to light with a wavelength of
400–430 nm and the intensity is proportionate to the amount in a sample. By care-
fully selecting the emission wavelength only certain porphyrins are measured. The
chemical method requires the extraction of the porphyrins in a solvent, protection of
the samples from light, high quality external standards, and an appropriate spectro-
photometer (25,26). Clearly, good laboratory practices are required to attain a coef-
ficient of variation (CV) when analysing multiple samples of <5% (14). Fluorescence
by haemoglobin can also be measured in the same way. These compounds are stable
for up to 10 days if samples are protected from UV light and stored at 4 °C. An alterna-
tive is to collect the blood on filter paper in the field, dry it, store it in a sealed plastic
bag, and then send the paper to a sophisticated laboratory where the concentration
of EP can be measured.
Blood samples can be stored for prolonged periods of time at 4 °C and can be fro-
zen for up to 3 months without a significant loss in EP content when acid-citrate-dex-
trose is used as an anticoagulant.
In contrast, a portable hematofluorimeter can be used to measure the amount of
ZPP by reflective fluorescence, a method that requires only a drop of blood placed on a
glass cover slip. The fluorescent material is ZPP while the absorbing compound at the
excitation wavelength is haemoglobin. The porphyrin actually measured by this in-
strument is ZPP and the machine’s manufacturer assumes that ZPP comprises 95% of
all the erythrocyte protoporphyrin in blood, which provides the basis for estimating
the concentration of EP. In some instruments the Hb concentration is also measured
automatically at the same time and the output is reported as the ratio of EP/Hb as ei-
ther µg EP/g Hb or as µmol EP/mol Hb (see below to convert from one unit to another).
While calibration has been a problem for the first instruments manufactured, recent
instruments appear to be more stable. Calibration is achieved by adjustments made
at the factory, and by the frequent use of external and internal standards. It is possible
to produce an internal standard from pooled samples of blood by washing it in sterile
saline and storing a 1:1 volume ratio in citrate-buffered glycerol at -20 °C. This washed
and cryo-protected blood can be used for up to 6 months as an internal control.
The field method of choice is clearly the hematofluorimeter as it requires only sev-
eral minutes to do and <20 µl of capillary blood. The machine needs only a power

83
supply and requires little expertise to use. However the instrument does need cali-
bration and makes two assumptions: that the mean corpuscular haemoglobin con-
centration (if expressed in µg/dl red cells) and the proportion of the total EP that
contains zinc do not vary from sample to sample.
Two issues may affect measurements made using the hematofluorimeter: first, the
need to oxygenate the blood sample; and second, the need to wash the red cells in
saline before measurement. When fresh blood is taken either from capillaries or a
vein, there appears to be little need to re-oxygenate the blood sample to get a repro-
ducible measurement. However, when there is a considerable period of time between
sampling and measurement (for example, greater that 30 minutes), there is better
reproducibility when the blood is shaken or stirred gently to increase the oxygen con-
tent (27). This is less an issue with the narrower bandwidth filters put into instru-
ments over the past 4–5 years than in the instruments produced in the 1980’s and
early 1990’s.
There are several reports that washing red blood cells with sterile saline greatly
lowers the number of falsely high results and improves the reproducibility and preci-
sion of the ZPP measurement, probably because it removes compounds from the se-
rum that fluoresce at the same wavelength as the porphyrins (17,27). In these papers,
there was a significant reduction in the concentration of ZPP in samples with high
values by simply washing and re-suspending red cells in saline. This fact might ac-
count for some of the large variations in reported EP concentrations between studies.
In clinical situations a high bilirubin concentration may contribute for this reason to
falsely high ZPP concentration, but this is not likely to be a normal confounding fac-
tor variable in field trials.
The ability to measure the concentration of EP in a fluorescent reflective spec-
trophotometer allows the direct expression of EP as a ratio of ZPP/Hb because the
haemoglobin concentration is also measured in the same machine in a separate pho-
tomultiplier tube and at a different wavelength. The actual concentration of eryth-
rocyte porphyrin, FEP, EP, or ZPP, has been expressed as an amount relative to either
whole blood, as µg/dl blood, or relative to the proportion of red blood cells as µg/dl
red cells. If the haematocrit is known it is simple to convert µg EP/dl whole blood to
µg/dl red cells as follows:
µg EP/dl red cells = µg EP/dl whole blood/Haematocrit
Or, if the ratio relative to the haemoglobin concentration is required:
µg EP/g Hb = µg EP/dl whole blood/g Hb/dl whole blood
To generally interconvert units (µg to µmol):
µg EP/dl red cells * 0.037 = µg EP/g Hb;
µg EP/dl red cells * 0.872 = µmol EP/mol Hb.
These latter two equations assume a normative value of the mean corpuscular hae-
moglobin concentration (MCHC); if it is possible actually to measure this, then there
is no need to make this assumption.
The National Committee on clinical laboratory standards recommends the ex-
pression of amount of EP in a blood samples as a ratio of EP/Hb (14) in units of µmol
EP/mol Hb.
CDC recommends the following thresholds to distinguish between iron deficient
erythropoiesis and iron sufficient erythropoiesis :
INDICATORS Of THE IRON STATuS Of POPuLATIONS

ASSESSING THE IRON STATuS Of POPuLATIONS
84
• >70 µg EP/dl red cells (>2.6 µg/g Hb, >61 µmol/mol Hb) for children under the age
of 5 years
• >80 µg EP/dl red cells (>3.0 µg/g Hb, >70 µmol/mol Hb) for individuals aged 5 years
and above.
A number of studies have examined the sensitivity and specificity of using different
thresholds of EP concentration as a means of screening for iron deficiency anaemia.
The best thresholds that optimize sensitivity and specificity are discussed by Mei et
al. (28). It is worth noting that one clinical study used a threshold of 55 µmol/mol to
define a high concentration of ZPP based on 2 standard deviations (SD) above a mean
concentration of 35 µmol/mol (7). In this case the threshold was successfully used to
screen potential blood donors and thus avoid the need to defer them.
The day-to-day variation in the concentration of EP is around 6.5% (29) and is con-
siderably more than reported by the same authors for concentrations of serum iron
and ferritin, at 3.0% and 3.7% respectively. There are some data on the coefficient of
variation using the older chemical extraction method, although very good reproduc-
ibility can be attained by laboratories accustomed to performing the assay (26).
The biological source of the day-to-day variations is not clear since one would ex-
pect it to be similar to the variation in haemoglobin concentration or in the mean cell
haemoglobin concentration, as these are formed elements within red cells and not
subject to large daily fluctuations in concentration. The CV for Hb is reported to be
<2% in some studies (30).
A document from the International Nutritional Anemia Consultative Group (IN-
ACG) on measurements of iron status notes that the concentration of EP measured
using a haematofluorimeter is systematically 10–20% lower than if measured using
the extraction method (25). Instruments that assume a fixed packed red cell volume
of 35% when expressing the concentration of ZPP per dl of red cells will tend to over-
estimate the concentration.
Lead interferes with the synthesis of haem by inhibiting porphobilinogen syn-
thase which results in an increased urinary excretion of ALA (aminolaevulinic acid).
There may also be a direct effect of lead on the activity of the enzyme ferrochetalase
which leads to an increase in the amount of metal-free protoporphyrin and results
in an increase in the need for iron to insert into the porphyrin ring structure. The
competition between zinc and iron at the level of the ferrochetalase is shifted toward
the production of zinc protoporphyrin in contrast to iron protoporphyrin (31,32). The
rise in EP or ZPP concentration that results from this shift reflects disruption in the
incorporation of iron into protoporphyrin due to lead, and is not due to a dietary iron
deficiency. The concentration of lead in the blood necessary to be a health risk is
>10 µg/dl, according to 1991 CDC guidelines, but is not reproducibly and specifically
related to an increase in concentration of ZPP (31). Nonetheless, Labbe et al. suggest
that ZPP can be an effective screening test for lead exposure in adults (1). There are 14
toxicology reports in just the last 3 years on the relationship between blood lead con-
centrations due either to acute or chronic exposure, and alterations in the concentra-
tion of ZPP, Hb, and other indices of haemoglobin production (see reference 2 for a
review). In general these are reports of very high concentrations of lead in blood and
are consistent with the 1999 report from Israel in which more than 14% of 105 workers
had blood lead concentrations of >60 µg/dl and which were correlated with the con-
centration of ZPP (33). However, a thorough statistical analysis was not done in many
of these reports so that it is not possible to identify the threshold for an effect.

85
Labbe and Dewanji recently reviewed and reiterated their view that ZPP is a cost-
effective screening test that can identify individuals with nutritional and non-nu-
tritional causes of iron deficient erythropoiesis (2). Since EP is not sensitive to acute
inflammation and it is not time consuming or expensive to measure the concentra-
tion, there is some strong appeal for its use in screening people. Table 2 shows Labbe
and Dewanji’s suggested thresholds and their interpretation.
INDICATORS Of THE IRON STATuS Of POPuLATIONS
TAbLe 2 The concentrations and ratios of indicators of iron status, their interpretation and recommendations
Measurements Interpretation Recommendation
Low ZPP/Hb ratio (<60 µmol/mol) Adequate systemic iron supply Iron stores can be estimated by the ferritin concentration; If ZPP/Hb ratio <40 µmol/mol, consider tests for iron overload (TSAT)
Mid-range ZPP/Hb ratio (60–80 µmol/mol)
Possible non-replete iron status; consider inadequate diet, ACD, or other causes
CBC may support case for iron depletion; ferritin can be used to differentiate low iron stores from inflammatory blockade; could then use concentration to verify inflammation
High ZPP/Hb ratio, (>80 µmol/mol) and low ferritin concentration (<20 µg/l)
Iron deficient erythropoiesis attributable to low marrow iron supply, maybe to depleted iron stores
Iron supplementation; monitor therapy with decrease in ratio and/or increase in reticulocyte count
High ZPP/Hb ratio (>80 µmol/mol) and high ferritin concentration ; (>200 µg/l)
Severe inflammatory blockade, ACD, other causes of impaired iron utilization
Correct the causes(s) of impaired iron utilization; consider chronic lead poisoning or ineffective supplementation
ZPP, zinc protoporphyrin; Hb, haemoglobin; CBC, complete blood count; ACD, anaemia of chronic disease; APP, acute phase protein; TSAT, transferrin saturation. Adapted from Labbe et al. (1), with permission of the publisher.
While the values given in Table 2 may not be a perfect approach for use in field stud-
ies in developing countries, it does offer a method to evaluate the value of EP meas-
urements to screen populations.
Mei and colleagues (28) recently published a careful analysis of the relative sensi-
tivity and specificity of the concentration of Hb and EP in children and adult women
to diagnose iron deficiency. A receiver operating characteristics (ROC) analysis of
iron status indicators demonstrated that the concentration of EP was quite a sensi-
tive diagnostic indicator for children, but not for adult women. The reasons for this
difference was not immediately obvious as the data set did not focus on very young
(<12 months) children for whom there are known problems regarding the interpreta-
tion of EP concentrations.
The approach suggested by Labbe et al. (1) needs to be applied to a number of large
data sets to assess the usefulness of the concentration EP or the EP/Hb ratio to diag-
nose iron deficiency and to decide whether a combination of these variables with fer-
ritin or sTfR concentration can be used in public health screening and surveillance
programs as well as in research studies.
3. Serum iron, total iron binding capacity and transferrin saturation
3.1 Serum iron
The plasma or serum pool of iron is that fraction of all iron in the body that circulates
bound primarily to transferrin. There are usually enough binding sites on transfer-
rin so that 100% saturation does not occur, and the typical range in saturation is 35–

ASSESSING THE IRON STATuS Of POPuLATIONS
86
45% of all binding sites. The iron in this pool turns over very quickly and represents
iron in transit from one location to another e.g. from absorptive cells to erythrocytes
developing in the bone marrow. The iron bound to low molecular weight proteins
such as dicarboxylic acids is not usually detected in most assays although there are
methods such as ultrafiltration, for example, that allow an estimate of the concentra-
tion of non-transferrin bound iron in the plasma pool. This usually comprises less
than 1% of the total plasma iron pool, but there are situations in which it can increase
substantially.
There are three ways of assessing the amount of iron in the plasma or serum: by
measuring the total iron content per unit volume in µg/dl; by measuring the total
number of binding sites for iron atoms on transferrin, called the total iron binding
capacity, in µg/dl; and by estimating the percentage of the two bindings sites on all
transferrin molecules that are occupied, called the percentage transferrin satura-
tion.
More than 80% of the iron in plasma is taken up by developing erythroblasts in the
bone marrow. This means that changes in the rate of red cell synthesis alters both the
rate of turnover of plasma iron and the concentration of iron in plasma. The clinical
conditions that are associated with a rapid release of iron into the plasma pool from
surrounding tissue and cells, such as reperfusion injury, repeated transfusions, and
prematurity, can exceed the iron binding capacity of transferrin. Measured in terms
of plasma turnover, iron exists in the plasma pool for a short period, typically 40–50
minutes. This means that the concentration of iron in plasma, or serum, changes
quickly with the very dynamic movement of iron from tissue (e.g. enterocytes, reticu-
loendothelial cells, hepatocytes, others) into the plasma pool as well as the movement
of iron out of the plasma pool into tissue (e.g. bone marrow, myocytes, blood brain
barrier, etc.). Most of the iron entering the plasma pool is derived from iron recycled
from catabolised red blood cells in the reticulo-endothelial system. The release of
iron from macrophages, such as during responses to cytokines in acute inflamma-
tion, will result in substantial changes in the plasma iron concentration.
Two significant biological factors that alter the plasma iron concentration are
infection and inflammation. The plasma iron concentration is very responsive to
cytokines released from immune cells throughout the inflammatory process. The
cytokines interleukin-6, interleukin-2, interleukin-10, and tumour necrosis fac-
tor α (TNF-α) are all potent stimuli for the movement of iron from the plasma pool
into storage sites in macrophages. The rate of “normalization” of this acute phase
response varies between individuals which adds uncertainty to the interpretation
of plasma iron in populations and individuals experiencing inflammatory process-
es. For example, the plasma iron concentration may return to normal within 24–48
hours of an acute infection but may remain low for prolonged periods of time during
chronic inflammatory states such as arthritis. This results in a decreased availability
of iron to cells leading to the anaemia of chronic disease (ACD), a condition often
seen in elderly people.
Finally, after a meal a significant rise in plasma iron concentration can be observed
due to the release of iron absorbed by enterocytes into the plasma pool. The meas-
urement of the plasma iron concentration during this period will be representative
of the absorption of iron.
The normal plasma iron concentration ranges between 50–120 µg/dl (25,34). The
thresholds used to classify individuals as iron deficient typically range from 50–

87
60 µg/dl, however natural variation in measurements may lead to misclassification
(34,35). There is substantial day-to-day variation within subjects of approximately
15%, as well as variation during the day of 10–20% (30,35). The variation between
subjects is at least as large and suggests that assessing iron status based on a single
measurement of plasma iron concentration has a high risk of misclassifying iron sta-
tus and may lead to an error in any estimate of prevalence.
The amount of iron in plasma can be readily measured by a number of meth-
ods that are quantitatively reliable, sensitive, reproducible, and require very small
amounts of sample (25,34). Determinations of plasma or serum iron are based on
either colorimetric principles or are made by direct measurement using an instru-
ment such as an atomic absorption spectrophotometer. These methods have been
well described elsewhere and have been fundamentally unchanged for more than
two decades (25,34). There are some needs that must be addressed in order to get
reliable results, regardless of the assay:
• Care must be taken to prevent contamination of samples during collection with
iron from needles and plastic-ware;
• Standardized blood sampling protocols must be used, since the time of day that
the samples are collected and post-prandial effects can be quite pronounced.
• Laboratory techniques must be used that minimize contamination with iron from
equipment and the environment;
• A high level of competency is required to ensure good laboratory practices and
reproducible results.
3.2 Transferrin, total iron binding capacity, transferrin saturation
The globular protein, transferrin, is the specific transport protein for iron in the
plasma pool, and each molecule binds with similar affinity two molecules of iron.
The protein circulates throughout the plasma pool and delivers iron to cells via the
transferrin receptor pathway (34). The concentration of transferrin increases dur-
ing iron deficiency and decreases with protein deficiency, so it is sensitive to several
factors. The concentration of this transport protein reflects iron status only when
iron stores are exhausted and when the plasma iron concentration is <40–60 µg/dl,
so it does not diagnose iron deficiency prior to ineffective erythropoiesis. A proxy
measure of transferrin is the measurement of the total iron binding capacity (TIBC)
which applies the assay for plasma iron with one additional step to measure the iron
saturation of transferrin.
Because the concentration of transferrin is often estimated by measuring the total
iron binding capacity, it is susceptible to the same problems as measuring the serum
iron concentration.
The assay is really a measure of the total number of transferrin binding sites per
unit volume of plasma or serum and is performed much like the serum iron assay.
The TIBC is not as subject to rapid changes in concentration as the plasma iron con-
centration, so it is inherently more stable as an indicator of iron status. The TIBC by
itself is not often used as a measure of iron status because it appears not to change
until iron stores are depleted (34).
Clinical studies have demonstrated that a transferrin saturation (TSAT) of <15% is
insufficient to meet normal daily requirements for erythropoiesis (34). A prolonged
period of time with a TSAT below 15% results in iron deficient erythropoiesis which
INDICATORS Of THE IRON STATuS Of POPuLATIONS
ASSESSING THE IRON STATuS Of POPuLATIONS
88
leads to changes in the number and shape of newly released reticulocytes and eryth-
rocytes (36).
The variation in concentration of iron in plasma and serum iron is substantial, as
described above, and this variation causes the daily variation in TSAT (5). The TIBC
itself shows a very little variation either within subjects or from day to day. Anything
that alters the plasma iron concentration will alter the TSAT, thus there is the same
lack of specificity for TSAT as there is for plasma iron concentration.
The concentration of transferrin in plasma or serum can be readily measured us-
ing a variety of immunological methods such as enzyme-linked immunosorbent as-
says (ELISA) or immunoblotting, both using commercially available monoclonal or
polyclonal antibodies. The assays themselves are usually “sandwich” ELISA meth-
ods, similar to the assay used to estimate the concentration of ferritin, or they use
a single antibody to transferrin. These assays use antibodies to specific epitopes on
the circulating glycoprotein and allow the precise measurements of concentrations
of transferrin in plasma and serum (34). In contrast to colorimetric methods and to
atomic absorption spectrophotometry, there is less need to prevent contamination
with iron when using an immunological assay. The limitations of such assays may
be significant. First, the antibodies used in different assays may vary in their affinity
for transferrin epitopes and may bind to different absolute amounts of transferrin
during assays. Second, there is no internationally used external standard, so com-
parisons between different assays are difficult to make. Finally, most laboratories
fail to perform reliability tests between ELISA plates. This is a very important source
of variability and can be an important source of error in the determining the concen-
tration of transferrin.
The range in the coefficient of variation of TIBC within an individual from day-
to-day is about 8–12% while the diurnal variation is less than 5% (29,30,35). Assay
variation is rarely reported though it is quite low in laboratories which use well es-
tablished methods (25,29,30).
4. Soluble transferrin receptorThe measurement of soluble transferrin receptor (sTfR) has become popular in the
past 10 years because it is sensitive to the inadequate delivery of iron to bone marrow
and tissue (37). During cellular iron deficiency the concentration of sTfR increases in
plasma or serum and is not strongly affected by concurrent infection. The sTfR con-
centration can be measured in a quantitatively reproducible manner, it is reasonably
stable in concentration within an individual, and can be interpreted as an indicator
of the severity of abnormal erythropoiesis.
The sTfR fragment is cleaved from the membrane bound transferrin receptor
found on nearly all cells. The predominant donors of these fragments to the plasma
or serum pool are the cells of the developing red cell mass – the erythroblasts and
reticulocytes. The concentration of sTfR reflects erythropoietic activity. The con-
centration decreases in situations and individuals with marrow hypoplasia, such
as after chemotherapy for cancer, while the concentration increases in individuals
with stimulated erythropoiesis, such as haemolytic anaemia and sickle cell anaemia.
Since sTfR is sensitive to erythropoiesis due to any cause, it cannot be interpreted
strictly as an indicator of iron deficiency erythropoiesis. This means that sTfR is an
indicator of iron status only when iron stores are empty and there are no other known
causes of abnormal erythropoiesis (37–39).

89
Most of the assays for sTfR that have been developed to date are based on immu-
nological methods to identify the amount of cleaved protein fragment in circulation
in the plasma pool. The development of an ELISA more than 10 years ago (37,40,41)
and the quantification of the relationship between iron deficiency anaemia and the
sTfR concentration led to the commercial production of several assay kits. As men-
tioned before, such assays are not easy to do well. The commercial kits require an
ELISA plate reader with a narrow bandwidth detection beam, and a familiarity with
antibody based assays is essential. A stable internal standard is absolutely neces-
sary as there is no external standard currently in existence. This means that assays
are difficult to compare. The diurnal variation in concentration of sTfR is poorly de-
scribed but is believed to be <5%. However, this is not well established with regard to
the time of day as morning to evening variation has not been differentiated from the
day to night variation. The variation within and between assays is fairly small when
good techniques are employed. For example, Cooper and Zlotkin reported a meth-
odological variation of 5–6% during a study of a large cohort of people in Canada
(42). In the same study the day to day variation in ferritin was between 12–24%, and
there was nearly twice as much variation in females compared with males. Similar
degrees of variation are reported by manufacturers of commercial assay kits. Run-
to-run variation in assay performance needs to be monitored to prevent drift in the
assay than cannot easily be detected without an external standard. Differences be-
tween different lots of antibodies should also be assessed, especially if the antibody
is not commercially produced.
Finally, because the concentration of sTfR is not normally distributed, values may
need to be transformed to logarithms before analysis (43,44).
The absence of an international standard to allow different assays to be compared
has made it difficult to define accurately a specific range of normal values. Beguin
recently published normal values of 5 ± 1 mg/l (39). A popular commercial kit in the
United States uses a somewhat higher threshold of 6–7 mg/l. It is impossible to assign
a single threshold value that would be accurate for all commercial kits and clinical
instruments. During severe beta thalassaemia the concentration of sTfR is typically
>100 mg/l while during severe iron deficiency anaemia it is >20–30 mg/l.
A number of factors may affect the concentration of sTfR in plasma or sera: acute
or chronic inflammation and the anaemia of chronic disease, malaria, malnutrition,
age and pregnancy.
There is conflicting evidence regarding the impact of inflammation and cytokines
on the sTfR concentration. Feelders et al. (45) showed that administering TNF-α to
cancer patients caused a prompt decrease in the concentration of sTfR that persisted
for a period that was distinct from the time course response for other acute phase
proteins such as ferritin, C-reactive protein and acid glycoprotein. During chron-
ic inflammation, such as during the ACD, Beguin states that it is possible to have
a normal TfR despite an increase in ZPP concentration in some patients with ACD
(38). This suggests a depletion in bone marrow iron content without a measurable
increase in the concentration of sTfR (38). Others have demonstrated that if iron de-
ficiency anaemia and ACD coexist, then the sTfR concentration can increase (46),
but this has not been reported in all studies (47). The sTfR/log ferritin index has been
found to be useful to separate individuals with IDA and ACD (47). Yet the gold stand-
ard to asses iron status is a bone marrow biopsy for iron and, when this was used by
Junca et al. (48), they failed to find that the sTfR concentration predicted a decrease
INDICATORS Of THE IRON STATuS Of POPuLATIONS
ASSESSING THE IRON STATuS Of POPuLATIONS
90
in the amount of iron in bone marrow in patients with ACD. Follow up studies of
129 anaemic hospital patients again used bone marrow aspirates to identify an iron
deficiency and observed an increase in sTfR concentration in IDA, but not in ACD
(49). The sTfR log ferritin index was again able to separate subjects with IDA from
those with ACD among people with both conditions. In a smaller study, Pettersson
et al. (50) showed that the concentration of sTfR was decreased during ACD, and was
increased during IDA and in subjects with a combination of IDA and ACD.
Malaria is associated with sudden changes in measures of iron status because of
the cyclical effect of disease on red cell metabolism. Two potential effects on the con-
centration of sTfR may be expected: (37) the increased concentration of cytokines at-
tenuates the concentration of erythropoietin leading to a reduction in erythropoiesis
and an associated decrease in sTfR concentration; (38) active haemolysis of red blood
cells leads to anaemia with an associated increase in the concentrations of erythro-
poietin and sTfR. Both effects may occur in populations where malaria is endemic.
Verhoef et al. (43) recently showed that the concentration of sTfR was increased
in infants with both IDA and malaria in Africa. There was however, a significantly
greater increase in sTfR concentration in anaemic children with malaria than in
anaemic children without malaria. As expected in children with malaria, there was a
very substantial variation in the sTfR concentration which reflected the cyclical na-
ture of the disease. Other studies of a similar size and scope showed a similar effect
of malaria on the sTfR concentration (44,51) although it was not always possible to
conclude that the sTfR concentration was increased independently of iron deficiency
anaemia. These data suggest that it is difficult to determine the iron status of people
with malaria using sTfR.
A study reported by Kuvibidila et al. (52) found no effect of moderate protein en-
ergy malnutrition on the sTfR concentration of African women with a wide range in
haemoglobin concentration.
Because the concentration of sTfR changes during erythropoiesis, infants should
have a higher sTfR concentration than adults (53). Yeung and Zlotkin (54) noted that
the concentration of sTfR did not vary by age or sex in infants aged 6–15 month old
and that all the infants had a higher sTfR concentration than is usually observed in
adults. But the lack of normative data for young children prevents a clear cut diag-
nostic use of sTfR concentration for detecting iron deficiency in this age group.
The relationship between an increased sTfR concentration and depleted iron
stores, a low transferrin saturation, a low plasma iron concentration, and the anae-
mia that is characteristic of iron deficient erythropoiesis in adults, is hard to confirm
in young children. For example, two studies have found an expected inverse corre-
lation between the concentration of sTfR and Hb, iron, and TIBC in infants (55,56),
while a third study found no relationship between sTfR and measurements of iron
status in newborns (57).
The complicated situation in children with beta thalassaemia has been examined
(56). A high concentration of sTfR was noted in the newborn children of mothers that
were iron deficient, but could not use sTfR to distinguish between children with beta
thalassaemia and those who were iron deficient. In contrast to patients with ACD
mentioned earlier, the sTfR/ferritin ratio, or the log ferritin index could not distin-
guish between these two conditions either.
Pregnancy is another physiological situation characterized by very active erythro-
poiesis. Akinsooto et al. (58) used the concentrations of ferritin and sTfR in pregnant
women in an attempt to find out which had the better sensitivity and specificity to

91
detect iron deficiency as diagnosed by other indicators. The sTfR concentration and
the sTfR/ferritin index were 75% and 86% sensitive, and 63% and 82% specific, respec-
tively. The positive predictive values were 64% and 84%, and the negative predictive
values were 75% and 87% for iron deficiency. Studies by Akesson et al. (4) and Car-
riaga et al. (59) found the sTfR concentration to be useful to diagnose iron deficiency
during pregnancy, and achieved nearly 100% specificity, yet other studies have not
found this to be the case. In one of the few studies to use bone marrow aspirates, Van
den Broek et al. (60) concluded that the sTfR concentration was not as good a predic-
tor of iron status as ferritin concentration in pregnant Malawian women.
The studies of Cook et al. (37) provided direct evidence that the sTfR concentra-
tion rises within several weeks of repeated phlebotomy, once iron stores have been
depleted. Furthermore, the sTfR concentration was not a useful indicator until the
ferritin concentration was <20 µg/l. These data indicate the capacity of sTfR meas-
urements to detect a rapid fall in iron stores. Others have asked the opposite ques-
tion: how long does it take to detect a significant reduction in sTfR concentration
when iron therapy is given? Souminen et al. (46) gave oral iron supplements to 65
individuals who were frequent blood donors and examined changes in sTfR concen-
tration. There was a significant decrease in sTfR concentration within 3 months of
supplementation. It is likely that studies that look for changes in sTfR concentration
over shorter periods will demonstrate that 6–8 weeks is sufficient to detect a signifi-
cant biological change of >0.5 SD units.
5. references 1. Labbe RF, Vreman HJ, Stevenson DK. Zinc protoporphyrin: A metabolite with a mis-
sion. Clinical Chemistry, 1999, 45:2060–2072. 2. Labbe RF, Dewanji A. Iron assessment tests: transferrin receptor vis-a-vis zinc pro-
toporphyrin. Clinical Biochemistry, 2004, 37:165–174. 3. Langer EE et al. Erythrocyte protoporphyrin. Blood, 1972, 40:112–128. 4. Akesson A et al. Serum transferrin receptor: a specific marker of iron deficiency in
pregnancy. American Journal of Clinical Nutrition, 1998, 68:1241–1246. 5. Institute of Medicine. Micronutrient Requirements Report on water soluble vitamins
and minerals. National Academy of Science Press, 2002. 6. de Azevedo PA et al. The influence of iron, vitamin B(12), and folate levels on soluble
transferrin receptor concentration in pregnant women. Clinica Chimica Acta, 2003, 334:197–203.
7. Harthoorn-Lasthuizen EJ, Lindemans J, Langenhuijsen MM. Does iron-deficient erythropoiesis in pregnancy influence fetal iron supply? Acta Obstetricia et Gyneco-logica Scandinavica, 2001, 80:392–396.
8. Thomas WJ et al. Free erythrocyte porphyrin: hemoglobin ratios, serum ferritin, and transferrin saturation levels during treatment of infants with iron-deficiency anemia. Blood, 1977, 49:455–462.
9. Juul SE et al. Zinc protoporphyrin/heme as an indicator of iron status in NICU pa-tients. Journal of Pediatrics, 2003, 142:273–278.
10. Griffin IJ et al. Zinc protoporphyrin/haem ratio and plasma ferritin in preterm infants. Archives of Disease in Childhood Fetal and Neonatal Edition, 2002, 87:F49–F51.
11. Domellof M et al. Iron supplementation of breast-fed Honduran and Swedish infants from 4 to 9 months of age. Journal of Pediatrics, 2001, 138:679–687.
12. Domellof M et al. The diagnostic criteria for iron deficiency in infants should be reevaluated. Journal of Nutrition, 2002, 132:3680–3686.
13. Kitajima H, Kaneko T, Akatsuka J. [The measurement of erythrocyte zinc protopor-phyrin/heme ratio in various anemias in childhood]. Rinsho Ketsueki, 1992, 33:1199–1203.
INDICATORS Of THE IRON STATuS Of POPuLATIONS

ASSESSING THE IRON STATuS Of POPuLATIONS
92
14. Rettmer RL et al. Zinc protoporphyrin/heme ratio for diagnosis of preanemic iron deficiency. Pediatrics, 1999, 104:e37.
15. Soldin OP, Miller M, Soldin SJ. Pediatric reference ranges for zinc protoporphyrin. Clinical Biochemistry, 2003, 36:21–25.
16. Recommendations to prevent and control iron deficiency in the United States. Centers for Disease Control and Prevention. MMWR Recomm Rep, 1998, 47:1–29.
17. Hastka J et al. Washing erythrocytes to remove interferents in measurements of zinc protoporphyrin by front-face hematofluorometry. Clinical Chemistry, 1992, 38:2184–2189.
18. van Tellingen A et al. Iron deficiency anaemia in hospitalised patients: value of vari-ous laboratory parameters. Differentiation between IDA and ACD. Netherlands Jour-nal of Medicine, 2001, 59:270–279.
19. Hastka J et al. Zinc protoporphyrin in anemia of chronic disorders. Blood, 1993, 81:1200–1204.
20. Braun J. Erythrocyte zinc protoporphyrin. Kidney International Supplement, 1999, 69:S57–S60.
21. Pootrakul P et al. Increased red blood cell protoporphyrin in thalassemia: a result of relative iron deficiency. American Journal of Clinical Pathology, 1984, 82:289–293.
22. Harthoorn-Lasthuizen EJ, Lindemans J, Langenhuijsen MM. Combined use of eryth-rocyte zinc protoporphyrin and mean corpuscular volume in differentiation of thalassemia from iron deficiency anemia. European Journal of Haematology, 1998, 60:245–251.
23. Graham EA et al. Elevated zinc protoporphyrin associated with thalassemia trait and hemoglobin E. Journal of Pediatrics, 1996, 129:105–110.
24. Asobayire FS et al. Prevalence of iron deficiency with and without concurrent anemia in population groups with high prevalences of malaria and other infections: a study in Cote d’Ivoire. American Journal of Clinical Nutrition, 2001, 74:776–782.
25. International Nutritional Anemia Consultative Group. Measurements of Iron Status. ILSI Press, 1985.
26. Piomelli S. The diagnostic utility of measurements of erythrocyte porphyrins. Hema-tology/Oncology Clinics of North America, 1987, 1:419–430.
27. Labbe RF et al. Zinc protoporphyrin. Past, present, and future. Annals of the New York Academy of Sciences, 1987, 514:7–14.
28. Mei Z et al. Erythrocyte protoporphyrin or hemoglobin: which is a better screening test for iron deficiency in children and women? American Journal of Clinical Nutrition, 2003, 77:1229–1233.
29. Romslo I, Talstad I. Day-to-day variations in serum iron, serum iron binding capacity, serum ferritin and erythrocyte protoporphyrin concentrations in anaemic subjects. European Journal of Haematology, 1988, 40:79–82.
30. Borel MJ et al. Day-to-day variation in iron-status indices in healthy men and women. American Journal of Clinical Nutrition, 1991, 54:729–735.
31. Lamola AA, Yamane T. Zinc protoporphyrin in the erythrocytes of patients with lead intoxication and iron deficiency anemia. Science, 1974, 186:936–938.
32. Soldin OP et al. Changing trends in the epidemiology of pediatric lead exposure: inter-relationship of blood lead and ZPP concentrations and a comparison to the US popu-lation. Therapeutic Drug Monitoring, 2003, 25:415–420.
33. Froom P et al. Lead exposure in battery-factory workers is not associated with anemia. Journal of Occupational and Environmental Medicine, 1999, 41:120–123.
34. Bothwell TH et al. Iron metabolism in man. Oxford, Blackwell Scientific Publications, 1979.
35. Lammi-Keefe CJ et al. Day-to-day variation in iron status indexes is similar for most measures in elderly women with and without rheumatoid arthritis. Journal of the American Dietetic Association, 1996, 96:247–251.
36. Huebers HA et al. Plasma iron and transferrin iron-binding capacity evaluated by colorimetric and immunoprecipitation methods. Clinical Chemistry, 1987, 33:273–277.

93
INDICATORS Of THE IRON STATuS Of POPuLATIONS
37. Cook JD, Dassenko S, Skikne BS. Serum transferrin receptor as an index of iron absorption. British Journal of Haematology, 1990, 75:603–609.
38. Kohgo Y, Torimoto Y, Kato J. Transferrin receptor in tissue and serum: updated clini-cal significance of soluble receptor. International Journal of Hematology, 2002, 76:213–218.
39. Beguin Y. Soluble transferrin receptor for the evaluation of erythropoiesis and iron status. Clinica Chimica Acta, 2003, 329:9–22.
40. Cook JD, Flowers CH, Skikne BS. The quantitative assessment of body iron. Blood, 2003, 101:3359–3364.
41. Fillet G, Beguin Y. Monitoring of erythropoiesis by the serum transferrin receptor and erythropoietin. Acta Clinica Belgica, 2001, 56:146–154.
42. Cooper MJ, Zlotkin SH. Day-to-day variation of transferrin receptor and ferritin in healthy men and women. American Journal of Clinical Nutrition, 1996, 64:738–742.
43. Verhoef H et al. Serum transferrin receptor concentration indicates increased eryth-ropoiesis in Kenyan children with asymptomatic malaria. American Journal of Clini-cal Nutrition, 2001, 74:767–775.
44. Stoltzfus RJ et al. Effects of iron supplementation and anthelmintic treatment on motor and language development of preschool children in Zanzibar: double blind, placebo controlled study. BMJ, 2001, 323:1389–1393.
45. Feelders RA et al. Regulation of iron metabolism in the acute-phase response: interfer-on gamma and tumour necrosis factor alpha induce hypoferraemia, ferritin produc-tion and a decrease in circulating transferrin receptors in cancer patients. European Journal of Clinical Investigation, 1998, 28:520–527.
46. Suominen P et al. Single values of serum transferrin receptor and transferrin receptor ferritin index can be used to detect true and functional iron deficiency in rheumatoid arthritis patients with anemia. Arthritis and Rheumatism, 2000, 43:1016–1020.
47. Malope BI et al. The ratio of serum transferrin receptor and serum ferritin in the diagnosis of iron status. British Journal of Haematology, 2001, 115:84–89.
48. Junca J et al. The usefulness of the serum transferrin receptor in detecting iron deficiency in the anemia of chronic disorders. Haematologica, 1998, 83:676–680.
49. Punnonen K, Irjala K, Rajamaki A. Serum transferrin receptor and its ratio to serum ferritin in the diagnosis of iron deficiency. Blood, 1997, 89:1052–1057.
50. Pettersson T, Kivivuori SM, Siimes MA. Is serum transferrin receptor useful for detect-ing iron-deficiency in anaemic patients with chronic inflammatory diseases? British Journal of Rheumatology, 1994, 33:740–744.
51. Mockenhaupt FP et al. Serum transferrin receptor levels are increased in asympto-matic and mild Plasmodium falciparum-infection. Haematologica, 1999, 84:869–873.
52. Kuvibidila S et al. Serum transferrin receptor concentrations in women with mild malnutrition. American Journal of Clinical Nutrition, 1996, 63:596–601.
53. Virtanen MA et al. Higher concentrations of serum transferrin receptor in children than in adults. American Journal of Clinical Nutrition, 1999, 69:256–260.
54. Yeung GS, Zlotkin SH. Percentile estimates for transferrin receptor in normal infants 9–15 mo of age. American Journal of Clinical Nutrition, 1997, 66:342–346.
55. Rusia U et al. Serum transferrin receptors in detection of iron deficiency in pregnancy. Annals of Hematology, 1999, 78:358–363.
56. Choi JW, Pai SH. Change in erythropoiesis with gestational age during pregnancy. Annals of Hematology, 2001, 80:26–31.
57. Kuiper-Kramer EP et al. Evaluation of the iron status of the newborn by soluble trans-ferrin receptors in serum. Clinical Chemistry and Laboratory Medicine, 1998, 36:17–21.
58. Akinsooto PJO. Soluble transferrin receptors in anaemia of pregnancy. Journal of Obstetrics and Gynaecology, 2001, 21:250–252.
59. Carriaga MT et al. Serum transferrin receptor for the detection of iron deficiency in pregnancy. American Journal of Clinical Nutrition, 1991, 54:1077–1081.
60. van den Broek NR et al. Iron status in pregnant women: which measurements are valid? British Journal of Haematology, 1998, 103:817–824.


95
ANNEx 4
the interpretation of indicators of iron status during an acute phase response CHRISTIne A. nORTHROP-CLeWeS


97
THE INTERPRETATION Of INDICATORS Of IRON STATuS DuRING AN ACuTE PHASE RESPONSE
Contents1. Abstract 98
2. Introduction 98
3. The acute phase response 98
4. Sequence of events 99
5. Changes in acute phase indicators during treatments for various diseases. 100
6. Acute phase proteins, iron indicators and the influence of cytokines 101
7. Control of iron metabolism 101
8. ferritin 102
9. Serum transferrin receptor 103
10. Asymptomatic malaria, acute phase proteins and iron 104
11. Human immunodeficiency virus, acute phase proteins and iron. 105
12. Summary 106
13. References 106

ASSESSING THE IRON STATuS Of POPuLATIONS
98
1. abstractIron status is influenced by infection or trauma. The objective of this paper is to
describe how indices of iron status, particularly the concentration of ferritin and
soluble transferrin receptor (TfR), are influenced by changes in the concentration
of acute phase proteins (APPs) during infection or trauma. Measurements of the
change in concentration of APPs after elective surgery that are not preceded by in-
fection are used to show the difference in responses of these proteins. Changes in
the concentration of APPs and markers of iron status during treatment for infection
are also used to demonstrate the interrelationship between indicators. In developing
countries asymptomatic malaria is common and produces an acute phase response,
but the data on the concentration of APPs and indices of iron status in asymptomatic
malaria are inconclusive with respect to using either serum TfR or ferritin as a mark-
er of iron status in such situations. In individuals infected with human immunode-
ficiency virus (HIV) there may be an atypical acute phase response in the absence
of opportunistic infections. Some tentative conclusions are drawn concerning the
interrelationships between ferritin and two APPs, C-reactive protein (CRP) and α-1-
acid glycoprotein (AGP), during an acute phase response.
2. IntroductionFerritin concentration is an important indicator of total body iron stores and a con-
centration of <12–15 µg/l is taken to indicate deficient iron stores (1). However, the
synthesis of ferritin is stimulated by infection, which may either obscure an iron de-
ficiency or indicate a larger iron store than truly exists. In this paper, the nature of the
acute phase response and its relationship to iron metabolism is illustrated.
Iron deficiency is the most common micronutrient deficiency in the world. It can
affect all populations and age groups, but the most vulnerable groups are women
and children. Anaemia is commonly used as an indicator of iron deficiency in pop-
ulation-based surveys, but iron deficiency is not the only cause of anaemia: infec-
tions, haemoglobinopathies, and vitamin A deficiency can all lead to anaemia. A
high prevalence of anaemia is often found in developing countries, especially where
infections such as malaria or hookworm are common. In addition infection with HIV
is affecting millions of people in the developing world and may influence their iron
status, but little is known about the acute phase response during HIV infection in the
absence of opportunistic infection.
3. the acute phase responseInfection and trauma are accompanied by an acute phase response, a non-specific
process that includes the production of APPs prior to the full activation of the im-
mune response. The main purpose of the acute phase response is to prevent damage
to tissues, and remove harmful molecules and pathogens. During such a response
the concentration of some APPs, called positive APPs, increase in the plasma and
others, called negative APPs, decrease. The changes in the concentrations of APPs
are due largely to changes in their production by hepatocytes, which in turn are
regulated by cytokines such as interleukin-1 (IL-1), interleukin-6 (IL-6) and tumour
necrosis factor α (TNF-α), which act in a complex network (2).
The role of the positive APPs includes host-adaptive and host-defense mecha-

99
nisms, which act by binding to foreign substances and by modulating phagocytic
cell functions. The positive APPs include CRP, α-1-antichymotrypsin (ACT), AGP, also
known as orosomucoid, serum amyloid A (SAA), fibrinogen, haptoglobin, caerulo-
plasmin and ferritin. An increase in serum ferritin concentration occurs in response
to any infectious or inflammatory process, but serum ferritin concentration also re-
flects total body iron stores, hence a low serum ferritin concentration can only re-
flect depleted iron stores in the absence of infection. The magnitude of the change
in concentration of the APPs during an acute phase response varies considerably:
caeruloplasmin can increase by about 50% whereas CRP can increase by as much as
1000-fold (3,4). The APPs that decrease in concentration include transferrin, albu-
min, transthyretin and retinol binding protein (RBP). These proteins are not thought
to have an immune function, but rather to act as transport proteins and as a result,
the plasma concentration of the specific nutrients they carry may be reduced during
infection and inflammation (4).
4. Sequence of eventsThe concentration of APPs after elective surgery that is not preceded by infection
can be used to demonstrate the time course over which their production is stimu-
lated. The first change during the acute phase response is in cortisol concentration,
which peaks at 6 hours after surgery, followed by a rise in the number of white blood
cells, which peak at 10 hours. Data obtained after cholecystectomy indicate that CRP
and ACT rise rapidly in the first 6 hours and continue to rise for the first 20 hours
after surgery, whereas AGP shows only a small increase during the same time period
(Figure 1). Albumin and pre-albumin both decrease in concentration. Haptoglobulin
initially decreases but returns to its initial concentration by 20 hours before showing
a steady increase in concentration over the next few days (4).
Data collected over 6 days following elective surgery showed that CRP rises very
rapidly from normal concentrations of <5 mg/l to concentrations of >100 mg/l, peak-
ing at day 2, and then slowly decline. Fibrinogen and AGP show a slower initial rise
but do not return to a normal concentration until up to a week after CRP had re-
turned to normal (4). Data from Fleck and Myers (4), however, showed that the rise in
concentration of AGP and fibrinogen was preceded by a slight fall in concentration
immediately after the operation. An initial decrease in AGP was also observed by
Myers et al. (5) 2–4 hours after making a skin incision for a hysterectomy, and this
preceded an increase in AGP at 6 hours. The initial decrease in AGP concentration
is thought to be due to changes in microvascular permeability immediately follow-
ing trauma which may facilitate the movement of proteins between the plasma and
damaged tissues (3).
Data on the concentration of CRP, SAA, haptoglobulin, fibrinogen, and albumin
collected over a period of 21 days after surgery confirmed and extended the informa-
tion from the first study (4). Both CRP and SAA increased rapidly and reached a peak
concentration between 48–72 hours after surgery. With no post-operative complica-
tions, the concentration of CRP returned to normal by the 10th post-operative day,
whereas SAA did not return to normal values until about 12–14 days after the opera-
tion. In contrast, haptoglobulin and fibrinogen initially decreased in concentration,
then slowly increased, and only achieved maximum concentrations at 10 and 12 days,
respectively; fibrinogen returned to normal, but the concentration of haptoglobulin
was still higher than normal at day 21 (3).
THE INTERPRETATION Of INDICATORS Of IRON STATuS DuRING AN ACuTE PHASE RESPONSE

ASSESSING THE IRON STATuS Of POPuLATIONS
100
5. Changes in acute phase indicators during treatments for various diseases
Baynes et al. (7) reported a number of small studies in which they followed the chang-
es in concentration of various acute phase indices in patients with different illnesses,
and showed sequential changes during treatment.
The increase in plasma ferritin concentration paralleled the increase in plasma
CRP during acute pneumonia, tuberculosis, rheumatoid arthritis and neutropenic
sepsis, suggesting that ferritin was acting as an APP. However, the degree to which
the ferritin concentration rose was influenced by the underlying iron status of the
subjects. The plasma ferritin concentration was found to be much lower in individu-
als with rheumatoid arthritis, who were iron deficient as well as being chronically ill,
whereas the concentration of CRP always seemed to be increased in proportion to
the severity of disease.
In neutropenic sepsis, both CRP and ferritin were markedly increased in concen-
tration. During treatment there was a sharp drop in CRP concentration that was not
paralleled by a drop in plasma ferritin concentration. The different responses may
reflect different turnover rates, with CRP concentration responding rapidly to the
removal of the trauma (i.e. the chemotherapy), whereas the ferritin concentration
declined more slowly, perhaps because erythropoiesis was still depressed by the pro-
duction of cytokines (7).
FIGURe 1 Characteristic patterns of change in acute phase proteins (APPs) after trauma. APPs are shown as percent change from the initial concentration.
Adapted from feelders et al. (2), Gabay and Kushner (3), fleck and Myers (4), Wieringa et al. (6), with permission of the publishers.
-50
0
50
100
150
200
-6 0 6 12 18 24 48 96 144
Time (hours)
?-1-acid glycoprotein C-reactive protein ?-1-antichymotrypsin
Albumin Pre-albumin Haptoglobulin
Fibrinogen Ferritin
Ch
ang
e in
acu
te p
has
e p
rote
ins
(%)
-50
0
50
100
150
200
-6 0 6 12 18 24 48 96 144
Time (hours)
α-1-acid glycoprotein C-reactive protein α-1-antichymotrypsin
Albumin Pre-albumin Haptoglobulin
Fibrinogen Ferritin
Ch
ang
e in
acu
te p
has
e p
rote
ins
(%)

101
6. acute phase proteins, iron indicators and the influence of cytokines
A low serum iron concentration and a high serum ferritin concentration during an
acute phase response are associated with a redistribution of iron into the liver and
mononuclear phagocyte system, both mediated by cytokines (2). In experimental
animals the administration of the cytokines TNF-α, IL-1 and IL-6 induced a de-
crease in serum iron concentration within 3–6 hours and in similar studies in vitro,
cytokines induced an increase in ferritin synthesis (2). Feelders et al. (2) carried out
an experiment in humans and reported similar results to those found in vitro and in
experimental animals, i.e. the administration of cytokines resulted in hypoferrae-
mia associated with an increased ferritin production.
In the study by Feelders et al. (2) 12 patients with inoperable soft-tissue sarcoma
or melanoma were treated for 2 days with the T-cell-derived cytokine human inter-
feron γ (IFN γ), which is thought to prime activated macrophages. Serum samples
were taken on two days before treatment and at baseline. All patients were then can-
nulated, an isolated limb perfusion was performed using recombinant human TNF-α
and human IFN γ, and further blood samples were taken for 7 days after treatment.
Although an acute phase response occurs in many types of cancer (8,9) and would
be expected to produce associated changes in iron metabolism, Feelders et al. (2)
showed that APPs (except the concentration of AGP, which was slightly higher than
normal) and iron status were normal before treatment, suggesting that the local tu-
mours were not producing a systemic reaction.
Following treatment with recombinant TNF-α and IFN γ, all APPs except CRP
and ferritin decreased in concentration, probably due to haemodilution and cap-
illary leakage. Both CRP and ferritin increased in concentration after the start of
perfusion, representing an early acute phase response, while AGP responded more
slowly in a second response. The concentration of CRP showed a sharp decrease after
peaking at day 2; ferritin decreased slowly in concentration but was still higher than
normal at day 7, as was AGP. In contrast the two negative APPs, albumin and transfer-
rin, decreased in concentration from the first pre-treatment day, reached a nadir at
the baseline sample, then remained low for 2 more days before slowly increasing in
concentration. Serum iron and serum TfR concentrations decreased during pre-
treatment, and remained low after perfusion, with the lowest concentrations record-
ed 8 hours and 1 day afterwards, respectively.
The experiment showed that the administration of TNF in humans caused hypo-
ferraemia associated with an increased ferritin production. The data also confirm a
previous report that the increase in ferritin concentrations parallels that of CRP (7),
suggesting that ferritin responds as an early APP. However the plasma ferritin con-
centration remained high for longer than the CRP concentration thus, in the latter
part of the experiment, ferritin behaved more like AGP.
7. Control of iron metabolismThe regulation of iron metabolism is normally under the control of iron regulatory
proteins (IRPs) that bind to sequences on messenger ribonucleic acid (mRNA) and
protect mRNA from degradation. As a consequence of iron deficiency the IRPs bind
to mRNA which promotes the expression of transferrin receptor protein and repress-
es the synthesis of ferritin. When iron is present in adequate amounts, ferritin syn-
THE INTERPRETATION Of INDICATORS Of IRON STATuS DuRING AN ACuTE PHASE RESPONSE

ASSESSING THE IRON STATuS Of POPuLATIONS
102
thesis is promoted and iron storage occurs. During infection the normal control of
iron metabolism is changed by IL-1 and TNF-α. The plasma ferritin concentration
increases, despite a low concentration of serum iron, because ferritin mRNA is more
sensitive to cytokines than to iron (10).
The low concentration of serum iron found during infection (hypoferraemia) is
accompanied by changes in the plasma concentration of several iron-binding pro-
teins (Table 1) that facilitate iron uptake by the reticuloendothelial system of the gut
or the removal and re-use of haemoglobin released from old erythrocytes (10).
TAbLe 1 Influence of inflammation on iron-binding proteins in plasma
Plasma protein (units) normal range Function Change in plasma concentration in response to infection
Caeruloplasmin (g/l) 0.16–0.53 Converts feII to feIII Increases ~ 50%
Transferrin (g/l) (µmol/l)
1.9–2.5825–34
Binds and transports iron Decreases ~ 30%
Lactoferrin (µg/l) 0.91–0.45 Binds iron, especially at low pH
Released from granulocytes. Increases 200–500%
ferritin (µg/l) (pmol/l)
15–25034–562
Binds iron Can increase 3000%
Haptoglobulin (g/l)(µmol/l)
0.70 – 3.797.0–37.9
Binds haemoglobin Increases 200–500%
Adapted from Thurnham and Northrop-Clewes (10), with permission of the publisher.
Hypoferraemia may protect individuals against infection by withholding iron from
pathogenic micro-organisms and by reducing the potential pro-oxidant properties
of iron which may exacerbate tissue damage at the site of inflammation where reac-
tive oxygen species are being produced and the body’s cells are at risk of damage (11).
One theory suggested that lactoferrin acts in the hypoferraemic-hyperferritinaemic
response to inflammation by causing a drop in plasma iron concentration and a rise
in plasma ferritin by removing iron from transferrin and delivering it to the macro-
phages, where it is bound to ferritin (11). However, it is now thought that lactoferrins
exert antimicrobial properties that are independent of binding iron, although their
mode of action has not been elucidated (10).
8. FerritinIn clinical practice the gold standard to estimate iron stores is to stain a bone mar-
row aspirate for iron, but this is not practical to do during population surveys, so
alternative methods have been sought. The World Health Organization recommends
that a serum ferritin concentration <12 µg/l indicates depleted iron stores in children
<5 years of age, while a concentration <15 µg/l indicates depleted iron stores in those
>5 years of age (1). However, both thresholds may be too low during an acute phase
response or when there is chronic disease, and a serum ferritin concentration be-
tween 30 and 100 µg/l may better indicate depleted iron stores in such circumstances
(1,12).
The fact that the measurement of serum ferritin concentration can reflect the total
body iron store and an acute phase response has been known since the 1970s, but
the exact kinetics of the changes that occur are not known in detail (2). Understand-
ing how to interpret the concentration of serum ferritin in the presence of infection
103
is difficult, and various approaches have been suggested. An early idea was to use
the ferritin concentration and the mean corpuscular volume or haematocrit, which
is low during anaemia, but it can also be altered by a wide variety of conditions in-
cluding B vitamin deficiencies, liver, thyroid and kidney disease, and so was not a
good choice. It became clear that to interpret the serum ferritin concentration some
measure of the acute phase response was needed (12). Therefore it was suggested
that, in addition to ferritin, an independent indicator of the acute phase response,
such as CRP or AGP, should be measured (13). The report of the joint World Health
Organization/Centers of Disease Control and Prevention technical consultation on
the assessment of iron status at the population level proposes a meta-analysis of ex-
isting data to explore the possibility of using one or two APPs to correct serum ferritin
concentration in the presence of infection.
Other approaches to help interpret the ferritin concentration in the presence of
infection include: the determination of serum iron concentration with the percent-
age saturation of serum iron-binding capacity (transferrin), because a high serum
ferritin concentration and a transferrin saturation <45% usually indicates infection
(14); the measurement of TfR alone (discussed below) because it is thought to be un-
affected by infection; and the measurement of TfR plus ferritin. However there is
disagreement about the use of ferritin as well as TfR because it is thought that ferritin
does not improve the diagnostic efficiency of measuring TfR alone, or that the calcu-
lation of the TfR/log ferritin ratio is more useful (15).
9. Serum transferrin receptorMeasuring the concentration of serum TfR is as an alternative method to assess iron
status because the concentration increases during iron deficiency. It is thought that
the serum TfR concentration is not increased in individuals during an acute phase
response therefore the measurement of serum TfR may help to distinguish between
individuals with and without iron deficiency in the presence of infection. However
no international reference standard exists for this assay, and there may be difficulties
in interpreting serum TfR in the presence of some chronic infections (15).
Transferrin is the main iron transport protein found in blood. It delivers iron to
cells where it interacts with the specific membrane receptor, called TfR (14). Serum
TfR is a truncated monomer of the tissue receptor, lacking the first 100 amino acids
(15). Mean serum TfR concentrations tend to be in the range of 5–8 mg/l in normal
subjects, but standards for different commercial assays vary and results cannot eas-
ily be compared.
Serum TfR concentrations can range from 8 times below to 20 times above normal
values. The most important factor controlling this variation is bone marrow erythro-
poietic activity (15). Serum TfR concentrations indicate the absolute rate of erythro-
poiesis and the adequacy of marrow proliferative capacity for any level of anaemia.
As the iron supply to the tissues becomes deficient the concentration of TfR on cell
surfaces increases progressively and independently of the presence of adequate iron
stores. This means that an increase in serum TfR concentration is a sensitive and
quick response to the development of iron deficiency. Conversely, the serum TfR con-
centration decreases in response to treatment with iron before a change in haemo-
globin occurs, so the response to iron can be monitored by changes in serum TfR
(15).
THE INTERPRETATION Of INDICATORS Of IRON STATuS DuRING AN ACuTE PHASE RESPONSE
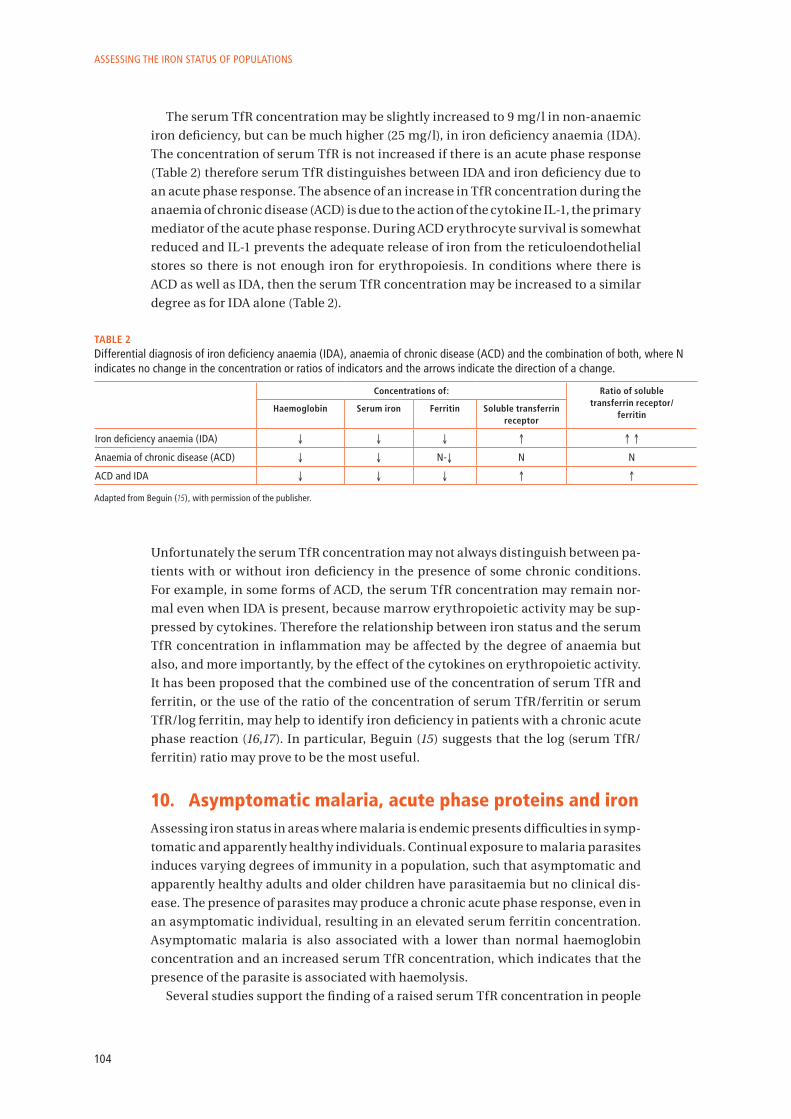
ASSESSING THE IRON STATuS Of POPuLATIONS
104
The serum TfR concentration may be slightly increased to 9 mg/l in non-anaemic
iron deficiency, but can be much higher (25 mg/l), in iron deficiency anaemia (IDA).
The concentration of serum TfR is not increased if there is an acute phase response
(Table 2) therefore serum TfR distinguishes between IDA and iron deficiency due to
an acute phase response. The absence of an increase in TfR concentration during the
anaemia of chronic disease (ACD) is due to the action of the cytokine IL-1, the primary
mediator of the acute phase response. During ACD erythrocyte survival is somewhat
reduced and IL-1 prevents the adequate release of iron from the reticuloendothelial
stores so there is not enough iron for erythropoiesis. In conditions where there is
ACD as well as IDA, then the serum TfR concentration may be increased to a similar
degree as for IDA alone (Table 2).
TAbLe 2 Differential diagnosis of iron deficiency anaemia (IDA), anaemia of chronic disease (ACD) and the combination of both, where N indicates no change in the concentration or ratios of indicators and the arrows indicate the direction of a change.
Concentrations of: Ratio of soluble transferrin receptor/
ferritinHaemoglobin Serum iron Ferritin Soluble transferrin
receptor
Iron deficiency anaemia (IDA) ↓ ↓ ↓ ↑ ↑ ↑
Anaemia of chronic disease (ACD) ↓ ↓ N-↓ N N
ACD and IDA ↓ ↓ ↓ ↑ ↑
Adapted from Beguin (15), with permission of the publisher.
Unfortunately the serum TfR concentration may not always distinguish between pa-
tients with or without iron deficiency in the presence of some chronic conditions.
For example, in some forms of ACD, the serum TfR concentration may remain nor-
mal even when IDA is present, because marrow erythropoietic activity may be sup-
pressed by cytokines. Therefore the relationship between iron status and the serum
TfR concentration in inflammation may be affected by the degree of anaemia but
also, and more importantly, by the effect of the cytokines on erythropoietic activity.
It has been proposed that the combined use of the concentration of serum TfR and
ferritin, or the use of the ratio of the concentration of serum TfR/ferritin or serum
TfR/log ferritin, may help to identify iron deficiency in patients with a chronic acute
phase reaction (16,17). In particular, Beguin (15) suggests that the log (serum TfR/
ferritin) ratio may prove to be the most useful.
10. asymptomatic malaria, acute phase proteins and ironAssessing iron status in areas where malaria is endemic presents difficulties in symp-
tomatic and apparently healthy individuals. Continual exposure to malaria parasites
induces varying degrees of immunity in a population, such that asymptomatic and
apparently healthy adults and older children have parasitaemia but no clinical dis-
ease. The presence of parasites may produce a chronic acute phase response, even in
an asymptomatic individual, resulting in an elevated serum ferritin concentration.
Asymptomatic malaria is also associated with a lower than normal haemoglobin
concentration and an increased serum TfR concentration, which indicates that the
presence of the parasite is associated with haemolysis.
Several studies support the finding of a raised serum TfR concentration in people
105
with asymptomatic malaria (18–20). However Stoltzfus et al. (18) found that although
the serum TfR increased with parasite density in children, this increase disappeared
when serum TfR was adjusted for the haemoglobin concentration. Furthermore, Ver-
hoef et al. (21) suggest that, because of malaria-induced haemolysis, the serum TfR
concentration may not be a useful measure of iron deficiency in individuals with
malaria, and that further studies are needed to elucidate the relationship between
the serum TfR concentration and malaria.
Stoltzfus et al. (18) found no relationship between the serum ferritin concentra-
tion and the density of malaria parasites when the concentration of parasites was
<1000/µl blood, but above this parasite density the serum ferritin concentration was
higher by 1.5 µg/l per 1000 parasites. Odunukwe et al. (22) have proposed that serum
ferritin could be a useful marker of iron status during asymptomatic malaria. They
suggested that there is a linear relationship between the serum ferritin concentra-
tion and malaria parasite density in apparently healthy adults, irrespective of the
species of Plasmodium, and that the ferritin concentration can be corrected using
the following formula:
Measured serum ferritin concentration – (0.08 µg * malaria density) = ferritin level
(µg/l), where malaria density is measured in counts/µl blood.
The usefulness of this formula has not yet been confirmed.
11. Human immunodeficiency virus, acute phase proteins and iron
Infection with HIV is accompanied by a progressive accumulation of iron in mac-
rophages, endothelial and other cells, and can result in an iron excess in the bone
marrow, brain and other organs during the advanced stages of disease. The main
cause of the iron excess is the chronic acute phase response which retains iron in the
reticulo-endothlial system and acts to sustain a low serum iron concentration (23). A
consequence of such iron loading is the growth of microorganisms, resulting in the
opportunistic infections typical of acquired immunodeficiency syndrome (AIDS).
Because iron is needed for lymphocyte activation and proliferation, an altered im-
mune function related to imbalances of iron metabolism might be a special problem
in patients with HIV (24). The proliferative phase of lymphocyte activation requires
iron because it is essential for enzymes such as ribonucleotide reductase, which is in-
volved in deoxyribonucleic acid (DNA) synthesis (24). Changes in iron status appear
to exert subtle effects on the immune system in HIV by altering the proliferation of
T-lymphocytes and B-lymphocytes (25).
The results of a number of studies suggest that infection by HIV alone can elicit an
APP response but, overall, the acute phase response in asymptomatic HIV is mild (26–
30). In a study of children with HIV infection, without secondary infection, Jahoor et
al. (29) found that the APP response may be different from the response elicited by
bacterial infections because the higher concentrations and faster synthesis rates of
the positive APPs were not accompanied by lower concentrations and synthesis rates
of the negative APPs. The results from this study of children (29) confirmed previous
data from the same author on asymptomatic HIV-infected adults. Their findings sug-
gest that because the negative APPs are also transport proteins, the concentration of
the specific nutrients they carry may not be reduced during early but asymptomatic
HIV infection.
THE INTERPRETATION Of INDICATORS Of IRON STATuS DuRING AN ACuTE PHASE RESPONSE
ASSESSING THE IRON STATuS Of POPuLATIONS
106
12. Summary • An increased concentration of serum TfR is a good indicator of tissue iron defi-
ciency, irrespective of iron stores.
• The concentration of serum TfR is not increased when anaemia is due to inflam-
mation, so changes in the serum TfR concentration can distinguish between IDA
and ACD. However, when IDA and ACD are both present, the serum TfR concen-
tration is increased, irrespective of the acute phase response.
• In some chronic conditions erythropoietic activity may be increased even though
there is no IDA and, in such circumstances, the concentration of serumTfR may be
difficult to interpret. Various ways of using the ratio of serum TfR to serum ferritin
have been suggested to help identify IDA in the presence of such a chronic acute
phase response.
• Normally the synthesis of ferritin and TfR proteins is regulated post-transcrip-
tionally by the intracellular iron concentration. However, an increased ferritin
synthesis during an acute phase response appears to be stimulated by cytokines,
independently of intracellular iron.
• Serum ferritin increases during an acute phase response, although the final con-
centration of ferritin is influenced by the underlying iron status.
• In the studies cited, ferritin behaved as a fast-acting positive APP at the beginning
of the acute phase response and paralleled the changes in concentration of CRP.
However in the later stages of the acute phase response, the concentration of fer-
ritin remained high, and it behaved more like AGP.
• Thus, in the initial phase of infection the change in concentration of CRP may
predict the behaviour of ferritin, and in the later stages AGP may control for the
confounding effects of the acute phase response. Measurement of both these APPs
may help to interpret the changes in serum ferritin concentration: if only the CRP
concentration is elevated then the infection is in the initial stages; if both CRP and
AGP are elevated in concentration then the infection is in the acute stage; and if
only AGP is elevated then the infection is in the chronic stage and a correction fac-
tor to interpret ferritin in each stage could be calculated.
• More information is needed to interpret iron status as a result of an acute phase re-
sponse. The report from the joint World Health Organization/Centers for Disease
Control and Prevention technical consultation on the assessment of iron status
at the population level suggests the use of a meta-analysis to explore the possi-
bilities of using one or two APPs to correct ferritin in the presence of infection.
13. references 1. WHO, UNICEF, UNU. Iron deficiency anaemia: assessment, prevention, and control.
A guide for programme managers. Geneva, World Health Organization, 2001. WHO/NHD/01.3.
2. Feelders RA et al. Regulation of iron metabolism in the acute phase response: inter-feron g tumour necrosis factor a induce hypoferraemia, ferritin production and a decrease in circulating transferrin receptors in cancer patients. European Journal of Clinical Investigation, 1998, 28:520–527.
3. Gabay C, Kushner I. Acute phase proteins and other systemic responses to inflamma-tion. The New England Journal of Medicine, 1999, 340:448–454.
4. Fleck A, Myers MA. Diagnostic and prognostic significance of the acute phase proteins. In: Gordon AH, Koj A, eds. The acute phase response to injury and infection. Amsterdam, Elsevier Science Publishers B.V. (Biomedical Division), 1985: 249–271.

107
5. Myers MA et al. Early plasma protein and mineral changes after surgery: a two stage process. Journal of Clinical Pathology, 1984, 37:862–866.
6. Wieringa FT et al. Estimation of the effect of the acute phase response on indicators of micronutrient status in Indonesian infants. Journal of Nutrition, 2002, 132:3061–3066.
7. Baynes R et al. The non-immune inflammatory response: serial changes in plasma iron, iron binding capacity, lactoferrin, ferritin and C-reactive protein. Scandinavian Journal of Clinical Laboratory Investigation, 1986, 46:695–704.
8. Denz H et al. Association between the activation of macrophages, changes of iron me-tabolism and the degree of anaemia in patients with malignant disorders. European Journal of Haematology, 1992, 48:244–248.
9. Phillips A, Shaper AG, Whincup PH. Association between serum albumin and mortal-ity from cardiovascular disease, cancer, and other causes. Lancet, 1989, 2:1434–1436.
10. Thurnham DI, Northrop-Clewes CA. Effects of infection on nutritional and immune status. In: Hughes DA, Darlington LG, Bendich A, eds. Diet and Immune Function. Totowa, USA, Humana Press Inc, 2004: 35–63.
11. Farnaud S, Evans RW. Lactoferrin – a multifunctional protein with antimicrobial properties. Molecular Immunology, 2003, 40:395–405.
12. Witte DL. Can serum ferritin be effectively interpreted in the presence of the acute-phase response? Clinical Chemistry, 1991, 37:484–485.
13. Herbert V et al. Serum ferritin iron, a new test, mesures human body iron stores unconfounded by inflammation. Stem Cells, 1997, 15:291–296.
14. Punnonen K, Irjala K, Rajamaki A. Serum transferrin receptor and its ratio to serum ferritin in the diagnosis of iron deficiency. Blood, 1997, 89:1052–1057.
15. Beguin Y. Soluble transferrin receptor for the evaluation of erythropoiesis and iron status. Clinica Chimica Acta, 2003, 329:9–22.
16. Remacha AF et al. The role of serum transferrin receptor in the diagnosis of iron defi-ciency. Haematologica, 1998, 83:963–966.
17. Bultink IE et al. Ferritin and serum transferrin receptor predict iron deficiency in ane-mic patients with rheumatoid arthritis. Arthritis and Rheumatism, 2001, 44:979–981.
18. Stoltzfus RJ et al. Serum ferritin, erythrocyte protoporphyrin and hemoglobin are valid indicators of iron status of school children in a malaria-holoendemic popula-tion. Journal of Nutrition, 1997, 127:293–298.
19. Menendez C et al. Effect of malaria on soluble transferrin receptor levels in Tanzanian infants. American Journal of Tropical Medicine and Hygiene, 2001, 65:138–142.
20. Mockenhaupt FP et al. Serum transferrin receptor levels are increased in asympto-matic and mild Plasmodium falciparum-infection. Haematologica, 1999, 84:869–873.
21. Verhoef H et al. Serum transferrin receptor concentration indicates increased erythropoiesis in Kenyan children with asymptomatic malaria. American Journal of Clinical Nutrition, 2001, 74:767–775.
22. Odunukwe NN et al. Serum ferritin and other haematological measurements in apparently healthy adults with malaria parasitaemia in Lagos, Nigeria. Tropical Medi-cine and International Health, 2000, 5:582–586.
23. Boelaert JR, Piette J. The potential role of iron in HIV infection and its implications. 6th World Congress for Biomedical Sciences. 2000.
24. Melchoir J-C et al. Malnutrition and wasting, immunodepression, and chronic in-flammation as independent predictors of survival in HIV-infected patients. Nutrition, 1999, 15:865–869.
25. Gordeuk VR et al. Iron status and the outcome of HIV infection: an overview. Journal of Clinical Virology, 2001, 20:111–115.
26. Lee MH, Means RT. Extremely elevated serum ferritin levels in a University hospital: associated diseases and clinical significance. The American Journal of the Medicine, 1995, 98:566–571.
27. Rogers J et al. A motif within the 5’-non-coding regions of acute phase mRNA mediates control of ferritin translation by interleukin-1-beta and may contribute to the anemia of chronic disease. Blood, 1991, 78 (Suppl. 1):367a.
THE INTERPRETATION Of INDICATORS Of IRON STATuS DuRING AN ACuTE PHASE RESPONSE

ASSESSING THE IRON STATuS Of POPuLATIONS
108
28. Fuchs D et al. Association between immune activation, changes of iron metabolism and anaemia in patients with HIV infection. European Journal of Haematology, 1993, 50:90–94.
29. Jahoor F et al. The acute phase protein response to human immunodeficiency virus infection in human subjects. American Journal of Physiology, 1999, 276:E1092–E1098.
30. Friis H et al. HIV and other predictors of serum folate, serum ferritin, and hemoglob-in in pregnancy: a cross-sectional study in Zimbabwe. American Journal of Clinical Nutrition, 2001, 73:1066–1073.