assessing the performance of bamboo structural...
TRANSCRIPT

ASSESSING THE PERFORMANCE OF BAMBOO STRUCTURAL COMPONENTS
by
Michael J. Richard
Bachelor of Science, Worcester Polytechnic Institute, 2008
Master of Science, Worcester Polytechnic Institute, 2009
Submitted to the Graduate Faculty of
The Swanson School of Engineering in partial fulfillment
of the requirements for the degree of
Doctor of Philosophy
University of Pittsburgh
2013

UNIVERSITY OF PITTSBURGH
SWANSON SCHOOL OF ENGINEERING
This dissertation was presented
by
Michael J. Richard
It was defended on
June 5, 2013
and approved by
Melissa Bilec, Ph.D., Assistant Professor, Civil and Environmental Engineering
John Brigham, Ph.D., Assistant Professor, Civil and Environmental Engineering
Khosrow Ghavami, Ph.D., Full Professor, Civil Engineering, PUC-Rio
C. Drew Armstrong, Ph.D., Associate Professor, Architectural Studies
Dissertation Director: Kent A. Harries, Ph.D., Associate Professor, Civil and Environmental
Engineering
ii

Copyright © by Michael J. Richard
2013
iii

Bamboo has been a traditional construction material in many regions for centuries. The
rapid growth and maturation rate of bamboo as well as its good strength properties and global
accessibility make it a promising non-conventional building material resource. However, due to
limited standardization and design criteria, bamboo has often been relegated to non-engineered
and marginally-engineered construction. The current study assesses the performance of full-culm
structural bamboo components and appropriate standard material and member test methods. A
brief overview is given to the motivation for the study of structural bamboo, placing the work in
its social context, followed by background on the properties of bamboo and the structural
applications of the material as well as the pathway to its further standardization and utilization.
Experimental and analytical studies are conducted focusing on the tensile, flexural, buckling, and
environmental sustainability performance of full-culm bamboo components. Standard bamboo
tension tests are carried out to investigate the test interferences associated with the functionally
graded fiber distribution across the culm wall thickness. Tension specimens oriented in both the
radial and tangential directions are considered in order to isolate the effects of the fiber gradation
both on test results and experimental methodology. Recognizing longitudinal splitting induced
by flexure as a dominant limit state, modified standard bamboo flexural tests are performed to
investigate the development of a standard test procedure for this limit state, which involves a
mixed-mode longitudinal splitting failure in the flexural element. Flexural testing considers two
ASSESSING THE PERFORMANCE OF STRUCTURAL BAMBOO COMPONENTS
Michael J. Richard, Ph.D.
University of Pittsburgh, 2013
iv

test configurations and three difference species of bamboo. Results of modified full-culm tests
are compared with smaller clear bamboo flexural specimens taken from the culm wall as well as
standard or proposed tests for pure mode I and pure mode II failure components. The
experimental buckling capacity of single-culm and multiple-culm bamboo columns is studied as
further understanding of column strength is critical to the construction of more robust and
potentially multiple-story bamboo structures. Finally, in an effort to quantify the perceived
sustainability benefits of bamboo, the environmental impacts of multiple-culm bamboo columns
are compared with structurally comparable timber and steel alternatives in a comparative
midpoint life cycle analysis.
v

TABLE OF CONTENTS
NOMENCLATURE ............................................................................................................... XVII
ACKNOWLEDGMENTS ......................................................................................................... XX
1.0 INTRODUCTION ........................................................................................................ 1
1.1 THE GROWING SOCIO-ECONOMIC GAP .................................................. 2
1.2 HOUSING: A FUNDAMENTAL RIGHT YET GLOBAL CHALLENGE .. 3
1.3 ADEQUATE SHELTER AND NATURAL DISASTERS ............................... 5
1.4 THE STRAIN ON GLOBAL BUILDING RESOURCES ............................... 9
1.5 SUSTAINABLE DEVELOPMENT WITH BAMBOO ................................. 15
1.6 SCOPE OF DOCUMENT ................................................................................. 17
2.0 BAMBOO AND ITS STRUCTURAL APPLICATIONS ....................................... 20
2.1 BAMBOO AND ITS RESOURCES................................................................. 21
2.1.1 Bamboo Taxonomy and Classification ........................................................ 21
2.1.2 Bamboo Anatomy, Structure, and Growth ................................................. 22
2.1.2.1 The Bamboo Culm .............................................................................. 23
2.1.2.2 The Rhizomes ...................................................................................... 25
2.1.2.3 Bamboo Growth and Flowering ........................................................ 27
2.1.3 Bamboo Resources ......................................................................................... 30
2.1.4 Bamboo Harvesting and Seasoning.............................................................. 32
vi

2.1.4.1 Bamboo Propagation and Plantations............................................... 33
2.1.4.2 Bamboo Harvesting and Seasoning ................................................... 35
2.1.4.3 Bamboo Treatment and Preservation ............................................... 36
2.1.5 Mechanical Properties of Natural Bamboo ................................................. 39
2.1.5.1 Modulus of Elasticity .......................................................................... 40
2.1.5.2 Flexural Strength ................................................................................ 40
2.1.5.3 Compression Strength ........................................................................ 41
2.1.5.4 Tensile Strength................................................................................... 41
2.1.5.5 Shear Strength ..................................................................................... 42
2.1.5.6 Commentary on Bamboo Material Properties ................................. 43
2.2 STRUCTURAL APPLICATIONS OF BAMBOO ......................................... 43
2.2.1 Bamboo Structures ........................................................................................ 44
2.2.2 Bamboo Jointing Techniques ....................................................................... 49
2.2.3 Hazard Mitigation and Disaster Relief through Bamboo Structures ....... 53
2.2.4 Engineered Bamboo Products ...................................................................... 55
2.2.5 Composite Bamboo Products and Systems ................................................. 56
2.3 THE PATH TO STANDARDIZATION ......................................................... 57
2.3.1 Current Bamboo Standards ......................................................................... 58
2.3.2 Improving Standardization .......................................................................... 61
3.0 INHERENT BENDING IN BAMBOO TENSION TESTS .................................... 64
3.1 BAMBOO TENSILE STRENGTH.................................................................. 65
3.2 INHERENT BENDING AND ROTATION OF TENSION SPECIMENS .. 68
3.3 EXPERIMENTAL PROGRAM ....................................................................... 73
vii

3.3.1 Specimens and Fabrication ........................................................................... 74
3.3.2 Testing Apparatus ......................................................................................... 76
3.3.3 Instrumentation ............................................................................................. 77
3.4 EXPERIMENTAL RESULTS ......................................................................... 79
3.4.1 Failure Modes ................................................................................................ 79
3.4.2 Tensile Strength ............................................................................................. 82
3.4.3 Experimental Strain Profiles ........................................................................ 86
3.4.4 Experimental Stress Profiles ......................................................................... 92
3.4.5 Experimental Elastic Modulus Profile ......................................................... 93
3.5 CONCLUSIONS ................................................................................................ 94
4.0 PERFORMANCE OF BAMBOO FLEXURAL COMPONENTS ........................ 97
4.1 BAMBOO FLEXURAL BEHAVIOR ............................................................. 97
4.1.1 Bamboo Flexural Behavior ........................................................................... 98
4.1.2 Bamboo Shear and Splitting Behavior ...................................................... 103
4.1.2.1 In-Plane Shear (Mode II Failure) .................................................... 105
4.1.2.2 Bamboo Splitting (Mode I and Mixed-Mode Failures) ................. 106
4.2 EXPERIMENTAL PROGRAM ..................................................................... 113
4.2.1 Bamboo Species and Test Locations .......................................................... 113
4.2.2 Bowtie Tests.................................................................................................. 114
4.2.2.1 Bowtie Tests Results.......................................................................... 115
4.2.3 Split-Pin Tests .............................................................................................. 117
4.2.3.1 Split-Pin Test Results ........................................................................ 118
4.2.4 Small Scale Flexural Tests .......................................................................... 118
viii

4.2.4.1 Small Scale Beam Test Results ........................................................ 120
4.2.5 Full-Culm Flexural Tests ............................................................................ 124
4.2.5.1 Specimens ........................................................................................... 124
4.2.5.2 Experimental Flexural Test Arrangement ..................................... 126
4.2.5.3 Experimental Full-Culm Test Results ............................................. 129
4.3 DISCUSSION ................................................................................................... 133
4.3.1 Applicability as a Field Test ....................................................................... 135
4.4 CONCLUSIONS .............................................................................................. 135
5.0 PERFORMANCE OF BAMBOO COLUMNS ..................................................... 138
5.1 BACKGROUND .............................................................................................. 138
5.1.1 Bamboo Column Buckling .......................................................................... 139
5.1.2 Standard Design Procedures ...................................................................... 143
5.2 EXPERIMENTAL PROGRAM ..................................................................... 144
5.2.1 Specimens ..................................................................................................... 144
5.2.2 Compression Tests ....................................................................................... 146
5.2.3 Column End Connections ........................................................................... 147
5.2.4 Determination of Effective Length of Columns ........................................ 148
5.2.5 Column Buckling Test Program ................................................................ 150
5.3 EXPERIMENTAL RESULTS ....................................................................... 152
5.3.1 Full Height Columns ................................................................................... 153
5.3.2 Short Column Tests ..................................................................................... 158
5.3.3 Summary of Column Tests ......................................................................... 160
5.4 CONCLUSIONS .............................................................................................. 161
ix

6.0 SUSTAINABILITY OF BAMBOO STRUCTURAL COMPONENTS ............. 163
6.1 BACKGROUND ON LIFE CYCLE ASSESSMENT OF BAMBOO ........ 164
6.1.1 Life Cycle Assessment Methodology .......................................................... 164
6.1.2 Previous LCAs on Bamboo and Wood ...................................................... 165
6.1.3 Research Basis for Current LCA ............................................................... 170
6.1.3.1 Four-culm bamboo columns ............................................................ 171
6.1.3.2 Timber columns................................................................................. 172
6.1.3.3 Structural Steel Columns ................................................................. 173
6.2 METHOD AND INPUTS ................................................................................ 173
6.2.1 Extraction (Harvesting) .............................................................................. 177
6.2.2 Transportation to Processing ..................................................................... 178
6.2.3 Processing and Treatment .......................................................................... 179
6.2.4 Transportation to Site ................................................................................. 179
6.2.5 Fasteners ....................................................................................................... 180
6.2.6 Erection......................................................................................................... 180
6.2.7 Steel Process Inputs ..................................................................................... 181
6.3 LCIA PROFILES ............................................................................................ 182
6.3.1 Bamboo and Timber Columns ................................................................... 183
6.3.2 Comparison with Steel Columns ................................................................ 187
6.3.3 Discussion ..................................................................................................... 189
6.4 FUTURE WORK ............................................................................................. 192
6.4.1 Single metric for environmental impact .................................................... 193
6.4.2 Inclusion of a transportation adjustment .................................................. 195
x

6.4.3 Consideration of service life........................................................................ 196
6.5 CONCLUSIONS .............................................................................................. 197
7.0 CONCLUSIONS ...................................................................................................... 199
7.1 ASSESSMENT OF STANDARD MATERIALS TEST METHODS ......... 199
7.2 ASSESSMENT OF STRUCTURAL AND ENVIRONMENTAL PROPERTIES .................................................................................................. 201
7.3 FUTURE WORK ............................................................................................. 202
7.3.1 Modeling of bamboo as a functionally graded material .......................... 203
7.3.2 Performance of bamboo jointing techniques ............................................ 204
7.3.3 Bamboo LCI Database and Structural Design LCA Parameter ............. 205
7.4 SUMMARY ...................................................................................................... 206
APPENDIX A ............................................................................................................................ 208
CITED REFERENCES ............................................................................................................ 258
xi

LIST OF TABLES
Table 3-1: Test Matrix .................................................................................................................. 75
Table 3-2: Observed failure modes in tensile tests. ...................................................................... 82
Table 3-3: Average Experimental Tensile Strength Summary and Normalization ...................... 83
Table 4-1: Bowtie Test Specimen Geometry and Results .......................................................... 115
Table 4-2: Split Pin Test Geometry and Results ......................................................................... 117
Table 4-3: Small Beam Geometry and Results ........................................................................... 120
Table 4-4: Geometric Properties of Bamboo Flexure Specimens and Test Details ................... 126
Table 4-5: Summary of strength results (UPitt specimens only) ................................................ 134
Table 5-1: Column Specimen Geometry Data ............................................................................ 146
Table 5-2: Results for control columns used to establish value of effective length factor, K .... 148
Table 5-3: Specimen axial load capacity .................................................................................... 152
Table 5-4: Predicted Column Behavior ...................................................................................... 157
Table 6-1: Column sections considered ...................................................................................... 171
Table 6-2: Included Processes for Comparative LCA and Corresponding LCI Databases ........ 176
Table 6-3: LCIA results for all column alternatives ................................................................... 191
Table 6-4: Example of transportation volume and weight.......................................................... 195
xii

LIST OF FIGURES
Figure 1-1: Example of informal settlement housing in South Asia (UN-HABITAT 2011b) ....... 4
Figure 1-2: Global steel and cement production (1990-2010) ...................................................... 10
Figure 1-3: Map of global forests (World Resource Institute 2009) ............................................ 11
Figure 1-4: Informal material suppliers provide necessary building inputs (UN-HABITAT 2011b). .................................................................................................................................. 12
Figure 1-5: Triple bottom line through standardization and research of bamboo ........................ 16
Figure 2-1: Plantation of Phyllostachys Aurea in Bananal, Brazil ............................................... 22
Figure 2-2: Composition of a bamboo culm ................................................................................. 23
Figure 2-3: Bamboo vascular bundles (inset from Janssen 1981) ................................................ 25
Figure 2-4: Leptomorph (left)and Pachymorph (right) rhizome systems (Banik 1995) .............. 26
Figure 2-5: Running bamboo and clumping bamboo (photos courtesy of C. Thiel) .................... 26
Figure 2-6: Pile of excavated P. aurea rhizomes and knife crafted from material ....................... 27
Figure 2-7: Outside view (left) and cross section (right) of a new bamboo shoot........................ 28
Figure 2-8: World Bamboo Habitat (adapted from Laroque 2007) .............................................. 31
Figure 2-9: Harvesting and seasoning P. aurea at Bambuparque (courtesy of L. Inglês) ............ 35
Figure 2-10: Bamboo treatment processes .................................................................................... 39
Figure 2-11: Examples of bamboo scaffolding in Southeast Asia ................................................ 44
Figure 2-12: Examples of bamboo housing .................................................................................. 46
xiii

Figure 2-13: Examples of Large Architectural Bamboo Structures ............................................. 47
Figure 2-14: Categories of typical joints as drawn by Janssen (2000, 1981). .............................. 50
Figure 2-15: The Arce joint (Arce-Villalobos1993) ..................................................................... 52
Figure 2-16: Typical residential structures following the 2006 Sikkim earthquake (Kaushik et al. 2006) ..................................................................................................................................... 54
Figure 2-17: Current bamboo standards as well as proposed lab and field applicable tests (Harries et al. 2012) ............................................................................................................................ 60
Figure 3-1: Representative bamboo dogbone specimen ............................................................... 66
Figure 3-2: Illustrative fiber analysis of bamboo tension specimen ............................................. 70
Figure 3-3: Rotation in representative spring model loaded in Tension ....................................... 71
Figure 3-4: Representative fiber volume fraction distribution ..................................................... 72
Figure 3-5: Stress due to uniform strain ....................................................................................... 72
Figure 3-6: Total strain including rotation of moment Fe ............................................................ 73
Figure 3-7: Tensile test specimens ................................................................................................ 75
Figure 3-8: Experimental Test Set Up .......................................................................................... 77
Figure 3-9: VIC-3D system. ......................................................................................................... 78
Figure 3-10: Location of strain gages on tension specimen and gages after testing..................... 79
Figure 3-11: Representative Failure Modes .................................................................................. 81
Figure 3-12: Experimental Tensile Strength ................................................................................. 84
Figure 3-13: Tensile strength along the culm height. ................................................................... 85
Figure 3-14: Specimen TG1-5 (Free): Inner (Upper Left), Middle (Upper Right), Outer (Lower Left), & Radial (Lower Right) .............................................................................................. 88
Figure 3-15: Specimen TG1-5 (Fixed): Inner (Upper Left), Middle (Upper Right), Outer (Lower Left), & Radial (Lower Right) .............................................................................................. 89
Figure 3-16: Strain profile for specimen TG1-5 (free): 40MPa (top), 70 MPa (center), and 100MPa (bot.) ....................................................................................................................... 90
xiv

Figure 3-17: Strain profile for Specimen TG1-5 (fixed): 40MPa (top), 60MPa (center), and 89MPa (bot.) ......................................................................................................................... 91
Figure 3-18: Representative stress profiles for specimens TG1-5 and TG21-11 ......................... 92
Figure 3-19: Representative E-Modulus profile for specimens TG1-8 and TG21-12 .................. 94
Figure 4-1: Examples of bamboo splitting (Sharma 2010) ........................................................... 98
Figure 4-2: Longitudinal shear due to flexure ............................................................................ 103
Figure 4-3: Standard definitions of fracture modes (Smith et al. 2003) ..................................... 105
Figure 4-4: Current test methods for in-plane shear strength of bamboo ................................... 106
Figure 4-5: Split-Pin Test (Mitch 2009) ..................................................................................... 108
Figure 4-6: Edge Bearing Test (Sharma 2010) ........................................................................... 110
Figure 4-7: Examples of Bowtie Test Failure Planes ................................................................. 116
Figure 4-8: Small Beam Flexural Specimen Configuration ....................................................... 119
Figure 4-9: Shear Stress (MPa) v. Stroke (mm) for Small Notched Flexural Specimens (curves offset for clarity) ................................................................................................................. 121
Figure 4-10: VIC-3D contour images for un-notched Tre Gai beam specimen ......................... 122
Figure 4-11: VIC-3D Contour Images for Notched Tre Gai Specimen...................................... 123
Figure 4-12: Jig for measuring bamboo culms ........................................................................... 125
Figure 4-13: Modified flexure test for full scale culms .............................................................. 128
Figure 4-14: Representative test pictures ................................................................................... 130
Figure 4-15: Representative load-displacement curves .............................................................. 131
Figure 4-16: Magnified images of crack bridging on either side of notch in Dendrocalamus specimen DB3 .................................................................................................................... 135
Figure 5-1: Jig for measuring bamboo columns ......................................................................... 145
Figure 5-2: Short-doweled end condition ................................................................................... 147
Figure 5-3: Buckled shaped of PVC columns 1 and 2 ................................................................ 149
xv

Figure 5-4: Test set-up and instrumentation ............................................................................... 151
Figure 5-5: Normalized stress v. displacement plots. ................................................................. 153
Figure 5-6: observed behavior of bamboo column specimens ................................................... 156
Figure 5-7: Lateral displacement of culms in multiple-culm columns (figures drawn to scale on a grid 50 mm) ........................................................................................................................ 156
Figure 5-8: Original and buckled shapes for single-culm bamboo short columns ..................... 159
Figure 5-9: Plot of critical stress versus slenderness (L/r) .......................................................... 161
Figure 6-1: Process Flow Diagram for Columns ........................................................................ 174
Figure 6-2: LCIA profile for 2600mm bamboo and timber columns (scenario 1) ..................... 185
Figure 6-3: LCIA profile for bamboo and timber columns (scenario 2) .................................... 186
Figure 6-4: LCIA profile for bamboo, timber, and steel columns (scenario 1) .......................... 188
Figure 6-5: LCIA profiles for bamboo, timber, and steel columns (scenario 2) ........................ 189
Figure 7-1: Modeling of structural bamboo components ........................................................... 204
xvi

NOMENCLATURE
2a initial crack length for split-pint test
A area
Aculm area of bamboo culm section
Ag gross area of entire cross section
b breadth (width)
C design equation modification factor
c distance from the neutral axis to the extreme fiber of cross section
cr distance from midline of the culm wall to the edge of the wall section at
the location of rupture
d depth
D outer diameter of bamboo culm
E eccentricity
E modulus of elasticity
Ec composite moment of elasticity
Ef modulus of elasticity of bamboo fibers
Em modulus of elasticity of lignin matrix
F force
fr transverse modulus of rupture (edge bearing test)
xvii
GI mode I strain energy release rate
hr distance from the culm wall midline to elastic neutral axis
I moment of inertia
Iculm moment of inertia of bamboo culm section
Ig moment of inertia of gross cross section
K effective length factor or spring stiffness factor
Keff experimental effective length factor
KI crack intensity factor
L length
M moment
Pcr elastic buckling capacity
r radius of gyration
R culm radius
Rc culm radius measured to the midwall thickness
S span
t thickness
V shear force
Vf volume fraction of bamboo fibers
w width in tangential direction of culm
y distance between the centroid of shear area and neutral axis
δ out-of straightness (curvature)
ε strain
εxx horizontal strain
xviii
εyy vertical strain
θ angle
σ stress
σ┴ tension capacity perpendicular to the longitudinal fibers
σc experimental compressive strength
σcr critical buckling stress
σ* normalized critical buckling stress
τ shear stress
xix

ACKNOWLEDGMENTS
Prove all things; hold fast that which is good. – 1 Thessalonians 5:21
To Danielle:
for continuing to stick with me through the ups, downs, twists, and turns.
Thank you and I love you.
To Mom and Dad:
for always encouraging me to dream and for supporting me throughout.
I would like to acknowledge a few (out of many) who have helped me with this research:
Dr. Kent A. Harries for his mentorship, friendship, and the opportunity to learn from his
expertise, gain confidence as an academic and engineer, and work in a full-scale structures
laboratory. I look forward to future collaboration and visits to Pittsburgh.
CEE lab technician Charles “Scooter” Hager for all his guidance and assistance in the
structures lab and his friendship
Dr. Khosrow Ghavami for not only offering his expertise and knowledge in bamboo
structures but for his gracious hospitality while I studied in Rio and his continued friendship
xx

Committee members Dr. John Brigham, Dr. Mellissa Bilec, and Dr. C. Drew
Armstrong for their expertise, input, and guidance in the development of this work
The Mascaro Center for Sustainable Innovation and the NSF IGERT Program
Dr. Bhavna Sharma for her guidance and expertise in bamboo structures as well as for
encouraging my involvement with MCSI outreach programs
Fellow UPitt students Lynn Worobey, Jarret Kasan, Cassie Thiel, Alex Dale, Derek
Mitch, Daniel Cardoso, and Mark K. Watkins for their support and friendship
Jennifer Gottron, the 2011 and 2012 IRES teams, and Alex Vuotto
My family and friends who have been so supportive, especially my wife Danielle who
has (patiently) stuck by and experienced the trials and triumphs alongside me.
xxi

1.0 INTRODUCTION
Used for centuries as a non-engineered construction material, bamboo has wide availability
across the globe and offers a potentially more sustainable alternative to conventional engineered
building practices in regions where it is readily available. With the world population estimated to
reach 9 billion people by 2050 (Dickson 2002), bamboo is a much needed alternative to the
global portfolio of construction materials. Structural use of bamboo offers potential advances in
such areas as a) reducing homelessness rates in areas across the globe, b) mitigating damage
caused by natural disasters, c) providing housing for disaster relief efforts, and d) bridging the
growing socio-economic gap for growing populations. However, due to a lack of understanding,
as well as a lack in engineering standardization, bamboo continues to be regarded as an inferior
material by the populations that can most benefit from its use. Therefore, the objective of the
current research is to extend the body of knowledge on bamboo standardization and the
performance of bamboo structural components (i.e. bamboo axial and flexural members) in order
to move this unique and promising material toward broad acceptance and use in the global
construction field.
1

1.1 THE GROWING SOCIO-ECONOMIC GAP
There is a growing socio-economic gap developing between advanced and developing societies
as well as between urban and rural populations (Powell 2006). Technology continues to advance
in developed western nations as well as urban centers but lags in the rapidly growing populations
of developing nations and remote rural regions. This is in contrast to the principle of sustainable
development, especially with respect to housing and construction. Inexpensive, autonomous
housing and green construction are two of the new technologies envisioned to proliferate by
2020 (Powell 2006). However, developing nations must overcome greater barriers with regard to
the implementation of new technologies; structural bamboo construction offers a potential
alternative.
Global development is coupled with burgeoning populations and a growing demand for
improved housing. The global population is estimated to reach 9 billion people by 2050 (Dickson
2002). Construction resources are therefore being strained as conventional building resources
(steel, concrete, and timber) are being sought by more people in more remote regions. Often,
access to conventional building materials comes with high costs and large environmental
impacts, particularly those associated with transport. However, low-cost indigenous materials
like bamboo are often passed over for construction due to their perception as being ‘poor man’s’
materials or unreliable for construction due to a lack of research and standardization. As a result,
indigenous materials are typically only used in non-engineered and vernacular construction.
There is also a need for adequate housing and infrastructure in developing nations which
often have large socio-economic gaps between rural and urban populations. Examples of this
disparity include pervasive rural poverty (technological and economic) as compared to urban
centers, and the existence of urban poverty in cities such as the favela of Rio de Janeiro, the
2

slums of Mumbai and Kolkata, and other informal settlements throughout the developing world.
The latter can be considered an extension of the former since many rural people travel to the city
in search of work but lack the economic resources for adequate urban housing. Additionally,
developed nations are also straining conventional resources as more efficient infrastructure is
needed to replace aging systems.
These trends showcase two major issues. First, the growing demand for adequate housing
and infrastructure is straining conventional material resources such as concrete, timber, and steel
not only in places where they are practically available but in outlying remote areas where use of
these materials is not feasible. Nonetheless, they are seen as the superior or ‘affluent’ material
choice as opposed to local indigenous materials. Second, this view is coupled with a lack of
expertise in the use of conventional materials; indeed, local materials often perform better
structurally. For example, bamboo houses better survived two recent seismic events as compared
to conventional materials in Northeast India (Kaushik et al. 2006a, Kaushik et al. 2006b, and
Murty and Sheith 2012).
1.2 HOUSING: A FUNDAMENTAL RIGHT YET GLOBAL CHALLENGE
Safe, reliable housing is recognized as a basic human need and a basic human right as
“[everyone] has the right to a standard of living adequate for the health and well-being of himself
and of his family, including food, clothing, housing, and medical care and necessary social
services…” (UN-UDHR 1948). However, homelessness and/or inadequate housing remains a
significant and growing problem across the globe as people struggle for adequate housing in both
rural and urban environments. Major causes of this problem include rapid urbanization in
3

developing areas, human conflicts, natural disasters, and issues of housing affordability and
availability of building resources. “Unfortunately housing affordability remains a challenge and
it is worsening due to, among other factors, the economic effects of the global financial crisis and
the increasing severity of disasters and conflicts, which both place an additional strain on already
stretched land and housing resources” (UN-HABITAT 2011b).
Rapid urbanization is a major challenge to providing adequate housing and has led to
many living in non-engineered or marginally-engineered informal settlements. UN-HABITAT
estimated that as of 2011, more than 1 billion people are living in such informal settlements
(often described more negatively as ‘slums’) and that 2 billion more people will be added to this
number over the next 25 years (UN-HABITAT 2011b). Asia faces a significant challenge, as it
has the fastest rate of urbanization in the world and nearly one third of households in Asia are in
informal settlements: “Predictions suggest that between 2010 and 2050, the urban population in
Asia will nearly double to reach 3.4 billion. Every day Asian cities will need to accommodate
120,000 new residents, which equates to a daily housing demand of at least 20,000 housing
units” (UN-HABITAT 2011b). Southern Asia will see the fastest growth with its 2010 urban
population of 600 million increasing to 1.4 billion by 2050 (Figure 1-1).
Figure 1-1: Example of informal settlement housing in South Asia (UN-HABITAT 2011b)
4

Meanwhile, Latin America and the Caribbean as well as Africa are also facing issues of
homelessness and rapid urbanization. In Latin America and the Caribbean, 84.6% of the
population will live in cities by 2030 (up from 75.5% in 2000). The population living in informal
settlements was estimated to be 134 million in 2005; approximately one-third of the region’s
population (UN-HABITAT 2011a). In Africa, which is rural but quickly urbanizing, cities will
need to accommodate an additional 40,000 people every day between 2011 and 2025 when
nearly half (47.2%) of Africa’s population will live in cities (UN-HABITAT 2011c). While
North Africa and a few sub-Saharan African countries have reduced the population of dwellers
living in informal settlements between the years of 2000 and 2010, the majority of African
households continue to settle in informal housing due to a lack of alternatives: “Indeed, in some
[African] countries slums constitute a considerable proportion of the housing stock, for example
Chad (90.3%), Ethiopia (79.1%), Mozambique (80.0%), and Niger (81.9%)” (UN-HABITAT
2011c). Even in European and North American countries, homelessness is a serious problem;
approximately 10% of the population lives in slums and informal settlements. Europe is
estimated to have a homeless population of approximately 600,000 while 750,000 people were
reported as being homeless in the United States in 2006 (UN-HABITAT 2011d).
1.3 ADEQUATE SHELTER AND NATURAL DISASTERS
Natural disasters, as well as human conflicts, pose another major challenge to providing adequate
shelter to affected populations. Not only must attention be given to providing adequate
temporary shelter immediately after a disaster, but also to providing long-term, sustainable, and
permanent housing for populations. Relief shelter and long term housing strategies should seek
5

to implement housing solutions that consider and engage local resources, building skills, culture,
and economy. Permanent housing must also seek to provide improved performance and hazard
mitigation in order to reduce loss and casualty in future events.
The litany of available statistics from recent natural disasters illustrate the need for both
better permanent shelters which can survive these events or protect their occupants so as to
reduce casualties, and better shelter relief efforts and strategies immediately after an event. For
example, the death totals for major earthquakes in recent years have been significant in areas
with housing inadequate for the regional seismic risk. The 2003 Bam, Iran earthquake (26,300
dead), the 2005 Kashmir earthquake (80,500 dead), the 2008 Sichuan earthquake (70,000 dead),
and the 2010 Haiti earthquake (230,000 dead) all resulted in significant casualty. Following such
events, the number of injured persons is typically similar or greater and those displaced from
their homes are often an order of magnitude greater. Similar major earthquakes in Morocco
(2004) and Chile (2010) however saw much lower death totals, approximately 571 and 452
respectively (Yu et al. 2010). Additionally, more buildings remained standing in Chile than Haiti
after the earthquake even though the Chilean quake was of a significantly greater magnitude
(Rowell and Jackson 2010). This markedly lower death toll can be attributed to better hazard
mitigation through availability and adherence to building codes; use of best practices;
standardization; and guidelines for buildings. Similarly, the disparity between regions with
adequate housing stock and those with more informal shelters can be also seen in the death tolls
from major hurricanes and tropical cyclones. The 2008 cyclone in Myanmar and Burma resulted
in approximately 135,000 deaths while Hurricane Katrina in the Southern United States in 2005
only caused 1,836 deaths.
6

In addition to providing better performing long-term housing, better strategies for
providing temporary shelter after natural disasters are a concern. The December 2004 Indian
Ocean Tsunami claimed over 250,000 lives and left millions of people homeless or displaced in
the coastal areas of Indonesia, Malaysia, Southern India, Sri Lanka, Thailand, and the Maldives.
Tents and shared barracks were used as temporary shelter for survivors and the need for adequate
permanent housing at affordable costs remains. As of 2011 (7 years after the disaster), “it has
been estimated that in [the Indonesian province of] Aceh alone, 92,000 new houses need to be
built and 151,000 damaged houses rehabilitated” (UN-HABITAT 2011b). Meanwhile, the
January 2010 Haitian Earthquake claimed over 300,000 lives and left 1.3 million people living in
temporary shelters in the Port-au-Prince region. Another 600,000 people moved to other areas of
the country seeking shelter immediately following the disaster (Government of the Republic of
Haiti 2010). Approximately 105,000 homes were totally destroyed and over 208,000 were
damaged. It is estimated that the housing sector alone in Haiti incurred 2.3 billion USD worth of
damage (Government of the Republic of Haiti 2010). Yet, the humanitarian response was slow.
Immediately after the quake, the Office of Internal Migration and its partners had only given out
shelter supplies to approximately 36,000 people (Klarreich, 2010), which highlights the slow
response of the relief effort in supplying shelter. By March 2010, 1.2 million people were still
living in 460 spontaneously organized camps of over 25 families each; 21 of these spontaneous
camps, which included some 250,000 people, presented major risks “for the well-being and
safety of their inhabitants” (Government of the Republic of Haiti 2010).
Ultimately, delays in the distribution of prefabricated shelter forces many of the displaced
to use salvaged and local materials. Temporary disaster relief strategies need to adjust to better
facilitate affected populations. Instead of shipping outside materials, resources and prefabricated
7

units for shelters to the disaster site (usually from overseas), temporary shelters should instead
use local materials and building expertise. This allows for a faster response time, lower costs,
and a faster return to normalcy for the affected population. Use of local materials and building
expertise in temporary relief shelter also transitions to their use in building of more long-term
permanent structures. In Haiti, groups are working on developing and disseminating better
standards and best practices to allow Haitians to use traditional and local building techniques
which are more accessible for rebuilding and more robust in terms of future hazard mitigation
such as wood framed structures with earthen infill walls (Rowell and Jackson 2010). The UN has
recognized this and states that “transitional shelter should only require locally available tools and
skill sets” and states that prefabricated shelters are not practical or appropriate based on cost and
cultural perspectives (United Nations, 2004).
A new strategy for disaster relief should involve transfer of information and knowledge
regarding temporary (and long term) shelter construction to complement local expertise and the
development of implementation plans for relief shelter construction rather than the shipment of
outside materials and resources to the site. In the ongoing effort to define solutions for disaster
relief, bamboo has great potential with further standardization as it is often a local material with
good structural properties and, in some areas, local inhabitants are knowledgeable in traditional
methods for use in non-engineered structures.
8

1.4 THE STRAIN ON GLOBAL BUILDING RESOURCES
The growing demand for adequate housing across the globe is straining the resource availability
of conventional building materials (steel, concrete, wood, and masonry). As the resources of
these conventional materials are being sought after in more areas of the world, questions arise as
to the ability to provide the supply to meet the increased demand and how to do so in a
sustainable manner. The sustainability question must address the use of such materials in remote
regions that lack both a native supply of conventional building materials and the expertise to
build effectively with them. Figure 1-2 shows the global production of crude steel and cement
between the years of 1990 and 2010. Over the last 20 years, the world has seen a significant
increase in the production of both these finite material resources. According to the World Steel
Association, global crude steel production has increased from 616.0 million metric tons in 1990
to 1,428.7 million metric tons in 2010, an increase of 132%. Meanwhile, concrete is the most
widely used construction material in the world (Crow 2008). Global cement production has
increased from 1,148.9 million metric tons in 1990 to 3,310.0 million metric tons in 2010, an
increase of 188%. Much of this construction growth comes from rapidly developing countries
such as Brazil, Russia, India, and China (the so-called BRIC countries). For 2010, China was the
leading producer of cement accounting for 57% of total global production (van Oss 2012). This
is up from a 29% share of total global production in 1994 (Solomon 1994). The next 6 producers
in 2010 were India, the United States, Turkey, Brazil, Japan, and Russia (van Oss 2012).
Concrete use in 2050 is also predicted to be 4 times the amount used in 1990 (Crow 2008).
While important and necessary resources for buildings, these materials are energy
intensive to produce and generate a number of other negative environmental impacts. The
cement industry is one of the leading industrial emitters of carbon dioxide (CO2); it is estimated
9

that 0.87 to 0.92 metric tons of CO2 emissions are produced for every metric ton of cement
clinker produced (van Oss 2012). Because of the vast quantity used, concrete production
contributes as much as 5% of the annual anthropogenic global CO2 production with China alone
producing 3% (Crow 2008). Efforts are being made at using recycled steel and concrete as well
as looking into new admixtures and alternatives for concrete (Crow 2008). However, a
broadening of the construction material resource base is still required in areas of expanding
population where concrete and steel construction is a) expensive, b) not readily available and
requires importation of necessary materials, and c) not viable due to a lack of expertise by the
local population in using these construction techniques.
Figure 1-2: Global steel and cement production (1990-2010)
Even renewable construction material stocks such as timber are being strained by
increased demand for construction as well as other demands of the growing global population
such as land and agriculture. Figure 1-3 is a map of global forests indicating that 47% of global
10
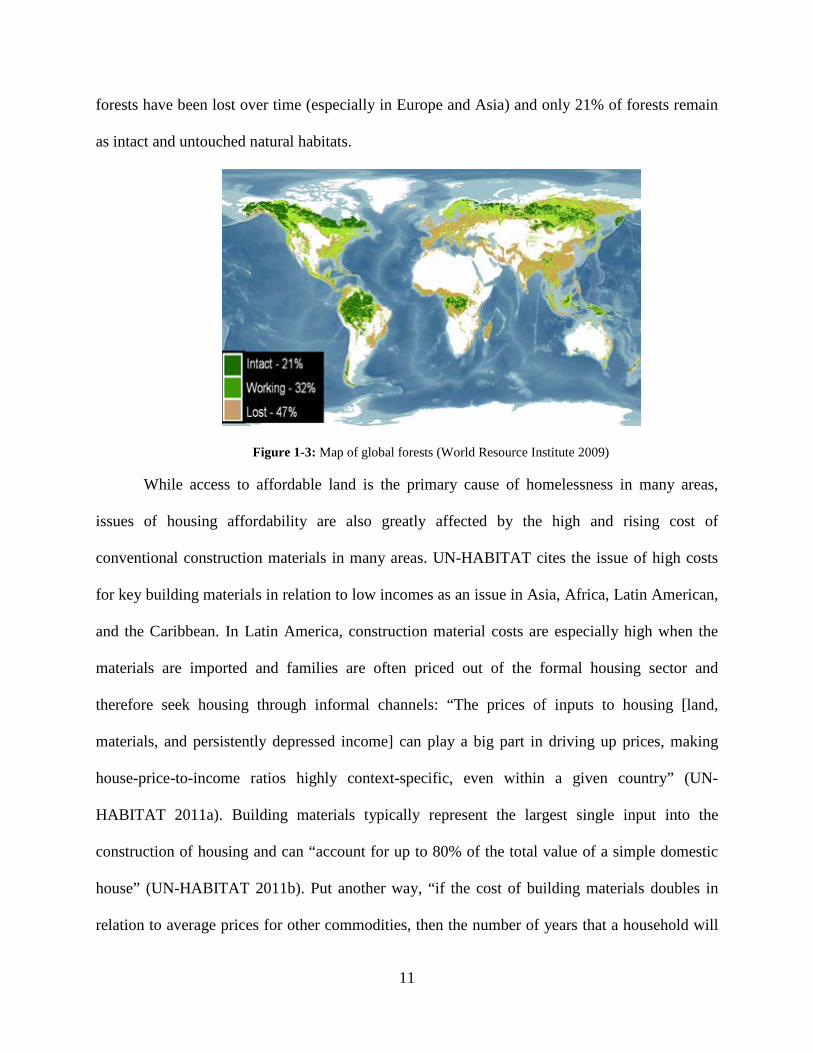
forests have been lost over time (especially in Europe and Asia) and only 21% of forests remain
as intact and untouched natural habitats.
Figure 1-3: Map of global forests (World Resource Institute 2009)
While access to affordable land is the primary cause of homelessness in many areas,
issues of housing affordability are also greatly affected by the high and rising cost of
conventional construction materials in many areas. UN-HABITAT cites the issue of high costs
for key building materials in relation to low incomes as an issue in Asia, Africa, Latin American,
and the Caribbean. In Latin America, construction material costs are especially high when the
materials are imported and families are often priced out of the formal housing sector and
therefore seek housing through informal channels: “The prices of inputs to housing [land,
materials, and persistently depressed income] can play a big part in driving up prices, making
house-price-to-income ratios highly context-specific, even within a given country” (UN-
HABITAT 2011a). Building materials typically represent the largest single input into the
construction of housing and can “account for up to 80% of the total value of a simple domestic
house” (UN-HABITAT 2011b). Put another way, “if the cost of building materials doubles in
relation to average prices for other commodities, then the number of years that a household will
11

have to work to afford the cost of materials will likewise nearly double” (UN-HABITAT 2011b).
This forces populations to seek key housing materials through less expensive informal channels,
such as the supplier in Figure 1-4, to ‘self-build’ informal dwellings. High housing costs in
relation to income is also true in Africa where construction materials costs are increasing from
already high levels; in 2001 urban Africa had the highest regional housing-cost-to-income ratio
globally at 12.5 or 12.5 median annual salaries required to purchase 1 median price home (UN-
HABITAT 2011c). Asian Pacific countries and Arab States had a 2001 ratio of 12.5 and 11.3
respectively while Latin American countries and high income countries had ratios of 5.4 and 5.8
respectively (UN-HABITAT 2011c).
Figure 1-4: Informal material suppliers provide necessary building inputs (UN-HABITAT 2011b).
This increase in cost can be attributed in part to the adherence to using conventional
building materials (steel and concrete) in the formal construction sector even when these are not
the materials best suited for construction in a specific area. Many central and local governments
insist on using conventional building materials and technologies through requirements in their
building codes and regulations “many of which are a colonial heritage and adopted from foreign
countries” (UN-HABITAT 2011b) and “prevent the use of more appropriate, readily available
local building materials [and] …cost-effective and environmentally-friendly construction
technologies” (UN-HABITAT 2011b). In many Asian countries, there are also issues of poor
productivity and other shortcomings due to poor technology capacity in the local building
12

material industry which can lead to shortages and fluctuating prices. However, if countries
invested resources and knowledge in low-income and affordable housing through traditional
building techniques still widely used in Asia and the informal building sector, it is believed these
countries could ultimately stimulate their economies: “Low income housing generates 30% more
worker income than high cost housing [and] …construction in the informal sector [which is more
traditional in nature and more labor intensive] creates 20% more jobs and builds six times more
per dollar spent than formal sector construction” (UN-HABITAT 2011b).
Lack of appropriate standards and buildings codes and conventional building materials is
also a factor in the high construction costs in sub-Saharan Africa as well as a lack of skilled labor
and the high cost of importing and transporting materials. Cement, primary metals, and
construction machinery are often the key building inputs that must be imported in many
countries. Tariffs, foreign exchange rates, transportation, and other import costs all add to the
cost of the construction material. In Kenya and Cote d’Ivoire, 37% and 35% respectively of the
construction materials necessary for a median priced house are imported (UN-HABITAT 2011c).
In Libya, the formal construction sector is focused primarily on concrete based buildings and
technologies. However, in a desert country where water itself is a highly priced and scarce
commodity, a water-based construction material can ultimately also be highly expensive in terms
of initial construction costs. According to UN-HABITAT, some African countries have begun to
look at revising prescriptive building codes and standards for more performance-based
requirements as well as investigating non-conventional materials such as the use of stabilized
soil-blocks in Sudan (UN-HABITAT 2011c).
In addition to accessing housing materials, one final issue involves addressing the
durability of housing in developing areas and informal settlements. As defined in the UN-
13
HABITAT reports, a house is considered ‘durable’ if it has a permanent structure that is
sufficient to protect inhabitants from climatic conditions such as precipitation, heat, cold, and
humidity and the housing is located in a non-hazardous area (UN-HABITAT 2011b). However,
in many cases, only the condition of the flooring material is taken into account and the number of
un-durable dwellings would increase markedly if wall and roof materials and condition were also
surveyed: “For example, when only the floor criterion was used in Indonesia, 84% of dwellings
were considered durable as opposed to 70% when the three components were taken into account”
(UN-HABITAT 2011b). Meanwhile, based on only the floor criterion, 20% of the global urban
population with non-durable housing lives in sub-Saharan Africa.
Ultimately, these issues with global building material resources and high construction
costs showcase a need for changing global policy with regard to providing adequate, affordable
housing to populations. Rather than trying to supplant conventional building techniques and
established building codes from the developed world in developing areas, work should be
focused on providing the appropriate knowledge, skills, design practices, and policies to enable
local populations to use appropriate and affordable local/traditional building materials and
techniques for their region. Building industries which use locally sourced materials and
techniques should be encouraged and strengthened. Practices that promote sustainable and
environmentally conscious construction methods must be promoted. Furthermore, building
codes, regulations, and standard practices should be revised and amended to pursue more
‘performance-based’ criteria and a broadened building material spectrum. Lastly, technical (or
semi-technical) literature and design guidelines which are user-friendly and targeted toward a
local population should be disseminated and proper skills training be provided to local labor in
informal housing sectors (UN-HABITAT 2011b).
14

1.5 SUSTAINABLE DEVELOPMENT WITH BAMBOO
Ultimately, the current status quo is not promoting the principles of sustainable development
which advocates balancing equity, environment, and economy (i.e. the ‘triple bottom line’).
Straining of conventional building materials is producing large environmental impacts through
extraction, manufacturing, and transport. Furthermore, high supply costs and a lack of local
expertise do not provide equity and economy, especially to rural populations, in the form of safe
reliable housing. Bamboo offers an alternative to conventional building materials and practices.
Found in tropical and temperate climates across the globe, this grass has the potential to be an
alternative building product in areas that desperately need reliable building resources. Bamboo is
currently used as a housing material in many regions and much research has been conducted on
its strength properties in both its natural form and in engineered building products. Its qualitative
sustainability benefits have also been highlighted. However, in much of the world, bamboo
remains the ‘poor man’s material’. Removing the stigma and gaining greater engineering
recognition and acceptance for bamboo requires formal quantification of this natural fiber
material with respect to performance, standardization, and sustainability.
Research and standardization of non-conventional materials such as bamboo therefore
serves both a technical and social role as these efforts can promote sustainable practices in
developing regions. This ultimately leads to greater acceptance and utilization. Such acceptance,
coupled with advocacy, can lead to broader social acceptance of previously marginalized
vernacular construction methods. Bamboo offers a low-cost, sustainable alternative for
construction in areas where conventional materials are expensive and/or difficult to obtain.
Through broader utilization, adequate and reliable housing is provided to a greater population
while reducing cultural, environmental, and economic impacts. In his 1981 thesis on bamboo
15

structures, Janssen writes that the full utilization of indigenous material is crucial to increasing
the self-sufficiency of developing countries. Standardization of bamboo test methods and
construction would promote greater equity with adequate housing and standards of living while
also preserving culturally-important vernacular building methods. Use of local bamboo material
also reduces environmental and economic impacts. With standardization of non-conventional
materials like bamboo, the triple bottom line of sustainable development (Figure 1-5) is realized,
especially regarding equity. Figure 1-5 highlights some of the qualitative benefits associated with
using bamboo in the areas of environment, economy, and equity. The purpose of the current
work is to quantify environmental impacts associated with a representative structural bamboo
element and compare it to the impacts of structurally comparable steel and timber components.
The hope is that this quantification and comparison will further highlight the potential of bamboo
with respect to the environment and also facilitate further study of its potential in the areas of
equity and economy.
Figure 1-5: Triple bottom line through standardization and research of bamboo
16

1.6 SCOPE OF DOCUMENT
Bamboo offers great potential as a sustainable alternative to conventional building materials.
However, its use is still often relegated to marginally or non-engineered structures due to gaps in
knowledge of its performance, standardization, sustainability, and utilization. The objective of
this work is to investigate the performance and methods of assessing the performance of
structural bamboo components, namely axial and flexural members in an effort to further the
standardization, design, and use of bamboo structures. The work also aims to quantify the
sustainable benefits and environmental impacts of structural bamboo components as the
qualitative benefits are often highlighted in the literature.
Chapter 2 discusses the composition of bamboo, its major material properties, and its
global resources. An overview of structural applications and structural benefits of bamboo is also
presented to provide an introduction to historical, current, and envisioned uses as a construction
material in its natural form as well as in the form of engineered products. Chapter 2 also presents
an overview of the current standardization of bamboo as a building material as well as the
proposed path to further standardization in its natural form. Discussion is given to the social
benefits of bamboo standardization as well as highlights recent research on developing improved
standard test methods that are both laboratory and field applicable. Gaps in the understanding
and standardization of full-culm bamboo properties are identified and the test methods described
in subsequent chapters are placed in the context of current standard approaches.
In Chapter 3, often overlooked aspects of the typically-used standard tension tests for
bamboo are investigated in a rigorous study. Two parameters associated with the test
arrangement are considered: the orientation of specimen extraction and the degree of rotational
restraint provided by the test machine. Experimental tension tests composed of full thickness
17

radial specimens as well as tangentially oriented specimens are conducted and monitored using a
VIC-3D imaging system in an effort to capture nonlinear strain profiles. Implication of test
arrangement and experimental results are discussed.
The flexural performance of bamboo beam components is discussed in Chapter 4
specifically the study of longitudinal splitting failures and the development of a standardized test
method to address this common limit state. Full scale flexural tests of un-notched and notched
bamboo culm specimens are used to investigate the principle of shear flow within flexural
members in order to develop an improved understanding of bamboo splitting failures.
Experimental tests were conducted at both the University of Pittsburgh (Pitt) and the Pontifical
Catholic University of Rio de Janeiro (PUC-Rio) in Rio de Janeiro, Brazil.
The experimental buckling behavior of bamboo columns, specifically the behavior of
multiple-culm columns is presented in Chapter 5 along with analytical results investigating the
impact of initial curvature, taper, and slenderness on the column performance. Full scale
experimental tests on single culm and multiple culm bamboo columns assessed the strength and
buckling behavior of these components.
Chapter 6 describes a comparative midpoint life cycle analysis that was conducted to
compare the environmental impacts of a representative bamboo column (studied in Chapter 5)
with impacts of structurally comparable timber and steel column alternatives having similar
capacity. The life cycle assessment (LCA) methodology was used to calculate environmental
impacts. Structural design parameters – specifically column height and axial capacity – were
used as the baseline functional units. The use of structural design parameters as functional units
is envisioned to help facilitate a future framework in which sustainability considerations can be
18

better integrated into the structural design process through quantified relationships between
sustainability metrics and properties required in the structural design process.
Finally, Chapter 7 provides a summation of the current work, conclusions on the
potential for and further acceptance of bamboo as a building material and recommendations for
areas of future research.
19

2.0 BAMBOO AND ITS STRUCTURAL APPLICATIONS
Bamboo is found globally throughout the tropics and in some temperate regions. A member of
the grass family, it is utilized throughout the world for a multitude of applications ranging from
food, furniture, clothing, artistic crafts, and paper products. Yet, the primary use of bamboo
continues to be for construction (Lobovikov et al. 2007); it has been used in a variety of
vernacular building techniques in many regions throughout history. Today, due to the lack of
engineering and materials standards, bamboo is most often associated with non-engineered
construction associated with under-developed rural areas and is often superseded in these regions
by conventional materials like concrete and steel. However, bamboo has also been used in major
architectural works as well as for temporary structures such as scaffolding. Contemporary
research is investigating the structural and sustainability benefits of bamboo; many of which
stem from the material’s biological composition. As a structural material, bamboo is comparable
to other conventional materials in terms of most material properties. Outlining a pathway to
standardization ultimately seeks to further acceptance and use of bamboo as a construction
material.
20

2.1 BAMBOO AND ITS RESOURCES
Bamboo is a member of the larger grass family and there are hundreds of species worldwide.
Species range from small diameter ‘reed like’ bamboo to large diameter woody bamboo that is
often used in construction. A functionally graded, natural fiber-reinforced material, bamboo has
evolved in nature to efficiently resist environmental loads such as wind and gravity. Bamboo has
been shown to have mechanical properties comparable to those of conventional building
resources. Additionally, its availability worldwide gives it great potential as a building material.
Bamboo plantations of various sizes can also benefit from the advantageous growing properties
of bamboo and the multitude of uses for the harvest. However, as an organic material, bamboo
must be seasoned and preserved properly for intended uses, especially for exposed structures.
2.1.1 Bamboo Taxonomy and Classification
Bamboo is a member the grass family Poaceae or Gramineae. The family classification is then
divided into sub-families, tribes, sub-tribes, genera, and species (Chapman and Peat 1992). The
bamboo sub-family, Bambusoideae, is associated with the woody culm bamboo and is the “most
primitive subfamily in terms of flower structure” (Chapman and Peat 1992). Bambusoideae is
composed of 13 or 15 tribes based on the two widely used grass classifications from 1992,
Clayton and Renvoize or Watson and Dallwitz respectively (Chapman 1996). The largest tribe,
Bambuseae is the woody bamboo tribe and is divided into various sub-tribes. The sub-tribes are
then divided into multiple genera such as Arundinaria, Bambusa, Chusquea, Dendrocalamus,
Gigantochloa, Guadua, Melocanna, Merostachys, Nastus, Phyllostachys, Rhipidocladum, and
Schizostachyum (Chapman and Peat 1992, Clark and Pohl 1996). An early 1966 estimate by
21

McClure classified bamboo into 63 genera and approximately 700 species (Liese 1987) but this
number has grown to between 1000 and 1500 species (Grewal 2009; Laroque 2007). Common
species of large diameter bamboo used in construction include Phyllostachys heterocycla
pubescens (Moso), Bambusa Stenostachya (Tre Gai), Guadua angustifolia (Guadua), and
Dendrocalamus Giganteus (Dendrocalamus). The experimental portion of this work includes
specimens of Moso, Tre Gai and Dendrocalamus.
2.1.2 Bamboo Anatomy, Structure, and Growth
The two main anatomical features of the bamboo plant are (a) the visible culms or stalks of
bamboo (Figure 2-1) which are ultimately used as the raw material for construction and (b) the
underground rhizome system. Bamboo grows and matures rapidly yet only flowers once in its
lifetime. Most new culm production is achieved through the expansion of the rhizome system.
Figure 2-1: Plantation of Phyllostachys Aurea in Bananal, Brazil
22

2.1.2.1 The Bamboo Culm
For most woody species, the structure of bamboo is composed of culms with solid
transverse diaphragms or nodes separating hollow inter-nodal regions along its height (Figure 2-
2a). Generally, depending on species, the length of internodes between diaphragms increases
along most of the culm height, decreasing as it reaches the very top of the culm (Amada et al.
1996). The circular cross section is composed of unidirectional cellulosic fibers oriented parallel
to the culm’s longitudinal axis embedded in a lignin matrix (Figure 2-2b). Bamboo is a
functionally graded material that has evolved to resist its primary loading in nature: its own self-
weight and the lateral loading effects of wind. As seen in Figure 2-2b, the density of fibers
increases from the culm’s inner wall to the outer wall. In some species such as Tre Gai, the wall
thickness of the bamboo culm will be largest at the base of the culm and decrease with height up
the culm, also demonstrating a naturally efficient use of material to resist overturning due to
wind while reducing gravity loads. Finally, the thin outside layer of the culm wall
(approximately 0.25 mm thick) is dense and contains silica, which serves as good protection for
the plant but can dull tools when bamboo is used in construction (Janssen 2000).
inner wall
outer wall
a) longitudinal section of culm
b) functional gradation of cellulosic fiber from inner to outer culm wall.
Figure 2-2: Composition of a bamboo culm
23

While alive, the culm is both the structural support of the bamboo and the conduit for
water and sap transportation. The culm is composed of approximately 40% cellulose fibers, 10%
vessels and 50% parenchyma tissue (Janssen 2000). The parenchyma tissue matrix in which
fibers and vessels are embedded begins to harden or lignify over time as the culm grows. The
fibers which provide the culm’s strength are grouped around vessels for water and sap transport
in vascular bundles as shown in Figure 2-3 or occur as isolated strands. Figure 2-3 shows that the
conducting vessels are ‘capped’ by the bamboo fibers (darker cells) and surrounded by
parenchyma. The vascular bundles are large and less densely packed near the interior wall while
near the outer wall they become smaller as the vessels decrease in size and become more densely
packed. The vascular bundles are also oriented such that they are ‘strongest’ in the radial
direction of the culm. The size and quantity of vessels decrease with the height of the culm (used
for nutrient transport, their volume may be reduced with increased culm height) and are replaced
with bamboo fibers. This addition of fibers compensates for the loss in strength and stiffness due
to reductions in diameter and wall thickness near the top of the culm (Janssen 2000). Grosser and
Liese (1971) outlined four basic vascular bundle types varying in shape and size and studied how
these are distributed through the cross section and vertically in various bamboo species. They
used the four basic bundle types and their combinations, along with the radial order of vascular
bundles in the cross section to classify species of Asian bamboo from various genera.
24

Figure 2-3: Bamboo vascular bundles (inset from Janssen 1981)
2.1.2.2 The Rhizomes
While the culm is the primary product used for construction and other applications, the
underground rhizome system is equally important as it is responsible for the rapid growth and
production of bamboo culm (sometimes referred to as the bamboo factory). Rhizomes are not a
root but rather an underground stem having nodes and internodes that grows laterally (Clark and
Pohl 1996). As shown in Figure 2-4, there are two basic forms of rhizome systems: leptomorphs
and pachymorphs. A leptomorph rhizome system has larger internodes that grow or ‘run’ out
laterally. New culms grow up and out from lateral buds at each internode perpendicular to this
lateral underground stem. These species, known as running bamboo, can spread widely and are
potentially invasive. The genus Phyllostachys is an example of a running bamboo (Figure 2-5a)
(Clark and Pohl 1996). A pachymorph rhizome system has short and thick rhizomes that grow
out and turn upwards to form new vertical culms. This causes the culms of a plant to be densely
packed or ‘clumped’ together. These species are referred to as clumping bamboo as shown in
Figure 2-5b. Some species have been found to have characteristics of both forms and are
classified as amphimorph rhizomes (Clark and Pohl 1996).
25

Figure 2-4: Leptomorph (left)and Pachymorph (right) rhizome systems (Banik 1995)
a) running bamboo (P. Aurea) b) clumping bamboo
Figure 2-5: Running bamboo and clumping bamboo (photos courtesy of C. Thiel)
The extensive network of bamboo rhizomes effectively binds up the soil to a depth of
approximately 300 mm (Chapman and Peat 1992). This makes removal of bamboo difficult
although planters are investigating ways to use the rhizome material for products (Figure 2-6).
The rhizome system also has potential for providing soil stabilization. Janssen (2000) writes that
there have been cases of bamboo preventing riverbank erosions and therefore protecting villages.
However, while the rhizomes are effective in binding up the soil, the shallowness and density of
the underground system also introduces a potential weak plane between the bound shallow soil
and the soil beneath the rhizomes. In the northeast hill region of India, for example, stands of
26

clumping bamboo are believed to be the cause of slope failures during the rainy season as the
heavy clumps and attendant soil slips along the weak shallow plane beneath the rhizomes.
Figure 2-6: Pile of excavated P. aurea rhizomes and knife crafted from material
2.1.2.3 Bamboo Growth and Flowering
Bamboo is one of the fastest growing plants on earth and species range in size from a few
centimeters to many meters tall. Large bamboo can reach their full height of 15-30 m (49-98 ft)
in a period of approximately 2 to 4 months (Liese 1987). This means bamboo can have a daily
growth rate as high as 20 cm to 100 cm (8-39 in). Dendrocalamus giganteus is the world’s
largest grass with a height of 30-35m (98-115 ft) (Chapman 1996). This type of growth requires
a large amount of stored energy: “Taking also into account their diameter of 5-15 cm, an
enormous biomass must be mobilized from the stored energy in the rhizomes within a short time;
the growing culm itself hardly possesses enough leaves for producing carbohydrates by
assimilation” (Liese 1987).
The primary growth method for bamboo is vegetative reproduction. Rather than regularly
producing flowers and seeds, new culms are produced from the internodes (leptomorphs) or
apexes (pachymorphs) of the rhizomes. This usually occurs during a certain season of the year
27

(Janssen 2000). Vegetative propagation can also be accomplished through the use of cuttings
(culm, branch, or rhizome) from an existing bamboo plant (Liese 1987).
(Lobovikov et al. 2007) (Janssen 2000)
Figure 2-7: Outside view (left) and cross section (right) of a new bamboo shoot
When a new bamboo shoot emerges, it is protected by a rigid sheath of culm leaves
(Figure 2-7). These leaves are shed as the culm develops and matures. The nodes and internodes
(diameter and length) are already defined in the new bamboo shoot and begin to grow and
expand (Liese and Weiner 1996) much like a collapsing telescope that is being stretched open.
Initially the culm diameter is small. Since bamboo culms do not experience cambial growth like
trees, the bamboo creates culms of larger diameter and height only through creation of new
rhizomes from the first shoot. New rhizomes grow out of the base downward into the soil and
then turn upwards to produce a secondary and larger culm. This process is repeated with
successive rhizomes resulting in progressively larger diameter and taller culms until the system
stabilizes at its final culm size (Chapman 1996).
After the initial growth period, the bamboo culm begins to mature. In comparison to
timber which takes more than 10 years (softwood) or 30 years (hardwood) to mature, bamboo
culms mature in only 3 to 5 years depending on species. Unlike timber which continues to
28

produce new tissue radially through the cambium, bamboo does not experience any secondary
growth and all vessels must function through the entire life of the culm.
During this process, lignification of the parenchyma tissue and cell walls continues as
more lignin accumulates. The lignin content of bamboo (20-26%) is similar in value to both
North American softwoods (24−37%) and hardwoods (17−30%) (Li et al. 2007). Studies vary on
how long lignification continues after bamboo reaches its full height. Some state that
lignification is completed after the first year of growth while others state that the lignin content
can continue to increase in fiber and parenchyma cells for one to three and even up to seven
years (Li et al. 2007). Liese and Weiner (1996) saw no increase in the number of lamellae of
fiber walls in specimens of Phyllostachys viridiglaucescens between the third and ninth year. Yet
fiber wall thickness was shown to increase again between years 9 and 12.
Ultimately, the cell wall thickening of bamboo fibers within vascular bundles over time
correlates to an increase in specific gravity and improved mechanical properties (Li et al. 2007,
Liese and Weiner 1996). Therefore it is widely recognized that the mechanical properties of
bamboo improve with age. For specimens of Phyllostachys pubescens grown in the southeastern
United States, Li et al. (2007) showed the specific gravity increased dramatically between years
one and three and only slightly thereafter in years three through five. Lignin content was shown
to stabilize at year three and this was therefore deemed an appropriate time to harvest. Moisture
content decreases during the maturation phase of three years and the amount of cellulose also
decreases in culms after the first year. Mechanical strength also begins to decrease after five
years and especially after bamboo flowering (Liese and Weiner 1996).
Bamboo flowering and seed production occur very rarely. Although some bamboos do
flower and seed frequently, most species only flower once at the end of their 20 to 40 year
29
lifespan. The interesting aspect of bamboo flowering is that most species experience gregarious
blooming where all the member of a species flower at once (Clark and Pohl 1996). This is
irrespective of culm age or distribution over large areas “even over 1,000 km [621 miles]” (Liese
1987). This surge of blooming then exhausts the energy of the plant stored in the parenchyma
cells of the culm and the rhizomes and the bamboo die in mass quantities. The seeds produced
and any old rhizomes that survive the flowering then begin to regenerate the bamboo population
(Clark and Pohl 1996). This mass flowering and die off poses a challenge to commercial
applications of bamboo and the protection of bamboo habitats (and the animals that live in them).
2.1.3 Bamboo Resources
Global bamboo forests not only provide habitats for a range of birds, mammals, insects, and
reptiles but are also one of the top producers of biomass. According to Janssen (2000), bamboo
can produce up to 10 tons of biomass per hectare and accounts for one-quarter of the biomass in
tropical regions and one-fifth in sub-tropical regions. Biomass in the form of fallen leaves helps
to rejuvenate the soil while harvested culms and rhizomes are used in a variety of crafts and
industries. Paired with its rapid renewability, the global availability of bamboo gives it great
potential as a building material.
The world bamboo habitat, as shown in Figure 2-8, encompasses tropical and temperate
climates on all continents except Europe and Antarctica; the world bamboo forest area is
estimated at 62,520 square kilometers (Lobovikov et al. 2007). Most woody bamboo species
grow between the latitudes of 46N and 47S (Laroque 2007). Asia has the highest percentage of
bamboo forest with 65% and the leading country, with 30% of world bamboo resources, is India.
About half of China’s bamboo stock is Phyllostachys edulis, which is the principal source of
30

edible bamboo shoots and is also used for construction (Chapman and Peat 1992, Chapman
1996). Meanwhile, there are more than 100 species of bamboo native to India and bamboo
covers about 13% of the country’s total forest area (Vengala et al. 2008). Common Indian
bamboo species used for construction are Bambusa balcooa, Bambusa bambos, Bambusa tulda,
Dendrocalamus giganteus, Dendrocalamus hamiltonii, and Dendrocalamus asper. The species
Bambusa vulgaris is another common bamboo found throughout the tropics.
Figure 2-8: World Bamboo Habitat (adapted from Laroque 2007)
Figure 2-8 also shows the potential for bamboo in areas such as South America, Africa, and even
the Southeastern United States. Ecuador has 4% of the world’s bamboo forests and Colombia has
approximately 520 square kilometers of native Guadua angustifolia kunt, one of the most widely
used species for construction (Laroque 2007), growing in some regions (Correal and Lopez
2008). Brazil, despite bamboo forest only making up 2% of the country’s total forest area, is said
to have the greatest diversity of bamboo in Latin America with 137 species (Laroque 2007) and
interest in the material is growing rapidly due to its perceived advantages. Bamboo can be grown
in areas of the Southeastern United States, yet the only species native to North America is
31

Arundinaria gigantea, or cane, which grows along rivers and streams or in marshy areas (Clark
and Pohl 1996). Bamboo can also grow outside of the tropics in temperate and even cold
climates: some species of Thamnocalamus can survive at an elevation of 3000 meters above sea
level in temperatures of -20 or -30oC for five or six months of the year in the understory of the
Tibetan pine forest (Chapman 1996).
However, while bamboo species grow and can be grown throughout the world, there are
concerns of depleting its resource base to meet the growing demand for bamboo products.
Janssen (2000) writes that even in countries with large bamboo resources like India and China,
there is a lack of material availability and that natural propagation is not enough to regenerate
bamboo resources for the burgeoning industrial demand: “Active and systematic plantation
programs are required if bamboo is to ever reach a utilization level that does justice to its
potential” (Janssen 2000). Yet, there is also the issue of virgin natural forests being clear cut and
replaced by the very bamboo plantations trying to meet this demand; effectively negating the
environmental benefits espoused by the use of bamboo. Ultimately, a balance must be sought
between harnessing the potential of bamboo use and limiting impacts to natural forest habitats.
2.1.4 Bamboo Harvesting and Seasoning
The harvesting of bamboo occurs through a range of methods and scales. At one end of the
spectrum there is the case of local villagers cutting down bamboo culms by hand from local
stands near the village as needed. On the other end of the spectrum there is the large organized
plantation with industrial equipment and large outputs. The gap between is comprised of a
multitude of homesteads, plantations, and co-operatives of various sizes and shapes. Yet while
32

the means and scale differ, the basic process of harvesting bamboo is composed of cutting,
treatment, and seasoning.
2.1.4.1 Bamboo Propagation and Plantations
As a grass, harvesting of a single culm does not kill the entire bamboo plant as is the case
with timber since culms continue to grow from the underground rhizome system through
vegetative reproduction. Since bamboo rarely flowers over its life and natural propagation takes
time, vegetative reproduction is also used to expand a plantation through the use of both
horizontal and vertical cuttings (Janssen 2000). Other methods of propagation include the offset
method, rhizome method, layering, macroproliferation and tissue culture (Janssen 2000). Typical
vertical cuttings are 2 to 3 internodes in length and planted in the ground much like a tree
sapling. Rhizomes begin to grow downward from the buried bottom node and sprouts grow from
the top nodes. Horizontal cuttings involve burying a length of green culm trimmed of branches
horizontally in the ground. New sprouts and rhizomes then will begin to grow at nodes where
branches were cut. It is good practice to obtain cutting material from various sources to reduce
the impact of gregarious blooming and die-off of the bamboo stock (Janssen 2000).
In most parts of the world, the largest stock of bamboo is still growing in natural forests
(Janssen 2000). Meanwhile, privately owned homesteads are usually only for private use with
little or no material being sold: “the homestead mode turns out to be less profitable only if the
farmer wants to sell the bamboo on the market. The real value of homestead bamboo lies in its
utility to the farmer and his family” (Janssen 2000). Plantations are owned by companies and
cooperatives and the bamboo product is often sold to pulp and paper manufacturers. These
companies need huge quantities of bamboo hence a large amount of land. Janssen (2000) argues
that this huge allocation of land for non-food agriculture poses a major impact and advocates that
33

a more sustainable solution is more local bamboo plantation co-operatives. According to Liese
(1987) chemical fertilization can increase yields by more than 50% and a sustained plantation
yield can be estimated at amount 5-12 tons of air-dry material per hectare. Janssen (2000)
estimates that a well-managed plantation yields as much as 20-30 tons (air-dry) of bamboo per
hectare per year.
In June 2012, the author visited a small privately-owned bamboo plantation,
Bambuparque (Bamboopark) in the Brazilian mountain town of Bananal, São Paulo State,
approximately 150 kilometers from Rio de Janeiro. Owned and operated by Sr. Luis Inglês, the
plantation is 2 hectares (20,000 square meters) in size and grows one commercial species
Phylloyostachus aurea. However, the plantation also has nine other species growing on the
grounds such as Bambusa vulgaris, Bambusa nutenes (native to Brazil), Bambusa tudoides, and
Dendrocalamus giganteus. For the P. aurea, there are approximately 60,000 bamboo culms
growing on the plantation and about 20% are used in a single year. Sr. Inglês (2012) does not use
chemicals for pest control, fertilizer, or irrigation (although the plantation is located along a
mountain stream). The growth season begins in September (Spring) with the sprouting of new
bamboo shoots. No laborers are allowed in the plantation for 2 months during this first phase of
growing to prevent damage to the new bamboo shoots. In 3 to 4 months, the culms reach their
maximum height of 8 to 10 meters. Ultimately, the bamboo is used in furniture products as well
as decorative walls and ceilings for clients in São Paulo and Rio de Janeiro. At the time of the
visit, Sr. Inglês was working on developing a bamboo beach chair at a cost of approximately 120
Brazilian Reais (US$70). Three meter long cuts of bamboo culms are sold in small quantities to
clients for approximately BR$6 (US$3.50) per culm. Currently, Sr. Inglês is supporting the
plantation privately but has the goal of making the plantation commercially sustainable.
34

2.1.4.2 Bamboo Harvesting and Seasoning
Once a bamboo culm has matured 3 to 5 years, it is ready for harvest. One environmental
benefit of bamboo harvesting is that there is no clear cutting of large areas. Rather the mature
culms are selectively cut while remaining culms continue to grow and mature. This keeps the
environment and habitat of the bamboo forest or plantation intact (Janssen 2000) and ensures a
continuous supply of new culms, maturing culms, and culms ready for harvest.
Harvesting can be done manually with hand cutting tools or using mechanical equipment
depending on the scale and location of the plantation. At Bambuparque, a small chainsaw is used
to harvest culms of P. aurea (Figure 2-9a and b) and culms are cut to standard 3 meter lengths
(Figure 2-9c). Culms are harvested at 5 years of age from May till September (winter) when the
bamboo has the least water and starch and therefore greatest durability against insects and fungi.
Culms are cut at a node to prevent water infiltration and rot in the remaining stump. Sr. Inglês
also only harvests between the third quarter and new phases of the moon; a practice believed to
reduce starch content yet no correlation between durability and moon phases is established
(Janssen 2000). Any harvested culms of inferior quality are used as firewood. After treatment of
the bamboo, the culms are stacked in an open shed to air dry (Figure 2-9d).
a and b) harvesting P. Aurea c) cutting to 3m length d) stacked for drying
Figure 2-9: Harvesting and seasoning P. aurea at Bambuparque (courtesy of L. Inglês)
35

Air drying and kiln drying are the common methods of seasoning bamboo. Air drying
typically takes 6 to 12 weeks while kiln drying in thermally insulated chambers takes 2 to 3
weeks (Laroque 2007). For air drying, the primary concern is that culms are protected from the
elements (i.e. rain) with a roof or canopy and have the ability to dry quickly if exposed to
moisture. Culms should also be laid horizontally with sufficent room to provide air movement
and be free from soil (Janssen 2000). Bamboo often needs a longer drying period than
conventional timber due to its higher moisture content (Liese 1987). With this initial high
moisture content, bamboo experiences a large amount of shrinkage during seasoning; this leads
to the issue of cracking and even collapse. The bamboo tissue primarily shrinks in the radial
direction of the cross section (Liese 1987) with thick walled bamboo being more susceptible to
cracking than a thin walled species.
2.1.4.3 Bamboo Treatment and Preservation
Untreated, the durability of bamboo varies based on the species, age, and conservation
actions taken (Ghavami 2008). In the open and in contact with soil, bamboo is estimated to last 1
to 3 years; 4 to 6 years if under cover and free from soil contact (Janssen 2000, Jayanetti and
Follett 2008). Only under very good storage/use conditions is untreated bamboo estimated to last
10 to 15 years.
The main culprits in bamboo degradation are water ingress, fungal attack, and infestation
by insects and rodents. Fungi and insects are attracted to the starch content in the culm and
animals can nest in hollow internodes. These issues are combated by the proper design and
detailing of structures (Janssen 2000, Jayanetti and Follett 2008). Best practices include roof
overhangs, good air circulation, drainage, the plugging of open culm ends, and ensuring no
contact between a bamboo structure and soil (termite prevention). Janssen (2000) states bamboo
36

has less natural durability than most woods due to the absence of certain chemicals yet Li et al.
(2007) states that extractive contents analogous to both trees and bamboo may help with natural
decay resistance.
Ultimately, treatment processes can greatly extend the life of bamboo culms and their
corresponding structures. Janssen (2000) writes that, while the price of bamboo increases
approximately 30% with preservation treatment, the service life can be increased to 15 years in
exterior exposure and to 25 years under cover. Preservatives range from oil based, oil soluble,
water soluble, tar oil and boron-based chemicals, all of which are relatively safe options
(Jayanetti and Follett 2008). Boron based chemicals such as borax and boric acid are also
considered effective and inexpensive. The high silica content of the outer layer of bamboo, while
providing good resistance to water and insects, also prevents infiltration of preservative. The
inner layer of bamboo is also impermeable (Janssen 2000). Infiltration of preservative can only
occur through the ends of the culm and the conducting vessels. These vessels close within 24
hours of harvest and therefore treatment process must occur shortly after harvest and before
seasoning (Janssen 2000).
Preservation methods range in technique and complexity. Traditional methods include
curing, smoking, soaking, and lime-washing of bamboo. Traditional soaking involves
submerging culms in water for 6 weeks during which water soluble starch is removed from the
culm. The dip diffusion method involves immersing bamboo in a chemical solution bath. In the
rural village of Camburi, Brazil, culms are soaked for 2 weeks in a stone pool (Figure 2-10a)
filled with a solution of water and disodium octaborate tetrahydride (Octabor). Small holes are
drilled into each internode for the solution to penetrate inside the culm. The vertical soak
37

diffusion method involves hanging bamboo culms, which have all nodes punctured except the
final node, vertically and pouring a chemical solution onto them (Adhikary 2008, Janssen 2000).
Fire treating of bamboo culms is another simple method that works for species such as P.
aurea. At the plantation in Bananal, Brazil, the culms are washed thoroughly and then heated
with a simple hand torch and propane tank (Figure 2-10b). The culm begins to sweat
pyroligneous acid which is diluted with a kerosene soaked rag and spread over the culm surface.
This acts as a protective varnish for the bamboo culm. The process takes approximately 15
minutes per 3 m long culm (32 culms per 8 hour day); one tank of propane, estimated to be a
standard 9.1 kg (20 lb) tank, can treat approximately 200 culms.
Another common method for treating bamboo is the modified Boucherie method. This
method passes a pressurized chemical solution through the conducting vessels of the culm to
replace the existing sap (Adhikary 2008). Figure 2-10c shows the basic equipment needed for a
field setup. A pressurized tank holds the chemical solution such as a boron compound. An
airtight rubber nozzle is then attached to one end of the bamboo culm. The chemical compound
is forced through the culm to replace the natural sap which seeps out the opposite open end of the
culm. Once all the sap has been removed and replaced with preservative, the culm is stored for
drying and seasoning. This system can be set up locally in rural communities and has been
shown to treat 1200 culms per month (Adhikary 2008). A fast and effective process, the system
only needs simple instruction to operate. Additionally, a range of preservative solutions can be
used including cow urine or neem oil. The Boucherie method only requires that the bamboo be
treated immediately after cutting and a sufficient number of culms are available to be cost
effective.
38

a) stone submerging pool for treating with a
solution of water and Octabor
b) fire treatment of P. aurea
c) modified Boucherie method (Adhikary 2008)
Figure 2-10: Bamboo treatment processes
2.1.5 Mechanical Properties of Natural Bamboo
Bamboo is a promising engineered construction material because it has mechanical
properties comparable to those of conventional building materials. While specifics of the
mechanical properties of bamboo are discussed in detail in the pursuing chapters, these
properties are highly correlated to the percentage and distribution of bamboo fibers within the
culm cross section. Mechanical properties are influenced greatly by the specific gravity, which
depends on fiber content, fiber diameter, and cell wall thickness (Janssen 2000). The density of
39

most bamboos is 700 – 800 kg/m3 but depends on species, growing conditions, and even the
position in the culm. The fibers are approximately 60 – 70% by weight of the culm tissue. The
density or volume fraction of fibers is approximately 60% at the exterior face of the culm wall
and 10-15% at the interior face. Density also increases along the height of a culm (Janssen 2000,
Amada et al. 1996). The fiber length is longest in the middle of the culm wall section and is
shorter at both the inner and outer wall faces. The shortest fibers are always at nodes. Janssen
(2000) states the longitudinal modulus of elasticity is correlated to the number of vascular
bundles per mm2, while the elastic bending stress (modulus of rupture) relates to fiber length.
2.1.5.1 Modulus of Elasticity
For the modulus of elasticity, research has focused on developing equations to account
for the number and gradation of the bamboo fibers which effect stiffness. Janssen (2000) states
that the functional gradation of fibers in the cross section increases stiffness by 10% as compared
to an even distribution of the same volume of fibers. Using an elastic modulus of 70,000 N/mm2
for cellulose and assuming a bamboo fiber is 50% cellulose, the apparent or effective modulus is
E=35,000 N/mm2. This number is then be multiplied by the percentage of fibers in the outer and
inner layers of the culm (Janssen 2000). Another technique is to determine the volume fraction of
the bamboo fibers across the wall thickness. This volume fraction is then used with the rule of
mixtures to determine the modulus of elasticity across the wall thickness (Amada et al. 1996,
Ghavami et al. 2003, Ghavami 2008, Li and Shen 2011).
2.1.5.2 Flexural Strength
Janssen (2000) estimated the bending stress at failure for air-dry bamboo as 0.14 times
the density in kg/m3. However, in typical bending tests, the mode of failure is not fracture of the
40

fibers but rather longitudinal splitting of the material due to fracture of the weaker lignin bonding
the fibers together. This is due to the shear in the section (i.e.: VQ/It shear) overcoming the
capacity of the relatively weak lignin. Janssen (2000) gives a critical value of transversal strain
as 0.0013 for establishing the bending capacity of bamboo. Using a Poisson’s coefficient of 0.3
and a modulus of E = 17000 N/mm2, a critical longitudinal strain of 0.00373 and an ultimate
bending stress of 62 N/mm2 are estimated, “a typical outcome” in tests (Janssen 2000).
2.1.5.3 Compression Strength
The compression strength of full-culm bamboo has been studied by multiple authors. As
with bending strength, Janssen (2000) estimated the ultimate compressive stress of air-dry
bamboo as 0.094 times the density in kg/m3. During a typical compression test, the specimen
often develops vertical cracks and bulges laterally (like a wooden barrel). The friction caused by
contact with the loading plates holds the specimen together and can be a factor in the reported
compressive strength value. Therefore, Arce-Villalobos (1993) called for the use of friction-free
loading plates during testing. Arce-Villalobos (1993) also states that lignin plays a large role in
bamboo failure under compression as tangential expansive forces lead to critical tangential
strains.
2.1.5.4 Tensile Strength
The tensile strength of bamboo has been shown to be quite high and vary widely between
species. Bamboo has been cited as having tensile strength similar to mild steel in some cases
(Laroque 2007). As with Young’s modulus, tensile strength is influenced primarily by the
bamboo fiber volume ratio (Janssen 1981). Amada et al. (1996, 1997) studied tensile specimens
from two year old Phyllostachys edulis Riv. (Mousou bamboo) and found that the tensile strength
41
of the bamboo (140-230 MPa) was greater than that of common woods such as fir, pine, and
spruce (~30-50 MPa). Using the rule of mixtures, the tensile strength of the lignin matrix was
estimated to be 50 MPa and that of a vascular bundle to be 610 MPa (12 times larger). The
tensile modulus of elasticity was 2 GPa and 46 GPa for the matrix and bundle respectively
(Amada et al. 1996, 1997). Due to their entangled fibers, bamboo nodes show more isotropic
behavior and lower tensile strength (Amada et al. 1997).
While bamboo has good tensile strength in the direction of the fibers, a more critical
value of bamboo strength is the tensile strength perpendicular to the unidirectional fibers. When
tension is applied in the transverse direction, only the lignin matrix acts to resist the applied
stress. This leads to splitting and cracking failures. Studies have shown that bamboo fails at a
specific transverse strain of approximately 0.001 and that this value should be used as a limiting
criterion for design (Arce-Villalobos 1993). This value can also be correlated to performance in
the longitudinal direction since bamboo has a stable Poisson’s ratio of approximately 0.3
(Janssen 1981).
2.1.5.5 Shear Strength
As described above, the strength of the lignin matrix is often the limiting factor for
strength. Therefore, longitudinal splitting and shear strength are important characteristics for
bamboo used in construction. In comparison with timber, the hollow cross section of the culm
has less area to resist shear than timber although bamboo does not have defects such as knots.
However, since bamboo fibers are only oriented in the longitudinal direction, there are two
asymmetric shear planes in bamboo: a shear plane across the cross section of the culm and a
shear plane parallel to the fibers. For a bamboo culm in flexure, Janssen (2000) estimates the
critical shear stress at the neutral axis as 2.2 N/mm2.
42

2.1.5.6 Commentary on Bamboo Material Properties
As can be seen in previous sections, a great deal of what is known of the material
properties of bamboo consist of ‘rules of thumb’ or gross generalizations. Single values of
limiting strain and properties estimated as a function of density – a value known to vary
considerably based on many parameters – are not conducive to engineering standardization,
particularly for the many bamboo species viable for construction applications. This work, along
with those of Mitch (2009, 2010) and Sharma (2010), attempts to provide a framework for a
better understanding and ultimately standardization of bamboo material properties and tests to
determine them. The standardization philosophy is described in greater depth in Section 2.3 and
Harries et al. (2012).
2.2 STRUCTURAL APPLICATIONS OF BAMBOO
The applications of bamboo material in construction are numerous. While many think of bamboo
in the form of the proverbial bamboo hut, the material is used in a range of temporary and
permanent structures in both natural and engineered forms. The following section focuses
primarily on bamboo structures constructed with full-culm bamboo. The use of full-culm
bamboo is often limited by the jointing techniques used or available and therefore a discussion of
this topic is also provided. Another key aspect of the potential of bamboo structures is their
ability to provide hazard mitigation and performance during extreme loading such as seismic
events. Finally, mention is given to engineered bamboo products as well as the use of bamboo
with other materials such as concrete and timber in the form of composites.
43

2.2.1 Bamboo Structures
The primary use of bamboo is in construction and its utilization encompasses a wide range of
applications and forms, both temporary and permanent. For the current discussion, attention is
focused on the use of natural full-culm bamboo rather than engineered bamboo products.
Bamboo scaffolding (Figure 2-11) continues to be used throughout Southeast Asia and
has traditionally been used in countries like China, India, and Thailand (Janssen 2000). One of
the advantages of bamboo scaffolding is its capacity and reliability in resisting hurricane force
winds (Janssen 2000, Chapman 1996). Jayanetti and Follett (2008) cite non-standardized jointing
techniques and lack of durability as issues hindering wider acceptance of bamboo scaffolding.
(Lobovikov et al. 2007)
Top of high rise in Hong Kong (van der Lugt et al.
2006)
Figure 2-11: Examples of bamboo scaffolding in Southeast Asia
In most cases, bamboo is used for the construction of houses and community buildings
like the ones shown in Figure 2-12. Figure 2-12a showcases a bamboo schoolhouse in the village
of Mungpoo, India. Composed of a bamboo frame, simple multiple-culm bolted connections are
used for connections to framing members. Four-culm columns are founded on concrete plinths
having reinforcing bar extending and grouted into each culm (Mitch 2010). The structure shown
in Figure 2-12a is the prototype for the multiple-culm column experimental study described in
44

Chapter 5. Panels of woven bamboo strips are then used for the infill walls. The school is
committed to sustainability and plans to construct all of its buildings using locally sourced
bamboo. Figure 2-12b is a picture of the bamboo community center in the rural coastal village of
Camburi in São Paulo State, Brazil. The center was constructed by the Belgium organization
Bamboostic with the goal of promoting construction in the village using local stocks of bamboo
(Choi et al. 2011, Ghavami 2008). Culms of Guadua angustifolia (Guadua) and Phyllostachys
pubescens (Moso) were used in the construction as well as compacted earth bricks and terracotta
roof tiles. Culms were treated on site in a stone pool with a chemical solution immersion bath
(Fig. 2-12a). The one-story structure, which holds 3 classrooms, 2 bathrooms, an office, and a
multipurpose room, is composed of four-culm bamboo columns embedded in sand within a brick
plinth, bamboo beams, and bamboo roof trusses. Bolted connections are used for the bamboo
components while compacted earth bricks are used to form exterior half partition infill walls.
The combination of a bamboo frame and roof with masonry and plaster walls is also seen in
houses in India (Fig. 2-12c) and Latin America (Fig. 2-12d).
45

a) St. Joseph’s School in Mungpoo, India
(photo: B. Sharma)
b) village community center in Camburi, Brazil
(photo: B. Sharma)
c) bamboo house in India (Lobovikov et al. 2007)
d) bamboo house in Latin America (van der Lugt 2009)
Figure 2-12: Examples of bamboo housing
The construction of bamboo housing as well as community, school, and farm buildings is
often related to the rural environment of the communities in which they are located: “The
majority of bamboo construction relates to rural community needs in developing countries. As
such, domestic housing predominates and, in accordance with their rural origins, these buildings
are often simple in design and construction relying on a living tradition of local skills and
methods” (Jayanetti and Follett 2008). However, bamboo has also been applied in the
construction of larger architectural works. Figure 2-13a shows the large bamboo bridge at the
Cross Waters Ecolodge in Quangdong Province, China. It was designed by the renowned
Colombian architect Simon Velez. Velez has constructed other large exhibition structures in
bamboo such as the Church without Religion in Cartagena, Colombia (Fig. 2-13b) and the ZERI
46

Pavilion for the 2000 World Expo in Hanover, Germany (Fig. 2-13c). Another example of
bamboo architecture is the Green School in Bali, Indonesia which constructed all of its buildings
with local bamboo (Fig. 2-13d).
a) bamboo bridge at the Cross Waters Ecolodge,
Quangdong Province, China (Grewal 2009)
b) Church without Religion, Cartagena, Colombia
(www.archleague.org/2011/02/simon-velez/)
c) ZERI Pavilion for the 2000 World Expo,
Hanover, Germany (van der Lugt et al. 2006)
d) Green School, Bali, Indonesia
(www.greenschool.org)
Figure 2-13: Examples of Large Architectural Bamboo Structures
In the context of bamboo housing, full–culm bamboo can be used for a range of structural
components. Examples of bamboo foundations include direct contact bearing foundations (not
preferred for durability considerations); bearing on stone or concrete footings (with or without
dowel bars embedded into bamboo culm); bamboo embedded into concrete footings, bamboo
reinforced concrete, and use of bamboo with steel shoes (Jayanetti and Follett 2008). The floor
structure may consist of bamboo beams and joists with smaller culms, bamboo mats, bamboo
47

panels, or bamboo boards used as decking. Bamboo roofing often employs full-culm rafters or
trussed systems with bamboo tiles, shingles, or mats as covering (Jayanetti and Follett 2008).
Thatched roofs are also seen in bamboo structures in India and Southeast Asia (Fig. 2-13d)
(Vengala et al. 2008).
Full-culm bamboo is most extensively used for wall and partition construction; often as
framing paired with an infill material. This infill can take many forms: whole or halved bamboo
culms, bamboo mats, split bamboo, bamboo with plaster, woven bamboo, bamboo panels, wattle,
etc. (Jayanetti and Follett 2008). In northeastern and southern parts of India, housing consists of
bamboo with reinforced mud walls (Vengala et al. 2008). Forms of wall construction range from
traditional Bahareque and Quincha to modern grid and pre-fabricated systems (Paudel 2008).
Bahareque and Quincha systems were developed in Latin American and involve a combination
of bamboo laths or flattened bamboo with mud, plaster, or concrete mortar. In solid wall
Bahareque, horizontal bamboo laths are attached on both sides of the bamboo framing and the
interior wall cavity is filled with mud. In the hollow wall system, the horizontal bamboo laths are
simply covered over with plaster or cement mortar (Paudel 2008). Modern grid and pre-
fabricated systems involve a combination of wood, bamboo, plaster and mortar to create infill
wall panels.
In addition to buildings, bamboo bridges (Fig. 2-13a) and space structures are two other
structural forms that have garnered attention from researchers and designers. Jayanetti and
Follett (2008) state that bamboo bridges are generally of trestle construction and limited span for
mostly pedestrian use. However, Laroque (2007) designed and studied the use of a suspended
bamboo footbridge and states that bamboo can be used in girder bridges, suspended trusses,
arches, and suspension bridges. The covered bamboo arch bridges of Jörg Stamm in Colombia
48

can reach a span of 52 m (171 ft) and carry a 2 ton truck (Laroque 2007). Meanwhile, bamboo
space structures have been studied as a solution for large span coverings (Ghavami 2008,
Ghavami and Moreira 1993, Moreira and Ghavami 2009). Ultimately, bamboo was shown to be
adequate for the elements of the space structure, but more research and design is needed to
improve the strength and performance of connection points as experimental tests showed shear
stress failure at connections.
2.2.2 Bamboo Jointing Techniques
Effective jointing in structures requires careful design, research, and practice; this is especially
true for bamboo structures. Bamboo jointing techniques must not only account for the tubular
form of bamboo but also the variability in size along the culm and among various culms and
species (Jayanetti and Follett 2008). The splitting and crushing strengths of bamboo are specific
concerns for the design of effective joints. Ultimately, the greater acceptance and utilization of
bamboo in building larger, engineered, durable, and efficient structures will depend on
developments, research, and improvements in bamboo jointing (Janssen 2000, Jayanetti and
Follett 2008).
Janssen (1981, 2000) classified bamboo jointing techniques into eight categories based on
how forces were transmitted between the bamboo culm and the joint. The five most common
categories are illustrated in Figure 2-14. Category 1 involves engaging the entire bamboo culm
cross section in contact through bearing (Fig. 2-14a) while category 2 (Fig. 2-14b) is composed
of joints which transfer load from the inside hollow of the culm to a parallel element through a
fill material (e.g. wood or cement mortar). Category 4 (Fig. 2-14c) uses parallel elements to
transfer loads from the cross section (often attached by pins) while category 5 uses pins or bolt
49

elements perpendicular to the culm to transfer load from the cross section (Fig. 2-14d). Category
6 involves using parallel elements that transfer load between the outside of the culm and the joint
(Fig. 2-14e). Categories 3, transfer from inside the culm to a perpendicular element, and 7,
transfer from outside to an element perpendicular, are not often seen according to Janssen (2000)
while category 8 is reserved for split bamboo connections.
a) Category 1 example: lashed
bearing connection
b) Category 2 examples: plug (top) and
grouted dowel (bottom) connections
c) Category 4 example: taper-wedged fishmouth connection
d) Category 5 examples:
pinned or bolted connections
e) Category 6 example: ‘swaged’ connection
Figure 2-14: Categories of typical joints as drawn by Janssen (2000, 1981).
Ultimately, each category of joint may be comprised of either traditional jointing
methods or more modern innovative alternatives. Traditional joints are often in the form of
bearing connections or connections using lashing. Lashing is still one of the most widely used
methods for joining bamboo as it can be fast, inexpensive, and easy to fabricate (Jayanetti and
Follett 2008). This technique is often used in the tall temporary scaffolding structures seen in
Southeast Asia (Arce-Villalobos1993). The lashing is often traditionally made from organic
fibers like bamboo, rattan, coconut or palm; however, plastic or steel wires are also being used to
50

lash bamboo components. With organic lashing, the fibers are soaked before application and
tighten around the bamboo as they shrink during the drying process.
However, is many cases, lashing does not provide adequate stiffness at the structural
joint and alternative joints are sought. Bolts and pins (either wood or metal) are often used (Figs.
2-14c and d) along with metal or wooden gusset plates but also reduce the capacity of the
bamboo component due to the potential for splitting failures at the joint. Since bamboo culms
have variable cross sectional diameter, bolted connections are often designed with overlapping
culms (Fig. 2-14d), which can create large joints, hinder modulation and prefabrication, and
leads to eccentricities (Arce-Villalobos1993). On the other hand, well designed multiple pin
joints may be used to develop efficient moment-resisting connections (Sharma 2010).
Plug connectors (Fig. 2-14b) of wood or cement mortar with an embedded metal
component have an advantage of filling in open ends which helps to improve durability but, in
the case of cement mortar, shrinkage and splitting (as the mortar draws moisture from the culm)
are potential drawbacks (Janssen 2000). Mitch (2010) studied the performance of dowelled and
grouted bamboo column bases (similar to Fig. 2-14b) subject to transverse forces and
overturning moment. The connection was composed of the lower internodes being filled with
cement mortar with a steel reinforcing bar embedded in the mortar plug. Due to shrinkage of the
mortar, capacity was governed by the number of nodes engaged by the mortar plug; each node
created a shear key of sorts. Arce-Villalobos (1993) proposed the used of wood plugs inserted
into the open end of the culm affixed with various wood or steel connecting plates depending on
the specific design of the central joint (Fig. 2-15). The joint works to take advantage of bamboo’s
strength properties in the longitudinal direction and protect the open end of the culm for
infestation and moisture. Meanwhile, the wood and steel connectors can be glued into place with
51
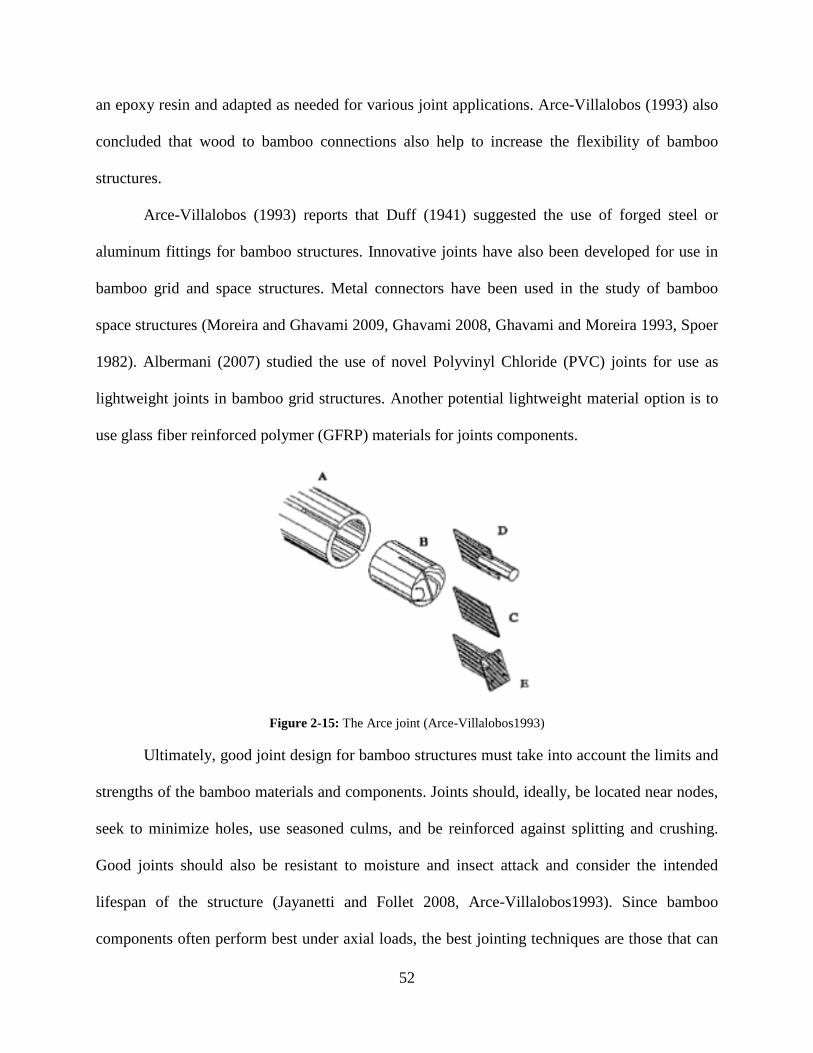
an epoxy resin and adapted as needed for various joint applications. Arce-Villalobos (1993) also
concluded that wood to bamboo connections also help to increase the flexibility of bamboo
structures.
Arce-Villalobos (1993) reports that Duff (1941) suggested the use of forged steel or
aluminum fittings for bamboo structures. Innovative joints have also been developed for use in
bamboo grid and space structures. Metal connectors have been used in the study of bamboo
space structures (Moreira and Ghavami 2009, Ghavami 2008, Ghavami and Moreira 1993, Spoer
1982). Albermani (2007) studied the use of novel Polyvinyl Chloride (PVC) joints for use as
lightweight joints in bamboo grid structures. Another potential lightweight material option is to
use glass fiber reinforced polymer (GFRP) materials for joints components.
Figure 2-15: The Arce joint (Arce-Villalobos1993)
Ultimately, good joint design for bamboo structures must take into account the limits and
strengths of the bamboo materials and components. Joints should, ideally, be located near nodes,
seek to minimize holes, use seasoned culms, and be reinforced against splitting and crushing.
Good joints should also be resistant to moisture and insect attack and consider the intended
lifespan of the structure (Jayanetti and Follet 2008, Arce-Villalobos1993). Since bamboo
components often perform best under axial loads, the best jointing techniques are those that can
52

resist these axial forces and their reactions in bamboo elements (Arce-Villalobos1993). Joints
must also account for bamboo’s weak splitting strength (at bolts) as well as its open ends.
Standard design rules and good practice need to be established. Arce-Villalobos (1993) also
argues that good joint design must be simple since the construction of bamboo structures often
involves an untrained workforce and limited equipment.
2.2.3 Hazard Mitigation and Disaster Relief through Bamboo Structures
In many rural and developing areas, populations seek the conventional ‘advanced’ materials of
steel, concrete, and masonry which are perceived to be durable and perform better during natural
disasters like earthquakes. However, the technological knowledge and established methods of
design practice often do not accompany the ‘advanced’ materials to these areas which leads to
poorly built construction and ultimately greater damage and loss of life during seismic events.
Another area of concern is the rebuilding of housing after a natural disaster and often the large
shipments of conventional materials over long distances. Bamboo structures, which have the
advantage of a lower mass than masonry and concrete structures (Vengala et al. 2008, Sharma
2010), have the potential to not only provide long term seismic performance of buildings but also
to improve or expedite aid response in disaster relief efforts.
The effective seismic performance of bamboo housing has been illustrated in various
field studies and research projects. Kaushik et al. (2006a, 2006b) conducted a field study of
seismic damage following the magnitude 5.7 February 14, 2006 earthquake in Sikkim, India. As
shown in Figure 2-16, masonry and reinforced concrete structures experienced significant
damage while traditional Ikra style houses constructed of a bamboo frame with bamboo lathe
infill performed well during the seismic event. The authors cited a lack of standard practices for
53

masonry and concrete construction as well as poor construction features such as floating
columns, intermediate soft stories in reinforced concrete frames, and poor reinforcement
detailing as the cause of seismic vulnerability in the region: “Except for a few [reinforced
concrete] buildings involving major projects, analysis and design are generally not carried out;
structural drawings are prepared simply based on previous experiences of engineers on the basis
of a few [rules-of-thumb]” (Kaushik et al. 2006b). The authors also conclude that the amount of
damage was disproportionate to the moderate magnitude of the earthquake. A larger, magnitude
6.9, earthquake struck northern Sikkim September 18, 2011. Similar damage patterns (although
more significant) were reported in preliminary reconnaissance reports (Murty and Sheth 2012).
Significantly, Murty and Sheth conclude: “There should be an aggressive promotion of
traditional [Ikra] housing by development of a manual of good construction practices and
inclusion of this as a formal housing construction typology eligible for bank loans”.
a) damaged concrete structure b) damaged masonry structure c) traditional Ikra structure Figure 2-16: Typical residential structures following the 2006 Sikkim earthquake (Kaushik et al. 2006)
54

Janssen (2000), in researching the National Bamboo Project of Costa Rica, notes the
survival of 20 bamboo houses near the epicenter of the April 22, 1991 magnitude 7.5 earthquake.
Vengala et al. (2008) notes that a bamboo test house, 2.7m2 in size, was able to resist shake
table-applied loads equivalent to the magnitude 7.8 Kobe earthquake without experiencing any
damage. Bamboo bahareque structures, with varying combinations of timber, bamboo, and
mortar, are also used extensively throughout Latin America, and are considered to have good
performance during seismic events (Gonzalez and Gutierrez 2005, Guitierrez 2004). Work has
been done to experimentally test and model the seismic performance of bamboo portal frames
based on those found in and subject to the 2006 Sikkim earthquake (Sharma 2010).
In addition to long term seismic performance, bamboo structures also have potential as
both temporary and permanent shelter in disaster relief efforts. Rather than shipping large
quantities of conventional material, local bamboo can be used along with imported knowledge
and construction guidelines/training to provide faster disaster responses (Brown et al. 2012).
Bamboo gridshell structures are one potential option for these temporary shelters. The use of
local building material may result in improved local resiliency and a more sustainable transition
from temporary buildings to the construction of more permanent bamboo structures.
2.2.4 Engineered Bamboo Products
Bamboo has been used most often in its natural form much like timber but there is also a large
amount of research addressing engineered bamboo products. These typically comprise a
composite of bamboo and a binding resin. Glue laminated bamboo (‘Glubam’) or laminated
bamboo lumber (LBL) is developed much in the same way as glue laminated lumber. Xiao et al.
(2008, 2010) developed Glubam using 2,440 mm by 1,220 mm (8ft by 4ft) bamboo veneer sheets
55
(bamboo ‘plywood’) that are finger jointed and cold pressed. Through this process, girders were
produced, tested, and used in the construction of a Glubam girder bridge able to carry an 8 ton
two axle truck. Xiao et al. (2008) have also constructed a pedestrian bridge, a single story house,
and a two-story house using Glubam components. LBL is used in the US for such non-structural
components as flooring, countertops, and railings but has been shown to have structural
properties and quality similar or better to wood lumber (Rittironk and Elnieiri 2008). Bamboo
plywood is also formed from the lamination of bamboo strips into sheets (van der Lugt 2009).
China is the leading producer of bamboo board and flooring material as well as woven bamboo
mats. Other engineered products include bamboo mat board, bamboo mat veneer composite,
bamboo mat corrugated sheets (roofing material), bamboo sliver laminated lumber, strand woven
bamboo, and bamboo particle board similar to wood oriented strand board (OSB) which all
attempt to optimize strength and utilize more of the raw bamboo culms in production (Guan and
Zhu 2008, van der Lugt 2009, Vengala et al. 2008).
2.2.5 Composite Bamboo Products and Systems
Research has also been conducted on using bamboo in composite systems with other
materials; these include bamboo reinforcement in concrete and in composite timber or steel
assemblies. The US Navy studied the use of bamboo reinforcement in concrete in the 1960s
(Brink and Rush 1966). Bamboo reinforcement in concrete has been studied in many different
forms including split bamboo as reinforcement embedded in concrete beams, concrete slabs with
permanent bamboo shutter forms, and bamboo reinforced columns with permanent shutter forms
(Ghavami 2005, 2008). With permanent shutter forms (often also referred to as stay-in-place
forms), the half-culm bamboo acts as formwork during the placement of the concrete and
56

remains afterward as permanent reinforcement. Ghavami (2005, 2008) studied bamboo shutter
forms where the nodal diaphragms were left in place to act as shear connectors with the concrete.
Strips of steel or bamboo can also be added close to nodal diaphragms to increase the shear
transfer. Sudhakar et al. (2008) used vertically oriented concrete ties at intervals along the span
to tie an arrangement of four bamboo culms into a composite bamboo beam. Gupta et al. (2008)
used a similar approach using horizontal concrete ties to tie four culms together into a single
composite column. Iyer (2002) investigated the use of bamboo strips as embedded reinforcement
in masonry for improved seismic performance. One of the main concerns with using bamboo as
concrete reinforcement is the high water absorption of bamboo which causes expansion of the
reinforcement (and vice versa when dried) (Ghavami 2008).
In timber assemblies, bamboo boards and pins/nails have been used in timber structures
for connections (Mori et al. 2008) and bamboo nails were often used in ancient Japanese
construction. Modern bamboo connectors which also employ adhesive have been designed for
timber pavilion structures (Inoue et al. 2008). Bamboo and timber plies have also been used to
form composite sandwich panels. Finally, Li et al. (2008) studied a bamboo and steel composite
floor slab composed of two bamboo panels and a profiled steel decking sheet.
2.3 THE PATH TO STANDARDIZATION
Standardization of testing and design practices is necessary not only to advance the use
and acceptance of a technology but also to ensure the safety of the population using the
technology. Standards provide a baseline reference as well as a benchmark requirement.
Protection of the consumer, protection of the environment, reduction of production costs,
57

minimum standards of workmanship, occupant safety, and consideration of market requirements
are all essential features of a good standard (Janssen 2000) as well as striving for performance-
based metrics rather than prescriptive requirements. Therefore, standardization serves both a
technical and social purpose as they must consider the context in which they will be
implemented, taking into account of such things as local materials, local traditions, and the needs
of the intended population.
Through standardization of non-conventional materials like bamboo, the triple bottom
line of sustainable development can be realized, most notably in regard to equity. There is an
increasing socio-technical-economic gap between advanced and developing societies as well as
between urban and rural populations (Powell 2006). Standard field tests for non-conventional
materials provide rural communities greater equity in terms of safe, adequate, and reliable
housing and sustainable development using local resources resulting in an improved standard of
living. Communities may wean themselves of unsustainable practices associated with
transporting conventional materials to rural areas and renewable materials like bamboo reduce
the strain on global construction resources.
2.3.1 Current Bamboo Standards
Currently, there are few standards and codes regarding the use of structural bamboo. In 2004, the
International Organization for Standardization (ISO) in collaboration with the International
Network for Bamboo and Rattan (INBAR) published a model standard for determining the
mechanical properties of bamboo: ISO 22157-1 (ISO 2004b, 2004c). Illustrated in Figure 2-17,
the document includes standard test methods for determining a) full-culm compressive strength
(Fig. 2-17b); b) longitudinal tensile strength using a ‘dogbone’ specimen taken from the culm
58

wall (Fig. 2-17c); c) longitudinal shear using the ‘bowtie test’ (Janssen 1981) (Fig. 2-17d); and,
d) flexural capacity based on a four-point bend test of a long culm (Fig. 2-17e). The latter test is
typically governed by longitudinal shear behavior (i.e. VAy/It shear) and is therefore not a true
modulus of rupture test. The standard also provides guidelines for determining moisture content,
mass, and shrinkage properties of bamboo. Other tests focused on the longitudinal shear capacity
of bamboo (often a critical behavior) include a typical ‘S-type’ shear coupon (INBAR 1999)
(Fig. 2-17f) and a ‘lap shear’ test arrangement (Cruz 2002) (Fig. 2-17g). ISO and INBAR also
have a model standard for bamboo structural design: ISO 22156 (ISO 2004a). Meanwhile, the
National Building Code of India includes a section on bamboo construction covering
requirements for minimum strength, suitable species, grading and seasoning, preservative
treatment, as well as design and joining techniques (Bureau of Indian Standards 2005). ASTM
International is considering bamboo in a proposed revision to its standard D5456, Specification
for Evaluation of Structural Composite Lumber Products, but no consideration is currently given
to bamboo used in its natural form (ASTM International 2010). The International Code Council
Evaluation Service (ICC-ES) has published an evaluation report (ESR-1636) on the use of culms
of Bambusa Stenostachya (Tre Gai) bamboo from Vietnam in construction and outlines design
considerations and allowable design stresses (ICC-ES 2013).
59

Figure 2-17: Current bamboo standards as well as proposed lab and field applicable tests (Harries et al. 2012)
60
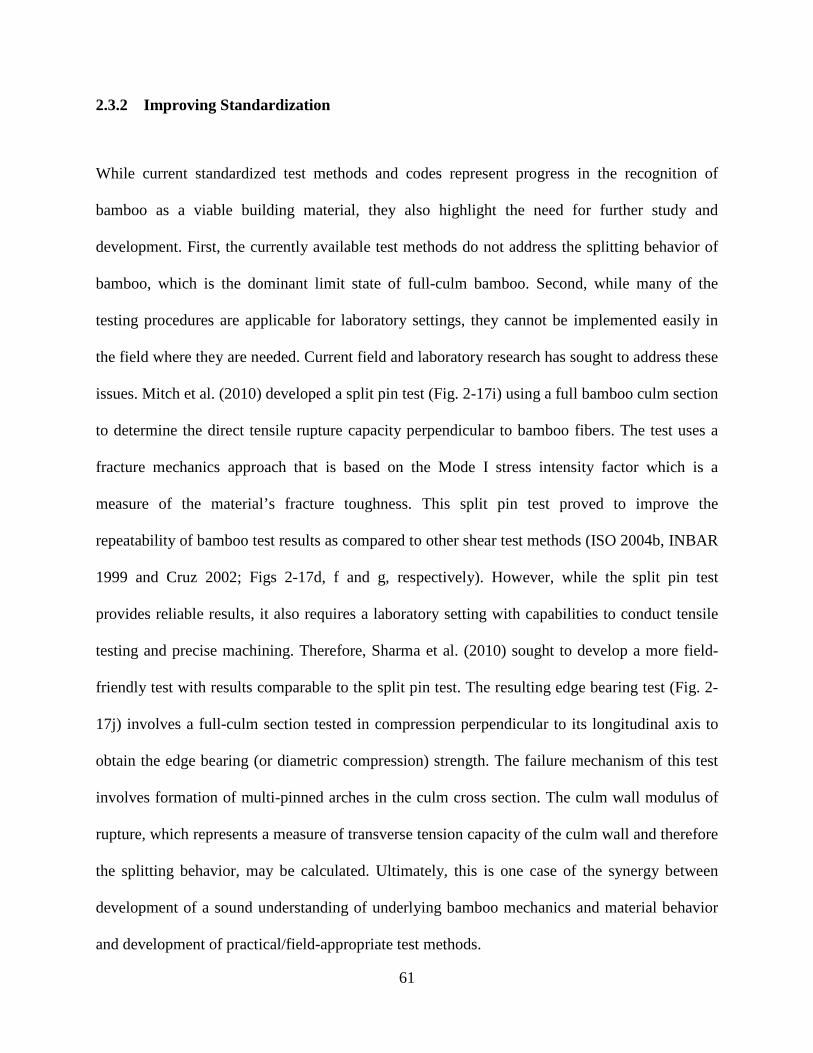
2.3.2 Improving Standardization
While current standardized test methods and codes represent progress in the recognition of
bamboo as a viable building material, they also highlight the need for further study and
development. First, the currently available test methods do not address the splitting behavior of
bamboo, which is the dominant limit state of full-culm bamboo. Second, while many of the
testing procedures are applicable for laboratory settings, they cannot be implemented easily in
the field where they are needed. Current field and laboratory research has sought to address these
issues. Mitch et al. (2010) developed a split pin test (Fig. 2-17i) using a full bamboo culm section
to determine the direct tensile rupture capacity perpendicular to bamboo fibers. The test uses a
fracture mechanics approach that is based on the Mode I stress intensity factor which is a
measure of the material’s fracture toughness. This split pin test proved to improve the
repeatability of bamboo test results as compared to other shear test methods (ISO 2004b, INBAR
1999 and Cruz 2002; Figs 2-17d, f and g, respectively). However, while the split pin test
provides reliable results, it also requires a laboratory setting with capabilities to conduct tensile
testing and precise machining. Therefore, Sharma et al. (2010) sought to develop a more field-
friendly test with results comparable to the split pin test. The resulting edge bearing test (Fig. 2-
17j) involves a full-culm section tested in compression perpendicular to its longitudinal axis to
obtain the edge bearing (or diametric compression) strength. The failure mechanism of this test
involves formation of multi-pinned arches in the culm cross section. The culm wall modulus of
rupture, which represents a measure of transverse tension capacity of the culm wall and therefore
the splitting behavior, may be calculated. Ultimately, this is one case of the synergy between
development of a sound understanding of underlying bamboo mechanics and material behavior
and development of practical/field-appropriate test methods.
61

Standardization of bamboo test methods is critical to the greater acceptance and
utilization of bamboo structures. The capture of fundamental material properties permits
comparison of bamboo behavior and performance across different species, geometry,
weathering, and treatment processes. With respect to design, methods that reliably determine
fundamental properties permit study of the calibration of material resistance factors as well as
design guidance for various species. Standardized test methods can also be used in isolating
factors and parameters that affect the material performance and behavior of bamboo. As with the
progression from complex to field-applicable test methods discussed above, this calibration and
isolation of factors affecting performance will help develop simpler design equations which will
increase the acceptance, adoption, and utilization of bamboo construction in the field. Such a
design approach for properties such as bamboo compression, tension, shear, and splitting
capacity is consistent with those used for established materials (timber, concrete, steel, etc.)
taking the general form of:
[ ]ki xCxxCCFQ 21ϕ≤ (2-1)
Where the structural loading demand, Q, must be less than or equal to the capacity provided by
the bamboo. This capacity is determined by considering a) the material property involved in
resisting the load (compression, tension, etc.), Fi; b) a statistically derived material resistance
factor, φi, based on standard tests and accounting for variation in material properties and
confidence levels; and c) any other factors dependent on such things as species, geometry,
exposure, etc. that may affect capacity, C1 to Ck.
The goal of the current work is to further this progression of development from sound
understanding of underlying bamboo mechanics and material behavior to more field applicable
design and test methods. This will be accomplished through the investigation of structural
62

bamboo components, specifically bamboo axial and flexural members. The influence of bamboo
fiber gradation on the standard bamboo tension test will be investigated with experimental tests.
Bamboo columns will be tested and studied to investigate the column buckling behavior of
bamboo culms and multiple-culm columns. Meanwhile, bamboo flexural tests will seek to
investigate the longitudinal shear flow within the bamboo culm since this often drives splitting
failures in bamboo flexural members.
63

3.0 INHERENT BENDING IN BAMBOO TENSION TESTS
Functionally graded materials (FGMs) like bamboo are important non-conventional materials in
civil infrastructure that can be used for a variety of applications in both their natural and
engineered forms. Standardized test methods and identification of critical limit states are crucial
for increased use, reliability, and ultimately acceptance of bamboo structures. While the
International Organization of Standards (ISO) has a model standard for bamboo (ISO 2004a) and
a number of material test methods (ISO 2004b); these are often cursory and further study is
warranted. ISO promulgates a standard coupon-based tension test method. It is the contention of
the present study that, due to the functionally graded nature of bamboo, the test geometry for this
test is inherently flawed and may result in additional non-uniform bending stresses being
introduced across the breadth of the cross section during testing. The bending inherent in a
standard coupon is due to the natural gradation of bamboo fibers through the radial direction of
the culm wall. Additionally, coupon preparation: the orientation and location in the culm from
which it is extracted, may significantly affect strength values reported from the test. This chapter
investigates the inherent bending in bamboo tension specimens to quantify the influence of
bending on tensile test results. Tensile specimens having different in situ orientation are
prepared; these include ‘radial’ specimens engaging the full gradation of fibers through the culm
wall thickness; and ‘tangential’ specimens taken from varying locations through the culm-wall
thickness perpendicular to the radial direction. A Vic-3D (2010) imaging camera and electrical
64

resistance strain gages were used to measure variation in strain in the test specimens related to
their original orientation in the bamboo culm. Experimental end conditions are also varied to
explore effects of induced moment in the test specimens. Experimental values are compared with
theoretical values for bending using a fiber element analysis approach. The experimental and
analytical results show that current test methods for bamboo tension capacity do indeed develop
stresses associated with specimen flexure; and the influence of bending is quantified for
specimens of various sizes.
3.1 BAMBOO TENSILE STRENGTH
Model standards for bamboo published by ISO and the International Network for Bamboo and
Rattan (INBAR), outline bamboo structural design strategies in ISO 22156 (2004a), and test
methods for determining mechanical properties in ISO 22157 (ISO 2004b and c). The standard
tensile test described in the latter involves the use of a ‘dogbone’ shaped specimen cut radially
from the culm wall as shown in Figure 1-17c. The gauge portion of the specimen is required to
have a rectangular cross section with dimensions of the culm wall thickness, t, or less in the
radial direction and 10 mm to 20 mm in the culm tangential direction. The gage length is
required to be 50 mm to 100 mm long (ISO 2004b). ISO 22157 also calls for the ends of the
specimen to be “so shaped as to ensure that the failure occurs within the gauge portion” (ISO
2004b) which typically translates into a ‘dogbone’ shaped or tabbed specimen. Although ISO
22157 is silent on the issue, it should be clear that if a dogbone shape is used, the reduction
should be made in the tangential direction of the specimen so as not to remove the extreme inner
and outer culm wall fibers from the test coupon. The grips of the testing apparatus are required to
65

be aligned in the radial direction; that is: the specimen is gripped parallel to the culm wall
thickness (t) dimension and through the width (w) of the specimen. If Young’s modulus
(modulus of elasticity or MOE) is desired, two strain gauges are placed on opposing sides of the
specimen – although the ISO standard is not clear as to which opposing sides (the t or w faces).
When testing for commercial purposes, the standard requires that specimens should have one
node region located within their length, although this is not required (and is rarely done) for
scientific research. Representative specimen dimensions and geometry given by ISO are shown
in Figure 3-1.
Figure 3-1: Representative bamboo dogbone specimen
In addition to the issues described above, the ISO standard tension test is silent on two
critical issues: it does not consider or even mention the functionally graded nature of the bamboo
fibers and their effect on specimen performance; or specify whether the loading grips of the
testing apparatus should be fixed or free to rotate in order to take up any bending effects
resulting from the specimen gradation. Furthermore, by specifying a specific tangential
dimension of w = 10 – 20 mm with an unrestricted thickness value of t, the ISO standard is not
giving consideration to the potential influence of shear lag which will effect specimens having w
greater than t (Fig. 3-1) since gripping is prescribed to be through the w direction. Other standard
tension test specimens for steel, (ASTM E8-11), timber, (ASTM D143-09), and fiber composites
(ASTM D3039-08) also have prescribed values (timber) or recommended dimensions (steel and
66

fiber composites) but in most cases, in order to miminize shear lag effects, the t/w ratio is greater
than 2. ASTM E8 requires that for specimens having non-conforming geometry to be considered
comparable, the relationship between gage length and cross sectional area must be kept constant.
The tensile strength of bamboo has been studied for a variety of species and has been
shown to vary widely. In this study, focus is placed on how tension strength is affected by the
composition of the material, rather than on the quantitative values of tension strength for the
species considered.
Tensile strength and modulus is influenced primarily by the volume fraction of bamboo
fibers (Janssen 1981) since fibers are the primary source of strength (Ghavami 1988, Shao et al.
2009). Nonetheless, the lignin matrix effectively distributes stress between fibers (Shao et al.
2009). Shao et al. (2009) developed equations defining tensile strength and MOE based on the
volume fraction of fibers and the rule of mixtures for a composite. In essence, this approach
results in material properties averaged over the sectional area of the tensile specimen.
The elastic modulus on the outer layer of the culm wall has been found to be 3 times
higher than the modulus at the inner wall (Duff 1941, Janssen 1981). Vaessen and Janssen
(1997) stated that there was no evidence to show that these values varied other than linearly
through the culm wall thickness. However, studies using imaging analyses have shown that the
volume fraction of fibers (which can be related to tensile strength and modulus of elasticity,
MOE) can vary in a parabolic fashion for some species (Amada et al. 1996, Amada et al. 1997,
Ghavami et al. 2003). The resulting parabolic strength distribution is attributed by Amada et al.
(1997) to the stress distribution (i.e.: bending due to wind load) experienced by bamboo in
nature. Arce-Villalobos (1993) states that bamboo fails at a particular strain rather than a
particular stress in the longitudinal and the tangential directions. Relationships between tensile
67
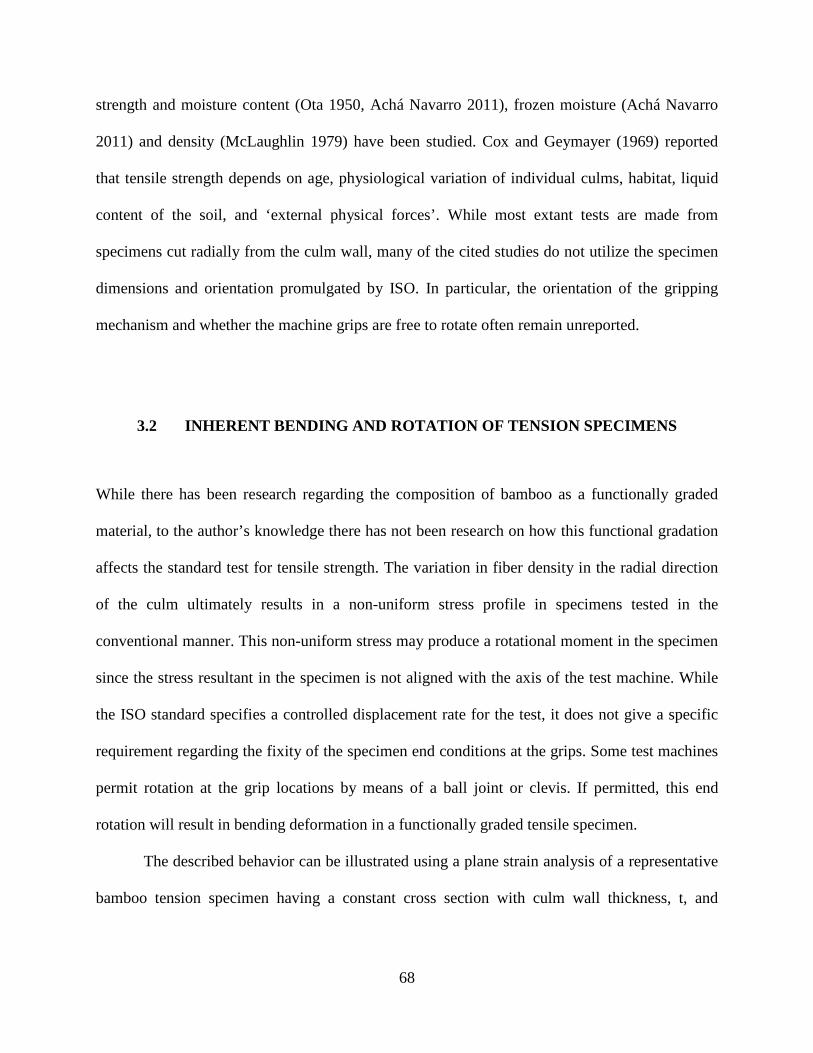
strength and moisture content (Ota 1950, Achá Navarro 2011), frozen moisture (Achá Navarro
2011) and density (McLaughlin 1979) have been studied. Cox and Geymayer (1969) reported
that tensile strength depends on age, physiological variation of individual culms, habitat, liquid
content of the soil, and ‘external physical forces’. While most extant tests are made from
specimens cut radially from the culm wall, many of the cited studies do not utilize the specimen
dimensions and orientation promulgated by ISO. In particular, the orientation of the gripping
mechanism and whether the machine grips are free to rotate often remain unreported.
3.2 INHERENT BENDING AND ROTATION OF TENSION SPECIMENS
While there has been research regarding the composition of bamboo as a functionally graded
material, to the author’s knowledge there has not been research on how this functional gradation
affects the standard test for tensile strength. The variation in fiber density in the radial direction
of the culm ultimately results in a non-uniform stress profile in specimens tested in the
conventional manner. This non-uniform stress may produce a rotational moment in the specimen
since the stress resultant in the specimen is not aligned with the axis of the test machine. While
the ISO standard specifies a controlled displacement rate for the test, it does not give a specific
requirement regarding the fixity of the specimen end conditions at the grips. Some test machines
permit rotation at the grip locations by means of a ball joint or clevis. If permitted, this end
rotation will result in bending deformation in a functionally graded tensile specimen.
The described behavior can be illustrated using a plane strain analysis of a representative
bamboo tension specimen having a constant cross section with culm wall thickness, t, and
68

tangential width w, as shown in Figure 3-2a. In this case, the stress distribution in the radial
direction (x in Figure 3-2a) is a function of modulus of elasticity and strain:
)()()( xxEx c εσ = (3-1)
The composite modulus of elasticity Ec(x) can be characterized using the rule of mixtures
and the volume fraction of bamboo fibers, where Ef is the modulus of elasticity of a bamboo
fiber, Em is the modulus of elasticity of the lignin matrix, and Vf(x) is the volume fraction of
bamboo fiber as a function of x:
))(1()()( xVExVExE fmffc −+= (3-2)
If strain is a constant across the section as is conventionally assumed for a tension test,
the stress is found from Eq. 3-1 as a function of Ec. Once the shape of the stress profile is
established, its resultant, F, and eccentricity with respect to the geometric centroid of the
specimen (also the axis of the test machine), e, can be determined as shown schematically in
Figure 3-2b. From these, the maximum and minimum stress in the cross section can be
calculated as:
2
6wtFe
twF±=σ (3-3)
In which the first term accounts for the uniform distribution of tensile stress across the section
area (A = tw) and the second term accounts for stress associated with the resulting moment Fe.
69
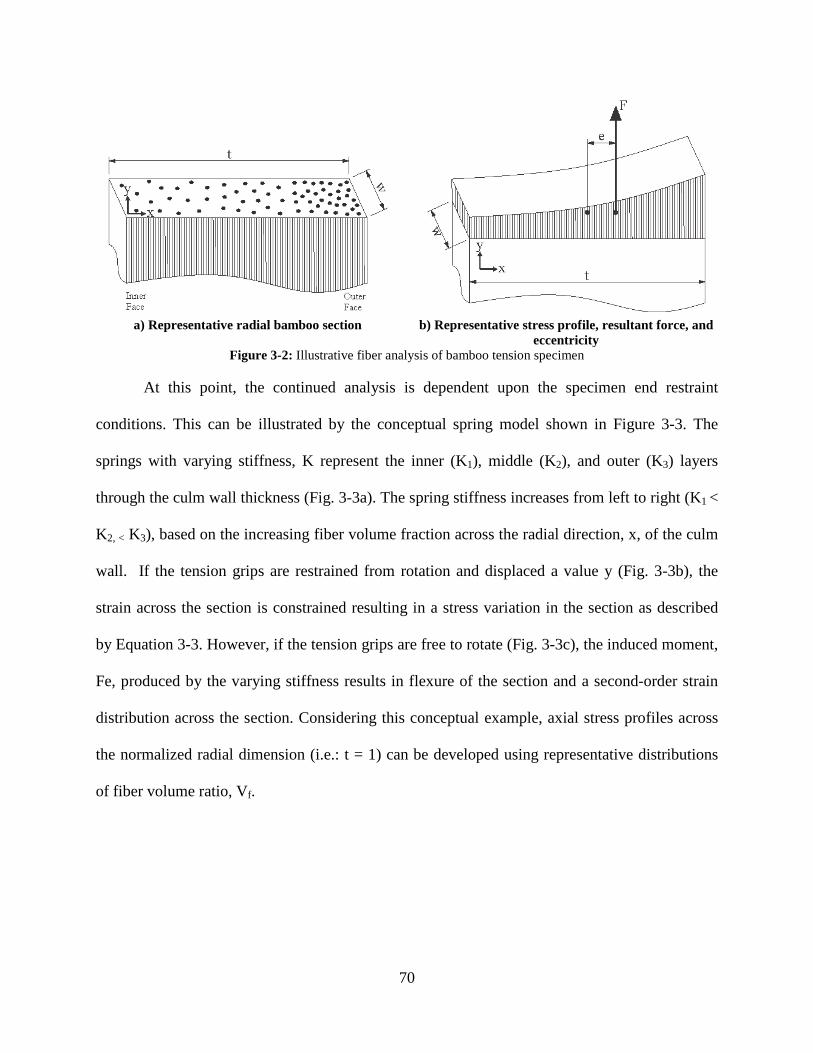
a) Representative radial bamboo section b) Representative stress profile, resultant force, and
eccentricity Figure 3-2: Illustrative fiber analysis of bamboo tension specimen
At this point, the continued analysis is dependent upon the specimen end restraint
conditions. This can be illustrated by the conceptual spring model shown in Figure 3-3. The
springs with varying stiffness, K represent the inner (K1), middle (K2), and outer (K3) layers
through the culm wall thickness (Fig. 3-3a). The spring stiffness increases from left to right (K1 <
K2, < K3), based on the increasing fiber volume fraction across the radial direction, x, of the culm
wall. If the tension grips are restrained from rotation and displaced a value y (Fig. 3-3b), the
strain across the section is constrained resulting in a stress variation in the section as described
by Equation 3-3. However, if the tension grips are free to rotate (Fig. 3-3c), the induced moment,
Fe, produced by the varying stiffness results in flexure of the section and a second-order strain
distribution across the section. Considering this conceptual example, axial stress profiles across
the normalized radial dimension (i.e.: t = 1) can be developed using representative distributions
of fiber volume ratio, Vf.
70

a) 3 springs tested in parallel b) springs tested in ‘fixed’
condition c) springs tested in ‘free’ condition
Figure 3-3: Rotation in representative spring model loaded in Tension
Janssen (1981, 2000) stated that the elastic modulus of a bamboo fiber is estimated as Ef
= 35000 MPa, the elastic modulus of lignin is estimated as Em = 1800 MPa, and that fiber
volume fraction can be estimated as Vf = 0.60 at the outer face of the culm wall and Vf = 0.10 at
the inner face for most species. Results from specimens of Phyllostachys heterocycla pubenscens
(Moso) and Dendrocalamus giganteus by Ghavami et al. (2003) showed this conservative
estimation of Vf to be valid. Ghavami et al. (2003) also found Vf to have a parabolic distribution
in Moso and Dendrocalamus.
In our conceptual example, a constant, linear, parabolic, cubic, and square root
distribution of fiber volume ratio, shown in Figure 3-4 – each resulting in an average fiber
volume ratio in the cross section – Vf = 0.35, were selected (Eqns. 3-4 to 3-7). To ensure an
average Vf = 0.35, the exterior Vf = 0.60 was held constant and the interior Vf was varied
appropriately. Although admittedly artificial, but this is intended as an illustrative example only.
71

The value of Ef = 35000 MPa and Em = 1800 MPa were used with Eqn. 3-2 resulting in a
composite MOE averaged over the section area of Ec = 13420 MPa.
35.0. =favgV (3-4)
( ) 10.010.060.0 +−= xV flinear (3-5)
( ) 22.022.060.0 2 +−= xV fparabolic (3-6)
( ) 26.026.060.0 3 +−= xV fcubic (3-7)
( ) 11.011.060.0 21
−+= xV tfsquareroo (3-8)
Figure 3-4: Representative fiber volume fraction distribution
Figure 3-5: Stress due to uniform strain
-0.100.000.100.200.300.400.500.600.70
0.0 0.1 0.2 0.3 0.4 0.5 0.6 0.7 0.8 0.9 1.0
Vf
Normalized wall thickness, t
Constant
Linear
Para
Cubic
Squareroot
Inner Culm Wall Outer Culm Wall
-5.0
0.0
5.0
10.0
15.0
20.0
25.0
0.0 0.1 0.2 0.3 0.4 0.5 0.6 0.7 0.8 0.9 1.0
Stre
ss (M
Pa)
Normalized wall thickness, t
Constant
ParaLinear
Cubic
Squareroot
Inner Culm Wall Outer Culm Wall
72

Figure 3-6: Total strain including rotation of moment Fe
Figure 3-5 illustrates that the stress caused by the application of a uniform tensile strain
across the section exhibits a distribution similar to the distribution of the fiber volume fraction
(which determines E-modulus). However, if the ends of the specimens are free to rotate; this
stress results in the application of the moment Fe and the resulting strains, described by Eqn. 3-3,
are shown in Figure 3-6 which accounts for the rotation in the specimen and shows that the
maximum strain is occurring at the weaker interior face (see also Figure 3-3c). In addition to
looking at the experimental strength results for the bamboo tensile specimens, the apparent strain
profile through the culm wall thickness will be characterized using this approach as a guide to
identify bending in the specimen.
3.3 EXPERIMENTAL PROGRAM
The experimental program consisted of bamboo tensile tests of specimens cut from the culm wall
in both radial and tangential directions (Figure 3-7a). Radial specimens were cut through the
entire culm wall thickness while tangential specimens were cut from the outer, middle, and inner
layers of the bamboo culm thickness. Tests were conducted on a tension frame with locking self-
0
500
1000
1500
2000
2500
3000
3500
0.0 0.1 0.2 0.3 0.4 0.5 0.6 0.7 0.8 0.9 1.0
Stra
in (m
icro
stra
in)
Normalized wall thickness, t
Constant
Linear
Para
Cubic
Squareroot
Inner Culm Wall Outer Culm Wall
73

aligning grips allowing the specimen end restraint conditions to be either fixed or free to rotate.
The test program sought to study the influences of fiber gradation of the culm wall and test
machine end fixity on bamboo tensile strength results and the longitudinal strain profiles of the
specimens. This program will identify factors affecting bamboo tension tests and permit these so-
called ‘interferences’ to be quantified1.
3.3.1 Specimens and Fabrication
Specimens were taken from 11 internodes of 2 culms of Bambusa Stenostachya (Tre Gai). Tre
Gai bamboo, native to Vietnam, is a thick walled bamboo species which allowed for specimens
to be cut in the radial direction of the culm wall as well as tangentially at three defined layers of
the culm wall as shown in Figure 3-7a. The aspect ratio of specimen cross sectional area was
targeted to be equal to 4, with the width equal to 20 mm (0.79 in.) and thickness equal to 5 mm
(0.20 in.). The ‘width’ dimension of radial specimens is the culm-wall thickness. Tangential
specimens were taken from the outer, middle, and inner portions of the culm wall as shown in
Figure 3-7a. Unlike the radial specimens, tangential specimens have an essentially uniform
gradation of fiber volume across their width. An average gage length of 80 mm was calculated
for all specimens (minimum of 56 mm and maximum of 99 mm). Ultimately, 82 specimens were
prepared following the test matrix shown in Table 3-1. A few specimens containing a node
within the gage length were tested for each of the specimen orientations with the grip free to
rotate and a final radial specimen containing a node was tested with fixed end conditions.
1 ‘Interferences’ is the term used by ASTM to identify issues affecting the results of a test method. A section labeled ‘Interferences’ is now part of the ASTM Standard Test Method boilerplate text.
74

Specimens were fabricated using a horizontal milling machine as shown in Figure 3-7b.
First, a rectangular block was removed from the culm wall of an internode. Radial and tangential
specimens were then cut from the blocks using a band saw. Specimen geometry was measured at
three locations along the gage length to determine an average value of width and thickness. Last,
softwood gripping tabs were affixed to the specimens using an epoxy adhesive (Fig. 3-7c).
a) specimen orientation b) specimen fabrication in horizontal milling machine c) application of softwood tabs
Figure 3-7: Tensile test specimens
Table 3-1: Test Matrix
Specimen ID internode tests
tests with
nodes
orientation end restraint
TRU1 to TRU12 10 2 radial free TRF13 to TRF23 10 1 radial fixed TOU24 to TOU3 10 1 tangential – outer free
TMU35 to TMU43 8 1 tangential – middle free TIU44 to TIU54 10 1 tangential - inner free TOF55 to TOF64 10 - tangential – outer fixed TMF65 to TMF72 8 - tangential – middle fixed
TIF73 to TIF82 10 - tangential - inner fixed
75

3.3.2 Testing Apparatus
Testing was conducted in an MTS 810 universal testing frame having an 89 kN (20 kip) capacity
load cell (Fig. 3-8) and equipped with hydraulic wedge grips. Since the compression strength
perpendicular to fibers is low (Janssen 1981), specimens were tested with a grip pressure of only
6.9 MPa (1000 psi) to minimize crushing and/or shear-related failures in the grip region.
Occasionally adjustments to grip pressure had to be made during testing to account for specimen
slip during testing. All specimens were placed in the grips such that the grip chucks were applied
to the long side of the specimen; this is consistent with the ISO requirement for the radial
specimens but not for the tangential. Nonetheless, the tangential specimens are expected to have
more uniform cross section properties, in which case this change is not believed to be an issue.
Tests were conducted in displacement control at a rate of 0.0254 mm/s (0.001 in/s). ISO
22157 specifies a rate of 0.01 mm/s (0.0004 in/s), but this is impractically slow and cannot be
reliably achieved with the test frame and controller used in this test program. The hydraulic
wedge grips are self-centering, having a ball joint allowing rotation of the grip assembly. This
joint may be fixed or be left free to rotate; thus affecting the end restraint noted in Table 3-1.
Load and vertical displacement values were obtained directly from the MTS load cell and
LVDT.
76

Figure 3-8: Experimental Test Set Up
3.3.3 Instrumentation
Surface strains in the bamboo specimens were measured using two forms of instrumentation. The
primary instrumentation for the study was a VIC-3D digital image correlation system which
captures the strain field in the specimen across either the radial or tangential dimension of the
specimen. The VIC-3D system (shown in Figure 3-9) uses the concept of digital image
correlation to determine the strain tensor on the material surface during the test. Specimens are
painted with a speckle pattern prior to testing (photocopier toner broadcast onto wet white spray
paint); during the test consecutive high resolution images are taken and deformation patterns
(based on sampling of the speckle pattern) are recorded. Post processing allows specified strain
fields to be plotted (Correlated Solutions 2010). Radial specimens were imaged to capture the
77

strain field in the radial direction while tangential specimens were imaged in the tangential
direction; essentially; i.e.: the longer face of each specimen is imaged (Figure 3-9d).
b) VIC-3D cameras
a) test frame with VIC 3D system c) test in progress d) speckle pattern on specimen
Figure 3-9: VIC-3D system.
Electrical resistance strain gages were also used on a set of radial free (TRU in Table 3-1)
specimens and one radial fixed specimen (TRF in Table 3-1) to allow for comparison of directly
measured strain values with results from the VIC-3D system. Two strain gages were placed at
the mid-height of the specimen gage length; one placed at each of the interior and exterior edges
of the radial dimension of the specimen as shown in Figure 3-10.
78

Figure 3-10: Location of strain gages on tension specimen and gages after testing
3.4 EXPERIMENTAL RESULTS
Reporting of the experimental results is organized into four sections. First, the failure modes
observed during the testing are discussed and illustrated. Next, attention is given to a summary of
tensile strength data observed. The observed experimental strain profiles are then discussed and
the stress and modulus of elasticity across the radius are estimated using tangential specimens.
Observed trends found in the experimental results are illustrated here using a representative set
of specimen data. A complete catalogue of experimental tension test results is presented in the
Appendix.
3.4.1 Failure Modes
The bamboo tensile test specimens exhibited six general categories of specimen failure as
illustrated in Figure 3-10: Failure mode A involves specimen failure within the wood tabbed grip
79

length, while mode B represents failures at the interface of the grip and gage lengths. Failure
mode C is a tensile rupture within the gage length of the specimen. Modes D and E both involve
a longitudinal splitting failure through the gage length of the specimen; mode D is a single split,
while mode E is referred to as a ‘brooming’ failure which engages the entire cross section.
Finally, failure mode F represents cases where a combination of failure modes was observed.
These are shown schematically and by example in Figure 3-10. Modes C through F are all
considered ‘good’ failures in the sense of being mostly unaffected by the tabbing or gripping
process. Failures C and E are the ‘preferred’ failure modes of unidirectional fiber reinforced
polymer (FRP) materials having uniform fiber volume ratios. The single longitudinal splitting
failures observed in modes D and F may result from the following two sources which cannot be
avoided when testing bamboo:
Uneven grip pressure. While the gripping pressure applied to the softwood tabs is uniform,
because the bamboo itself has varying material properties across the gripped width, the apparent
‘gripping pressure’ relative to the tested portion of the specimen may be uneven. This can result
in single longitudinal splitting failures associated with regions of greater grip pressure. This type
of failure is seen in hand-layed up FRP materials where the thickness of the specimen is not well
controlled.
Longitudinal bending of specimen. If the specimen exhibits any flexure (see Section 3.2),
longitudinal shear (i.e.: VAy/It shear) is present and may affect a longitudinal splitting failure.
80

mode A mode B mode C mode D mode E mode F Figure 3-11: Representative Failure Modes
Considering the 76 internode specimens (Table 3-2), regardless of orientation or end
restraint, 38 specimens (50%) experienced a mixed mode F failure. In each case, the combination
consisted of a mode B or C rupture and a mode D or E splitting failure. Thirty-one specimens
(41%) experienced a mode D or E longitudinal splitting failure only. One specimen (1%) and 6
specimens (8%) experienced failures in (mode A) or at (mode B) the wood tabs, respectively.
Five of the six specimens having a nodal region in their gage length exhibited a mode C rupture
failure exclusively; in these cases the failure was at the node. In comparing the failure modes
with respect to specimen orientation and end restraint condition (Table 3-2), there was no
significant difference between testing conditions. The dominant failure mode in each case was a
mode D splitting failure or a mode F combination failure which included splitting. This
observation, once again, highlights the issue of splitting as a dominant limit state for bamboo.
81

Table 3-2: Observed failure modes in tensile tests.
ID orientation end restraint Test observed failure mode
A B C D E F TRU radial Free 12 1 0 2 5 3 1 TRF Fixed 11 0 0 1 3 0 7 TOU tangential-
outer Free 11 0 0 0 4 2 5
TOF Fixed 9 0 1 1 4 1 2 TMU tangential-
middle Free 11 0 3 1 1 0 6
TMF Fixed 10 0 0 0 5 1 4 TIU tangential-
inner Free 8 0 0 0 2 0 6
TIF Fixed 10 0 2 0 0 0 8
It should also be noted that during testing, many specimens experienced issues with slip
occurring in the grip length between either the bamboo and wood tabs; or the wood tabs and
hydraulic wedge grips. This was ultimately an issue with the grip system; therefore slip was not
considered a failure mode in the testing; and displacement data for the tests was not considered
in the following sections (since it necessarily includes slip).
3.4.2 Tensile Strength
The experimental tensile strength results are summarized in Table 3-3 and Figure 3-12 for the
various orientation and end restraint conditions. Table 3-3 also presents the average tensile
strengths for each condition normalized to the average strength of the radial-free (TRU)
specimens. A few trends are immediately identified; while these may be expected, their
implications are largely ignored in standardized bamboo tension tests:
1. In all cases, free end restraints result in higher tensile strengths than fixed restraints.
2. The tangential specimens capture the variation of expected tensile strength through the culm
wall thickness. The outer specimens were about 1.87 times as strong as the inner and about
1.33 times as strong as the middle specimens. This result implies a higher order, rather than
linear, fiber volume distribution.
82

3. The radial specimens exhibited results very close to (but marginally less than) the average of
the three tangential locations which are also comparable to the results of the middle
tangential specimens. Again, this result implies a fiber volume distribution having an order
greater than 1.
4. COV values are typical of bamboo testing. The COV is seen to improve (i.e.: fall) for the
fixed end restraint condition and with increasing fiber content (outer tangential specimens).
Table 3-3: Average Experimental Tensile Strength Summary and Normalization
Average Strength, MPa (COV) End Restraint Radial Inner Middle Outer
Free 141.2 (36.2%) 101.9 (41.4%) 139.9 (28.0%) 193.8 (18.9%) Fixed 131.9 (28.9%) 94.3 (33.4%) 134.6 (24.1%) 172.8 (15.5%)
Free/Fixed 1.07 1.08 1.04 1.12 Average Strength Normalized to Free Radial Specimens
Free 1.00 0.72 0.99 1.37 Fixed 0.93 0.67 0.95 1.22
Specimens Having Nodal Region, MPa Free 69.5 (25.7%) 29.3 68.8 125.4
nodal/internode 0.49 0.29 0.49 0.65
Specimens which included a nodal region within the gage length of the tensile coupon
and tested in the free condition were also tested. Results, shown Table 3-3, showed much lower
tensile strengths than the other specimens although exhibited similar trends. The detrimental
effect of the node was less pronounced as the fiber volume ratio increased (inner to outer
tangential specimens). The one radial specimen tested with a nodal region in the fixed condition
(not reported in Table 3-3) experienced a tensile strength (42.9 MPa) lower than the free
condition but it should be noted that a partial failure occurred at the node during test preparation.
83

Figure 3-12: Experimental Tensile Strength
Tensile strength values are also known to vary with respect to the location of the
specimen along the culm. Figure 3-13 illustrates the tensile strength results for specimens along
the length of both culm TG1 (internodes 5 through 11) and TG21 (internodes 11 through 13).
The results showed that for all orientations the tensile strength generally increased along the
culm height although the results from TG1 are greater than those from TG21, indicating
variation between culms. In culm TG1, this increase was more pronounced for the radial
specimens, although this was not reflected in TG21. Nonetheless the trends indicated above were
consistent regardless of the height along the culm at which specimens were taken.
The general increase in tensile strength along the height of the culm is believed to be a
function of simple mechanics: The amount of fiber material in the culm section is essentially
constant or increases marginally along the height of the culm (Janssen 2000) while the diameter
and culm wall thickness generally decrease with height (see Section 2.1.2.1) reducing the area
0
50
100
150
200
250
300
Outer(Free)
Outer(Fixed)
Middle(Free)
Middle(Fixed)
Inner(Free)
Inner(Fixed)
Radial(Free)
Radial(Fixed)
Stre
ngth
(MPa
)
Orientation and End Restraint
Error BarsHigh
3rd Quartile+ Average1st Quartile
Low
84

over which the stress is determined. Since tensile strength is primarily imparted by the fibers, the
apparent strength increases. Indeed, the fiber volume fraction increases along the culm height
(Janssen 2000, Amada et al. 1996).
a) free end restraints b) fixed end restraints
Figure 3-13: Tensile strength along the culm height.
In summary, the tensile strength results illustrate the influence of machine-imposed end
restraints and the location and orientation within the culm from which the tension specimen is
extracted. The latter affects the fiber volume ratio in the test specimen. The mechanisms
affecting these general trends in tension behavior are explored further in the following section in
which strain patterns in the specimens are investigated.
0
50
100
150
200
250
300
5 6 7 8 9 10 11 12 13
Tens
ile S
tren
gth
(MPa
)
Internode No. Along Culm
TG1-O TG1-M TG1-I TG1-R
TG21-O TG21-M TG21-I TG21-R
Culm TG21
Culm TG1
0
50
100
150
200
250
300
5 6 7 8 9 10 11 12 13
Tens
ile S
tren
gth
(MPa
)
Internode No. Along Culm
TG1-O TG1-M TG1-I TG1-R
TG21-O TG21-M TG21-I TG21-R
Culm TG1
Culm TG21
85

3.4.3 Experimental Strain Profiles
As stated previously, the goal of using the VIC-3D imaging system was to capture the
experimental surface strain profiles across the width of the specimens (radial or tangential)
relative to the culm wall orientation and ultimately capture rotation in the specimen. It is
assumed that all tests exhibit plane strain behavior in the ‘specimen thickness’ dimension (i.e. the
‘depth’ direction for the VIC-3D system) which allows for study of the resulting experimental
surface strains. Representative results and summaries are presented in this section while a
complete summary of data obtained is presented in the Appendix.
Figures 3-14 and 3-15 show the strain profiles across the tension specimens cut from
internode 5 of culm TG1 for the tangential and radial specimens in both the free and fixed end
conditions, respectively. Strains at a number of stress levels are shown to indicate changes with
test progression. The results for the free end condition (Fig. 3-14) show, apart from a break in the
outer tangential specimen, a fairly uniform strain distribution in each of the tangential specimens
as expected. Meanwhile, for the radial specimen with free end constraints, a nonlinear strain
distribution decreasing from the inner face to the exterior highlights potential bending in the
system as was illustrated in the earlier representative example (Figure 3-6). The radial specimen
with fixed constraints (Fig. 3-15 bottom right) has a peak strain towards the center of the
specimen, which does not suggest rotation, and tangential specimens once again show uniform
strain results across their sections.
These results are reinforced by Figures 3-16 and 3-17 which compare the strain profile of
the outer, middle, inner, and radial specimens for TG1-5 (free and fixed restraints respectively)
at specific values of average applied stress. It should be noted, that due to preloading of some
specimens by the machine grip pressure, strain values reported in Figures 3-16 and 3-17 should
86

be considered relative and not be compared directly across the sections; focus should be placed
on the strain distributions. In Figures 3-16 and 3-17, the expected trends and behaviors are
reinforced. In particular, the strain distribution at a given average stress level sees the interior
strains greater than the exterior (see Figure 3-6) and the radial strains similar to the middle
tangential strains.
Overall, the experimental strain distributions for all bamboo internodes tests (Appendix)
exhibited mixed results. TG1-5 and TG21-12 radial specimens had evident rotation seen in the
free specimen with more uniform strains in the fixed specimen. Two specimens (TG1-8 and
TG21-13) saw rotation in both free and fixed radial specimens while specimen TG1-6 did not see
pronounced rotation in either end restraint condition. Specimens TG1-7, TG1-10, and TG21-11
saw more evidence of rotation in the fixed condition while radial specimens for TG1-11 and
TG1-9 saw higher strain values on their exterior side.
87

Figure 3-14: Specimen TG1-5 (Free): Inner (Upper Left), Middle (Upper Right), Outer (Lower Left), & Radial (Lower Right)
0
2000
4000
6000
8000
10000
12000
14000St
rain
eyy
(ms)
Location Along Specimen (mm)Interior Face Exterior Face
10 MPa
50 MPa
103 MPa
0
2000
4000
6000
8000
10000
12000
14000
Stra
in e
yy(m
s)
Location Along Specimen (mm)Interior Face Exterior Face
20 MPa
50 MPa
100 MPa
150 MPa
0
2000
4000
6000
8000
10000
12000
Stra
in e
yy(m
s)
Location Along Specimen (mm)Interior Face Exterior Face
41 MPa
70 MPa
100 MPa
130 MPa
186 MPa
0
2000
4000
6000
8000
10000
12000
Stra
in e
yy(m
s)
Location Along Specimen (mm)Interior Face Exterior Face
20 MPa
50 MPa
80 MPa
108 MPa
88
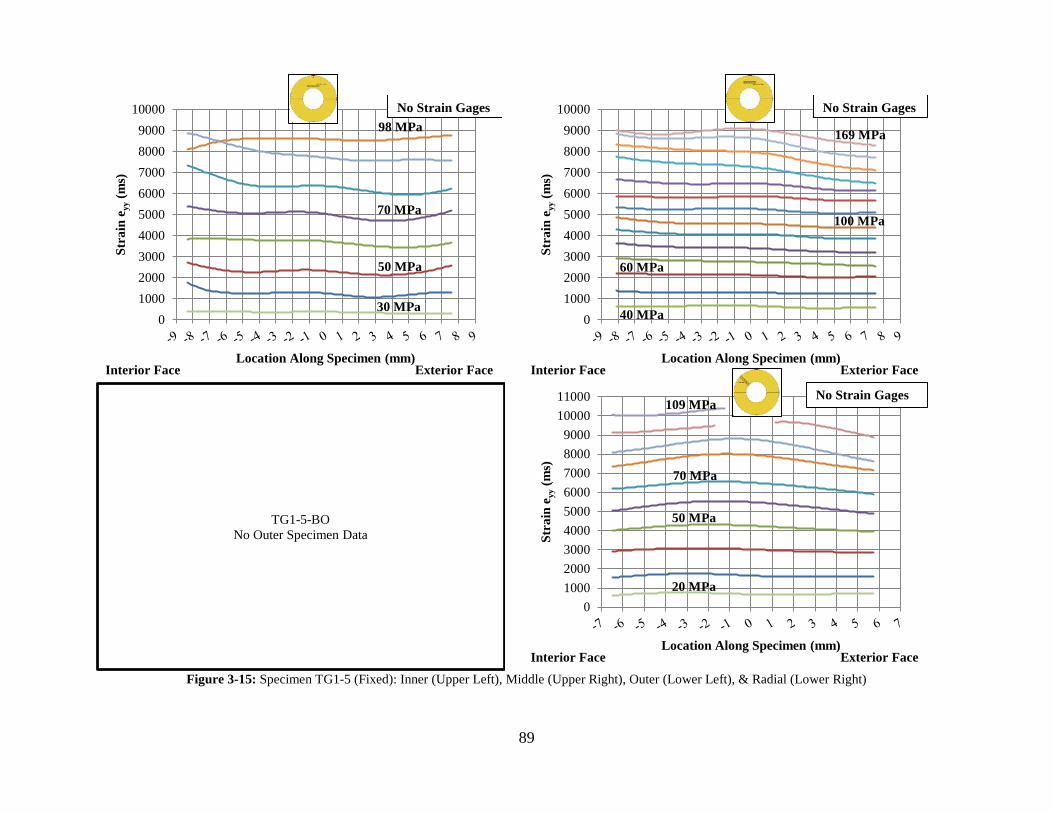
Figure 3-15: Specimen TG1-5 (Fixed): Inner (Upper Left), Middle (Upper Right), Outer (Lower Left), & Radial (Lower Right)
0100020003000400050006000700080009000
10000St
rain
eyy
(ms)
Location Along Specimen (mm)Interior Face Exterior Face
No Strain Gages
30 MPa
50 MPa
70 MPa
98 MPa
0100020003000400050006000700080009000
10000
Stra
in e
yy(m
s)
Location Along Specimen (mm)Interior Face Exterior Face
No Strain Gages
40 MPa
100 MPa
60 MPa
169 MPa
TG1-5-BONo Outer Specimen Data
0100020003000400050006000700080009000
1000011000
Stra
in e
yy(m
s)
Location Along Specimen (mm)Interior Face Exterior Face
No Strain Gages
20 MPa
70 MPa
50 MPa
109 MPa
89

Figure 3-16: Strain profile for specimen TG1-5 (free): 40MPa (top), 70 MPa (center), and 100MPa (bot.)
2586 2425
0500
1000150020002500300035004000450050005500
Stra
in e
yy(m
s)
Location Along Specimen (mm)Interior Face Exterior Face
Radial: 39.7 MPa
Outer: 39.7 MPa
Middle: 39.7 MPa
Inner: 39.7 MPa
5760
4679
25003000350040004500500055006000650070007500800085009000
Stra
in e
yy(m
s)
Location Along Specimen (mm)Interior Face Exterior Face
Radial 69.8 MPa
Inner 70.0 MPa
Outer: 70.2 MPa
Middle: 70.2 MPa
8954
7094
9668
7759
400045005000550060006500700075008000850090009500
10000105001100011500
Stra
in e
yy(m
s)
Location Along Specimen (mm)Interior Face Exterior Face
Radial: 99.9 MPa
Radial (Peak): 107.8 MPa
Middle: 99.9 MPa
Outer: 99.8 MPa
Inner: 99.9 MPa
90

Figure 3-17: Strain profile for Specimen TG1-5 (fixed): 40MPa (top), 60MPa (center), and 89MPa (bot.)
500
1500
2500
3500St
rain
eyy
(ms)
Location Along Specimen (mm)Interior Face Exterior Face
Radial: 39.9 MPaNo Strain GagesNo Strain Data for Outer Layer
Middle: 39.9 MPa
Inner: 39.7 MPa
0
1000
2000
3000
4000
5000
6000
Stra
in e
yy [m
s]
Location Along Specimen [mm]Interior Face Exterior Face
Radial: 60.0 MPa
No Strain GagesNo Strain Data for Outer Layer
Middle: 60.0 MPa
Inner: 60.0 MPa
0100020003000400050006000700080009000
10000
Stra
in e
yy(m
s)
Location Along Specimen (mm)Interior Face Exterior Face
Radial: 89.4 MPa
Outer: 89.4 MPa
Inner: 89.4 MPa
No Strain GagesNo Strain Data for Outer Layer
91

3.4.4 Experimental Stress Profiles
The experimental tensile results were also used to estimate the uniform tensile stress distribution
(not considering rotation) across the radial dimension (through the culm wall). Figure 3-18 plots
the ultimate tensile stress for the inner, middle, and outer tangential specimens (free and fixed
conditions) with respect to their estimated location along the normalized radial thickness
dimension. To estimate the location of the tangential specimens, the middle specimen is assumed
to be centered at 0.5t; specimen dimensions are known and a blade kerf of 2 mm (1/16 in) is
assumed. From this, the location of the tangential specimens may be approximated. It is also
acknowledged that the most extreme outer and inner fibers are lost due to milling of the
tangential specimens. Figure 3-18 uses representative specimens TG1-5 and TG21-11 to
illustrate common results.
a) TG1-5 specimens b) TG21-11 specimens
Figure 3-18: Representative stress profiles for specimens TG1-5 and TG21-11
Excluding the tests where no middle specimen (thinner walled culms did not permit three
tangential specimens in every case) was fabricated (in which case only a linear distribution could
103
149
184
115
169208
0
50
100
150
200
250
0.0 0.1 0.2 0.3 0.4 0.5 0.6 0.7 0.8 0.9 1.0
Stre
ss (M
Pa)
Normalized Radial Thickness Dimension
Free
Fixed
41
86
186
41
75
132
0
20
40
60
80
100
120
140
160
180
200
0.0 0.1 0.2 0.3 0.4 0.5 0.6 0.7 0.8 0.9 1.0
Stre
ss (M
Pa)
Normalized Radial Thickness Dimension
Fixed
Free
92

be graphed) for both free and fixed conditions, results clearly indicated a nonlinear stress
distribution; albeit the relationship is by no means consistent. Three tests (TG1-5, TG1-6, and
TG1-7) had exponentially decaying (i.e.: σ α xy; where y < 1) or near linear (y = 1) relationships
similar to that shown in Figure 3-18a for both free and fixed conditions, while specimen TG21-
11 (Fig. 3-18b) had an exponentially increasing (i.e.: σ α xy; where y > 1) relationship for both
free and fixed conditions. Three specimens (TG1-8, TG1-9, and TG21-12) had a combination of
curvature for free and fixed conditions. Specimens TG1-8 and TG21-12 saw exponentially
increasing curvature in the fixed condition and decaying curvature in the free condition. The
opposite was seen in specimen TG1-9. Specimen TG1-10 had no middle layer in either the free
or fixed condition (only linear increasing relationships). Specimen TG1-11 has no middle layer
in the free condition while specimen TG21-13 had no middle layer in the fixed condition.
However, both showed exponentially increasing curvature in the case that included a middle
layer. Finally, exponentially increasing curvature was seen in the nodal specimen (TG1-1) in the
free condition.
3.4.5 Experimental Elastic Modulus Profile
Similar to the procedure used in Section 3.4.4 for determining the stress profiles, the
experimental tangent modulus of elasticity distribution across the radial direction was also
estimated using the results of tangential specimens from two internodes: TG1-8 and TG21-12.
As mentioned previously, slippage in the grip length proved to be an issue in many tests which
affected displacement results. These representative internodes were chosen based on their good
load-displacement data from testing prior to the occurrence of slippage. Specimen TG1-8
exhibited a higher average apparent modulus in the fixed condition and had exponentially
93

increasing distributions. Meanwhile, specimen TG21-12 had near linear distributions and values
for both free and fixed conditions. Results, once again, illustrate the influence of increasing fiber
density across the radial dimension.
a) Specimen TG1-8 b) Specimen TG21-12
Figure 3-19: Representative E-Modulus profile for specimens TG1-8 and TG21-12
3.5 CONCLUSIONS
The goal of this experimental program was to highlight issues with and interferences present in
current methods and practices regarding the tensile strength of clear bamboo specimens taken
from the culm wall. The study not only investigated the influence of fiber gradation on the
specimen behavior but also the end restraint condition provided by the testing machine – for
which there is no guidance in applicable standards. The following conclusions are drawn from
the experimental test results:
44773567
8876
62936092
7661
0
1000
2000
3000
4000
5000
6000
7000
8000
9000
10000
0.0 0.1 0.2 0.3 0.4 0.5 0.6 0.7 0.8 0.9 1.0
E-M
odul
us (M
Pa)
Normalized Radial Dimension
Fixed
Free
3547
5547
7594
3690
5183
7398
0
1000
2000
3000
4000
5000
6000
7000
8000
0.0 0.1 0.2 0.3 0.4 0.5 0.6 0.7 0.8 0.9 1.0
E-M
odul
us (M
Pa)
Normalized Radial Dimension
Fixed
Free
94

Tensile strength results obtained using a fixed end condition produced lower average
strengths in all cases as compared to those tests that are free to rotate. It is envisioned that the
specimen rotation when allowed in free end specimens causes longitudinal failures (splitting;
failure modes D and E in Figure 3-11) as longitudinal splitting permits for redistribution of axial
forces due to loss of strain compatibility across the section. Further, the tangential specimens
capture the variation of expected tensile strength through the culm wall thickness and indicate a
higher order, rather than linear, fiber volume distribution.
The radial specimens exhibited results very close to (but marginally less than) the
average of the three tangential locations which are also comparable to the results of the middle
tangential specimens. Again, this result implies a fiber volume distribution having an order
greater than one.
COV values are typical of bamboo testing. The COV is seen to improve (i.e.: fall) for the
fixed end restraint condition and with increasing fiber content (outer tangential specimens).
Experimental strain profile data illustrated that most radial tensile specimens had a
nonlinear strain distribution, which could potentially be attributed to rotation due to variation of
fiber volume in the section. However, nonlinear strain was also seen in some tangential and fixed
specimens.
Experimental stress and E-modulus distributions illustrated that fiber gradation through
the culm wall effects uniform tensile strength. As future work, fiber volume fraction could be
estimated across the radial thickness to develop a refined E-modulus equation (which is species
specific), which could then be used to calculate the total stress profile and resultant eccentric
force. However fiber volume distributions are expected to vary from culm to culm as was
apparently observed in this study. Thus to accomplish this task, either fiber distribution must be
95

measured for all specimens or a simplifying relationship adopted. Based on the present data, such
a relationship will be nonlinear although, beyond this, no conclusion is warranted.
Overall, fiber density across the culm wall thickness and the end restraint conditions of
the specimens were shown to have an influence on bamboo tensile test results and therefore must
be considered in the development of improved standard test methods. It is recommended that
tangential specimens from various regions within the culm wall be used since they possess a
more uniform fiber density throughout their cross section and taken together can outline the fiber
density and strength in the radial direction through the culm wall.
96

4.0 PERFORMANCE OF BAMBOO FLEXURAL COMPONENTS
Splitting or longitudinal shear failures in bamboo are a major concern with use of the material for
construction applications and therefore must be addressed in standardized test methods and
building practices. The present study investigates the longitudinal shear failure in full-culm
bamboo flexural components through the use of a modified International Organization for
Standards (ISO) bamboo flexure test (see Section 2.3.1 and Figure 22e). The objective is to
develop a standardized test method for investigating splitting caused by flexure. Sixteen flexural
specimens of Dedrocalamus giganteus (Dendrocalamus), Phyllostachys pubescens (Moso), and
Bambusa stenostachya (Tre Gai) are tested. Data is recorded for ultimate strength, deflection,
and strains at the location of the splitting failure. Smaller scale flexural specimens are taken from
the culm wall of Tre Gai and Moso bamboo and tested in four-point bending. These smaller tests
are used to capture splitting in the culm wall thickness and study correlations to the full-culm
beam results. Test results are also compared with experimental test results for mode I (split-pin
tests) and mode II (bowtie) failures.
4.1 BAMBOO FLEXURAL BEHAVIOR
While bamboo has been shown to have advantageous tensile and compressive strength properties
in the direction of longitudinal fibers, better understanding is needed with regard to bamboo
97

flexural performance; specifically flexure-induced splitting in bamboo. As shown in Figure 4-1,
splitting often occurs in bamboo components and connections due to the weak lignin matrix, lack
of tangential fibers, and high rate of shrinkage due to drying.
(a) Beam splitting at joint (b) Splitting at bolted connections
Figure 4-1: Examples of bamboo splitting (Sharma 2010)
While bamboo flexural, shear, and tension perpendicular to fibers have been studied, flexure
induced splitting poses a unique concern as it comprises a mixed-mode failure with both
tangential tension (Mode I) and in-plane shear (Mode II). The objective of the current study is to
investigate a method for testing this dominate mode of failure.
4.1.1 Bamboo Flexural Behavior
The strength of a flexural element is determined from the maximum stress at either the extreme
tension or compression fiber of the section, σ. This maximum stress or modulus of rupture is
defined as:
IMc
=σ (4-1)
Where M is the moment at the section considered, c is distance from the neutral axis to the
extreme fiber of the cross section, and I is the moment of inertia of the cross section.
98

Janssen (1981) defined the maximum flexural stress for bamboo as the maximum
compressive stress corresponding to a controlling lateral tensile strain in the section. He
conducted both short- and long-term flexural tests on 5 m long (3.60 m free span), full-culm
bending specimens of Bambusa blumeana. A four-point bending test was chosen because this
arrangement provides a region of constant moment. Tests demonstrated that the flexural neutral
axis coincides with the centroid of the culm indicating that the tensile and compressive behaviors
have the same effective stiffness. Additionally, the bending strength was shown to decrease from
the bottom to the top of the culm while apparent modulus was shown to increase. Moisture
content and density were also shown to be significant parameters affecting flexural strength.
Creep behavior was shown to be described with a Burgers’ model (Burgers 1935). However,
Janssen also concluded that the ultimate bending strength is defined by both the ultimate shear
stress in the neutral layer (splitting) and the ultimate tensile strain transverse to the fibers at the
extreme compression fiber (resulting from the Poisson effect). The ratio of ultimate shear stress,
τ to density was shown to increase with the age of the bamboo culms before cutting up to 5 years
(Janssen 1981).
Since short flexural specimens can often fail in shear prior to a modulus of rupture being
achieved, Vaessen and Janssen (1997) developed a theoretical equation for determining the
critical length, lc, of a four-point bamboo bending test to ensure that the modulus of rupture is
achieved. They verified their approach with eight Bambusa bluemana test specimens. The
theoretical model assumed that a) all cross sections were perfectly circular; b) each culm had a
constant wall thickness; c) plane cross-sections remained plane after loading; d) Young’s
modulus remained constant over the length of the culm and varied linearly through the culm wall
in the radial direction; and e) the material behavior is linear-elastic. Experimental results
99
(Janssen 1981) suggest that cracking occurs at either the neutral layer or extreme fibers.
Therefore, the theoretical equation was developed based on the knowledge that “the specimen
will fail due to pure shear stresses or pure bending stresses”. The critical length is therefore the
length resulting in simultaneous failure of the compression zone (maximum bending stress) and
neutral layer (maximum shear stress) (Vaessen and Janssen 1997). Eight four-point bending tests
were conducted with 5 long specimens (shear span to culm diameter ratio, a/D ≈ 8 to 13) and 4
short (a/D ≈ 4 to 8) specimens. Six of the specimens exhibited behavior that was predicted by the
theoretical equation of critical length. Vaessen and Janssen also state that the functional
gradation of fibers in a culm increase the apparent value of flexural stiffness, EI, by 10% as
compared to a uniform distribution. While the bamboo can resist stress in the compression zone
parallel to the fibers, this compressive stress causes a lateral tensile strain perpendicular to the
fibers in the weaker lignin matrix. Using the critical value for this lateral strain determined by
Arce-Villalobos (1993) of 0.0011 and a Poisson’s ratio of 0.3 (Janssen 1981), Vaessen and
Janssen estimated a critical compression strain of -0.0037 and a corresponding ultimate bending
stress of 62 N/mm2 for the culms they tested. Similarly, an ultimate shear stress of 2.2 N/mm2
was determined from the same tests. The critical length for third-point bending was determined
to be 26.3 (rounded to 30) times the bamboo culm diameter, D. The critical shear stress
meanwhile is estimated as 2.3F/A (Janssen 2000). A specimen length of 30D, resulting in a shear
span of 10D, is used in the current ISO bamboo material test standards (ISO 2004b and 2004c).
Ahmad and Kamke (2005) studied the physical and mechanical characteristics of
Dendrocalamus strictus (Calcutta bamboo) using tension and bending tests. Calcutta bamboo is
the most widely used bamboo in India and is found in every state of the country. It was found to
have similar physical and mechanical characteristics to timber common in Malaysia and North
100
America. The authors studied the specific gravity (SG), equilibrium moisture content (EMC),
dimensional stability, tensile strength, and bending strength. The tests were conducted using the
ASTM standards for wood and wood-based materials D2395-93, D4933-91, and D143-94. Fifty
4.5 x 1.3 mm bending specimens, each 18 mm long, having both radial and tangential
orientations were taken from along the culm height between nodes and at internodes. Specimens
were conditioned at 20°C and 65% relative humidity for at least 3 weeks before the tests
resulting in an average moisture content at testing of 9.4%. Analysis showed that there were no
significant differences in modulus of rupture, MOR; stress at the proportional limit, SPL; or
Young’s modulus, E between the radial and tangential directions. The mean MOR in the radial
direction was 137 MPa and 148 MPa in the tangential direction. Mean values of E were 9790 and
9880 MPa in the radial and tangential directions, respectively. Mean SPL values were 90.9 and
91.9 MPa respectively. Values of SPL and E were shown to differ significantly between
internodes and nodes; MOR was not seen to vary for these locations. MOR, SPL and E were also
shown to vary along the height of the culm. The authors concluded that Calcutta bamboo has
bending strength and stiffness similar to or better than the timber species of Douglas-fir, yellow-
poplar, aspen, pine, and hemlock. Generally, the top of the culm had the best mechanical
properties.
Low et al. (2006) studied the structure, composition, and mechanical response of the
Australian bamboo Sinocalamus affinis (Rendle) McClue using synchrotron radiation diffraction,
Vickers indentation, three-point bend tests, and Charpy-impact tests. The bamboo tested included
both one year old and mature five year old culms. Results showed that the young bamboo had a
higher elastic modulus, flexural strength, impact strength, and fracture toughness. Hardness was
101

also found to be load and time-dependent. The major energy dissipative processes for producing
high toughness in bamboo were fiber debonding, crack deflection, and crack-bridging.
Obataya et al. (2007) studied the flexural ductility of split bamboo culms and compared
this with wood species through the use of cyclic bending tests. Three internodes of 150 mm
diameter were obtained from the mid-height of 3-year-old Phyllostachys pubescens (Moso)
culms. Internodes were cut into rods and then further divided into 240 mm long specimens from
various radial locations through the culm wall thickness. Wood specimens were developed from
spruce and beech woods. Four-point bending tests were conducted with strain gages placed on
the compression and tensile faces of the beam. Five specimens were tested with the higher fiber
density region (outer wall) acting in compression (type 1) while five others were tested with this
region acting in tension (type II). Three-point cyclic bending tests were also conducted on
bamboo and wood specimens. The results of the four-point bending tests showed that the
bamboo specimens had a Young’s modulus varying from 15 to 16 GPa irrespective of bending
orientation. However, the maximum curvature was twice as high for type I bending specimens
than for type II. This relationship was also shown for specimens from intermediate regions of the
cross section. The authors conclude that bending orientation affects flexural ductility but has less
impact on stiffness. Additionally, the flexural ductility of bamboo is best when the outer wall
portion is placed in tension while the inner wall portion is compressed (this, of course is not
possible in full-culm flexure). Studying the longitudinal compression behavior of the inner
portion of the culm wall, Obataya et al. postulate that the parenchyma cells in which bamboo
fibers are imbedded should be considered as a compressible foam-like structure. The behavior of
the bamboo was not greatly influenced by the method of loading (monotonic or cyclic) and the
modulus of elasticity of bamboo was shown to not be significantly different from that of wood
102

(Obataya et al. 2007). The combination of the multitude of fibers in the outer layer and the
compressible inner layer results in excellent ductility of the split-culm specimens considered.
4.1.2 Bamboo Shear and Splitting Behavior
Flexure induced splitting results from longitudinal shear, τ, in a culm section defined as:
ItVAy
=τ (4-2)
Where V is internal shear force at the location considered; I is the moment of inertia of the culm
section; t is the width of the cross section resisting shear; A is the area above the section of
interest; and y is the distance between the centroid of A and the neutral axis of the cross section.
This is shown schematically for a hollow thick-wall tube in Figure 4-2a and shows that τ has a
component in the plane of the cross section and in the longitudinal direction.
(a) Shear in thick-walled tube (b) Shear flow in thin-walled tube
Figure 4-2: Longitudinal shear due to flexure
The value of τ reaches its maximum value at the neutral axis (NA), where A is equal to half of
the culm cross sectional area. In this case Equation 4-2 becomes:
103

( )( )3223
22
max tRt4tR6R4t3tRt3R3V4−+−π
+−=τ (4-3)
For a thin-walled tube, where the thickness, t is assumed to be significantly smaller than the
outer radius, R, (conventionally, thin-walled sections are those in which R/t > 20) the direction of
the shear flow, q is always parallel to the walls of the tube (Fig. 4-2b) and the maximum shear
stress is calculated as:
g
max AV2
=τ (4-4)
Where Ag is equal to the area of the entire cross section.
The flexure induced shear stress, coupled with the bending stresses, results in a mixed
mode I and mode II stress condition along the culm shear span. Mode I tensile opening stress
(Figure 4-3a) perpendicular to the fibers results from the presence of a flexural gradient, while
mode II in-plane shear (Figure 4-3b) results from the flexure-induced shear (i.e.: Equation 4-2).
Mode III, out-of-plane shear (Figure 4-3c) of the culm wall would result from the addition of
torsional loading but is not considered in the present study.
In many materials, Mode II is a relatively tough mode of behavior having a relatively
high capacity in comparison to Mode I; however, in the presence of Mode I distortions, Mode II
capacity and toughness deteriorate significantly. Thus, the Mode I component of flexure is
believed to be the driving component of a splitting failure. Stated another way, splitting is more
likely to occur in the high-moment region of the shear span (where there is a shear component,
V) than in the constant moment region of a four-point bend test. However, direction of splitting
is dictated by the higher curvature and moment closer to the mid-span.
104

a) Mode I, opening tension
b) Mode II, in plane shear
c) Mode III, out-of-plane shear
Figure 4-3: Standard definitions of fracture modes (Smith et al. 2003)
4.1.2.1 In-Plane Shear (Mode II Failure)
Currently, there are two standard test methods for determining bamboo shear strength
parallel to longitudinal fibers as shown in Figure 4-4. Janssen (1981) developed the ‘bowtie’ test
(Figure 4-4a) in an attempt to quantify in-plane shear capacity; this test is adopted in the model
ISO standard for bamboo (ISO 2004b and 2004c). The test uses a full culm specimen tested in
compression parallel to the fibers. The specimen length, L is equal to the culm diameter, D.
‘Bowtie’ loading plates as shown in Figure 4-4a create four longitudinal shear planes at which
failure can occur. The shear strength is calculated from the culm wall thickness, t and the
ultimate load, F as:
∑=
quadrantsLt
F
4
τ (4-5)
Another accepted test is the ‘S-type’ test for inter-laminar shear, shown in Figure 4-4b
which has been standardized by INBAR (1999). This test is based on ASTM standard D2733-70
(1976) Method for Interlaminar Shear Strength of Structural Reinforced Plastics at Elevated
Temperatures and was adapted for bamboo by Moreira (1991). Coupons are taken from the culm
wall and allow shear plane orientation either parallel or perpendicular to the through thickness of
105

the culm. Tested in tension, the coupon is notched halfway through the width of the specimen at
two locations. This creates a plane of area A subject to direct shear (Fig. 4-4b); the inter-laminar
shear strength is therefore:
AF
=τ (4-6)
a) bowtie test for in-plane shear
(Janssen 1981, ISO 2004b) b) S-type inter-laminar shear test
(INBAR 1999, Cruz 2002) Figure 4-4: Current test methods for in-plane shear strength of bamboo
Cruz (2002) also developed a ‘lap shear’ test arrangement to study shear strength
perpendicular to the longitudinal fibers. Sharma (2010) provides an extensive review of available
bamboo test methods. Nonetheless, current available standardized tests do not investigate
bamboo splitting characterized by the tensile strength perpendicular to the bamboo fibers (Mode
I) or mixed-mode failures.
4.1.2.2 Bamboo Splitting (Mode I and Mixed-Mode Failures)
Research has been conducted to understand the strength characteristics and to develop
test methods for bamboo tensile strength perpendicular to the fibers: the Mode I component of
106
splitting resistance. The susceptibility to longitudinal splitting due to drying of thick-walled
bamboo can also be attributed to the presence of both longitudinal and tangential stresses and
weak tensile strength perpendicular to fibers. The low tensile strength perpendicular to fibers is
due to the fact that only the lignin matrix resists stresses in the tangential and radial directions of
the culm. Arce-Villalobos (1993) concluded that there is no correlation between the density of
bamboo and its transverse tensile strength implying that the capacity of the lignin is relatively
universal. Arce-Villalobos also states that bamboo samples fail at a specific tangential strain:
0.0011. Recognizing that Poisson’s ratio of 0.3 is also relatively constant for bamboo (Janssen
1981), the tangential strain can be related to longitudinal strain and ultimately to design criteria.
However, this limiting tangential strain approach can also be framed simply as relating to the
density and strength of the weak lignin matrix in the tangential direction. As reported by Shao et
al. (2009), Zeng et al. (1992) found that the tensile strength perpendicular to the longitudinal
fibers was only about 2% of that parallel to the fibers.
As discussed in Section 2.3.2, Mitch et al. (2010) and Sharma (2010) sought to develop
laboratory and field tests for tensile strength perpendicular to the longitudinal fibers. Mitch et al.
developed the split-pin test shown in Figure 4-5a. Based on fundamental linear elastic fracture
mechanics, the test consists of a full culm specimen having a transverse hole. Horizontal notches
are made at the edge of the holes in order to initiate failure in the horizontal plane. A split steel
pin is inserted and loaded such that a transverse tension failure of the culm results. Ultimately,
the test determines the direct tension capacity perpendicular to the longitudinal bamboo fibers
(Eqn. 4-7) and can be used to assess the fracture toughness of the culm (Eqn. 4-8). Results
showed that the test improved upon the repeatability of test results as compared to the ‘bowtie’
107

108
or S-specimen tests shown in Figure 4-4. The tension capacity perpendicular to the longitudinal
fibers, σ┴, is given as:
atLt
F
42 (4-7)
Where the specimen dimensions are shown in Figure 4-5b. The Mode I strain energy release rate
(a measure of fracture toughness), GI, is given as:
E
KG I
I
2
(4-8)
Where E is the elastic modulus of the material and KI is the crack intensity factor for the
specimen geometry:
21
tan2
L
a
a
La
Lt
FK I
(4-9)
a) test set-up b) specimen dimensions
Figure 4-5: Split-Pin Test (Mitch 2009)
Sharma (2010) sought to develop a less complex test that could be applied in the field and
correlate with the split-pin test which requires specimen machining, a complex test apparatus and
a method of applying tension; all impractical in a field test. The edge bearing test, shown in
Figure 4-6, was proposed as a surrogate for the more complex split-pin test, since a compression
F/2
F/2

test is more easily implemented. The edge bearing test is composed of a full culm specimen
loaded in compression perpendicular to the bamboo fibers. The test is used to determine the
transverse modulus of rupture for the culm walls, fr (Eqn. 4-10) – a measure of transverse tension
capacity:
( )
( )r
rrEWrEW
r
rrNSrNS
IhcMf
IhcMf
+=
+=
(4-10)
Where the applied moments are given as:
2wLR
ARI1wLRM
ARI1wLRM
c2c
cEW
2c
cNS
−
−
π=
−
π=
(4-11)
In Equations 4-10 and 4-11, the NS and EW subscripts refer to the specimen quadrant indicating
applied moments in which the tension is along the inner or outer culm wall, respectively (see
Figure 4-6 for moment directions and rupture patterns).The subscript r in Equation 4-10 refers to
the culm properties at the quadrant at which the rupture occurs. In Equation 1-10, cr= t/2 and
refers to the distance from the midline of the culm wall to the edge of the wall section at the
location of rupture while hr is the distance from the culm wall midline to the elastic neutral axis
of the culm wall measured toward the center of curvature at the location of rupture (Sharma
2010). In Equation 4-11, A = Lt and I = Lt3/12 are the area and moment of inertia of the single
culm wall in through-wall flexure. Rc is defined as the culm radius measured to the midwall
thickness; that is Rc = (D-t)/2.
109

Figure 4-6: Edge Bearing Test (Sharma 2010)
Amada and Untao (2001) also studied the fracture toughness of bamboo culms and nodes
at the macroscopic level using notched tensile tests from 2 year old Phyllostachys edulis
(Mousou). The fracture characteristics of bamboo were considered to be first fiber-cracking.
Dog-bone specimens having a width equal to the culm wall thickness and a gauge length of 50
mm were used. A 0.4 mm thick notch was cut perpendicular to the fibers from the outer surface
of the specimen using a razor blade. The fracture toughness calculated based on this specimen
geometry had the highest value at the outer surface of the culm and decreased towards the inner
surface. The average fracture toughness was determined to be 56.8 MPa∙m1/2 which is higher
than most wood species. The authors concluded that the fracture toughness is proportional to the
volume fraction of the fibers, Vf, through the culm wall thickness. Furthermore, the fracture
toughness in the outer layer and the average value increased marginally with height in the culm.
Finally, the fracture toughness of bamboo nodes was found to be 18.4 MPa∙m1/2, which was
lower than that at the inner surface (Amada and Untao 2001). It is important to note that the
specimen geometry used by Amada and Untao measures the toughness of the longitudinal
bamboo fibers and matrix across the cross section and says little of the toughness associated with
longitudinal splitting.
110

Shao et al. (2009) studied the Mode I inter-laminar fracture properties of Phyllostachys
pubescens (Moso) bamboo. The Mode I inter-laminar fracture toughness, GI was measured based
on the energy method using double cantilever beam specimens and a scanning electron
microscope to study fracture surfaces. According to the authors, once there are cracks in
bamboo, the delaminating propagation is not controlled by the strength but by interlaminar
fracture toughness which is a basic characteristic of the bamboo. The Moso used in the study was
4 years old and had a total height of approximately 15 m. Seventeen double cantilever specimens
were taken from the culm wall at heights of 1.3, 3, and 5 m along the culm. The moisture content
was approximately 11% during testing. The mean value of Mode I inter-laminar strain energy
release rate was determined as GI = 358 J/m2 (COV = 17%). No significant difference in fracture
toughness was found for specimens located at different heights along the culm. Crack
propagation was shown to develop along the longitudinal interface between fibers or ground
tissue and the crack was a self-similar fracture without fiber-bridging (Shao et al 2009) which is
consistent with a pure Mode I failure. The authors also concluded that the resistance arresting
crack propagation is controlled by the inter-laminar strength between fibers or ground tissue.
Tan et al. (2011) conducted a multi-scale study on the fracture behavior and resistance
properties of Moso bamboo as a functionally-graded material. First, the study used nano-
indentation experiments to study the variation of Young’s modulus in the radial and longitudinal
directions of the culm as well as to study micro-scale tensile properties. Next, the resistance
curve behavior of bamboo was investigated with four point bending experiments. Specimens
were 4.2 x 4.0 x 40.0 mm in size and had notches (notch to width ratio of approximately 0.45) at
midspan. Specimens were composed of three groups: those having notches on the outer culm
face with the highest fiber density (outside crack); notches on the inner culm face with lowest
111

fiber density (inside crack); and notches on the side face (side crack). The tests were conducted
under displacement control with a loading rate of 0.01 mm/s. The finite element method was
then used to calculate the energy release rates for crack geometries used in the experimental
testing. Crack bridging models were used to investigate bridging effects in the bamboo fracture
behavior. Energy release rates for crack bridging models as well as the finite element models
were shown to have good agreement with results from the experiments. Inside crack specimens
were shown to exhibit the highest energy release rates or toughness followed by the side crack
specimens and outside crack specimens respectively. The authors concluded that this was due to
high cellulosic bridge densities in the inside crack specimens (Tan et al. 2011). Meanwhile the
intermediate behavior in the side crack specimens was attributed to crack tip shielding caused by
ligament bridging.
Zhao et al. (2011) studied mixed-mode cracking in the fracture of bamboo flexure
specimens using digital speckle correlation method (DSCM) instrumentation. Specimens were
taken from the culm wall of four year old Phyllostachys pubescens (Moso). Flexural specimens
had a length of 160 mm, a test span of 120 mm, and were 10 mm square. One specimen category
(Bamboo-O) had the outside face of the culm wall in tension while another (Bamboo-I) had the
inner face of the culm wall in tension. A 4 mm crack was placed at mid-span in the tension face
of the flexural member and load was applied 15 mm to the left of mid-span according to Chinese
National Standard GB/T15780-1995 (as reported by Zhou et al). A CCD camera was used to
capture the speckle image continuously during the test. DSCM was then used to determine the
crack opening displacement (COD). The stress intensity factors KI and KII were also calculated.
Results showed that the COD for Bamboo-O was less than that for Bamboo-I while the stress
112

intensity factors for Bamboo-O were greater than those for Bamboo-I. The authors conclude that
the gradient distribution of bamboo has a protecting function for a static crack in the inner layer.
The objective of the current study is to investigate the mixed-mode longitudinal shear
behavior of full culm bamboo flexural components and work to develop methods for a testing
procedure of full culm specimens. While studies by Tan et al. (2011) and Zhou et al. (2011)
investigated small-scale specimens taken from thin walled bamboo species, the current study
investigates full-culm specimens of both thin-walled and thick-walled bamboo species. In
addition, the work seeks to correlate the mixed-mode strength behavior with Mode I and Mode II
behavior seen in split-pin and bow-tie tests in order to estimate the primary driver of the flexural
splitting failure.
4.2 EXPERIMENTAL PROGRAM
The experimental portion of this investigation was composed of three phases: a) estimation of the
Mode I and Mode II capacities of the bamboo using bowtie and split-pin tests; b) small scale
beam tests of rectangular specimens taken from the culm wall; and c) full-culm modified ISO
flexural tests to determine longitudinal splitting strength. The specimens, test methods and
results of these phases are described in the following sections.
4.2.1 Bamboo Species and Test Locations
Three species of bamboo were used for the full-culm modified flexural tests. Dedrocalamus
giganteus (Dendrocalamus) and Phyllostachys pubescens (Moso) were tested in the Structures
113

and Materials Laboratory at the Pontifícia Universidade Católica de Rio de Janeiro (PUC) during
the author’s tenure as a visiting researcher from February to June 2012. Moso specimens tested
at PUC were supplied from an off campus facility while 10 to 12 year-old Dendrocalamus culms
were harvested from the PUC campus in 2010. Eight Dendrocalamus culms were harvested and
cut into 4 m sections; test specimens were selected from this group. It should be noted that the
Dendrocalamus culms were stored unsheltered outside the laboratory. This did not allow the
untreated bamboo to dry properly and resulted in infestation of the bamboo by insects that eat the
starches as they tunnel through the culm.
Additional full-culm specimens of Phyllostachys pubescens (Moso) and Bambusa
stenostachya (Tre Gai) were tested in the Watkins-Haggart Structural Engineering Laboratory
(WHSEL) at the University of Pittsburgh. Specimens were ordered from a bamboo importer in
Portland, Oregon (www.bamboocraftsman.com) with Moso specimens shipped from China and
Tre Gai specimens from Vietnam. Specimens for the bowtie, split-pin, and small beam tests were
fabricated from the same batch of Moso and Tre Gai culms as the full-culm tests in Pittsburgh
and were also tested in the WHSEL Lab.
4.2.2 Bowtie Tests
‘Bowtie’ tests (Fig. 4-4a) were conducted in accordance with ISO standard 22157-
1:2004(E) (ISO 2004b) on six Moso and five Tre Gai specimens to estimate the Mode II in-plane
shear strength (τ) of each species. Specimens were taken from undamaged regions of full-culm
beam specimens after testing. For each specimen, measurements of wall thickness and specimen
length were taken at each quadrant (N, S, E and W) at each end of the specimen; these
dimensions are summarized in Table 4-1. The length of each specimen was equal to
114

approximately one culm diameter as required by the ISO standard. Specimen ends were cut
parallel and at right angles to the axis of the specimen.
Table 4-1: Bowtie Test Specimen Geometry and Results
Bowtie Test Culm
Avg. diameterD Avg. length, L Avg. Culm Wall Thickness, t Shear
Area Ult. Load Shear
Stress (Eq. 4-5)
(mm) (mm) L/D N (mm)
S (mm)
E (mm)
W (mm) mm2 kN MPa
M1 M8-7-1 65.0 68.6 1.06 5.48 5.35 5.23 5.42 1473 20.83 14.14 M2 M8-8-1 63.6 67.4 1.06 5.31 5.70 4.91 4.89 1402 20.62 14.71 M3 M8-8-2 63.0 68.8 1.09 5.31 5.10 5.53 5.74 1491 19.61 13.15 M4 M9-14 60.5 62.0 1.02 5.79 6.06 6.04 5.74 1464 25.22 17.23 M5 M12-9 64.7 67.7 1.05 6.47 6.83 6.71 6.78 1814 23.99 13.23 M6 M12-10 64.2 67.0 1.04 6.58 6.91 6.62 7.07 1822 23.59 12.94
Avg. (COV)
14.20 (0.104)
T1 T7-2 65.2 70.2 1.08 23.54 21.34 25.29 22.47 6503 58.36 8.98 T2 T7-3 65.7 66.6 1.01 23.91 22.71 21.27 23.25 6071 56.89 9.37 T3 T7-10 64.1 80.4 1.25 20.14 22.19 18.10 20.01 6463 48.89 7.56 T4 T7-11 64.2 66.8 1.04 16.07 19.48 18.68 20.40 4985 45.15 9.06 T5 T11-1 65.9 65.7 1.00 20.50 20.47 24.58 25.29 5966 49.42 8.28
Avg. (COV)
8.65 (0.075)
Specimens were tested in an Instron universal testing machine with ‘bowtie’ compression
loading plates as shown in Figure 4-4a. Specimens were oriented in the testing apparatus so that
shear planes occurred at the cardinal designations. A specified loading rate of 0.01 mm/sec was
used as prescribed by ISO. The maximum load and location(s) of failure were noted for each
specimen and testing stopped automatically when the load fell to 50% of the peak.
4.2.2.1 Bowtie Tests Results
Results of the bowtie tests are shown in Table 4-1. In-plane shear stress is calculated
from Equation 4-5. Moso specimens had an average ultimate shear strength of 14.23 MPa with a
COV of 0.104, while Tre Gai specimens displayed an ultimate shear strength of 8.65 MPa with a
COV of 0.075. This latter value is close to the value of 8.8 MPa determined by Mitch (2009) for
115

the same species (although a different batch of culms). The COV from the current tests is
considerably better than the 0.30 value reported by Mitch.
Failure of bowtie specimens generally occurred along two of the shear planes created by
the loading plates. The first failure typically occurred at the peak load. In two of eleven tests,
after the initial failure and load reduction, the specimen carried additional load until a second
failure occurred in the shear plane opposite of the initial failure (Fig. 4-7a). In two tests, the first
failure occurred and the load dropped below 50% of that peak, ending the test. Five specimens
failed initially at a shear plane but experienced multiple additional cracks at a second peak,
breaking the specimen into three separate pieces. The additional cracks in this category of
failures occurred both at shear planes and between shear planes (Fig. 1-7b). Finally, two tests
saw cracking between shear planes. This failure indicates a degree of flexure across the
unsupported quadrant and may indicate initial flaws in the test specimens. In most cases, the
ultimate load and shear stress were similar for each specimen. In all cases, the shear failure
ruptures along the entire length of the specimen.
(a) Failure at shear plane (b) Failure between shear planes
Figure 4-7: Examples of Bowtie Test Failure Planes
116

4.2.3 Split-Pin Tests
Split-pin tests were conducted on four Moso and three Tre Gai specimens in order to determine
the Mode I tensile strength perpendicular to fibers (σ┴) of each species as well as the Mode I
stress intensity factor (KI). Similar to the bowtie tests, specimens were taken from full culm
beam tests after testing and measurements of wall thickness were taken at the East and West
quadrants at both ends of the specimen. Specimen length and diameter at both ends were also
measured. All dimensions are summarized in Table 4-2 and Figure 4-5b. The length (L) of each
specimen was equal to approximately one culm diameter as recommended by Mitch (2009).
Each specimen has a 25.4 mm diameter hole drilled through the east and west sides. Both holes
were created with a single pass of a drill press to maintain symmetry of the specimen. The
diameter of the hole is required to be between 0.1D and 0.5D. Crack initiators 3 mm in length
were cut parallel to the length of the culm on either side of the drilled hole with a fine toothed
hacksaw blade resulting in a dimension 2a = 31.4 mm (see Fig. 4-5b).
Table 4-2: Split Pin Test Geometry and Results
Split-pin Test Culm Avg. D Avg. length, L teast twest Fult
σ┴ (Eq. 4-7)
KI (Eq. 4-9)
(mm) (mm) L/D (mm) (mm) (kN) (MPa) (MPa•m1/2) M1 M8-1 80.5 110.6 1.37 6.19 6.15 1.69 1.73 0.28 M2 M8-5-1 69.9 73.1 1.05 5.46 5.34 1.05 2.33 0.32 M3 M8-7-3 66.3 74.6 1.12 4.95 5.21 0.97 2.21 0.31 M4 M8-7-4 65.8 63.0 0.98 5.38 5.32 1.13 3.34 0.42
Avg. (COV)
2.40 (0.244)
0.33 (0.178)
T1 T11-2 66.0 69.2 1.05 19.56 19.11 2.46 1.68 0.22 T2 T11-3 66.4 70.5 1.06 20.31 19.51 1.83 1.18 0.16 T3 T11-8 67.8 73.6 1.09 15.34 15.43 2.23 1.71 0.24
Avg. (COV)
1.52 (0.162)
0.21 (0.166)
The specimens were loaded at a rate of 0.005mm/sec using an Instron universal testing
machine and the ultimate load was recorded for each test.
117

4.2.3.1 Split-Pin Test Results
Results from the split-pin tests are presented in Table 4-2. The tensile capacity
perpendicular to the length of the fibers (σ┴) and stress intensity factor (KI) are calculated from
Equations 4-7 and 4-9, respectively. An average ultimate tensile strength of 2.40 MPa having a
coefficient of variation of 0.244 was calculated for the Moso specimens while Tre Gai specimens
had an average ultimate tensile strength of 1.52 MPa and a coefficient of variation of 0.162. The
stress intensity factors for Moso and Tre Gai specimens were 0.33 MPa•m1/2 and 0.21 MPa•m1/2,
respectively. The coefficient of variation was 0.178 and 0.166 for both species respectively. The
results observed for the Tre Gai specimens were comparable (although slightly higher) to results
presented by Mitch et al. (2010) for similar Tre Gai tests which had an average ultimate tensile
strength of 1.06 MPa and a stress intensity factor of 0.17 MPa•m1/2, both with a COV of 0.22.
4.2.4 Small Scale Flexural Tests
Small beam tests were conducted to determine the longitudinal shear strength of bamboo within
the culm wall. Four specimens of Moso and five specimens of Tre Gai were cut from the culm
wall internodes (Fig. 4-8a) using a milling machine. Specimen dimensions are reported in Table
4-3. Specimens were oriented in such a way that the width, b was measured in the radial
direction of the culm and the height, h was oriented in the tangential direction (Fig. 4-8a). The
height to width ratio of the specimens was kept as close to a value of 2 as was possible (Table 4-
3). As shown in Figure 4-8, the specimens were tested in four point bending with a 0.5h deep
laser-cut notch (Figure 4-8c) cut into the tension face under one load point. The first specimen in
each species series was tested without a notch as a control. The notched orientation was selected
to result in similar orientation as in full-culm specimens described in the following section.
118

a) test set-up orientation and dimensions
b) test set-up (Specimen T4 shown)
c) notch d) typical failure (Specimen T4 shown)
Figure 4-8: Small Beam Flexural Specimen Configuration
Table 4-4 provides the average geometry of the beam specimens tested. Moso specimens were
tested over a simple span of L = 152 mm with shear span lengths of 51 mm. The Tre Gai
specimens were tested over a simple span of L = 229 mm with shear span lengths of 76 mm. The
variation in sizes was due to the larger internode lengths in the Tre Gai culms. A Vic-3D imaging
system (described in Section 3.3.3) was used in order to investigate the stress concentration at
the notch location and capture splitting in the specimen.
119

Table 4-3: Small Beam Geometry and Results
Small Beam
Specimen Notched
dimensions at notch Shear, V Shear Stress,
τ (Eq. 4-2)
b H h/b Area at crack initiation (mm) (mm) (mm2) (N) (MPa)
M2 N 5.88 12.13 2.06 71.3 334 7.02 M6 Y 5.64 12.65 2.24 71.3 56 1.19 M7 Y 5.97 12.67 2.12 75.7 114 2.25 M9 Y 5.98 12.37 2.07 74.0 99 2.01
Avg.
(COV) 1.28
(0.307) T4 N 12.01 19.13 1.59 230 905 5.90 T5 Y 11.47 18.75 1.63 215 77 0.54 T6 Y 10.86 19.39 1.79 211 145 1.04 T8 Y 10.99 17.97 1.64 197 107 0.81
T10 Y 10.46 17.69 1.69 185 95 0.77
Avg. (COV)
0.788 (0.260)
4.2.4.1 Small Scale Beam Test Results
The results of the small scale flexural tests are presented in Table 4-3 and Figure 4-9 for
the Moso and Tre Gai specimens. First, un-notched specimens M2 and T4 were shown (as
expected) to have much higher shear capacity than notched specimens (Table 4-3); this value is
characteristic of the species and test geometry. In the notched specimens, failure occurred at the
notch at the first peak of loading as shown in the applied shear versus stroke diagrams. For Moso
specimens M7 and M9, this peak also corresponded with maximum shear stress for the entire test
(Fig. 4-9a). All Tre Gai specimens except T5 experienced a secondary loading phase (Fig. 4-9b)
indicating a very tough post-peak behavior.
120

a) Moso Specimens b) Tre Gai Specimens
Figure 4-9: Shear Stress (MPa) v. Stroke (mm) for Small Notched Flexural Specimens (curves offset for clarity)
It is noted that several Tre Gai tests were ultimately stopped due to the maximum deflection limit
of the test arrangement being reached (the beams ‘bottomed out’ on the test frame). Notched
Moso specimens had an average shear stress, τ1 at splitting of 1.82 MPa with a COV of 0.31,
while Tre Gai specimens had an average shear stress value of 0.79 MPa with a COV of 0.26.
Representative results of the failure mode and strains estimated using the VIC-3D
imaging system are shown in Figure 4-10 for an un-notched Tre Gai specimen (T4) and in Figure
4-11 for a comparable notched specimen (T8). The un-notched specimen (Fig. 4-10a) shows
bending strains (εxx) increasing during the test as expected with compression at the top face and
tension on the bottom face of the beam (Figs. 4-10b - e). Meanwhile, in the photos of the
representative notched specimen, the primary failure mode was for an initial crack to propagate
from the notch towards midspan (Figs. 4-11b and 4-8d). As the cracking towards midspan
became substantial (in some cases through the entire constant moment region) cracking towards
the support would develop. Figure 4-11d shows strain associated with bending (εxx) and the
concentration of stress at the location of the notch. Meanwhile, Figure 4-11e illustrates the
0.00.20.40.60.81.01.21.41.61.82.02.22.4
0.0 5.0 10.0 15.0 20.0
Shea
r Stre
ss (M
Pa)
Stroke (mm)
M6
M7
M9
0.0
0.2
0.4
0.6
0.8
1.0
1.2
1.4
1.6
0.0 5.0 10.0 15.0 20.0 25.0
Shea
r Stre
ss (M
Pa)
Stroke (mm)
T5
T6 T10T8
121

122
concentration of vertical strain (εyy) along the crack as it continues to open. The failure behavior
of the small beams will be compared with the results of the full-scale specimens described in the
following section.
Figure 4-10: VIC-3D contour images for un-notched Tre Gai beam specimen
%HDP7HVW=
- -
T4 Small Beam Test
A
B
C
D
E
εxx strain
εxx
strain
εxx
strain
εxx
strain
0
-0.005
0.005

123
Figure 4-11: VIC-3D Contour Images for Notched Tre Gai Specimen
- -
- -
N -WT4 Small Beam Test
A
B
C
D
E
εxx
strain
εyy
strain
0
0.005
-0.005
4.2.5 Full-Culm Flexural Tests
Full-culm flexure tests were conducted both at the University of Pittsburgh (UPitt) and the
Pontifícia Universidade Católica de Rio de Janeiro (PUC) using three different species of
bamboo (Dendrocalamus, Moso, and Tre Gai). As described in the following section, the tests
consisted of four-point bending tests (ISO 2004b) modified with a notched specimen in order to
better measure the longitudinal shear behavior of the culm in flexure and investigate the potential
of the modified test as a reliable standard test method. The full-culm results were also correlated
with the results of the smaller scale tests for Mode I, II, and mixed mode failures.
4.2.5.1 Specimens
Full-culm flexure specimens were selected from batches of Dedrocalamus giganteus
(Dendrocalamus) and Phyllostachys pubescens (Moso) and Bambusa stenostachya (Tre Gai).
Specimens of Dendrocalamus and Moso culms tested at PUC were tested over simple spans of
3000 mm and 2760 mm, respectively. Moso and Tre Gai culms tested at UPitt were tested with
simple spans of 2896 mm and 2286 mm, respectively. Span lengths were selected to meet the
30D span requirements of ISO 22157 (2004b) and were also dictated to some extent by culm
lengths available from suppliers.
For geometric measurements, the section quadrants of the bamboo culm cross sections
were assigned cardinal directions (North, South, East, and West) and each internode was
numbered from the base to the top of the culm. The initial variability in geometry was catalogued
prior to testing. Measurements were taken along each culm’s length for diameter, variation from
a plumb axis (to determine initial out-of-straightness), wall thickness (wall thickness
124

measurements were taken following testing when the culms were cut into sections), and
internode length. Measurements were taken by placing the bamboo in a specially designed jig as
shown Figure 4-12. The culm is placed between two parallel string lines set a constant distance
apart; measurements were taken between each string and the culm. From this, both the culm
diameter and deviation from centerline or “out-of-straightness,” can be determined.
Measurements were taken at the center of each internode, load/notch points, and support points
in both principle axes (N-S and E-W; i.e.: each culm was rotated 90 degrees in the jig for a
second set of measurements). Table 4-4 summarizes values for culms used in this study. The
gross cross section area (Ag) and moment of inertia (I) are based on the average diameter (D) and
wall thickness (t) values measured at each internode, averaged over the culm length.
a) support condition of
measuring jig. b) culms that are (top) relatively straight and (bottom) significantly curved in jig.
Figure 4-12: Jig for measuring bamboo culms
Twenty specimens were tested in flexure and their geometric properties are summarized
in Table 4-4. With the exception of one specimen of Dendrocalamus (DB2 0.0125S), all
specimens had maximum out of straightness less than 1% of span length. Based on culm
diameter to wall thickness, Moso and Dendrocalamus are considered thin-walled species, having
D/t > 10, while Tre Gai is a thick-walled species. Specimens tested at PUC had larger cross
sections than those tested at Pitt. Finally, all efforts were made to maximize the test span and
respect the S > 30D requirement (ISO 2004a); due to culm availability, this was not always
possible with some of the specimens tested at PUC.
125

Table 4-4: Geometric Properties of Bamboo Flexure Specimens and Test Details
Test Culm
Test Span,
S
average dimensions over culm length notch location (see Fig.
1-5)
Shear V = F/2
Shear Stress, τ
(Eq. 4-12)1 D T Max. out of straightness, δ
Area, A
Moment of Inertia,
I at initiation of failure at notch
(mm) (mm) (mm) (mm) δ/S (mm2) (mm4) (N) (MPa) Moso tested at UPitt
1 MP9 2896 67 8 7 0.0025 1434 652864 none 1526 2.66 2 MP4 2896 75 7 7 0.0025 1401 822364 none 2156 3.55 3 MP1 2896 72 5 15 0.0052 1135 625468 P2 244 0.50
3B P1 293 0.48 4 MP2 2896 71 8 13 0.0044 1505 756185 P2+D 375 0.66
4B P1+D 456 0.64 5 MP12 2896 62 7 8 0.0026 1188 467654 none 1124 2.23 6 MP8 2896 71 6 15 0.0053 1181 630323 P2+D 337 0.63
6B P1+D 119 0.19 Avg. (Notched) 0.52
COV 0.348 Tre Gai tested at UPitt
7 TP7 2286 65 21 5 0.0023 2896 873988 none 4306 2.07 8 TP8 2286 67 16 11 0.0049 2587 930004 P2+D 402 0.33 9 TP2 2286 66 12 8 0.0035 2060 783247 P2+D 293 0.33 10 TP3 2286 63 16 9 0.0038 2382 715878 P1+D 440 0.32
Avg. (Notched) 0.33 COV 0.031
Dedrocalamus tested at PUC 11 DB1 3000 95 9 25 0.0084 2453 2292217 none 1928 1.50 12 DB2 3000 109 10 38 0.0125 3137 3849267 none 5227 3.53 13 DB3 3000 145 16 16 0.0052 6600 13859277 P1 1468 0.38 14 DB4 3000 136 13 13 0.0042 4944 9576049 P1 1707 0.69 15 DB5 3000 109 19 20 0.0065 5437 5746187 P2 1082 0.43
Avg. (Notched) 0.50 COV 0.332
Moso tested at PUC 16 MB5 2760 105 10 2 0.0008 3057 3476649 none 5014 3.48 17 MB3 2760 95 9 19 0.0069 2531 2380560 none 2593 2.37 18 MB4 2760 95 9 24 0.0085 2433 2276357 P2 536 0.47 19 MB2 2760 83 8 9 0.0033 1941 1409975 P2 164 0.19
Avg. (Notched) 0.33 COV 0.598
1 calculated using dimensions measured at notch location
4.2.5.2 Experimental Flexural Test Arrangement
The configuration of the flexural tests follows the guidelines of ISO 22157 (2004b) with
a specimen having a span, S ≥ 30D, and equal shear spans, S/3 ≥ 10D. This specimen geometry
is necessary to ensure a flexure-dominated behavior (Vaessen and Janssen 1997). In order to
126

study longitudinal shear behavior, the test is modified as shown in Figure 4-13c with a vertical
notch of length 0.5D cut into the tension side of the flexural member at the end of the constant
moment region. When loaded, the notch will initiate a longitudinal shear failure at its root. The
maximum longitudinal shear flow at the notch root corresponding to this geometry can then be
calculated from equations 4-3 or 4-4 for thick or thin-walled species, respectively. As shown in
Table 4-4, some specimens of each species/location group were tested without a notch to
determine the apparent flexural capacity of the material and observe any longitudinal shear
failures. This was followed by tests using notched specimens to investigate the longitudinal shear
flow capacity. As shown in Figure 4-13c, some specimens were notched directly under a load
point (P1 or P2) while other specimens were notched at a distance of one culm diameter, D from
the load in the adjacent shear span (P1+D or P2+D). Notches approximately 2 mm wide were cut
using either an electric circular saw (UPitt) or hand saw (PUC). Vertical deflection was recorded
at load and support points using draw wire transducers (DWT). Electric resistance strain gages
were placed at the root of the notch, as shown in Figure 4-14c in an effort to capture the
tangential strain at the moment of initial splitting. All notched specimens had two strain gages
located at the notch on the side of the support. Tests 6 (MP8), 6B (MP8), 8 (TP8), 9 (TP2), and
10 (TP3) also had two strain gages located at the notch on the side towards mid-span. Strain
gages at the mid-span of the culm (i.e.: within the pure-moment region) were used to measure
extreme compressive and tensile strains or tangential strain (Fig. 4-13d) depending on the
specimen. Un-notched specimens at PUC had mid-span strain gages measuring the extreme
compression and tension strains due to bending while un-notched UPitt specimens had mid-span
gages measuring tangential strains. Finally, the first test failures of three UPitt Moso specimens
127

were repaired using pipe clamps, the culms re-notched at the other support, and the culms
retested; these second tests are designated 3B, 4B and 6B in Table 4-4.
a) Full-culm flexure test configuration used at UPitt.
b) Full-culm flexure test configuration used at PUC.
c) Notch detail at point P1 or P2 d) Strain gage detail at point M
Figure 4-13: Modified flexure test for full scale culms
The test configuration varied between the two testing locations as shown in Figure 4-13. At
UPitt, the testing configuration was arranged as shown in Figure 4-13a with the culm supported
in saddles made of lifting-sling straps and loaded from above with a spreader beam. DWTs
measured displacement directly at the mid-span, load points, and at the supports. Specimens
were tested in a Baldwin universal testing machine under displacement control. At PUC, a
manual loading apparatus was designed as shown in Figure 4-13b. Using a manual crank and
loading plate beneath the testing floor, a spreader beam was pulled downward to load the culm in
128

flexure. Two load cells and displacement transducers measured load and displacement at each
loading point while two additional transducers measured displacement at the supports. In both set
ups, care was taken to ensure that loading and support points provided sufficiently large bearing
area and flexibility in order to mitigate local crushing of the culm walls; this is crucial in the
design of such tests.
4.2.5.3 Experimental Full-Culm Test Results
The results of the full-culm tests provided information not only on the longitudinal shear
strength of bamboo culms in flexure but also on the functionality of the proposed modified test
arrangement. In the case of the PUC test arrangement (Fig. 4-13b), all specimens were able to
achieve failure. However, the test is unstable in nature; the culm could become unseated from the
roller support and the spreader beam can become inclined (thereby applying unequal load) as the
splitting progresses at the notch. For the UPitt orientation, the test was more stable, yet had
issues of the culm surface coming off the loading saddle at the notch location after sufficient
cracking had occurred (although this only affects post-peak behavior) . Most un-notched
specimens tested at UPitt also reached the maximum deflection limit allowed by the test
configuration before failure (i.e.: specimens ‘bottomed out’; the test requires greater clearance
than was provided). However, all notched specimens were able to reach their ultimate failure
before ‘bottoming out’.
129

a) Unnotched specimen (M4) under load
b) Notched specimen (T8) under load
c) Notch before test (T8) d) Notch during test (T8)
Figure 4-14: Representative test pictures
Figure 4-14 illustrates both an un-notched specimen (M4) under loading (Fig. 4-14a) and a
notched specimen (T8) at failure (Fig. 4-14b). Un-notched specimens showed a smooth load-
displacement curve as illustrated in Figure 4-15a. These also illustrated a stable hysteretic
behavior and permanent deformations when tested over several cycles. This is in contrast to the
behavior of notched specimens which exhibited several peaks before ultimate load is reached
(Fig. 4-15b). These intermediate peaks are believed to coincide with initial cracking and discrete
propagation of the crack developed at the root of the notch (Fig 4-14d). Nine of fourteen notched
specimens exhibited this ‘sawtooth’ behavior.
130

a) un-notched specimen M12 b) notched specimen T8
Figure 4-15: Representative load-displacement curves
Figure 4-14 illustrates the notch detail in a representative Tre Gai specimen (fully shown
in Figure 4-14b) both before testing (Fig. 4-14c) and during testing after cracking has occurred
(Fig. 4-14d). For the majority of specimens regardless of species or notch location, initial
cracking was directed towards the midspan of the culm. In some specimens, further loading
resulted in a second crack developing on the other side of the notch which propagated towards
the near support. As discussed in the next section, the dominant direction of cracking is driven by
the direction of increasing moment and curvature in the beam, which is towards mid-span and
the constant moment region.
The test results are summarized in Table 4-4 for all tests and catalogued by species.
Specimens of Moso tested at UPitt and PUC are listed separately due to the fact that material
properties of bamboo can vary between different batches of culms. Shear, V = F/2, is shown for
the ultimate strength or for the first peak if a ‘sawtooth’ load-displacement curve was observed.
Shear stress, τ at the notch at initial splitting for the thick-walled Tre Gai is calculated from
0
0.5
1
1.5
2
2.5
0 100 200 300
Load
(kN
)
Displacement (mm)
Un-notched specimen M12
0.0
0.2
0.4
0.6
0.8
1.0
1.2
1.4
1.6
0 10 20 30 40 50 60
Load
(kN
)
Displacement (mm)
Notched Specimen T8
131

Equation 4-3 which may be simplified for the given test geometry (i.e.: notch depth = 0.5D and
notch at edge of shear span) as:
(4-12)
Shear stress for thin-walled Moso and Dendrocalamus may be calculated using Equation 4-4
which was found to agree very well with Equation 4-12 for the specimens whose D/t ratios were
generally 10 or greater (Table 4-4). Equation 4-4 over-estimated the experimentally observed
shear stress by about 7% for the Tre Gai, whose D/t ≈ 4.2 clearly indicates thick-walled
specimens. Nonetheless, as an approximate estimate, Equation 4-4 is suitable.
As expected, the strength of the un-notched specimens was significantly higher than the
strength of notched specimens. Recall, that testing with L/D > 30 is intended to mitigate the
splitting mode of failure in a beam test (Vaessen and Janssen 1997). Nonetheless, some
longitudinal cracking was seen to develop in some un-notched specimens (MP9, MP4, and TP7).
Specimen MP9 did have some existing cracks in two locations that were then propagated during
testing, while specimens MP4 and TP7 began testing with no major cracks identified. While
most culms had surface cracking due to drying shrinkage, a major crack was defined as a deep
crack going through most of the wall thickness and extending over an entire or multiple
internodes. Notched specimens did not have any major cracking but notched Tre Gai specimens
did have some pre-existing gashes and surface cracks due to harvesting and drying.
Based on initial cracking capacity, splitting shear strength for all notched specimens was
similar: Moso tested at UPitt had an average value of shear stress, τavg. of 0.52 MPa (COV =
0.348), while Moso tests at PUC had a value of 0.33MPa (COV = 0.598). Dendrocalamus
specimens exhibited an average shear stress of 0.50 MPa (COV = 0.332) while the thicker-
walled Tre Gai specimens had an average value of 0.33 MPa (COV = 0.031). The lower average
( )( )It48
t2DDF 33 −−=τ
132

value and higher COV for the two PUC Moso tests is due to the lower experiment stress value
(0.19 MPa) of specimen MB2. A small crack at the notch developed during test preparation of
this specimen when the load of the spreader beam was applied to the beam. This crack (or the
weak conditions to initiate a preliminary crack) could have been caused during cutting and
preparation of the notch. In addition to naturally large variation exhibited by bamboo materials,
this latter point identifies specimen handling as a potential source of error, particularly with
relatively fragile notch tests. Discounting the result from MB2, the shear stress of the single
remaining notched Moso specimen tested as PUC is essentially the same as Moso specimens
tested at UPitt.
4.3 DISCUSSION
The full-culm flexural tests exhibited lower strength values than the bowtie, split-pin, and
smaller clear bamboo flexural specimens. Table 4-5 summaries the results for all four of the tests
conducted at UPitt. These specimens were from the same batch of culms and therefore are
directly comparable. Shear strength values determined from small clear specimens were 2.4 – 3.5
times stronger than the values determined from full culm tests. Much of this difference may be
attributed to ‘scale effects’ and the high quality of the clear specimens used. Comparing bowtie
tests to the full culm results, the normalized values show similar ratios for both the Moso and Tre
Gai. In both cases, the bowtie tests yielded longitudinal shear strengths 26-28 times greater than
the full culms and 8-11 times greater than the clear specimens. The differences are believed to
reflect the fact that the bowtie test is 100% Mode II distortion while the crack initiation of the
beam tests is dominated by Mode I behavior (see Figure 4-3). Comparison of the bowtie and
133

split-pin test results, that compare Mode II to Mode I behavior directly, illustrates that the Mode
I (split-pin) capacity is only about 17% of the Mode II (bowtie) capacity. This result is typical of
many brittle materials especially unidirectional fiber-reinforced materials. The notched beam
tests exhibit some mixed mode behavior but are dominated by mode I response. The
relationships demonstrated in Table 4-5 may provide insight into the underlying ratio of Mode I
and Mode II components contributing to mixed mode failure. More importantly, they may be
leveraged to develop simpler test methods which may be used as surrogates for determining
other material properties: as concrete tensile strength may be estimated from compressive
strength, bamboo splitting behavior may be estimated from simple to conduct tests such as the
bowtie test.
Table 4-5: Summary of strength results (UPitt specimens only)
Species Bowtie Split-Pin Clear Full τ, MPa (COV) σ┴, MPa (COV) τ, MPa (COV) τ, MPa (COV)
Moso 14.20 (0.10) 2.40 (0.24) 1.82 (0.31) 0.51 (0.35) Tre Gai 8.65 (0.075) 1.52 (0.16) 0.79 (0.26) 0.33 (0.031)
Normalized values Moso 27.8 4.7 3.6 1.0
Tre Gai 26.2 4.6 2.4 1.0
The geometry of the splitting in the full culms also confirms the mixed mode nature of
the failure. Figure 4-16 shows images taken after testing with a handheld high magnification
camera of the splitting failure in Dendrocalamus specimens tested at PUC. Images were taken on
the same face of the culm on either side of the notch following testing. The images show crack-
bridging occurring as the crack propagates towards mid-span and the support; this is an
indication of a mixed-mode failure. As noted in Section 1.1.2.2, Shao et al. (2009) did not see
crack-bridging in double cantilever tests which is consistent with pure Mode 1 fracture exhibited
using this test method.
134

Figure 4-16: Magnified images of crack bridging on either side of notch in Dendrocalamus specimen DB3
4.3.1 Applicability as a Field Test
It was hoped that strain gage data would help in capturing splitting behavior, although strain
gages provide data only up to the point of splitting. Unfortunately, due to a perceived acquisition
error, strain gage data collected at UPitt was potentially corrupted. Nonetheless, as the foregoing
demonstrates, sufficient data to identify and quantify longitudinal splitting behavior is available
simply from load-deflection behavior. This demonstrates the potential utility of this relatively
simple test in a field (rather than laboratory) environment. As shown in Figure 4-13, multiple test
arrangements may be used depending on availability of resources and only simple
instrumentation is required to measure applied load and deflection. For instance, using the test
arrangement designed at PUC (Figure 4-13b), free weights may be used to apply load and
sufficiently accurate deflection measurements (precision of 1 mm is adequate for culms of the
size tested here) may be made using a tape or ruler.
4.4 CONCLUSIONS
The modified full-culm tests for assessing longitudinal shear behavior illustrate the need for a
standardized test method to characterize the longitudinal splitting strength of bamboo tested in
flexure. Results showed that full-culm tests produced lower shear strength values than current
notc
h
135

standardized or proposed tests. This is believed to be partially the result of the complex mixed
mode behavior occurring at the notch. Full-culm results were also lower than similar values
obtained from small clear through-wall specimens.
The current work also strove to better understand the relationship of Mode I and Mode II
failure components in the mixed-mode failure of bamboo beams. Results in Table 4-5 suggest
that Mode I tangential tensile strength perpendicular to the fibers is the main driver of
longitudinal splitting and showed that a ratio between Mode I, Mode II, and mixed mode
capacities may exist. As future work, research should be conducted on developing an interaction
relationship between Mode I and Mode II components so that an interaction equation may be
developed for longitudinal splitting strength in a form similar to Equation 4-13:
1maxmax
≤+⊥
⊥
ττ
σσ ba
(4-13)
In which a and b are empirical or theoretically derived coefficients. This would allow values
from smaller standard tests such as the bowtie and split-pin tests to be used in design of full-culm
flexural components yet still account for the mixed-mode splitting. Alternatively, with such a
relationship established, simple-to-conduct tests (such as the bowtie or the edge bearing tests)
may be able to be used as surrogate measures of more-difficult-to-obtain values.
The notched beam test configuration had several drawbacks. First, once significant
cracking occurred at the notch location, some specimens deformed (kinked) sufficiently to
change the boundary conditions of the test – removing contact at the loading saddle above the
notch. This caused all load to be placed on the un-notched side of the beam, thereby changing the
configuration of the test. This can be corrected with a three-point bending test with a single load
and notch at the midspan. Second, effort was made to meet the 30D length requirement of the
ISO 22157 four-point bending test (ISO 2004b); ensuring flexural behavior of the specimen and
136

thereby isolating shear failure at the notch location. It is also noted that the bending stress
component at the notch was the majority contribution to the principal shear stress value
calculated at the notch and shows the influence of flexural rotation in the test. A shorter shear
span would reduce this influence and increase the influence due to flexural induced shear. One
area of future work would be to investigate the performance and repeatability of shorter shear
span specimens tested in three-point bending as a standard test for longitudinal mixed-mode
splitting strength of bamboo. In such a test, the shear span length may be adjusted to modify the
ratio of Mode I and Mode II failure components. Removing the notch altogether in shorter
specimens and permitting a shear failure to occur ‘naturally’ should also be investigated. In this
case, geometric parameters associated with the Ay term of VAy/It (Equation 4-2) would need to
be determined at the location of failure following the test and will be vary from specimen to
specimen. Monitoring such behavior may be cumbersome in this case.
137

5.0 PERFORMANCE OF BAMBOO COLUMNS
This chapter presents the experimental results of an investigation of the buckling capacity of
single-culm and multiple-culm bamboo column elements. Single-culm columns of species
Bambusa Stenostachya (Tre Gai) were tested to obtain single-culm column capacities as well as
control tests to determine the behavior of short-doweled end-conditions. Three multiple-culm
columns were then tested in order to investigate the ultimate capacity and buckling behavior of
these elements. Specifically of interest was the effect of ‘bamboo stitching’ on improving
column behavior in the bamboo culms. Experimental values were compared with theoretical
predictions for buckling capacity. The effective strength behavior of multiple-culm columns was
shown to exhibit load redistribution and to mimic the sum of individual culm capacities rather
than composite column behavior. Stitching was shown to be beneficial in enforcing column
geometry yet detrimental due to the introduction of lateral loading to culms.
5.1 BACKGROUND
The structural behavior of bamboo is not nearly as well understood as more conventional
construction materials, which results in the use of bamboo often being relegated to non- and
marginally-engineered construction. Moreover, the specific behavior of either common or
necessary structural elements or details is only understood anecdotally. This study investigates
138

full-culm bamboo column behavior. While studies of single culm columns (compression
elements) have been conducted (Arce-Villalobos 1993, Ghavami and Moreira 2002, Yu et al.
2003, Yu et al. 2005), multiple-culm columns are largely unstudied. Multiple-culm columns have
a number of advantages including: a) accommodating relatively simple concentric connections of
framing members to be made; b) allowing increased axial capacities and improved lateral force
resistance; and, c) allowing, due to increased capacity, smaller individual culm sizes to be used.
This study presents a series of experiments of full-scale axially-loaded single and
multiple-culm bamboo columns. Ultimate behavior and buckling capacities are assessed and
contrasted with fundamental mechanical theory in an effort to establish rational design guidance
for such columns. A specific parameter of interest is the improved behavior that may be
developed in multiple-culm columns by the provision of ‘stitches’ and/or connections to
transverse members. It is hypothesized that well-designed multiple-culm columns may provide
sufficient capacity to permit multi-story bamboo frame structures to be engineered.
5.1.1 Bamboo Column Buckling
The elastic buckling capacity (Pcr) of a uniform, initially straight concentrically loaded
column is described by the Euler buckling equation (Eqn. 5-1):
( )22
cr KLEIP π
= (5-1)
Where E is Young’s modulus, I is the moment of inertia of the cross section and KL is effective
length, where K modifies actual column length, L, to account for end restraint conditions.
Applying Equation 5-1 to bamboo requires a number of modifications to account for a)
the variation in section (I) over the height (L); b) initial out-of-straightness; and c) material
139

variability (E). Nonetheless, these factors can be accounted for using fundamental mechanical
principals. From a design perspective, however, these modifications are conventionally
addressed partially through permitted tolerances and partially though the use of modification and
material resistance factors.
In his 1993 doctoral thesis, Arce-Villalobos used energy methods to study the critical
buckling load of single-culm bamboo columns. A critical buckling load equation was developed
for a straight bar of tapered cross section and variable Young’s modulus. A second equation for a
“Southwell plot of deformations” (Southwell 1932) was proposed to remove the influence of
crookedness from the equation for critical buckling load during an experiment of a crooked strut.
An experimental program was conducted on a sample of Guadua s.p. culms to develop
experimental Southwell plots which were compared with theoretical predictions. Statistically
compared, experimental and theoretical results had a correlation of R2=0.81. Arce-Villalobos
also proposed an equation using average properties of I and E, but states that, while most critical
load values for a tested sample were conservative estimates, critical load was over-estimated for
some culms. Arce-Villalobos lists buckling of bamboo columns as an area for future research
and outlines recommendations. First, initial lateral culm deformation must be considered as a
major source of lateral deformation in axially loaded members. Second, buckling load is affected
by the change in cross-section dimensions and elastic modulus along the height of the culm. The
variation in the cross section itself also effects the calculation of an effective value for the
sectional stiffness (EI). Finally, due to randomly-positioned nodal regions being more flexible (in
the axial direction), the critical buckling load will be reduced. Thus, the average influence of
nodes should be studied (Arce-Villalobos 1993).
140

Ghavami and Moreira (2002) investigated the column buckling behavior of single
bamboo culms for use in a space structure. Eleven specimens of Dendrocalamus giganteus with
a diameter of 100 mm and a length of 2 m were first measured to determine initial curvature and
deviation of the centroid from the longitudinal axis along the culm using a special measuring
device developed for the purpose. The moment of inertia, If, was also calculated considering that
a higher fiber density exists in the outer 25% of the culm wall (Fig. 2-2) rather than considering
the gross section (Ig) for a homogeneous cross section. Specimens were tested in compression as
pin-ended columns (i.e.: K = 1). The buckling load for the specimens was determined using a
Southwell plot and the modulus of elasticity, E, was determined experimentally for the
specimens. Results showed that a) experimentally determined values of apparent moment of
inertia (Iexp) were close to those predicted considering If; and b) failure and ultimate load were
governed by compression failure of bamboo fibers in the concave section of the element
(resulting from global buckling deformation) followed by local buckling of the culm wall. The
authors concluded that the stress corresponding to this failure phenomenon is the limit of
proportionality in uniform compression (Ghavami and Moreira 2002).
Column buckling is one of the critical limit states for failure in bamboo scaffolding. Yu et
al. (2003) investigated the buckling behavior of two bamboo species, Bambusa pervariabilis
(Kao Jue) and Phyllostachys pubescens (Mao Jue) with 72 column buckling tests. A limit state
design method against column buckling of structural bamboo based on empirically modified
slenderness was developed based on calibration against buckling tests conducted over a wide
range of practical member lengths. Tests considered height-to-diameter ratio, diameter variations
over member length, and moisture content of the bamboo. Bamboo specimen lengths were 400,
600, and 800 mm for Kao Jue and 1000, 1500, and 2000 mm for Mao Jue. Moisture content was
141

considered to be the most important property in determining mechanical properties and was
taken as either natural (N) or wet (W); the latter was achieved by immersing the bamboo in water
for 1 week prior to testing. Pin-ended (i.e.: K=1) compression tests were conducted on small
specimens of bamboo cut from the buckling specimens after the buckling test to better determine
material properties. Applied load, axial shortening, and horizontal displacements were measured
continuously throughout the large-scale buckling tests. Both global buckling (most Mao Jue
members) and local buckling (wet and short Kao Jue specimens) were observed during the tests.
Reduction of load-carrying capacity due to buckling was shown to be severe. A buckling design
method was developed based on the method for structural steel promulgated in the British steel
code BS5950 (British Standards Institution 2000). This approach adopts the Perry-Robertson
(Robertson 1925) interaction formula for compressive buckling strength with initial
imperfections. To account for the variation of Young’s modulus along the member length, the
average Young’s modulus was used for the entire member length. Variations of external
diameter and thickness are also apparent and the variation in moment of inertia was considered
in the analysis with a non-prismatic parameter α (evaluated through the classical energy method).
To calibrate the proposed design method, an analysis was conducted against the test data with all
partial safety factors equal to 1. The analysis determined Robertson constants, modified
slenderness ratios and average model factors for each species. The non-prismatic parameter was
found not to be insignificant for Kao Jue but significant for Mao Jue; thus, with respect to the
cross section properties, a Kao Jue culm can be viewed as being non-tapered while Mao Jue is
tapered. The authors also proposed limits for culm out-of-straightness in order for their design
method to be applicable (Yu et al. 2003).
142

In a subsequent study, Yu et al. (Yu et al. 2005) constructed 4 full-scale double-layer
bamboo scaffolds and tested them to failure to assess bamboo culm buckling within such a
structural system. The scaffolds were composed of both Kao Jue and Mao Jue bamboo species.
All ‘lashed’ or ‘tied’ joints were fashioned using bamboo or plastic strips and were therefore
considered as pins in analysis and design. Secondary and bracing members provided effective
load distribution in the event of axial buckling of a post. The test scaffolds were 9 m high, 6 m
wide and 0.6 m deep and had four working platforms (including the top). Each consisted of
varying arrangements of bamboo species and lateral restraint configurations. Test scaffolds were
loaded on the topmost working platform with sand bags near the central post. Results of the test
exhibited the inner central post (Kao Jue) buckling either between main horizontal ledgers or
globally across the four working platforms. However, no global collapse of the structure was
observed. Using this experimental data, the authors developed a finite element model to examine
and predict the buckling behavior of the scaffold systems (Yu et al 2005).
5.1.2 Standard Design Procedures
Currently, the International Organization for Standardization (ISO) document ISO 22156:
Bamboo Structural Design (ISO 2004a) provides guidance for determining the culm moment of
inertia and ultimately determining the buckling load for bamboo columns. As a conservative
estimate, diameter and wall thickness should be measured at both ends of the culm and the mean
values used in the calculation of Iculm. ISO 22156 specifies the use of the Euler buckling equation
(Eqn. 5-1) but with a 10% reduction in Iculm to account for tapers in diameter of less than 1 on
170. Additionally, column designs must consider bending stresses due to initial curvature,
eccentricities and induced deflections (ISO 2004a). The National Building Code of India (Bureau
143

of Indian Standards 2005) provides similar requirements for determining the moment of inertia
of bamboo columns. It is understood that the Indian standard is an adoption of the ISO model
standard.
5.2 EXPERIMENTAL PROGRAM
The experimental program to investigate the buckling behavior of multiple-culm bamboo
columns encompassed five main stages: a) cataloguing the culm geometry; b) experimental
determination of compression strength; c) determination of effective length factor, K based on
the column end conditions used; d) experimental buckling tests of single-culm specimens; and e)
experimental buckling tests of multiple-culm columns. These stages are described in the
following sections.
5.2.1 Specimens
Bambusa Stenostachya (Tre Gai) harvested in Vietnam was used for the experimental
tests. The bamboo was purchased commercially in 3 m lengths; the author has no control over
culm selection and the harvesting and storage history of the culms is unknown. Specimens were
first cut to length and the section quadrants assigned a cardinal designation (North, South, East
and West). The initial variability in geometry was then catalogued prior to testing. Measurements
were taken along each culm’s length for diameter, variation from a plumb axis (to determine
initial out-of-straightness), wall thickness (wall thickness measurements were taken following
144

testing when the culms were cut into sections), and internode length. Measurements were taken
by placing the bamboo in a specially designed jig as shown in Figure 5-1.
Figure 5-1: Jig for measuring bamboo columns
The culm is placed between two parallel string lines set a constant distance apart, measurements
were taken between each string and the culm. From this, both the culm diameter and deviation
from centerline or “out-of-straightness,” can be determined. Measurements were taken at the
center of each internode and in both principle axes (N-S and E-W; i.e.: each culm was rotated 90
degrees in the jig for a second set of measurements). Table 5-1 summarizes the values for the
culms used in this study. The gross cross sectional area (Aculm) and moment of inertia (Iculm)
values are based on the average diameter (D) and wall thickness (t) values measured at each
internode and are based on the gross cross section dimensions. For the batch of Tre Gai used, the
culm diameter did not vary significantly over the culm height, although the wall thickness did
decrease from bottom to top. The typical ratio of bottom to top diameter (Dbot/Dtop) was 1.01
whereas the ratio of bottom to top wall thickness (tbot/ttop) was 1.7; therefore, these culms must be
treated as being tapered (Yu et al. 2003). Average initial out-of-straightness of this batch of Tre
Gai bamboo was relatively small: 0.006L, with no value exceeding 0.010L. As indicated in Table
5-1, culms having a larger section were selected for single-culm column tests (tests S1-S4);
while marginally smaller culms were selected for the four-culm column tests (tests M1-M3).
a) support condition of
measuring jig. b) culms that are (top) relatively straight and (bottom) significantly curved in jig.
145

Table 5-1: Column Specimen Geometry Data
Column Test
Culm ID
Length, L
Avg. Diameter,
D
Avg. Wall Thickness,
t Max. Deviation from
Straight Aculm Iculm (mm) (mm) (mm) (mm) Ratio of L (mm2) (mm4)
S1 TG-5 2600 89 15 23 0.009L 3,400 2,440,000 S2 TG-8 2600 87 15 13 0.005L 3,400 2,283,000 S3 TG-9 2590 88 17 11 0.004L 3,800 2,521,000 S4 TG-4 2600 86 16 17 0.006L 3,600 2,263,000
SH1 TG-3-6’ 1830 88 16 17 0.009L 3,600 2,390,000 SH2 TG-21-4’ 1218 83 25 7 0.006L 4,600 2,314,000 SH3 TG-3-2’ 609 82 24 4 0.006L 4,300 2,122,000
M1
TG-13 2590 77 16 7 0.003L 3,000 1,526,000 TG-15 2590 77 15 22 0.009L 2,900 1,448,000 TG-23 2590 73 12 11 0.004L 2,300 1,102,000 TG-25 2590 72 18 14 0.005L 3,100 1,255,000
M2
TG-10 2590 78 16 12 0.005L 3,100 1,599,000 TG-12 2590 80 13 14 0.005L 2,700 1,594,000 TG-14 2590 83 15 13 0.005L 3,100 1,927,000 TG-24 2590 78 14 12 0.004L 2,800 1,491,000
M3
TG-6 2590 85 15 19 0.007L 3,300 2,100,000 TG-7 2590 83 13 26 0.010L 2,900 1,786,000 TG-18 2600 85 16 25 0.010L 3,500 2,210,000 TG-19 2590 82 20 11 0.004L 3,900 2,084,000
5.2.2 Compression Tests
Compression test specimens were fabricated from the off-cuts of the culms and
conducted in accordance with ISO standard 22157-1:2004 (ISO 2004b) from which the
experimental compressive strength, σc and the modulus of elasticity, E were determined.
Fourteen inter-nodal specimens having a length-to-diameter ratio (L/D) of 1.25 were prepared
from seven randomly selected culms. Sulfur capping compound was used to prepare the cylinder
ends, resulting in an aspect L/D ratio for the test specimen clear height greater than 1 in every
146
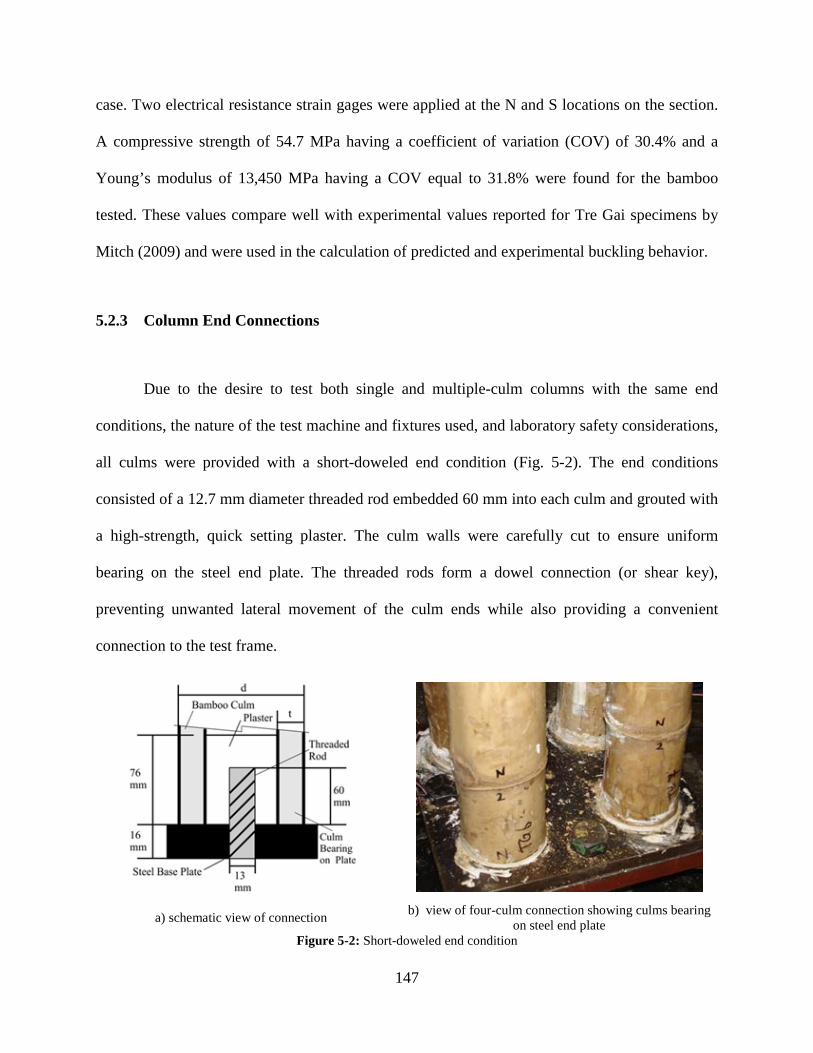
case. Two electrical resistance strain gages were applied at the N and S locations on the section.
A compressive strength of 54.7 MPa having a coefficient of variation (COV) of 30.4% and a
Young’s modulus of 13,450 MPa having a COV equal to 31.8% were found for the bamboo
tested. These values compare well with experimental values reported for Tre Gai specimens by
Mitch (2009) and were used in the calculation of predicted and experimental buckling behavior.
5.2.3 Column End Connections
Due to the desire to test both single and multiple-culm columns with the same end
conditions, the nature of the test machine and fixtures used, and laboratory safety considerations,
all culms were provided with a short-doweled end condition (Fig. 5-2). The end conditions
consisted of a 12.7 mm diameter threaded rod embedded 60 mm into each culm and grouted with
a high-strength, quick setting plaster. The culm walls were carefully cut to ensure uniform
bearing on the steel end plate. The threaded rods form a dowel connection (or shear key),
preventing unwanted lateral movement of the culm ends while also providing a convenient
connection to the test frame.
a) schematic view of connection b) view of four-culm connection showing culms bearing on steel end plate
Figure 5-2: Short-doweled end condition
147

5.2.4 Determination of Effective Length of Columns
To establish an appropriate effective length factor (K) for the column end conditions
used, two 2590 mm long specimens of 88.9 mm diameter schedule 80 poly vinyl chloride (PVC)
pipe were tested as column elements. These specimens a) were provided with identical end
conditions as described in the previous section; b) were initially straight; and c) have effectively
no variation in known dimensions or material properties along their length or through their
section. Thus, by applying Equation 5-1 to experimental results, the effective length factor (the
only unknown) may be calculated. Results from duplicate control tests are shown in Table 5-2.
The average effective length factor found for the end conditions used was K = 0.55. Evaluation
of photographs (Figure 5-3) of buckled shapes confirms this value.
Table 5-2: Results for control columns used to establish value of effective length factor, K
Specimen Length, L outside
diameter, D wall
thickness, t I E PCR Keff
(mm) (mm) (mm) (mm4) (MPa) (kN) PVC1 2591 88.9 7.62 162 x 104 2812 25.0 0.52 PVC2 2591 88.9 7.62 162 x 104 2812 20.8 0.57
As will be discussed, the apparent value of K for the bamboo specimens may be greater than for
the PVC since, due to initial out-of-straightness-induced flexure, the end of the bamboo
specimens was observed to rotate against the steel end plate prior to the onset of buckling. The
PVC did not exhibit this behavior.
148

Figure 5-3: Buckled shaped of PVC columns 1 and 2
149
5.2.5 Column Buckling Test Program
All buckling tests (including the PVC tests described previously) were conducted in a
servo-hydraulic controlled universal test machine (UTM) having a capacity of 900 kN. All tests
were run in displacement control (to ensure controlled failures) at a rate of 2.54 mm per minute.
Applied load and crosshead displacement were obtained from the UTM controller; lateral
displacement in both NS and EW directions of individual culms at mid height were obtained
using draw wire displacement transducers (DWT) as shown in Figure 5-4d; and bamboo flexural
strains at mid-height were obtained using electrical resistance strain gages (also seen in Figure 5-
4d). All data was collected electronically at a rate exceeding 1 Hz. It is acknowledged that use of
crosshead travel for column axial displacement is not entirely correct since this value includes
the compliance of the test machine. However this data is only used directly to identify the onset
of bifurcation and buckling; the small error introduced does not affect such results. The test
frame compliance is known to be 0.015 mm/kN when testing specimens of the height tested here.
Seven single culm and three four-culm column tests were conducted as shown in Table 5-
1. Conducting the single-culm tests was intended to establish a baseline for the culm behavior.
The four-culm columns were assembled such that the culm spacing in both principle directions
was equal and adequate to allow transverse members of a size similar to the longitudinal culms
to pass (see Figure 5-4c). All culm end conditions were identical as described above and shown
in Figure 5-2. Test M1 was a simple arrangement of four culms. Only the doweled end
conditions enforced the multiple culm geometry (spacing) over the height of the specimen. Thus,
M1 may be thought of as testing four single culm columns in parallel. All things being equal, the
capacity of M1 should be four times the lowest individual culm capacity. It is hypothesized that
150

as the weakest culm in the four-column arrangement fails, the load is redistributed to the
remaining culms and these will then buckle in rapid succession.
Specimen M2 and M3 are provided with bolted ‘stitches’ (Fig. 5-4c) which effectively
enforce the initial column geometry at their locations. M2 had a stitch located at mid-height (i.e.:
L/2) and M3 had stitches at its third points (L/3). These stitches, it is proposed, will help to
inhibit single culm buckling and thereby improve the overall column load carrying capacity.
Each stitch consists of two short lengths of bamboo having an outside diameter of about 75 mm
(same material as columns in this case) connected through the entire assembly with four 12.7
mm threaded rods (or carriage bolts). The holes for these rods are drilled in situ using a 300 mm
long drill bit, thus ensuring alignment.
c) detail of bolted column stitch of
specimen M3
a) single culm specimen prior to test
S1 b) four culm specimen prior to test
M2
d) DWT instrumentation at mid-height of single culm (top) and four-
culm (bottom) test. Figure 5-4: Test set-up and instrumentation
151
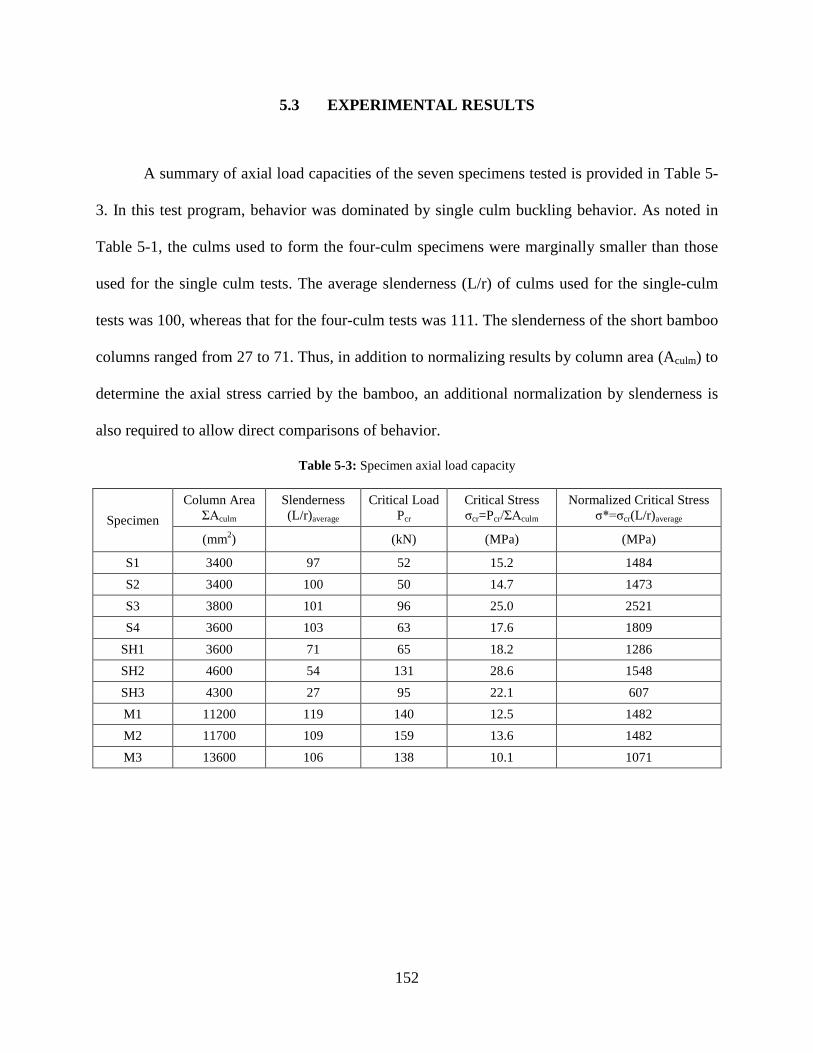
5.3 EXPERIMENTAL RESULTS
A summary of axial load capacities of the seven specimens tested is provided in Table 5-
3. In this test program, behavior was dominated by single culm buckling behavior. As noted in
Table 5-1, the culms used to form the four-culm specimens were marginally smaller than those
used for the single culm tests. The average slenderness (L/r) of culms used for the single-culm
tests was 100, whereas that for the four-culm tests was 111. The slenderness of the short bamboo
columns ranged from 27 to 71. Thus, in addition to normalizing results by column area (Aculm) to
determine the axial stress carried by the bamboo, an additional normalization by slenderness is
also required to allow direct comparisons of behavior.
Table 5-3: Specimen axial load capacity
Specimen Column Area
ΣAculm Slenderness (L/r)average
Critical Load Pcr
Critical Stress σcr=Pcr/ΣAculm
Normalized Critical Stress σ*=σcr(L/r)average
(mm2) (kN) (MPa) (MPa)
S1 3400 97 52 15.2 1484 S2 3400 100 50 14.7 1473 S3 3800 101 96 25.0 2521 S4 3600 103 63 17.6 1809
SH1 3600 71 65 18.2 1286 SH2 4600 54 131 28.6 1548 SH3 4300 27 95 22.1 607 M1 11200 119 140 12.5 1482 M2 11700 109 159 13.6 1482 M3 13600 106 138 10.1 1071
152

5.3.1 Full Height Columns
Figure 5-5 shows the normalized axial stress (σ*) versus axial displacement curves for all full-
height specimens. Normalized axial stress accounts for both the variation in column area
(ΣAculm) and slenderness of the individual culms (L/r), where r is the radius of gyration of the
culm section: averageculm
*
rL
AP
=σ
∑ (5-2)
a) single culm columns b) multiple culm columns
Figure 5-5: Normalized stress v. displacement plots.
Because the tests are conducted in displacement control, critical buckling is identified as
occurring at the load plateau in Figure 5-5 although lateral displacements of the culms is evident
at lower loads. Eventual culm splitting (described below) corresponds to the subsequent, almost
instantaneous, loss of capacity evident in the curves shown in Figure 5-5.
Specimens M1 and M3 exhibit initial small drops in capacity which are recovered prior to
the critical (peak) load being achieved. Specimen M2 exhibits similar behavior, although the
initial peak is never regained. This behavior is attributed to load redistribution in the multiple-
0
500
1000
1500
2000
2500
3000
0 2 4 6 8 10 12 14 16
Nor
mal
ised
Stre
ss (M
Pa)
Displacement (mm)
S3: 2521 MPaS4: 1809 MPaS1: 1484 MPa
S2: 1473 MPa
0
200
400
600
800
1000
1200
1400
1600
0 5 10 15 20 25 30 35
Nor
mal
ised
Stre
ss (M
Pa)
Displacement (mm)
M2: 1482 MPa
M1: 1482 MPa
M3: 1071 MPa
153

culm specimens, where the initial peak represents the behavior of the ‘weakest’ culm; this is
discussed further below.
Single culm capacities were relatively consistent with the exception of specimen S3. This
culm, in addition to being the largest section tested, was also among the straightest (Table 5-1);
both factors are believed to contribute to this specimen’s superior performance. The four-culm
specimen behavior was similarly consistent.
Figure 5-6 illustrates the failure modes of one single-culm specimen (Fig. 5-6a) and all
three of the multiple-culm specimens (Figs. 5-6b to 5-6d). The photos all show specimens under
load at a large displacement. All single culm specimens were observed to buckle over their entire
length. As the axial displacement increased, the culms exhibited a longitudinal splitting failure
generally at the top end of the culm where the culm wall thickness is at its minimum (Fig. 5-6e).
The splitting, in this case, is a longitudinal shear failure of the culm resulting from the flexure
induced by buckling; a so-called VAy/It failure. Since natural vertical orientation of culms was
maintained, this always occurred at the top of columns where culm wall thickness, t, is smallest.
The initial flexure-induced rotation at the culm ends results in local crushing of the
bamboo and, as it progresses, loss of bearing contact on the ‘tension’ side of the culm. This has
the effect of increasing the effective length factor, K, of the culm. Similar behavior was observed
in column base connection tests (Mitch 2010). Once splitting occurs, culm capacity is lost.
Individual culm behavior in the four-culm specimens also reflected this general behavior.
This is dramatically illustrated in Figure 5-6b of specimen M1. In this photo all four culms have
buckled independently and a significant longitudinal splitting failure of one is clearly seen.
The presence of stitches enforces the four-culm geometry at the stitch location(s). Thus
each individual culm is ‘forced’ to buckle in the same direction (Figs. 5-6c and d). This effect is
154

seen in Figure 5-7 which shows, in plan, the lateral displacement traces at mid-height of each
culm in the four-culm columns. The unstitched culms of specimen M1 are able to displace
laterally (buckle) as their individual geometries dictate. The stitched culms of M2 and M3, on the
other hand, must ‘track’ each other. The stitches, as it were, restrain the initial buckling of the
‘weakest’ culm while ‘drawing’ the remaining culms in the direction of the weakest buckling
culm. This, in essence, results in a collection of self-equilibrating lateral point loads being
applied to all culms at the stitch locations. These loads (and their resulting moments) may be
initially restrained or drive buckling. As a result of the stitch-induced lateral loads, some of the
culms formed a ‘kink’ at the location of the stitch. Figure 5-6f, for instance, shows a clear kink in
the left-hand culm while the right-hand culm shows more uniform curvature. In the case shown
in Figure 5-6f, the kink resulted from the local buckling of the culm wall at the location of the
threaded rod. Although the rods were only installed ‘thumb tight’, the column’s lateral
deformation, in this case, resulted in the rod being ‘pulled through the culm wall’. Finally, minor
longitudinal splitting, associated with the stitch bolts was also observed (Fig. 5-6g).
Considering the foregoing discussion and the results shown in Table 5-3, it is evident that
beneficial effects of the stitch (restraining section behavior) are counteracted by the additional
lateral loads they introduce. Thus the need for stitches is inconclusive, particularly for relatively
slender columns dominated by individual culm behavior. Nonetheless, transverse or in-plane
bolted connections to such multiple-culm columns are de facto stitches. Thus the stitch behavior
must be considered where such connections exist.
155

e) splitting at top (M2)
f) kinking at braces (M3)
a) S4 b) M1 c) M2 d) M3 g) splitting at bolts (M3) Figure 5-6: observed behavior of bamboo column specimens
Figure 5-7: Lateral displacement of culms in multiple-culm columns (figures drawn to scale on a grid 50 mm)
a) M1 (no stitching) b) M2 (stitch at mid-height) c) M3 (stitching at 1/3rd points)
N N N
156

In Table 5-4, experimental column capacity is compared to that predicted using the Euler
buckling equation (Eqn. 5-1). For the multiple-culm columns, the effective buckling load
determination is based on the sum of the culm moments of inertia (i.e.: ΣIculm), rather than the
gross column moment of inertia (Ig). This is consistent with the observed column behavior and
would appear to be consistent with findings from previous research and available standards, as
described above. As shown in Table 5-4, the calculations were made using both the theoretical
pin-ended capacity (K = 1) toward which the culm behavior deteriorates, and the initial,
experimentally determined value of K = 0.55. It is clear from Table 5-4, that the observed
column behavior falls between these limits, although generally closer to the pin-ended limit of K
= 1. As a measure of column behavior, the apparent value for effective length factor is shown
in Table 5-4; this value is the K required to calculate the experimentally observed critical load
using Eqn. 1. The difference between this value and K = 0.55 may be attributed to the following:
a) variability of the test specimen section and material properties; b) initial out-of-straightness;
and c) degradation of the column end condition described above. To separate and quantify these
effects, additional analyses and research is required. Nonetheless, the universal use of K = 1 is
shown to yield conservative predictions.
Table 5-4: Predicted Column Behavior
Specimen
Pcr (Eqn. 1)
Apparent K ΣIculm Experimental Predicted
K=1 K=0.55
(mm4) (kN) (kN) (kN) S1 2,440,000 52 48 159 0.96 S2 2,283,000 50 45 149 0.95 S3 2,521,000 96 50 165 0.72 S4 2,263,000 63 45 147 0.84 M1 5,331,000 140 105 348 0.87 M2 6,611,000 159 131 432 0.91 M3 8,181,000 138 162 534 1.08
157
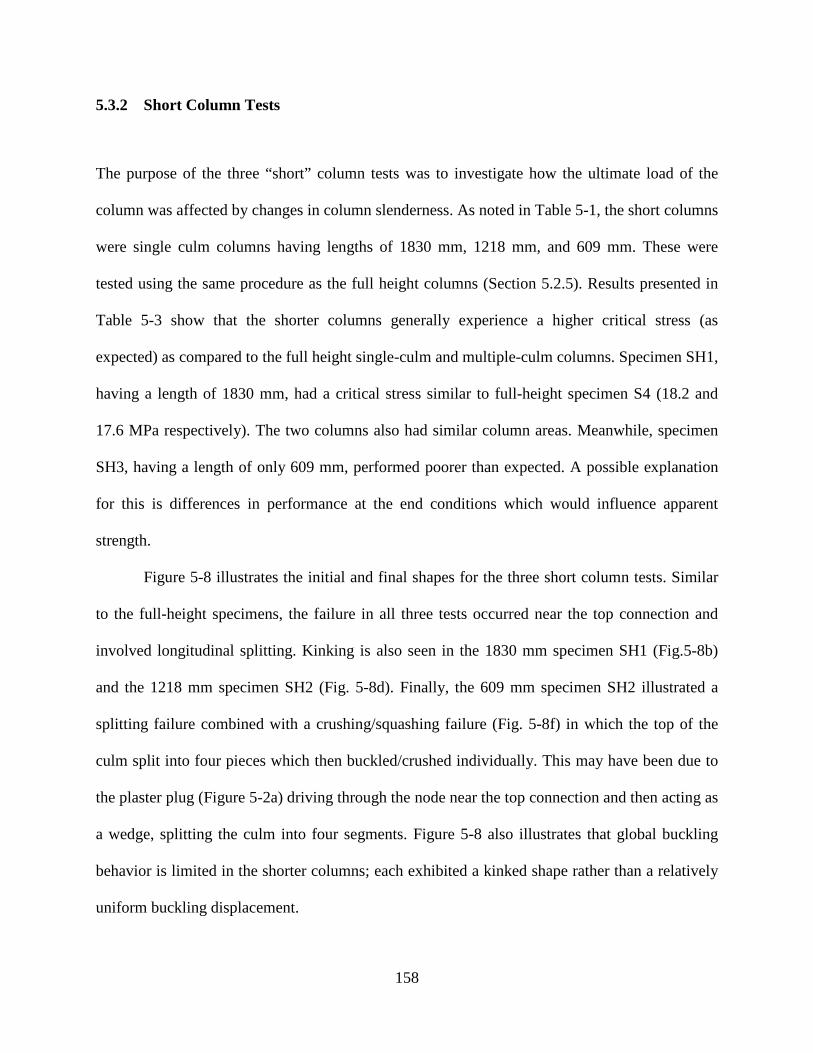
5.3.2 Short Column Tests
The purpose of the three “short” column tests was to investigate how the ultimate load of the
column was affected by changes in column slenderness. As noted in Table 5-1, the short columns
were single culm columns having lengths of 1830 mm, 1218 mm, and 609 mm. These were
tested using the same procedure as the full height columns (Section 5.2.5). Results presented in
Table 5-3 show that the shorter columns generally experience a higher critical stress (as
expected) as compared to the full height single-culm and multiple-culm columns. Specimen SH1,
having a length of 1830 mm, had a critical stress similar to full-height specimen S4 (18.2 and
17.6 MPa respectively). The two columns also had similar column areas. Meanwhile, specimen
SH3, having a length of only 609 mm, performed poorer than expected. A possible explanation
for this is differences in performance at the end conditions which would influence apparent
strength.
Figure 5-8 illustrates the initial and final shapes for the three short column tests. Similar
to the full-height specimens, the failure in all three tests occurred near the top connection and
involved longitudinal splitting. Kinking is also seen in the 1830 mm specimen SH1 (Fig.5-8b)
and the 1218 mm specimen SH2 (Fig. 5-8d). Finally, the 609 mm specimen SH2 illustrated a
splitting failure combined with a crushing/squashing failure (Fig. 5-8f) in which the top of the
culm split into four pieces which then buckled/crushed individually. This may have been due to
the plaster plug (Figure 5-2a) driving through the node near the top connection and then acting as
a wedge, splitting the culm into four segments. Figure 5-8 also illustrates that global buckling
behavior is limited in the shorter columns; each exhibited a kinked shape rather than a relatively
uniform buckling displacement.
158

a) SH1 pre-test
(1830 mm) b) SH1 buckled c) SH2 pre-test (1218 mm) d) SH2 buckled e) SH3 pre-test
(609 mm) f) SH3 buckled
Figure 5-8: Original and buckled shapes for single-culm bamboo short columns
159
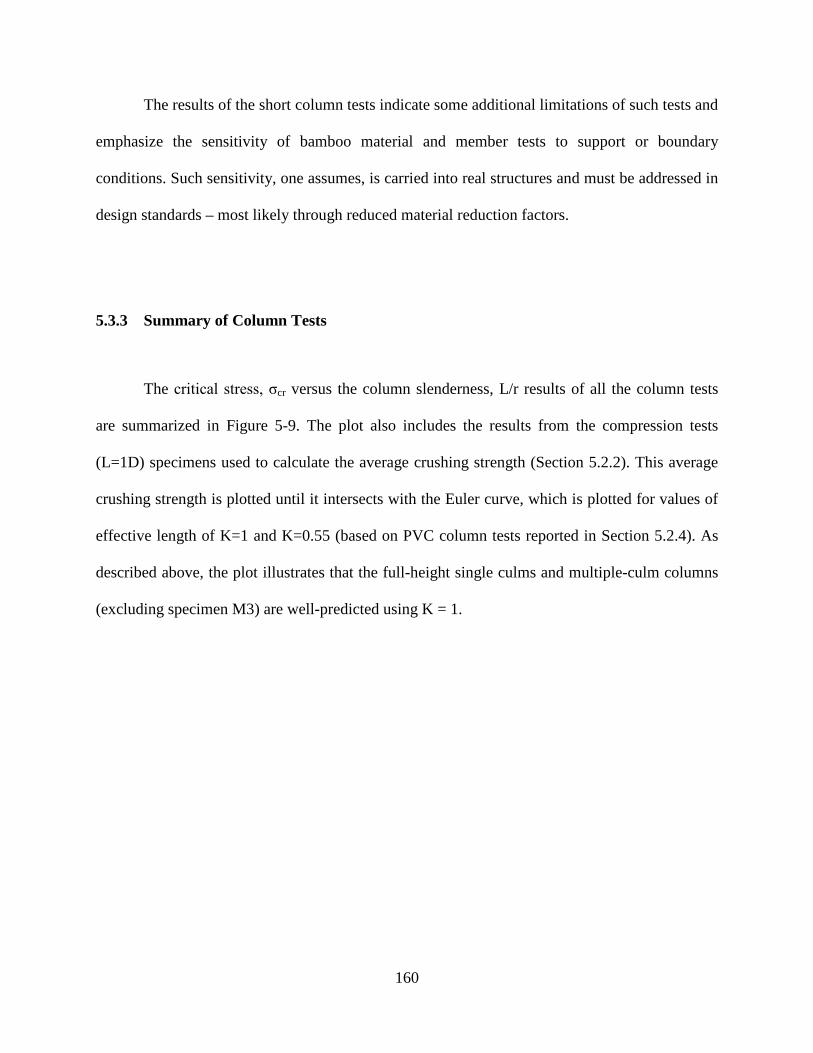
The results of the short column tests indicate some additional limitations of such tests and
emphasize the sensitivity of bamboo material and member tests to support or boundary
conditions. Such sensitivity, one assumes, is carried into real structures and must be addressed in
design standards – most likely through reduced material reduction factors.
5.3.3 Summary of Column Tests
The critical stress, σcr versus the column slenderness, L/r results of all the column tests
are summarized in Figure 5-9. The plot also includes the results from the compression tests
(L=1D) specimens used to calculate the average crushing strength (Section 5.2.2). This average
crushing strength is plotted until it intersects with the Euler curve, which is plotted for values of
effective length of K=1 and K=0.55 (based on PVC column tests reported in Section 5.2.4). As
described above, the plot illustrates that the full-height single culms and multiple-culm columns
(excluding specimen M3) are well-predicted using K = 1.
160
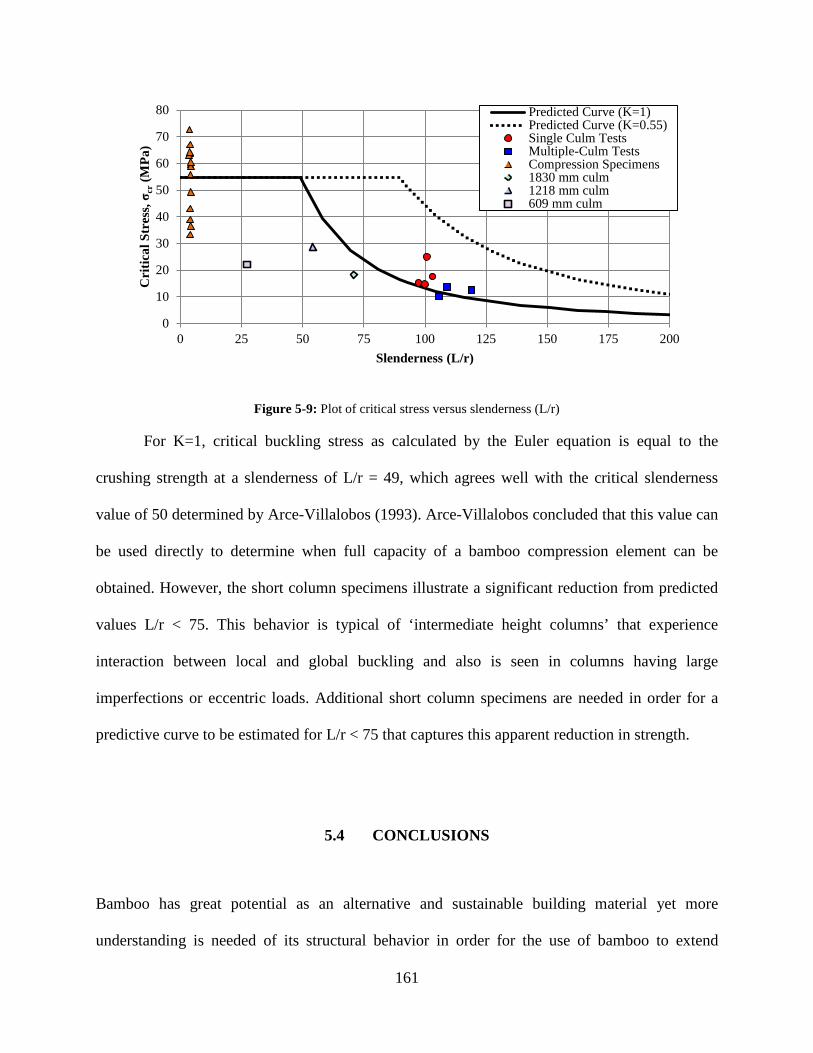
Figure 5-9: Plot of critical stress versus slenderness (L/r)
For K=1, critical buckling stress as calculated by the Euler equation is equal to the
crushing strength at a slenderness of L/r = 49, which agrees well with the critical slenderness
value of 50 determined by Arce-Villalobos (1993). Arce-Villalobos concluded that this value can
be used directly to determine when full capacity of a bamboo compression element can be
obtained. However, the short column specimens illustrate a significant reduction from predicted
values L/r < 75. This behavior is typical of ‘intermediate height columns’ that experience
interaction between local and global buckling and also is seen in columns having large
imperfections or eccentric loads. Additional short column specimens are needed in order for a
predictive curve to be estimated for L/r < 75 that captures this apparent reduction in strength.
5.4 CONCLUSIONS
Bamboo has great potential as an alternative and sustainable building material yet more
understanding is needed of its structural behavior in order for the use of bamboo to extend
0
10
20
30
40
50
60
70
80
0 25 50 75 100 125 150 175 200
Cri
tical
Str
ess, σ c
r(M
Pa)
Slenderness (L/r)
Predicted Curve (K=1)Predicted Curve (K=0.55)Single Culm TestsMultiple-Culm TestsCompression Specimens1830 mm culm1218 mm culm609 mm culm
161

beyond marginally-engineered structures. Understanding the behavior of multiple-culm columns
offers a pathway to building larger and perhaps multi-story structures. The intent of this chapter
was to present the experimental results for the buckling behavior of single-culm and multiple-
culm specimens and characterize these with respect to the Euler equation which is typically used
in design. The results of the single culm specimens confirmed the need for initial out-of
straightness and taper to be considered for Tre Gai culm specimens. Multiple-culm column
specimens exhibited load redistribution as weaker culms began to fail and observed column
behavior was best represented by the sum of the individual culms, ΣIculm, rather than by the gross
section properties, Ig, of the multiple-culm column. Bamboo stitching was shown to enforce the
geometry of the multiple-culm column yet their benefit of restraining weaker culm buckling was
counteracted by their introduction of lateral loads to the individual culms. While these results
proved inconclusive, the effect of this stitch behavior must be considered where transverse or in-
plane bolted connections to these columns exist in the field. The apparent effective length factor,
K for the full-height specimens was shown to be closer to 1 than to the value predicted in the
control tests. This was potentially due to flexure-induced rotation causing local crushing at culm
ends as well as variability in the cross section and initial culm out-of-straightness. The flexure-
induced rotation also caused longitudinal splitting failures at the top end condition. These effects
need to be considered in the field for cases were culms are subject to end bearing loads. Finally,
short column tests exhibited similar longitudinal shear failures but showed a kinking behavior as
opposed to global buckling. Short columns also highlighted a significant reduction in load
capacity for slenderness ratios L/r < 75. More tests are necessary to refine and develop
predictive performance curves for future design.
162

6.0 SUSTAINABILITY OF BAMBOO STRUCTURAL COMPONENTS
Bamboo has been recognized for many years as a potentially sustainable alternative to
conventional building materials. This assertion has been made based on such qualitative
advantages as bamboos’ rapid growth rate, rapid renewability, material strength, and multitude
of species across the globe. However, few studies have attempted to quantify the sustainability of
bamboo alternatives in construction; particularly full-culm bamboo. This study seeks to quantify
the environmental impacts of a representative structural bamboo component; specifically the
four-culm bamboo column studied in Chapter 5. Those impacts are then compared with the
impacts of similar representative timber and steel columns. First, using a life cycle assessment
methodology, a representative comparative life cycle assessment (LCA) is conducted for the use
of bamboo columns and comparable solid timber or built-up box timber columns. The LCA
conducted follows a cradle-to-consumer approach that will study material extraction, processing,
delivery and erection of the product. The LCA will be considered with respect to column use in
the United States, which has a large supply of timber resources, as well as use in Brazil, which
has both timber and bamboo resources available. The representative comparative LCA example
is then expanded by adding representative steel columns for comparison, specifically standard
hollow box and round shapes (HSS). Ultimately, with a functional unit defined as a comparable
structural capacity, the intent of the work is also to investigate the potential of better integrating
environmental impacts into the structural design process.
163

6.1 BACKGROUND ON LIFE CYCLE ASSESSMENT OF BAMBOO
Bamboo has been widely recognized qualitatively as a sustainable material with advantages
including carbon sequestration and erosion control. Yet few studies have tried to quantify the
sustainable benefits of bamboo. The following section reviews some of the previous studies
regarding environmental impacts of bamboo use and the research basis for the current study. As
mentioned previously, the current midpoint LCA of full-culm bamboo seeks to determine
quantitatively whether a representative bamboo column is a relatively more sustainable
alternative to structurally comparable timber or steel columns of comparable capacity. The
current study is also based on the structural behavior of bamboo columns as described in Chapter
5 of this work, previous work on comparable timber components, and representative steel
alternatives designed based on AISC (2011) capacity calculations.
6.1.1 Life Cycle Assessment Methodology
Life cycle assessment (LCA) is defined as “a technique for assessing the environmental aspects
and potential impacts associated with a product” or process (ISO 14040 2006). The first LCA
study is considered to be a 1970 study done for the Coca-Cola Company investigating the
environmental impacts of soda container alternatives and most early LCA studies involved
packaging materials (Baumann 2004). The LCA process involves assembling an inventory of all
the inputs and outputs associated with a product or process, assigning environmental impacts to
these inputs and outputs, and then analyzing/interpreting the resulting impacts. The LCA
methodology outlines four major steps: definition of the goal and scope; life cycle inventory
(LCI) analysis of all inputs and outputs, life cycle impact assessment (LCIA) which converts
164

inventory data into a set of environmental impact categories, and interpretation of the results.
Standard guidelines for conducting an LCA are outlined in the International Organization of
Standards (ISO) document ISO 14040: Environmental management – Life cycle assessment-
Principles and framework (ISO 14040 2006). The goal and scope definition is critical to the
process as it not only outlines the intended outcome of the LCA study but sets the boundaries of
what inputs and outputs are considered in the study of a specific process. Common boundaries
include cradle to grave (considering impacts from material extraction to disposal), cradle to
consumer or cradle to site (considering impacts from material extraction until the hand-off to the
consumer), and cradle to cradle (considers impacts from material extraction to reuse of the
product). As discussed in Section 6.2, the system boundary of this study involves a cradle to
consumer or site approach.
6.1.2 Previous LCAs on Bamboo and Wood
As discussed in Chapter 1, the rapid growth rate of bamboo and its accessibility throughout the
world make full-culm bamboo an appealing construction material alternative for building when
compared with conventional materials, specifically timber. De Flander and Rovers (2009) sought
to quantify the global potential of bamboo as a modern construction material by comparing the
volume of timber and laminated bamboo lumber needed to construct a representative house with
a floor area of 175 square meters. They found that one hectare of Guadua angustifolia (Guadua)
bamboo in Colombia can produce enough volume per year to construct the model house. A
similar hectare of timber only produces enough volume of lumber to construct the model house
every four years. Lobovikov et al. (2012) suggest that increasing stands of bamboo culms could
be used as biomass carbon sinks in regions, although the concept requires further study.
165

Ultimately, quantified environmental impacts of bamboo are needed to assess environmental
sustainability.
van der Lugt et al. (2006) used a cradle-to-grave LCA to compare the environmental
impacts of beam and column components in a bamboo pedestrian bridge in the Netherlands with
timber, steel, and concrete elements required for a similar load bearing capacity. Guadua bamboo
was sourced from plantations in Costa Rica and even with sea transport was shown to be the
most sustainable alternative. However, conducting a life cycle costing (LCC) analysis, it was
found that steel was more cost effective than bamboo due to the shorter life span and higher
labor costs of the bamboo option.
van der Lugt et al. (2009) again investigated the environmental impacts and sustainability
of using various bamboo materials (both natural culms and engineered bamboo products) as
compared to timber products in Western Europe. The data used in this study for determining the
eco-costs/kg was obtained from the IDEMAT-2008 (www.idemat.nl) and Ecoinvent-v2
(www.ecoinvent.org/database/) databases. The study investigated both the environmental impact
or ‘eco-burden’ of bamboo products using the Eco-cost model and the regenerative nature of
bamboo with its annual yield. The LCA study considered mostly products made of Moso
bamboo but also looked at species Guadua spp. and Dendrocalamus asper. This report looked at
bamboo materials that are already available (or have the potential to be available) in the Western
European market: bamboo culms, Plybamboo (comparable to plywood), Strand Woven Bamboo
(SWB), Bamboo Mat Board (BMB; comparable to oriented strand board), and bamboo
composites (fibers). The LCA reported was based on a ‘cradle-to-site’ approach as it was
assumed that the use and end-of-life phases were similar for bamboo and timber products. The
products were assumed for use in the Netherlands and to have originated from sustainably
166

managed plantations in China. The functional unit (FU) varied for each product. For the LCA of
an unprocessed bamboo culm, the FU was taken to be a table leg 0.8 m long with a diameter of 9
cm. The eco-costs/kg were first calculated for the production and transportation of a 5.33 m long
Moso culm and results showed that 94.5% of the eco-costs were from sea transport from China
to the Netherlands. For the comparison with timber, the bamboo table leg was compared with the
same table leg built of various softwood and hardwood species. Results showed that sea
transportation caused the bamboo to have higher eco-costs than most woods except FSC tropical
hardwood (van der Lugt et al. 2009). Vogtländer et al. (2010) also compared the environmental
impacts of raw bamboo culms from the van der Lugt et al. (2006) study and Plybamboo and
Strand Woven Bamboo from China with similar timber products in terms of eco-costs/kg.
Calculations were based on the Ecoinvent-v2 and IDEMAT 2008 databases and the eco-costs
2007 method for LCIA (Vogtländer 2001). As expected and similar to previous studies, results
showed that sea transport gave bamboo a higher eco-cost/kg value compared to local timber but
bamboo performed better as compared to FSC hardwood.
van der Lugt et al. (2012) investigated the environmental impact (i.e.: global warming
potential in kg CO2 equivalents) for industrial bamboo products, specifically carbonized 3-layer
laminated bamboo board. An LCA was conducted considering a cradle-to-warehouse plus end-of
life boundary for the bamboo board production. The use phase was not included since “emissions
in this step are less than 1%” (van der Lugt et al. 2012) in comparison to production and
disposal. The product was considered to be produced in China and then shipped to Europe,
specifically the Netherlands. In addition to quantifying the environmental impacts of laminated
bamboo board, the authors also sought to address how carbon sequestration is dealt with in the
life cycle analysis of bamboo. Considering a cradle-to-grave scope, biogenic CO2 was considered
167

by van de Lugt et al. (2012) to have a net zero effect on global warming unless the bamboo is
burnt to generate electricity or heat as replacement for other fuels. On a global scale, van der
Lugt et al. also state that bamboo carbon sequestration is a function of land transformation (i.e. if
global forest area is increasing and the wood and/or bamboo volume in buildings is increasing,
then carbon sequestration increases). Therefore, effects of carbon sequestration from bamboo
plantation area growth over a 5 year period as well as credit from burning bamboo at disposal for
heat were considered and laminated bamboo board was found to be viable as a sustainable
alternative even after transportation to Europe.
A 2011 project by undergraduate students at the University of Pittsburgh also involved a
comparative LCA of bamboo and timber; specifically bamboo and timber portal frames. Portal
frames were selected as these are often seen in residential timber construction. In timber
construction, these are composed of dimensional lumber and plywood sheathing to provide
lateral stiffness. The functional unit of this study was defined as equivalent lateral stiffness and
experimental testing was conducted to determine the lateral stiffness of a timber portal frame
sheathed in plywood and a bamboo portal frame sheathed using a bamboo woven mat (Choi et
al. 2011). The equivalent stiffness ratio was determined to be 6.8 bamboo frames = 1 timber
frame. The timber frame was composed of 2 X 4 hem fir stud timber with nailed connections and
3/8” plywood sheathing while the bamboo frame was composed of Pseudosasa amabilis (Tonkin
Cane) from China. The impacts of the bamboo woven mat could not be studied due to a lack of
manufacturing data. Tonkin Cane was selected for the study because even though it has a small
diameter it has thick and stiff culm walls like large diameter bamboo. Additionally Tonkin Cane
is available from producers in the United States. This allowed the authors of the study to
investigate three cradle-to-consumer scenarios: locally produced and used in Brazil; domestically
168

produced and used in Pittsburgh, PA, USA; and internationally produced and used in Pittsburgh.
The bamboo process phases included agriculture, treatment, and transportation. The study used
established LCA data for the timber frame reported by Puettmann et al. (2010a, 2010b). Bamboo
produced locally and domestically was found to be potentially more sustainable than timber
based on the functional unit of equivalent lateral stiffness. Results also showed that
transportation was the major phase limiting the sustainability (i.e.: internationally produced
bamboo) followed by the cultivation impacts. The authors concluded that using larger diameter
bamboo (i.e.: stiffer culms) may improve the equivalent stiffness ratio between the two frames
and therefore increase the relative sustainability of the bamboo portal frame (Choi et al. 2011).
A second 2012 study by undergraduates at the University of Pittsburgh conducted a
comparative LCA of bamboo and glass fiber reinforced polymer GFRP gridshell structures for
use as rapidly deployable relief shelters in response to natural disasters (Brown et al. 2012). As
with the 2011 study, the functional unit was the structural stiffness of the gridshell structure.
Results showed that if bamboo is farmed in a sustainable manner, located in a favorable climate,
and transportation distance for delivery is limited, bamboo can be a sustainable material
alternative to GFRP for the gridshell structures considered (Brown et al. 2012).
With regard to US timber production, Milota et al. (2005) conducted a gate-to-gate life-
cycle inventory of softwood lumber production for both the US Pacific Northwest (Oregon and
Washington) and the US South (Georgia, Alabama, Mississippi, and Louisiana). The objective of
the work was to determine the energy and material inputs and outputs associated with the
production of planed dry lumber. The research was part of the development of a wood products
LCA database by the Consortium for Research on Renewable Industrial Materials (CORRIM).
The functional unit for the study was 1000 board feet or 2.36 m3 of planed, dry dimension
169
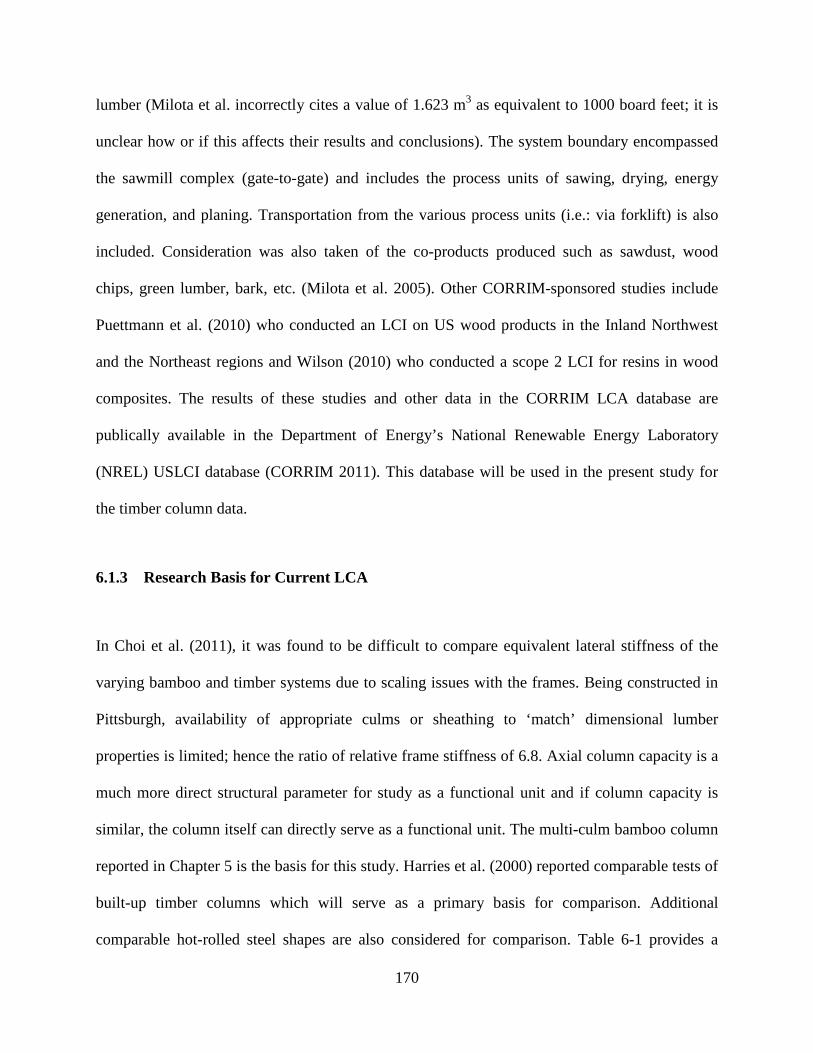
lumber (Milota et al. incorrectly cites a value of 1.623 m3 as equivalent to 1000 board feet; it is
unclear how or if this affects their results and conclusions). The system boundary encompassed
the sawmill complex (gate-to-gate) and includes the process units of sawing, drying, energy
generation, and planing. Transportation from the various process units (i.e.: via forklift) is also
included. Consideration was also taken of the co-products produced such as sawdust, wood
chips, green lumber, bark, etc. (Milota et al. 2005). Other CORRIM-sponsored studies include
Puettmann et al. (2010) who conducted an LCI on US wood products in the Inland Northwest
and the Northeast regions and Wilson (2010) who conducted a scope 2 LCI for resins in wood
composites. The results of these studies and other data in the CORRIM LCA database are
publically available in the Department of Energy’s National Renewable Energy Laboratory
(NREL) USLCI database (CORRIM 2011). This database will be used in the present study for
the timber column data.
6.1.3 Research Basis for Current LCA
In Choi et al. (2011), it was found to be difficult to compare equivalent lateral stiffness of the
varying bamboo and timber systems due to scaling issues with the frames. Being constructed in
Pittsburgh, availability of appropriate culms or sheathing to ‘match’ dimensional lumber
properties is limited; hence the ratio of relative frame stiffness of 6.8. Axial column capacity is a
much more direct structural parameter for study as a functional unit and if column capacity is
similar, the column itself can directly serve as a functional unit. The multi-culm bamboo column
reported in Chapter 5 is the basis for this study. Harries et al. (2000) reported comparable tests of
built-up timber columns which will serve as a primary basis for comparison. Additional
comparable hot-rolled steel shapes are also considered for comparison. Table 6-1 provides a
170

comparison of these comparable column members while the following sections briefly
summarize each material selection.
Table 6-1: Column sections considered
four culm bamboo column
6 X 6 built up timber column
6 X 6 dimensional
timber column
Steel
HSS3x3x1/8 HSS3x0.203
data source Chapter 5 Harries et al. (2000) NDS (2005) AISC (2011)
test data test data design data design data E (MPa) 13,450e 12,400d 12,400d 200,000d
KL (mm) 2600 3050 2600 2600 2600 A (mm2) 12,200 13,070 17,420 839 1077 I (mm4) 6,700,000 23,700,000 25,300,000 740,000 690,000 r (mm) 23.4 42.6 38.1 29.7 25.3 P (kN) 159e 179e 246d 160d 164d
fcr = P/A (MPa) 12.1e 13.5e 6.05d 14.1d fcr = 190d fcr = 152d
π2EI/(KL)2 (kN) 131 312e 579d 216 201 fcomp= (MPa) 54.7e 13.8d 14.5d 317d 290d
weight of 2600 mm column (kg) 24.3 19.7 23.6 17.3 22.1
E = modulus of elasticity; KL = effective length; A = cross section area; I = moment of inertia; r = radius of gyration; P = critical applied force; P/A = critical applied stress; π2EI/(KL)2
= theoretical Euler buckling load; fcomp = crushing stress; fcr = critical buckling stress. e = experimentally determined; d = code-prescribed design data
6.1.3.1 Four-culm bamboo columns
The four-culm columns reported in Chapter 5 of this work are the basis for this
comparative LCA study. The bamboo culms of species Bambusa Stenostachya (Tre Gai) were
harvested and treated in Vietnam and transported to the US via a supplier in Portland, Oregon.
The columns were composed of four 2600 mm high Tre Gai culms that were ‘stitched’ together
171

with bamboo cross stitches and threaded steel rods. The columns were designed and tested
according to ISO 22156 and ISO 22157-1:2004 guidelines.
6.1.3.2 Timber columns
Harries et al. (2000) conducted axial, flexural, and squash load capacity tests on built-up
timber elements. The columns and flexural members were constructed out of pressure-treated 2
in. nominal Southern Pine sawn dimensional lumber connected with Resorcinol resin adhesive.
The columns were 3048 mm in height and of various cross sectional area. Predicted capacity was
calculated using the allowable stress values from the 1995 National Design Standard (NDS)
Supplement. Experimental results showed that the built-up members had significant over-
strength to allowable design values and therefore could be designed conservatively with the NDS
provision for solid sawn timber columns (Harries et al. 2000). The average ultimate capacity
values were 119.1 kN for four 5 X 5 columns; 178.7 kN for two 6 X 6 columns and 217.6 kN for
two 8 X 8 columns. Since the boxed timber column used only 2 in nominal dimensional lumber,
it is a potential sustainable alternative to using larger solid timbers. Although not considered in
the present study, the columns tested by Harries et al. also included columns made of finger-
jointed dimensional lumber, which itself allows greater utilization of the harvested timber. Due
to the comparable capacity, the 6 X 6 column, shown in Table 6-1, will be considered in the
comparative LCA. A comparable 6 X 6 solid timber column was also designed using ASD
equations from the 2005 NDS Supplement (AF&P Assoc. 2005) and Breyer et al. (2007) for
consideration in the comparative LCA.
172

6.1.3.3 Structural Steel Columns
Representative hot-rolled steel columns were designed based on American Institute of
Steel Construction (AISC 2011) guidance for an unbraced length of 2600 mm and required
nominal capacity of 160 kN (experimental capacity of four-culm bamboo column). Only doubly
symmetric HSS sections were considered since the smallest available wide flange shape has a
capacity of more than 350 kN. Singly- or non-symmetric shapes were not considered due to the
complexity of their behavior and the difficulty of integrating these into a simple design. Steel is
priced by weight; therefore the columns were designed to minimize the steel weight (cross
sectional area) in each case.
6.2 METHOD AND INPUTS
The comparative LCA presented will assess the environmental impacts of the structural bamboo,
boxed timber, solid timber, and steel columns. A 2600 mm tall column will be considered as the
functional unit. This column has an axial load bearing capacity of approximately 160 kN (18
tons). The columns are not assumed to be part of a lateral load resisting system in this
comparison since the effects of lateral load will affect each column capacity differently. It is
assumed that the footing beneath the column is adequate. The footing and its connection to the
column are excluded from the LCA since the details of these may vary widely and will depend
on the structural context of the column (i.e.: gravity only or part of a lateral load-resisting
system). The results of this midpoint LCA will be the LCIA profiles for the columns. A cradle-
to-consumer approach will be used as it is assumed that the use and disposal phases for both the
bamboo and the timber columns will be similar; the disposal and/or re-use of the steel columns
173

will depend greatly on context. Durability (and thereby service life) will also vary for each
material and will be highly dependent upon context. In particular, whether the columns are
interior columns or exposed to the elements will affect service life. The varying service lives and
reuse options for each material as well as analysis of sensitivity to changes in service life and
reuse are major components for a ‘cradle-to-grave’ assessment and objects of future study; these
are not considered in the current comparison. The process flow diagram in Figure 6-1a illustrates
the six processes included in the system boundary: extraction (i.e.: harvesting), transportation to
the processing site, processing and preservative treatment, transportation to erection site,
fabrication of fastener system, and erection. For timber box columns (Fig. 6-1b), erection is
conducted before delivery to the site. For steel columns, extraction, transportation to the
processing site, and processing are combined into one life-cycle step (Fig. 6-1c).
a) bamboo columns
b) timber box columns
c) hot-rolled steel columns
Figure 6-1: Process Flow Diagram for Columns
Two scenarios are considered: 1) columns used in the USA, which has stockpiles of steel
and timber components; and 2) columns used in Brazil which has steel, timber, and bamboo
174

material available. Large diameter bamboo is not native to North America, and thus
transportation costs to receive bamboo from Asian plantations (or elsewhere) are expected to
drive the impacts of the use of bamboo in the USA. Nonetheless, with appropriate incentive,
large culm species could be grown in the USA, addressing the issue of availability. Brazil,
however, offers a more sustainable context since the number of native large diameter bamboo
species is greater. In terms of timber, Brazil is facing issues of deforestation in the tropical
forests of the Amazon as well as protecting what areas remain of the coastal Atlantic Forest.
Therefore, it is envisioned that in Brazil, there is both the incentive and opportunity for greater
structural use of bamboo.
Table 6-2 illustrates the LCI databases used to characterize the six major processes in the
system process flows. The LCI databases used were the USLCI (www.nrel.gov/lci/), IDEMAT
2001 (www.idemat.nl), and ecoinvent (www.ecoinvent.org/database/) databases. The LCIA tool
TRACI 2 version 3.01 from the US EPA (www.epa.gov/nrmrl/std/traci/traci.html) was used for
the life cycle impact assessment.
175
Table 6-2: Included Processes for Comparative LCA and Corresponding LCI Databases
Process Flow Mat. Scenario 1 (USA) Scenario 2 (BRAZIL)
Included Process Names Database Included Process Names Database
Extraction
Bam. Carbon sequestration estimate
Chain sawing I
van der Lugt (2012)
IDEMAT SAME AS SCEN. 1
Timber Softwood logs with bark, harvested at avg. intensity site, at mill, US SE/US USLCI
Roundwood, paraná pine (SFM), under bark, u=50%, at forest
road/BR U ecoinvent
Transport to
Processing
Bam. Transport, lorry 3.5-7.5t, EURO3/RER S ecoinvent SAME AS SCEN. 1
Timber Transport, combination truck, average fuel mix/US USLCI Included in Processing & Treatment
Production Steel 1 lb, Fe360 I (construction steel) IDEMAT SAME AS SCEN. 1
Processing and
Treatment
Bam.
Energy Asia I IDEMAT Electricity, low voltage, production BR, at grid/BR U' ecoinvent
Borax, anhydrous, powder, at plant/RER U ecoinvent SAME AS SCEN. 1
Boric acid, anhydrous, powder, at plant/RER U ecoinvent SAME AS SCEN. 1
Timber
Rough green lumber, at sawmill, US SE/kg/US USLCI Sawn timber, paraná pine (SFM),
kiln dried, u=15%, at sawmill/BR U ecoinvent
Dry rough lumber, at kiln, US SE/US USLCI Preservative treatment, sawn timber, pressure vessel/RER U (Adjusted
for Brazil Electric Grid) ecoinvent Surfaced dried lumber, at planer mill,
US SE/kg/US USLCI
Preservative treatment, sawn timber, pressure vessel/RER U ecoinvent Analyzing 1 kg 'Wood preservative,
organic salt, Cr-free, at plant/RER U'
ecoinvent Wood preservative, organic salt, Cr-
free, at plant/RER U ecoinvent
Steel 1 oz Alkyd paint, white, 60% solvent, at plant/RER U ecoinvent SAME AS SCEN. 1
Transport to Site
Bam.
Transport, ocean freighter, average fuel mix/US USLCI
Transport, lorry 3.5-7.5t, EURO3 ecoinvent Transport, single unit truck, diesel
powered/US' USLCI
Transport, combination truck, diesel powered/US' USLCI
Timber Transport, single unit truck, diesel powered/US USLCI Transport, lorry 3.5-7.5t, EURO3 ecoinvent
Steel Transport, combination truck, diesel powered/US' USLCI Transport, lorry 3.5-7.5t, EURO3 ecoinvent
Fasteners
Bam. Galvanized steel sheet, at plant/RNA USLCI SAME AS SCEN. 1
Timber Box Only
Phenol-resorcinol-formaldehyde resin, at plant/US (Cradle - Gate) USLCI SAME AS SCEN. 1
Phenol-resorcinol-formaldehyde hardener, at plant/US (Cradle - Gate) USLCI SAME AS SCEN. 1
Erection Bam.
Electricity, at grid, Eastern US/US USLCI Electricity, low voltage, production BR, at grid/BR U ecoinvent Timber
176

6.2.1 Extraction (Harvesting)
For timber, the species investigated were Southern Yellow Pine (specific gravity 0.55) for the
USA scenario and Paraná Pine for the Brazilian scenario. The extraction process for bamboo and
timber focused on the harvest of the grown product for industrial use, although agriculture
processes are included in the LCI figures. In terms of US timber, CORRIM data in the USLCI
database considers the production of seedlings which includes fertilization, planting, and forest
management including fertilization during stand growth (Johnson et al. 2005, Oneil et al 2010,
and Puettmann et al. 2010). Agriculture is also included in values for the Paraná Pine planation-
grown product (Athaus et al. 2007). In the case of bamboo agriculture, it is assumed that there is
no fertilizer used and the agriculture process is not otherwise included; this assumes initial
manual planting and regenerative growth of culms; thus no ‘reforestation’ process is required.
These assumptions are based on a case study of a bamboo plantation in Costa Rica (van der Lugt
2009) and interviews with a plantation owner in Brazil conducted by the author (Inglês 2012).
However, it is acknowledged that bamboo agriculture processes vary between plantations of
different sizes as well as by regions globally and future study on variability between bamboo
harvesting practices is needed. Although bamboo is harvested by hand in many areas, the use of
a chain saw was assumed as a practical method for harvesting both the culm size and volume of
culms practically required for structural applications. For the southern pine case, reforesting and
carbon sequestration is included as part of the harvesting process. It is noted that native Paraná
pine is an endangered species due to historical over-logging but the process used considered pine
harvested from a sustainably managed plantation (and is also representative of other plantation
pine species) and therefore implicitly also includes reforestation and carbon sequestration.
Presently, there is no data available for bamboo reforestation or carbon sequestration in standard
177

LCIA databases; this is a significant weakness of the presently available databases and should be
addressed by future (agricultural-related) researchers in order that timber and bamboo
alternatives may be compared on even more comparable bases. Recently, however, van der Lugt
et al. (2012) proposed quantification of the beneficial effects of carbon sequestration and
reforesting for bamboo. They propose a value of 1.83 kgCO2/kg of bamboo culm harvested. This
value becomes 5.72 kg CO2/kg when it is considered that the culms only constitute 32% of the
plant (Zhou and Jiang (2004) as reported by van der Lugt); underground rhizomes account for
the majority of sequestered carbon. This value is used in the present analyses as an estimate of
carbon sequestration in order that analyses of each material are comparable.
6.2.2 Transportation to Processing
The Tre Gai bamboo used in this study was locally harvested and processed near Ho Chi Minh
City, Vietnam. The timber box column was processed by Cox Industries of Orangeburg, South
Carolina (Harries et al. 2000). Transportation of harvested logs to the processing facility and
sawmill is included in the data from both the USLCI and ecoinvent data bases. For scenario one,
raw logs are assumed to travel 130 km to the sawmill for lumber production (Puettmann et al.
2010). For scenario 2, a transport distance of 90 km for Paraná pine is included in the processing
step (Athaus et al. 2007). This latter inconsistency results from the use of multiple LCI databases
which classify processes differently using data from multiple studies. This may affect the
ultimate comparability of results but represents current best-practice. For harvested bamboo, it
was assumed that culms are transported a similar distance as timber – 130 km and 90 km in each
scenario, respectively – by a single unit lorry.
178

6.2.3 Processing and Treatment
The processing for bamboo includes sun drying and preservative treating using the Boucherie
Method. The Boucherie Method uses borates (i.e.: borax powder and boric acid) to impregnate
the bamboo with a pump and is described in Section 2.1.4.3. An estimated 1kWh of energy is
used per culm (Choi et al. 2011) and the amount of chemical per weight of bamboo is given by
van der Lugt (2003).
For timber scenario 1, processing includes sawing, kiln drying, planing, and preservative
treatment. For pressure treating, a creosote free preservative is impregnated into the timber using
an industrial pressure chamber (Southern Pine Association, 2006). These steps include such
processes as transport through the mill as well as sorting and stacking. The Paraná pine scenario
includes similar processes; therefore the preservative treatment process from scenario 1 is used
with an adjustment for the Brazilian electricity grid. For sawn timber intended for only interior
exposure, typically no treatment is required. The intended use of the column: interior or exterior
exposure should be considered in interpreting impacts.
6.2.4 Transportation to Site
For scenario 1, it is assumed that bamboo columns are assembled in Pittsburgh, PA. The treated
Tre Gai bamboo is shipped via ocean freighter from Ho Chi Minh City to a supplier in Portland,
OR (12875 km). A single unit truck is used to deliver the bamboo from the shipyard to the
supplier (9 km). The shipment is then transported cross country by tractor-trailer to Pittsburgh
(4184 km). The completed timber columns are transported by single unit truck from South
Carolina to Pittsburgh (946 km).
179

For scenario 2, specific locations of bamboo and pine suppliers in Brazil are unknown
although sustainable options should be supplied locally. Therefore, both materials are assumed to
travel via lorry 805 km to the erection site.
6.2.5 Fasteners
Fasteners are considered only when they are used in the construction of the column itself. End
connections and footings used to connect the column ‘into’ the structure are not considered.
Therefore, no fasteners are considered for the solid timber and steel cases. The fastening systems
for the bamboo and timber box column are steel bolted connections and a phenol-resorcinol-
formaldehyde resin adhesive, respectively. The galvanized steel components (threaded rods,
nuts, and bolts) used to connect the bamboo test columns (Chapter 5) were weighed and their
impacts determined based on the weight of the material. Transportation to site of the connection
components is assumed to be coincident with final domestic transportation of the culms.
It was assumed that a 2 mm layer of resin is applied to all contact areas for the built-up
timber columns and a 1:5 ratio of hardener to resin was used to determine the mass of each
(Wessex Resins 2011). Erection of the built-up columns is completed during the plant-processing
phase; the columns are shipped in their final form.
6.2.6 Erection
The erection process for the bamboo and timber columns primarily involves the use of sawing
equipment and drilling equipment. Bamboo columns are assembled in the field, whereas built-up
timber columns are assembled in the plant; following and preceding shipping to the site,
180

respectively. For the bamboo column, a miter saw was used to trim culms to their proper height
when required (study assumes culms were supplied came in standard 3 m (10 ft) lengths) and a
cordless drill was used to drill the holes for bolted connections. Power, voltage, and amps from
each piece of equipment were used along with estimated usage times to calculate the amount of
electric energy required. A band saw was used for cutting threaded steel rod to length for the
through-bolts. For the solid timber and the timber box columns, only the miter saw was utilized
for cutting timber to their proper length when required. Steel sections are assumed to be cut to
length at their respective mills and require no further assembly within the scope of this analysis.
Once on site, individual columns have similar weights (Table 1-1) and thus handling equipment
requirements will be similar; all columns considered can be carried by one manual laborer and
certainly erected by two.
6.2.7 Steel Process Inputs
The IDEMAT 2001 database considers construction steel environmental impacts based on the
1999 average world production and considers delivery in Europe, specifically the Netherlands. It
is unclear what percentage of the environmental impacts is due to final delivery in this dataset.
Steel is a truly global commodity with raw materials coming from all corners of the globe and
final products shipped to all markets. The industry in 2013 is also considerably different than that
in 1999; for instance, between 1999 and 2012, US steel production has increased 190% and
global production has increased 287%. The US share of global production has fallen from 8.6%
in 1999 to 5.7% in 2012 (World Steel Association 2012, USGS 2010, and Figure 1-2).
Nonetheless, noting that representative steel samples are being used for comparison in this study,
the environmental impacts values from IDEMAT 2001 are used directly.
181

Steel sections are painted with an Alkyd paint to prevent rust and it is assumed that 32
ounces of paint covers 100 square ft. Transportation to site is similar to the timber cases for both
scenarios 1 and 2; it assumed that the final columns travels 805 km by truck. No assembly is
considered as the steel columns are assumed to arrive on site cut to the required length.
6.3 LCIA PROFILES
LCIA profiles are organized by the nine impact categories associated with the TRACI LCIA
tool:
• global warming potential of greenhouse gas emissions measured in units of kg CO2
(carbon dioxide) equivalent (eq)
• acidification: H+ moles eq
• carcinogens: kg benzene eq
• non-carcinogens: kg toluene eq
• respiratory effects: kg PM2.5 (particulate matter less than 2.5 microns) eq
• eutrophication (e.g. excess nitrates and phosphates) : kg N eq
• ozone depletion: kg CFC-11 (chlorofluorocarbons) eq
• ecotoxicity (e.g. pesticides, fertilizers, and energy emissions): kg 2,4-D eq and,
• smog (e.g. nitrous oxide, sulfur dioxide, and carbon monoxide): kg NOx eq
First, the bamboo and timber options are compared as they are considered to have the
greatest similarity in harvesting, production, and treatment. Additionally, bamboo and timber
may be considered to be more comparable and appropriate for structures in which bamboo may
be considered. Impacts for bamboo and timber options are therefore each divided into major
182

processes. Following this, total impacts for categories are compared for the bamboo, timber, and
steel alternatives.
6.3.1 Bamboo and Timber Columns
Figures 6-2 and 6-3 illustrate the cumulative LCIA profiles for the bamboo and timber
columns for scenario 1 and scenario 2 respectively. Values are normalized to the maximum value
in each category; thus comparison cannot be made between impact categories. For the first (US)
scenario (Fig. 6-2), the bamboo column has the highest impact value in the two categories of,
carcinogens and non-carcinogens resulting from the use of galvanized steel fasteners which have
a significant impact in these categories. For global warming potential, reforestation and carbon
sequestration considered during the harvesting process has the largest environmental impact
contribution for bamboo but these net environmental benefits count as a credit in this case (i.e.: a
negative impact value in Fig. 6-2). However, if carbon sequestration was not considered, bamboo
would have the largest environmental impact due to long shipping distance required. Ultimately,
transportation to site and the use of steel fasteners are the dominant processes for bamboo in all
impact categories except global warming potential. Without these processes, bamboo would have
the least environmental impact of the three natural product alternatives in all categories. In this
study, it must be acknowledged that transportation effects are estimated and relative only to this
specific study. Clearly, for bamboo construction to be viable in North America local planation
must take place; this will significantly reduce environmental and financial impacts.
The timber box column has the highest impacts in the five categories of acidification,
respiratory effects, eutrophication, ecotoxicity, and smog due to the impact of the adhesive resin
(fastener) used. Timber processing and treatment as well as transportation also have noticeable
183

impacts for the performance of both timber columns, although if the timber is destined for
interior use, treatment becomes unnecessary. In the case of global warming potential, the timber
columns also have a net environmental benefit (negative number in Fig. 6-2) but this is not as
significant as the bamboo case.
Only in the impact category of ozone depletion does the solid 6x6 timber column have
the highest impact due to timber processing (since the solid column has more material).
However, if a more environmentally friendly adhesive system were used for the built up column,
it would have lower impacts in all categories as compared to the solid timber column. Overall,
scenario 1 results illustrate that bamboo is a potentially sustainable option despite not being
locally grown. This conclusion is dependent on the carbon sequestration allowance used; in this
study the value reported by van der Lugt et al. (2012) was adopted in lieu of an alternative value
provided within the available LCA data bases. Additionally, although less lumber is used, the
impacts associated with the adhesive resin in the built-up timber column adversely affect its
overall environmental performance compared to solid timber. However, not factored into the
equation is that large dimensional lumber (solid timber column) must come from larger and older
trees, while smaller dimensional lumber (2 in nominal thickness) used in the built-up column can
be sawn from smaller, younger trees, sustainable farmed trees and more boardfeet (lumber
volume) can be produced per harvested tree.
184

Figure 6-2: LCIA profile for 2600mm bamboo and timber columns (scenario 1)
For scenario 2, set in Brazil, the bamboo column only has the higher environmental
impacts in the category of non-carcinogens and the lowest impacts in all other categories but
carcinogens. Galvanized steel fasteners and transport were the major processes impacting
bamboo performance yet transport now only includes 805 km of truck transport to site. If
bamboo is local to a community, the impact of transportation would fall even further. The built-
up timber box column has the higher impacts in the categories of acidification, eutrophication,
ecotoxicity, and smog due, once again, to the influence of the adhesive resin. The solid timber
column has the higher impacts in the categories of carcinogens, respiratory effects, and ozone
depletion, although these values may fall if the wood remains untreated for interior use.
-1.4
-1.2
-1
-0.8
-0.6
-0.4
-0.2
0
0.2
0.4
0.6
0.8
1Im
pact
(Nor
mal
ized
to m
ax im
pact
in e
ach
cate
gory
)
ERECTION FASTENERS
TRANSPORTATION TO SITE PROCESSING AND TREATMENT
TRANSPORT TO PROCESSING EXTRACTION
Order of Impact Bars
185
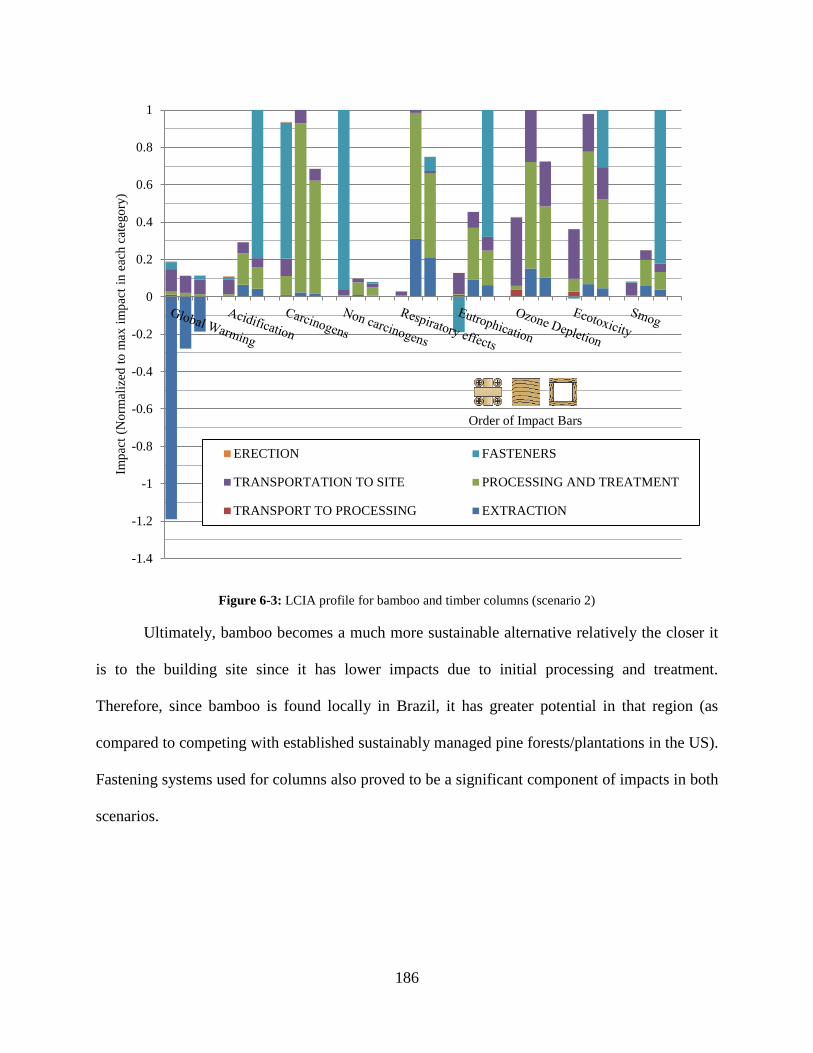
Figure 6-3: LCIA profile for bamboo and timber columns (scenario 2)
Ultimately, bamboo becomes a much more sustainable alternative relatively the closer it
is to the building site since it has lower impacts due to initial processing and treatment.
Therefore, since bamboo is found locally in Brazil, it has greater potential in that region (as
compared to competing with established sustainably managed pine forests/plantations in the US).
Fastening systems used for columns also proved to be a significant component of impacts in both
scenarios.
-1.4
-1.2
-1
-0.8
-0.6
-0.4
-0.2
0
0.2
0.4
0.6
0.8
1Im
pact
(Nor
mal
ized
to m
ax im
pact
in e
ach
cate
gory
)
ERECTION FASTENERS
TRANSPORTATION TO SITE PROCESSING AND TREATMENT
TRANSPORT TO PROCESSING EXTRACTION
Order of Impact Bars
186

6.3.2 Comparison with Steel Columns
While the first portion of the LCIA study considered bamboo and comparable timber columns,
the second portion adds hot-rolled steel column sections that were optimized to use the least
material (i.e.: lowest cost). The environmental impacts of representative box, and round HSS
columns were assessed for both the US and Brazil scenarios. The results of the LCIA for
representative steel sections are then compared with the environmental impacts of the bamboo
and timber columns in Figures 6-4 and 6-5.
The results in Figure 6-4 for scenario 1 (again normalized to the greatest impact value in
each category) illustrate that there is nominal difference between the square and round HSS
shapes and is attributable to the greater sectional area (and therefore section weight) of the round
HSS (see Table 6-1). The HSS sections are shown to out-perform both timber columns in four
impact categories: eutrophication, ozone depletion, ecotoxicity, and smog (built up timber is
worst case in five categories, solid timber in one) and to outperform bamboo in five categories:
acidification, non-carcinogens, ozone depletion, ecotoxicity, and smog.
187

Figure 6-4: LCIA profile for bamboo, timber, and steel columns (scenario 1)
In scenario 2 (Fig. 6-5), the performance of steel components appears to improve
compared to timber alternatives yet decreases slightly in relation to the bamboo column. The
HSS sections out-perform the timber alternatives in 6 categories: acidification, respiratory
effects, eutrophication, ozone depletion, ecotoxicity, and smog. The HSS sections only out-
perform bamboo in 3 categories: non-carcinogens, ozone depletion, and ecotoxicity.
-1.2
-1.0
-0.8
-0.6
-0.4
-0.2
0.0
0.2
0.4
0.6
0.8
1.0
1.2Im
pact
(Nor
mal
ized
to m
ax im
pact
in e
ach
cate
gory
)
Bamboo Timber Timber Box HSS Box HSS Round
188

Figure 6-5: LCIA profiles for bamboo, timber, and steel columns (scenario 2)
6.3.3 Discussion
Table 6-3 summarizes the quantitative environmental impacts for all column alternatives in both
scenarios. The table, as with Figures 6-2 through 6-5, illustrate that there is no clear sustainable
option between the bamboo, timber, and steel columns. This is due to the fact that no weighting
is given to the nine impact categories outlined in the midpoint LCIA study. A single
sustainability metric similar to the eco-costs/kg used by van der Lugt et al. (2006, 2009) or
Vogtländer et al. (2010) is therefore needed to define the more sustainable option. Ultimately,
van der Lugt et al. (2009) determined that only domestically produced bamboo products were
-1.2
-1.0
-0.8
-0.6
-0.4
-0.2
0.0
0.2
0.4
0.6
0.8
1.0
1.2Im
pact
(Nor
mal
ized
to m
ax im
pact
in e
ach
cate
gory
)
Bamboo Timber Timber Box HSS Box HSS Round
189

potentially more sustainable than domestic European lumber in some cases. A similar finding
appears to be the case in the present study in which the results presented did show that the
bamboo column had improved performance in the second scenario: domestic production in
Brazil. This highlights the conclusion that bamboo is sustainable when used locally rather than
when it is shipped long distances and is likely true for most commodities when monetary cost is
excluded from the analysis. The environmental impacts of shipping outweigh the benefits of the
bamboo material. This agrees with findings of Choi et al. (2011) which considered the TRACI
impact categories of only global warming potential, acidification, non-carcinogens, and
ecotoxicity in their final report. The LCIA profile results reported by Choi et al. also showed that
internationally shipped bamboo had higher impacts than timber in the categories of global
warming, acidification, and non-carcinogens based on equivalent frame stiffness. Additionally,
the midpoint LCIA points to the large impact of fasteners on environmental impacts of both
bamboo and timber components. Considering the relative weight of categories in which fasteners
impact may change this conclusion as fasteners represent a relatively small part of either column.
The results also illustrated the comparable performance of representative steel
components as compared with the bamboo and timber columns. Janssen (1981) states that steel
production requires 50 times more energy than bamboo and Ghavami (2008) reports that two
tons of CO2 are produced for every 1 ton of steel. Certainly, if one kilogram of steel and bamboo
were compared one would assume that the bamboo would perform better. However, when
looking at structural elements having comparable capacities, the smaller HSS sections exhibited
environmental impacts (depending on category) on par with those of bamboo and timber.
Nonetheless, the bamboo impacts were driven by transportation and fastening systems while
steel impacts were driven by production.
190

Table 6-3: LCIA results for all column alternatives
Section four-culm bamboo column 6X6 sawn timber 6X6 built-up
timber Box HSS3x3x1/8 HSS3x0.203
Impact Category Unit Scen. 1 Scen. 2 Scen. 1 Scen. 2 Scen. 1 Scen. 2 Scen. 1 Scen. 2 Scen. 1 Scen. 2 Global Warming kg CO2 eq -149.8 -153.6 -50.8 -25.1 -29.9 -10.9 22.5 29.3 28.6 37.2
Acidification H+ moles eq 16.7 8.6 3.2 22.9 64.5 78.3 10.6 12.8 13.5 16.2 Carcinogens kg benzene eq 0.109 0.126 0.034 0.134 0.023 0.092 0.568 0.574 0.726 0.733
Non carcinogens kg toluene eq 3324.5 3274.7 83.9 322.8 92.3 259.2 1032.0 1059.6 1316.5 1351.8 Respiratory effects kg PM2.5 eq 0.024 0.027 0.009 0.866 0.072 0.649 0.037 0.045 0.047 0.057
Eutrophication kg N eq -0.004 -0.006 0.036 0.046 0.093 0.101 0.007 0.012 0.008 0.015 Ozone Depletion g CFC-11 eq 0.0005 0.0033 64.6 0.0077 43.3 0.0056 0.0001 0.0016 0.0001 0.0020
Ecotoxicity kg 2,4-D eq 6.4 10.1 6.0 27.9 12.9 28.5 3.4 6.8 4.1 8.4 Smog kg NOx eq 0.32 0.15 2.88 0.47 3.48 1.87 0.12 0.16 0.15 0.21
191

6.4 FUTURE WORK
The goal of the current midpoint LCA was to compare the environmental impacts of a
representative bamboo column with comparable timber and steel alternatives designed for the
same axial capacity and to demonstrate advantages and drawbacks of the adoption of a structural
capacity or element as a functional unit. In terms of the bamboo LCIA, information on the
environmental impacts for available agriculture, harvesting, and treatment processes (as well as
uses) of various bamboo species must be compiled and refined into a standard database for future
assessments.
In this study, the carbon sequestration allowance for bamboo was adopted from an
independent study: van der Lugt et al. (2012). It is not entirely clear that this value is determined
considering the same parameters as those provided in standard datasets for timber. Nor, one
assumes, has the value been ‘vetted’ to the same degree as those formalized in the datasets. For
example, the carbon sequestration data for bamboo and timber are not directly comparable
without knowing the harvest cycle for both. In general, structural bamboo may be harvested
every two or three years whereas softwood lumber is harvested on cycles on the order of ten
years or more. Thus the carbon sequestration advantage of bamboo may be three to five times
that of timber. It is understood that the present data and study accounts for the single harvest
cycle required to produce the bamboo or timber column considered.
Study of impacts due to bamboo connection methods would also be useful as the column
fastening system for the four-culm column was a large contributor in the total impact values. The
sensitivity of results to changes in the bamboo processes (as well as those of timber and steel) is
192

also necessary once an improved database is available. Improved, and perhaps regionalized
impact data on steel production is required since steel production can vary with location as
different production processes and national energy mixes will affect results. Yet steel is a
globally traded commodity, raw materials for steel production are also harvested and traded on a
global scale, and the end of life and recycling of steel varies considerably. For example, ore may
be extracted in Australia of Brazil (and mixed with recycled feed stock from India and Europe)
for steel milled and fabricated in China intended for a bridge structure in the USA or UK (current
examples include the San Francisco Bay Bridge and the second Forth Road Bridge in
Edinburgh). At the end of the bridge’s life – which may be 100 years hence, the steel may be
recycled in India or another region not presently considered. Although the environmental impact
data for construction steel from the IDEMAT 2001 database was used as being representative,
determination of the sensitivity to process changes is necessary.
Inclusion of masonry and reinforced concrete construction, which bamboo construction
often competes with in rural areas such as Northeast India, would also benefit the overall
comparison. In terms of column elements considered here, masonry piers, cold-formed steel
built-up columns, and timber cluster posts should also be included as alternatives. Replacing full-
length lumber in the box columns with finger-jointed lumber (assembled from offcuts when
lumber is sawn to length) should also be investigated. (While not reported in Harries 2000,
finger-jointed box columns were also tested and the results reported in the sponsor report.)
6.4.1 Single metric for environmental impact
A single metric of environmental impact would also improve the overall assessment as
the nine impact categories of the midpoint LCA did not necessarily provide a clear ‘sustainable’
193

option. Weighting of the impact categories into a single parameter would allow for more straight
forward comparison with structural parameters and ultimately better integration into the
structural design process. Nonetheless, it must be acknowledged that any single measure is
necessarily flawed and, itself, must address regional priorities. Janssen (1981) calculated the
ratio of embodied energy (MJ/m3) and design stress (MPa) for concrete, steel, wood, and
bamboo to show an order of magnitude between materials for comparison. However, this
approach does not account for design parameters such as shape of the cross section and required
stiffness (e.g. deflection limits). For example, column design is driven by stability measured by
the length (m), moment of inertia (mm4) and radius of gyration (mm), rather than by stress.
Instead, a parameter could be developed in the form of ‘environmental impact’/structural
property, ηQ, where Q is a measure of eco-cost/kg such as those used by previous studies: kg
CO2/ft, or embodied energy/ft (van der Lugt et al. 2009, Vogtländer et al. 2010). Like geometric
properties, values could then be calculated for specific or representative structural materials or
shapes and be compiled into a design aid for use in comparing structural design alternatives. An
example might be a column of data quantifying environmental impact vs. unbraced column
length added to Table 3-10 used for column design in the AISC Steel Construction Manual.
Tabulating a generalized case associated with production, adjustment factors could then be
developed for impact parameters based on location specific process (e.g. European, US, or Asian
steel production) or material (e.g. domestic softwood, domestic hardwood, international
hardwood, or sustainably harvested wood) as well as a generalized transportation adjustment
factor (e.g. 100, 500, or 1000+ km, transport radii factor). Such an approach might take the form
of design Equation 6-1similar to Equation 2-1.
[ ]kfactortransportfactorprocess xCxxCCQQ =η (6-1)
194

6.4.2 Inclusion of a transportation adjustment
Another key issue with the LCA of structural sections is the issue of accounting for shipping
volume as well as weight – essentially considering the shape or form of the element being
shipped. Currently, transportation environmental impacts are given in terms of material weight
multiplied by distance traveled in units of tons-kilometer (tkm) or similar. This assumes that two
similarly weighed structural components (in this case, a column) generate the same impacts (for
a specific vehicle and distance travelled) regardless of structural shape. Yet standard trucks have
a finite shipping volume (and load capacity) and different columns vary in size and shape. As an
illustrative example using the columns considered in this study, consider a standard shipping unit
volume of 2.6 m long and 2.44 m square; i.e.: 2.6 m long columns bundled into a 2.44 m square
pallet for shipping on a flatbed truck thereby accommodating conventional roadway vertical and
horizontal clearances. For this case, Table 6-4 provides a summary of the number of columns
that may be shipped in each unit and their approximate weight. In each case, it is assumed that
the total product weight may be carried by the truck; another threshold that must be respected.
Table 6-4: Example of transportation volume and weight.
Bamboo built-up timber solid timber HSS3x3x1/8 HSS3x0.203 Unit dimension 100 mm dia. culms 132 mm square 140 mm square 76 mm square 76 mm dia.
Weight of 1 column (kg) 24.3 19.7 23.6 17.3 22.1 Number of 2600 long
columns in 2.4 x 2.4 m unit 648 culms
130 columns 324 289 1024 1152
Total weight per truck (kg) 3,536 6,400 8,500 17,700 25,400 tkm/km (1 truck) 3.54 0.64 0.84 1.77 2.54
Number of trucks or trips required to transport 1152
columns 9 4 4 2 1
Total shipped weight (kg) of 1152 columns 27,993 22,694 27,187 19,929 25,400
It is easily seen from Table 6-4 that the column form will affect transport impact.
Bamboo and timber require approximately nine and four times the number of vehicles (or
195

individual trips), respectively, to ship an equivalent number of columns as the steel HSS round
section despite the total shipped weight being similar. In this case, the weight of a full truck
varies significantly between columns. However, each trip includes the impact of moving the
truck itself (a ‘fixed’ impact per km) and perhaps, the impact of the truck returning to the depot
empty. These factors cannot be easily accounted for in the present LCIA which bases
transportation impact on shipped weight only. The column form, and its effect on the
transportation volume required, must be accounted for in the comparative LCIA. An appropriate
form factor must be developed so as the varying shape of structural columns can be considered in
environmental costs of shipping. In the present example, at least two variations clearly
demonstrate the variability of transportation impact:
1. In the example shown in Table 6-4, the bamboo columns are shipped as individual culms and
assembled on site. If the culms were pre-assembled, the volume taken up by one column
would not be that of five individual 100 mm culms (approximately 0.03m3) but a square unit
approximately 300 mm on a side (0.23 m3), almost eight times the shipping volume.
2. In some cases tubular steel is shipped nested into larger sections; this will decrease the
number of columns in our hypothetical shipping unit but increase the shipment density;
therefore the shipping impact per column may fall assuming that the truck capacity is not
exceeded and that there is a demand for shipping sections of different size.
6.4.3 Consideration of service life
Last, consideration of structural component design life must also be considered in future studies.
As natural fiber materials, bamboo and timber have a limited service life, especially if untreated.
Even steel will corrode in time if not treated properly. However, if properly maintained and
196

recycled, all three alternatives can offer potential longevity and reuse, which reduces the amount
of new material needed for replacement or new construction. Therefore, impact benefits
associated with reuse and consideration of service life (whether directly applied in the
environmental impact parameter or through an adjustment factor) should be considered in the
analysis. Efforts in this realm have been made by a number of researchers including Aktas and
Bilec (2012).
6.5 CONCLUSIONS
The goal of this study was to quantify the potential environmental sustainability impacts of a
structural bamboo column in comparison to a solid timber, built-up box timber, and two
representative steel column sections. An additional objective was to demonstrate, by example,
advantages and drawbacks of the adoption of a structural capacity or element as a functional unit.
A comparative midpoint LCA considering a scope 2 (cradle-to-consumer) approach was
conducted for these elements with respect to two scenarios: use in the United States (scenario 1),
where bamboo must be imported and use in Brazil (scenario 2) where bamboo species are locally
grown. It was initially hypothesized that the boxed timber column would be the more sustainable
option in the United States while bamboo would prove the more sustainable option in Brazil.
The results of the study ultimately did not produce a clear sustainable option between the
bamboo, timber, and steel columns in either of the scenarios studied. LCIA profiles did show that
transportation to erection site contributed the most to the environmental impacts of the bamboo
column in both scenario 1 and 2. Specifically, the long distance transport of bamboo in scenario
1 appears to negate the benefits of using bamboo seen in categories and therefore bamboo is best
197

used only in a domestic context. The bamboo column had larger environmental impacts than
timber in the categories of carcinogens (scenario 1) and non-carcinogens (scenario 1 and 2); this
is attributed to the use of galvanized steel fasteners used (consistent with the experimental work
presented in Chapter 5). Further research on non-steel fastener alternatives for the bamboo
column could significantly reduce environmental impacts. The Brazil scenario ultimately
decreased bamboo environmental impacts in five of the nine categories: global warming,
acidification, non-carcinogens, eutrophication, and smog.
The phenol-resorcinol-formaldehyde resin and related processing contributed the most to the
environmental impacts of the built-up box timber column in both scenarios 1 and 2, allowing the
solid timber column, despite having more wood material, to outperform the timber box column
in some categories. An alternative adhesive may significantly reduce these impacts. The use of
finger-jointed timber may also reduce the timber-related impacts of the box columns since
finger-jointed lumber is assembled from what is essentially waste in the dimensional lumber
fabrication process. The HSS box and HSS round sections outperformed the timber columns and
even the bamboo in some impact categories for both scenarios and are potential options for use.
The erection process in all cases had negligible impacts as compared with other process steps.
The midpoint LCA results show that bamboo could be a sustainable alternative relative to
other columns studied in both the US and Brazil but grouping and weighting of TRACI impact
categories is needed to better compare the bamboo, timber, and steel alternatives. Furthermore,
these results highlight the need for development and refinement of a database for bamboo life
cycle inventories and the potential of future work in developing an environmental impact
quantification based on structural parameters than can be integrated into the structural design
process and standard design aides.
198

7.0 CONCLUSIONS
The objective of this work was to describe a research program aimed at assessing the
performance of full-culm structural bamboo use in construction from perspectives of standard
test method development, structural component strength, and environmental impact. Research is
focused on the use of bamboo in its natural full-culm form rather than fabricated bamboo
products and consideration is given to the appropriate social context of such bamboo
construction: use as a locally available non-conventional building material. In consideration of
this objective, several experimental studies were conducted. Detailed conclusions are found in
each chapter.
7.1 ASSESSMENT OF STANDARD MATERIALS TEST METHODS
In the effort to highlight interferences present in current methods and practices in standard
testing methods, the tensile tests presented in Chapter 3 sought to investigate the influence of
bamboo fiber gradation and end restraint conditions on specimen performance since these factors
are not currently considered in applicable standard test methods. Radially cut specimens were
shown to have strengths similar to, yet nominally less than, the average strength values of
tangentially cut specimens from the inner, middle, and outer layer of the culm wall thickness.
Results of tests of radially-cut specimens were shown to be comparable to the strengths of
199

middle layer tangential specimens which imply a nonlinear fiber distribution with an order
greater than one. Specimens with rotationally free end conditions were shown to have a higher
average strength in all cases than those with fixed end conditions and it is believed that allowing
end rotation caused longitudinal splitting failure which permitted redistribution of axial forces
since strain compatibility across the section was no longer valid. The effects of restraining
rotation were illustrated in the non-linear strain distributions captured with a VIC-3D imaging
system for the free end constrained radial specimens. However, nonlinear strain was also seen in
some tangential and fixed specimens. Overall, fiber density across the culm wall thickness and
the end restraint conditions of the specimens were shown to have an influence on bamboo tensile
test results and therefore must be considered in the development of improved standard test
methods.
Modified ISO flexural tests, as discussed in Chapter 4, were conducted to assess the
longitudinal shear strength (splitting) of bamboo resulting from flexure and to investigate
development of standard testing practices for this mixed-mode failure. Flexural specimens, tested
in four-point bending, were modified by cutting a notch having a depth equal to the culm radius,
in the tension face of the culm at or near one loading point in order to isolate the point at which
shear failure initiates. Full-culm tests produced lower shear strength values as compared to
smaller clear specimens machined from the culm wall or current standard or proposed tests for
Mode I (split-pin test) and Mode II (bowtie test) shear. This was found to be partially due to the
mixed-mode nature of the splitting failure. Mode I tangential tensile strength perpendicular to the
fibers was shown to be the main driver of longitudinal splitting and results suggested a ratio
between Mode I, Mode II, and mixed mode capacities may exist. Development of an interaction
ratio would potentially allow simple-to-conduct tests (such as the bowtie or the edge bearing
200

tests) to be used as surrogate tests for more-difficult-to-obtain values. Several drawbacks of the
notched beam test configuration highlight the need for further testing in developing a standard
test configuration for longitudinal splitting caused by flexure.
7.2 ASSESSMENT OF STRUCTURAL AND ENVIRONMENTAL PROPERTIES
As discussed in Chapter 5, understanding the behavior of multiple-culm columns offers a
pathway to building larger and perhaps multi-story bamboo structures. Experimental buckling
tests were conducted on full-scale single- and multiple-culm columns having slenderness ratios
on the order of L/r ~ 100; these were characterized with respect to the Euler equation. The
apparent effective length factor, K, for the full-height specimens was shown to be closer to 1
than to the value predicted in control tests for the end restraint considered. This was potentially
due to flexure-induced rotation causing local crushing at the culm ends as well as variability in
the cross section and initial culm out-of-straightness. Results from single culm specimens
appeared to confirm the need for initial out-of straightness and taper to be considered for the
thicker-walled Tre Gai specimens. Multiple-culm column specimens exhibited load
redistribution as weaker constituent culms began to fail and observed column behavior was best
represented by the sum of the individual culms (apparent moment of inertia Icolumn = ΣIculm) rather
than by the gross section properties (Icolumn = Ig) of the multiple-culm column. Three shorter
columns tested suggest a significant reduction in load capacity for slenderness ratios L/r < 75 as
compared to the experimentally determined crushing strength and expected Euler buckling loads.
In terms of environmental impacts associated with material use, bamboo has many
perceived qualitative benefits but only a limited number of studies have looked at quantifying the
201

relative environmental impacts of bamboo use. The intent of the midpoint life-cycle-analysis
reported in Chapter 6 was to compare the environmental performance of the structural bamboo
column from Chapter 5 with structurally comparable timber and steel alternatives. While the
results did not produce a clear sustainable option between the bamboo, timber, and steel columns
or the two scenarios studied (fabrication and use in US and Brazil), LCIA profiles did show that
transportation to the erection site and the steel bolt fastening system used contributed the most to
the environmental impacts of the bamboo column in both the US and Brazilian scenarios. When
used in a domestic context (Brazil scenario), environmental impacts of bamboo decreased in five
of nine impact categories: global warming, acidification, non-carcinogens, eutrophication, and
smog as compared to US use, where bamboo must be imported. The phenol-resorcinol-
formaldehyde resin and processing contributed the most to the environmental impacts of the
built-up box timber column alternative in both scenarios. The HSS box and HSS round sections
outperformed the timber columns and even the bamboo in some of the impact categories for both
scenarios and therefore remain potential options for use.
7.3 FUTURE WORK
The current work highlights the need for further development of standard testing methods as well
as design criteria for bamboo structural components. One of the primary limit states seen in all
the experimental studies undertaken in this work (tension, flexure, and buckling tests), and in
most other studies cited throughout this dissertation, was longitudinal splitting failures induced
by flexure. Therefore, further tests are needed to create a larger data set in order that this limit
state can be characterized properly using a refined standard test method. However, in addition to
202

specific recommendations made based on each of the experimental studies herein and reported in
each chapter, the work also points to broader future areas of research that can aid in furthering
the body of knowledge on the utilization of structural bamboo.
7.3.1 Modeling of bamboo as a functionally graded material
The bamboo tensile testing conducted illustrated the influence of culm wall fiber gradation on
the strength results of the standard test procedure. The functionally graded material (FGM)
nature of bamboo must be considered in the development of standard test procedures and design
criteria. Therefore, modeling the mechanical behavior of FGMs like bamboo is an important area
of future study, specifically, characterization and modeling of the fracture and splitting behavior
of bamboo. Fracture and fatigue modeling has been studied for wood and a summary is provided
in Smith et al. (2003). Techniques for fracture modeling of wood include statistical fracture
models (SFMs); fictitious crack models and bridging models that use Linear Elastic Fracture
Mechanics (LEFM); finite element models; morphology-based models; lattice models; and
damage models. With respect to bamboo, Silva et al. (2006) developed a finite element model of
a bamboo culm section (Fig. 7-1a). The study considered the use of a) graded finite brick
elements; b) a homogeneous orthotropic model; and c) an isotropic homogeneous model. Results
showed the homogenized orthotropic model to be the stiffest while the graded elements capture
the highest stresses at the bamboo wall exterior. Nonetheless, the isotropic homogeneous model
was found to be suitable for capturing global behavior. Sharma (2010) developed a beam
element model of a bamboo frame which was used to compare model results with results from an
experimental pushover frame test (Fig. 7-1b). However, the beam element model only
considered deterioration of the bamboo column base connections and no degradation in the
203

stiffness of the bamboo elements. Villalobos et al (2011) developed a proposed 2D SFM based
on the drying fracture process in specimens of bamboo Quadua angustifolia. Ultimately,
development of bamboo structural component models will provide a crucial tool in helping to
predict the behavior and performance of a multitude of bamboo species and bamboo structural
systems in addition to studying modification factors to future design equations. They would also
serve as a foundation for future more comprehensive models.
a) Bamboo internode finite element model by Silva et al.
(2006) b) Beam element model frame (Sharma 2010)
Figure 7-1: Modeling of structural bamboo components
7.3.2 Performance of bamboo jointing techniques
The longitudinal splitting seen in the experimental buckling capacity of bamboo columns
(chapter 5) occurred in all cases at the short-dowel end condition at the top of the column.
Ultimately, as discussed in Section 2.2.2, the development of effective jointing techniques for
bamboo structures and understanding their performance and capacity is crucial to understanding
the performance of an entire bamboo component or structural system. Sharma (2010), in the
study of the seismic performance of a representative bamboo portal frame, also states that
research on bamboo jointing, specifically force-displacement relationships of connections and
identification of limit states, is crucial for understanding the performance of bamboo building
204

systems. Furthermore, the results of the LCIA in chapter 6 of this work illustrate that the
fastening system currently considered for multiple-culm columns (galvanized steel bolts),
contributed significantly to the environmental impacts of the entire column. Therefore,
conventional (steel bolts), traditional (wrapping or binding), and non-conventional jointing
techniques for bamboo must also be assessed with respect to environmental impacts.
7.3.3 Bamboo LCI Database and Structural Design LCA Parameter
As discussed in chapter 6, the establishment of a bamboo LCI database which compiles data for
various agriculture, treatment, production, use, and disposal processes for bamboo would allow
for environmental impacts to be better determined for the multitude of bamboo species, products,
and uses. A standard database would also allow for better comparison between studies of the
environmental sustainability of using bamboo products in a variety of domestic and global
contexts. A bamboo LCI database would also eliminate many process assumptions that currently
need to be made in assessments and highlight areas requiring more research and data collection.
Further, the LCIA studied in chapter 6 highlights the need for environmental impact parameters
that can be linked to structural design properties of structural components allowing for easier
comparison of environmental impacts for building alternatives and determining sustainable
options during the structural design process.
205

7.4 SUMMARY
With the benefits of rapid renewability, global accessibility, and good strength properties,
bamboo has great potential as an alternative structural building material that can add to the
global construction resource base. The pathway to standardization is the development of standard
testing procedures that are applicable both in laboratory and field settings as well as
establishment of design criteria for dominant limit states, particularly longitudinal splitting. The
current study sought to assess standard bamboo testing methods as well as the performance of
structural bamboo components (beams and columns). Standard tensile tests as prescribed by ISO
22157 (2004b) were conducted to assess the test interferences associated with the functionally
graded nature of the bamboo culm. Resulting strength and nonlinear strain distributions showed
that behavior is affected by these variables and therefore must be considered in the standard test
procedure. Full-scale single- and multiple-culm column tests were also conducted to investigate
the experimental buckling strength with respect to the Euler equation commonly used in design.
Column tests showed that multiple-culm columns had an effective moment of inertia equal to the
sum of individual culm components and that shorter columns exhibited a reduction in strength
beyond that predicted by the Euler equation. Further tests are needed to better characterize the
strength versus slenderness curve for bamboo columns.
The study also illustrated that longitudinal splitting is a dominant limit state for bamboo
components tested in various manners and longitudinal splitting induced by flexure was seen in
both the tensile and buckling tests. Therefore, a modified ISO flexural test for full-culm bamboo
was developed and tested as a standard longitudinal splitting test prototype. The tests showed a
reduction in shear strength as compared to smaller clear bamboo specimens testing in bending or
bowtie shear tests. Similar ratios between results of the mixed mode failure seen in the full-culm
206

tests and results of the split-pin test (Mode I failure) and the bowtie test (Mode II failure) for two
different bamboo species suggest that an underlying relationship may exist that could be used in
establishing future design or material testing criteria.
A comparative midpoint life-cycle-impact-analysis (LCIA) was conducted to compare
environmental impacts associated with constructing the experimental bamboo column studied
with timber and steel alternatives of similar capacity. Results, although requiring weighting of
impacts to reach a definitive conclusion, suggest that bamboo is best used in a domestic setting
where it is readily available. Steel alternatives were also shown to be a viable alternative
(depending on impact category considered) as compared with the bamboo and timber options
considered. The need for environmental impact parameters related to structural capacity
properties and to account for structural shapes was cited. Overall the work highlights the need for
further testing and characterization of bamboo structural components to aid in furthering the
standardization and utilization of this promising non-conventional building material.
207

APPENDIX A
SUMMARY OF RESULTS FROM BAMBOO TENSION TESTS
The following appendix presents the complete strength and strain profile results from the
experimental tension test program conducted in Chapter 3.
208

Table A-1: Tension Test Strength Results
Specimen Culm Internode Quadrant Layer Area Area Peak Load
Peak Load
Peak Strength
Peak Strength
sq mm sq in kN kips MPa ksi 1 TG1 1 C1 Radial 92 0.142 7.5 1.7 82.2 11.9 2 TG1 5 C1 Radial 80 0.124 8.7 1.9 108.6 15.8 3 TG1 6 C1 Radial 73 0.114 9.7 2.2 131.8 19.1 4 TG1 7 C1 Radial 71 0.110 9.5 2.1 134.1 19.5 5 TG1 8 C1 Radial 73 0.113 8.5 1.9 116.8 16.9 6 TG1 9 C1 Radial 63 0.097 14.2 3.2 225.7 32.7 7 TG1 10 C1 Radial 64 0.099 12.3 2.8 192.0 27.8 8 TG1 11 C1 Radial 54 0.083 11.5 2.6 215.6 31.3 9 TG21 11 C1 Radial 80 0.124 7.6 1.7 95.3 13.8 10 TG21 12 C1 Radial 77 0.120 8.2 1.8 106.4 15.4 11 TG21 13 C1 Radial 78 0.120 6.7 1.5 86.3 12.5 12 TG1 1 D1 Radial 82 0.127 4.7 1.1 56.9 8.2 13 TG1 5 C2 Radial 73 0.114 7.9 1.8 107.4 15.6 14 TG1 6 C2 Radial 75 0.116 10.1 2.3 134.9 19.6 15 TG1 7 C2 Radial 69 0.106 10.2 2.3 149.1 21.6 16 TG1 8 C2 Radial 71 0.110 9.4 2.1 133.2 19.3 17 TG1 9 C2 Radial 61 0.095 9.4 2.1 152.7 22.1 18 TG1 10 C2 Radial 63 0.098 11.3 2.5 178.0 25.8 19 TG1 11 C2 Radial 56 0.087 11.0 2.5 195.5 28.4 20 TG21 11 C2 Radial 80 0.125 7.6 1.7 94.5 13.7 21 TG21 12 C2 Radial 76 0.118 6.4 1.4 84.2 12.2 22 TG21 13 C2 Radial 75 0.116 6.6 1.5 88.2 12.8 23 TG1 1 D2 Radial 83 0.129 3.6 0.8 42.9 6.2 24 TG1 1 A (North) Outer 103 0.159 12.9 2.9 125.4 18.2 25 TG1 5 A (North) Outer 113 0.175 20.8 4.7 184.5 26.8 26 TG1 6 A (North) Outer 109 0.169 22.0 4.9 202.3 29.3 27 TG1 7 A (North) Outer 107 0.166 19.7 4.4 183.8 26.7 28 TG1 8 A (North) Outer 103 0.159 15.1 3.4 147.1 21.3 29 TG1 9 A (North) Outer 93 0.144 24.6 5.5 263.9 38.3 30 TG1 10 A (North) Outer 105 0.163 23.2 5.2 219.9 31.9 31 TG1 11 A (North) Outer 111 0.172 24.5 5.5 220.7 32.0 32 TG21 11 A (North) Outer 107 0.166 20.0 4.5 186.4 27.0 33 TG21 12 A (North East) Outer 107 0.166 14.7 3.3 136.7 19.8 34 TG21 13 A (North East) Outer 94 0.145 18.1 4.1 192.8 28.0 35 TG1 1 A (North) Middle 100 0.155 6.9 1.5 68.8 10.0 36 TG1 5 A (North) Middle 110 0.170 16.3 3.7 148.9 21.6 37 TG1 6 A (North) Middle 110 0.170 18.9 4.3 172.2 25.0 38 TG1 7 A (North) Middle 102 0.158 18.7 4.2 183.0 26.5 39 TG1 8 A (North) Middle 68 0.105 10.8 2.4 159.3 23.1 40 TG1 9 A (North) Middle 91 0.141 15.5 3.5 170.7 24.8
209

Table A-1 (continued) 41 TG21 11 A (North) Middle 107 0.165 9.2 2.1 86.4 12.5 42 TG21 12 A (North East) Middle 105 0.163 11.7 2.6 111.0 16.1 43 TG21 13 A (North East) Middle 68 0.105 5.9 1.3 87.6 12.7 44 TG1 1 A (North) Inner 86 0.134 2.5 0.6 29.3 4.3 45 TG1 5 A (North) Inner 86 0.134 8.9 2.0 103.2 15.0 46 TG1 6 A (North) Inner 81 0.125 9.7 2.2 120.4 17.5 47 TG1 7 A (North) Inner 72 0.112 8.0 1.8 111.3 16.1 48 TG1 8 A (North) Inner 110 0.171 12.6 2.9 114.1 16.8 49 TG1 9 A (North) Inner 68 0.105 9.1 2.0 133.4 19.3 50 TG1 10 A (North) Inner 116 0.179 17.5 3.9 150.8 21.9 51 TG1 11 A (North) Inner 103 0.159 15.4 3.5 150.0 21.8 52 TG21 11 A (North) Inner 88 0.137 3.6 0.8 40.8 5.9 53 TG21 12 A (North East) Inner 100 0.155 5.3 1.2 53.1 7.7 54 TG21 13 A (North East) Inner 90 0.140 3.7 0.8 41.6 6.0 55 TG1 5 B (South) Outer 110 0.170 22.8 5.1 208.4 30.2 56 TG1 6 B (South) Outer 101 0.156 17.0 3.8 169.1 24.5 57 TG1 7 B (South) Outer 107 0.166 17.2 3.9 160.3 23.3 58 TG1 8 B (South) Outer 106 0.165 18.0 4.1 169.3 24.6 59 TG1 9 B (South) Outer 105 0.163 15.7 3.5 149.7 21.7 60 TG1 10 B (South) Outer 107 0.166 18.1 4.1 168.9 24.5 61 TG1 11 B (South) Outer 91 0.141 14.2 3.2 156.0 22.6 62 TG21 11 B (South) Outer 105 0.163 13.8 3.1 131.6 19.1 63 TG21 12 B (South) Outer 111 0.172 23.7 5.3 213.4 30.9 64 TG21 13 B (South) Outer 110 0.171 22.2 5.0 201.1 29.2 65 TG1 5 B (South) Middle 104 0.162 17.6 4.0 169.0 24.5 66 TG1 6 B (South) Middle 94 0.146 16.8 3.8 178.3 25.9 67 TG1 7 B (South) Middle 79 0.122 12.0 2.7 152.4 22.1 68 TG1 8 B (South) Middle 105 0.163 12.8 2.9 121.9 17.7 69 TG1 9 B (South) Middle 65 0.100 8.7 2.0 134.3 19.5 70 TG1 11 B (South) Middle 50 0.077 6.1 1.4 123.0 17.8 71 TG21 11 B (South) Middle 77 0.119 5.8 1.3 75.3 10.9 72 TG21 12 B (South) Middle 97 0.150 11.9 2.7 122.7 17.8 73 TG1 5 B (South) Inner 93 0.144 10.7 2.4 115.0 16.7 74 TG1 6 B (South) Inner 91 0.142 11.9 2.7 130.3 18.9 75 TG1 7 B (South) Inner 87 0.135 7.1 1.6 81.6 11.8 76 TG1 8 B (South) Inner 63 0.098 6.5 1.5 103.3 15.0 77 TG1 9 B (South) Inner 84 0.130 6.5 1.5 76.9 11.2 78 TG1 10 B (South) Inner 126 0.196 18.1 4.1 143.5 20.8 79 TG1 11 B (South) Inner 78 0.122 8.6 1.9 109.7 15.9 80 TG21 11 B (South) Inner 89 0.138 3.7 0.8 41.2 6.0 81 TG21 12 B (South) Inner 76 0.117 5.0 1.1 65.6 9.5 82 TG21 13 B (South) Inner 132 0.204 10.0 2.2 75.9 11.0
210

Figure A-1: Specimen TG1-1 (Free): Inner (Upper Left), Middle (Upper Right), Outer (Lower Left), & Radial (Lower Right)
-4000
-3000
-2000
-1000
0
1000
2000
3000
4000
5000
Stra
in e
yy(m
s)
Location Along Specimen (mm)Interior Face Exterior Face
Max Load 29.3 MPaNo Strain Gages25 MPa
20 MPa
29 MPa0
1000
2000
3000
4000
5000
6000
7000
Stra
in e
yy(m
s)
Location Along Specimen (mm)Interior Face Exterior Face
Max Strength 68.8 MPaNo Strain Gages
55 MPa
35 MPa
17 MPa
0
1000
2000
3000
4000
5000
6000
7000
8000
9000
Stra
in e
yy(m
s)
Location Along Specimen (mm)Interior Face Exterior Face
Max Strength 125 MPaNo Strain Gages
20 MPa
110 MPa
90 MPa
125 MPa
-3000-2000-1000
0100020003000400050006000700080009000
Stra
in e
yy(m
s)
Location Along Specimen (mm)Interior Exterior Face
Max Strength 82.2 MPaNo Strain Gages
10 MPa
60 MPa
82 MPa
211

Figure A-2: Specimen TG1-1 (Free): 2nd Radial
0
1000
2000
3000
4000
5000
6000
7000
8000
Stra
in e
yy(m
s)Location Along Specimen (mm)
Interior Face Exterior Face
10 MPa
30 MPa
58 MPa
212

Figure A-3: Specimen TG1-5 (Free): Inner (Upper Left), Middle (Upper Right), Outer (Lower Left), & Radial (Lower Right)
0
2000
4000
6000
8000
10000
12000
14000
Stra
in e
yy(m
s)
Location Along Specimen (mm)Interior Face Exterior Face
10 MPa
50 MPa
103 MPa
0
2000
4000
6000
8000
10000
12000
14000
Stra
in e
yy(m
s)
Location Along Specimen (mm)Interior Face Exterior Face
20 MPa
50 MPa
100 MPa
150 MPa
0
2000
4000
6000
8000
10000
12000
Stra
in e
yy(m
s)
Location Along Specimen (mm)Interior Face Exterior Face
41 MPa
70 MPa
100 MPa
130 MPa
186 MPa
0
2000
4000
6000
8000
10000
12000
Stra
in e
yy(m
s)
Location Along Specimen (mm)Interior Face Exterior Face
20 MPa
50 MPa
80 MPa
108 MPa
213

Figure A-4: Specimen TG1-5 (Fixed): Inner (Upper Left), Middle (Upper Right), Outer (Lower Left), & Radial (Lower Right)
0100020003000400050006000700080009000
10000
Stra
in e
yy(m
s)
Location Along Specimen (mm)Interior Face Exterior Face
No Strain Gages
30 MPa
50 MPa
70 MPa
98 MPa
0100020003000400050006000700080009000
10000
Stra
in e
yy(m
s)
Location Along Specimen (mm)Interior Face Exterior Face
No Strain Gages
40 MPa
100 MPa
60 MPa
169 MPa
TG1-5-BONo Outer Specimen Data
0100020003000400050006000700080009000
1000011000
Stra
in e
yy(m
s)
Location Along Specimen (mm)Interior Face Exterior Face
No Strain Gages
20 MPa
70 MPa
50 MPa
109 MPa
214

Figure A-5: Specimen TG1-6 (Free): Inner (Upper Left), Middle (Upper Right), Outer (Lower Left), & Radial (Lower Right)
02000400060008000
100001200014000160001800020000
Stra
in e
yy(m
s)
Location Along Specimen (mm)Interior Face Exterior Face
120 MPa
50 MPa70 MPa
100 MPa
30 MPa
-2000
0
2000
4000
6000
8000
10000
12000
14000
Stra
in e
yy(m
s)
Location Along Specimen (mm)Interior Face Exterior Face
100 MPa
50 MPa
173 MPa
150 MPa
-2000
0
2000
4000
6000
8000
10000
12000
14000
16000
Stra
in e
yy(m
s)
Location Along Specimen (mm)Interior Face Exterior Face
30 MPa
100 MPa
203 MPa
150 MPa
50 MPa0
2000
4000
6000
8000
10000
12000
14000
Stra
in e
yy(m
s)
Location Along Specimen (mm)Exterior FaceInterior Face
100 MPa
132 MPa
20 MPa
50 MPa
215

Figure A-6: Specimen TG1-6 (Fixed): Inner (Upper Left), Middle (Upper Right), Outer (Lower Left), & Radial (Lower Right)
0100020003000400050006000700080009000
10000
Stra
in e
yy (m
s)
Location Along Specimen (mm)
Max Strength 131.6 MPa; No Strain Gages
Interior Face Exterior Face
40 MPa
100 MPa
80 MPa
120 MPa
0
1000
2000
3000
Stra
in e
yy(m
s)
Location Along Specimen (mm)
Loss of Contour aft. 60.4 MPaMax Load 178.7 MPaNo Strain Gages
Interior Face Exterior Face
60 MPa
50 MPa
40 MPa
0100020003000400050006000700080009000
100001100012000
Stra
in e
yy(m
s)
Location Along Specimen (mm)
Full loss of contour after 130.8 MPaMax Load 169.7 MPaNo Strain Gages
Interior Face Exterior Face
50 MPa
70 MPa100 MPa
131 MPa
0100020003000400050006000700080009000
100001100012000
Stra
in e
yy(m
s)
Location Along Specimen (mm)Interior Face Exterior Face
Partial Loss of Contour after 80.0 MPa
135 MPa
70 MPa
100 MPa
50 MPa
20 MPa
216

Figure A-7: Specimen TG1-7 (Free): Inner (Upper Left), Middle (Upper Right), Outer (Lower Left), & Radial (Lower Right)
0
2000
4000
6000
8000
10000
12000
Stra
in e
yy(m
s)
Location Along Specimen (mm)Interior Face Exterior Face
10 MPa
50 MPa
112 MPa
100 MPa
0
2000
4000
6000
8000
10000
12000
Stra
in e
yy(m
s)
Location Along Specimen (mm)Interior Face Exterior Face
21 MPa
100 MPa
49 MPa
170 MPa184 MPa
0
2000
4000
6000
8000
10000
Stra
in e
yy(m
s)
Location Along Specimen (mm)Interior Face Exterior Face
30 MPa
100 MPa
50 MPa
150 MPa
185 MPa
0
2000
4000
6000
8000
10000
12000
14000
Stra
in e
yy (m
s)
Location Along Specimen (mm)
135 MPa
Interior Face Exterior Face
100 MPa
70 MPa49 MPa
10 MPa
217

Figure A-8: Specimen TG1-7 (Fixed): Inner (Upper Left), Middle (Upper Right), Outer (Lower Left), & Radial (Lower Right)
0
1000
2000
3000
4000
5000
6000
7000
8000
9000
Stra
in e
yy(m
s)
Location Along Specimen (mm)Interior Face Exterior Face
31 MPa
50 MPa
82 MPa
0100020003000400050006000700080009000
10000110001200013000
Stra
in e
yy(m
s)
Location Along Specimen (mm)Interior Face Exterior Face
40 MPa
100 MPa
50 MPa
140 MPa
153 MPa
0100020003000400050006000700080009000
10000
Stra
in e
yy(m
s)
Location Along Specimen (mm)Interior Face Exterior Face
40 MPa
100 MPa
50 MPa
150 MPa
160 MPa
0100020003000400050006000700080009000
10000
Stra
in e
yy(m
s)
Location Along Specimen (mm)Interior Face Exterior Face
10 MPa
100 MPa
50 MPa
150 MPa
218

Figure A-9: Specimen TG1-8 (Free): Inner (Upper Left), Middle (Upper Right), Outer (Lower Left), & Radial (Lower Right)
0100020003000400050006000700080009000
10000110001200013000
Stra
in e
yy(m
s)
Location Along Specimen (mm)Interior Face Exterior Face
10 MPa
116 MPa
100 MPa
50 MPa
0100020003000400050006000700080009000
10000110001200013000
Stra
in e
yy(m
s)
Location Along Specimen (mm)Interior Face Exterior Face
159 MPa
100 MPa
130 MPa
150 MPa
50 MPa40 MPa
0
1000
2000
3000
4000
5000
6000
7000
8000
9000
Stra
in e
yy(m
s)
Location Along Specimen (mm)Interior Face Exterior Face
30 MPa
91 MPa
50 MPa
147 MPa
0
1000
2000
3000
4000
5000
6000
7000
8000
9000
Stra
in e
yy(m
s)
Location Along Specimen (mm)
20 MPa
Max Load 117.7 MPa
Interior Face Exterior Face
100 MPa
50 MPa
219

Figure A-10: Specimen TG1-8 (Fixed): Inner (Upper Left), Middle (Upper Right), Outer (Lower Left), & Radial (Lower Right)
0100020003000400050006000700080009000
10000110001200013000
Stra
in e
yy (m
s)
Location Along Specimen (mm)
Max Load 102.9 MPaLoss of Contour aft. 64.0 MPaNo Strain Gages
Interior Face Exterior Face
50 MPa60 MPa
70 MPa
64 MPa
0
1000
2000
3000
Stra
in e
yy(m
s)
Location Along Specimen (mm)
Max Load 122.1 MPaPartial Loss of Contour aft. 48.0 MPaNo Strain Gages
Interior Face Exterior Face
29 MPa
48 MPa
40 MPa
0
1000
2000
3000
4000
5000
6000
7000
8000
Stra
in e
yy(m
s)
Location Along Specimen (mm)Interior Face Exterior Face
No Strain Gages170 MPa
100 MPa
150 MPa
60 MPa0
1000
2000
3000
4000
Stra
in e
yy(m
s)
Location Along Specimen (mm)
40 MPa
49 MPa
Interior Face Exterior Face
No Strain GagesLoss of Contour after 52.3 MPaMax Load at 60.1 MPa
52 MPa (aft. 60.1 Peak)
60 MPa
220

Figure A-11: Specimen TG1-9 (Free): Inner (Upper Left), Middle (Upper Right), Outer (Lower Left), & Radial (Lower Right)
0
2000
4000
6000
8000
10000
12000
Stra
in e
yy(m
s)
Location Along Specimen (mm)Interior Face Exterior Face
Max Strength 133.4 MPaNo Strain Gages
100 MPa
50 MPa
20 MPa
120 MPa
0
2000
4000
6000
8000
10000
12000
Stra
in e
yy(m
s)
Location Along Specimen (mm)Interior Face Exterior Face
Max Load 170.7 MPaNo Strain Gages
30 MPa
80 MPa
70 MPa
50 MPa
0
2000
4000
6000
8000
10000
12000
14000
Stra
in e
yy(m
s)
Location Along Specimen (mm)Interior Face Exterior Face
No Strain Gages
20 MPa
100 MPa
264 MPa
200 MPa
0
2000
4000
6000
8000
10000
12000
14000
16000
Stra
in e
yy(m
s)
Location Along Specimen (mm)Interior Face Exterior Face
Max Load: 225.7 MPaNo Strain Gages
20 MPa
60 MPa
160 MPa
200 MPa
221

Figure A-12: Specimen TG1-9 (Fixed): Inner (Upper Left), Middle (Upper Right), Outer (Lower Left), & Radial (Lower Right)
0
1000
2000
3000
4000
5000
6000
7000
Stra
in e
yy(m
s)
Location Along Specimen (mm)
77 MPa
Interior Face Exterior Face
No Strain Gages
50 MPa
29 MPa0
100020003000400050006000700080009000
1000011000
Stra
in e
yy(m
s)
Location Along Specimen (mm)Interior Face Exterior Face
No Strain Gages
152 MPa
100 MPa
50 MPa
0
1000
2000
3000
4000
5000
6000
7000
8000
Stra
in e
yy(m
s)
Location Along Specimen (mm)Interior Face Exterior Face
No Strain Gages
150 MPa
50 MPa
100 MPa
0100020003000400050006000700080009000
10000
Stra
in e
yy(m
s)
Location Along Specimen (mm)Interior Face Exterior Face
No Strain Gages
30 MPa
50 MPa
100 MPa
153 MPa
222

Figure A-13: Specimen TG1-10 (Free): Inner (Upper Left), Middle (Upper Right), Outer (Lower Left), & Radial (Lower Right)
0
2000
4000
6000
8000
10000
12000
14000
Stra
in e
yy(m
s)
Location Along Specimen (mm)Interior Face Exterior Face
50 MPa
20 MPa
Max Load: 151.4 MPa
100 MPa
140 MPa
No Middle Specimenfor TG1-10 (Free)
0
2000
4000
6000
8000
10000
Stra
in e
yy(m
s)
Location Along Specimen (mm)Interior Face Exterior Face
49 MPa
Max Strength: 221.7 MPa
170 MPa
100 MPa
210 MPa
0
2000
4000
6000
8000
10000
12000
14000
16000
Stra
in e
yy(m
s)
Location Along Specimen (mm)
29 MPa
Interior Face Exterior Face
No Strain Gages
61 MPa
140 MPa
193 MPa
223

Figure A-14: Specimen TG1-10 (Fixed): Inner (Upper Left), Middle (Upper Right), Outer (Lower Left), & Radial (Lower Right)
0100020003000400050006000700080009000
1000011000
Stra
in e
yy(m
s)
Location Along Specimen (mm)Interior Face Exterior Face
No Strain Gages
20 MPa
50 MPa
100 MPa
144 MPa
No Middle Specimen for TG1-10 (Fixed)
-1000
0
1000
2000
3000
4000
5000
6000
7000
Stra
in e
yy(m
s)
Location Along Specimen (mm)Interior Face Exterior Face
140 MPa
Loss of Contour aft. 140.2 MPaMax Load 169.2 MPa
40 MPa50 MPa
100 MPa
0100020003000400050006000700080009000
10000110001200013000
Stra
in e
yy(m
s)
Location Along Specimen (mm)
29 MPa
Interior Face Exterior Face
Partial Loss of Contour after110.1 MPa; MaxLoad 178.8 MPa
170 MPa
120 MPa
100 MPa
60 MPa
224

Figure A-15: Specimen TG1-11 (Free): Inner (Upper Left), Middle (Upper Right), Outer (Lower Left), & Radial (Lower Right)
0
1000
2000
3000
4000
5000
6000
7000
8000
Stra
in e
yy(m
s)
Location Along Specimen (mm)Interior Face Exterior Face
20 MPa
Max Strength: 150.5 MPa
100 MPa
40 MPa
30 MPa
No Middle Specimen for TG1-11 (Free)
0
1000
2000
3000
4000
Stra
in e
yy(m
s)
Location Along Specimen (mm)Interior Face Exterior Face
100 MPa
Max Load: 222.4 MPaLoss of Contour aft. 100.0 MPa
41 MPa
50 MPa
-10000
100020003000400050006000700080009000
1000011000120001300014000
Stra
in e
yy(m
s)
Location Along Specimen (mm)
41 MPa
Interior Face Exterior Face
One strain gage at midspan
100 MPa
150 MPa
190 MPa
217 MPa
225

Figure A-16: Specimen TG1-11 (Fixed): Inner (Upper Left), Middle (Upper Right), Outer (Lower Left), & Radial (Lower Right)
0
1000
2000
3000
Stra
in e
yy(m
s)
Location Along Specimen (mm)
Loss of contour at 65.7 MPaMax Load 109.4 MPa
Interior Face Exterior Face
40 MPa
60 MPa
50 MPa
-1000
0
1000
2000
3000
4000
5000
6000
7000
8000
9000
Stra
in e
yy(m
s)
Location Along Specimen (mm)
Break occurred after 120.7 MPa but before max load of 123.5 MPa
Interior Face Exterior Face
124 MPa
100 MPa
50 MPa
0100020003000400050006000700080009000
10000
Stra
in e
yy(m
s)
Location Along Specimen (mm)
Loss of contour after 141.0 MPaMax Load 156.4 MPa
Interior Face Exterior Face
30 MPa
130 MPa
100 MPa
50 MPa
0100020003000400050006000700080009000
100001100012000
Stra
in e
yy(m
s)
Location Along Specimen (mm)Exterior FaceInterior Face
No Strain Gages
196 MPa
50 MPa
100 MPa
149 MPa
30 MPa
226

Figure A-17: Specimen TG21-11 (Free): Inner (Upper Left), Middle (Upper Right), Outer (Lower Left), & Radial (Lower Right)
0
1000
2000
3000
4000
5000
6000
7000
8000
Stra
in e
yy(m
s)
Location Along Specimen (mm)Interior Face Exterior Face
10 MPa
20 MPa
43 MPa40 MPa
30 MPa
0100020003000400050006000700080009000
10000110001200013000
Stra
in e
yy(m
s)
Location Along Specimen (mm)Interior Face Exterior Face
87 MPa
50 MPa
20 MPa
0100020003000400050006000700080009000
1000011000
Stra
in e
yy(m
s)
Location Along Specimen (mm)Interior Face Exterior Face
40 MPa
100 MPa
188 MPa
140 MPa
51 MPa
0100020003000400050006000700080009000
1000011000120001300014000
Stra
in e
yy(m
s)
Location Along Specimen (mm)
94 MPa
Interior Face Exterior Face
10 MPa
49 MPa
227

Figure A-18: Specimen TG21-11 (Fixed): Inner (Upper Left), Middle (Upper Right), Outer (Lower Left), & Radial (Lower Right)
0
1000
2000
3000
4000
5000
6000
7000
Stra
in e
yy(m
s)
Location Along Specimen (mm)Interior Face Exterior Face
44 MPa
20 MPa
30 MPa
40 MPa
0100020003000400050006000700080009000
10000110001200013000
Stra
in e
yy(m
s)
Location Along Specimen (mm)Interior Face Exterior Face
78 MPa
50 MPa
30 MPa
0100020003000400050006000700080009000
1000011000120001300014000
Stra
in e
yy(m
s)
Location Along Specimen (mm)Interior Face Exterior Face
19 MPa
61 MPa
100 MPa
130 MPa 132 MPa
0100020003000400050006000700080009000
1000011000
Stra
in e
yy(m
s)
Location Along Specimen (mm)
95 MPa
Interior Face Exterior Face
Partial Loss of Contour after 65.2 MPa
30 MPa
60 MPa
228

Figure A-19: Specimen TG21-12 (Free): Inner (Upper Left), Middle (Upper Right), Outer (Lower Left), & Radial (Lower Right)
0
1000
2000
3000
4000
5000
6000
7000
Stra
in e
yy(m
s)
Location Along Specimen (mm)Interior Face Exterior Face
50 MPa55 MPa
30 MPa
40 MPa
0100020003000400050006000700080009000
1000011000
Stra
in e
yy(m
s)
Location Along Specimen (mm)Interior Face Exterior Face
20 MPa
50 MPa
111 MPa
100 MPa
0
1000
2000
3000
4000
5000
6000
7000
8000
Stra
in e
yy(m
s)
Location Along Specimen (mm)Interior Face Exterior Face
29 MPa
50 MPa
100 MPa
80 MPa
137 MPa
0100020003000400050006000700080009000
10000
Stra
in e
yy(m
s)
Location Along Specimen (mm)Interior Face Exterior Face
Max Strength: 106.9 MPa Loss of Contour aft. 104.8 MPa
30 MPa
105 MPa
50 MPa
100 MPa
229

Figure A-20: Specimen TG21-12 (Fixed): Inner (Upper Left), Middle (Upper Right), Outer (Lower Left), & Radial (Lower Right)
0
2000
4000
6000
8000
10000
12000
Stra
in e
yy(m
s)
Location Along Specimen (mm)Interior Face Exterior Face
30 MPa
40 MPa
50 MPa
60 MPa
68 MPa
0
2000
4000
6000
8000
10000
12000
14000
16000
Stra
in e
yy(m
s)
Location Along Specimen (mm)Interior Face Exterior Face
29 MPa
120 MPa
90 MPa
215 MPa
-2000
0
2000
4000
6000
8000
10000
Stra
in e
yy(m
s)
Location Along Specimen (mm)Interior Face Exterior Face
80 MPa
84 MPa
40 MPa
50 MPa
No Strain Gages
230

Figure A-21: Specimen TG21-13 (Free): Inner (Upper Left), Middle (Upper Right), Outer (Lower Left), & Radial Manual Values (Lower Right)
-1000
0
1000
2000
3000
4000
5000
6000
7000
Stra
in e
yy(m
s)
Location Along Specimen (mm)Interior Face Exterior Face
30 MPa
20 MPa
44 MPa
40 MPa
0100020003000400050006000700080009000
10000
Stra
in e
yy(m
s)
Location Along Specimen (mm)Interior Face Exterior Face
21 MPa
80 MPa
50 MPa
0100020003000400050006000700080009000
10000110001200013000140001500016000
Stra
in e
yy(m
s)
Location Along Specimen (mm)Interior Face Exterior Face
193 MPa
100 MPa
20 MPa
150 MPa
0
1000
2000
3000
4000
5000
6000
7000
8000
Stra
in e
yy(m
s)
Location Along Specimen (mm)
16 MPa
Interior Face Exterior Face
71 MPa
64 MPa
53 MPa
42 MPa
30 MPa
231
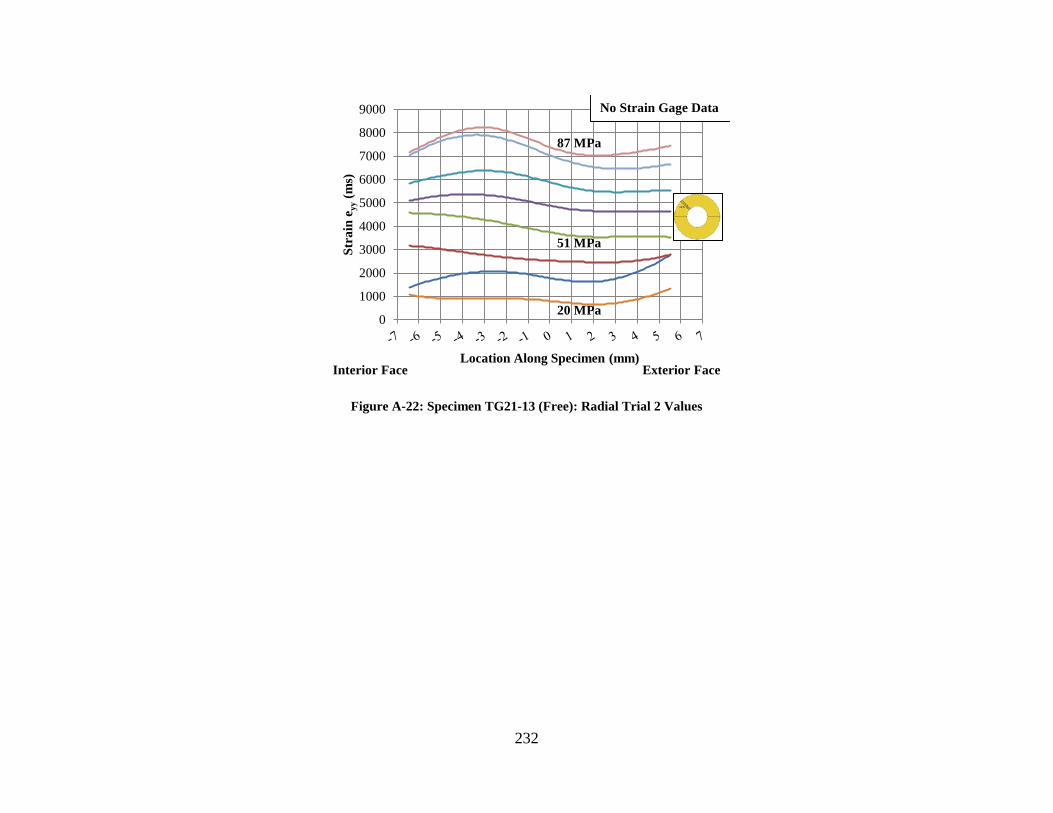
Figure A-22: Specimen TG21-13 (Free): Radial Trial 2 Values
0
1000
2000
3000
4000
5000
6000
7000
8000
9000
Stra
in e
yy(m
s)Location Along Specimen (mm)
87 MPa
Interior Face Exterior Face
No Strain Gage Data
51 MPa
20 MPa
232

Figure A-23: Specimen TG21-13 (Fixed): Inner (Upper Left), Middle (Upper Right), Outer (Lower Left), & Radial (Lower Right)
0100020003000400050006000700080009000
100001100012000
Stra
in e
yy(m
s)
Location Along Specimen (mm)Interior Face Exterior Face
50 MPa
70 MPa
75 MPa
10 MPa
No Middle Specimenfor TG21-13 (Fixed)
0100020003000400050006000700080009000
100001100012000130001400015000160001700018000
Stra
in e
yy(m
s)
Location Along Specimen (mm)Interior Face Exterior Face
41 MPa
100 MPa
203 MPa
150 MPa
-1000
0
1000
2000
3000
4000
5000
6000
7000
8000
Stra
in e
yy(m
s)
Location Along Specimen (mm)Interior Face Exterior Face
89 MPaNo Strain Gages for Specimen
30 MPa
50 MPa
80 MPa
233
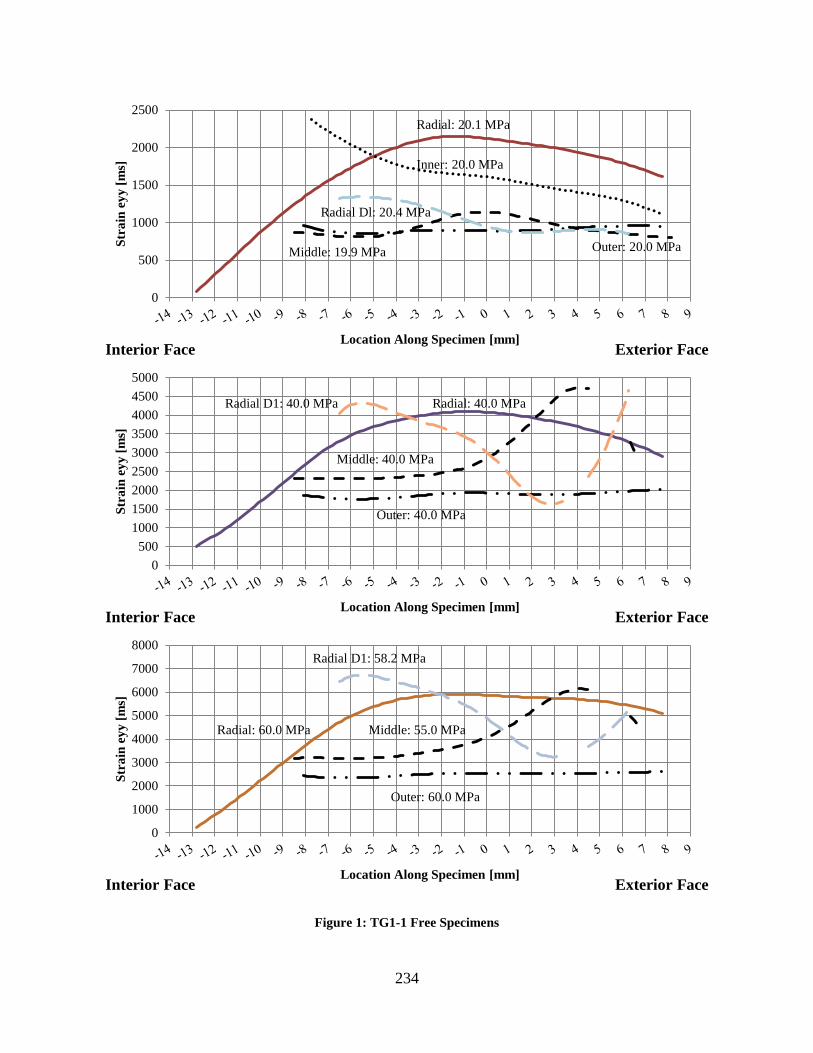
Figure 1: TG1-1 Free Specimens
0
500
1000
1500
2000
2500St
rain
eyy
[ms]
Location Along Specimen [mm]Interior Face Exterior Face
Radial: 20.1 MPa
Middle: 19.9 MPa
Radial Dl: 20.4 MPa
Outer: 20.0 MPa
Inner: 20.0 MPa
0500
100015002000250030003500400045005000
Stra
in e
yy [m
s]
Location Along Specimen [mm]Interior Face Exterior Face
Radial: 40.0 MPa
Middle: 40.0 MPa
Outer: 40.0 MPa
Radial D1: 40.0 MPa
0
1000
2000
3000
4000
5000
6000
7000
8000
Stra
in e
yy [m
s]
Location Along Specimen [mm]Interior Face Exterior Face
Radial: 60.0 MPa Middle: 55.0 MPa
Radial D1: 58.2 MPa
Outer: 60.0 MPa
234

Figure A-24: TG1-5 Free Specimens
2586 2425
0500
1000150020002500300035004000450050005500
Stra
in e
yy(m
s)
Location Along Specimen (mm)Interior Face Exterior Face
Radial: 39.7 MPa
Outer: 39.7 MPa
Middle: 39.7 MPa
Inner: 39.7 MPa
5760
4679
25003000350040004500500055006000650070007500800085009000
Stra
in e
yy(m
s)
Location Along Specimen (mm)Interior Face Exterior Face
Radial 69.8 MPa
Inner 70.0 MPa
Outer: 70.2 MPa
Middle: 70.2 MPa
8954
7094
9668
7759
400045005000550060006500700075008000850090009500
10000105001100011500
Stra
in e
yy(m
s)
Location Along Specimen (mm)Interior Face Exterior Face
Radial: 99.9 MPa
Radial (Peak): 107.8 MPa
Middle: 99.9 MPa
Outer: 99.8 MPa
Inner: 99.9 MPa
235

Figure A-25: TG1-5 Fixed Specimens
500
1500
2500
3500St
rain
eyy
(ms)
Location Along Specimen (mm)Interior Face Exterior Face
Radial: 39.9 MPaNo Strain GagesNo Strain Data for Outer Layer
Middle: 39.9 MPa
Inner: 39.7 MPa
0
1000
2000
3000
4000
5000
6000
Stra
in e
yy [m
s]
Location Along Specimen [mm]Interior Face Exterior Face
Radial: 60.0 MPa
No Strain GagesNo Strain Data for Outer Layer
Middle: 60.0 MPa
Inner: 60.0 MPa
0100020003000400050006000700080009000
10000
Stra
in e
yy(m
s)
Location Along Specimen (mm)Interior Face Exterior Face
Radial: 89.4 MPa
Outer: 89.4 MPa
Inner: 89.4 MPa
No Strain GagesNo Strain Data for Outer Layer
236

Figure A-26: TG1-6 Free Specimens
3739
3994
-2000
-1000
0
1000
2000
3000
4000
5000
6000
7000St
rain
(eyy
)
Location Along SpecimenExterior FaceInterior Face
Radial: 50.3 MPa
Outer: 50.1 MPa
Middle: 50.1 MPa
Inner: 50.4 MPa
Partial Loss of Contour in Outer Layer
5618 5960
-2000
-1000
0
1000
2000
3000
4000
5000
6000
7000
Stra
in (e
yy)
Location Along SpecimenExterior Face
Radial: 69.7 MPa
Interior Face
Outer: 70.2 MPa
Middle: 70.3 MPa
Inner: 69.8 MPa
8311 8179
100020003000400050006000700080009000
100001100012000130001400015000
Stra
in (e
yy)
Location Along SpecimenExterior FaceInterior Face
Radial: 100.0 MPa
Outer: 99.7 MPa
Middle: 100.0 MPa
Inner: 99.8 MPa
237

Figure A-27: TG1-6 Fixed Specimens
3845 3861
0.0500.0
1000.01500.02000.02500.03000.03500.04000.04500.0
Stra
in e
yy [m
s]
Location Along Specimen [mm]Interior Face Exterior Face
Radial: 50.4 MPa
Middle: 49.8 MPa
Inner: 50.0 MPa
Outer: 49.5 MPa
5631 5591
1500200025003000350040004500500055006000
Stra
in e
yy [m
s]
Location Along Specimen [mm]Interior Face Exterior Face
Partial Loss of Contour (Radial and Outer Specimen)
and Full Loss (Middle Specimen)
Radial: 70.4 MPa
Outer: 70.4 MPa
Inner: 70.1 MPa
85947962
0100020003000400050006000700080009000
10000
Stra
in e
yy [m
s]
Location Along Specimen [mm]Interior Face Exterior Face
Radial: 99.9 MPa
Outer: 100.0 MPa
Inner: 99.9 MPa
Partial Loss of Contour (Radial and Outer Specimen)
and Full Loss (Middle Specimen)
238

Figure A-28: TG1-7 Free Specimens
2898 2992
500
1000
1500
2000
2500
3000
3500
4000
4500St
rain
eyy
[ms]
Location Along Specimen [mm]Interior Face Exterior Face
Radial: 49.4 MPa
Outer: 49.4 MPa
Middle: 49.4 MPa
Inner: 50.0 MPa
4366 4347
1000
2000
3000
4000
5000
6000
7000
Stra
in e
yy [m
s]
Location Along Specimen [mm]Interior Face Exterior Face
Radial: 70.2 MPa
Outer: 69.8 MPa
Middle: 69.8 MPa
Inner: 70.0 MPa
69056220
0100020003000400050006000700080009000
10000
Stra
in e
yy [m
s]
Location Along Specimen [mm]Interior Face Exterior Face
Radial: 99.9 MPa
Outer: 100.2 MPa
Middle: 100.1 MPa
Inner: 100.0 MPa
239

Figure A-29: TG1-7 Fixed Specimens
2804 2808
500
1000
1500
2000
2500
3000
3500
4000
4500St
rain
(eyy
)
Location Along SpecimenInterior Face Exterior Face
Radial: 49.7 MPa
Outer: 50.2 MPa
Middle: 49.8 MPa
Inner: 49.5 MPa
4140 4076
1000
2000
3000
4000
5000
6000
7000
8000
Stra
in (e
yy)
Location Along SpecimenInterior Face Exterior Face
Radial: 69.5 MPa
Outer: 70.1 MPa
Middle: 69.7 MPa
Inner: 70.2 MPa
62105862
2500
3000
3500
4000
4500
5000
5500
6000
6500
Stra
in (e
yy)
Location Along SpecimenInterior Face Exterior Face
Radial: 99.9 MPa
Middle: 100.1 MPa
Outer: 100.0 MPa
Inner Specimen Failed at 81.7 MPa
240

Figure A-30: TG 1-8 Free Specimens
2542 2325
0
1000
2000
3000
4000
5000
6000St
rain
eyy
[ms]
Location Along Specimen [mm]Interior Face Exterior Face
Radial: 49.9 MPa
Middle: 50.2 MPa
Outer: 50.2MPa
Inner: 50.0 MPa
4088
3667
1000
2000
3000
4000
5000
6000
7000
8000
Stra
in e
yy [m
s]
Location Along Specimen [mm]Interior Face Exterior Face
Radial: 70.4 MPa
Outer: 70.0 MPa
Middle: 70.0 MPa
Inner: 69.8 MPa
6749
4966
3000
4000
5000
6000
7000
8000
9000
10000
11000
Stra
in e
yy [m
s]
Location Along Specimen [mm]Interior Face Exterior Face
Radial: 100.1 MPaOuter: 99.7 MPa
Middle: 100.4 MPa
Inner: 100.0 MPa
241

Figure A-31: TG1-8 Fixed Specimen
0
200
400
600
800
1000
1200
1400
1600St
rain
eyy
[ms]
Location Along Specimen [mm]
Radial: 39.7 MPa
Interior Face Exterior Face
Radial SpecimenNo Strain GagesLoss of Contour after 52.3 MPaMax Load at 60.1 MPa
Middle: 39.7 MPa
0
500
1000
1500
2000
2500
Stra
in e
yy [m
s]
Location Along Specimen [mm]
Radial: 49.1 MPa
Interior Face Exterior Face
Inner: 50.3 MPa
Middle: 48.0 MPa
-500
0
500
1000
1500
2000
2500
Stra
in e
yy [m
s]
Location Along Specimen [mm]Interior Face Exterior Face
Radial: 60.1 MPa
Outer: 59.7 MPa
Inner: 59.7 MPa
242

Figure A-32: TG1-9 Free Specimens
1500
2000
2500
3000
3500
4000
4500
5000St
rain
eyy
[ms]
Location Along Specimen [mm]Interior Face Exterior Face
Radial Specimen No Strain GagesMax Load: 225.7 MPa
Radial: 49.9 MPa
Outer: 50.1MPa
Inner: 50.0 MPa
Medium 50.1 MPa
200025003000350040004500500055006000650070007500800085009000
Stra
in e
yy [m
s]
Location Along Specimen [mm]Interior Face Exterior Face
Radial: 69.9 MPaInner: 70.0 MPa
Outer: 70.0 MPa
Middle: 70.0 MPa
3000350040004500500055006000650070007500800085009000
Stra
in e
yy [m
s]
Location Along Specimen [mm]Interior Face Exterior Face
Radial: 100.0 MPa
Outer: 99.7 MPa
Inner:100.0 MPa
243

Figure A-33: TG1-9 Fixed Specimens
0
500
1000
1500
2000
2500
3000St
rain
eyy
[ms]
Location Along Specimen [mm]Interior Face Exterior Face
No Strain Gages
Radial: 49.9 MPa
Outer: 49.9 MPa
Middle: 50.1 MPa
Inner: 50.0 MPa
3000
3500
4000
4500
5000
5500
6000
Stra
in e
yy [m
s]
Location Along Specimen [mm]Interior Face Exterior Face
Radial: 99.7 MPa
Middle: 100.0 MPa
Outer: 99.6 MPa
5000
5500
6000
6500
7000
7500
8000
Stra
in e
yy [m
s]
Location Along Specimen [mm]Interior Face Exterior Face
Radial: 129.7 MPa
Middle: 129.6 MPa
Outer: 130.5 MPa
244
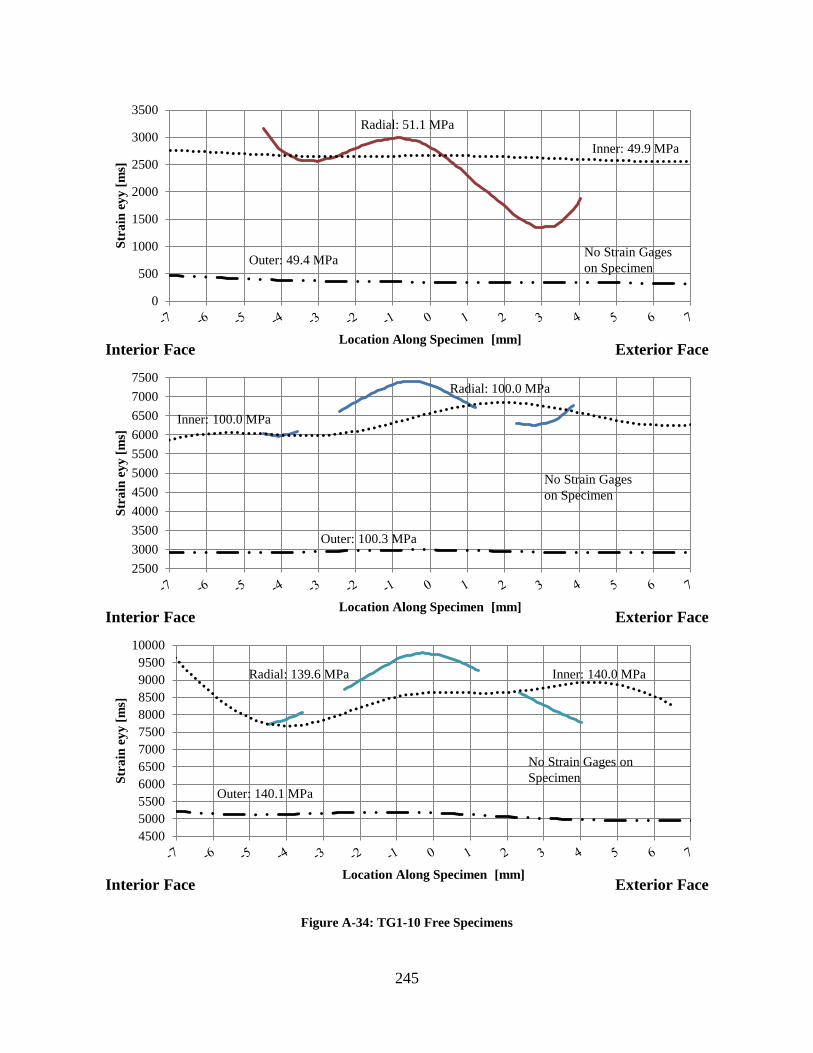
Figure A-34: TG1-10 Free Specimens
0
500
1000
1500
2000
2500
3000
3500St
rain
eyy
[ms]
Location Along Specimen [mm]Interior Face Exterior Face
No Strain Gages on Specimen
Radial: 51.1 MPa
Outer: 49.4 MPa
Inner: 49.9 MPa
25003000350040004500500055006000650070007500
Stra
in e
yy [m
s]
Location Along Specimen [mm]Interior Face Exterior Face
No Strain Gages on Specimen
Radial: 100.0 MPa
Outer: 100.3 MPa
Inner: 100.0 MPa
45005000550060006500700075008000850090009500
10000
Stra
in e
yy [m
s]
Location Along Specimen [mm]Interior Face Exterior Face
No Strain Gages on Specimen
Radial: 139.6 MPa Inner: 140.0 MPa
Outer: 140.1 MPa
245

Figure A-35: TG1-10 Fixed Specimens
25462346
0.0
500.0
1000.0
1500.0
2000.0
2500.0
3000.0
3500.0
4000.0St
rain
eyy
[ms]
Location Along Specimen [mm]Interior Face Exterior Face
Radial Specimen; Partial Loss of Contour after 110.1 MPa; Max Load at 178.8 MPa
Radial: 60.2 MPa
Outer: 60.0 MPa
Inner: 60.1 MPa
4823
4241
2500.0
3000.0
3500.0
4000.0
4500.0
5000.0
5500.0
6000.0
Stra
in e
yy [m
s]
Location Along Specimen [mm]Interior Face Exterior Face
Radial: 90.0 MPa
Outer: 90.0 MPa
Inner: 90.2 MPa
7145
6147
4000.0
4500.0
5000.0
5500.0
6000.0
6500.0
7000.0
7500.0
8000.0
Stra
in e
yy [m
s]
Location Along Specimen [mm]Interior Face Exterior Face
Radial: 120.0 MPa
Outer: 120.1 MPa
Inner: 120.2 MPa
246

Figure A-36: TG1-11 Free Specimens
2170
-500
0
500
1000
1500
2000
2500
3000
3500St
rain
eyy
[ms]
Location Along Specimen [mm]
Radial: 40.8 MPa
Interior Face Exterior Face
Potential Malfunction with Exterior Strain Gage
Outer: 40.8 MPa
Inner: 40.8 MPa
1987
00
500
1000
1500
2000
2500
Stra
in e
yy [m
s]
Location Along Specimen [mm]Interior Face Exterior Face
Potential Malfunction with Exterior Strain Gage
Radial: 69.8 MPa Outer: 69.6 MPa
3742
20
500
1000
1500
2000
2500
3000
3500
4000
Stra
in e
yy [m
s]
Location Along Specimen [mm]Interior Face Exterior Face
Potential Malfunction with Exterior Strain Gage
Radial: 100.3 MPa
Outer: 100.0 MPa
247

Figure A-37: TG1-11 Fixed Specimens
0
500
1000
1500
2000
2500St
rain
eyy
[ms]
Location Along Specimen [mm]Exterior FaceInterior Face
No Strain Gages
Radial: 50.1 MPa
Middle: 50.1 MPa
Inner: 49.8 MPa
Outer: 50.0MPa
2000
2500
3000
3500
4000
4500
5000
5500
Stra
in e
yy [m
s]
Location Along Specimen [mm]Exterior FaceInterior Face
Radial: 80.3 MPa
Middle: 80.1 MPa
Outer: 79.5 MPa
200025003000350040004500500055006000650070007500
Stra
in e
yy [m
s]
Location Along Specimen [mm]Exterior FaceInterior Face
Radial: 109.5 MPa
Middle: 110.1MPa
Outer: 110.7 MPa
248

Figure A-38: TG21-11 Free Specimens
5665.8
4123.9
0.0
1000.0
2000.0
3000.0
4000.0
5000.0
6000.0
7000.0St
rain
eyy
[ms]
Location Along Specimen [mm]Interior Face Exterior Face
Radial: 40.0 MPa
Inner: 40.0 MPa
Middle: 40.2 MPa
Outer: 39.6MPa
5736.1
4123.94328.9
2764.1
1000.0
2000.0
3000.0
4000.0
5000.0
6000.0
7000.0
8000.0
Stra
in e
yy [m
s]
Location Along Specimen [mm]Interior Face Exterior Face
Outer: 60.1 MPa
60.0 MPa
50.1 MPaMiddle: 60.0 MPa
Radial: 59.8 MPa
5748.4
4149.9
20003000400050006000700080009000
1000011000
Stra
in e
yy [m
s]
Location Along Specimen [mm]Interior Face Exterior Face
Radial: 80.0 MPa
Outer: 80.5 MPa
Middle: 79.9 MPa
249

Figure A-39: TG21-11 Fixed Specimens
2362.0
2064.6
1000.01500.02000.02500.03000.03500.04000.04500.05000.05500.06000.06500.0
Stra
in e
yy [m
s]
Location Along Specimen [mm]
Inner: 40.0 MPa
Interior Face Exterior Face
Outer: 40.0 MPa
Middle 39.9MPa
Radial: 40.2 MPa
4799.2
4058.53500.04000.04500.05000.05500.06000.06500.07000.07500.08000.08500.0
Stra
in e
yy [m
s]
Location Along Specimen [mm]Interior Face Exterior Face
Radial: 60.2 MPa
Medium: 60.3 MPa
Outer: 60.5 MPa
7604.5
6123.1
4500.05000.05500.06000.06500.07000.07500.08000.08500.09000.09500.0
10000.010500.011000.0
Stra
in e
yy [m
s]
Location Along Specimen [mm]Interior Face Exterior Face
Partial Loss of Contour after 65.2 MPa
Radial: 79.8 MPa
Middle: 77.8 MPaPeak Strength
Outer: 79.9 MPa
250

Figure A-40: TG21-12 Free Specimen
3092.9 2988.9
1000.01500.02000.02500.03000.03500.04000.04500.05000.05500.06000.0
Stra
in e
yy [m
s]
Location Along Specimen [mm]Interior Face Exterior Face
Outer: 50.1 MPa
Inner: 50.3 MPa
Radial: 50.0 MPa
Middle: 50.0 MPa
2130.8 2266.9
2000.02500.03000.03500.04000.04500.05000.05500.06000.06500.07000.0
Stra
in e
yy [m
s]
Location Along Specimen [mm]Interior Face Exterior Face
Middle 80.0 MPa
Outer 80.4 MPa
Radial 79.7 MPa
3118.9 3013.4
0.01000.02000.03000.04000.05000.06000.07000.08000.09000.0
10000.0
Stra
in e
yy [m
s]
Location Along Specimen [mm]Interior Face Exterior Face
Radial: 104.8 MPa
Middle: 99.9 MPa
Outer: 100.0 MPa
Radial: 99.9 MPa
251

Figure A-41: TG21-12 Fixed Specimens
500
1000
1500
2000
2500
3000
3500St
rain
eyy
[ms]
Location Along Specimen [mm]Interior Face Exterior Face
Middle: 40.1 MPa
Inner: 40.2MPa
Radial: 39.6 MPa
Outer: 40.0 MPa
No Strain Gages
10001500200025003000350040004500500055006000
Stra
in e
yy [m
s]
Location Along Specimen [mm]Interior Face Exterior Face
Inner: 49.9 MPa
Outer: 49.3 MPa
Radial: 50.1 MPa
No Strain Gages
Middle: 50.1 MPa
3500
4000
4500
5000
5500
6000
6500
Stra
in e
yy [m
s]
Location Along Specimen [mm]Interior Face Exterior Face
Outer: 80.0 MPa
Radial: 79.8 MPa
Inner:79.9 MPa
No Strain Gages
252

Figure A- 42: TG21-13 Free Specimens
35223135
500
1000
1500
2000
2500
3000
3500
4000St
rain
eyy
[ms]
Location Along Specimen [mm]
Radial: 41.7 MPa
Outer: 39.7 MPa
Interior Face Exterior Face
Inner: 29.8 MPa(Broke at 44 .2 MPa)
Middle: 39.8 MPa
51204426
2000
2500
3000
3500
4000
4500
5000
5500
Stra
in e
yy(m
s)
Location Along Specimen (mm)Interior Face Exterior Face
Radial: 53.1 MPa
Middle: 49.8 MPa
Outer: 50.0 MPa
6667
5722
3000350040004500500055006000650070007500
Stra
in e
yy [m
s]
Location Along Specimen [mm]Interior Face Exterior Face
Radial: 70.7 MPa
Middle: 69.5 MPa
Outer: 70.3 MPa
253

Figure A-43: TG21-13 Fixed Specimens
0500
100015002000250030003500400045005000
Stra
in e
yy [m
s]
Location Along Specimen [mm]Interior Face Exterior Face
Inner: 39.9 MPa
No Strain Gages for Specimen
Outer: 40.6 MPa
Radial: 39.8 MPa
-1000-500
0500
1000150020002500300035004000450050005500600065007000
Stra
in e
yy [m
s]
Location Along Specimen [mm]Interior Face Exterior Face
Inner: 49.9 MPa
No Strain Gages for Specimen
Outer: 49.8 MPa
Radial: 50.4 MPa
0100020003000400050006000700080009000
10000
Stra
in e
yy [m
s]
Location Along Specimen [mm]Interior Face Exterior Face
Radial: 88.6 MPaNo Strain Gages for Specimen
Outer: 70.0 MPaRadial: 70.0 MPa
Inner: 69.7 MPa
254

Figure A-44: Contour Banding in Radial Free Specimen TG21-12
255

Figure A-45: Stress versus wall thickness location
29
69
125
0
20
40
60
80
100
120
140
0.0 0.1 0.2 0.3 0.4 0.5 0.6 0.7 0.8 0.9 1.0
Stre
ss (M
Pa)
Normalized Radial Thickness Dimension
TG1-1
103
149
184
115
169208
0
50
100
150
200
250
0.0 0.1 0.2 0.3 0.4 0.5 0.6 0.7 0.8 0.9 1.0
Stre
ss (M
Pa)
Normalized Radial Thickness Dimension
TG1-5
120
172
202
130
178
169
0
50
100
150
200
250
0.0 0.1 0.2 0.3 0.4 0.5 0.6 0.7 0.8 0.9 1.0
Stre
ss (M
Pa)
Normalized Radial Thickness Dimension
TG1-6
111
183 184
82
152 160
020406080
100120140160180200
0.0 0.1 0.2 0.3 0.4 0.5 0.6 0.7 0.8 0.9 1.0
Stre
ss (M
Pa)
Normalized Radial Thickness Dimension
TG1-7
114
159
147
103
122
169
0
20
40
60
80
100
120
140
160
180
0.0 0.1 0.2 0.3 0.4 0.5 0.6 0.7 0.8 0.9 1.0
Stre
ss (M
Pa)
Normalized Radial Thickness Dimension
TG1-8
133
171
264
77
134150
0
50
100
150
200
250
300
0.0 0.1 0.2 0.3 0.4 0.5 0.6 0.7 0.8 0.9 1.0
Stre
ss (M
Pa)
Normalized Radial Thickness Dimension
TG1-9
256

Figure A-46: Stress versus wall thickness location (cont.)
151
220
144169
0
50
100
150
200
250
0.0 0.1 0.2 0.3 0.4 0.5 0.6 0.7 0.8 0.9 1.0
Stre
ss (M
Pa)
Normalized Radial Thickness Dimension
TG1-10
150
221
110123
156
0
50
100
150
200
250
0.0 0.1 0.2 0.3 0.4 0.5 0.6 0.7 0.8 0.9 1.0
Stre
ss (M
Pa)
Normalized Radial Thickness Dimension
TG1-11
41
86
186
41
75
132
020406080
100120140160180200
0.0 0.1 0.2 0.3 0.4 0.5 0.6 0.7 0.8 0.9 1.0
Stre
ss (M
Pa)
Normalized Radial Thickness Dimension
TG21-11
53
111137
66
123
213
0
50
100
150
200
250
0.0 0.1 0.2 0.3 0.4 0.5 0.6 0.7 0.8 0.9 1.0
Stre
ss (M
Pa)
Normalized Radial Thickness Dimension
TG21-12
42
88
193
76
201
0
50
100
150
200
250
0.0 0.1 0.2 0.3 0.4 0.5 0.6 0.7 0.8 0.9 1.0St
ress
(MPa
)
Normalized Radial Thickness Dimension
TG21-13
257

CITED REFERENCES
Achá Navarro, E. H., (2011). Bamboo: High Tech Material for Concrete Reinforcement. Doctoral Thesis, Pontifícia Universidade Católica do Rio de Janeiro, June 2011, 138 pp.
Adhikary, N., (2008). An experiment with a locally constructed bouccherie treatment plant in Nepal. Modern Bamboo Structures, Xiao, Y., Inoue, M., and Paudel S.K., eds., London, UK, pp. 103-110.
Ahmad M. and Kamke F.A., (2005). Analysis of Calcutta bamboo for structural composite materials: physical and mechanical properties. Wood Science and Technology, 39, pp. 448-459.
Aktas, C.B. and Bilec, M.M. (2012). Impact of Lifetime on U.S. residential building LCA Results. The International Journal of Life Cycle Assessment, 17(3), pp. 337-349.
Albermani, F., Goh, G.Y., and Chan, S.L., (2007). Lightweight bamboo double layer grid system. Engineering Structures, 29, pp.1499-1506.
Amada, S., Ichikawa, T., Munekata, T., Nagase, Y., and Shimizu, H., (1997). Fiber texture and mechanical graded structure of bamboo, Composites: Part B, 28B, pp. 13-20.
Amada, S., Munekata, T., Nagase, Y., Ichikawa, Y., Kirigai A., and Zhifei, Y., (1996). The Mechanical Structures of Bamboo in Viewpoint of Functionally Gradient and Composite Materials, Journal of Composite Materials, 30(7), pp. 800-819.
Amada S. and Untao, S., (2001). Fracture properties of bamboo, Composites: Part B, 32, pp. 451-459.
American Forest and Paper and Association and American Wood Council, (2005). National design specification (NDS) for wood construction and supplement. AF & PA, Washington, D.C.
American Institute of Steel Construction, (2011). Steel Construction Manual. 14th ed. AISC, Chicago, IL.
Arce-Villalobos, O.A., (1993). Fundamentals of the design of bamboo structures. Master’s Thesis, Eindhoven University of Technology, Netherlands, September 1993, 167 pp.
ASTM International, (1978). ASTM D2733-70: Method for Interlaminar Shear Strength of Structural Reinforced Plastics at Elevated Temperatures, West Conshohocken, PA: ASTM International
258
ASTM International, (2008). ASTM D3039-08: Standard Test Method for Tensile Properties of Polymer Matrix Composite Materials, West Conshohocken, PA: ASTM International
ASTM International, (2009). ASTM D143-09: Standard Test Methods for Small Clear Specimens of Timber, West Conshohocken, PA: ASTM International
ASTM International, (2010). Structural Bamboo. ASTM Standardization News. November/December, pp. 50.
ASTM International, (2011). ASTM E8-11: Standard Test Methods for Tension Testing of Metallic Materials, West Conshohocken, PA: ASTM International
Athaus, H., Werner, F., Stettler, C., and Dinkel, F., Basel, C., (2007). Ecoinvent report No. 21: Life Cycle Inventories of Renewable Materials, Swiss Centre for Life Cycle Inventories, Dübendorf, Switzerland, December 2007, 127 pp.
Banik, R., (1995). INBAR Technical Report No. 06: A Manual for Vegetative Propagation of Bamboos, International Network for Bamboo and Rattan, Beijing, China, 66 pp.
Breyer, D.E., Fridley, K.J., Cobeen, K.E., and Pollock, D.G., (2007). Design of Wood Structures: ASD/LRFD. 6th ed. McGraw-Hill, New York, NY.
Brink, F.E. and Rush, P.J., (1966). Bamboo Reinforced Concrete Construction. U.S. Naval Civil Engineering Laboratory, Port Hueneme, CA.
Brown, K., Eells, P., Nites, M., Pagliassotti, M., Stein, A., and Zimmerman, C., (2012). Design of a Rapidly Deplyable Bamboo Gridshell Structure. International Research Experience for Students Report (unpublished), University of Pittsburgh, 45 pp.
Bureau of Indian Standards, (2005). National Building Code of India: Part 6 Structural Design Section 3: Timber and Bamboo: 3B Bamboo.
Burgers, J.W. 1935. Mechanical considerations - model systems - phenomenological theories of relaxation and of viscosity. First Report on Viscosity and Plasticity, Nordemann Publishing Company, New York, NY.
Chapman, G.P., (1996). The Biology of Grasses, CAB International, Wallingford.
Chapman, G.P. and Peat, W.E., (1992). An introduction to the grasses (including bamboos and cereals), CAB International, Wallingford.
Choi, M., Kwon, A., Lawit O., Macready, P., Ringel, C., and Zettl, J., (2011). Comparative Life Cycle Analysis for Portal Frame Construction. International Research Experience for Students Report (unpublished), University of Pittsburgh, 26 pp.
Clark, L.G. and Pohl, R.W., (1996). Agnes Chase’s First Book of Grasses: The Structure of Grasses Explained for Beginners, 4th ed., Smithsonian Institution Press, Washington.
259

Correal, L. and Lopez, L., (2008). Mechanical Properties of Colombian glue laminated bamboo. Modern Bamboo Structures, Xiao, Y., Inoue, M., and Paudel S.K., eds., London, UK, pp. 121-127.
CORRIM (Consortium for Research on Renewable Industrial Materials), (2011). Research, Life Cycle Inventory and Life Cycle Assessment. CORRIM, <http://www.corrim.org/research/lci_lca.asp>, (December 12, 2011).
Cox F.B. and Geymayer H.G., (1969). Expedient reinforcement for concrete for use in S.E. Asia. Report 1-Preliminary Tests of Bamboo. Monograph. (as reported by Arce-Villalobos 1993).
Crow, J.M., (2008). The concrete conundrum. Chemistry World, 5(3) pp. 62-66.
Cruz, M.L.S., (2002). Caracterização fisica e mecânica de colmos inteiros do bambu da espécie phyllostachys aurea: comportamento à flambagem (in Portuguese). Master’s Thesis, Pontifícia Universidade Católica do Rio de Janeiro, August 2002, 122 pp.
De Flander, K. and Rovers, R., (2009). One laminated bamboo-frame house per hectare per year. Construction and Building Materials, 23, pp. 210-218.
Dickson, M., (2002). Engineering buildings for a small planet: Towards construction without depletion. The Structural Engineer, 80(3), pp. 35-43.
Duff, C.H., 1941. Bamboo and its structural used. The Engineering Society of China, session 1940-41, paper #ICE. 1. Institution of Civil Engineers of Shanghai, pp. 1-27. (as reported by Arce-Villalobos 1993)
Ecoinvent Unit Processes Database (Ecoinvent). <www.ecoinvent.org/database/>
Ghavami, K., (1988). Application of bamboo as a low-cost construction material. Proceedings of International Bamboo Workshop, Cochin, India, pp. 270-279.
Ghavami, K., (2005). Bamboo as reinforcement in structural concrete elements. Cement and Concrete Composites, 27, pp. 637-649.
Ghavami, K., (2008). Bamboo: Low cost and energy saving construction materials. Modern Bamboo Structures, Xiao, Y., Inoue, M., and Paudel S.K., eds., London, UK, pp. 5-21.
Ghavami, K., and Moreira, L.E., (2002). Buckling behaviour of compression elements in bamboo space structure. Spaces Structures 5. Parke, G.A.R. and Disney, P. Disney, eds., Thomas Telford Ltd., London, pp. 133-144.
Ghavami, K., Rodriques, C.S., and Paciornik, S., (2003). Bamboo: Functionally Graded Composite Material. Asian Journal of Civil Engineering (Building and Housing), 4(1), pp. 1-10.
260

Government of the Republic of Haiti, (2010). Action Plan for National Recovery and Development of Haiti: Immediate key initiatives for the future.
González, G. and Gutiérrez, J., (2005). Structural performance of bamboo ‘bahareque’ walls under cyclic load. Journal of Bamboo and Rattan, 4(4), pp. 353-368.
Grewal, J.K., (2009). Bamboo as a Structural Material. Bachelors Thesis, University of Southampton, April 2009. 50pp.
Grosser, D. and Liese, W., (1971). On the Anatomy of Asian Bamboos, with Special Reference to their Vascular Bundles. Wood Science and Technology, 5, pp. 290-312.
Guan, M.J. and Zhu, E.C., (2008). Flexural properties of bamboo sliver laminated lumber under different hygrothermal conditions. Modern Bamboo Structures, Xiao, Y., Inoue, M., and Paudel S.K., eds., London, UK, pp. 151-157.
Gupta, S., Sudhakar, P., Korde, C., and Agrawal, A., (2008). Experimental verification of bamboo-concrete composite column with ferro-cement bond. Modern Bamboo Structures, Xiao, Y., Inoue, M., and Paudel S.K., eds., London, UK, pp. 253-258.
Gutiérrez, J., (2004). Notes on the Seismic Adequacy of Vernacular Buildings. 13th World Conference on Earthquake Engineering, August 2004, Vancouver, Canada.
Harries, K.A., Petrou, M.F., and Brooks, G., (2000). Structural Characterization of Built-Up Timber Columns. Journal of Structural Engineering, 6(2), pp. 58-65.
Harries, K.A., Sharma, B., and Richard M.J., (2012). Structural Use of Full Culm Bamboo: The Path to Standardisation. International Journal of Architecture, Engineering and Construction, 1(2), June 2012, pp. 1-10.
ICC-ES (International Code Council Evaluation Service), (2013). Evaluation Service Report 1636: Structural Bamboo Poles. ICC-ES.
IDEMAT Database. <www.idemat.nl>
INBAR (International Network of Bamboo and Rattan), (1999). An International Model Building Code for Bamboo, Janssen, J.A., ed., INBAR, Beijing.
Inglês, L., (2012). Personal interview, June 2012.
Inoue, M., Tanaka, K., Tagawa, Y., Nakahara, M., Goto, Y., Imabayashi, M., and Uchiyama, U., (2008). Application of bamboo connector to timber structure – Introduction of construction and dismantlement of Japanese government pavilion Nagakute in Expo 2005 Aichi, Japan. Modern Bamboo Structures, Xiao, Y., Inoue, M., and Paudel S.K., eds., London, UK, pp. 191-199.
ISO (International Organization for Standardization), (2004a). International Standard ISO 22156:2004 (E), Bamboo – Structural Design. Geneva, Switzerland: ISO.
261

ISO (International Organization for Standardization), (2004b). International Standard ISO 22157-1:2004 (E), Bamboo – Determination of Physical and Mechanical Properties – Part I: Requirements. Geneva, Switzerland: ISO.
ISO (International Organization for Standardization), (2004c). International Standard ISO 22157- 2:2004 (E), Bamboo – Determination of Physical and Mechanical Properties – Part II: Laboratory Manual. Geneva, Switzerland: ISO.
ISO (International Organization for Standardization), (2006), ISO 14040: Environmental management – Life cycle assessment- Principles and framework. Geneva, Switzerland: ISO.
Iyer, S., (2002). Guideline for Building Bamboo-Reinforced Masonry in Earthquake-Prone Areas in India. Masters of Building Science Thesis, University of Southern California, May 2002. 80pp.
Janssen, J., (1981). Bamboo in Building Structures. Doctoral Thesis. Eindhoven University of Technology, Netherlands.
Janssen, J.J.A., (2000). Designing and Building with Bamboo: INBAR Technical Report 20. International Network for Bamboo and Rattan, Beijing, China, 211pp.
Jayanetti, D.L. and Follett, P.R., (2008). Bamboo in construction. Modern Bamboo Structures, Xiao, Y., Inoue, M., and Paudel S.K., eds., London, UK, pp. 23-32.
Johnson, L.R., Lippke, B., Marshall, J.D., and Comnick, J., (2005). Life-Cycle Impacts of Forest Resource Activities in the Pacific Northwest and Southeast United States. Wood and Fiber Science, 37(CORRIM Special Issue), pp. 30-46.
Kaushik, H.B., Dasgupta, K., Sahoo, D.R., and Kharel, G., (2006a). Reconnaissance Report: Sikkim Earthquake of 14 February 2006. National Information Center of Earthquake Engineering, Indian Institute of Technology Kanpur, April 2006. 13pp.
Kaushik, H.B., Dasgupta, K., Sahoo, D.R., and Kharel, G., (2006b). Performance of Structures during the Sikkim Earthquake of 14 February 2006. Current Science, 91(4), pp. 449-455.
Klarreich, K., (2010). Haiti earthquake diary: The quest for temporary housing. The Christian Science Monitor.
Laroque, P., (2007). Design of a Low Cost Bamboo Footbridge. Master’s Thesis, Massachusetts Institute of Technology (MIT), June 2007, 87 pp.
Li, H. and Shen S., (2011). The mechanical properties of bamboo and vascular bundles. Journal of Materials Research, 26(21), pp. 2749-2756.
Li, X.B., Shupe, T.F., Peter, G.F., Hse, C.Y., and Eberhardt, T.L., (2007). Chemical Changes with Maturation of the Bamboo Species Phyllostachys Pubescens. Journal of Tropical Forest Science, 19(1), pp. 6-12.
262

Li, Y.S., Shan, W., and Liu, R., (2008). Experimental study of mechanical behavior of bamboo-steel composite floor slabs. Modern Bamboo Structures, Xiao, Y., Inoue, M., and Paudel S.K., eds., London, UK, pp. 275-284.
Liese, W., (1987). Research on Bamboo. Wood Science and Technology, 21, pp. 189-209.
Liese, W. and Weiner, G., (1996). Ageing of bamboo culms. A review. Wood Science and Technology, 30, pp. 77-89.
Lobovikov, M., Paudel, S., Piazza, M., Ren, H., and Wu, J., (2007). World Bamboo Resources: A Thematic Study Prepared in the Framework of the Global Forest Resources Assessment 2005. Rome, Italy: Food and Agriculture Organization (FAO) of the United Nations.
Lobovikov, M., Schoene, D., and Yping, L., (2012). Bamboo in climate change and rural livelihoods. Mitigation and Adaptation Strategies for Global Change, 17, pp. 261-276.
Low, I.M., Che, Z.Y., and Latella, B.A., (2006), Mapping the structure, composition and mechanical properties of bamboo. Journal of Materials Research, 21(8), pp. 1969-1976.
McLaughlin, E.C., (1979). A note on the strength of Jamaica grown bamboo. Wood and Fiber Science, 11(2), pp. 86-91. (as reported by Arce-Villalobos 1993).
Milota, M. R., West, C. D., and Hartley, I.D., (2005). Gate-To-Gate Life-Cycle Inventory of Softwood Lumber Production. Wood and Fiber Science, 37(CORRIM Special Issue), pp. 47-57.
Mitch, D., (2009). Splitting Capacity Characterization of Bamboo Culms. University of Pittsburgh Honors College Thesis, University of Pittsburgh, March 2009. 88pp.
Mitch, D., (2010). Structural Behavior of Grouted-Bar Bamboo Column Bases. Master’s Thesis, University of Pittsburgh, July 2010. 99pp.
Mitch, D., Harries, K.A., and Sharma, B., (2010). Characterization of Splitting Behavior of Bamboo Culms, ASCE Journal of Materials in Civil Engineering, 22(11), pp. 1195-1199.
Moreira, L.E., (1991) Desenvolvimento de estruturas treliçadas espaciais de bamboo (in Portuguese). Doctoral Thesis, Pontifícia Universidade Católica do Rio de Janeiro.
Moreira L.E. and Ghavami, K., (2009). Bamboo Space Structure. Proceedings of the 11th International Conference on Non-conventional Materials and Technologies (NOCMAT 2009), September 2009, Bath, UK, 8 pp.
Mori, T., Umemura, K., and Norimoto, M., (2008). Manufacture of drift pins and boards made from bamboo fiber for timber structures. Modern Bamboo Structures, Xiao, Y., Inoue, M., and Paudel S.K., eds., London, UK, pp. 129-137.
Murty, C.V.R. and Sheth, A. (editors), (2012). The Mw 6.9 Sikkim-Nepal Border Earthquake of September 18, 2011. EERI Special Earthquake Report, February 2012, 14 pp.
263

Obataya, E., Kitin, P., and Yamauchi, H., (2007). Bending characteristics of bamboo (Phyllostachys pubescens) with respect to its fiber-foam composite structure. Wood Science and Technology, 41, pp. 385-400.
Oneil, E.E., Johnson, L.R., Lippke, B.R., McCarter, J.B., McDill, M.E., Roth, P.A., and Finley, J.C., (2010). Life-Cycle Impacts of Inland Northwest and Northeast/North Central Forest Resources. Wood and Fiber Science, 42(CORRIM Special Issue), pp. 29-51.
Ota, M., (1950). Studies on the properties of bamboo stem (part 10). On the relation between the tensile strength parallel to the grain and the moisture content of split bamboo. Bulletin Kyushu University of Forestry, 32, pp. 155-164. (as reported by Arce-Villalobos 1993)
Paudel, S.K., (2008). Engineered bamboo as a building material. Modern Bamboo Structures, Xiao, Y., Inoue, M., and Paudel S.K., eds., London, UK, pp. 33-40.
Powell, A.E., (2006). The Widening Gulf. Civil Engineering Magazine. American Society of Civil Engineers, 76(8), pp. 56-61.
Puettmann, M.E., Bergman, R., Hubbard, S., Johnson, L., Lippke, B., Oneil, E., and Wagner, F. G., (2010a). Cradle-to-gate life-cycle inventory of US wood products production: CORRIM phase I and phase II products. Wood and Fiber Science, 42(CORRIM Special Issue), pp. 15-28.
Puettman, M.E., Wagner, F.G., and Johnson, L., (2010b). Life Cycle Inventory of softwood lumber from the Inland Northwest. Wood and Fiber Science, 42, pp.52-66.
Richard, M. J. and Harries K.A., (2012). “Experimental Buckling Capacity of Multiple-Culm Bamboo Columns.” Key Engineering Materials; 517, pp. 51-62.
Rittironk, S. and Elnieiri, M., (2008). Investigating laminated bamboo lumber as an alternate to wood lumber in residential construction in the United States. Modern Bamboo Structures, Xiao, Y., Inoue, M., and Paudel S.K., eds., London, UK, pp. 83-96.
Robertson, A, (1925). The Strength of Struts. ICE Selected Engineering Papers, 1(28).
Rowell, K. and Jackson, L., (2010). The Haiti Co-Laboratory Project. ASTM Standardization News, ASTM International, Nov/Dec 2010, pp. 32-35.
Shao Z., Fang, C., and Tian G., (2009). Mode I interlaminar fracture property of moso bamboo (Phyllostachys pubescens). Wood Science and Technology, 43, pp. 527-536.
Sharma, B., (2010). Seismic Performance of Bamboo Structures. Doctoral Dissertation, University of Pittsburgh, 201 pp.
Silva, E.C.N., Walters, M.C., and Paulino, G.H., (2006). Modeling Bamboo as a Functionally Graded Material: Lessons for the Analysis of Affordable Materials. Journal of Material Science, 42, pp. 6991-7004.
264

Smith I., Landis, E., and Gong, M., (2003). Fracture and Fatigue in Wood. John Wiley and Sons Ltd., West Sussex, UK.
Solomon, C., (1994). Cement. 1994 Mineral Yearbook, United States Geological Survey (USGS), pp. 1-20.
Southern Pine Association, (2006). Southern Pine for Structural Components. S. P. Association. Kenner, LA.
Southwell, E. V., (1932). On the Analysis of Experimental Observations in Problems of Elastic Stability. Proceedings of Royal Society of London, 135, pp. 601-616.
Spoer P., (1982). The Use of Bamboo in Space Trusses. Master’s Thesis, Technical University of Denmark. (as reported by Arce-Villalobos 1993)
Sudhakar, P., Gupta, S., Bhalla, S., Kordke, C., and Satya, S., (2008). Conceptual development of bamboo concrete composite structure in a typical Tribal Belt, India. Modern Bamboo Structures, Xiao, Y., Inoue, M., and Paudel S.K., eds., London, UK, pp. 65-73.
Tan, T., Rahbar, N., Allameh, S.M., Kwofie, S., Dissmore, D., Ghavami, K., and Soboyejo, W.O., (2011). Mechanical properties of functionally graded hierarchical bamboo structures. Acta Biomaterialia, 7, pp. 3796-3803.
United Nations, (2004). Tents: A guide to the use and logistics of family tents in humanitarian relief. Office for the Coordination of Humanitarian Relief.
United Nations Human Settlements Programme (UN-HABITAT), (2011a). Affordable Land and Housing in Latin America and the Caribbean.
United Nations Human Settlements Programme (UN-HABITAT), (2011b). Affordable Land and Housing in Asia.
United Nations Human Settlements Programme (UN-HABITAT), (2011c). Affordable Land and Housing in Africa.
United Nations Human Settlements Programme (UN-HABITAT), (2011d). Affordable Land and Housing in Europe and North American.
United Nations Universal Declaration of Human Rights (UN-UDHR), (1948).
United States Environmental Protection Agency (US-EPA). Tool for the Reduction and Assessment of Chemical and Other Environmental Impacts (TRACI), TRACI 2 version 3.01, <www.epa.gov/nrmrl/std/traci/traci.html>
United States Geological Survey (USGS), (2012). Cement Statistics and Information. <http://minerals.usgs.gov/minerals/pubs/commodity/cement/index.html#myb> (January 2013)
265

United States Geological Survey (USGS), (2012). Iron and Steel Statistics. <http://minerals.usgs.gov/ds/2005/140/ironsteel.pdf > (May 2013)
United States Life Cycle Inventory (USLCI) Database. <www.nrel.gov/lci/>
Vaessen, M.J. and Janssen, J.A., (1997). Analysis of the critical length of culms of bamboo in four-point bending tests, HERON, 42(2), pp.113-124.
van der Lugt P., van den Dobbelsteen, A.A.J.F., and Janssen, J.J.A., (2006). An environmental, economic and practical assessment of bamboo as a building material for supporting structures Construction and Building Materials, 20(9), pp. 648-656.
van der Lugt, P., Vogtländer, J., and Brezet, H., (2009). INBAR Technical Report No. 30: Bamboo, a Sustainable Solution for Western Europe Design Cases, LCAs and Land-Use. International Network for Bamboo and Rattan (INBAR), Beijing, China.
van der Lugt, P., Vogtländer, J.G., van der Vegte, and Brezet, J.C., (2012). Life Cycle Assessment and Carbon Sequestration; the Environmental Impact of Industrial Bamboo Products, IXth World Bamboo Congress, April 2012, Belgium, pp. 73-85.
van Oss H. G., (2012). Cement. 2010 Minerals Yearbook, United States Geological Survey (USGS), pp. 16.1-16.37.
Vengala, J., Jagadeesh, H.N., and Pandey C.N., (2008). Development of bamboo structure in India. Modern Bamboo Structures, Xiao, Y., Inoue, M., and Paudel S.K., eds., London, UK, pp. 51-63.
Villalobos, G., Linero, D.L., and Muñoz, J.D., (2011). A statistical model of fracture for a 2D hexagonal mesh: The Cell Network Model of Fracture for the bamboo Guadua angustifolia. Computer Physics Communications, 182, pp. 188-191.
Vogtländer, J.G., (2001). The model of the Eco-costs/Value Ratio, a new LCA based decision support tool. Doctoral thesis, Delft University of Technology, Delft, Netherlands.
Vogtländer, J., van der Lugt, P., and Brezet, H., (2010). The sustainability of bamboo products for local and Western European applications. LCAs and land-use. Journal of Cleaner Production, 18, pp. 1260-1269.
Wessex Resins and Adhesives Limited, (2003). Resorcinol Resin. <http://www.wessex-resins.com> (November 22, 2011).
Wilson, J., (2010). Life-Cycle Inventory of Formaldehyde-Based Resins Used in Wood Composites In Terms of Resources, Emission, Energy and Carbon. Wood and Fiber Science, 42(CORRIM Special Issue), pp. 125-143.
World Resource Institute, (2009). State of the World’s Forests. <http://www.wri.org/map/state-worlds-forests> (January 2013).
266

World Steel Association, (2012). Annual crude steel production archive. <http://www.worldsteel.org/statistics/statistics-archive/annual-steel-archive.html> (January 2013).
World Steel Association, (2012). World Crude Steel Production – Summary. <http://www.worldsteel.org/dms/internetDocumentList/press-release-downloads/2012/2012-statistics-table/document/2012%20statistics%20table.pdf> (May 2013)
Xiao, Y., Shan, B., Chen, G., Zhou, Q., and She L.Y., (2008). Development of a new type of Glulam – Glubam. Modern Bamboo Structures, Xiao, Y., Inoue, M., and Paudel S.K., eds., London, UK, pp. 41-47.
Xiao, Y., Zhou, Q., and Shan, B., (2010). Design and Construction of Modern Bamboo Bridges. Journal of Bridge Engineering, 15(5), pp.533-541.
Yu, C., Lange, J., and Mastrangelo, G., (2010). Lessons Learnt from Natural Disasters – Shelters and the Built Environment. Indoor and Built Environment, 19(3), pp. 307-310.
Yu W.K., Chung K.F., and Chan S.L., (2003). Column buckling of structural bamboo. Engineering Structures, 25, pp. 755-768.
Yu W.K., Chung K.F., and Chan S.L., (2005). Axial buckling of bamboo columns in bamboo scaffolds. Engineering Structures, 27, pp. 61-73.
Zeng, Q.Y., Li, S.H., and Bao, X.R., (1992). Effect of bamboo nodal on mechanical properties of bamboo wood. Scientia Silvae Sinicae, 28(3), pp. 247-252 (in Chinese: as reported by Shao et al. (2009)).
Zhao, J., Ma, S., Liu, H., and Ren, H., (2011). Experimental investigation of the mixed-mode crack expanding in bamboo. Advanced Materials Research, 146-147, pp1285-1288.
Zhou, G.M. and Jiang, P.K., (2004). Density, storage and spatial distribution of carbon in Phyllostachys pubescens forest. Scientia Silvae Sinicae, 6, pp 20-24. (in Chinese with English summary; reported by van der Lugt (2012)).
267