assessing the performance of concentrated solar power ... · assessing the performance of...
TRANSCRIPT

PROCEEDINGS OF ECOS 2015 - THE 28TH INTERNATIONAL CONFERENCE ON EFFICIENCY, COST, OPTIMIZATION, SIMULATION AND ENVIRONMENTAL IMPACT OF ENERGY SYSTEMS
JUNE 30-JULY 3, 2015, PAU, FRANCE
Assessing the performance of Concentrated Solar Power plants in selected locations of Chile
A.R. Starkea, J.M. Cardemilb,d, R. Escobarc,d, L.L. Lemosa, S. Collea
aLEPTEN - Laboratory of Energy Conversion engineering and Energy Technology/Federal University of Santa Catarina (UFSC), Florianópolis, Santa Catarina, Brazil. [email protected],
[email protected], [email protected] bSchool of Industrial Engineering, Universidad Diego Portales, Av. Ejército 441, Chile.
[email protected] cMechanical and Metallurgical Engineering Department, Pontificia Universidad Católica de Chile, Vicuña Mackenna
4860, Macul, Santiago, Chile. [email protected] dFraunhofer Chile Research Foundation, Center for Solar Energy Technologies (CSET). Vicuña Mackenna 4860,
Macul, Santiago, Chile.
Abstract: A thermal and economic analysis of Concentrated Solar Power plants is conducted considering a range of plant capacities from 50 to 800 MWth of field thermal output and the following technologies: parabolic trough collectors (PTC), linear Fresnel collectors with direct steam generation (LFC-DSG), central receiver system using molten nitrate salts (CRS-MNS) and central receiver system with direct steam generation (CRS-DSG). The analysis focuses on the environmental conditions of selected locations of Chile: Crucero and Pozo Almonte. The study considers a parametric analysis and optimization of the storage and power block sizes, for different plant scales, in terms of the levelized cost of energy (LCOE). The annual production of the plants are calculated by using the Transient System Simulation program (TRNSYS), which uses a new component library developed for that purpose. The results obtained show good agreement with other software packages as well as with actual data from currently operating CSP plants. Parametric analysis and optimization routine conducted show that the high level of irradiation available in Chile provides a significant reduction in the LCOE for commercial plants, comparing to the current plant installed in South Spain and California
Keywords: CSP, DSG, Chile, TRNSYS.
1. Introduction During the last decade, Concentrated Solar Power (CSP) plant have demonstrated its capabilities as a secure and clean energy source, which makes it one of the promising technologies for mitigating the climate changes [1]. After the initial development in the 90’s, i.e., construction of the SEGS (354 MW) and Solar One (10 MW) plants in USA, the CSP industry has experienced a considerable growth since 2007, achieving a cumulative capacity of 2.3 GW at the end of 2013 [2–4]. In this period, new technologies have reached commercial maturity and new concepts have emerged, such as direct steam generation, innovative cycles and thermal storage integration, among other advances [5–7]. The main CSP technologies [8,9] are parabolic through collectors (PTC), linear Fresnel collectors (LFC) and central receiver system (CRS), the latter also known as solar towers. Currently, PTC technology with synthetic oil as heat transfer fluid represents over 90% of the installed capacity, where more than half of that is located in Spain [2,4,10]. Most of those plants integrate a thermal energy storage (TES) system, composed by an indirect-two-tank of molten nitrate salts (MNS). Because of the relatively high deployment of the technology, PTC with TES is considered as market dominant and fully mature with respect to CSP plants [2,10,11]. Central Receiver Systems [10,12] have received increased attention during the past few years, since the higher operating temperatures allow reaching higher thermal-to-electricity conversion efficiencies. In this context, two main operating schemes have emerged for this technology [7]: first using MNS as heat transfer fluid and
heat storage medium, like the Gemasolar (2011, 19.9 MW - 15h TES) and Crescent Dunes (2014, 110 MW – 10h TES) plants located in Spain and USA, respectively. The other scheme is the process denominated direct steam generation (DSG) [7,13–16], through which steam can be produced directly in the receiver. Examples of that technology are the plants PS10 (2007, 11 MW) and PS20 (2009, 20 MW) in Spain, both generating saturated steam, while the Sierra Sun Tower (2009, 5 MW) and Ivanpah Solar Electric Generating Station (2013, 377 MW), in USA, generate superheated steam [2,17]. Despite the fact that DSG can reduce costs and thermal losses associated to heat exchangers, currently there is no suitable solution of TES available for DSG receivers. The exception is the steam accumulator employed in PS10 and PS20 plants, which supply 50 min of plant operation at the rated plant capacity [17] effectively acting more as a transient damper than as a proper TES. This low capacity for storage, limits the application of the technology and significantly lowers the plant capacity factor in cases of transient cloudy skies.
Regarding Liner Fresnel Collectors, until 2010, just early-commercial demonstrations LFC were operating [2,16]. However, two LFC commercial plants began to operate since 2010: a 30 MW plant built by Novatec Solar in Spain and a 125 MW plant built in India by AREVA solar – both plants use DSG configuration and none of them has TES system [2].
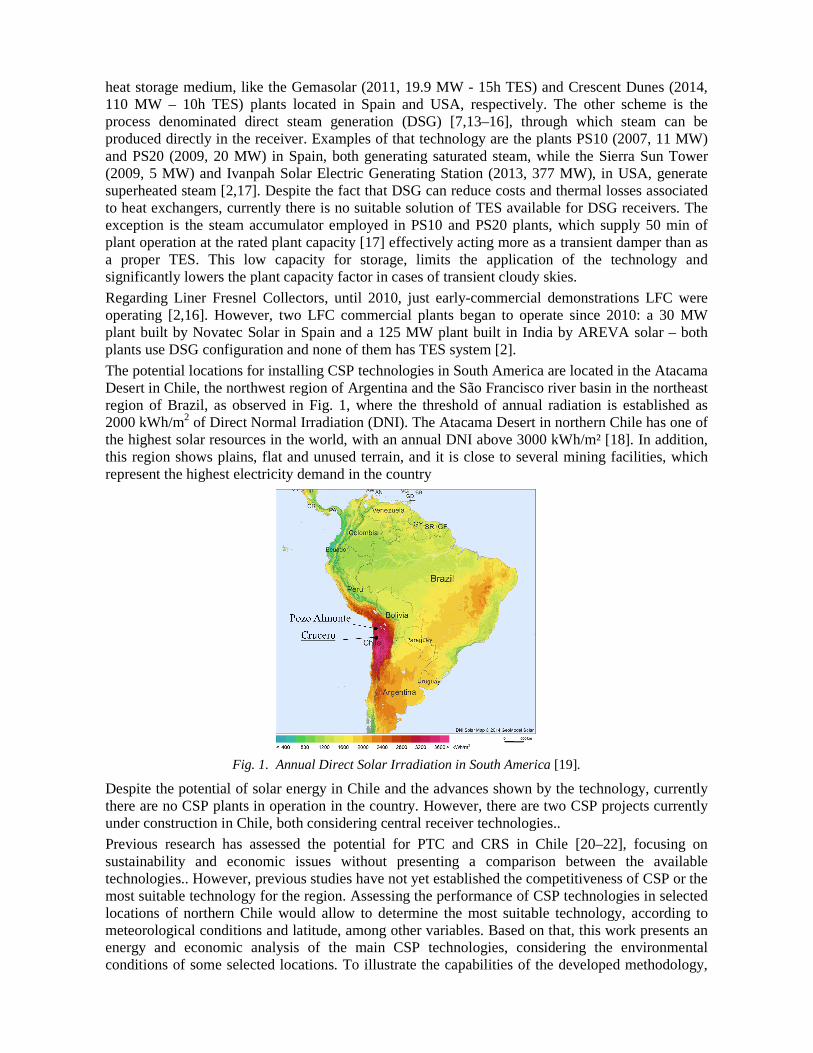
The potential locations for installing CSP technologies in South America are located in the Atacama Desert in Chile, the northwest region of Argentina and the São Francisco river basin in the northeast region of Brazil, as observed in Fig. 1, where the threshold of annual radiation is established as 2000 kWh/m2 of Direct Normal Irradiation (DNI). The Atacama Desert in northern Chile has one of the highest solar resources in the world, with an annual DNI above 3000 kWh/m² [18]. In addition, this region shows plains, flat and unused terrain, and it is close to several mining facilities, which represent the highest electricity demand in the country
Fig. 1. Annual Direct Solar Irradiation in South America [19].
Despite the potential of solar energy in Chile and the advances shown by the technology, currently there are no CSP plants in operation in the country. However, there are two CSP projects currently under construction in Chile, both considering central receiver technologies.. Previous research has assessed the potential for PTC and CRS in Chile [20–22], focusing on sustainability and economic issues without presenting a comparison between the available technologies.. However, previous studies have not yet established the competitiveness of CSP or the most suitable technology for the region. Assessing the performance of CSP technologies in selected locations of northern Chile would allow to determine the most suitable technology, according to meteorological conditions and latitude, among other variables. Based on that, this work presents an energy and economic analysis of the main CSP technologies, considering the environmental conditions of some selected locations. To illustrate the capabilities of the developed methodology,

two locations of Chile are selected, Crucero and Pozo Almonte, both with outstanding levels of solar irradiation. The analysis considers transient simulations of several plant configurations such as PTC, LFC with DSG, CRS with MNS receiver and a CRS with DSG receiver. Those simulations were carried out using TRNSYS software [23], performing parametric analysis and optimization of the TES and power block size for different plant capacities in terms of the levelized cost of energy (LCOE).
2. Methodology The annual performance for each plant configuration is determined by a simulation model, which considers an hourly resolution meteorological database. For that purpose, the Transient System Simulation Program (TRNSYS) [23] was selected due to its modularity and open-source structure, which facilitates the addition of new mathematical models (Types) – e.g., steam accumulators or Phase Change Material (PCM) storage systems [11,24]. Although, TRNSYS has currently more than three hundred operational Types, – including some for CSP applications i.e. STEC library [25] and TESS libraries [26] – there are no available Types for some components of the CSP plants analyzed herein. Therefore, it was necessary to build a new TRNSYS library for proper CSP plant simulations. To do so, the open access mathematical models [27–30], developed by the U.S National Renewable Energy Laboratory (NREL) for the System Advisor Model (SAM) software was compiled as an add-on library compatible with TRNSYS software.
Mathematical models included in SAM are available as Fortran source codes, and are compatible with TRNSYS code standards, since SAM uses the TRNSYS 16 as a solver engine. It is worth mention that a new water thermodynamics properties subroutine was developed in order to compile those source codes. Hence, in an attempt to expand the TRNSYS fluid database, a new subroutine was implemented using the CoolProp library [31], a freeware code, which includes one hundred and fourteen pure and pseudo-pure fluids as well as fifty incompressible liquids. Although computational time for simulating DSG technologies increases significantly due to the use of equation of state for the thermodynamic properties, the results of the simulation are considerably more accurate. Once the new library was built, the Type’s proforma for each plant component were created, and then the simulation of each plant technology was implemented in the TRNSYS Simulation Studio environment. As the convergence of the simulations are reached, the levelized cost of electricity is calculated using the annual electricity production and economic assumptions (described in section 3), as well as the evaluation of the overall and components efficiencies (i.e. field, receiver and power block). Mathematical models of a direct/indirect two tank TES system have already been implemented for the PTC and CRS-MNS technologies in the SAM codes [27,28]. In contrast, DSG technologies do not have this capability implemented. Nevertheless, a theoretical TES system model [32] is used to simulate the thermal behavior of the LFC and CRS plants with DSG technology. This approach has been considered in previous studies for PTC technology [33] and for CRS-DSG technology [17]. For the present work, a value of 0.9 is considered for the charging/discharge utilization factors – meaning that 10% of the thermal energy is lost during the charge and the same amount during the discharge process – whereas the storage loss factor is evaluated as a function of the fraction of the absorbed energy sent to storage and the charging/discharge utilization factors, as demonstrated by [32]. For the optimization of the CRS heliostat field, the DELSOL3 code [34], developed by the Sandia National Laboratories, was used. The DELSOL is widely used, e.g., design of the PS-10 and PS-20 commercial power towers in Spain [17]. In addition to DELSOL, the PTGEN application described in [27] is used to manage the information about radiation flux incoming to the tower receiver, within the several DELSOL executions. This is the same approach used by SAM software. Hence, the DELSOL code optimizes the heliostat field array, tower and receiver dimension considering some design, financial and cost parameters. After the optimization process, the code generates a

field efficiency matrix and a solar flux distribution map on the receiver as a function of the solar position.
The new TRNSYS simulation models were validated by comparing to original SAM hourly results as well as by comparing to actual data from currently operating systems [35]. The PTC plant was simulated in the TRNSYS environment and in SAM using the Andasol-1 plant data as shown in [35]. Regarding the CRS plant with the MNS receiver, it was simulated considering the Gemasolar plant data as described in [36]. Due to the early stage of the DSG technology, limited data are available. Therefore, the CRS plant with the DSG receiver was simulated considering the characteristics described in [17], while the LFC system is simulated using the Novatec Boiler concept [37,38]. These four systems were used to validate the new TRNSYS library are considered as reference configurations. As mentioned in the last section, the reference plants configurations were simulated considering the meteorological conditions of two selected locations in Chile. The main characteristics of those locations are summarized in Table 1.
Table 1. Main characteristics of the selected locations in South America Site Crucero/CL Pozo Almonte/CL Latitude (º) -22.24 -20.26 Longitude (º) -69.51 -69.77 Altitude (m) 1146 1030 Design point DNI (irradiance, W/m2) 1027 937 Annual DNI (irradiation, kWh/m2/year) 3411 3048 Solar database source [39] [39]
The design point of the direct normal irradiance (DNI) for each location is defined as the irradiance equivalent to the 90% of the cumulative distribution function (CDF), considering the nonzero values of DNI weighted by the cosine of the incident angle. This means that in 90% of the insolation time, a value of DNI lower than the design point should reach the collector mirror.
Since the cost reduction by increasing the plant size (i.e., economy of scale) is a present trend [17,40], five solar field sizes were considered for each plant technology. For the sake of simplicity and for facilitating the comparison of the technologies, the thermal output of the field is used as a size indicator of the plant. Therefore, the sizes considered herein are 50, 100, 200, 400, 800 MWth. Naturally, each technology and location will give rise to different solar field aperture areas, accordingly to the environmental conditions.
The use of TES systems increases the production of electricity, for which it requires larger solar fields in order to supply the extra thermal energy to be stored, allowing a reduction on the value of LCOE and increases plant’s capacity factor. For that reasons, PTC and CRS-MNS plants commonly use large TES systems [2,17,41] with capacities measured in hours of storage. Next generation of DSG plants will probably incorporate improved TES designs in order to increase the capacity factor and dispatchability to the grid. Therefore, a parametric analysis of the power block and TES sizes was performed to assess the effects of these two variables on the LCOE, for a given thermal output size of the solar field. This analysis indicates the different combinations of power block and TES size that minimize the LCOE of the plant. For this purpose, the location of Crucero and a field thermal power of 400MWth were considered. Finally, the LCOE of each configuration was optimized in terms of the TES and power block size, allowing to determine the minimal LCOE value for each technology, location and thermal energy output of the solar field. For this task, the Generic Optimization Program (GENOPT) was used, which can be easily coupled with TRNSYS. Since the problem consists of a multi-dimensional optimization with continuous variables, the GPS implementation of the Hooke-Jeeves algorithm with multiple starting point was adopted, as recommended by [42].
3. Plants configuration Figure 2 shows the simplified scheme of the four power plants analyzed in this work. For PTC and CRS-MNS plants, the simulations considered a standard two-tank indirect and direct configuration,

respectively. Also, conventional Rankine cycles were modeled according to the information about internal components detailed in [27,28]. Both DSG plants were simulated by operating in recirculation mode with a steam separator between the boiler and superheating section. Regarding the LFC plant, the solar field was considered split into boiler and superheater sections. The DSG receiver of the CRS is considered divided into boiler, superheater and reheater sections.
Fig. 2. Schematic diagrams of: (a) PTC indirect two-tank MNS storage; (b) CRS direct two-tank MNS
storage; (c) DSG LFC with a theoretical TES; and (d) CRS with DSG
It is worth noting that only the CRS-DSG commonly present a reheat stage in the Rankine cycle. Detailed information about the configuration of each power cycle used in the simulations of DSG power plants can be found in [29] for LFC-DSG and [30] for CRS-DSG. Because the concept of the TES for a DSG system is still under development, the model adopted in the simulations is theoretical. Therefore the specific configuration of that system was not considered for the optimization process. It is also important to note that all of the reference power plants have a fossil backup system, which can operate in different modes. In addition, for the validation routines, the use of fossil heater is considered according to the available information for both reference plants. However, for the sake of simplicity, this work considers solar-only scenarios, since the degree of hybridization commonly depends on the local policy and not on technical features. .
3.1. Reference systems configuration As mentioned above, the operating data from Andasol-1 [35] and Gemasolar [36] projects are used as the reference configurations for the PTC and CRS-MNS power plants, respectively. Due to the small amount of information available regarding DSG projects, the systems analyzed in [17,29,30] were assumed as the reference configurations for the CRS-DSG and LFC-DSG plants, respectively. Table 2 shows the main parameters of the aforementioned configurations.
3.2. Parametric analysis and optimization The parametric analysis and the optimization process considered the reference configurations as base cases. However, some parameters have been changed to enable the direct comparison between the different technologies, which are listed in Table 3. In addition, all of the configurations were simulated considering a dry cooling system (since the Atacame Desert in northern Chile is characterized by lack of water), while the molten salts mixture is considered as 60% NaNO3/40% KNO3.
TESFossil backup
Rankine cycle
Cooling system
To
wer
Rec
eive
r
SH
RH
Bo
iler
(d) CRS-DSG
Hottank
Coldtank
Fossil backup
Rankine cycle
Cooling system
To
wer
Rec
eive
r
(b) CRS-MNS
TES
Fossil backup
Rankine cycle
Cooling systemL
FC
fie
ld
Fossil Temp. boost
(c) LFC-DSG
Hot
tank
Coldtank
Fossil backup
Rankine cycle
Cooling system
PT
C f
ield
(a) PTC

Table 2. Main parameters of the configuration of the reference plants. PTC CRS-MNS CRS-DSG LFC-DSG
Location Granada/Spain Seville/Spain Seville/Spain Dagget/USA Collector/Receiver Heliostat/Tower height
EuroTrough ET150/Solel UVA3 Schott PTR70
Sener (10.9x10.9m)/ 140m
Sener (10.9x10.9m)/ 170m
Novatec Boiler
Field aperture area (m2) 510120 305401 543437 360547 Solar multiple (-) 1.76 2.5 1.1 1.65 HTF Design Temp. (ºC) 393 565 575/500 (RH) 500 Cycle gross output (MW) 55 19.9 111.15 49.998 Rated cycle efficiency (-) 0.381 0.412 0.43 0.3941 Cycle pressure (bar) 100 100 100/40 (RH) 90 Full load hours of TES (h) 7.5 15 0 0
Table 3. Main parameters adopted in the parametric and optimization analysis.
PTC CRS-MNS CRS-DSG LFC-DSG Field HTF Therminol VP-1 MNS Water/Steam Water/Steam TES media MNS MNS - - HTF Design Temp. (ºC) 393 565 550/500 (RH) 500 Rated cycle efficiency (-) 0.381 0.412 0.412 0.3941 Cycle pressure (bar) 100 100 160/40 (RH) 90
The LFC solar field has different geometries and performances for the boiler and superheater sections, where each loop has twelve modules in the boiler section and six in the superheater section. For the PTC and LFC technologies, the field aperture area is calculated based on the specified field thermal output, and the loop conversion efficiency was estimated at the design condition and DNI point. Therefore, each location presents different values of the aperture area. Finally, for CRS systems the surrounding heliostat field design is performed by the DELSOL code.
3.3. Economics For the evaluation of the LCOE, the definition adopted by [43,44] was used. In addition, an interest rate of 8% and an inflation rate of 4.5% were assumed. The plant availability was defined as 96% and the project lifetime was established in 25 years. Finally, no subsidies were considered since such incentives do not exist in Chile. Regarding the cost of the system, the assumptions presented in Table 4 were adopted for the economic evaluation. The values used in this work are based in those presented by [16,17,45–48]. It is worth mentioning that the cost of PCM TES was adopted for the DSG technologies, this value is based on [17,49] and represent the expected cost in the long term for the industry.
Table 4. Economic parameters considered for the CSP plants. PTC CRS-MNS CRS-DSG LFC-DSG
Direct cost Site improvements (US$/m2) 15 15 15 15 Solar field (US$/m2) 270 180 180 180 Heat Transfer Fluid (US$/m2) 80 0 0 35 TES (US$/kWhth) 30 30 50 50 Fossil backup (US$/kWe) 0 0 0 0 Power block, refPBCe , (US$/kWe) 850 1200 1200 850 Reference power block, refPBP , (MWe) 55 115 115 55 Balance of plant, refBPCe , (US$/kWe) 105 350 0 0 Fixed tower cost, ftowerC , (Mio US$) - 3 3 - Tower scaling factor, towerχ (-) - 0.0113 0.0113 - Receiver reference cost, refrecC , (Mio US$) - 110 80 - Receiver reference area, refrecA , (m2) - 1571 1571 - Receiver scaling factor,recχ (-) - 0.7 0.7 - Contingency (as % total equipment cost) 7 7 7 7 Indirect Cost Land cost (US$/acre) 10000 10000 10000 10000 EPC and owner cost (as % of Direct cost) 11 11 11 11 Sale tax (%) 0 0 0 0
Operation and maintenance O&M fixed (US$/kWe-year of a nameplate power) 65 65 65 35 O&M variable (US$/MWh of the annual electrical output) 3 3 3 3 Estimated gross to net conversion factor (%) 90 87.5 87 95
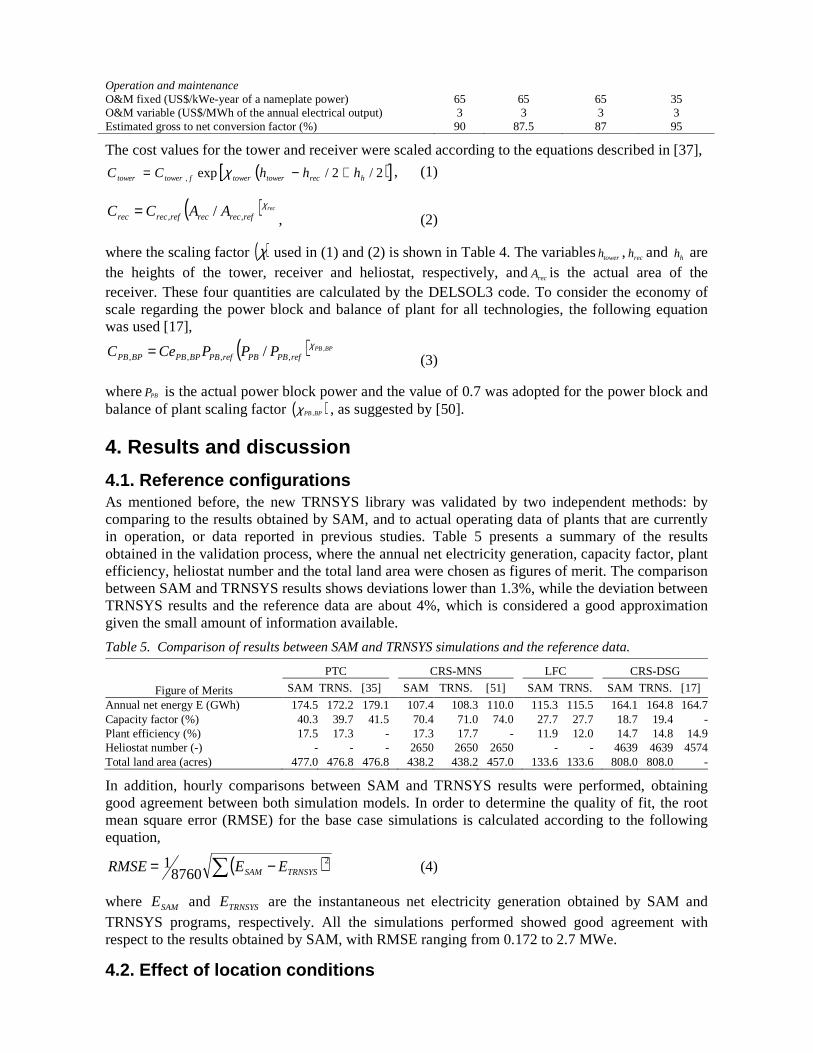
The cost values for the tower and receiver were scaled according to the equations described in [37],
( )[ ]2/2/exp, hrectowertowerftowertower hhhCC +−= χ , (1)
( ) rec
refrecrecrefrecrec AACC χ,, /=
, (2)
where the scaling factor ( )χ used in (1) and (2) is shown in Table 4. The variables towerh , rech and hh are the heights of the tower, receiver and heliostat, respectively, andrecA is the actual area of the receiver. These four quantities are calculated by the DELSOL3 code. To consider the economy of scale regarding the power block and balance of plant for all technologies, the following equation was used [17],
( ) BPPB
refPBPBrefPBBPPBBPPB PPPCeC ,
,,,, / χ= (3)
where PBP is the actual power block power and the value of 0.7 was adopted for the power block and balance of plant scaling factor ( )BPPB,χ , as suggested by [50].
4. Results and discussion
4.1. Reference configurations As mentioned before, the new TRNSYS library was validated by two independent methods: by comparing to the results obtained by SAM, and to actual operating data of plants that are currently in operation, or data reported in previous studies. Table 5 presents a summary of the results obtained in the validation process, where the annual net electricity generation, capacity factor, plant efficiency, heliostat number and the total land area were chosen as figures of merit. The comparison between SAM and TRNSYS results shows deviations lower than 1.3%, while the deviation between TRNSYS results and the reference data are about 4%, which is considered a good approximation given the small amount of information available.
Table 5. Comparison of results between SAM and TRNSYS simulations and the reference data.
PTC CRS-MNS LFC CRS-DSG
Figure of Merits SAM TRNS. [35] SAM TRNS. [51] SAM TRNS. SAM TRNS. [17]
Annual net energy E (GWh) 174.5 172.2 179.1 107.4 108.3 110.0 115.3 115.5 164.1 164.8 164.7Capacity factor (%) 40.3 39.7 41.5 70.4 71.0 74.0 27.7 27.7 18.7 19.4 -Plant efficiency (%) 17.5 17.3 - 17.3 17.7 - 11.9 12.0 14.7 14.8 14.9Heliostat number (-) - - - 2650 2650 2650 - - 4639 4639 4574Total land area (acres) 477.0 476.8 476.8 438.2 438.2 457.0 133.6 133.6 808.0 808.0 -
In addition, hourly comparisons between SAM and TRNSYS results were performed, obtaining good agreement between both simulation models. In order to determine the quality of fit, the root mean square error (RMSE) for the base case simulations is calculated according to the following equation,
( )∑ −= 2
87601
TRNSYSSAM EERMSE (4)
where SAME and TRNSYSE are the instantaneous net electricity generation obtained by SAM and TRNSYS programs, respectively. All the simulations performed showed good agreement with respect to the results obtained by SAM, with RMSE ranging from 0.172 to 2.7 MWe.
4.2. Effect of location conditions
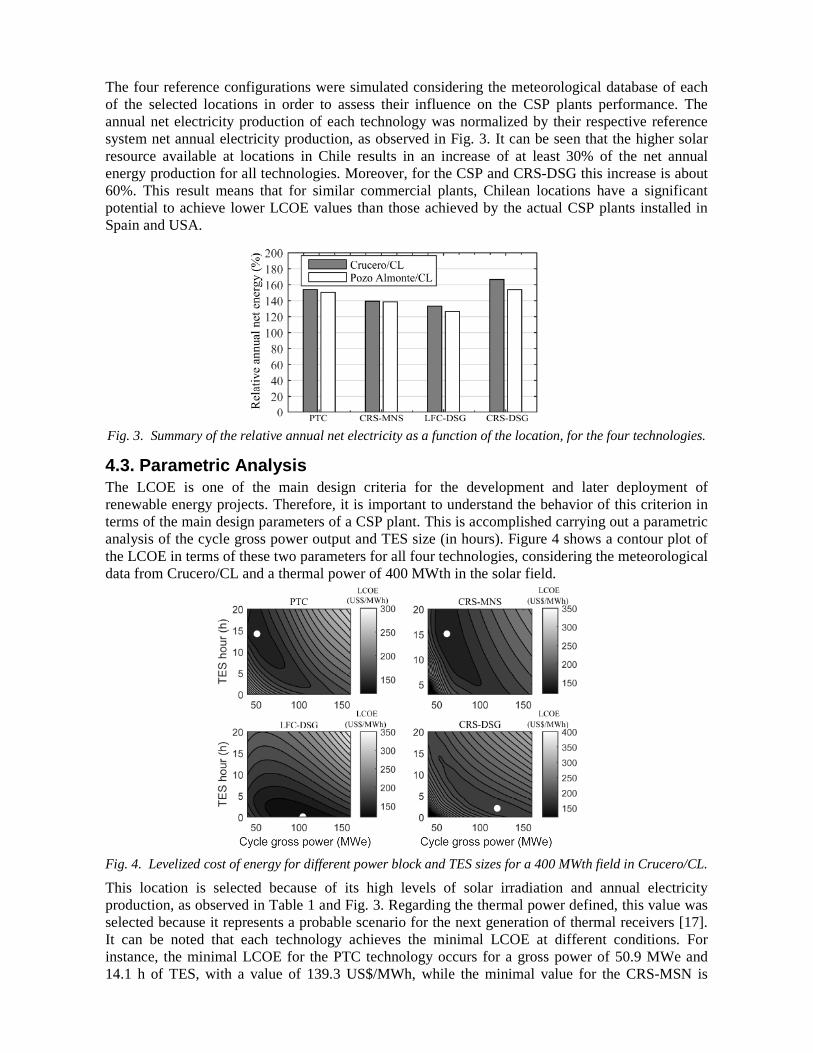
The four reference configurations were simulated considering the meteorological database of each of the selected locations in order to assess their influence on the CSP plants performance. The annual net electricity production of each technology was normalized by their respective reference system net annual electricity production, as observed in Fig. 3. It can be seen that the higher solar resource available at locations in Chile results in an increase of at least 30% of the net annual energy production for all technologies. Moreover, for the CSP and CRS-DSG this increase is about 60%. This result means that for similar commercial plants, Chilean locations have a significant potential to achieve lower LCOE values than those achieved by the actual CSP plants installed in Spain and USA.
Fig. 3. Summary of the relative annual net electricity as a function of the location, for the four technologies.
4.3. Parametric Analysis The LCOE is one of the main design criteria for the development and later deployment of renewable energy projects. Therefore, it is important to understand the behavior of this criterion in terms of the main design parameters of a CSP plant. This is accomplished carrying out a parametric analysis of the cycle gross power output and TES size (in hours). Figure 4 shows a contour plot of the LCOE in terms of these two parameters for all four technologies, considering the meteorological data from Crucero/CL and a thermal power of 400 MWth in the solar field.
Fig. 4. Levelized cost of energy for different power block and TES sizes for a 400 MWth field in Crucero/CL.
This location is selected because of its high levels of solar irradiation and annual electricity production, as observed in Table 1 and Fig. 3. Regarding the thermal power defined, this value was selected because it represents a probable scenario for the next generation of thermal receivers [17]. It can be noted that each technology achieves the minimal LCOE at different conditions. For instance, the minimal LCOE for the PTC technology occurs for a gross power of 50.9 MWe and 14.1 h of TES, with a value of 139.3 US$/MWh, while the minimal value for the CRS-MSN is
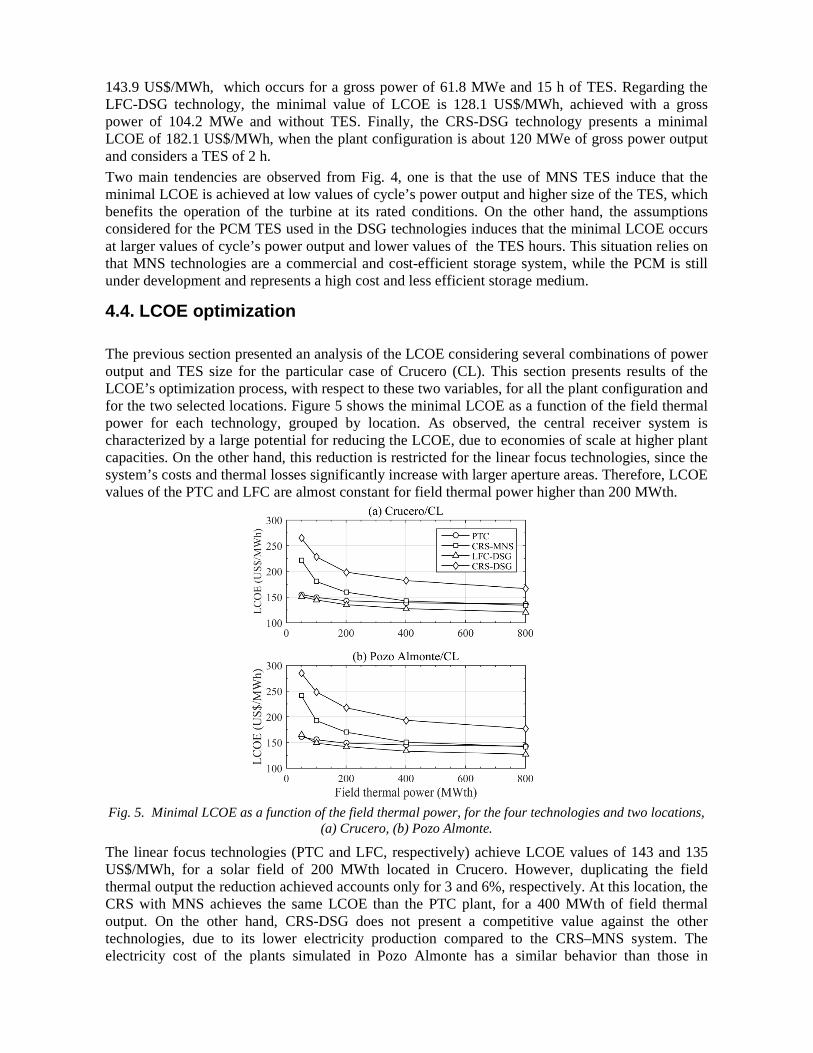
143.9 US$/MWh, which occurs for a gross power of 61.8 MWe and 15 h of TES. Regarding the LFC-DSG technology, the minimal value of LCOE is 128.1 US$/MWh, achieved with a gross power of 104.2 MWe and without TES. Finally, the CRS-DSG technology presents a minimal LCOE of 182.1 US$/MWh, when the plant configuration is about 120 MWe of gross power output and considers a TES of 2 h.
Two main tendencies are observed from Fig. 4, one is that the use of MNS TES induce that the minimal LCOE is achieved at low values of cycle’s power output and higher size of the TES, which benefits the operation of the turbine at its rated conditions. On the other hand, the assumptions considered for the PCM TES used in the DSG technologies induces that the minimal LCOE occurs at larger values of cycle’s power output and lower values of the TES hours. This situation relies on that MNS technologies are a commercial and cost-efficient storage system, while the PCM is still under development and represents a high cost and less efficient storage medium.
4.4. LCOE optimization
The previous section presented an analysis of the LCOE considering several combinations of power output and TES size for the particular case of Crucero (CL). This section presents results of the LCOE’s optimization process, with respect to these two variables, for all the plant configuration and for the two selected locations. Figure 5 shows the minimal LCOE as a function of the field thermal power for each technology, grouped by location. As observed, the central receiver system is characterized by a large potential for reducing the LCOE, due to economies of scale at higher plant capacities. On the other hand, this reduction is restricted for the linear focus technologies, since the system’s costs and thermal losses significantly increase with larger aperture areas. Therefore, LCOE values of the PTC and LFC are almost constant for field thermal power higher than 200 MWth.
Fig. 5. Minimal LCOE as a function of the field thermal power, for the four technologies and two locations,
(a) Crucero, (b) Pozo Almonte.
The linear focus technologies (PTC and LFC, respectively) achieve LCOE values of 143 and 135 US$/MWh, for a solar field of 200 MWth located in Crucero. However, duplicating the field thermal output the reduction achieved accounts only for 3 and 6%, respectively. At this location, the CRS with MNS achieves the same LCOE than the PTC plant, for a 400 MWth of field thermal output. On the other hand, CRS-DSG does not present a competitive value against the other technologies, due to its lower electricity production compared to the CRS–MNS system. The electricity cost of the plants simulated in Pozo Almonte has a similar behavior than those in

Crucero. However, because of the lower levels of DNI, the LCOE for plants in Pozo Almonte are slightly higher than those previously showed for Crucero.
The cycle gross power that minimizes the LCOE is depicted in Fig. 6. It can be noted that the optimal cycle power presents a linear relationship with field thermal power. Moreover, DSG technologies require almost twice of the power block size, which is also observed in Fig. 4. Based on the results presented so far, it can be concluded that the slope of the optimal power block size is a function of the TES size.
Fig. 6. Cycle gross power output that minimizes the LCOE as a function of the field thermal power, for the
four technologies and two locations, (a) Crucero, (b) Pozo Almonte.
Regarding the TES size, the optimal value is almost the same (15 h) for the PTC and CRS-MNS technologies, regardless the location, where the optimal value varies between 11 to 13 hours. For the DSG power plants, a similar behaviour is observed, although the optimal sizes of the TES are significantly lower. About the optimal TES are around 2 and 0.3 hours, for these two systems, respectively.
5. Conclusions This work presented an evaluation of CSP plants performance in selected locations of Chile in terms of the LCOE. The study was carried out using a new TRNSYS library, built using the mathematical models developed by NREL and the CoolProp thermodynamic library. The adopted approach helps the proper assessment of novel concepts and integration alternatives, since it uses the well-kwon modular structure of the TRNSYS. Moreover, the validation shows that the new library has a small deviation compared with the original SAM’s result as well as with data retrieved from the literature. Regarding the potential for CSP plants in the selected locations, the high level of irradiation available in Chile can provide a significant reduction of at least 30% in the LCOE of those plants. Finally, the optimization analysis shown that Chilean locations present an outstanding potential for the deployment of CSP projects, where the linear technologies and the CRS-MNS present values of LCOE below of 150 US$/MWh, for both locations considered.
Acknowledgments The authors gratefully acknowledge financial support from project ANEEL N° 1095166 supported by PETROBRAS/CENPES in Brazil and project FONDECYT N° 1130621 funded by CONICYT in Chile.
References [1] IEA. Technology Roadmap: Concentrating Solar Power. 2010. [2] IEA. Technology Roadmap: Solar Thermal Electricity. 2013. [3] Pavlović TM, Radonjić IS, Milosavljević DD, Pantić LS. A review of concentrating solar
power plants in the world and their potential use in Serbia. Renewable and Sustainable Energy Reviews. 2012 Aug;16(6):3891–902.
[4] Fernández-García a., Zarza E, Valenzuela L, Pérez M. Parabolic-trough solar collectors and their applications. Renewable and Sustainable Energy Reviews. 2010;14(7):1695–721.
[5] Kumar V, Shrivastava RL, Untawale SP. Fresnel lens: A promising alternative of reflectors in concentrated solar power. Renewable and Sustainable Energy Reviews. 2015;44:376–90.
[6] Barlev D, Vidu R, Stroeve P. Innovation in concentrated solar power. Solar Energy Materials and Solar Cells. 2011;95(10):2703–25.
[7] Mills D. Advances in solar thermal electricity technology. Solar Energy. 2004;76(1-3):19–31.
[8] Müller-Steinhagen H, Trieb F, Trieb F. Concentrating solar power: A review of the technology. Ingenia Online. 2004;1–9.
[9] Kalogirou S a. Solar thermal collectors and applications. Progress in Energy and Combustion Science. 2004. 231-295 p.
[10] Tian Y, Zhao CY. A review of solar collectors and thermal energy storage in solar thermal applications. Applied Energy. 2013;104:538–53.
[11] Kuravi S, Trahan J, Goswami DY, Rahman MM, Stefanakos EK. Thermal energy storage technologies and systems for concentrating solar power plants. Progress in Energy and Combustion Science. 2013 Aug;39(4):285–319.
[12] Ho CK, Iverson BD. Review of high-temperature central receiver designs for concentrating solar power. Renewable and Sustainable Energy Reviews. 2014 Jan;29:835–46.
[13] Zarza E, Valenzuela L, León J, Hennecke K, Eck M, Weyers HD, et al. Direct steam generation in parabolic troughs: Final results and conclusions of the DISS project. Energy. 2004;29(5-6):635–44.
[14] Sanz-Bermejo J, Gallardo-Natividad V, Gonzalez-Aguilar J, Romero M. Comparative System Performance Analysis of Direct Steam Generation Central Receiver Solar Thermal Power Plants in Megawatt Range. Journal of Solar Energy Engineering. 2014;136(1):011028.
[15] Montes MJ, Abánades a., Martínez-Val JM. Performance of a direct steam generation solar thermal power plant for electricity production as a function of the solar multiple. Solar Energy. 2009;83:679–89.
[16] Morin G, Dersch J, Platzer W, Eck M, Häberle A. Comparison of Linear Fresnel and Parabolic Trough Collector power plants. Solar Energy. 2012 Jan;86(1):1–12.
[17] Avila-Marin AL, Fernandez-Reche J, Tellez FM. Evaluation of the potential of central receiver solar power plants: Configuration, optimization and trends. Applied Energy. 2013 Dec;112:274–88.
[18] Escobar R a., Cortés C, Pino A, Pereira EB, Martins FR, Cardemil JM. Solar energy resource assessment in Chile: Satellite estimation and ground station measurements. Renewable Energy. 2014;71(2014):324–32.
[19] GeoModel-Solar. Direct Normal Irradiation in Latin América [Internet]. Solar energy maps. 2014 [cited 2015 Feb 15]. Available from: www.solargis.info
[20] Corral N, Anrique N, Fernandes D, Parrado C, Cáceres G. Power, placement and LEC evaluation to install CSP plants in northern Chile. Renewable and Sustainable Energy Reviews. 2012;16:6678–85.
[21] Larraín T, Escobar R. Net energy analysis for concentrated solar power plants in northern Chile. Renewable Energy. 2012 May;41:123–33.
[22] Cáceres G, Anrique N, Girard a., Degrève J, Baeyens J, Zhang HL. Performance of molten salt solar power towers in Chile. Journal of Renewable and Sustainable Energy. 2013;5(2013).

[23] Klein SA. TRNSYS: A transient systems simulation program v.17. 2010. [24] Ho CK. Software and Codes for Analysis of Concentrating Solar Power Technologies. 2008. [25] Schwarzbozl P, Eiden U, Pitz-Paal R, Zentrum D, Jones SA. A TRNSYS Model Library for
Solar Thermal Electric Components ( STEC ): Reference Manual Release 3.0. 2006. [26] Thermal Energy System Specialists. TESS Libs 17 - Component Libraries for the TRNSYS
Simulation Environment. High Temperature Solar Library and Solar Library. 2014. [27] Wagner MJ. Simulation and Predictive Performance Modeling of Utility-Scale Central
Receiver System Power Plants. 2008. [28] Wagner MJ, Gilman P. Technical manual for the SAM physical trough model. 2011. [29] Wagner MJ, Zhu G. A direct steam linear Fresnel performance model for NREL’s SAM.
Proceedings of the ASME 2012 6th International Conference on Energy Sustainability & 10th Fuel Cell Science, Engineering and Technology Conference. 2012.
[30] Neises T, Wagner MJ. Simulation of Direct Steam Power Tower Concentrated Solar Plant. ASME 2012 6th International Conference on Energy Sustainability, Parts A and B. 2012;499–507.
[31] Bell IH, Wronski J, Quoilin S, Lemort V. Pure and pseudo-pure fluid thermophysical property evaluation and the open-source thermophysical property library coolprop. Industrial and Engineering Chemistry Research. 2014;53:2498–508.
[32] Winter C. Solar power plants: fundamentals, technology, systems, economics. Berlin; 1990. 199-214 p.
[33] Montes MJ, Abánades a., Martínez-Val JM. Performance of a direct steam generation solar thermal power plant for electricity production as a function of the solar multiple. Solar Energy. 2009 May;83(5):679–89.
[34] Kistler BL. A User’s Manual for DELSOL3: A Computer Code for Calculating the Optical Performance and Optimal System Design for Solar Thermal Central Receiver Plants. 1986.
[35] NREL. System Advisor Model (SAM) Case Study: Andasol-1. 2013. [36] NREL. System Advisor Model (SAM) Case Study: Gemasolar. 2013. [37] Gilman P, Blair N, Mehos M, Christensen C, Janzou S, Cameron C. Solar Advisor Model:
User Guide for Version 2.0 [Internet]. 2008. [38] NOVATEC. NOVATEC SOLAR [Internet]. 2015 [cited 2015 Feb 1]. Available from:
http://www.novatecsolar.com/ [39] Escobar R, Ortega A, Cardemil JM, Pino A, Cortés C. Chilean Solar Energy Atlas. 1st ed.
IGM, editor. Santiago; 2014. 150 p. [40] Gazzo A, Gousseland P, Verdier J, Kost C, Morin G, Engelken M, et al. Middle East and
North Africa Region Assessment of the Local Manufacturing Potential for Concentrated Solar Power (CSP) Projects. 2010.
[41] Kolb GJ, Ho CK, Mancini TR, Gary JA. Power Tower Technology Roadmap and Cost Reduction Plan. 2011.
[42] Wetter M. GenOpt - Generic Optimization Program - User Manual V2.1.0. 2008. [43] Fraunhofer ISE. Levelized cost of eletricity renewable energy technologies. 2013. [44] IRENA. Renewable energy Technologies: Cost Analysis Series - Concentrating Solar Power.
2012. [45] Turchi C. Parabolic Trough Reference Plant for Cost Modeling with the Solar Advisor
Model (SAM). 2010. [46] Turchi CS, Heath G a. Molten Salt Power Tower Cost Model for the System Advisor Model
(SAM). 2013. [47] Pitz-Paal R, Dersch J, Milow B, Téllez F, Ferriere A, Langnickel U, et al. Development Steps
for Parabolic Trough Solar Power Technologies With Maximum Impact on Cost Reduction. Journal of Solar Energy Engineering. 2007;129(4):371.
[48] Zhu G, Wendelin T, Wagner MJ, Kutscher C. History, current state, and future of linear Fresnel concentrating solar collectors. Solar Energy. 2014 May;103:639–52.

[49] Feldhoff JF, Schmitz K, Eck M, Schnatbaum-Laumann L, Laing D, Ortiz-Vives F, et al.
Comparative system analysis of direct steam generation and synthetic oil parabolic trough power plants with integrated thermal storage. Solar Energy. 2012;86(1):520–30.
[50] SunShot U.S. Department of Energy. SunShot Vision Study. US Department of Energy. 2012;(February):69–96.
[51] NREL. System Advisor Model (SAM) Case Study: Gemasolar [Internet]. 2013. p. 1–6.