assessing the security benefits of a trusted traveler ... · assessing the security benefits of a...
TRANSCRIPT

Assessing the Security Benefits of a Trusted Traveler Program in the Presence of Attempted Attacker Exploitation and Compromise BRIAN A. JACKSON, EDWARD W. CHAN, AND TOM LATOURRETTE
WR-855-RC
May 2011
WORK ING P A P E R
This product is part of the RAND National Security Research Division working paper series. RAND working papers are intended to share researchers’ latest findings and to solicit informal peer review. They have been approved for circulation by RAND National Security Research Division but have not been formally peer reviewed. Unless otherwise indicated, working papers can be quoted and cited without permission of the author, provided the source is clearly referred to as a working paper. RAND’s publications do not necessarily reflect the opinions of its research clients and sponsors. is a registered trademark.


1
AssessingtheSecurityBenefitsofaTrustedTravelerPrograminthePresenceofAttemptedAttackerExploitationandCompromise
Brian A. Jackson, Edward W. Chan, and Tom LaTourrette
RAND Corporation
Introduction
Since September 11, 2001, very significant changes have been made to aviation security in an effort to prevent future terrorist attacks. Additional screening processes have been put in place, new technologies have been deployed, and—as is reflected in the budgets for the aviation elements of the Transportation Security Administration—increased resources, now exceeding $6 billion dollars per year, have been committed to aviation security (Department of Homeland Security, 2011). As these changes have occurred, however, questions have been raised about the basic philosophy of aviation security, which is that security is applied uniformly to all. This argument has been crystallized in public debate with images of “grandmothers getting the same treatment as people who are more likely to be terrorists.” One outcome of this debate has been renewed interest in ways to vary the amount of screening individuals receive with the goals of improving performance and reducing the security burden on (some) travelers. Preferential treatment in screening can be approached in two ways. The first is identifying individuals who may pose more risk than others and allocating more security resources to them, a process usually called profiling. The second is identifying individuals who likely pose less risk than others and allowing them to pass through security with reduced security screening, a process known as trusted traveler programs. There is an extensive literature examining the former,1 but there is much less analysis of the latter (see Government Accountability Office, 2002). Our focus here is on trusted traveler programs.
The basic logic of a trusted traveler program is that security resources can be shifted from travelers who have been confirmed as low risk to the remaining unknown‐risk population. It is assumed that devoting more security resources to the unknown‐risk population would increase the chance of identifying individuals seeking to bring weapons through security checkpoints to stage attacks on aircraft. The key elements of a trusted traveler program are the following:
1. A member of the traveling public applies for the program (which may involve an application fee).
2. A background‐check process verifies that the individual meets the criteria for trusted status. 3. A separate, reduced security‐screening process is applied to trusted travelers when they access
air transportation.2
1 For example, Reddick, 2011; Cavusoglu et al., 2010; McLay et al., 2010; Press, 2010; Press, 2009; McLay et al., 2008; Persico
and Todd, 2005; Caulkins, 2004; Yetman, 2004 (and references therein). 2 Trusted travelers would be issued credentials to access this separate path. Such credentials would likely include biometric
identification to make it difficult for one person to exploit another’s trusted traveler status.

2
To achieve the goals of such a program, the reduction in screening undergone by a trusted traveler would have to free up resources that could be applied to members of the general public. If screening resources are treated as a constant, all resources removed from the “trusted traveler lines” would be redeployed to “general public lines,” affording, for example, more time to scrutinize x‐ray images of their belongings or manually search their bags, more resources to deploy and routinely use explosive‐ detection technologies, or, over the longer term, more funds to develop and deploy new technologies that are more effective than current methods.3
However, the potential for a “fast lane through security” raises serious questions for analysts who have studied terrorist behavior. It is well known that terrorist organizations have long viewed airliners as attractive targets. We also know that they are both adaptive and flexible, with strong incentives and a demonstrated track record of “learning their way around” new security measures and even of using security measures in ways that help them achieve their goals (Jackson et al., 2007). It is obvious that a terrorist group attempting to stage an attack on an airplane would find a security line with reduced screening attractive. How could attackers take advantage of a trusted traveler program? In this paper, we examine three main strategies:
1. Terrorists could apply for and be granted trusted traveler status, which would provide them “authorized access” to that line.
2. Terrorists could identify members of the public who are trusted travelers and dupe or coerce them into carrying weapons through the trusted traveler line.
3. Members of the public who are trusted travelers could become terrorists (either by being actively recruited by such groups or by radicalizing themselves) and stage an attack before their changed risk level was discovered and their trusted traveler status revoked.
If attackers can execute these strategies, the security benefits of a trusted traveler program would be reduced. Such concerns have been a significant roadblock to the implementation of a true trusted traveler program—one in which security intensity for trusted travelers is significantly reduced—in the United States.4
Our analysis allowed us estimate the security performance of a trusted traveler program in the presence of attacker attempts to compromise it. We found that, although these attempts would reduce the maximum potential security benefits of a program, they would not eliminate those benefits in all circumstances. In the remainder of this paper, we present our analysis, describing the simple model of a trusted traveler program that we used, explaining both how different attacker strategies reduce the security benefits of the program and policies to hedge against those strategies, and providing a general discussion of how these strategies could affect program costs and the likely cost‐benefit balance of such a program.
3 Note that there is no inherent reason why screening resources would have to remain constant under such a program. If
screening resources are not held constant, freed resources could be pulled out of screening and used for other purposes to produce a net cost reduction while holding security levels constant.
4 See the testimony of Thomas Blank, and subsequent discussion, in U.S. House of Representatives, 2005. Existing programs such as CLEAR provide access to different security lines for members, but individuals receive the same screening in those lines.
3
ModelingaTrustedTravelerProgram
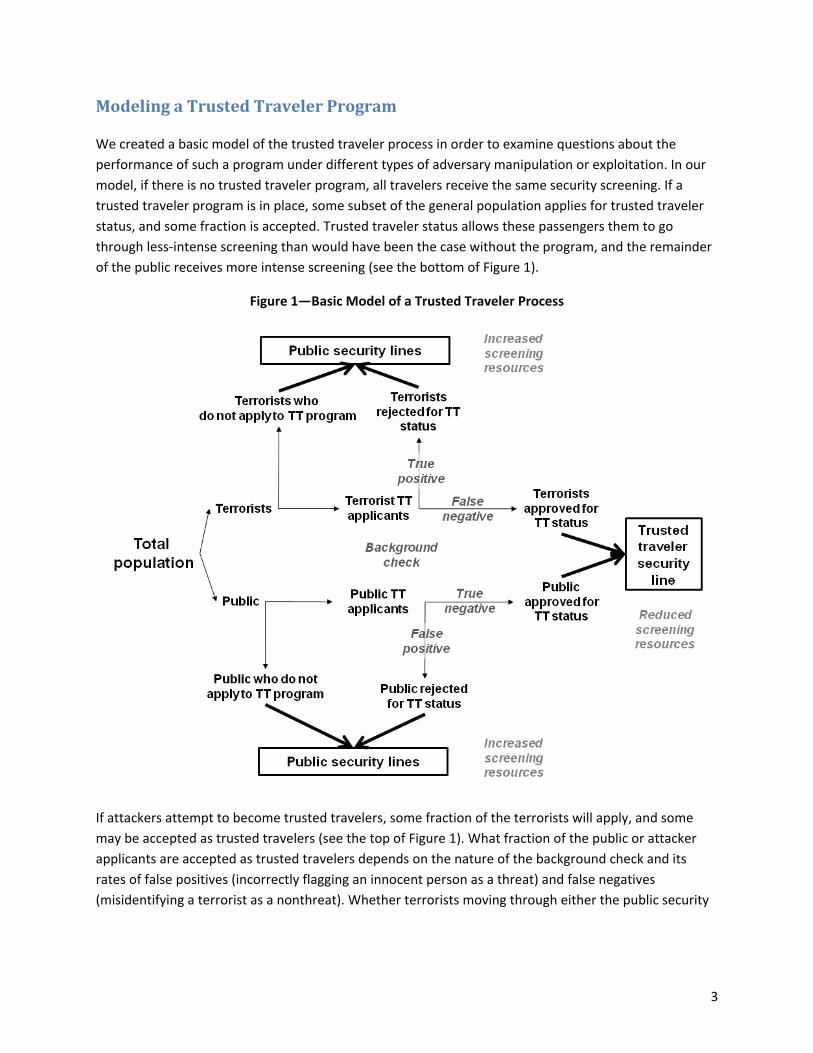
We created a basic model of the trusted traveler process in order to examine questions about the performance of such a program under different types of adversary manipulation or exploitation. In our model, if there is no trusted traveler program, all travelers receive the same security screening. If a trusted traveler program is in place, some subset of the general population applies for trusted traveler status, and some fraction is accepted. Trusted traveler status allows these passengers them to go through less‐intense screening than would have been the case without the program, and the remainder of the public receives more intense screening (see the bottom of Figure 1).
Figure 1—Basic Model of a Trusted Traveler Process
If attackers attempt to become trusted travelers, some fraction of the terrorists will apply, and some may be accepted as trusted travelers (see the top of Figure 1). What fraction of the public or attacker applicants are accepted as trusted travelers depends on the nature of the background check and its rates of false positives (incorrectly flagging an innocent person as a threat) and false negatives (misidentifying a terrorist as a nonthreat). Whether terrorists moving through either the public security

4
lines5 or a trusted traveler line are detected during screening (e.g., their concealed weapons are identified in a bag x‐ray, explosives residues are detected on their person) depends on the effectiveness of each screening process. Public information on the baseline effectiveness of current screening is fragmentary, and estimates of the probability of a threat being detected through screening varying widely. The effectiveness of current screening efforts is widely acknowledged to be less than perfect, however.6
Whatever this “baseline probability of detection” is, we assume that, upon implementation of a trusted traveler program, that probability will, as a result of the redeployment of resources, increase for the general public line and decrease for the trusted traveler line. If more resources are removed from the process of screening trusted travelers (e.g., the screening intensity is cut in half or—in the extreme case—entirely eliminated), more resources are freed up to improve performance in the screening of others. In our analysis, we held total screening resources constant, so any resources freed up from the trusted traveler line are applied to improving screening in the general public line.
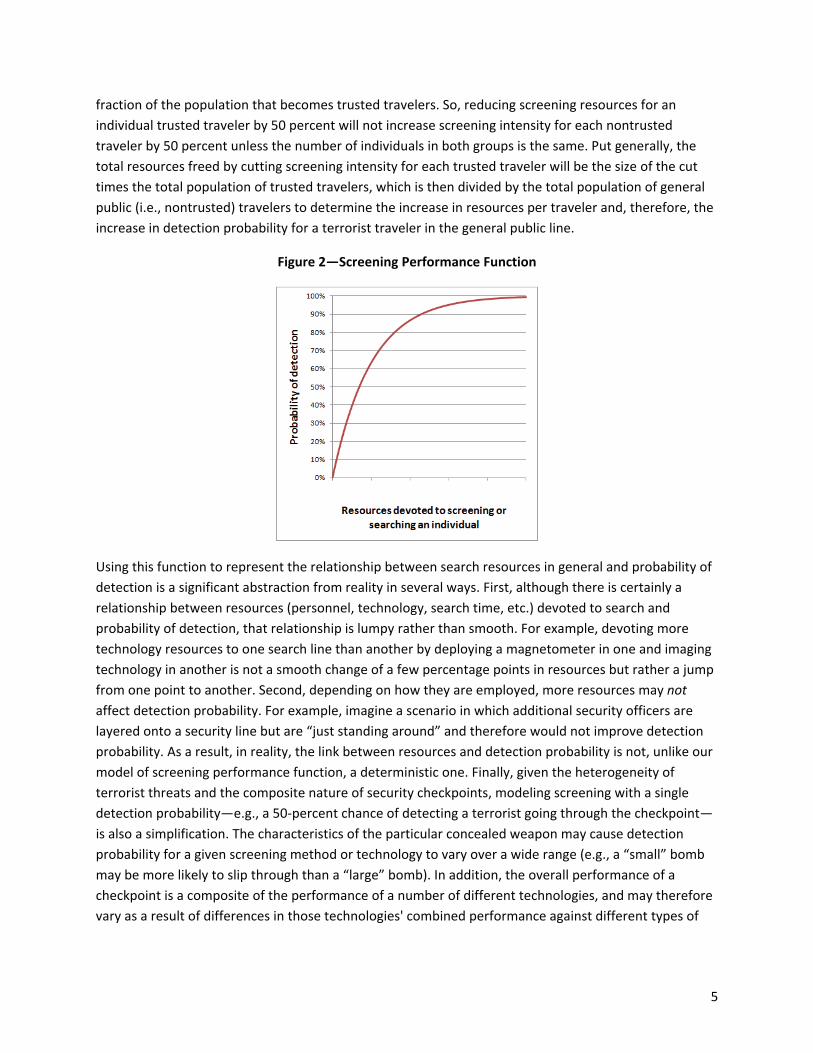
Though it is intuitive that adding more resources to screening will improve performance and that removing some resources will reduce it, a mathematical representation of that relationship is needed to model different implementations of a trusted traveler program. The operations research literature, where work has been done for many years on the “theory of search,” which relates the probability of detecting something to the time and effort devoted to finding it, was useful in developing this representation. We used a function described by Koopman (1956) for how probability of detection relates to search time (P(t) = 1‐e‐γt, where γ is a constant and t is the time spent searching) and used that equation in a more general way, treating the time variable as a more generic measure of the resources devoted to screening.
The nature of this function produces a probability‐of‐detection curve that increases rapidly from zero but then asymptotes as it approaches 100 percent, showing that diminishing returns set in as search resources are increased. (Figure 2 shows the resulting curve, where γ has been set to 1.7) Experimental studies of relevant search processes (e.g., how the time spent reviewing a baggage x‐ray relates to the probability of detecting a threat) produce similar curves (e.g., Ghylin et al., 2006; Drury et al., 2006). How probability of detection changes as resources are increased or decreased depends on the baseline performance (i.e., whether the probability falls on a steeper or flatter portion of the curve). From a baseline start point, resources for trusted travelers are cut (moving downward on the curve to a reduced probability of detection), and those resources are allocated to general public lines (moving upward on the curve to a higher probability of detection). This redistribution affects the resources devoted to screening each individual traveler in each line, with the exact change dependant on the
5 In our basic model, terrorists who are “detected” when they apply to a trusted traveler program are returned to the general
population. This is consistent with a background check that tries to identify “risky individuals” but does not identify terrorists with certainty. We revisit this issue briefly later in the paper.
6 For example, de Vries, 2002; Mosk et al., 2010; Linos et al., 2007; Elias, 2009; Office of the Inspector General, Department of Homeland Security, 2008.
7 Different values of γ change curve shape over defined numerical ranges of screening resources, but, if resources are treated relatively and a specific real resource level is not linked to a set resource level, the choice of γ does not affect analysis results. This is addressed later when we discuss modeling variables.
5
fraction of the population that becomes trusted travelers. So, reducing screening resources for an individual trusted traveler by 50 percent will not increase screening intensity for each nontrusted traveler by 50 percent unless the number of individuals in both groups is the same. Put generally, the total resources freed by cutting screening intensity for each trusted traveler will be the size of the cut times the total population of trusted travelers, which is then divided by the total population of general public (i.e., nontrusted) travelers to determine the increase in resources per traveler and, therefore, the increase in detection probability for a terrorist traveler in the general public line.
Figure 2—Screening Performance Function
Using this function to represent the relationship between search resources in general and probability of detection is a significant abstraction from reality in several ways. First, although there is certainly a relationship between resources (personnel, technology, search time, etc.) devoted to search and probability of detection, that relationship is lumpy rather than smooth. For example, devoting more technology resources to one search line than another by deploying a magnetometer in one and imaging technology in another is not a smooth change of a few percentage points in resources but rather a jump from one point to another. Second, depending on how they are employed, more resources may not affect detection probability. For example, imagine a scenario in which additional security officers are layered onto a security line but are “just standing around” and therefore would not improve detection probability. As a result, in reality, the link between resources and detection probability is not, unlike our model of screening performance function, a deterministic one. Finally, given the heterogeneity of terrorist threats and the composite nature of security checkpoints, modeling screening with a single detection probability—e.g., a 50‐percent chance of detecting a terrorist going through the checkpoint—is also a simplification. The characteristics of the particular concealed weapon may cause detection probability for a given screening method or technology to vary over a wide range (e.g., a “small” bomb may be more likely to slip through than a “large” bomb). In addition, the overall performance of a checkpoint is a composite of the performance of a number of different technologies, and may therefore vary as a result of differences in those technologies' combined performance against different types of

6
threats. That said, the abstraction is useful for crafting an understandable model, and we return later in the paper to some of the implications of the simplification for trusted traveler program design.
The other central element of the trusted traveler program is the nature of the background‐check process, which must distinguish threatening individuals from nonthreatening members of the public. As shown in Figure 1, any such process will have the potential for false positives and false negatives. False negatives create the potential for terrorists to become trusted travelers, and false positives kick “innocent people” out of the program. False negatives obviously reduce security, but false positives do as well, since denying innocent individuals trusted traveler status reduces the amount of resources that can be freed up to improve screening performance.8 The trade‐off between these two parameters is related to the characteristics of the background check. For example, compared with a less extensive (and less expensive) background check, which might need to reject many innocent people to achieve a reasonable probability of also rejecting most potential terrorists, a more extensive (and expensive) background check would likely detect a much larger fraction of terrorists (i.e., a lower false negative rate) and flag fewer innocent people as potential terrorists (i.e., a lower false positive rate). The performance of detection processes is often represented by a receiver operating characteristic (ROC) curve, which relates the true detection probability (1 minus the false negative rate) to the false positive rate. Some notional ROC curves are shown in Figure 3.
Figure 3—Exemplary Receiver Operating Characteristic Curves
Better (and, for the purposes of our analysis, likely more expensive) background checks would have ROC curves more like the solid black line, where a relatively high true positive rate could be attained before
8 A high false rejection rate could also affect the willingness of individuals to apply for the program.

7
the false positive rate begins to increase. Poorer background‐check processes would have lower ROC curves (like the dashed line) and would require tolerating higher numbers of false positives to produce higher true positive rates. The straight, dotted diagonal line represents a useless background check that provides no ability to identify a threat individual against the background of the general public. There is an extensive literature addressing the development of ROC curves for different models of threat behavior, but we could identify no consensus about what the curves would look like for particular types of background checks. For example, this type of analysis has been applied to the use of the polygraph for lie detection, for models of predicting recidivism of criminals, and in other applications.9
DemonstratingtheModelWithoutAdversaryExploitationorCompromiseHow this type of simple model functions and what results it can produce are easiest to illustrate through a simple example. In this section, we demonstrate how different levels of participation in a trusted traveler program and different levels of reduction in the resources devoted to screening those travelers affect screening performance without the complicating factor of adversaries attempting to compromise the program. Because all of our analyses hold total security resources constant, all resources removed from trusted travelers are devoted to screening the remainder of the public. This therefore illustrates the maximal effect of such a resource reallocation. Though screening burdens on trusted travelers are reduced in such a scenario because screening intensity decreases, the total screening burden on the entire population remains constant.10
Given some baseline performance value—for example, an assumption that screening as implemented is 60‐percent effective in detecting attackers who attempt to penetrate security—we can examine how that effectiveness level changes for the trusted traveler and the general public screening lines as the resources devoted to screening each trusted traveler are cut by some percentage (e.g., in half) and as an increasing fraction of travelers (e.g., half) are accepted into the program. Figure 4 illustrates this specific case, showing how detection probabilities in each line are affected. In this case, the substantial fraction of the population participating in the program combined with the significant reduction in screening produces a large change in detection probabilities in both lines.
Figure 4 also clearly shows that the security benefit of resource reallocation from trusted travelers to the general public depends on where current baseline performance falls on the screening‐performance curve. If the baseline performance is on the steepest portion of the curve, the increase in resources for the general public has large benefits in performance improvement and comparable drops in the probability of detecting threats in the trusted traveler line. If the baseline performance is nearer to the shoulder or flattened portion of the curve, changes in performance are more modest. 9 A wide variety of examples of these types of analyses are available in the literature. For illustrative examples, see Richardson
et al, 2007; Dow et al., 2005; United States Sentencing Commission, 2004; National Research Council, 2003. 10 Viewed in its most simple way, this moves the security burden away from trusted travelers and onto everyone else. For
example, take the basic case in which “screening resources” is just time spent searching an individual and his or her bags. The time not spent on trusted travelers would be spent on searching others, so the total screening burden would be constant. If a trusted traveler program produced a very significant disparity in screening burden between the two populations, people might argue against the program on fairness grounds. Such objections and their potential effect on program viability are outside the scope of this analysis. In the case of more‐complex options—i.e., where screening resources are not just time but also financial resources for better technology—there could be a net increase or decrease in screening burden on the public.

8
Figure 4—Illustration of Changes in Screening Performance for a Case in Which 50 Percent of Travelers Are Trusted and Their Screening Intensity Is Reduced by 50 Percent
0%
10%
20%
30%
40%
50%
60%
70%
80%
90%
100%
0 1 2 3 4 5
Prob
ability of detection
Resources devoted to screening or searching an individual
60% baseline detection probability
≈37% detection probability in trusted traveler line
≈75% detection probability in public line
Figure 5 summarizes the results of a set of similar analyses that vary the baseline security performance and trusted traveler participation rate. We compare two levels of screening reduction for trusted travelers: a smaller one (a 25‐percent cut in screening resources) and a much larger one (a 75‐percent cut in screening resources). As Figure 4, shows, adding resources to the screening of nontrusted travelers pushes detection probability for that population up the curve from the baseline level, and, as a result, more attackers are detected going through security. Absolute improvements in security performance are greatest when the baseline detection probability is lower; this is because the slope of the curve driving the benefit of adding additional resources is steeper there.
Given an assumed number of terrorists hiding among the general population and a judgment about which security line the terrorists are located in, detection probability values such as those shown in Figure 5 can be converted to numerical values of “terrorist leakage through security.” For this simple demonstration of the model, assume that no terrorists attempt to enter the trusted traveler program (the results of assuming otherwise are treated in detail in the reminder of the paper). If a small number of terrorists (e.g., ten) seek to penetrate security in a given period (e.g., annually), then simple application of the detection probabilities under different trusted traveler cases can produce leakage estimates. In the case of a baseline case in which detection probability is 60 percent, four of those ten attackers would penetrate security. However, if 50 percent of the population is trusted and screening of those individuals is cut by 75 percent (shown by the far right grey triangle on the grey, sixty percent

9
baseline line in Figure 5), detection probability increases to 80 percent. In this case, only two of those attackers penetrate security, yielding a net security gain of two fewer security penetrations. Representing the outcomes of different trusted traveler programs in terms of net attacker leakage becomes more convenient than discussing detection probabilities when attacker compromise and exploitation are considered because, in the compromise and exploitation cases, attackers may penetrate security through either the public or trusted traveler lines and because the fundamental policy concern is whether overall security performance with a trusted traveler program is better than what is possible under baseline conditions.
Figure 5—Screening Performance Improvement in Public Security Lines as the Trusted Traveler Population Increases and as Screening Intensity for Trusted Travelers Is Reduced
40%
45%
50%
55%
60%
65%
70%
75%
80%
85%
90%
95%
100%
0% 10% 20% 30% 40% 50%
Prob
ability of detecting
a te
rrorist
in th
e gene
ral pub
lic screen
ing lin
e
Fraction of public participatingin the TT program
80% baselinewith▲ 75% resource reductionX 25% resource reduction
60% baselinewith▲ 75% resource reductionX 25% resource reduction
40% baselinewith▲ 75% resource reductionX 25% resource reduction
This simple example provided in Figure 5 is intended to illustrate the best‐case security effects of a trusted traveler program by showing how detection probability might increase with the concentration of screening resources. One limitation of this type of model, however, is that it examines only one portion of a security system or one path attackers might take. The increased detection probabilities shown in the figure would only translate directly into a security benefit if attackers still chose to go through the screening line and were therefore caught at a greater rate than before. This assumes that, even if faced with a greater than 90‐percent chance of being detected (the top triangle in Figure 5), terrorists would still attempt to penetrate passenger screening rather than selecting another way to get a weapon onto a

10
plane, attacking the airport itself, or choosing another target entirely. Viewed at the level of an individual attacker, this essentially assumes away a class of attacker strategic behaviors that we know terrorist attack planners pursue. That is, if the probabilities involved were known and it was clear that success was unlikely, diversion to an attack path or target outside the model would be the rational choice.
Though such simplifications are inherent in any model that examines one target set or one part of a security system in isolation, they do not necessarily eliminate the utility of such models for examining different program or design options. Instead of thinking about how a change in security might affect one attacker’s decision, instead consider security performance over time, where there will be some “flow” of threats that are periodically encountered by security. Though improved checkpoint screening might deter some attackers into choosing other options, there is enough heterogeneity in the terrorist threat that it is unlikely that that all potential attackers would do so. However, the fact that some would means that, as discussed earlier, estimates based on this type of deterministic model of how a trusted traveler program might affect the number of attackers penetrating security are best‐case numbers. In spite of that reality, such estimates are nonetheless useful for internal comparisons within the modeled options and programs.
SummaryofKeyVariablesandCasesforOurAnalysisofAdversaryExploitationorCompromiseofaTrustedTravelerProgramThe illustrative analysis described in the previous section demonstrates the maximum security benefits of a trusted traveler program—how concentration of resources on individuals of unknown risk can increase the probability of detecting threats within that group. But, if adversaries seek to gain access to the trusted traveler line, or if they compromise trusted travelers to support their attacks, such behaviors—if successful—will cut into those benefits. The key policy concern is whether there will still be a net positive security benefit of such a program in spite of compromise and exploitation efforts.
To answer that question, modeling efforts must include the four basic program parameters introduced in the previous section:
• baseline detection probability at screening checkpoints • fraction of the population who applies to the trusted traveler program • reduction in screening of trusted travelers • the relationship between resources devoted to screening and detection probability.
However, to address how benefits change when attacker behavior is considered, other key variables must be included:
• the number of terrorists attempting to penetrate security in a given period • the fraction of terrorists who apply to the trusted traveler program • the characteristics of the background check that determines whether the terrorists who apply
are accepted to the program (i.e., the paired probabilities of successfully rejecting terrorists but rejecting some innocent people in the process).

11
Table 1—Variables and Cases for Analysis of Adversary Compromise and Exploitation of a Trusted Traveler Program
Parameter Cases Examined
Notes
Baseline detection probability for screening
40%, 60%, 80%, 90%,
95%
For this analysis, we make no assumptions about how these baseline detection probabilities would be achieved (i.e., what combination of personnel, types of technology, and so on result in a net X% chance to detect an attacker attempting to go through a security checkpoint).
Fraction of the traveling population applying to the trusted traveler program
0%, 5%, 25%, 50%
Because background checks involved in applying to a trusted traveler program will have a false positive rate, not all public applicants to the program will be accepted.
Reduction in screening for trusted travelers
0%–75%, in steps of 1%
The percentage reduction in the level of resources that produces the original baseline detection probability.
75% is set as the maximum possible reduction because innocent travelers may be coerced by adversaries.
Relationship between resources devoted to screening and detection probability
P(t) = 1–e‐r The equation described earlier, with γ = 1 and time substituted by “r” as a generic, unitless measure of resources devoted to screening; used only for calculating change in probability of detection from baseline.
Different values of γ change the curve shape over a fixed range of resource values, but, because we conducted this analysis using resources as a unitless, relative measure (i.e., without linking an absolute resource level to a specific probability of detection), choosing a different γ would not change the analytical results.
Number of terrorists attempting to penetrate security in a given period
100 terrorist travelers annually
Because our analysis focuses on detection probability when passing through security, multiple trips taken by a single individual are counted separately. A recent estimate of the total number of trips taken annually is 625 million.11
We used the high value of 100 terrorist travelers (e.g., 100 terrorists taking a single trip through security, ten terrorists taking ten trips each through security, etc.) to limit the effect of “rounding to a whole terrorist” when presenting results, which could have masked differences among cases.
The period of one year was used because enrollment in a trusted traveler program would presumably occur on an annual basis.
Fraction of terrorists applying to the trusted traveler program
0%, 5%, 25%, 50%, 100%
Cases were chosen to bracket rates of terrorist application to the program from very high to relatively low.
Background‐check characteristics (true positive rate/false positive rate)
A. 90%/10% B. 70%/20% C. 50%/20%
The three cases represent inexpensive (low true positive/high false positive), intermediate (higher true positive/high false positive), and expensive (highest true positive/low false positive) background checks. Considering how to implement a real program would require further examination of what types of background checks produce what levels of performance on each variable. Note that a high false positive rate could threaten the political viability of a trusted traveler program due to rejection of a large number of innocent travelers.
11 This figure is based on average of estimates of annual emplaned passengers in 2010 (619 million) and 2011 (630 million).
These values are from the Research and Innovative Technology Administration, Bureau of Transportation Statistics, n.d. (as of April 20, 2011).

12
Because we are examining a notional trusted traveler program rather than an existing program whose characteristics are already defined, values for these various parameters must be estimated. Even data on current security performance are not available, as discussed earlier. As a result, to examine a trusted traveler program, we examined performance over a range of values for each of the variables, which are summarized in Table 1. In the subsequent sections, we examine how these variables affect the maximum benefits of a trusted traveler program and how they shape the threat to those benefits posed by different attacker adaptations and exploitation paths.
HowWouldTerroristAdaptationandExploitationPathwaysReducetheSecurityBenefitsofaTrustedTravelerProgram?
Attacker exploitation causes the net security benefits of a trusted traveler program to fall below the maximum potential benefits. Depending on how effective exploitation efforts are (e.g., depending on whether terrorists routinely gain trusted traveler status), such a program might actually produce worse security outcomes than would having no program at all. Because it is reasonable to assume that some attackers would attempt to exploit such a program, policymakers need to understand how different adversary behaviors reduce net security benefits, under what conditions net benefits disappear entirely, and how to design trusted traveler programs to ensure net benefits over baseline security performance.
Though the effect of attempted attacker exploitation on a trusted traveler program depends on all of the parameters in Table 1, for decisionmakers, there are four central variables: two over which policymakers have control over and must make choices about, and two that result from choices made by others (but may be influenced by policy and program design). Those four variables are (1) the amount by which screening on trusted travelers is reduced, (2) the nature of the background check or vetting required to become a trusted traveler, (3) the fraction of terrorists who choose to apply to the program, and (4) the fraction of the public who choose to apply to the program. The other variables (baseline security performance, number of terrorists in the population, and how resource reallocation affects screening performance) are important and do affect outcomes, but they are exogenous to program design. The four central parameters are illustrated in Figure 6 in a basic map to which we return periodically in the remainder of the paper when we wish to graphically summarize elements of the analysis. In this section, we structure our discussion around these key variables, their effect on performance, and how they interact with one another.
In the introduction, we described three paths through which attackers might exploit a trusted traveler program: becoming trusted travelers themselves, coercing or duping members of the public who are trusted travelers, or recruiting individuals who are trusted travelers (or having trusted travelers radicalize on their own). Because its effects on program benefits and available responses are the most straightforward, the issue of terrorist coercion of members of the public is considered first. We then turn the remaining two pathways (terrorists becoming trusted travelers and recruitment/radicalization after attaining trusted traveler status).

13
Figure 6—Key Parameters Affecting Performance of a Trusted Traveler Program in the Presence of Attempted Adversary Compromise and Exploitation
Screening reduction for trusted travelers
Nature of the background check for
acceptance as a trusted traveler
Fraction of terrorists applying to the TT
program
Public participation in the TT program
CHOICES MADE BY POLICYMAKERS: CHOICES MADE BY OTHERS:
CoercingorDupingTrustedTravelersIn past terrorist conflicts, individuals who are not actually members of the terrorist group have been used in attack operations. One security question familiar to airline passenger for many years—“Has anyone given you, the traveler, anything to take with you on the flight?”—was the result of terrorists having duped unsuspecting individuals into carrying explosive devices through security.12 Terrorists have also used coercion to force unaffiliated individuals to participate in attacks. For example, they have convinced individuals to drive vehicle bombs to targets by taking their families hostage and threatening them with harm if they did not comply.13 Each of these strategies might be used by attackers seeking to bring weapons through security via a trusted traveler screening line.
Though this attacker pathway appears very problematic for those designing a trusted traveler program, in practical terms, it affects only the decision about how much screening can be reduced for trusted travelers.14 Addressing this potential adaptation pathway likely requires that a certain minimum “floor” of screening must remain in place to provide both some probability of detecting weapons carried by coerced individuals and an opportunity to detect people exhibiting signs that suggest they might have been coerced.15 How much residual security is needed to achieve a reasonable probability of detecting 12 For example, there is the case of Nezar Hindawi, who, in 1986, hid a timed explosive in the hand luggage of his girlfriend
without her knowledge (BBC, n.d.). 13 For example, the Provisional Irish Republican Army coerced individuals to deliver weapons through security cordons as a way
to circumvent access requirements (e.g., they selected individuals with legitimate access to a targeted facility) or security force information on known PIRA operatives (see, Jackson et al., 2007)
14 Not eliminating all screening for trusted travelers would also minimize some potential shifts in attacker decisionmaking. With no screening, entering the trusted traveler line would be much more attractive and resulting security breaches would likely be much more serious. In a “no screening” case, attackers would have much more freedom regarding the size and type of weapons they could draw on for aircraft attacks since they would have no risk that those weapons would be discovered when carried through the trusted traveler line.
15 A controversial element of current security measures is behavioral detection officers (BDOs), whose mission is to identify individuals exhibiting signs of stress that could indicate that they pose a risk to aviation security. Significant questions have

14
such situations is an empirical question. For the basis of our analysis, our floor for screening trusted travelers is 25 percent of the intensity of screening applied to the general public; that is, screening cannot be reduced more than 75 percent. In essence, the need to maintain this hedge of security carves off a slice of the potential benefits from a trusted traveler program. Our choice of a 25‐percent floor for screening reduction, though arbitrary, appears to us to be a reasonable approximate value for capturing this effect in our analysis. If, in reality, this floor should be higher or lower, then the potential security benefits of the program would be somewhat higher or lower, respectively, than those discussed in this paper.
Considering the interaction of this variable with the other variables, a limit on how much screening can be reduced could affect both terrorist and public decisions about participating in the program. For attackers, residual screening reduces the potential benefit of becoming a trusted traveler. A similar benefit reduction applies to members of the public, however, meaning that the level of residual screening could reduce the public’s willingness to participate. Residual screening of trusted travelers could be varied over time (and that variation could include random elements), which could potentially allow a lower absolute floor while decreasing the predictability of screening burden for trusted travelers. Figure 7 graphically illustrates these trade‐offs among the different parameters.
Figure 7—Linkage Between the Screening Reduction Choice and the Other Parameters that Affect the Net Security Performance of a Trusted Traveler Program
CHOICES MADE BY POLICYMAKERS: CHOICES MADE BY OTHERS:
Ideal = low application rate
Ideal = high application rate
Ideal = large to produce
greatest potential benefit
Con: more attractive to adversaries
Pro: more attractive to
public
Screening reduction for trusted travelers
Nature of the background check for
acceptance as a trusted traveler
Fraction of terrorists applying to the TT
program
Public participation in the TT program
Though this potential route of compromise may appear to have been created by the possibility of a trusted traveler program, it is important to note that such a route for compromising security exists now, although to a more modest extent. Because there are already populations who go through reduced or
been raised about the ability of these officers to detect terrorists (National Research Council, 2008). BDOs might be more effective in the specific task of detecting cases of coercion, since individuals who were coerced would have no specialized training or skills in concealing their stress.

15
no screening (e.g., pilots, some airport workers), those individuals could be duped, coerced, or bribed by attackers to transport weapons under existing security models.16
TerroristsSeekingtoBecomeTrustedTravelersFor terrorist attackers to become trusted travelers, there are two separate steps: First, they must choose to apply to the program and, second, having done so, must pass the background check. If terrorists do not apply (the first branch point for the terrorist population in Figure 1), then the effect of this exploitation pathway will be reduced. Though any background check will be designed to identify and exclude risky individuals from the program, all realistic background checks will have a less‐than‐perfect true positive rate, meaning that, if they do apply, some number of attackers will gain trusted status. Those attackers will still undergo the reduced trusted traveler screening, but attackers gaining access to that route is nonetheless a concern.
To examine this issue, we analyzed security outcomes just as we did above but added the potential for terrorists to attempt to join the trusted traveler program. We modeled how net security performance—total number of terrorists penetrating security, whether through the public or trusted traveler lines—varied across the cases described in Table 1.17 In the case of this exploitation pathway, net security benefits are sensitive to variation in all four of the key parameters in Figure 6, with different sensitivities that have different implications for program design. As a result, we examined how the effect of decisions on the two variables within policymakers’ control changed across all cases of the other two variables. In this analysis, there was no consequence for a terrorist applying and being rejected from the program: He or she was simply “thrown back into the pool” of the general population and thus subject to the security measures faced by nontrusted travelers.
TheImplicationsofScreeningReductionChoiceonNetSecurityBenefits,GivenAttackerExploitationAcross all the cases we analyzed, terrorist application to the trusted traveler program predictably reduces the program’s security benefits by reducing the amount of screening that can be reduced for trusted travelers. In some circumstances, attacker exploitation makes the program nonviable no matter what decision is made regarding screening reduction for trusted travelers. In other cases, all screening reductions produce better results than baseline performance, though exploitation might substantially erode performance improvement compared with performance in its absence. Other cases fall in between, with the outcome highly dependent on the exact screening level employed.
To illustrate these results, we use an intermediate case, where baseline security performance is set at 80 percent and the background check used to identify whether a potential trusted traveler is a terrorist has a 70‐percent chance of correctly identifying and excluding a terrorist applicant (but also denies trusted status to 20 percent of nonterrorist applicants). We then examined all of the cases in terms of the
16 For example, there are recent reports of Federal Air Marshals allegedly carrying materials through security and of airport
workers being willing to accept bribes to place luggage onto flights (Brown, 2011; Grabell, 2008). 17 Note that this assumes that both the chance of attack success and the type of attack selected will be the same, regardless of
whether the terrorist is in the trusted traveler line or the public line. This assumption is supported by the fact that trusted travelers would be subject to some screening.

16
variables in Table 1, varying the fraction of the public applying to be trusted travelers, the fraction of terrorists applying to the program, and the amount that screening was reduced for trusted travelers.
The results of this analysis demonstrate that the parameters interact to produce four different types of situations. Figure 8 presents results for an example of each type, which differ in terms of both the overall potential size of the security benefit and how that benefit varies based on the reduction of screening intensity in trusted traveler lines:
• Case A represents the simplest—and best—case for security performance. When few terrorists apply to the program and public participation is very high, any security reduction produces better results than would be afforded by the baseline case (without the trusted traveler program). The optimal screening reduction under these circumstances is 75 percent, which is the maximum level of reduction that our analysis allowed. At that level, the security benefit of the program is substantial, potentially halving the number of attackers penetrating security.
• Case B too is uniformly positive for security outcomes, but it is more complex for planners. Any reduction in screening between zero and 75 percent produces better results than the baseline, but there is an optimal reduction that produces the best security outcome. In this case, that reduction is 56 percent, a level of screening intensity that balances the probability of detecting attackers in both the trusted traveler and public lines, thereby resulting in the lowest net number of terrorists getting through security overall. The total security benefit under these circumstances is much less than Case A, however: Even under ideal circumstances, the number of attackers getting through security is reduced only by a small number.
• Case C is a negative extreme situation, and it illustrates circumstances in which a trusted traveler program is not viable. Here, so many terrorists are applying to (and being accepted by) the program that any security screening reduction produces worse results than baseline; that is, more terrorists get through screening than would get through if the program did not exist. The optimal screening reduction is therefore zero, and the best security performance is identical to the baseline, which is produced by treating trusted travelers exactly the same as individuals in the general public line.
• Case D is the most complex type of intermediate case. For this set of circumstances, improved security performance is possible. However, there are also reductions in screening that, because of the number of attackers in the trusted traveler line, produces worse‐than‐baseline performance. As a result, there is a premium on making the “right choice” in screening reduction. Total potential benefits here are also quite modest.
In each of the cases in this analysis, the best possible security performance can be calculated. Table 2 summarizes those results. Which “class” case each set of circumstances represents is shown by the shading of the cells behind the numerical values.

17
Figure 8—Dependence of Security Performance on the Rate of Attempted Terrorist Exploitation, Public Participation, and Screening Reduction in an Illustrative Case

18
Table 2—The Effects of Terrorist Exploitation and Compromise of a Trusted Traveler Program on Net Security Performance, Given an Intermediate‐Quality Background Check
0% 5% 25% 50% 100%
0% 2010% 18.0 18.7 20.0 20.0 20.025% 14.8 15.6 18.5 19.8 20.050% 8.9 9.8 13.3 16.7 19.6
Fraction of Population Applying to the TT Program
Fraction of Terrorists Applying to the TT Program80% Baseline Screening Performance
Background Check: ‐ 70% True Positive, 20% False Positive
Legend:
20.0 No screening reduction improves security over baseline.19.6 Performance over baseline is possible, but some cases produce net security reduction.16.7 All screening reductions improve security, but less than maximum screening reduction is optimal.8.9 Optimal screening reduction is the maximum level allowed in model.
Numerical values are the minimum number of attackers through security at optimal reduction
Notes: Assumes 625 million traveler trips and 100 terrorist trips. The baseline detection performance for screening before trusted traveler implementation is 80 percent. Background checks correctly reject 70 percent of terrorist applicants but also reject 20 percent of innocent applicants.
Based on these results, it is clear that a trusted traveler program could potentially reduce risk under a wide range of conditions. Even if some attackers were approved as trusted travelers and managed to pass through the trusted traveler screening line, that penetration would be more than offset by improved performance in the general public line if sufficient numbers of attackers were still seeking to penetrate security through that route (in Table 2, see all the white, crosshatched cells and two of the three light‐gray cells). However, attacker exploitation does reduce the potential security benefits from their theoretical maximum levels, in some cases considerably (in Table 2, compare the far left column, reflecting no terrorist applicants, with other columns).
Greater public participation, which enables greater performance improvement in the screening of the general public, reduces the sensitivity of net benefits to attacker exploitation; that is, even at higher terrorist application rates, overall performance is still better than having no program at all. It also reduces the sensitivity of those results to the amount by which screening is reduced. Conversely, if too many terrorists are able to become trusted travelers and overall participation is too low, a trusted traveler program will not reduce risk (in Table 2, see the black‐filled cells). Under such conditions, there is not enough improvement in the screening of the general public line to compensate for the number of attackers penetrating through the trusted traveler lines.

19
Finally, attacker exploitation directly cuts into the amount by which screening can be reduced for trusted travelers, and it makes deciding by how much to reduce screening intensity much more difficult. As more attackers apply to become trusted travelers, screening in the trusted traveler line must be kept higher to hedge against that threat. For some cases (in Table 2, see the crosshatched cells), a smaller screening reduction is needed to get as much security benefit as possible under the circumstances, although the penalty for being wrong is relatively modest, since missing that optimum will still produce better outcomes compared with no program. The hardest cases for the policymaker are the grey boxes, which represent situations in which performance could actually be worse than the baseline if screening is reduced by too much. The need to be more conservative in such circumstances could lead to smaller‐than‐optimal screening reductions, which, in addition to reducing the amount of resources available to reallocate to public screening lines, could discourage members of the public from participating in the program (since the private benefit to them would be reduced).
Considering these results from the perspective of program design, several observations can be made. First, whereas in a modeling environment it is possible to “tune” security reduction to get the best performance under each set of conditions, such an approach is not viable in reality due to information and implementation limits. Though intelligence might provide some insight into whether attackers view applying to a trusted traveler program as risky, it will never identify a precise fraction of terrorists who choose to apply. Similarly, although tuning security one percentage point at a time works in a model, actual security intensity can only rarely be adjusted so precisely. For example, the decision may be between using a specific technology or not, with either decision producing a “step change” in the level of detection resources rather than movement along a smooth curve.
Those designing a program will therefore find most attractive those regions where fine‐grained judgments about screening reduction are not required to robustly obtain results superior to the baseline (in Table 2, see the white and crosshatched cells). In such circumstances, there is no probability of “policy regret,” which stems from implementing a program that results in a worse outcome than the status quo would have produced. Grey cells are risky because performance over baseline is not robust for all decisions about screening reduction; furthermore, even if policymakers made the “right choice” for screening reduction at a specific time, it would not be robust or even modest changes in the number of attackers seeking to become trusted travelers. Finally, cases in which greater screening reductions can be sustained are also preferable, since they increase potential security benefits (e.g., compare Figure 8’s A with C).
Looking across the other relevant variable in Table 1—the assumed level of baseline security performance—we see that the lower the performance of existing security screening, the less sensitive the benefits of a trusted traveler program are to adversary attempts to exploit it. Put another way, when baseline performance is worse, more of the performance matrix (i.e., the "Table 2 for that case") is white or crosshatched. Conversely, when baseline performance is higher, the relevant fraction of the table shrinks. Intuitively, the more that there is to gain from the concentration of resources afforded by a trusted traveler program (e.g., if the baseline screening detection probability is 60 percent rather than 90 percent), the less the fact that some attackers pass through the trusted traveler line undetected matters for net security improvement.

20
As a result, to the extent that policy implementation can seek to push the situation to the left and down in Table 2 (i.e., toward reduced terrorist participation and higher public participation), the likelihood of producing robust improvement in security benefits increases. With respect to the specific decision variable we are focusing on here—screening reduction—the effects on terrorist and public decisions pull against one another. These are the same trades illustrated in Figure 7. Though more screening reduction helps moves us toward the ideal case of high public participation (and therefore greater benefit from this participation), it works against attaining the ideal case of low numbers of terrorist applications to the program (and also produces a greater benefit to an attacker of achieving trusted traveler status).
TheImplicationsofBackground‐CheckPerformanceonNetSecurityBenefits,GivenAttackerExploitationHow much security can be reduced for trusted travelers is one key policy decision. The other is determining the characteristics of the background check that applicants to the program must undergo. Background checks vary considerably, ranging from limited, database‐type checks (e.g., that look for criminal history or verify address and residency) to more‐extensive investigations, including face‐to‐face interviews, interviews with family or acquaintances, and so on. A variety of existing programs, including some within the homeland security area, require background checks; these checks involve fingerprint‐based criminal background checks, database searches using individuals’ names, substance‐use tests, and in‐person interviews (Government Accountability Office, 2007). As described earlier, our model reduces this heterogeneity to two values: the probability the check will exclude a terrorist applicant (the true positive rate) and the probability that it will mistakenly exclude an innocent individual (the false positive rate). As discussed later, the cost associated with different background checks also varies considerably, and it is generally assumed that better checks are more costly to perform (Government Accountability Office, 2007).
In the previous section, we showed that, in considering how the decision about screening reduction is made and how this reduction affects net security performance, situations in which security outcomes are better than baseline regardless of whether the “right” decision is made are preferred. In the matrix of different public and terrorist application rates for the example we provided, this preferred area—where there was no chance of “policy regret”—was of reasonable size, but changes in attacker behavior or public participation rates could still derail a program initially designed to produce robust security benefits. The quality of the background check used to grant trusted travelers status is the other lever available in program design to address this issue. This section, which assumes a background check that is better able to exclude attackers from a trusted traveler program, demonstrates how.
Table 3 repeats the conditions and calculations in Table 2 but assumes a background check with a 90‐percent true positive rate and a 10‐percent false positive rate. The effect of the better background check is essentially to stretch the white and crosshatched area to the right and upward. This widening the range of attacker behavior and public participation in which the program will robustly produce net security benefits. In this particular case, the one gray cell is also much less risky from a performance standpoint, with only a few reductions in screening intensity that would produce worse performance than baseline. Even in those cases, the increase in the number of terrorists penetrating security is very small. Background checks with poorer performance, however, have fewer white and crosshatched areas

21
and, to tolerate any but a small amount of adversary exploitation, require that the highest fraction of traveler trips be made by trusted travelers.
Table 3—The Effects of Terrorist Exploitation and Compromise of a Trusted Traveler Program on Net Security Performance, Given a Higher‐Quality Background Check
0% 5% 25% 50% 100%
0% 2010% 17.7 18.0 19.0 19.7 20.025% 14.1 14.4 15.4 16.7 18.750% 7.5 7.8 8.9 10.4 13.3
80% Baseline Screening PerformanceFraction of Terrorists Applying
to the TT ProgramBackground Check: ‐ 90% True Positive, 20% False Positive
Fraction of Population Applying to the TT Program
Legend:
20.0 No screening reduction improves security over baseline.19.6 Performance over baseline is possible, but some cases produce net security reduction.16.7 All screening reductions improve security, but less than maximum screening reduction is optimal.8.9 Optimal screening reduction is the maximum level allowed in model.
Numerical values are the minimum number of attackers through security at optimal reduction
Notes: Assumes 625 million traveler trips and 100 terrorist trips. The baseline detection performance for screening before trusted traveler implementation is 80 percent. Background checks correctly reject 90 percent of terrorist applicants but also reject 10 percent of innocent applicants.
It is perhaps unsurprising that the true positive rate becomes the dominant variable affecting performance in cases in which there are many terrorist applicants to the trusted traveler program. In a case with high terrorist load on the trusted traveler program (e.g., the rightmost cell in the last row of Table 2), a 10‐percent improvement in the true positive rate has a larger positive effect than 10‐percent improvements in other parameters on reducing the number of terrorists who pass through security, the optimal amount of reduced screening on trusted travelers, the number of screening reductions that produce net security benefits over the baseline, and how much worse performance can be than the baseline without the program for excessive screening reductions. In situations with lower terrorist load (e.g., 25‐percent participation and 25‐percent terrorist application in the middle square of Table 2, where all cases are better than baseline but the increase in performance is small), the value of increased public participation is more important than background‐check performance.
Though reducing the false positive rate for the background check is beneficial, it effects are marginal, for two reasons. First, an incremental reduction in the rate results only in a small increase in the fraction of the public actually accepted into in the program and a correspondingly small increase in the amount of resources freed to improve security, while improvement in the true positive rate moves attackers from the trusted line to the public line. Changes in the fraction of the population who apply are much more important, although it should be noted that willingness to apply could be reduced if false positive rates

22
are too high. If we vary the false positive rate for one of our example background checks while holding constant the true positive rate and participation rate, the black and white cells (the “never viable” and “always maximally viable” cases) remain the same, but the lower false positive rate produces fewer and less‐serious cases of poorer‐than‐baseline performance in the borderline cells.
Given that background‐check design is a key policy choice—and one with cost implications for the program, a point discussed later—it is useful to look at it from another perspective, one that relates directly to how assumptions about attacker behavior in particular drive background‐check characteristics. Rather than asking how background‐check quality might make a program more tolerant of attacker behavior, we asked, “How good would a background check have to be, given a specific baseline security performance, a specific trusted traveler participation rate, a specific screening intensity reduction, and a specific level of terrorist applications to the program, to ensure robust security benefits?” This approach more directly focuses on defining program requirements and determining the viability of different background‐check options.
Answering this question for a given set of program circumstances essentially reduces to identifying the minimum background‐check true positive rate at which a specific reduction in screening intensity for trusted travelers produces a nonzero security improvement over the baseline for a given participation rate and fraction of terrorists applying for trusted traveler status. Any background check that is better than the threshold value will increase the net benefits over the baseline. Figure 9 shows the results for a case in which baseline security performance is 60 percent and the desired reduction in screening for trusted travelers is 75 percent, which is the maximum reduction allowed in our modeling.
Figure 9 demonstrates that, when few terrorists apply to become trusted travelers, background checks of relatively modest (or even no) minimum sensitivity suffice to produce net security benefits even at maximal reduction in security intensity. When many attackers seek to become part of the program, however, the threshold for background‐check quality increases rapidly. In extreme cases, background checks with greater than a 95‐percent chance of rejecting terrorist applicants may be needed to produce a “no possible policy regret” implementation scenario. In cases with different characteristics, as baseline detection performance increases, the minimum required quality for background checks increases as the position on the detection function moves upward (see Figure 2).
Therefore, pursuing robustness of performance by deterring terrorist participation in the program and encouraging public participation is not the only option. An approach focused on developing a background‐check process of sufficient quality is an alternative. In the literature, there is relatively limited insight on key drivers of background‐check quality and on how predictive background‐check results are of future behavior.18 This suggests that this issue would require particular attention in program design.
18 As discussed earlier, studies have examined how different factors are predictive of behaviors, such as criminal recidivism. The
use of personal information in such functions as credit assessment, where a “background check” seeks to predict future financial behavior, is also analogous. However, such use focuses on a smaller set characteristics and behaviors that are probably more predictable.

23
Figure 9—Threshold True Positive Performance Required for the Trusted Traveler Background Check to Ensure Robust Performance at Varied Levels of Attacker Exploitation Attempts and Public
Participation
0%
10%
20%
30%
40%
50%
60%
70%
80%
90%
100%
0% 20% 40% 60% 80% 100%
Requ
ired
backgroun
d check
true
postive
rate
Fraction of terrorists applying to the TT program
Public participation rate: 10%
25%
50%
Notes: Assumes 625 million traveler trips and 100 terrorist trips. The baseline detection performance for screening before trusted traveler implementation is 60 percent. Calculations assume all background checks reject 10 percent of innocent applicants.
However, as Figure 10 (a revision of Figure 7) shows, seeking to improve background‐check quality to meet program goals for robust security benefits can pull other key factors in different directions, with the cost and the intrusiveness of the background check being intermediary factors. Though more‐extensive background checks make it possible for a trusted traveler program to weather terrorist application rates that diverge from the ideal low values (and might even deter such applications), they could do so at the price of public participation. If the public must pay higher program fees to offset increased cost of more‐extensive investigation, or if they must pay a “privacy price” because of the more‐intrusive check, some potential trusted travelers may choose not to apply.

24
Figure 10—Linkage Between Background‐Check Choices and Other Parameters that Affect the Net Security Performance of a Trusted Traveler Program
CHOICES MADE BY POLICYMAKERS: CHOICES MADE BY OTHERS:
Ideal = high application rate
Ideal = high true positive rate
But: could increase cost
and intrusiveness
Con: expensive or intrusive check could discourage public
Ideal = low application rate
Pro: handles higher terrorist applicants, might deter
Screening reduction for trusted travelers
Nature of the background check for
acceptance as a trusted traveler
Fraction of terrorists applying to the TT
program
Public participation in the TT program
TrustedTravelersBecomingTerroristsThe previous section focused on “current” terrorists who might apply to the trusted traveler program because they seek an easier attack path for a strike on an aviation target. Given concern about self‐radicalization and potential al‐Qa’ida recruitment of U.S. citizens, another case to consider is exploitation by individuals who were approved as trusted travelers but then either radicalized or were recruited by a terrorist organization. Such “good gone bad” scenarios are a common concern in counterintelligence and in such areas corporate espionage and insider threats to computer systems.
This risk posed by this case is directly related to how long an issued trusted traveler credential remains valid before an additional background check, which might detect the change in the individual’s risk level, is conducted. If reinvestigation is infrequent, an individual enter the trusted traveler program, turn to terrorism, and then plan and execute an attack before reinvestigation occurs.19 Assuming that radicalization would raise flags about a change in level of risk to aviation posed by that individual, more‐frequent reinvestigations might reveal individual’s changed risk level and result in the revocation of credentials or even law enforcement action. However, reinvestigations will cost the program money; to oversimplify, moving from one annual background check to two could double the per‐person cost of the program.
Given the uncertainties associated with estimating a time scale for radicalization and with identifying precursors to radicalization, it unlikely that there is any absolute answer to how frequently such reinvestigations would have to occur to reasonably address this vulnerability. In principle, a regular annual application cycle would provide attackers with knowledge that they would have a year of trusted traveler status to plan and execute an operation. Adding additional reinvestigation cycles, which, in
19 Existing background‐check programs that seek to achieve different security goals have varied reinvestigation rates, from
every five years to never (Government Accountability Office, 2007).

25
theory, could be accomplished in a semi‐automated way, would reduce the length of that time period. Adding randomness to the timing of reinvestigation would eliminate predictability. Adding more, random reinvestigations to each year would make the cycle shorter and less predictable, although a point of diminishing marginal returns would be reached fairly rapidly. The timelines of individual radicalization have varied, and analyses by Smith (n.d.) of a wide variety of terrorist operations shows that approximately half of attacks by international terrorist groups have a preparatory timeline of longer than one month. Though the timelines involved vary considerably from operation to operation, complex and high‐profile operations are often preceded by longer periods of preparation.
Based on this logic and past terrorist operational timelines, we believe that attackers who hold trusted traveler status for six months or longer would likely exceed a threshold of concern for security planning if screening for trusted travelers is substantially reduced. Cutting that time period (by instituting one or two reexaminations annually and incorporating some randomness to create uncertainty) may be sufficient to address this concern, but it may double or triple the per‐enrollee cost of the program. The effect on costs depends strongly on the nature of the background check, on whether automated methods can be used to support periodic reinvestigations, and on what levels of information are needed to provide a sufficient probability of detecting terrorists pursuing this particular exploitation pathway. However, more‐frequent checks would likely produce the same dynamics illustrated in Figure 10: Making it possible to address this particular route for attacker exploitation could potentially drive public participation down and therefore reduce security benefits.
ExploringtheBalanceofCostsandBenefitsofaTrustedTravelerProgram,GivenPotentialAttackerExploitationandCompromise
In previous sections, we considered the benefits of a trusted traveler program entirely in terms of reductions in the number of attackers who make it through security compared with a baseline case with similar detection performance but without a trusted traveler program. During the earlier discussion, questions of costs arose, specifically questions about the costs of individual background checks and how those costs would be driven by the quality of the checks and by how frequently they need to be repeated. To bring these issues together in at least a qualitative way, it is worth exploring how dollar costs and benefits might compare.
TypesofProgramCostsA trusted traveler program would have two main categories of costs:
Fixed Program Costs. There would undoubtedly be some annual program cost involved in maintaining the infrastructure for the program, issuing credentials, and so on. These baseline fixed costs would likely be comparable to those associated with similar credentialing programs. The most comparable program is the Transportation Worker Identification Card (TWIC) program which, according to the BY2010 Department of Homeland Security budget exhibit 300 release, has an estimated annual cost of $9 million, with higher expenditures occurring earlier in the program as it is established.

26
Per‐Traveler Background‐Check Costs: The second cost category is the variable cost of conducting background checks on individual trusted travelers. As noted earlier, there is likely a relationship between the cost and resource intensity of background checks on the one hand and, on the other, the ability of that check to produce a high true positive and a reasonable false positive rate. The literature reveals that background checks for national security clearances can cost thousands of dollars whereas basic background checks using databases for criminal behavior, financial history, and so on cost as little as $100 (or less). As mentioned previously, data on background‐check effectiveness in different applications are limited, as is information on the relationship between cost and performance. As a result, in considering costs and benefits, we are reduced to asserting a (reasonable) relationship between costs and performance characteristics. Frequency of background‐check reinvestigation is essentially a multiplication parameter in this analysis; if a trusted traveler background check costs $100, then repeating it between two and three times a year increases the annual cost to $250.
Most expected implementations of a trusted traveler program assume that participants will pay an annual fee for participation. Previous experience with the CLEAR program, whose annual enrollment cost is approximately $200, has been used to support the argument that individuals are willing to pay such a fee (Crowley and Ross, 2009). An analysis based on a survey carried out at the Pittsburgh airport showed an average willingness to pay $37 per year but that a small number of frequent travelers are willing to pay more than $150 (Foster et al., 2003). Such annual fees could cover the costs of simpler background checks or defray the costs of more‐extensive ones, thereby reducing the government expenditure required.
Changes in Screening Equipment and Personnel: Our analysis assumes that screening costs remain constant; that is, that there will be no “new” trusted traveler lines, that some existing security lines will become trusted traveler lines, that the intensity of screening in trusted lines will be reduced, and that the freed resources will be reallocated to the general public lines. In reality, however, there would at least be some sort of reconfiguration costs incurred even if total screening resources were held constant, but we have not considered these costs.
EstimatingBackground‐CheckRequirementsOur analysis and examples assume 625 million traveler trips (also known as enplanements) per year, and our estimates of program application and acceptance are represented as percentages of this total traveling population. Because single individuals can—and do—make more than one trip in a year, however, there will necessarily be considerably fewer background checks of trusted travelers than enplanements by trusted travelers.
As part of national surveys, Gallup periodically asks individual poll respondents how many air trips they took in the past year. These data make it possible to broadly map the distribution of trips taken by the domestic U.S. population and helps us estimate the number of background checks that would be needed to reach the levels of trusted traveler participation discussed earlier. We used data from the January and November 2010 polls and found that 61.5 percent of the population had not flown at all in

27
the last year, 15 percent of the population had made one round trip, and 23.5 percent had made more than two round trips.20
Using a U.S. population estimate of 308 million means that the traveling public—consisting of people who made at least one flight in the previous year—comprised approximately 119 million people, or 38.5 percent of the total population. Using just these broad categories and converting each round trip into two check‐ins (because most travelers go through security once on each portion of a round‐trip flight) means that ≈46 million people experienced two check‐ins and screenings annually (accounting for ≈10 percent of traveler trips in our analysis) and that ≈72 million people experienced three or more check‐ins and screenings annually (accounting for the remaining ≈90 percent of traveler trips). It is this latter group who is of most interest for policymakers considering a trusted traveler program, since the more trips an individual takes, the more value there is in performing a background check on that individual.
To estimate background‐check requirements, we need a greater understanding of differences in travel frequency among members of the group of more‐frequent travelers. Comparatively little public data describe how travel frequency varies across this population, although anecdotal contrasts are drawn between the travel frequency of extremely frequent travelers (whose number of annual trips can exceed a hundred) and others. To help us segment populations by individual travel frequency, a U.S. domestic airline shared with the RAND Corporation data on the distribution of annual check‐ins made by members of its frequent traveler program. Annual check‐ins by frequent traveler program members were broken down into bins of 1–2, 3–5, 6–10, 11–25, 26–50, 51–100, and more than 101 check‐ins during the 2010 calendar year. Though proprietary concerns make it impossible to report numerical values for each of these categories, the lowest bin captured ≈35 percent of member travel frequency, and the highest accounted for less than 1 percent of members, with an intuitive progression between the extremes.
Taking the percentage of travelers in each of the bins between 3–5 annual check‐ins and more than 101 annual check‐ins, we segmented the population of ≈72 million people calculated from the Gallup results and estimated the fraction of the public that fell into each travel frequency category. This required that we assume that the distribution of travel behavior for individuals within this one domestic airline’s frequent traveler program are representative of all travelers who make more than one round trip per year on all airlines and that the fact that the data are based on frequent traveler program membership does not distort the results in other ways. There are certainly limits on using this data as a proxy for the entire traveler population. For example, if we use the midpoints of each bin (and 150 trips as an artificial “average” for the more‐than‐101 check‐ins bin) and calculate total number of annual flights (using the Gallup estimates for the total traveling population), we generate a total number of annual domestic trips that exceeds statistics reported by BTS by approximately one‐third. However, since the measure we are interested in for our simulation is what fraction of check‐ins are by participants in the trusted traveler program, this divergence can be viewed as cautionary—rather than fatal—for analytical purposes. 20 The survey results separated the segments of the population who make more than two round trips into 2–4 trips (16.5
percent) and five or more trips (7 percent). We combined them for compatibility with other data we used to characterize the frequent traveler population.

28
Since this is the only data set we are aware of that enables (admittedly approximate) estimates of how many background checks might be required for a viable trusted traveler program, we used it to estimate how many individuals would have to participate in the program—starting at the top tier of most frequent travelers and working downward—to reach the values of 10‐percent, 25‐percent, and 50‐percent participation in each of the sample tables in this paper. Though they are uncertain, such estimates can provide an initial calibration of the numbers of travelers that would be involved in meeting the various participation thresholds in our models.
For 10‐percent of traveler trips to be made by participants in the trusted traveler program, only slightly more than the most‐frequent travelers must be convinced to apply (i.e., all travelers making more than 101 check‐ins annually, plus some travelers making 51–100 check‐ins annually). This level of participation could be achieved if 500,000–800,000 of the most‐frequent travelers applied.21 Having trusted travelers account for 25 percent of traveler trips requires enrolling individuals down into the bin made up of travelers with 26–50 annual check‐ins, and meeting this goal would require the participation of 2.4 million–4.0 million travelers. Having trusted travelers account for 50 percent of traveler trips requires enrolling individuals down into the bin made up of travelers with 11–25 annual check‐ins, and meeting this goal would require the participation of 10 million–17 million travelers.
ConsideringNetCostsandBenefitsBeyond the likely modest program administrative costs, the main driver of the cost of a trusted traveler program would be participant background checks. These costs would depend on how expensive each background check was and—more importantly—what portion of that cost was paid by the applicant. As noted earlier, estimates of public willingness to pay range from highs of $200 to lows of less than $40 per year. It is possible that larger fees could be charged, though doing so could reduce willingness to participate and, as that rate dropped, cut into security benefits and undermine program viability.
If application fees were kept low to encourage public participation, more‐expensive background checks would have to be subsidized, increasing government expenditures for the program. According to our earlier estimates, for every dollar a background check costs over the relevant “willingness‐to‐pay” threshold, the cost of the program would increase by $2.4 million–$4.0 million (to achieve a 25‐percent participation rate) or $10 million–$17 million (to achieve a 50‐percent participation rate. If program viability is shown to require a background check that exceeds public willingness to pay, more‐accurate estimates of the numbers of individuals required to hit specific participation levels will likely be needed.22 Conversely, if background checks could be conducted for less than what members are willing to pay, the program could be revenue neutral to the government. However, given the importance of background‐check quality and the possibility that checks will need to be conducted more than once a
21 Given the many uncertainties in these data, we report our estimates as ranges 25 percent above and below the calculated
value. 22 Further analysis may enable graduated pricing, which could encourage individuals who travel frequently to participate at
higher rates. Enrolling more‐frequent travelers would generate proportionately more leverage in achieving the types of “traveler trip participation rates” described here, and the greater security benefit of their participation could justify lower enrollment fees. However, the larger private benefit of participation to such individuals—because of their large number of trips through security each year—might make such graduated pricing unnecessary.

29
year to address adversary adaptive behavior, there is almost certainly a lower bound on the costs involved.
The significant uncertainty associated with the relationship between background‐check cost and performance levels makes it impossible to generate a spot estimate for what such checks are “likely” to cost for a real program. If the cost of satisfactory checks exceeds participant willingness to pay, the net cost of the program will have to be justified based on the security benefits it produces. The type of modeling done in this paper provides a structure for making such an assessment—by relating the fewer terrorists penetrating security to an expected number of additional attacks prevented. Though the monetary values assigned for aviation attacks have varied, a prior RAND estimate of the cost‐effectiveness of countermeasures for man‐portable air defense systems (i.e., surface‐to‐air missiles) on commercial aviation systems estimated a cost of $1 billion per loss of a fully loaded commercial airliner (Chow et al., 2005). Using this estimate and an assumed annual probability of attack, the annualized expected losses averted by the improved security provided by a trusted traveler program could be calculated and used to justify program costs.
Conclusion:NavigatingTrade‐OffsintheDesignofaTrustedTravelerProgramIf our model of detection performance is reasonable, it is clear that, a trusted traveler program could produce security benefits. Attempted attacker exploitation reduces security benefits under all circumstances, but it is possible to produce better‐than‐baseline performance under a variety of conditions.
It is also clear that different response and hedging strategies are needed to deal with the different potential routes attackers make take to exploit such a system. In some scenarios, establishing a lower limit on the amount by which security screening of trusted travelers is reduced seems appropriate because it both addresses the possibility that individuals may be coerced into aiding attackers and lowers the chances that a perceived “open door for aviation attacks” will changes attackers’ calculus about such attacks. In other scenarios, more‐complicated responses are needed, and they will affect program design and costs. Though attacker exploitation does cut into the theoretical maximum benefits of such a program, there are still many circumstances in which there is a net benefit, even with significant rates of terrorist attempts to use trusted traveler screening lines as a mode of attack. Additional potential benefits that we did not explicitly consider—e.g., the reduced burden of security on frequent travelers—would increase the potential attractiveness of such a program to individual participants and create private benefits for some travelers.
In considering how to design such a program, the relationships and linkages between the two main policy levers—screening reduction and background‐check characteristics—and how those levers affect whether terrorists and the public apply for trusted traveler status are important. Figures 8 and 10 illustrate the key challenges. Though greater reduction in screening increases potential security benefits and makes the program attractive to the public, it also increases the attractiveness to attackers and thereby reducing the chance that those potential benefits can be realized. Though more‐intensive

30
background checks minimize the importance of attacker exploitation attempts, they may do so either at the expense of public participation or increased program costs to the government.
To distill this multivariate analysis into a very simplified set of policy choices, the first key question is, “Do we believe that terrorists will seek to obtain trusted traveler status in large numbers, or is there a way to design a program that will discourage them from doing so?” If we can design a program that produces cases low and to the left in our performance matrixes (Tables 2 and 3), we may be able to create a virtuous circle: Because few terrorists apply, background checks can be less stringent, which will reduce their costs and therefore encourage broad public participation while limiting government program costs. Furthermore, lower costs make reinvestigation less of a concern.
Is it reasonable to assume that terrorists might be deterred from applying to such a program? In past studies of terrorist decisionmaking (e.g., Davis and Cragin, 2009), sensitivity to risks—both individual risk and risk to the success of a planned terrorist operation—has been identified as an important driver of terrorists’ tactical choices. Manipulating attacker risk perceptions has been shown in some circumstances to a way to deter specific types of terrorist behavior (Morral and Jackson, 2009), and developing a trusted traveler program that deters attackers from applying in the first place could be a multiplier of the program’s effectiveness.
It is possible that basic, practical design choices about how applicants are vetted for a trusted traveler program could affect terrorists’ willingness to apply. Some similar programs and situations (e.g., the visa application process, existing Customs and Border Protection programs, such as NEXUS) incorporate in‐person interviews into the application processes. Such in‐person components might deter adversaries from applying due to perceived risks of discovery. The perception that the background‐check process as a whole is effective in weeding out potential attackers could also deter them from applying in the first place. How the barrier to attack produced by the trusted traveler background‐check is perceived by potential attackers compared to other routes they might use to get weapons on planes is also important. For example, individuals employed by service firms in airports gain access to secure areas with limited screening after passing a modest background check. If attackers were intimidated by the perceived quality of the check performed on trusted travelers, they might see the employee route as an easier path. This emphasizes the need to remain cognizant of other routes that attackers might use to circumvent security.23 If a good trusted traveler background check deters attackers not into the public screening lines (which would expose them to the improved security that is enabled by the trusted traveler program) but instead to less‐secure route, such as one used for employees, the security benefits of the program will be undermined considerably.
The application process could be “tuned” to create deterrence. The simple model we used throughout this paper has no downside cost for attackers who apply and fail their background check, but it is more realistic to believe that a program involving a background check will carry a real risk of discovery and arrest for a confirmed terrorist who applies. It is unlikely that the probability of that occurring would be 100%, since realistic background checks are unlikely to be so definitive that every terrorist applicant will
23 As discussed earlier, this route is effectively deterrence of an attacker "outside the model" used for this analysis.

31
be discernable among the population of false positives. But, the arrest of some fraction of such applicants, and the public disclosure that they were identified through their trusted traveler application, could be a powerful deterrent to future terrorist applicants. Any such arrests would also increase the security benefits of the program, since those attackers would be unavailable to attempt other attacks.24 Other actions could also be taken to increase the perceived risk to attackers of applying to the program. For example, if the background investigation included examination of the applicant's social network, a terrorist applicant would potentially put other members of his group at risk. If such strategies are designed into an implemented trusted traveler program, they could serve as a hedge against attacker exploitation and increase the program’s overall security benefits. However, as in other scenarios, such measures may discourage members of the public from participating in the program (see Figure 11).
Figure 11—Linkage Between Efforts to Directly Deter Terrorist Applicants and Other Parameters that Affect the Net Security Performance of a Trusted Traveler Program
CHOICES MADE BY POLICYMAKERS: CHOICES MADE BY OTHERS:
Ideal = high application rateCon: might also
deter public participation
Ideal = low application rate
Pro: deter by increasing real or perceived application
risk
Screening reduction for trusted travelers
Nature of the background check for
acceptance as a trusted traveler
Fraction of terrorists applying to the TT
program
Public participation in the TT program
Though our discussion of whether these design choices would deter attackers from applying to such a program is necessarily tentative, the likely effects could established through focused study and intelligence analysis of this issue. Examining the relevant results of changes in the visa application processes since 2001 could reveal how different changes affected the willingness of different types of individuals to apply. Furthermore, analysis of open source and other intelligence collected from relevant groups could provide direct insight into which design factors affect their decisions and which do not.
But what if terrorists cannot be deterred, or what if policymakers cannot be sufficient sure that terrorists will not apply to count on it when designing a trusted traveler program? Under such circumstances, background‐check performance is critical, even at the expense of the highest participation rates. With high terrorist application rates driving the cases to the right of our matrixes, better background checks are needed to pull the white region to the right. In these cases, cost will likely
24 Simulations that include the risk of arrest show small, direct improvements in security resulting from the arrests (because
they do remove individual terrorists from the simulation). However, even modest “application deterrence” effects from these arrests would produce much larger payoffs.

32
become a much more significant driver unless approaches are developed to make it possible to increase background‐check quality at lower‐than‐expected costs. If economical background checks cannot be developed and individual participation must be subsidized, then total program costs could increase rapidly. Though increased participation does reduce how good background checks have to be to tolerate more terrorist applicants (refer Figure 9), the large number of additional background checks required would compensate for—and potentially overcompensate for—the potential reduction in background‐check cost. In this scenario, program viability would be driven by whether the cost of sufficiently useful background checks could be brought down to a tolerable level.
This analysis suggests that programs should be designed to try to hit the white regions of the matrixes that describe public and attacker choices. Given uncertainties about what fraction of terrorists would apply to a trusted traveler program (even if some deterrence efforts are successful), policymakers will never know enough to attempt to optimize security reductions. This would be true even if the nature of security measures made such fine‐grained adjustments possible. Therefore, operating in regions whose outcomes are better than baseline performance no matter what screening reduction is chosen is vastly preferable. In putting a new program together, policymakers should incorporate all current understanding about how to deter adversaries from applying. They should also identify how to achieve the best possible performance from a vetting process while keeping per‐traveler costs as low as possible and, to maximize participation, ensure that the program and its application process are as friendly as possible. Our research has shown there are areas in which additional learning could improve program effectiveness over time—specifically, continued analysis of adversary behavior to learn how to better deter terrorist applicants, more‐refined understanding of what makes participation in such a program attractive to members of the public, and advances in the state of the art in vetting processes that improve performance and reduce costs in that part of the program. A trusted traveler program should not be designed in such a way that its characteristics and processes are locked in and incapable of profiting from developments in each of these areas so program performance can be improved over time.
In conclusion, it is important to note that there is one risk from terrorist exploitation that we have not considered in this analysis but that could have important consequences for the viability of a trusted traveler program: political fallout in the wake of an attack perpetrated by a terrorist who passed through a trusted traveler line. In our modeled scenarios, we focused on net security performance, and our measure of “number of terrorists passing through security” included terrorists passing through both the general and trusted traveler screening lines. The effectiveness standard for a trusted traveler program cannot be assume that no terrorist will ever compromise the system. If policymakers are unprepared to weather and rationally respond to such criticisms after an attack, then a trusted traveler program may not be viable in spite of its potential security benefits. In the real world, it is likely that some terrorists will apply to become trusted travelers, and some number of those will be accepted as such. Even then, however, and even in the aftermath of an attack perpetrated by those individuals, the security benefits of the program may still be positive.

33
Acknowledgments
We gratefully acknowledge the individuals who provided data on the frequent flyer population of a major U.S. airline, which allowed us to estimate the number of individuals that would need to be trusted travelers in order to cover different percentages of the annual traveling population. Due to agreements involved in our access to that data, we cannot identify these individuals or the airline by name, but that does not reduce our gratitude. We also acknowledge individuals involved in government aviation security for the input they provided during the research process. Again, although we do not identify them individually, we recognize the assistance they provided. Within RAND, we acknowledge the advice and assistance provided by Jack Riley, Andrew Morral, Eric Peltz, and Erin‐Elizabeth Johnson during the analysis and writing processes. Any shortcomings are the responsibility of the authors. In addition, the content represents the views of the authors and does not necessarily represent the opinions or policies of the RAND Corporation or any of its research sponsors.
WorksCited
British Broadcasting Corporation. n.d. 1986: UK cuts links with Syria over bomb plot. Online at http://news.bbc.co.uk/onthisday/hi/dates/stories/october/24/newsid_2478000/2478505.stm
Brown, David Parker. 2011. $100 bribe to ticket agent allows unknown package to fly on JetBlue. Seattle Post Intelligencer Blog. Online at http://blog.seattlepi.com/airlinereporter/2011/01/17/100‐bribe‐to‐ticket‐agent‐allows‐unknown‐package‐to‐fly‐on‐jetblue/
Caulkins, Jonathan P. 2004. CAPPS II: A risky choice concerning an untested risk detection technology. Risk Analysis 24(4) 921–924.
Cavusoglu, Huseyin, Byungwan Koh, Srinivasan Raghunathan. 2010. An analysis of the impact of passenger profiling for transportation security. Operations Research 58(5) 1287–1302.
Chow, James, James Chiesa, Paul Dreyer, Mel Eisman, Theodore W. Karasik, Joel Kvitky, Sherrill Lingel, David Ochmanek, Chad Shirley. 2005. Protecting Commercial Aviation Against the Shoulder‐Fired Missile Threat. RAND Corporation, Santa Monica, CA.
Crowley, P. J., Lindsey Ross. 2009. How to make the TSA (and airports) work better. Online at http://www.americanprogress.org/issues/2009/04/tsa_risk.html
Davis, Paul K., Kim Cragin, eds. 2009. Social Science for Counterterrorism: Putting the Pieces Together. RAND Corporation, Santa Monica, CA.
de Vries, Lloyd. 2002. Airport security fails the test: One in four fake weapons not detected at U.S. airports. Online at http://www.cbsnews.com/stories/2002/07/01/terror/main513862.shtml
Department of Homeland Security. 2011. Budget‐in‐brief, fiscal year 2012.

34
Dow, Edward, Charles Jones, Jack Mott. 2005. An empirical modeling approach to recidivism classification. Criminal Justice and Behavior 32(2) 223–247.
Drury, Colin G., Kimberly M. Ghylin, Karen Holness. 2006. Error analysis and threat magnitude for carry‐on bag inspection. Proceedings of the Human Factors and Ergonomics Society 56th Annual Meeting, 1189–1193.
Elias, Bart. 2009. Airport Passenger Screening: Background and Issues for Congress. R40543, Congressional Research Service.
Gallup. 2010. New airport security measures. Online at http://www.gallup.com
Ghylin, K. M., C. G. Drury, A. Schwaninger. 2006. Two‐component model of security inspection: Application and findings. 16th World Congress of Ergonomics, IEA 2006, Maastricht, The Netherlands, July, 10–14, 2006.
Government Accountability Office. 2002. Aviation Security: Registered Traveler Program Policy and Implementation Issues. GAO‐03‐253, Washington, DC.
Government Accountability Office. 2007. Transportation Security: DHS Efforts to Eliminate Redundant Background Check Investigations. GAO‐07‐756, Washington, DC.
Grabel, Michael. 2008. “Air marshals: Undercover and under arrest,” ProPublica, online at http://www.propublica.org/article/air‐marshals‐undercover‐and‐under‐arrest‐1113
Jackson, Brian A., Peter Chalk, Kim Cragin, Bruce Newsome, John V. Parachini, William Rosenau, Erin M. Simpson, Melanie W. Sisson, Donald Temple. 2007. Breaching the Fortress Wall: Understanding Terrorist Efforts to Overcome Defensive Technologies. RAND Corporation, Santa Monica, CA.
Koopman, B. O. 1956. The theory of search. II. Target detection. Operations Research 4(5), 503–531.
Linos, Eleni, Elizabeth Linos, Graham Colditz. 2007. Did you pack your bags yourself? British Medical Journal 335 1290–1292.
McLay, Laura A., Adrian J. Lee, Sheldon H. Jacobson. 2010. Risk‐based policies for airport security checkpoint screening. Transportation Science 44(3) 333–349.
McLay, Laura A., Sheldon H. Jacobson, John E. Kobza. 2008. Making skies safer: Applying analytics to aviation passenger prescreening systems. Analytics 12–17.
Morral, Andrew R., Brian A. Jackson. 2009. Understanding the Role of Deterrence in Counterterrorism Security. RAND Corporation, Santa Monica, CA.
Mosk, Matthew, Angela Hill, Timothy Fleming. 2010. Gaping holes in airline security: Loaded gun slips past TSA screeners. Online at http://abcnews.go.com/Blotter/loaded‐gun‐slips‐past‐tsa‐screeners/story?id=12412458

35
National Research Council. 2003. The Polygraph and Lie Detection. National Academies Press, Washington, DC.
National Research Council. 2008. Protecting Individual Privacy in the Struggle Against Terrorists: A Framework for Program Assessment. National Academies Press, Washington, DC.
Office of the Inspector General, Department of Homeland Security. 2008. Audit of Airport Passenger and Checked Baggage Screening Performance (Unclassified Summary). OIG‐08‐25.
Persico, Nicola and Petra E. Todd. 2005. Passenger profiling, imperfect screening, and airport security. American Economic Review 95(2) 127–131.
Press, William. 2009. Strong profiling is not mathematically optimal for discovering rare malfeasors. PNAS 106(6) 1716–1719.
Press, William. 2010. To catch a terrorist: Can ethnic profiling work? Significance 7(4) 164–167.
Reddick, Sharon. 2011. Point: The case for profiling. International Social Science Review 79(3 & 4) 154–156.
Research and Innovative Technology Administration, Bureau of Transportation Statistics. n.d. TranStats. Online at http://www.transtats.bts.gov/
Richardson, David W., Susan B. Cave, Linda La Grange. 2007. Prediction of police officer performance among New Mexico State Police as assessed by the personality assessment inventory. J Police Crim Psych 22 84–90.
Smith, Brent. n.d. A look at terrorist behavior: How they prepare, where they strike. Online at http://www.ojp.usdoj.gov/nij/journals/260/terrorist‐behavior.htm
United States House of Representatives, Committee on Homeland Security, Subcommittee on Economic Security, Infrastructure Protection, and Cyber Security. 2005. The Promise of Registered Traveler: Part I and II. U.S. Government Printing Office, Washington, DC.
United States Sentencing Commission. 2004. Measuring Recidivism: The Criminal History Computation of the Federal Sentencing Guidelines. Research Series on the Recidivism of Federal Guideline Offenders, Release 1.
Yetman, James. 2004. Suicidal terrorism and discriminatory screening: An efficiency‐equity trade‐off. Defence and Peace Economics 15(3) 221–230.