assessing water quality in sultanate of oman using …...assessing water quality in sultanate of...
TRANSCRIPT

Assessing Water Quality in Sultanate of Oman Using a Newly Developed
Dynamic Speciation Technique
A Theses Submitted for the Degree of Doctor of Philosophy
By
Mohammed Majid AlKasbi
Lancaster Environment Center Lancaster University
April 2016

ii
In The Name of God, The Most Compassionate and The Most Merciful

iii
Declaration
I, Mohammed Majid AlKasbi confirm that the work presented in this thesis is my own.
Where information has been derived from other sources, I confirm that this has been
indicated in the thesis.

iv
Dedication
I dedicate this work to the soul of my father who passed away when I was 14 years
old, may Allah forgive him and grant him his highest paradise (Ameen), and to my
beloved mother and wife whose unconditional encouragement and support made it
possible for me to achieve my dreams. And also to my mother-in-law who passed
away during my studies.
To my family, I love you all.

v
Acknowledgments
I would like to express my deepest gratitude to my supervisor Professor.
Hao Zhang for her constant enthusiastic paramount support, and her guidance,
encouragement and patience in rectifying me throughout my doctoral studies.
Also for her welcomeness and kindness in providing home away from home. Her
influence is inherited in both the theoretical and practical aspects of this work. I
would also like to thank Una (Dongnan Zhao) for her help in soil work.
I owe special thanks to my mother and wife for supporting me throughout
my doctoral studies. I would also like to thank my dear sister Aysha for her
paramount care throughout all my studies. All the three have been a role model
for me as they emotionally guided me when and where they deemed I was
derailing from my studies. I would also like to thank my brothers, sisters and
brothers-in-law for their everlasting encouragement and supports. In addition, I
am grateful to my employer in Oman, Ministry of Environment and Climate
Change (MECA), for sponsoring my Doctoral program in the UK 2013-2016.
Further, I owe another special thanks to Dr. Said Al-Zadjali, and HE. Najeeb A. Al-
Rawas, Undersecretary of the Ministry of Environment and Climate Affairs
(MECA) for their precious time and support.
Last but not the least, in terms of exchange of ideas, support, criticisms
and intellectual stimulation, thanks are offered to all DGT team and members of
academic staff at the Lancaster University Environment Center. I also
acknowledge the staff and all who helped me at MECA, Petroleum Development
Oman (PDO), Rusyl Industrial Estate (RIE) and Sohar Industrial Region (SIR), for
facilitating my fieldwork and providing the required access and support.

vi
Assessing Water Quality in Sultanate of Oman Using
a Newly Developed Dynamic Speciation Technique
Mohammed Majid Al Kasbi
Submitted for the Degree of Doctor of Philosophy Lancaster
University, April 2016
Abstract
Rapid increases in coastal developments in the Sultanate of Oman recently,
including large ports with industries, crude oil refineries, mining and industrial
activities, have often produced point sources of metal and organic contaminations in
the local marine systems. Although advances have been made in measuring and
understanding the trace metal speciation in aquatic system using a dynamic technique
DGT (Diffusive Gradients in Thin-films) or using other equilibrium techniques,
measuring metal speciation in situ in seawater that polluted by crude oil is still
extremely challenging. Without the technology and the information, it is difficult to
assess the effects of oil ligands on metal speciation associated with the oil refineries
and industries.
In the present study, the DGT technique has been developed further for
measuring metal speciation in seawaters in the presence of oil. The influence of oil

vii
ligands on the speciation of trace metals (Cd, Co, Cu, Ni, Pb and Zn) has been
investigated in synthetic solutions of 0.5 and 0.7 mol/L NaCl containing different level
of Oman crude oil. DGT of different types in diffusive layers (pore size and
thicknesses), binding layers (Chelex resin and Fe oxide) and different types of
membranes (dialysis membranes (1000 MWCO and 3500 MWCO) and 0.05 mm
thickness Nafion112 membrane) were used. The diffusion coefficients were
determined for each metal, using a diffusion cell, through filter membrane and
diffusive gel with and without dialysis and Nafion112 membranes.
The measured diffusion coefficients of all metals in diffusive gel plus dialysis
membrane were significantly lower than gel alone. When Nafion112 membrane was
used with the diffusive gel, the diffusion coefficients of all metals were much lower,
up to 80 times lower for Cu, Cd and Ni. The potential of using DGT for determining
labile metals species in seawater in the presence of crude oil was evaluated in mixed
solution of NaCl and oil with varying mixing periods (0.25 day, 0.5 day, 1 day, 2 days,
4 days and 6 days) and oil concentrations (1, 3, 5, 7, 25 OWR% (oil water ratio), w/v).
It was demonstrated that organic ligands from crude oil influenced the lability of trace
metals. The combination of five types of DGT devices (OP-DGT, RG-DGT, (dialysis
1000Da)-DG, (dialysis 3500Da)-DGT, (Nafion112)-DGT) were used for speciation of
metals at 1 and 4 oil water ratio (OWR%), and 48 h mixing time. Lower
concentrations of labile metals were determined with the higher level of oil in the
synthetic solution when using Nafion112-DGT, due to the exclusion of large colloids
and negatively charged metal complexes by Nafion112 membrane. No significance
differences were observed between OP-DGT and RG-DGT for Co, Ni, Zn and Pb at
1% OWR and Co, Ni and Pb in at 4% OWR. This suggests the labile complexes of
metals and organic ligands from oil may be smaller than the pore size of the restricted
viii
diffusive gel. Comparing (Dialysis 1000MWCO)-DGT and 1000MWCO- Micro Float
microdialysis measurements indicated that Co, Cd, Cu and Zn were complexed with
ligands small enough to pass through the 1000 MWCO- Micro Float microdialysis but
not labile enough to be retained in the (Dialysis 1000 MWCO)-DGT samplers.
DGT technique was applied to soils contaminated with both metals and crude
oil to evaluate the effect of oil level and aging on the availability of metals in soils.
The dissolved metals in soil solution (Csoln), labile concentrations by DGT (CDGT) and
extractable concentration by CaCl2 were measured. Values of labile pool size, Kd, and
R (ratio of CDGT and Csoln) were calculated and the kinetic parameters (response time
Tc and desorption rate k−1) were obtained using DIFS (DGT Induced Fluxes in Soils
and sediments) model. Increases of crude oil treatments in soils promoted the
formation of non-labile species of Cu and Pb and limited the availability of both
metals. The time scales of the kinetic exchanges obtained from DGT measurements
and DIFS modelling was reflected by the range of determined Tc values: from seconds
to 3 hours. The gradual decrease of Kd values for Cu with time in three studied soils
with and without oil application may be attributed to the strong tendency of Cu to be
associated with the solid phase with increasing incubation time. The Kd values of Ni
were generally decreased with adding of crude oil amendments in three soils may be
due to the release of Ni species from solid phase and crude oil to soil solution. Three
soils were resupply of Cd and Pb in general very slow to measure. The generally
slower release rates of Cd and Pb compared to other studied metals may reflect the
lower concentration of Cd and Pb which allowed a higher proportion of them to
associate strongly with organic ligands sites with slower release rates. The trend
changes for k-1 values of studied metals in three selected soils were influenced by
crude oil amendemnets and aging time.

ix
All developed DGT of different types, including DGT with ferrihydrite for
oxyanions (As, Se, Mo, V, Sb and W), were deployed in situ in seawater and
groundwater around refineries and industrial areas in Oman. Soils and sediments in
those areas were also collected for DGT deployments. The labile concentrations of Cr,
Co, Ni, Cu, Cd, and Pb were generally low and not significantly different at all the
sampling locations due to the formation of strong metals complexes with organic
ligands that are less labile. The measured concentrations of labile V in all selected
locations were much lower than the total V concentration in the filtered grab samples
(CSol (0.45 μm filtered)) due to high levels of large colloidal ligands from crude oil.
The low proportion of Ni labile species (11%-29%) was measured by (Nafion112)-
DGT in all selected open wells because Ni is mainly complexed by negatively charged
ligands and they were excluded by Nafion112 membrane. The labile Fe, Ni and Mn
concentrations in Wells-1 and -2 were much higher than those in Well-3 and (RIE)’s
wells reflecting the occurrence of more intense oil and industrial contamination in the
area. For coastal sediments near the refinery discharge point at Al Fahal port, the DGT
measured labile concentrations of Fe, Ni, Cu, and V were higher near the discharge
point.
The DGT concentrations of Al, Fe and Mn in soils collected from SIR ranged
from (12-22 µg/L), (14-63 µg/L) and (9-17µg/L) respectively, in line with the
background level of those metals. For 15 selected soils, their Kd ranged from (1.8-33)
ml/g for (Al, Cr, Mn, Fe, Ni and Cu). The Kd values of Pb were higher at soil locations
(L2, L7, L8 and L11) of 266, 65, 43 and 55 gm/L respectively due to the higher metal
retention by the solid phase through sorption reactions and low concentration in the
soil solution.

x
The obtained results suggest that risk assessment of sandy soils could be
carried out using measurements of metals in soil solutions. However, devices such as
DGT dynamic technique, which respond to the kinetics of supply, are essential to
evaluate available metal in high pH and crude oil contaminated soils. Because DGT is
a dynamic technique and it can be readily deployed in situ, in seawaters,
groundwaters, soils, and sediments, it provids kinetic information directly in crude oil
contaminated environmental systems and allows better better understanding and risk
assessments.

xi
Table of Contents Declaration ........................................................................................................................... iii Dedication .............................................................................................................................iv Acknowledgments ............................................................................................................... v Abstract ..................................................................................................................................vi Abbreviations .................................................................................................................... xiv List of Figures .................................................................................................................... xvi List of Tables ...................................................................................................................... xxi Chapter 1 – Introduction .................................................................................................. 1 Chapter 2 – Literature Review........................................................................................ 6
2.1. Trace Metals in the Marine Environment .................................................................. 6 2.2. Trace metal pollution and toxicity in the marine environment ........................ 7 2.3. Organic matter in seawater .......................................................................................... 15 2.4. Trace metals speciation in seawater ......................................................................... 16 2.5. Sources of Oil in the Marine Environment ............................................................... 21 2.6. Oil Contamination in the Oman Sea ........................................................................... 24 2.7. The Fate of Crude Oil Spills on The Marine Systems ............................................ 26 2.8. The effect of crude oil contamination on trace metal concentrations .......... 29 2.9. Different techniques for measuring metal speciation ........................................ 31
2.9.1. Equilibrium methods ............................................................................................................. 31 2.9.1.1. Potentiometric methods ................................................................................................................ 31 2.9.1.2. Permeation Liquid Membrane (PLM) ...................................................................................... 32 2.9.1.3. Donnan Membrane Technique (DMT) .................................................................................... 33 2.9.1.4. Equilibrium dialysis......................................................................................................................... 34
2.9.2. Dynamic techniques ............................................................................................................... 36 2.9.2.1. Voltammetry ....................................................................................................................................... 36 2.9.2.2. Competitive ligand exchange - adsorptive stripping voltammetry (CLE-ACSV) 40 2.9.2.3. Ion Exchange Resins ........................................................................................................................ 41
2.10. DGT (Diffusive Gradients in Thin films) ................................................................ 42 2.10.1. Factors affecting the DGT performance ...................................................................... 44 2.10.2. Use of DGT for trace metals speciation measurements ........................................ 49
2.11. Assessment of trace metals availability in soils .................................................. 54 2.12. Assessment of trace metals pollution in sediments .......................................... 58 2.13. Determination of labile trace metals fractions in groundwaters ................. 61 2.14. Water quality challenges in Oman ........................................................................... 62
Chapter 3 – Effects of Crude Oil Contamination on Trace Metals Availability in Seawater Using Diffusive Gradient in Thin Films ............................................. 64
3.1. Introduction........................................................................................................................ 64 3.2. Materials and Methods ................................................................................................... 66
3.2.1. Reagents, materials and solutions ................................................................................... 66 3.2.2. Diffusion coefficients measurements ............................................................................. 66 3.2.3. DGT Performance .................................................................................................................... 68 3.2.4. Effect of crude oil ligands on the trace metals fractions .......................................... 69
3.2.4.1. Measurement of labile trace metals in crude oil .................................................................. 69 3.2.4.2. Effect of mixing time of oil and water ....................................................................................... 70 3.2.4.3. Effect of oil to water ratios (OWR%) ....................................................................................... 71

xii
3.2.5. Influence of the diffusive layer thicknesses on the lability of metal complexes. ....................................................................................................................................................................... 71 3.2.6. Chelex resin extraction method ........................................................................................ 72
3.3. Results and Discussion ................................................................................................... 73 3.3.1. Diffusion Coefficients ............................................................................................................... 73 3.3.2. Effect of deployment time and ionic strength on the DGT measurements ....... 76 3.3.3. Resin extraction for labile metals (WSF) ...................................................................... 79 3.3.4. Comparison between DGT and resin extraction methods ..................................... 80 3.3.5. Effect of mixing times in the presence of 3% OWR ................................................... 81 3.3.6. Effect of oil to water ratios OWR% on DGT measurements .................................. 84 3.3.7. Effect of oil to water ratio on WSF of metals ............................................................... 88 3.3.8.Theinfluenceofdiffusivegelthicknesses(∆g) .......................................................... 90 3.3.9. Comparison of DGT measurements (labile) and resin extraction (WSF) ........ 99
3.4. Conclusion ........................................................................................................................ 100 Chapter 4 – Development of DGT technique with different membranes for metal speciation in crude Oil contaminated marine environments ............ 102
4.1. Introduction..................................................................................................................... 102 4.1.1. Nafion membrane properties ......................................................................................... 104 4.1.2. The synthesis and structure of Nafion membrane ................................................. 105 4.1.3. Use of Nafion film for excluding anionic species. .................................................... 107 4.1.4. Dialysis membranes ............................................................................................................ 109
4.2. Materials and Methods ................................................................................................ 111 4.2.1. Reagents, materials and solutions. ............................................................................... 111 4.2.2. Nafion preparation .............................................................................................................. 111 4.2.3. Float-A-Lyzer dialysis preparation. .............................................................................. 112 4.2.4. Diffusion coefficients measurements .......................................................................... 112 4.2.5. DGT devices ............................................................................................................................ 114 4.2.6. Performance of DGT devices of different diffusive layers in the synthetic solutions with and without crude oil. ........................................................................................ 115
4.3. Micro Float microdialysis of 1000 MWCO ............................................................. 116 4.4. Results and discussion ................................................................................................. 117
4.4.1. Diffusion Coefficients. ........................................................................................................ 117 4.4.2. The measurements of diffusion coefficients of metal ions using dialysis .... 118
4.5. Influence of crude oil on metal speciation using different types of DGT ... 122 4.6. Comparison of measurements by (1000 MWCO)-DGT and Micro Float microdialysis of 1000 MWCO .............................................................................................. 130 4.7. Conclusions ...................................................................................................................... 134
Chapter 5 – Investigation the effect of crude oil on metal availability in soils and aging processes ...................................................................................................... 135
5.1. Introduction.................................................................................................................... 135 5.1.1. DGT in soils ............................................................................................................................ 138 5.1.2. Objectives of the Study ...................................................................................................... 142
5.2. Methods and Materials ................................................................................................ 142 5.2.1. Reagents, chemicals and solutions ............................................................................... 142 5.2.2. Preparation of DGT devices ............................................................................................. 142 5.2.3. Soil amendments and soil sampling ............................................................................. 143 5.2.4. Soil pH and organic matter content .............................................................................. 143 5.2.5. DGT deployment and retrieval ....................................................................................... 144 5.2.6. Soil solutions measurement ............................................................................................ 145 5.2.7. Extraction using 0.01M CaCl2 .......................................................................................... 145 5.2.8. Quality control and quality assurance ......................................................................... 146 5.2.9. Samples analysis and calculations ................................................................................ 146
xiii
5.2.10. Using Two-Dimensional DGT-Induced Fluxes in Soils (2D-DIFS) ................. 147 5.3. Results and Discussion ................................................................................................ 148
5.3.1. DGT measured concentrations ....................................................................................... 148 5.3.2. Soil solution concentrations ............................................................................................ 154 5.3.3. Effect of oil and aging on R values ................................................................................. 159 5.3.4. CaCl2 extractable concentrations................................................................................... 163 5.3.5. Effect of oil and aging on Kd ............................................................................................. 167 5.3.6. DIFS calculations and interpretations for Tc ............................................................ 174 5.3.7. Dissociation rate (K-1) ........................................................................................................ 178
5.4. Conclusion ........................................................................................................................ 183 Chapter 6 – Assessing Water Quality and soil quality in Oman Using Developed Dynamic Speciation Technique DGT ................................................. 185
6.1. Introduction..................................................................................................................... 185 6.2. Experimental and Field Deployments .................................................................... 188
6.2.1. Description of the study area .......................................................................................... 188 6.2.2. Chemicals and Materials ................................................................................................... 190 6.2.3. Field deployments and sample collections ............................................................... 191
6.2.3.1. Deployment in seawater............................................................................................................. 191 6.2.3.2. Deployment in groundwaters .................................................................................................. 193 6.2.3.3. Collection of sediments and DGT deployments. .............................................................. 194 6.2.3.4. Collection of soils and DGT deployment.............................................................................. 195 6.3.3.5. Properties of soils .......................................................................................................................... 197 6.3.3.6. Calculation of kinetic parameters using DIFS ................................................................... 198
6.4. Results and Discussion ................................................................................................ 198 6.4.1. Metal concentrations and speciation in seawater .................................................. 198
6.4.1.1. Measurements of DBL ................................................................................................................. 199 6.4.1.2. Speciation of cation metals ........................................................................................................ 202 6.4.1.3. Concentrations of oxyanion metals ....................................................................................... 208
6.4.2. Metal concentrations and speciation in groundwaters ........................................ 214 6.4.2.1. DBL measurements ....................................................................................................................... 214 6.4.2.2. Speciation of cation metals ........................................................................................................ 216 6.4.2.3. Concentrations of oxyanion metals ....................................................................................... 225
6.4.3. Assessing labile metals and their resupply in sediments of Al Fahal port ... 228 6.4.4. Assessing labile metals, pool size and their kinetic properties in soils ......... 232
6.4.4.1. Soil pH, Organic Matter and Total Metal Concentrations ............................................ 232 6.4.4.2. Labile metals, soil solution and solid phase extraction ................................................ 236 6.4.4.3. Assessing resupply pool size and kinetic parameters using DIFS ........................... 242
6.4.4.3.1. The distribution coefficient, (Kd) ................................................................................. 242 6.4.4.3.2. Response time (Tc) ............................................................................................................ 243 6.4.4.3.3. Dissociation rate (K-1) ........................................................................................................ 244
6.5. Conclusion ........................................................................................................................ 247 Chapter 7 – General conclusions and future work ............................................ 250 References ........................................................................................................................ 256 Appendixes ....................................................................................................................... 292
Appendix (A).............................................................................................................................. 292 Appendix (B).............................................................................................................................. 293 Appendix (C) .............................................................................................................................. 294

xiv
Abbreviations (SIR) Sohar Industrial Region (Oman)
(RIE) Rusayl Industrial Estate (Oman)
PDO Petroleum Development Oman
WSF Water soluble fraction of crude oil
ASV Anodic stripping voltammetry
CLE-AdSV Competitive ligand exchange – Adsorptive stripping voltammetry
DM Diffusion coefficient of metal, cm2/s
IS Ionic strength
ICP-MS Inductively coupled plasma - mass spectrometry
DBL Diffusive boundary layer
ICP-OES Inductively coupled plasma -optical emission spectrometer
BDL Below the detection limit
Δ Thickness of the diffusive boundary layer
M Free metal ion
L Free ligand
PLM Permeation liquid membrane
RSD Relative standard deviation
SD Standard deviation
fe Elution factor
CDGT DGT measured concentration
Csol Concentration of metal in the soil solution
DIFS Diffusion Induced Fluxes in Soils
Kd Distribution coefficient for labile metal
xv
(R value) The DGT-measured concentration (CDGT ) to water-soluble fraction
K-1 Dissociation rate
TC Response time
∆g Diffusion layer thickness
OM Organic matter
DMT Donnan membrane technique
DGT Diffusive gradients in thin films
MWHC Maximum water holding capacity
A Area of the DGT window
APA Agarose cross-linked polyacrylamide [gel]
MQ water Millipore Milli-Q® I8-megOhm/cm deionized [water]
TOC Total organic carbon
LOI Loss on ignition
M Molar (moles per liter)
Psu Practical salinity unit
OWR% Crude oil to water ratio
PAHs Polyaromatic hydrocarbons
T DGT deployment time
DOC Dissolved organic carbon
J Flux
MWCO Molecular weight cut off
xvi
List of Figures
Figure 2.1. Representation of three types of speciation: 1) fractionation; 2) kinetic; 3) equilibrium speciation (Lead et al., 1997). ............................................18
Figure 2.2. Processes (weathering) determining crude oil fate (Snow et al., 2014). .........................................................................................................................................27
Figure 2.3. Modified cross -section of DGT components and the elution accumulated trace metals from Chelex-100 resin (Zhang and Davison, 1995; Wallner-Kersanach et al., 2009) ......................................................................................48
Figure 3.1. Chelex-100 resin extraction method using ion-exchange resin Chelex-100 for measuring WSF of metals. ..................................................................................73
Figure 3.2. Trace metal masses diffused across the diffusive gel and filter membrane with time during targeted metals diffusion cell experiment. The ionic strength 0.5 NaCl and the average temperature during the experiment was 19 ± 0.5 oCatpH≈5.6. ................................................................................................75
Figure 3.3. The mass of the metals accumulated by resin gel DGT devices as a function of time. DGT devices were suspended in a well-stirred solution 0.5 M NaCl and 0.7 M NaCl containing known concentrations for different time periods. The solid lines are the lines of best fit for the experimental data. The dashed lines are predicted relationships calculated from known deployment conditions and the DGT equation. ...................................................................................78
Figure 3.4. Percentages of CDGT/Cresin of determined trace metals ions by resin extraction and DGT methods in synthetic solutions of 0.5 M (�) and 0.7 M NaCl (•),contain100µg/Land50µg/L,respectivelyatpH≈5.64. ..................80
Figure 3.5. The influence of mixing time of oil to water on DGT-labile fractions of Cd, Cu, Co, Pb, Ni, Zn in WSF (dissolved species) of 3% OWR, containing 50 µg/Lof targeted tracemetals and at pH≈5.6 and16hdeployment, usingvarying mixing periods (0.25, 0.5, 1, 2, 4 and 6 days). ............................................83
Figure 3.6. The measured concentrations by CDGT in WSF and ICP-MS in WSF and before adding oil with various concentrations of WSF (dissolved species) (1,3,5,7 and 25 OWR%, w/v): ionic strength of 0.5 mol/L NaCl containing (35-40) µg/L, (30-60) µg/L, (25-45) µg/L, (50-60) µg/L, 60 µg/L, (40-60) µg/LofCd,Cu,Co,Pb,Ni,ZnatpH≈5.6. ......................................................................86
Figure 3.7. The determined labile fractions of metals Co, Ni, Cu, Zn, Cd and Pb using resin extraction method in the synthetic solutions without oil and with varying OWR (3%, 5% and 25%, w/v), containing 50 µg/L targeted metals, pH 5.6 at 0.5 mol/L NaCl ionic strength .......................................................................89

xvii
Figure 3.8. DGT results for Zn, Cd, Ni, Zn, Co and Pb deployed 12h in the syntheticsolutionof0.5mpl/LNaClwithnooil,atpH≈5.4andT=19°C,plotted as 1/mass (ng-1)versus thediffusive layer thickness (∆g; cm),DBLvalues for trace metals are illustrated on the plots. .................................................91
Figure 3.9. DGT results for Zn, Cd, Ni, Zn, Co and Pb deployed 24h in the 3 % OWR,WSFsolutionof0.5mol/LNaCl,atpH≈5.4andT=19°C,plottedas1/mass (ng-1)versus thediffusive layer thickness (∆g; cm),DBLvalues for studied trace metals are illustrated on the plots. .....................................................93
Figure 3.10. The ratio CDGT/Csolution, calculated where the DBL thickness is ignored and included, 12 h deployment in synthetic solution of 0.5 mol/L NaCl ionic strength contains 50 µg/L of nitrates of (Cd, Cu, Co, Ni, Zn and Pb), atpH≈5.4andT=19°Cwithoutoil. .............................................................................94
Figure 3.11. The ratio CDGT/CWSF of different diffusion layers, calculated where the DBL thickness is neglected and included using 3.08 cm2 sampling area, for 24 h deployment in a synthetic solution of 0.5 mol/L NaCl ionic strength containing50µg/Lofnitratesof(Cd,Cu,Co,Ni,ZnandPb),atpH≈5.4andT= 19 °C with 3% OWR, w/v. ............................................................................................96
Figure 3.12. The mass of the labile metal fractions accumulated by resin gel in DGT devices as a function of thicknesses (∆g). The DGT units of differentthicknesses of hydrogel were exposed to the synthetic solutions with 3% OWR and with no oil, containing ≈ 50 µg/L of Cd, Cu, Co, Ni, Pb and Zn nitrates, pH =5.6 and 0.5 mol/L NaCl ionic strength. Using the measured diffusion coefficients and including DBL and soil device effective sampling area =3.08 cm2. The solid lines are well fit for the experimental data; the dashed lines are predicted relationships derived from deployment parameters using DGT equation. .....................................................................................98
Figure 3.13. CDGT/CWSF of metals Co, Ni, Cu, Zn, Cd and Pb in the synthetic solutions without oil and with varying OWR (3%, 5% and 25%, w/v), containing 50 µg/L targeted metals, pH 5.6 at 0.5 mol/L NaCl ionic strength. ......................................................................................................................................................99
Figure 4.1. Cluster-network model for the interactions between polymer and water in Nafion membrane (Smitha et al., 2005; Ramkumar, 2012). ............ 107
Figure 4.2. Micro Float-A-Lyzer .......................................................................................... 110
Figure 4.3. Diffusion Cell ........................................................................................................ 113
Figure 4.4. Nafion112- DGT assembly .............................................................................. 115
Figure 4.5. Plots of masses of metals ions diffused through filter membrane and diffusive gel with dialysis membrane versus time during 3 hours and 45 minutes diffusion cell experiment at 21 °C and pH = 5.6. ................................... 119
xviii
Figure 4.6. Plots of masses of metals ions diffused through filter membrane and diffusive gel plus Nafion112 membrane versus time during 8 hours diffusion cell experiment at 22 °C and pH = 5.6. ....................................................................... 121
Figure 4.7. The mass of metals accumulated by five types DGT devices with the various ratios of crude oil (1% and 4% w/v) concentrations of metals=20µg/L, pH=5.6, ionic strength = 0.5 mol/L of NaCl, deployment times: 17 hours except (Nafion112)-DGT were carried out for 24h. ............. 124
Figure 4.8. Effect of pH on performance of five types used DGT samplers for the measurement of Pb, Zn, Co, Cu, Cd and Ni in well-stirred synthetic solutions containing various ratios of crude oil (0, 1 and 4 w/v%) concentrations of metals=20µg/L, pH=5.6, ionic strength = 0.5 mol/L of NaCl, deployment times: 17 hours except (Nafion112)-DGT were carried out for 24h. ............. 126
Figure 4.9. Concentrations of metals in five versions of DGT devices in well-stirred synthetic solutions containing various ratios of crude oil (0, 1 and 4 w/v%) concentrations of metals=20µg/L, pH=5.6, ionic strength = 0.5 mol/L of NaCl, deployment times: 17 hours except (Nafion112)-DGT were carried out for 24 h. ........................................................................................................................... 129
Figure 4.10. Concentrations of Co, Cu, Ni, Zn, Cd and Pb in synthetic solutions with and without oil measured by (Dialysis1000 MWCO)-DGT and Micro Float microdialysis of 1000 MWCO. ............................................................................ 131
Figure 5.1. Schematic representation of the concentration of metal in solution in DGT and the adjacent soil after 24 hours, for three cases: (i), very fast release from solid phase; (ii), fairly slow release; (iii), no release. Layer A is the resin gel and layer B is the diffusion layer. (Taken from Zhang and Davison, NATO book chapter) ....................................................................................................................... 140
Figure 5.2. Determinations in CDGT-labile species of Co, Ni, Cu; Zn, Cd, and Pb in three soils treated and untreated with crude oil during aging time. ............. 150
Figure 5.3. (A-F). Determinations of total dissolved concentrations in soil solutions of Co, Ni, Cu, Zn, Cd and Pb in Coney Green, Gibson and Knowle Road soils treated and untreated with crude oil (0%, 2% and 8% w/w) and incubated. ................................................................................................................................ 158
Figure 5.4-(A-F). Determinations of trace metals concentrations in extracted in CaCl2 species of Co, Ni, Cu, Zn, Cd and Pb in three soils with without crude oil during aging time................................................................................................................ 167
Figure 5.5. The Kd values for Co, Ni, Cu, Zn, Cd and Pb on Coney Green, Gibson and Knowle Road soils treated with varying levels of crude oil 0%, 2% and 8% w/w during incubation time. ................................................................................. 173

xix
Figure 5.6. Dissociation rate, K-1 estimated for Co, Ni, Cu, Zn, Cd and Pb using DIFS at day (1) and week (8) of three studied soils impacted with different concentrations of crude oil, (0, 2, 8 % w/w). .......................................................... 180
Figure 6.1. Schematic map showing locations of sampling areas in economic regions in Muscat and Sohar in the Sultanate of Oman (Baawain, 2011; S. A. Al Maashri 2011). .............................................................................................................. 189
Figure 6.2. Modified figure, the DGT set-up and anchoring in fish cage for seawater deployment (Harman et al., 2010) ........................................................... 192
Figure 6.3. Collecting well water samples by lowering a weighted bottle into an open well (Bartram and Ballance, 1996) .................................................................. 193
Figure 6.4. Modified map of soils sampling locations in (SIR) (Al-Shuely et al., 2009). ...................................................................................................................................... 196
Figure 6.5. Plots of 1/mass Ni, Cd, Cu and Co (ng-1) accumulated in DGT devices versus diffusion layer thicknesses (∆g, cm) at two locations in the SoharIndustrial Region. ............................................................................................................... 200
Figure 6.6. Plots of 1/mass Ni, Cd, Cu and Co (ng-1) accumulated in DGT devices versus diffusion layer thicknesses (∆g, cm) at two locations in SoharIndustrial Region. ............................................................................................................... 201
Figure 6.7. Measured labile metal concentrations by OP-DGT, (1000 MWCO-dialysis)-DGT and (Nafion112)-DGT at four locations of seawaters in the Al Fahal port and SIR. ............................................................................................................. 203
Figure 6.8. The ratios of DGT labile metal species in 0.45 µm filtered grab samples from four selected locations in Al Fahal port and Sohar Industrial Region (SIR). ......................................................................................................................... 205
Figure 6.9. Ferrihydrite DGT concentrations of labile V, As, Mo, Se, Sb and W in four locations of seawater in Al Fahal port and SIR. ............................................. 210
Figure 6.10. The percentage of DGT labile V, As, Mo; Se, Sb and W 0.45 µm filtered grab samples from four selected locations in Al Fahal port and Sohar Industrial Region (SIR). .................................................................................................... 211
Figure 6.11. DGT results for Co, Ni, Cu and Cd in selected wells waters at RIE in Muscat and SIR in Sohar, plotted as 1/mass of versus the diffusive layer thickness(∆g,cm). ............................................................................................................. 215
Figure 6.12. Measured trace metals fractions in five open well waters at different sites by three versions of DGT samplers. ............................................... 217
Figure 6.13. The percentages of CDGT-labile metal species in studied wells of the total content in 0.45-μmfilterablegrabsamples. .................................................. 218
xx
Figure 6.14. The measured concentrations of FH-DGT labile V, As, Mo, Se, Sb and W species in the selected six open Wells waters in Muscat near RIE and Sohar in Khadafan near SIR, in the Sultanate of Oman, in January 2015. ..... 226
Figure 6.15. The percentages of FH-DGT labile V, As, Mo, Se, Sb and W fraction to 0.45 µm filterable grab samples in all studied six open well waters in Muscat near (RIE) and Sohar in Khadafan near (SIR), in the Sultanate of Oman, in January 2015. ....................................................................................................................... 227
Figure 6.16. Percentages of labile trace metals fractions using OP-DGT and FH-DGTin0.45μmfilterableporewatersneardischargepointofarefineryinAlFahal port, Muscat, Sultanate of Oman. ...................................................................... 230

xxi
List of Tables
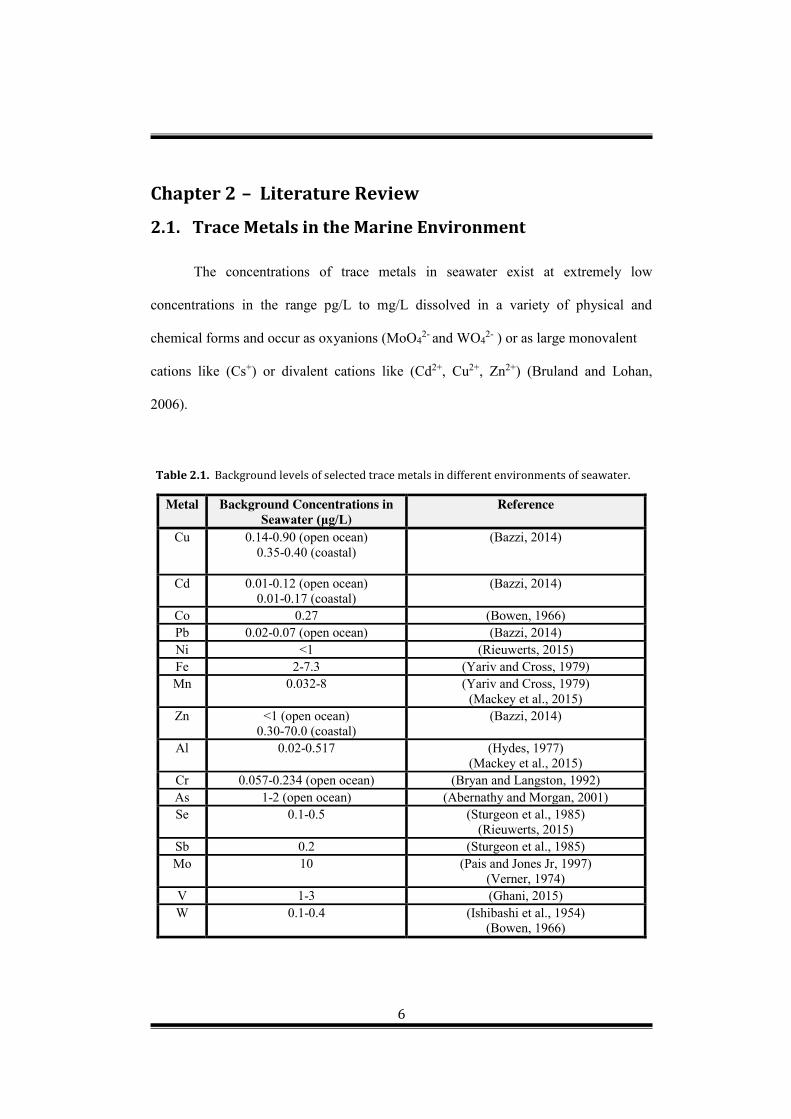
Table 2.1. Background levels of selected trace metals in different environments of seawater. ................................................................................................................................ 6
Table 2.2. Concentrations of selected contaminants with increased concentrations in relation to coastal and marine areas pollution......................12
Table 2.3. Sources of oil inputs in the marine systems from human activities. ...23
Table 2.4. DGT development and applications by different research groups. .......44
Table 2.5. The measured heavy metals contents in (SIR) (mg/kg) and compared with other studies (Al-Shuely et al., 2009). .................................................................60
Table 3.1. Diffusion coefficients of metal ions through filter membrane and diffusive gel in 0.5 M NaCl ionic strength at temperature. ....................................74
Table 3.2. Measured trace metals by resin extraction (WSF) and DGT methods in synthetic solutions of 0.5 M and 0.7 M NaCl, contain 100 µg/L and 50 µg/L, respectivelyatpH≈5.64. ...................................................................................................79
Table 3.3. Trace metal fractions measured in WSF of crude oil at varying mixing times. ..........................................................................................................................................81
Table 3.4. Measured trace metals in crude oil using DGT compared with the obtained results in Oman oil provided by PDO..........................................................84
Table 3.5. The measured concentrations of labile trace metals (µg/L) in synthetic solutions with and without varying concentrations of WSF of different OWR%. ....................................................................................................................90
Table 4.1. Diffusion coefficients through filter membrane and diffusive gel with andwithoutdialysisandNafion112membranes(pH=5.6,∆g=0.097cm;A=1.77 cm2) ................................................................................................................................ 118
Table 5.1. The pH values and OM% of the three soils. ................................................. 144
Table 5.2. Soil deployment temperatures for each sampling period. ................... 145
Table 5.3. (R) Values for studied metals in Coney Green soil with and without crude oil. ................................................................................................................................. 160
Table 5.4. (R) Values for studied metals in Gibson soil with and without crude oil. ................................................................................................................................................... 161
Table 5.5. (R) Values for studied metals in Knowle Road soil with and without crude oil. ................................................................................................................................. 161

xxii
Table 5.6. The obtained the response time (TC) from DIFS model using (R) values of Co, Ni, Cu, Zn, Cd and Pb for three studied soils with and amended with varying levels of crude oil (% w/w) in day (1) and week (8) during incubation time. .................................................................................................................. 176
Table 6.1. Parameters for ten sampling locations in Muscat and Sohar regions. ................................................................................................................................................... 199
Table 6.2 The total metals concentrations in 0.45 mm- filtered grab samples and unfiltered samples measurements (μg L−1) ratios of (Csol(0.45 µm filtered grab)/ Csol(unfiltered)) of all targeted metals in four sites of Sea of Oman. ...................... 208
Table 6.3. The total oxyanion metals concentrations in 0.45 mm- filtered grab samplesandunfilteredsamplesmeasurements(μgL−1) ratios of (Csol(0.45 µm
filtered grab)/ Csol(unfiltered)) of all targeted metals in four sites from the Sea of Oman. ...................................................................................................................................... 213
Table 6.4. The measured concentrations of DGT labile species (µg/L) by OP-DGT, (1000 MWCO-dialysis)-DGT and (Nafion112)-DGT in open well water-(1) in SIR. ............................................................................................................................................ 217
Table 6.5. Comparisonoftargetedtracemetalsconcentrations(μg/L)in0.45μmfiltered and unfiltered collected waters from well samples at selected wells in RIE and SIR regions. ..................................................................................................... 225
Table 6.6. Comparison of targeted oxyanionsmetals concentrations (μg/L) in0.45 μm filtered and unfiltered collected waters from well samples at selected wells in RIE and SIR regions. ........................................................................ 228
Table 6.7. Measured concentrations total content of all studied trace metals in 0.45 filtered pore waters and labile studied trace metals fractions by OP-DGT and FH-DGT (µg/L) for oxyanions near discharge point of refinery in Al Fahal port, Muscat, Sultanate of Oman. .................................................................................. 229
Table 6.8. General properties of soils collected from the study area near Sohar Industrial Region, Sultanate of Oman. ........................................................................ 234
Table 6.9. Natural background levels (mg/kg) of studied metals in soils from other countries in the literature. .................................................................................. 236
Table 6.10. The measured CDGT (µg/L), Csol, R values and extracted concentrations in CaCl2 solutions (µg/kg) of targeted 10 trace metals in fifteen sandy coastal soils, around (Sohar Industrial Region), Sultanate of Oman, January 2015. ......................................................................................................... 240
Table 6.11. The measured CDGT (µg/L), Csol, R values and extracted concentrations in CaCl2 solutions (µg/kg) of targeted oxyanions metals in fifteen sandy coastal soils, around (Sohar Industrial Region), Sultanate of Oman, January 2015. ......................................................................................................... 241

xxiii
Table 6.12. Determined parameters of Kd, Tc and K-1 values for all studied metals in the collected soils near Sohar Industrial Region (SIR), sultanate of Oman ................................................................................................................................................... 245
Table 6.13. Determined parameters of Kd, Tc and K-1 values for all studied oxyanions in the collected soils near Sohar Industrial Region (SIR), sultanate of Oman. ................................................................................................................................. 246
1
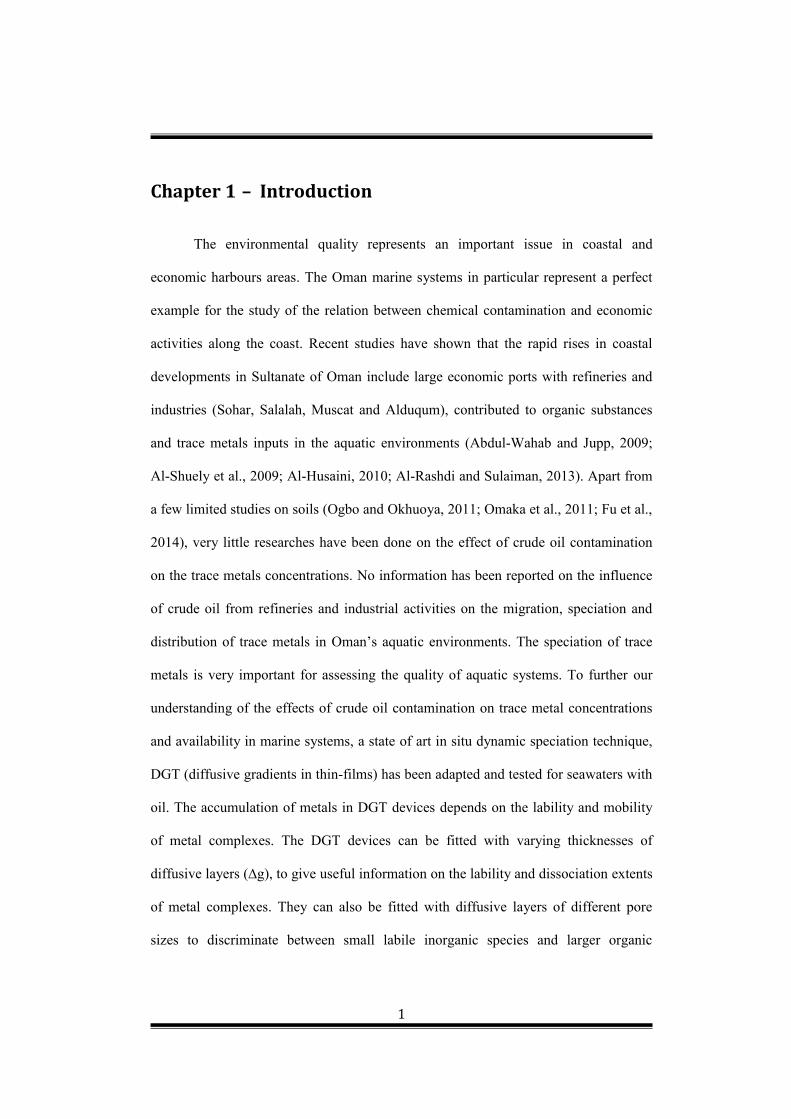
Chapter 1 – Introduction
The environmental quality represents an important issue in coastal and
economic harbours areas. The Oman marine systems in particular represent a perfect
example for the study of the relation between chemical contamination and economic
activities along the coast. Recent studies have shown that the rapid rises in coastal
developments in Sultanate of Oman include large economic ports with refineries and
industries (Sohar, Salalah, Muscat and Alduqum), contributed to organic substances
and trace metals inputs in the aquatic environments (Abdul-Wahab and Jupp, 2009;
Al-Shuely et al., 2009; Al-Husaini, 2010; Al-Rashdi and Sulaiman, 2013). Apart from
a few limited studies on soils (Ogbo and Okhuoya, 2011; Omaka et al., 2011; Fu et al.,
2014), very little researches have been done on the effect of crude oil contamination
on the trace metals concentrations. No information has been reported on the influence
of crude oil from refineries and industrial activities on the migration, speciation and
distribution of trace metals in Oman’s aquatic environments. The speciation of trace
metals is very important for assessing the quality of aquatic systems. To further our
understanding of the effects of crude oil contamination on trace metal concentrations
and availability in marine systems, a state of art in situ dynamic speciation technique,
DGT (diffusive gradients in thin-films) has been adapted and tested for seawaters with
oil. The accumulation of metals in DGT devices depends on the lability and mobility
of metal complexes. The DGT devices can be fitted with varying thicknesses of
diffusive layers (∆g), to give useful information on the lability and dissociation extents
of metal complexes. They can also be fitted with diffusive layers of different pore
sizes to discriminate between small labile inorganic species and larger organic

2
complexes (Lehto et al., 2006; Panther et al., 2008). Recent studies demonstrated that
DGT can be used in conjunction with dialysis membranes of varying molecular weight
cut-off (MWCO) in the front of the diffusive gel layer to provide a separation of the
smaller inorganic metal species from the larger colloidal species (Gimpel et al., 2003;
Li et al., 2003; Fan et al., 2013; Pouran et al., 2014). More recent studies have used
Nafion membrane in DGT and other passive samplers in direct contact with receiving
phase to prevent the transport of negatively charged metal ligands complexes across
the diffusion membrane and only allow positively charged species to be measured
(Blom et al., 2003; Hurst and Bruland, 2005; Panther et al., 2008). However, this has
not been thoroughly and systematically investigated for wider application.
The study presented here for the thesis is the first to investigate the influence of
crude oil ligands on trace metal speciation using DGT. The aim of this study is to
develop a simple in situ speciation method to assess the concentration, distribution and
speciation of trace metals in Oman coastal aquatic environment and soil system. The
objectives are:
i. To develop and test DGT method, with different types of devices, for trace
metals speciation in seawaters, groundwaters and soils contaminated with
crude oil matrix.
ii. To investigate the effects of crude oil on the trace metals availability in the
aquatic environment and the impact of oil matrix on metal speciation and
complexation.
iii. To investigate the effect of oil level and aging on the availability of metals in
soils using DGT measurements and DIFS model.
iv. To assess the impact of oil industries on Oman coastal environment quality
(seawater, groundwaters, sediments and soils) using developed DGT devices,
3
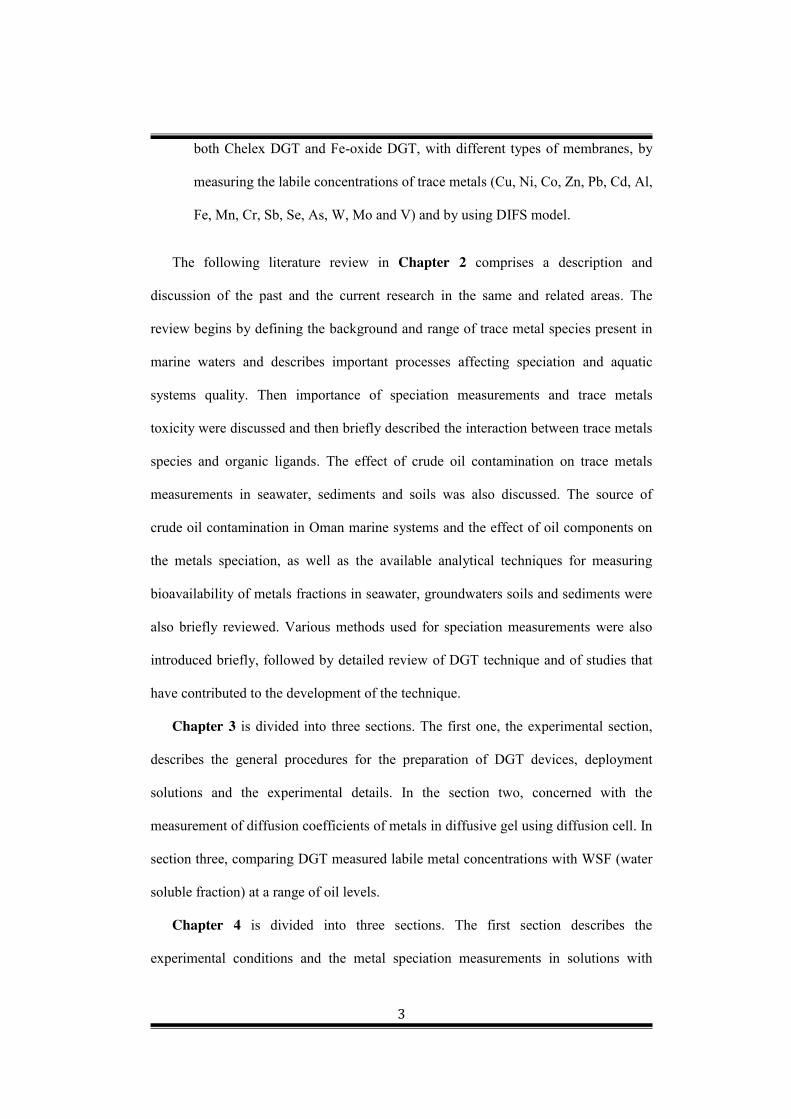
both Chelex DGT and Fe-oxide DGT, with different types of membranes, by
measuring the labile concentrations of trace metals (Cu, Ni, Co, Zn, Pb, Cd, Al,
Fe, Mn, Cr, Sb, Se, As, W, Mo and V) and by using DIFS model.
The following literature review in Chapter 2 comprises a description and
discussion of the past and the current research in the same and related areas. The
review begins by defining the background and range of trace metal species present in
marine waters and describes important processes affecting speciation and aquatic
systems quality. Then importance of speciation measurements and trace metals
toxicity were discussed and then briefly described the interaction between trace metals
species and organic ligands. The effect of crude oil contamination on trace metals
measurements in seawater, sediments and soils was also discussed. The source of
crude oil contamination in Oman marine systems and the effect of oil components on
the metals speciation, as well as the available analytical techniques for measuring
bioavailability of metals fractions in seawater, groundwaters soils and sediments were
also briefly reviewed. Various methods used for speciation measurements were also
introduced briefly, followed by detailed review of DGT technique and of studies that
have contributed to the development of the technique.
Chapter 3 is divided into three sections. The first one, the experimental section,
describes the general procedures for the preparation of DGT devices, deployment
solutions and the experimental details. In the section two, concerned with the
measurement of diffusion coefficients of metals in diffusive gel using diffusion cell. In
section three, comparing DGT measured labile metal concentrations with WSF (water
soluble fraction) at a range of oil levels.
Chapter 4 is divided into three sections. The first section describes the
experimental conditions and the metal speciation measurements in solutions with

4
varying (OWR%) using DGT devices with different membranes. Five types of DGT
devices were introduced with open pore (OP) and a restricted pore (RP) diffusive gels,
1000 MWCO and 3500 MWCO dialysis and Nafion112 membranes. The section two
focuses on the measurement of diffusion coefficients of metals (Cd, Co, Cu, Ni, Pb
and Zn) through diffusive gel and filter membranes with dialysis and Nafion 112
membranes placed in the front of them, using a specifically designed diffusion cell.
Section three presents and discusses the results obtained by all DGT devices in
solutions without and with oil. Labile metal concentrations by (1000MWCO)-DGT
were also compared with equilibrium concentrations by Micro Float microdialysis of
1000 MWCO.
Chapter 5 has two main results sections addresses the effect of crude oil (at
different OWR%) and aging (at different incubation time) on speciation and
availability of metals (Co, Cu, Cd, Ni, Pb and Zn) in soils. In the second section uses
the DIFS model to further understand the obtained results. The kinetic parameters,
such as dissociation rate constant (k-1) and response time (TC) were modeled using
DIFS. The ratios (R) and distribution coefficients (Kd) were obtained from the DGT,
soil solution and CaCl2 extraction measurements. All parameters R, Kd, Tc and k-1
were discussed and interpreted in the context of metal availability in soils.
In Chapter 6 the developed DGT methods and knowledge were applied in Oman’s
marine water, groundwaters, sediments and soils around large economic ports with
industries and refineries (Muscat and Sohar) and industrial region in Muscat to assess
the impact of oil industries on the environmental quality of that region. Kinetic
parameters of desorption from the soil particles to the soil solutions without and with
oil were obtained from the DIFS model. The availability of metals, including both

5
cation metals and oxyanion metals in soils and sediments were assessed based on R,
Kd and kinetic parameters TC and k-1.
Chapter 7 provides the main conclusions of each chapter of the work and discusses
the possibilities of the future research arising from these studies.
6
Chapter 2 – Literature Review
2.1. Trace Metals in the Marine Environment
The concentrations of trace metals in seawater exist at extremely low
concentrations in the range pg/L to mg/L dissolved in a variety of physical and
chemical forms and occur as oxyanions (MoO42- and WO4
2- ) or as large monovalent
cations like (Cs+) or divalent cations like (Cd2+, Cu2+, Zn2+) (Bruland and Lohan,
2006).
Table 2.1. Background levels of selected trace metals in different environments of seawater.
Metal Background Concentrations in Seawater (μg/L)
Reference
Cu 0.14-0.90 (open ocean) 0.35-0.40 (coastal)
(Bazzi, 2014)
Cd 0.01-0.12 (open ocean) 0.01-0.17 (coastal)
(Bazzi, 2014)
Co 0.27 (Bowen, 1966) Pb 0.02-0.07 (open ocean) (Bazzi, 2014) Ni <1 (Rieuwerts, 2015) Fe 2-7.3 (Yariv and Cross, 1979) Mn 0.032-8 (Yariv and Cross, 1979)
(Mackey et al., 2015) Zn <1 (open ocean)
0.30-70.0 (coastal) (Bazzi, 2014)
Al 0.02-0.517 (Hydes, 1977) (Mackey et al., 2015)
Cr 0.057-0.234 (open ocean) (Bryan and Langston, 1992) As 1-2 (open ocean) (Abernathy and Morgan, 2001) Se 0.1-0.5 (Sturgeon et al., 1985)
(Rieuwerts, 2015) Sb 0.2 (Sturgeon et al., 1985) Mo 10 (Pais and Jones Jr, 1997)
(Verner, 1974) V 1-3 (Ghani, 2015) W 0.1-0.4 (Ishibashi et al., 1954)
(Bowen, 1966)
7
Some trace metals (e.g molybdenum (Mo)) have a significant biological
requirement; however, they tend to occur in seawater at a relatively high concentration
relative to their requirement by the biota (Bruland and Lohan, 2006). Background
concentrations of selected trace metals Table 2.1 as assessment tools are intended to
represent the concentrations of certain contaminants that would be expected in the
seawater if certain industrial and crude oil activities had not occurred.
The distribution of trace metals in seawater are governed by a combination of
processes that transport trace metals, naturally dissolved or from human activities,
atmosphere (fluvial and downwind) and hydrothermal vents (heat flux in the sea floor
release large volumes of heat) to the ocean (Sander and Koschinsky, 2011). Although
trace metals are present in dissolved, colloidal and particulate forms, they occur at
very low concentrations that are generally variables. Most of the trace metals species
in surface seawater, especially those that are bioactive such as Cd, Co, Cu, Pb, Ni and
Zn, are particularly chelated by natural organic ligands (Hatje et al., 2001; Wallner-
Kersanach et al., 2009). The interaction of dissolved trace metals with particles
suspended in seawater is a major control on the observed concentration and
distribution of trace metals in seawater (Sherrell and Boyle, 1992).
2.2. Trace metal pollution and toxicity in the marine environment
Trace metal contamination in the coastal and marine environment is a
widespread worry globally. Trace metals pollution in seawater received a great deal of
attention especially in the last several decades due to their impacts on marine ecology
and other aspects of the marine systems (Hwang et al., 2015). The increase of trace
metals contamination in coastal waters pose a serious threat to the health of marine
living resources, the people who consume seafood products and natural ecosystems
8
because of their inherent enormous sources, persistence, toxicity and carcinogenic
through bioaccumulation in living organisms and food chains (Arifin et al., 2012;
Naser, 2013; Wang et al., 2013). Trace metals toxicity in seawater largely influenced
by the biological availability of the metals, which is determined according to their
physical and chemical forms. For example, the toxicity of metals can be reduced when
they are adsorbed to organic complexes, therefore decreasing their ionic fractions in
the seawater media (Mamboya, 2007). The small forms of organism in marines are
considered the most sensitive to metals pollution (Mulak, 1997). Although trace
metals such as Pb and Hg can damage an organism if a significant quantity is
swallowed in a short time, most trace metals affects aquatic life in seawater by
decreasing organisms’ longevity and their recruitment (Madsen, 2013). Living
organisms can be poisoned even with low levels of trace metals in marine systems.
This is due to the biochemical function in metabolic processes and the degree to which
the metals are absorbed and excreted by organisms. For example, blood and
hematocrit levels of Pb and enzymatic tests, may suggest that animals are being
poisoned with this metal. Lead is a dangerous chemical pollutant in ecosystem, as it
able to accumulate in organisms and enter food chains. Exposure to high level of Pb
can cause serious biological effects, depending on the concentration and exposure
time, including damage to the kidney, brain and nervous system (Govind and Madhuri,
2014). Cd has a long half-life (>10 years in terrestrial mammals) and able to form Cd-
Se complex (as in the case of Hg), suggesting the formation of a (Se) metabolite (as in
the case of mercury), suggesting the formation of a selenium metabolite (Jakimska et
al., 2011). Copper is one of the important metals known to be necessary to human’s
body. It is present in various proteins, such as oxidase, ceruloplasmin and galactose.
However, uptake of more than 100 mg/kg is toxic to humans. Copper can block

9
sulfhydryl group in enzymes and proteins, which causes toxicity in the human body.
Chronic exposure to high levels of copper salts or ionic forms can affects nervous
systems and kidney. Moreover, different diseases such as cardiovascular ones have
been related to contaminated drinking water by Cu (Ayres and Hellier, 1997). Nickel
(Ni) generally, in seawater is present at a very low levels ranged from 0.1- 0.5 μg/l.
various studies demonstrated that the hepatic toxicity related to nickel exposure and
dose affect enzyme activity (Cempel and Nikel, 2006).
Most of coastal areas in seawaters around the world suffering from the increase
of trace metals pollution pressures due to the discharges through a variety of sources,
including industries, wastewaters and domestic effluents and crude oil refineries (Pan
and Wang, 2012). Human activities concentrated in industrial areas significantly
influence the migration and distributions of trace metals in coastal marines (Peer and
Safahieh, 2011; Lim et al., 2013; Jilani, 2014; Hernández-Crespo and Martín, 2015).
Jilani (2014) reported that about 73.5% of effluents containing organic and trace
metals contaminants reach Pakistan coastal waters through Karachi economic harbour
due to receiving a continuous discharged of domestic and industrial waste. Moreover,
the effluents from factories and oil production platforms: chemical spills; discharges
from engines, releases from tankers and accidental spills are also considered a
common source of trace metals contamination in coastlines. Kibria et al. (2016) found
that the Karnafuli Estuary, and adjacent coastal areas of Chittagong in Bangladesh
were highly affected by metal contamination problem (cadmium, chromium, copper,
mercury, nickel, lead, uranium) through agricultural, domestic and wastes discharges
into the waterways in coastal environments of Bangladesh (Luoma et al., 2008; Kibria
et al., 2016). Study by Avila-Pérez et al. (1999) investigated about trace metal levels in
water and bottom sediments of a Mexican reservoir. The work demonstrated that Hg,

10
Pb, Cr and Fe were the high-risk metals pollution. The study also identified the spatial
and temporal distributions of total metal concentrations. The high levels metals
pollution being determined due to the anthropogenic activities such as: building
industries, organic and inorganic chemicals, motor vehicles factories or for leaching of
organic mercury pesticides possibly used in the agricultural practices around the area
(Avila-Pérez et al., 1999).
Crude oil pollution of the marine waters affects the creatures of the seawaters,
which in turn affects most of the environment. The accumulation of trace metals in
seawaters has been reported for a number of countries including Gulf countries, Brazil,
Korea and Nigeria (Bu-Olayan et al., 1998; Jung et al., 2013; de Souza et al., 2014;
Ekpenyong and Udofia, 2015; Freije, 2015). Although there have been investigations
on crude oil pollution in marine waters of Sultanate of Oman (Al-Husaini et al., 2014),
data on trace metal concentrations and speciation for local seawaters affected by oil
pollution are lacking. De Souza et al. (2014) demonstrated that the availability of trace
metals at a northeastern Brazilian coastal area under the influence of oil production
activities. The study showed that the total levels of Cd, Cu, Pb, Ni, and Zn in seawater
samples collected at two different sites of two campaigns were released from oil
industry (de Souza et al., 2014). The coastlines of the Arabian Gulf countries are
recognised as hotspots for high levels of trace metals due to receiving of intensive
industrial and refineries discharges along coastal marines. The marine waters in Gulf
countries have been the scenes crude oil spill accidents. For instance, in the 1991 Gulf
War, an estimated 10.8 million barrels of oil were spilled in the Arabian Gulf waters.
Elevated levels in heavy metals were reported after this major oil spill. Petroleum
refinery wastewaters are composed of different chemicals, which include oil and
greases, phenols, sulphides, ammonia, suspended solids, and heavy metals like
11
chromium, iron, nickel, copper, molybdenum, selenium, vanadium and zinc. People of
the Arabian Gulf are related economically and socially to the sea.
Trace metals accumulated in fish and other aquatic animals from food and
water that passes through their gills depending on the quantity of food ingested and
trace metals levels present in the food. Accumulation takes more time and probably
result in high concentrations in aged and big fish such as mercury in shark and tuna
(Bremner, 2002). Approximately more than 97% of the worldwide catch of seawater
fish comes from within less than 300 km of shore, and most of the decline in the
global fishing industry is attributed to damage of coastal seawaters habitat. The
seafood are necessary diet items for local communities and can be commercially
exported items (Al-Awadhi, 1999). Marine waters of the Oman Sea, Arabic Gulf and
Arabian Sea have been rich in varieties of fish and seafood, which are a main source
of food especially for local societies. Al-Yousuf et al. (2000) measured the
concentrations of some trace metals in various fish species obtained from different
locations along the western coasts of the, Saudi Arabia and Kuwait and United Arab
Emirates. This work found that the measured levels metals do not constitute a risk
factor for public health and seem to be exceeded the permissible limits for human
consumption (Naser, 2013). Study in Kuwait performed by Al-Majed and Preston
(2000) measured the levels of Total-Mercury (T-Hg) and Methyl-Mercury (Me-Hg)
fish species collected from Kuwait coastal marines. The work found that the
concentrations of T-Hg and Me-Hg in 20.6% of the 330 fish species were above the
WHO permissible limits, which is attributed to discharges from refineries and
petrochemical industries (Naser, 2013).

12
Table 2.2. Concentrations of selected contaminants with increased concentrations in relation to coastal and marine areas pollution.
Country Media Reported Levels Reference
China (Hong Kong)
Coastal Sediment Cd, Cu, Cr, Hg, Ni, Pb, Zn and As, 1.3, 171, 51, 0.43, 23, 69, 223, and 7.5 mg/kg respectively.
(Wang et al., 2013).
Pakistan Coastal seawater (Harbour)
Mg, Fe, Mn, Cu, Ni, Zn, Cr, Pb, Cd, and Co, (1.01-7.47 ug/l), (0.27- 1.05, 0.04-0.27, 0.05-0.43, 0.07-1.86, 0.09-1.77, 0.05-1.04, 0.43-0.62, 0.03-0.2 0.24-0.52 mg/L) respectively.
(Qari and Siddiqui, 2008).
Australia Australian coastline marine
Cd (125 μg g−1), Pb (2,425 μg g−1) and Zn (7,974 μg g−1)
(Chakraborty and Owens, 2014).
Japan Coastal sea sediment Cu, Pb, Zn, Cr, As, 32, 25, 135, 46 and 11.7 (mg/kg) respectively.
(Ahmed et al., 2010).
Korea Coastal sea sediment Cu, Pb, Zn, Cd, Cr, As and Hg, 37, 35, 122, 0.25, 58, 9.1 and 0.05 (mg/kg), respectively.
(Hwang et al., 2015).
Singapore Coastal environment As, Cd, Cr, Cu, Ni, Pb and Zn, In the range, 0.34–2.04, 0.013–0.109, 0.07–0.35, 0.23–1.16, 0.28–0.78, 0.009–0.062 and 0.97–3.66 μg/ L, respectively.
(Cuong et al., 2008).
Iran Coastal seawater Cr, Zn, Cd and Pb, Range, 80-123, 61-97, 63-87 and 82-120 µg/L
(Saghali et al., 2014).
Iran Iranian coastal sediment of the Oman Sea
Cu, Pb and Ni, 38.28, 50.37 and 26.90 μg/g, respectively.
(Peer and Safahieh, 2011).
United Arab Emirates (UAE)
Coastal sediment Co, 45.2 µg/g (Freije, 2015).
Oman Coastal sediment, Al Fahal Port
Pb, Cd, V and Cu, 10.5, 1.8, 42.0 and 13.6, respectively.
(Al-Husaini et al., 2014).
Saudi Arabia, Jeddah Coast
Jeddah Islamic Port As, Pb, Cu, Zn 0.31, 1.2, 0.40 and 0.41 (mg/L).
(Ali et al., 2011).
Bahrain Coastal sediment
Pb, 111 mg/kg Cu, in the range, (4.53–119 µg /L).
(Freije, 2015).
Additionally, the source of freshest water in many Gulf countries obtained
through desalination of seawater, which is account for more about 60% of the global

13
total production. Large amounts of water from desalination plants were rejected due to
the daily discharged trace metals to coastal waters. High concentrations of trace metals
have been reported at the proximities of numerous desalination plants along the
coastline of the marines Arabian Gulf (Lattemann and Höpner, 2008; Abdul-Wahab
and Jupp, 2009). A numerous of trace metals contamination studies in coastal and
marine areas were carried out globally were investigated in wide varieties of coastal
media as shown in Table 2.2.
The Gulf in general and the Sea of Oman in particular represent a good
example for the study of the relationship between the levels of trace metals and coastal
situations (de Mora et al., 2004). Al Fahal port in Muscat and Sohar industrial harbor
are the main locations for main economic activities involve crude oil transport, so
there is the possibility of organic and trace metal contamination in the marine waters
around these areas due to oil spills and leakage (Al-Husaini et al., 2014).
The cumulative information available on the levels of trace metals in coastal
seawaters impacted by industrial and crude oil contamination is generally patchy and
does not provide a complete picture of their migration, speciation and distribution in
the Arabian Gulf countries and Oman Sea. Thus, monitoring study of trace metals in
marine coastal seawater is crucial; to understand the source, distribution and fate of
chemical contaminants in seawater in order to formulate effective plans and strategy
for managing the marine system and protecting coastal environments. Furthermore, it
is necessary to provide useful and reliable data for assessing trace metals
contamination in the coastal seawater and predicting the influence of crude oil and
industrial contaminants on trace metals loads in marine waters. Thus, to ascertain that
marine waters quality with respect to trace metal concentrations are within acceptable
levels for protecting both environmental health and public health (Hwang et al., 2015).

14
Effect of ionic substitution on toxicity.
Research on metal speciation and bioavailability in seawater shows that they
vary considerably due to different ionic strengths and concentrations of organic
ligands (Langston and Bebianno, 1998). Adsorption is insignificant for all metals
because of high ionic strength, which reduces the density of metal ions on particle
surfaces due to a competitive exchange process (Connell, 2005).
The ligands in seawater are occurring as complexes with metal ions in the
presence of other major salinity components such as Ca2+, Mg2+. It must be noted that
marine systems are considered as a ligand buffer of L in large excess concentrations of
Ca and Mg. Thus, stability constants of a trace metal complex in freshwater can be
higher than in seawater (Hirose, 2006). The competition in seawater between Cu and
the major cations in seawater (i.e. Ca2 +, Mg2 +) for the same binding sites on the
surface of the algae increases. This increased competition may explain the observed
reduction in copper toxicity. Jones and Thomas (1988) investigated the effect of
industrial activities and seawater originated humic ligands, NTA, EDTA substances on
Cu, Pb and Zn speciation in contaminated areas. The work revealed the significance
effect of metal-DOM on fractionation of these metals in seawater or fresh water
(Kramer and Duinker, 2013). With an increase in ligand concentrations, the
concentration of free metal ions is shifted towards lower values. These findings
suggest that a weaker ligand has a greater influence than a stronger ligand on
decreasing Cu toxicity in marine microorganisms. This agrees with the knowledge that
a weaker ligand dominates in the speciation of Cu in coastal waters where Cu exists in
higher concentrations (Donat et al., 1994).

15
2.3. Organic matter in seawater
The term “organic matter” can be used to describe all hydrocarbons found in
aquatic environments or waste material other than living organisms and specific
organic compounds originated from anthropogenic sources (Nollet, 2005). Dissolved
organic matter (DOM) cannot be correctly considered as a chemical solution; it is a
very small colloidal suspension. With filtration over 0.45-μm filters pore size it is
possible to discriminate between particulate or organic matter (POM) and (DOM).
DOM is present in all aquatic environments and creates one of the largest pools
of reduced carbon on Earth’s surface (Nebbioso and Piccolo, 2013). Dissolved organic
matter (DOM) is a huge organic reservoir in the seawater composed of a variety of
organic compounds, which are the main source of organic ligands, that acts as a
chelating agent for trace metals and other nutrients, thus playing a key role in their
circulation and availability (Ogawa and Tanoue, 2003; Matar et al., 2013). The nature
of DOM in seawater presents in complex forms include humic substances, and a lesser
extent fulvic acids, glycolic acid, and the molecular class of fractions such as peptides,
amino acids. However, the humic substances in seawater are rare and complex
mixtures of different molecules with numerous functional sites of a wide molecular
weight range (Duursma and Dawson, 2011). Humic substances have been
demonstrated to occur in coastal marine waters at levels of ranged between 40 μg/L
and 400 μg/L, which is equivalent to 1-10 nmol/L, and at 1 nmol/L concentration in
seawater (Yang and van den Berg, 2009). Other work performed by Dryden et al.
(2007) on complexation of Cu with organic ligands in estuaries, however it is
significantly less than that obtained for Cu complexation in marine waters, indicating
that the humic substances are in a weaker type and are thus not the main ligands for
Cu in seawaters (Kogut and Voelker, 2001; Whitby and van den Berg, 2015). In

16
coastal areas DOM may consist of anthropogenic chelating ligands such as
ethylenediaminetetraacetic acid (EDTA), nitrilotriacetate (NTA), phosphates, citric
acid and various surfactants released from anthropogenic origin (Ndung’u et al.,
2003). Substantial DOM inputs through industrial and oil refinery activities such as
discharges into harbours are estimated to contribute high levels of organic ligands to
the marine waters. In aquatic systems, DOM associated with polycyclic aromatic
hydrocarbons PAHs and suspended organic or inorganic particles are in surface
waters, which influence the transport, and distribution of contaminants in ecosystems
(Shi et al., 2007). PAHs in contaminated marine waters span a wide range of
molecular weight and associated physical/chemical properties. The solubility of
aromatic hydrocarbons is governed by MWCO, salinity and temperature. The
solubility of PAHs is inversely correlated with salinity and MWCO, and directly with
temperature (Neff, 2002). Previous studies have shown PAH that industrial and oil
contamination elevate the concentrations of DOM and influence their composition and
trace metals measurements in the aquatic environment (Zhou et al., 2013).
2.4. Trace metals speciation in seawater
The distribution, mobility, lability of trace metals and their physicochemical
associations in marine systems are essential to control the geochemical behaviour and
bioavailability of various chemical forms and species (ABBASSE et al., 2003; Hirose,
2006). To avoid any misunderstanding, the International Union of Pure and Applied
Chemistry (IUPAC) has defined chemical speciation as follows (Karst, 2004; Hirose,
2006):
o Chemical species. A specific form of an element defined as to isotopic
composition, electronic or oxidation state, and complex or molecular
structure.

17
o Speciation analysis. Analytical process for identifying and/or measuring
the quantities of one or more individual chemical species in a sample.
o Speciation of an element; speciation. Implies knowledge of the
distribution of an element amongst defined chemical species in a system. If
elemental speciation is not feasible, the term fractionation is in use,
o Fractionation. Fractionation, which is distinguished from speciation, is a
process involving the separation of an analyte or a group of analytes from a
certain sample according to physical (e.g., size, solubility) or chemical
(e.g., binding, reactivity) properties.
The term “speciation” is used to specify the physicochemical form of a
particular element of interest. Three ways can be used to define speciation Figure 2.1
(Lead et al., 1997).
Firstly, it is based on physical attributes such as size, density, electrical charge
and shape. These attributes are usually measured by using fractionation methods such
as dialysis, filtration, electrophoresis, and centrifugation. Fractionation can be
dynamic like filtration or reflect equilibrium conditions like dialysis. The second way
is based on complex lability with indirect estimated size from mass transport
phenomena using experimental kinetic methods such as voltammetry. The third way is
based on free ion activity or concentration at equilibrium that is measured by using an
equilibrium speciation method (e.g. ion selective electrodes or batch techniques
equilibrating a solution with ion exchange resin).
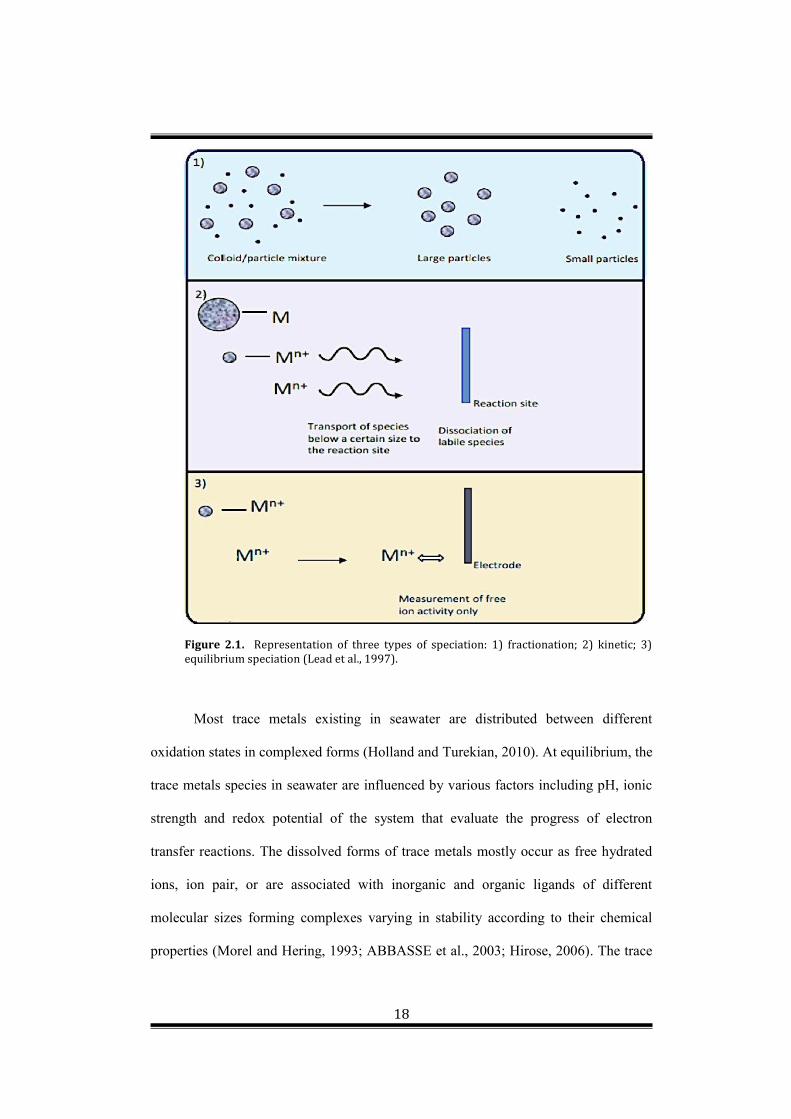
18
Figure 2.1. Representation of three types of speciation: 1) fractionation; 2) kinetic; 3) equilibrium speciation (Lead et al., 1997).
Most trace metals existing in seawater are distributed between different
oxidation states in complexed forms (Holland and Turekian, 2010). At equilibrium, the
trace metals species in seawater are influenced by various factors including pH, ionic
strength and redox potential of the system that evaluate the progress of electron
transfer reactions. The dissolved forms of trace metals mostly occur as free hydrated
ions, ion pair, or are associated with inorganic and organic ligands of different
molecular sizes forming complexes varying in stability according to their chemical
properties (Morel and Hering, 1993; ABBASSE et al., 2003; Hirose, 2006). The trace
19
metals may form, with the main inorganic ligand, neutral complexes which, in
principle, are almost always very labile (ABBASSE et al., 2003; Bayen et al., 2009).
For instance, trace metals can form labile complexes with inorganic ligands such as,
SO42-, CO3
2- and OH-. Moreover, many complexes able to form labile metals
complexes except larger molecular weight of organic compounds like humic
substances (Bernhard et al., 1986). The mobility and bioavailability of these metals
fractions can be affected by various factors including pH, nature of the sorbents,
presence and concentration of organic and inorganic ligands, including natural systems
processes, humic and fulvic acid, microbial metabolites and nutrient, especially in
marine waters impacted by economic activities (Balistrieri et al., 1992). Thus,
combining kinetic and dynamic information together with the analytical data can
provide reliable information on the bioavailability of metals in contaminated seawater
(Forsberg et al., 2006). It is rarely feasible to measure the concentration of an
individual complex. Most of the methods used to measure trace concentrations give
the total element contents irrespective of the speciation. According to the total
concentration, pH, Eh, chemical composition of the system and the complexation
constant of the assumed complexes, the portion of metals corresponding to their
chemical forms can be modeled. It is importance to know the concentrations of metal
species in the marine environment to predict the toxicity and bioavailability.
The complexation of trace metals by organic and inorganic ligands in seawater
is an important issue, as it determines to a large extent their bioavailability and
mobility (Hirose, 2006). Although the concentrations of organic matter in the seawater
exist at about 0.01% of the total level of salts, they may also be derived from
phytoplankton. Crude oil entering seawater through anthropogenic activities can be an
additional source of organic matter. The kinetics of associations of trace metals with

20
different size fractions of dissolved and particulate organic and inorganic materials is
extremely variable across different highly dynamic environment systems (Wells et al.,
2000). The concentration of metal ions M in seawater can be given as a total of
concentrations of varied chemical species of metal ions:
𝑀 = 𝑀 + Σ[𝑀𝐵] + Σ[𝑀𝐶] + Σ[𝑀 ]
𝑀 : Free ion concentration.
Σ[𝑀𝐵] : Total concentration of inorganic complexes.
Σ[𝑀𝐶] : Total concentration of organic complexes.
Σ[𝑀 ] : Total of metal chemical form complexes with particles.
In a complexing medium the supply of metal species to interface always
depends on the kinetics of the complex association and dissociation reactions. The
inorganic ligands in seawater such as OH-, Cl-, SO42-, CO3
2-, S2-, (HCO3-, and HS- are
included implicitly) usually form labile and very mobile complexes due to their high
rate constants of formation and dissociation of the kinetic flux of metals toward the
interface, so that diffusion of the metal species becomes rate determining (Morel and
Hering, 1993; Pinheiro et al., 1999). The complex formation reaction of metal ions
(M) with ligand (L) can be presented as follow:
𝑀 + 𝐿 ⇐⇒ 𝑀𝐿
21
The conditional stability constant, KCML, can be defined as:
𝐾 = [ ][ ][ ]
=
There is a similar situation for weakly complexed metal-DOM. Stability
constant is an important factor that can be used for characterising the metal
complexation with organic ligands. It is thermodynamically unique for metal
complexation with DOM (Chester, 1990; M.L.S. SIMÕES GONÇALVES, 1997).
In contrast, metals form more stable complexes with strong DOM compounds
in the contaminated marine waters with oil constituents discharged from refineries and
aromatic industries. Consequently, inorganic and organic trace metals complexes can
be categorised electrochemically as either labile or non-labile (inert), according to the
their association-dissociation rate constant (Chester, 1990). The supply of metal
species from the complexing system towards an interface is strongly influenced by the
kinetics of the complex association/dissociation reactions, regardless of whether one is
dealing with living organisms in a marine system, or with an electrode in voltammetry,
or with a membrane in a separation process (Pinheiro et al., 1999).
2.5. Sources of Oil in the Marine Environment
Crude oil provides approximately more than a third of energy consumption in
the world, which has led to increases in the condensates of oil extract, refinery inputs
and utilization, imports and exports worldwide (Brown et al., 2014). Concerns about
the marine environment with increasing oil spill accidents and petroleum inputs into
marine waters started to grow as well (Kennish, 1997). Oil enters the seawaters from
multiple natural and anthropogenic sources, notably leakages from refineries,
22
industrial wastewaters, tanker spills, losses from ships during transportation,
production facilities, marine terminals and natural seeps (Kennish, 1996; Board and
Board, 2003).
Petroleum hydrocarbon inputs into worldwide marine waters can be
categorized into four major activities including natural seeps, extraction, transportation
and consumption. Natural seeps contribute to the amount of oil to the marine
environment, accounting around 46% of the annual load of petroleum constituents to
the global marine waters exist when crude oil seeps from geologic formations below
seafloor into seawater (Board and Board, 2003). These seeps are often found in
regions where most of the crude oil extraction activities are located. As a result, vast
amounts of petroleum constituents, surface slicks and tar balls caused by seeps are
usually attributed to the releases from oil platforms, and significantly alter the nature
of ecosystems around them (Board and Board, 2003). It is remarkable that massive
rates of petroleum contamination in the marine systems worldwide are based on the
availability of these seeps (Kvenvolden and Cooper, 2003).

23
Table 2.3. Sources of oil inputs in the marine systems from human activities.
Percentage of Oil Inputs in Marine Environment
Derive From
65.2%
- Discharges of municipal and industrial wastes. - Ocean dumping. - Atmospheric fallout.
26.2%
-Transportation (tanker accidents, deballasting and dry docking)
8.5%
Released from fixed installations such as coastal refinery, marine terminals and offshore productions facilities.
By inspecting the data shown in the Table 2.3, it is obvious that most of the oil
entering marine waters originates from anthropogenic activities and exceeds natural
sources (Kennish, 1996).
Extraction of petroleum associated with the release of both crude oil and
refined products as a result of anthropogenic activities attributed to the efforts of
petroleum production. The nature and size of these releases is highly variable, but is
restricted to regions where active oil exploration and industrial development are
concentrated. Nowadays, only about 3 % of the accidental oil spills in marine waters
derives from platforms (Board and Board, 2003).
Transportation of petroleum associated with the refining and distribution of
crude oil or refined products; results in releases of variable sizes of oil due to spills
(e.g. tankers and pipelines leakages accidents) (Board and Board, 2003). Petroleum
consumption either from cars, marine vessels, airplanes or industries contributes to the
enormous majority of marine environments oil constituents’ contamination introduced
through anthropogenic sources. Unlike others sources, inputs from this category exist
almost solely as slow, chronic releases (Board and Board, 2003).
24
2.6. Oil Contamination in the Oman Sea
The Sultanate of Oman is one of the countries in the Gulf’s oil Arab states
located on the southeast of the Arabian Peninsula. Oman produces 980,000 barrels per
day of crude oil. Of the produced oil in the world, more than 50% is transported
through Oman Sea (Eissa-MA and Moharamy, 1990). This has led to an increase of
crude oil activities in the economic harbours of the Omani coast (e.g Al Fahal, Sohar
and Al duqum), which have therefore resulted in gross oil contamination of the marine
environment and a reduction in Omani environmental marine quality (Awad et al.,
1990; Al-Husaini et al., 2014). Oil industries (refining) in Al Fahal port and Sohar
industrial region in particular represent the perfect example for the study to investigate
the effect of oil spills on marine systems.
Al Fahal harbor being a heavily oil industrialised region in the Sultanate of
Oman is thought to be a major contributor of marine environmental pollution due to
receiving large oil loads. It contains three Single Buoy Mooring (SBM) systems,
which are distributed in separate locations in the harbour. The stored crude oil at the
tank farm is loaded onto tankers via two SPMs and the refined petroleum products are
imported and exported using the third SPM. Furthermore, Al Fahal bay lies close to
the most trafficked tanker routes in the world (Al-Husaini et al., 2014).
According to Eissa-MA and Moharamy (1990) the region of Al Fahal harbor
and its surroundings are particularly vulnerable to crude oil contamination build-up.
This owing to the measured high concentrations of polyaromatic hydrocarbons (PAHs)
in all collected samples, especially for samples collected from Al Fahal harbor regions,
which shows that discharges from the refinery activities and ship bilges are principally
contribute to the seawater contamination beside the known ballast waters from the

25
tankers anchoring at the SBM systems (Eissa-MA and Moharamy, 1990; Badawy et
al., 1992; Al-Husaini et al., 2014).
The Sohar Industrial Area (SIA) approximately 123 km2, represents another
practical case study for assessing the levels and typologies of inorganic and organics
contamination in Omani marine waters. It receives municipal effluents from industrial
and refinery activities, where it refines crude oil produced in Al Fahal harbor in
Muscat. A previous work (Alshuely et al., 2009) conducted on 63 coastal sediments
samples from different sites around Sohar Industrial Area (SIA) provided a clear
picture of the trace metals and crude oil contamination of the region emphasising the
risk associated to the elevated Ni, Cr, Mn and V due to illegal discharges of industrial
wastes and refined oil constituents from ballast tanks by tankers passing offshore in
route to the Gulf (Al-Shuely et al., 2009). The higher levels of Ni, Cr and V in
sediment samples were believed to be owing to the sourcing of oily waste during the
export and import of crude oil in the harbour. Vanadium and Ni are the most abundant
metals primarily existing in organometallic forms in crude oil. They can be used as an
important factor for fingerprinting the source of oil contamination in marine systems
(internal marker for hydrocarbons contamination) (Al-Husaini et al., 2014).
According to Folwer et al. (1993), most sediments around the coasts of the
Omani Sea contain more than 20 mg/L of vanadium (Fowler et al., 1993; Al-Husaini
et al., 2014). The study confirmed the provenance of the hydrocarbons and trace
metals in the marine waters around the harbour as derived from the crude oil and
industries related activities in the region.
Although various studies deal with heavy metals contamination in Omani
marine systems and their adjoining coastal waters; both with respect to aqueous phase
and sediment and soil phases, very little work has been carried out from the metals

26
ions angle. Besides, there has been a lack of adequate comprehensive work using a
reliable dynamic technique for assessing the effect of crude oil constituents on trace
metals bioavailability (speciation) in Omani marine waters around the refineries and
heavy industrial areas. The present study will discuss the change in mobility and
liability of the selected metal species considering the potential influence of industry
and refineries on the chemical cycles of metals in Omani marine systems.
2.7. The Fate of Crude Oil Spills on The Marine Systems
An understanding of the behavior and the environmental fate of the spilled oil
are necessary in order to understand and predict the extent of any environmental
impacts, which are useful to limit the damage caused by spills and facilitate cleanup
strategies (Dutta and Harayama, 2000; Klemas, 2010). When crude oil enters the
marine system, it undergoes a number of physical, chemical and biological processes
(weathering), which start acting on it, and determinates fate Figure 2.2 (Snow et al.,
2014).
Typical crude oil has a density slightly less than that of water of 0.85 g/ml, and
this factor combined with abiotic (e.g., water temperature, wind, tides, wave action,
current) and biotic (e.g., microbial activity) factors leads to the rapid spread of the
spilled oil over the sea surface as a single slick depends on the extent of the viscosity
of the crude oil (Dutta and Harayama, 2000; Kennish, 2000). The slick starts to break
up under the force of the wind and wave action, to form a narrow band parallel to the
wind direction.

27
Figure 2.2. Processes (weathering) determining crude oil fate (Snow et al., 2014).
During the first days after the oil enters marine water, those constituents of
crude oil (lower molecular weight components) volatise within one day, leading to the
removal of about 35% of the initial constituents and the water surface becomes
enriched with high molecular weight fractions (Dutta and Harayama, 2000; Sharma et
al., 2002).
Dissolution process competes with evaporation on the overall rate of oil slick
disappearance. The solubility of oil components is highly depending on the extent of
oil dissolution in seawater. Moreover, the solubility of crude oil components decreases
with the increase oil quantity and substitution reactions. For instance, aromatic
compounds are more soluble in seawater than aliphatic compounds. This influenced by

28
various parameters include oil source, oil composition, viscosity, photooxidation,
winds and waves (Kumar and Häder, 2012).
Evaporation and emulsification appear to be the most important and dominant
weathering processes following spreading, which can greatly increase pollutant
volume and the density of the residual oil slick. This will hinder and slow down the
mechanical removal of oil from the sea surface and delay other clean up processes
such as microbiological degradation and sediment dispersion (Sharma et al., 2002;
Fingas, 2012; Kumar and Häder, 2012).
The species composition of the floating oil is further governed by
photooxidation, biodegradation, and dissolution into the marine water (Dutta and
Harayama, 2000). Photooxidation is considered to be a potentially significant process
affecting the chemical composition of oil spilled in the marine, but it is still not well
characterised (Morrison and Murphy, 2010). The photochemical operation produces a
variety of oxidized components elevated due to the high solar radiation of oil films
(Morrison and Murphy, 2010; Fingas, 2012). The increased solubility is attributed to
the formation of polar aromatic and aliphatic component species fractions in the
seawater including alcohol, ketones, aldehydes, carboxylic acids, hydroxides,
sulfoxides and phenols forming water-soluble fraction (WSF) (Board and Board,
2003).
Biodegradation is one of the primary factors affecting crude oil degradation. It
is a natural process by which microorganisms such as fungi, bacteria and yeasts can
partially or completely breakdown crude oil into soluble fractions, CO2, nutrients and
energy (Kennish, 1996; Board and Board, 2003). The rate of biodegradation is highly
governed by salinity, oxygen, nitrogen and phosphorous in the water and the
temperature (Fingas, 2012). At the end of the process, the high molecular weight

29
molecules are involved in a metabolic operation called oxidative phosphorylation, or
respiration (Prince, 2002).
2.8. The effect of crude oil contamination on trace metal concentrations
Crude oil is a complex matrix composed predominantly of chemical
compounds that can be categorized as either saturated or aromatic hydrocarbons that
vary in appearance and composition from one oil field to another. Crude oils vary
according to the abundance of the components in the parent oil (Ahmad et al., 2010). It
consist of low portion about 3% (v/v) of elements such as nitrogen, sulphur and
oxygen, and less than 1% (v/v) of trace metals depending on the geochemistry of well
it extracted from (Winegardner and Testa, 2000).
Various studies recognise that all oils contain trace metals at varying
concentrations according to the geochemical conditions in which oil source beds
originated (Witherspoon and Nagashima, 1957). The effect of crude oil on the trace
metals concentrations in the marine systems depends on the type and composition of
oil, solubility of crude oil components in the seawater to form water soluble fractions
and the period of time under which the medium may remain in contact with oil
(Eriyamremu, 2013). Conversely, the increased availability may result in weak bonds
to the organic complexes (Relić et al., 2005; Iwegbue, 2011). The distribution and
speciation of trace metals in marine systems have been shown can be affected by
metals concentrations, abundance of organic ligands and colloids that transferred from
oil to water. It is very challenging to assess the effect of every chemical exist in crude
oil mixture. This is attributed to the complex molecular composition of crude oil and
its chemistry, which alters from field to field. Despite of the extensive efforts devoted
to studying metal contamination of aquatic systems, little attention has been paid to

30
their potential contamination derived from oil spills. The main focus has been on the
organic constituents as the only chemical contaminants (Patin, 1999; Maktoof et al.,
2014; Pimsee et al., 2014). This is reflected in the very limited published works
studying the metal pollution in the seawater following oil spill contamination. Apart
from the published studies after the Prestige crude oil accident in the coastal marine
waters of Galicia (Laffon et al., 2006), there are rare studies reported similar
situations, i.e. the Gulf countries coasts after the Gulf War spills (Bu-Olayan et al.,
1998; Freije, 2015). The fresh and marine waters in Egypt were also polluted due to
tanker oil loading and waste effluents discharge (Shimy, 1997). The marine waters in
Arabian Gulf countries were exposed to an enormous oil spills accidents in 1991 in
which about 6–8 million barrels of Kuwait crude oil were released into marine waters
as well as different spills from other oil operations and tankers oil related spills (Freije,
2015). De Souza et al. (2014) found that the measured fractions of trace metals Cd,
Cu, Pb, Ni, and Zn at northeastern Brazilian coastal seawaters were under the
influence of oil production activities. The metals (Cd, Co, Cr, Mo, Ni, Pb, V, and Zn)
were measured in the marine waters were collected from various sites on the Saudi and
Kuwait coasts after Gulf war. The studies concluded that the elevated levels of trace
metals have been attributed to the Gulf War oil spills (Bu-Olayan et al., 1998; Freije,
2015).
Therefore, metal contamination in combination with crude oil pollution in
seawaters could pose a more serious challenge for monitoring and protection of marine
system. It is crucial to have techniques that can measure metal concentration and
speciation correctly and reliably.
31
2.9. Different techniques for measuring metal speciation
2.9.1. Equilibrium methods
A great challenge in the area of trace metal monitoring is the development of
an ideal speciation technique adequately sensitive and selective enough to be applied
directly in aquatic systems without any or minimal perturbation of the sample
(Patterson, 1987; Pujol et al., 2014). Due to the development of the Free Ion Activity
Model (FIAM) in the 1970s (Batley et al., 2004), the uptake of metals by the biota in
aquatic system is related to the free ion activity of the metal in water, some
equilibrium speciation techniques have been developed for measuring free ion
concentrations. Some of these methods are briefly described in the following section.
2.9.1.1. Potentiometric methods Potentiometric measurements with ion-selective electrodes (ISEs) are sensitive
analytical methods for discriminating free metal species. They can be used for
investigate metals distribution and transfer in the environmental compartments in fresh
water at low concentrations millimolar (Broekaert et al., 2013).
However, there are various weaknesses in the use of these methods. First, the
detection limit of using ISE response to free ions is quite high at about 1µmol/L. In
addition, they are inapplicable in marine waters for metals cations analysis, owing to
the high ionic strength and presence of matrix interferences effects (Sadiq, 1992).
Despite ISE having been improved by a factor of up to one million and the
discrimination factor of interferences from ions by up to one billion, it is allowed to
limit the number of trace metals at their levels in seawater such as Cu, Pb, Cd and Zn
which do not include Ni2+ and it cannot identify some metals such as ligands (Bakker
and Pretsch, 2002; Ure and Davidson, 2008).

32
The potential of a single half-cell cannot be measured directly. Thus, the
potential of a lone indicator electrode is measured against a reference electrode in the
test solution of which it is constant (Broekaert et al., 2013). The response of
potentiometric electrodes to samples is regulated by various factors including
composition and thermodynamic and the kinetic properties of the membrane on the
electrode, solution, membrane/analyte and membrane/solution interfaces (Burtis et al.,
2012).
2.9.1.2. Permeation Liquid Membrane (PLM) Permeation Liquid membrane (PLM) is a pre-concentration method based on
the carrier-mediated transport of the metals ions across a hydrophobic membrane,
which separates the two aqueous compartments. It can be used for an in situ
discrimination between various trace metal species (Gunkel-Grillon and Buffle, 2008).
The PLM is composed of a thin polymeric support soaked with a water insoluble
organic solution containing a carrier.
The latter discriminates chemical fractions of interest in the hydrophobic
membrane and enhances their diffusion in the membrane. The targeted metals species
transport through the membrane and finally will released into receiving solution
(strip). Metals will form more stable complexes in the strip than with carrier in the
membrane or they will dissolve in the solvent. In either case, the analyte will continue
to transport to the receptor through the membrane and at the end it is released by more
stable metal-ligand in comparing to that of sampling solution. This happens due to the
tailor-made carrier that impregnates the membrane, which is selective for a given trace
metal, thus allowing the use of this technique for a broad spectrum of elements. Then
the metal of interest will be allowed to pre-concentrate in the receptor (strip) solution,
which might be subsequently analysed using ICP-MS. This diffusion process is

33
regarded as an extraction and back extraction sequence combined by transport across
the membrane and in solutions. In both extractions processes at both sides of the PLM
membrane, liquid–liquid interface is involved (Scarpetti, 2007). Thus, PLM can be
operated for free metals ions concentration measurements, labile hydrophilic through a
liquid membrane with respect their fluxes providing adequate information for metals
speciation researches (Slaveykova et al., 2004). The overall transport flux that is
driven by the chemical potential gradient between solutions on each side of the
membrane is influenced by: (i) mass transfer to the membrane including diffusion of
the metal through the solution diffusive boundary layer; (ii) complexation/dissociation
in the diffusive boundary layer; (iii) complexation/dissociation by membrane based on
carriers and (iv) transfer through the membrane (Slaveykova et al., 2004).
Although the PLM method is simple and quick, the measurements of free
metal ion concentration or the total concentration of labile complexes depend on
conditions e.g. pH. Another drawback of this method is that it is applicable for a
limited number of metals such as Ni, Pb, Cu, Cd and Zn (Zhang et al., 2006; Gramlich
et al., 2012).
2.9.1.3. Donnan Membrane Technique (DMT) The DMT is based on the theory of Donnan membrane equilibrium. It can be
applied to measure a wide range of free ion concentrations both in laboratory and in
situ in the field. For the analysis using cation-Donnan technique, it will be based on
the use of a ‘donor solution’ that contains the ‘free’ metal ions and their complexes,
and an ‘acceptor solution’ separated by a semi-permeable, negatively charged, cation
exchange membrane. The ionic strength is fixed in the receptor solution, inside a
chamber and on the other side of the exchange membrane. Due to the negative charge
and electric potential in the membrane, the cationic species will be promoted to enter

34
and transport across the cation exchange membrane to the acceptor side until the
‘Donnan equilibrium’ can be reached.
The negatively charged anionic species are largely excluded from entering the
membrane due to the negative charge in the membrane and strongly retarded anions
from the transport to the receptor solution. Furthermore, the structure of the membrane
could also exclude transport of colloidal particles through the membrane.
The metals concentrations in both sides of the solutions can be measured using
an analytical instrument such as AAS or ICP-MS (Temminghoff et al., 2000; Weng et
al., 2011). For measuring anionic species where we need to use anion-DMT, a
positively charged anion exchange membrane will be applied instead. The anionic
species will be allowed to transport through the membrane from the donor solution to
the acceptor until so-called Donnan equilibrium can be reached (Weng et al., 2011).
Donnan membrane techniques (DMT) are often restricted by lengthy
equilibrium requirements (may take days) and high limits of detection. Therefore,
various strategies need to be taken for designing DMT experiments, depending on the
limit of detection; whether the addition of ligands is required for accumulation
(Collins and Kinsela, 2010; Weng et al., 2011). If the free ion concentration in the
sample is below the detection limit of the analytical technique, a ligand needs to be
added to the acceptor side. Subsequently, the time required to reach equilibrium is
decreased and the limit of detection will be reduced to accumulate labile ligands of
interest (Weng et al., 2011).
2.9.1.4. Equilibrium dialysis The equilibrium dialysis method has been used in environmental studies to
fractionate metals species according to their differential rates of diffusion through

35
porous membranes. The discrimination of metals species depends on the pore size
used in dialysis membranes.
However, some relatively high molecular weight species smaller than pore size
may transport through the membrane (Saxena, 2013). The membrane materials can be
from cellulose nitrate, collodion or gelatin. The receiving phase in the equilibrium
dialysis can be either a chelating binding layer or small volume of blank solution with
the same ionic strength as the outside solution.
The transport of negatively charged species can be impeded by the charge on
the membrane. The diffusion of metal species could be influenced also by other factors
including membrane swelling, adsorption effects and interaction between solute and
membrane (Batley, 1989; Caroli, 1996).
The major drawbacks of the dialysis method are: the longtime of equilibration
from hours to several days and the negative charge in the membrane causes
interferences with the diffusion rates of charged molecules.
Moreover, the leakage of small organic molecules can cause error
measurements. If receiving resin is used for ionic metal species, the diffusion of ionic
metals species is highly dependent on the metals concentration in the water (Beneš,
1980; Caroli, 1996). The chelating resin, Chelex 100, was applied for environmental
study and proved a measurable uptake of Cd, Pb and Zn at low concentrations in water
(Vrana et al., 2005).

36
2.9.2. Dynamic techniques
Dissolved inorganic and organic species in seawater are a complex mixture
with various sources and composition, and play an important role in influencing the
environmental behavior of trace metal species and their biogeochemical cycles in
marine systems (Zhou et al., 2013). With more and more research findings on the
limitations of the FIAM, some dynamic speciation techniques for measuring labile
metal concentrations have been developed.
2.9.2.1. Voltammetry
Voltammetry techniques have been used in the study of complex systems
based on the recording of a current, which flows between electrode and auxiliary
electrode regardless of the number of ligands associated with the metal ions. The
voltammetric signal depends on the concentration of free metals in the seawater and
the reversibility of the redox reaction (Achterberg and Braungardt, 1999).
Lability in anodic stripping voltammetry depends on the kinetics of complex
dissociation in the diffusion layer during the time scale of each step during the
consumption or release of metal at the electrode surface. The lability of complexes ML
depends on the thermodynamic equilibrium at the electrode surface during the redox
processes (Coso, 2004). The dissociation time for complex (residence time) in the
diffusion layer influenced by layer thickness, and if the rotating disk electrode is well
defined hydrodynamically, the diffusion layer thickness and the residence time can be
estimated and controlled by altering the rotation rate (Capodaglio et al., 1995).
A direct measurement of labile trace metals is highly in demand for the rapid
screening of contaminated marine systems. Voltammetry has been an essential and
widespread analytical method, which is applied for distinguishing trace metals species
(Stockdale et al., 2015). Voltammetry is based on the current measured as a function

37
of the applied potential for an electrochemical cell. The technique combines two steps
including stripping voltammetry and pre-concentration, which enhances sensitivity
and selectivity (Denuault, 2009).
During the preconcentration or accumulation step, the trace metal of interest is
deposited onto or in a working electrode for a fixed period of time. During the
quantification stage the accumulated metal is oxidised or reduced back into solution
(Achterberg and Braungardt, 1999). Anodic Striping Voltammetry (ASV) is widely
applied for measuring trace metals in seawater at concentrations as low as 10-10 M and
studying their speciation based on metals lability. In this case the preconcentration
stage under forced convection can be carried out using electrodeposition. The
deposition potential usually ranged between 0.3- 0.4 V more negatively than the
reduced potential of the metals to be measured. During the deposition stage metal ions
are reduced to a metallic state, then collected in the Hg and amalgamated with the Hg.
Small fractions of metals are normally collected during this preconcentration step
(Noyhouzer and Mandler, 2013).
The analysis of sensitivity and selectivity is determined by the
preconcentration time of metals ions in the sample. In the anodic scan step, the peak
current is can be controlled by various factors from the deposition and stripping steps
including metal ion properties, the diffusion of trace metal species to the electrode,
metal complexes lability and the reversibility of an electrode process.
During ASV analysis, all the steps may comprise the stirring of the solution
using a magnetic stirrer, where the measurement is convection dependent.
Measurements using microelectrodes can be performed in quiescent solutions, which
is attractive for in-situ deployments in natural waters (Achterberg and Braungardt,
1999). The major difference between macro- and microelectrodes is that planar
38
diffusion occurs on the former compared to radial diffusion in the latter.
Microelectrodes are more preferred in field monitoring than macroelectrodes due to
theirs unique features, which are (Achterberg and Braungardt, 1999; Buffle and
Tercier-Waeber, 2005):
o Their small size enhances direct measurements in low ionic strength
freshwater.
o Due to rapid mass transport because of radial diffusion, the reliability of
environmental analysis is improved.
o The microelectrode is covered with an agarose gel for developing gel-
integrated microelectrodes (GIME) to prevent fouling of its surface. The
probe can be used for measurements down to 500 m in seawater and is able
to determine trace metals with sub-nanomolar detection limits in the
presence of oxygen. This greatly extends the uses of voltammetry for broad
field and not only for environmental samples (Buffle and Tercier-Waeber,
2005).
The complexing gel integrated microelectrode (CGIME); and the PLM-GIME
micro-total analytical system (PLM-GIME-µTAS) are examples of modified (GIME).
CGIME is used for measuring the free metals ions in freshwater systems (Buffle and
Tercier-Waeber, 2005).
It is based on placing small amount (µm) of resin gel like; Chelex by
depositing the resin layer on the microelectrode array of the GIM, and then followed
by deposition of the agarose gel and then electro-deposition of Hg semi-drops. In
PLM-GIME-µTAS the GIME used a hydrophobic permeation liquid membrane
(PLM) to extract metals species by binding to a carrier and transported by diffusion.

39
Then a channel consist of strip solution, where the metal complexed and accumulated
over a period of time (Buffle and Tercier-Waeber, 2005).
The major drawback of voltammetric measurements of trace metals in
freshwaters is adsorption of organic compounds, which arises from the contamination
of hydrophobic aromatic and aliphatic functional groups of DOM. This causes an
increase of peak current and shifts the peak potential toward more negative values.
Therefore, a Nafion-coated thin mercury film-rotating disk electrode was used
to prevent the adsorption and fouling by organic complexes in the contaminated areas.
Hurst and Bruland (2005) found that the low thickness used in the Nafion-coated
electrode study has no effect on the enhancement, but rather a gradual decrease in
sensitivity with increasing film thickness. The observed trend in the values has been
suggested as a result of depression of the mercury plating efficiency during the
deposition step.
In contrast, studies by HOYER and FLORENCE (1987), and Hurst and
Bruland (2005) reported an improvement of sensitivity in DPASV mode by using
cation exchange membrane a Nafion-coated of the same film thickness to an increase
in redox cycles at the electrode surface during the stripping step. Moreover, to deal
with the organic-rich seawater matrix and to measure ASV-labile copper in seawater
matrix contains high level of DOM.
Therefore, although these voltammetry methods are useful and powerful, they
are expensive and difficult to make in ordinary laboratories. Furthermore, the
properties of the electrodes are their inherent stability with very low background
currents (Dragoe et al., 2006).

40
2.9.2.2. Competitive ligand exchange - adsorptive stripping voltammetry (CLE-ACSV) Competitive ligand exchange-adsorptive stripping voltammetry (CLE-ACSV)
is the primary method used for measuring the complexed metals ions and
distinguishing metals species in the seawater (Buck et al., 2012). The method involves
an exchange reaction with an added ligand followed by electrochemical detection of
the adsorbed metal complex using adsorptive accumulation and subsequent reduction
of the metal.
The added ligand is usually one which forms rather stable metal-binding
complex with metal ion of interest. The ambient ligands, such as tropolone, 8-
hydroxyquinoline, salicyl aldoxime, catechol and dimethylglyoxime, usually are added
in a large quantity to the sample solution. The added ligand is left to equilibrate with
the metal present in the sample for at least 24 hours before analysis (van Leeuwen and
Town, 2005; Buck et al., 2012). After the addition of the ligand, the sample solution
contains at least three types of metal species; metal-DOM, metal-added ligand and free
metal. The kinetic detection window is defined by the requirement of the equilibration
phase before the accumulation of the metal complex with the added ligand at the
electrode surface. For all metal complexes with stabilities beyond the thermodynamic
detection window, the rate constant for dissociation is smaller than that for association
of metals to added ligands (van Leeuwen and Town, 2005).
Although the CLE-ACSV is a sensitive analytical technique used in many
previous speciation studies, it is not suitable for in situ measurement speciation. The
AdSV using the hanging mercury drop electrode (HMDE) can detect very low
concentrations of metals in samples having a wide range of pH, and rather fast
dissociating complexes with high sensitivity and high precision.
41
2.9.2.3. Ion Exchange Resins Ion exchange resins (cation and/or anion exchangers) can be used for
separating metal fractions according to their chemical structure, stability and kinetic
lability. Strong chelating ion exchange resins (complexing resins) like Chelex-100,
comprising iminodiacetates, or Chelamine, containing pentamines, have been
employed by a number of studies for preconcetrating of trace metals fractions from
marine waters and fresh waters samples (Nickson et al., 1995).
Haraldsson et al. (1993) encouraged the use of a speciation system based on
metals fractionation on three adsorbents, Chelex-100, SepPak Cl8 and Fractogel
DEAE, which differentiate between labile complexes, non-polar organic matter and
ion-exchangeable metals fractions (Nickson et al., 1995).
The solid-phase extraction method also was applied with minicolumns packed
with Ca-form Chelex-100 to separate labile metal species and define the weakly
complexed fraction of different metal ions. The extent of metals species lability can be
varied with the time of contact between samples and resins. The time allowed for these
techniques-samples equilibration can be altering from hours, in batch extraction
method, to seconds, in column stationary phase chromatography. The level of the
dissociated metal fractions sorbed onto the resin depends on the amount of the
competing metals ions and ligands, contact time between samples and resin and resin
capacity (Stockdale, 2005; Bowles et al., 2006; Pesavento et al., 2009).
Although these methods can determine strong ligands, they have some
drawbacks. The added resin could change the composition of the mixture and its
influence. The organic material can be escaped from the resins (Walther, 1989;
Pesavento et al., 2009).

42
The resins can also be used for equilibrium techniques. The batch extraction
technique involves increasing contact time with the small-added quantity of ion
exchange resin to the sample by stirring or shaking the mixture and then leaving this to
reach the equilibrium. The measured concentrations of free metals in the sample
solution can be used to determine the degree of complexation stability according to
measured time (Hart and Davies, 1977).
2.10. DGT (Diffusive Gradients in Thin films) The dynamic technique of diffusive gradients in thin films (DGT) was invented
and developed in 1994 by Hao Zhang and William Davison for in situ speciation
measurements of trace metals in waters, sediments and soils (Davison and Zhang,
1994; Zhang and Davison, 1995). The technique consists of a plastic piston with a
cylindrical cap of 20 mm diameter window comprising three layers. The first one is a
resin binding layer laid on the base plate and separated from bulks solution by a well
defined diffusive gel layer and filter membrane. The metals species of known
diffusion coefficients allowed the transport through the diffusive gel of a certain
thickness (∆g) to the binding layer. Numerous binding layers have been developed and
are available for extending the range of determinants of trace metals to include other
cations, oxyanions and targeted species in aquatic environments Table 2.4.
In most studies of measuring cations, the resin layer is made up of Chelex-100
of high affinity whose properties are strongly pH dependent. The resin Chelex
excludes large metals colloids due to the pore size of 150 µm and prevents any
dissociation of trapped metals to for reproducing metal complexes (Lead et al., 1997;
Garmo et al., 2003; Stockdale, 2005; Davison and Zhang, 2012). The DGT device is a
time-integrated technique. The gradient of labile factions of metals species in a
diffusive layer will be constant until the resin gel becomes saturated. The metals
43
species concentration at the resin gel/diffusive gel interface remains effectively zero,
leading to the continuous flux of free ions into a passive device. The DGT device is
robust, pre-concentrates analyetes at very low concentration and can be deployed
directly in waters without any pretreatment.
Therefore, a low risk of contamination of the sample and chemical changes of
the analyte’s properties are eliminated. Furthermore, quantitative concentration
measurements can be performed in sample solutions with no need for separate
calibration. The technique can be used for speciation measurement of trace metals at
low concentrations and is applicable for an in situ measurement of labile metal species
in aquatic systems at a low cost (Munksgaard and Parry, 2003; Peters et al., 2003;
Forsberg et al., 2006; Chen et al., 2012).

44
Table 2.4. DGT development and applications by different research groups.
Binding Layer Application pH Reference Chelex-100 Most of metals in aquatic system. 4.7 - 6 (Garmo et al., 2003)
AG50W-X cation exchange resin
Measuring of Cs and Sr in natural water.
4 - 9 (Chang et al., 1998)
Silver Iodide (AgI) Measuring of sulphide, (S) in water.
- (Teasdale et al., 1999)
Ferrihydrite, 5Fe2O3.9H2O Measuring dissolved
phospourous, (P) in natural water and oxygenated metals As, V, Se,
Sb, Mo,W and U.
2 - 10 (Zhang et al., 1998; Stockdale et al.,
2008; Huynh et al., 2015)
Ammonium molybdophosphate (AMP)
Measuring of Rediocaesium in natural waters
6.1 - 8 (Murdock et al., 2001)
cellulose phosphate-based Whatman P81 membrane
Measuring of Cu, Cd, Zn, Mn, Ni, K, Na, Ca, and Mg in natural
water.
4 - 9 (Li et al., 2002)
poly(4-styrenesulfonate) (PSS) liquid binding layer
Measuring of Cd2+ and Cu2+ in Lake water
3 < pH (Li et al., 2003)
suspended particulate reagent-iminodiacetate (SPR-IDA)
Measuring of Co, Ni, Cu, Cd and Pb in sediment and synthetic
solution.
2 - 9 (Warnken et al., 2004)
MBL consisted of ferrihydrite and Chelex-100 cation-
exchange resin
Synthetic solution and soil (Cd, Cu, Mn, Mo, P, and Zn).
5 - 9 (Mason et al., 2005)
DGT devices with varying diffusive gel thicknesses
To determine the thickness of the physical diffusive boundary layer
(DBL) and apparent diffusive boundary layer (ADBL) in
laboratory and natural environment.
5 and 7.5
(Warnken et al., 2006; Levy et al.,
2011)
Spheron-Oxin®ion exchanger Measuring of Cd, Cu, Ni and Pb under laboratory conditions,
natural water
6 - 8 (Gregušová et al., 2008)
MnO2 resin Radium Ra in water and sediment - (Leermakers et al., 2009)
Metsorb and ferrihydrite adsorbents
Measuring As3+ in seawater 3.5 - 8.5 (Bennett et al., 2011)
Yeast Saccharomyces cerevisiae
Cd
and
Pb In seawater and river water
4.5 - 7.5 (Menegário et al., 2010)
(Pescim et al., 2012)
Two sequential binding layers Chelex-100, a “front” and a “back” layer.
To investigate kinetic studies of Ni with nitrilotriacetic (NTA) and Suwannee River fulvic and humic acids (FA and HA) in solution at
pH 7
6.93-7.08 (Shafaei Arvajeh et al., 2012)
polymer-bound Schiff base (Py–PEI)
derived from poly(ethyleneimine) and 2-pyridinecarboxaldehyde as the binding agent (Py–PEI
DGT)
Measuring labile Cu2+, Cd2+ and Pb2+ in waters.
pH 4–8.5
)Fan et al., 2013(

45
2.10.1. Factors affecting the DGT performance The DGT sampler has the potential to be a suitable tool for the environmental
assessment of water quality monitoring in different fields of research owing to its
advantages mentioned above. However, various factors affect its accuracy of
measurements, as described and discussed in the following section.
o Diffusive boundary layer (BDL).
When DGT is deployed in water, there is a region between the filter membrane
and solution known as the diffusive boundary layer (DBL) of defined thickness (δ),
where the transport of trace metals species occurs by molecular diffusion. The mass
transport changes from advection and diffusion processes in the bulk solution, to
diffusion in the hydrogel layer (Warnken et al., 2006).
The DBL is governed by both flow rate and deployment geometry and
effectively extends the diffusion gradient (∆g) of the deployed DGT. The immersed
DGT in the water is generally negligible in well-stirred solutions and natural waters.
Warnken et al. (2006) estimated the DBL thicknesses based on the use of multiple
DGT devices of varying thicknesses and different geometric window areas, and found
that were no significant differences of measured DBLs at both moderately and
increased stirring speed solutions with a mean value of 0.023 cm. Whereas, at
unstirred solution the DBL approaches 0.15 cm, which indicating that the DBL cannot
be ignored. It is important to take into account material diffusion material MDL when
referring to the gradients through the diffusion layer and filter, of total thickness (∆g)
DGT measurement in low flow conditions: diffusive boundary layer and lability
considerations (Warnken et al., 2006; Davison and Zhang, 2012; Uher et al., 2013).

46
o Temperature.
Temperature is an essential parameter for estimating diffusion coefficient. The
diffusion coefficients of most metals were measured at temperatures between 5-35 °C.
It is an important factor for calculating analytes concentrations in each DGT
deployment (Zhang and Davison, 1995).
o pH and ionic strength.
The effect of pH and ionic strength on the performance of the DGT sampler
has been investigated in a wide range of pH using different resin gels and diffusive
layers. There are some limitations to the DGT sampler connected with properties of
Chelex-100 at low and high pH.
At pH 5-9 standard DGT using open pores hydrogel and Chelex-100 binding
layer functions best with a ratio of CDGT/Csolution ≈ 1. While at pH <2, the Chelex-100
will shrink and there will be a considerable ionisation, then the adsorptive capacity
will be reduced. If the sampler is exposed to the medium of pH>9 the resin gel and
diffusive layer will start to swell, which will affect the measurements.
Moreover, the dissociation and association of metal complexation in aquatic
system is influenced by pH. The organic acids dissociation will increase at high pH
and increase metals complexation (Zhang and Davison, 1995; Gimpel et al., 2001;
Huynh et al., 2015).
The response of DGT sampler to ionic strength reflects the effect of ionic
strength of solution on the diffusion coefficients analytes. Numerous studies showed
that a standard DGT dynamic technique is independent of ionic strength, except at
very low strengths ≈ 0.1 mmol/L where the diffusion coefficient is low.
The diffusion coefficients in the sampler at high ionic strength ≈ 0.7 mol/L
NaNO3 solution or in seawater have been estimated to be approximately 8% lower

47
than in pure water (Davison et al., 2000; Scally et al., 2006). During the production of
DGT it is required to wash hydrogels gels to get rid of any impurities and decrease any
products of polymerization that were not reacted. The DGT performance can be
affected by gel washing and conditioning. Deploying unwashed diffusive gel at pH ≈ 9
at an ionic strength of 10 mmol/L showed a little effect on DGT measurements, but the
measured theoretical response for CDGT/Csolution =1. If the hydrogel is not very well
washed it will have a negative charge due to the occurrence of reagent products.
The measurement accuracies could be affected by charged diffusive gel due to
the created Donnan potential. At pH> 7 rinse water is not enough to remove all
impurities. This will give CDGT/Csolution >1, due to the increased metal diffusion to the
resin at low ionic strength enhanced by the negative charge in the hydrogel. Washing
gel copiously at pH <7 indicated that the well washed gel and a ratio of CDGT/Csolution
<1 may be found at very low ionic strength of 0.1 mmol/L, caused by a positively
charged gel hindering the metal flux across the gel to the binding layer.
The DGT measurements can be performed accurately at low ionic strength
solutions (I < 1mmol/L) if the diffusion coefficients are provided at the same ionic
strength (Warnken et al., 2005; Davison and Zhang, 2012).
o Biofouling.
In natural waters, the accuracy of DGT measurements is affected by the
formation of biofilms at the surface of the samplers as a consequence of the exposure.
Biofilms is an aggregation of bacteria, algae and fungi and also contain extracellular
polymers substances resulting from metabolism (Uher et al., 2012). The biofouling
growth on the filter membrane affects the thickness of the diffusion layer and hampers
molecular diffusion. If the deployment takes more than 7 days, it is recommended to
use several types of DGT devices to correct the deviation of DBL thickness. In most

48
cases, the effect of biofilms is not taken into account and can be avoided if the DGT
sampler is deployed less than 7 days (Kersanach et al., 2009; Uher et al., 2012; Turner
et al., 2014).
Figure 2.3 illustrates a modified cross -section of DGT components and the elution
accumulated trace metals from Chelex-100 resin. The gradient of metal species
concentration of DGT deployment in solution can be seen.
Figure 2.3. Modified cross -section of DGT components and the elution accumulated trace metals from Chelex-100 resin (Zhang and Davison, 1995; Wallner-Kersanach et al., 2009)
The deployed DGT sampler was rinsed with Milli.Q water and the resin was
immersed in 1 ml of 1 M HNO3 for overnight before being diluted and analysed in

49
ICP-MS. The obtained results were expressed in terms of mass (ng) and concentration
(μg/L) of the metal in the resin gel. Where (C) is the solution concentration, ∆g is
diffusive layer thickness, (A) is the surface area, (D) is the diffusion coefficients; and t
is the exposure time. The mass of metal in the resin gel (M) was obtained using
equation (2.1):
M = Ce (Vacid + Vgel) / fe (2.1)
CDGT can be estimated by rearranging equation (2.2) (Kersanach et al., 2009):
CDGT = (∆ )
(2.2)
Even if all metals ligands in natural waters are considered fully labile, the measured
concentrations in DGT using equation (2.2) will tend to be smaller than the total
content in solution, due to the existence of fractions with diffusion coefficients that are
smaller than that of the free metal ions (Zhang and Davison, 2015).
2.10.2. Use of DGT for trace metals speciation measurements The DGT sampler is capable of distinguishing to an extent the trace metals
fractions according to their size and the rate at which they can liberate species (Zhang
and Davison, 2015). By using DGT devices with different hydrogels of varying
thicknesses and different pore sizes in equivalent, allows for more information on
metal speciation (Scally et al., 2003; Forsberg et al., 2006; Degryse et al., 2009).

50
The following discussion presents the results of some experimental work in the
laboratory and in the field achieved by various researchers to assess the performance
of DGT under controlled conditions.
To investigate whether the diffusive boundary layer (DBL) is small and can be
ignored in well-stirred laboratory solutions, Warnken et al. (2006) used DGT devices
containing varying diffusive layer thicknesses (∆g = 0.14 (filter membrane only), 0.54,
0.94, and 1.34 mm) were carried out for 50 h in synthetic solutions of 0.01 mol/L
NaNO3 ionic strength containing ∼10 μg/L Co, Ni, Cu, Cd, and Pb. The thicker
diffusive layer showed a higher accumulated mass of Cd than the theoretical uptake,
the thinner 0.40-mm diffusive layer showed the theoretical accumulation in the same
synthetic solution, and lower mass accumulated in the device with 0.14-mm gel (filter
membrane only) comparing to the theoretical uptake. The work found that the DBL of
Cd was 0.17 ± 0.018 mm during this deployment. The obtained DBL thicknesses of
metals Co, Ni, Cu, and Pb were ranged from 0.15 to 0.17 mm with a mean value of
(0.16 ± 0.0086 mm) with CDGT/CSOLN ratio of 1.23 ± 0.015. The study suggested that
DBL cannot be ignored and DBL thicknesses were increased significantly from 0.44 ±
0.014 mm in the synthetic solution stirred at 60 rpm to 1.5 ± 0.13 mm in the unstirred
synthetic solution. The study suggested that to obtain a value of 1 for CDGT/CSOLN, it is
required to use a larger effective area (A) of 3.08 cm2 for the soil DGT devices and
3.80 cm2 for solution DGT devices (Warnken et al., 2006). Levy et al. (2011) used
DGT containing different thicknesses (∆g) to investigate the lability of metal-exudate
complexes. The study also measured the values for the physical (DBL) and apparent
(ADBL) thicknesses of metals Cd, Cu, Al and Fe in synthetic solution. The work
found that iron (Fe) metal kinetically limited by the dissociation of Fe-complexes with
calculated ADBL values ranged between 1.8 to 2.8 mm. When metals are labile, the

51
measured concentration of metal in the binding layer should be decreased when the
hydro gel thickness increases. The study also found that, the concentrations of Fe on
the binding layer did not always increase with reducing of hydro gel thicknesses.
Moreover, the dissociation of aluminium (Al) from complexes was also kinetically
limited in all solutions; however, the Al exudates were more labile compared to Fe
species. The work also found that the calculated ADBL values were 0.62 ± 0.09, 0.50
± 0.07, 0.35 ± 0.07 mm for Al in the synthetic solutions containing C. vulgaris, A.
flos-aquae and C. pyrenoidifera exudates respectively. The obtained ADBL values of
(Cu) and (Al) were high and attributed to the kinetic limitation in the C. vulgaris
filtrate, corresponding to the high stable organic ligands (Levy et al., 2011).
Shafaei Arvajeh et al. (2012) deployed DGT devices containing two sequential
binding layers, a “front” and a “back” layer to investigate the penetration into the
Chelex binding layer of complexes of Ni with nitrilotriacetic (NTA) and Suwannee
River fulvic and humic acids (FA and HA) in solution at pH 7. The study found that in
Ni−NTA tests, the accumulated masses of Ni in the front and back binding layers were
similar due to the slowly dissociating complexes. For Ni−FA/HA solutions, a higher
Ni masses were up taken by the front resin and consistent with rapid dissociation from
a high amount of the binding sites. The obtained ratio of Ni in the front/back resins
was markedly lower (p < 0.05) for solutions containing Ni−HA compared to those
found in the solution of Ni−FA, attributed to the less lability of Ni−HA complexes
than Ni−FA complexes in similar synthetic solutions containing (FA = 10 mg/L and
HA = 8 mg/L). Also the work has shown the potential of using the two double resin
gels in DGT device as an alternative approach to using varying thicknesses of hydro
gels to obtain kinetic data. Moreover, the work concluded that in situ application of
DGT with double binding layers could provide more clear picture regarding the kinetic

52
information of metal organic complexes in natural environmental systems and will
improve the perception of metal speciation (Shafaei Arvajeh et al., 2012).
Recently DGT technique equipped with a dialysis molecular cut membrane
placed in front of the diffusive gel layer to prevent large molecular metal-DOM to
measure only simple inorganic species (Pouran et al., 2014).
Furthermore, the DGT technique can be used to pre-concentrate metals via
diffusive transport through the soil solution (Zhang et al., 1998) and induces resupply
from metal species associate to the solid phase (Harper et al., 1998) with very good
sensitivity, especially at longer deployment time (Davison and Zhang, 1994). It does
not significantly cause any changes in physical or chemical properties of soil. It has
been showed to behave analogously to plant uptake for a variety of trace metals,
including of Cd and Zn (Zhang et al., 2006) and Cu (Zhang et al., 2001). Previous
analytical techniques used to predict bioavailability of trace elements have shown
some correlations with metal uptake in soils and plants (Guo et al., 1996; Hergert,
1998; Zhang et al., 1998; Buszewski et al., 2000; Zhang et al., 2006; Garrido Reyes et
al., 2013). Although DGT technique has been considerably assessed for the purpose of
environmental monitoring of soils (Harper et al., 1998; Zhang et al., 2001) no research
has been carried out to date on assessing the suitability of the DGT technique for
metals speciation in soil contaminated with crude oil.
The performance of DGT has been assessed on a wide variety of solutions
ranging from model solutions to direct in situ measurements in lakes, river systems,
seawater and sediments. In most seawaters, the trace metals exist in different chemical
species such as free ionic, labile bound metal-ligands and non labile more stable
metal-ligand, and varying molecular sizes such as soluble colloidal ranged between

53
(nominally >1000 kDa) to less than 0.2 μm) to (particulate >0.2 μm) (Baeyens et al.,
2011; Österlund et al., 2012).
Zhang and Davison (1995) conducted a series of tests to assess the
performance of DGT in solutions at varying ionic strengths. They adjusted the ionic
strength of a 3 µg/L solution with NaNO3 ranged from 10 nmol/L to 1 mol/L. the
obtained results were expressed as the ratio of measured concentration in DGT to the
total concentration in the solution measured by Zeeman GF-AAS. The measured
concentration in DGT was no more than ≈10 % different from the total concentration
in the solution, irrespective of ionic strength.
Similar study achieved by Gimpel et al. (2001) using calcium salts to increase
the ionic strength similar to the seawater (10 nmol/L). The DGT devices were
deployed in solutions contain 5 and 10 Cd and 50 and 100 Cu at varying ionic
strengths, 0.1, 1 and 10 mM of Ca. The study found no difference and concluded that
DGT devices can be used to measure trace metals in hard waters (Gimpel et al., 2001).
Although the DGT technique has been showed to be very effective for
freshwater systems, few works also have been performed in marine systems (Wallner-
Kersanach et al., 2009). Zhang and Davison (1995) deployed DGT in the North
Atlantic Ocean using different thicknesses of hydrogel. The measured concentration of
Cu was 0.15 ± 0.01 µg/L was about twice of the Cu concentration for surface waters of
the Atlantic Ocean reported by Li (2000).
Kersanach et al. (2009) used DGT to determine labile fractions of Cd, Co, Cu,
Mn, Ni and Zn in the Patos Lagoon estuary in seawater of Brazil. The DGT
concentrations of Cd, Cu, Ni and Zn were low because of colloidal ligands in the area
affected by pollution from fertilizer, oil and petrochemical industries (Kersanach et al.,
2009).
54
Panther et al. (2012) evaluated DGT performance for measuring the dissolved
aluminum (Al) species in seawaters and freshwaters using Chelex-100 and titanium
dioxide-based (Metsorb) adsorbents. Metsorb-DGT showed a more accurate
measurement for dissolved Al in freshwaters above pH 7.7 and in seawater where the
predominant Al species is predicted to be Al(OH)4−. However, Chelex-DGT
underestimated the dissolved Al concentration in freshwaters (>pH 7.5) and in
seawater (Panther et al., 2012).
2.11. Assessment of trace metals availability in soils
Soil quality assessment is one of the key factors for evaluation the extent of
contamination in the environment has increasingly emphasised the need to consider
metals fractions reactivity in soils around anthropogenic activities (Lock and Janssen,
2001; Masto et al., 2015). Based on various studies, organic ligands, trace metals,
inorganic fractions and microbial proportions have been used as soil quality indicators
(de Haan and Visser-Reyneveld, 1996; Li et al., 2005; Ivezić et al., 2015). Trace
metals in soils can be originated from a natural source or varying consequences of
economic activities. Thus, aquatic soils constitute the most important pool or sink of
different chemical forms of metals and other contaminants governed by lithology of
the soils and rock in contact with them (Liang et al., 2014). Soils scientists have long
emphasised that trace metals fractions and their toxicity are essentially absorbed and
uptaken by biota from the soil solutions (Zhang and Young, 2005; Wuana and
Okieimen, 2011). The behavior of trace metals in soils can be influenced by their
sorptions and desorptions reactions with varying soil components and matrix. The
bioavailability of trace metals in soil solutions can be influenced by various processes
including metals dissociation and release from chemical contaminants (e.g., crude oil,
agricultural practices (pesticides and fertilizer), paints and economic ports activities)

55
(Zhang and Young, 2005; Rocha et al., 2011). Furthermore, the chemical forms of
metals in soils; water-soluble fractions, organic/or inorganic ligands, exchangeable
and Fe/or Mn oxides bound, are kinetically determine the metals lability and mobility
(Iwegbue, 2011). Soil contamination with crude oil has become a global
environmental concern especially regions surrounding oil exploration, heavy
industries and oil refineries, which are more threatened. Crude oil contains different
concentrations of saturated, aromatic, and resins constituents at varying molecular
weight (MW) range, depending oil type on degradation and microbial activities as
described above (Xiao et al., 2010; Iwegbue, 2011). Within hydrocarbons in soils or
sediments derived from spilled or discharged oil, organic complexes matrix,
recalcitrant hydrocarbons as poly aromatic/substituted aromatic molecules (Wang and
Stout, 2010; Omaka et al., 2011), including resins and hydrocarbons containing
different functional groups (like carboxylic acids, ethers, other organic acids etc.), are
the most dominant fractions, and represent more than 45% of the released oil
components in the contaminated area (Tissot and Welte, 1984; Abha and Singh, 2012;
Osam et al., 2013).
In most circumstances, free metals ions, inorganic and organic fractions
released from crude oil spill are the key species that influence the trace metals
speciation in the soil (sediments) (Guéguen et al., 2011; Majolagbe et al., 2012;
Adesina and Adelasoye, 2014; Fu et al., 2014).
However, there is a lack of consistency may be partially interpreted by the lack
of a standardised experiments to generate and ensure reliable, reproducible and
comparable obtained data. Very little fieldwork has been reported in the literature
regarding the effect of crude oil contamination on trace metals loads in soils applying
conventional techniques and extraction methods. However, still a lack of important
56
standardised laboratory protocols to better understand the influence of crude oil
constituents on the trace metals speciation in soils impacted with crude oil using
reliable technique. It was found (Omaka et al., 2011; Shukry et al., 2013; Fu et al.,
2014) that crude oil complexes in soils can either enhance or decrease the availability
of trace metals depending on the oil composition. The decreased concentrations were
probably due to the complexation with strong organic and inorganic ligands of high
molecular weight from oil.
Considerable research has been conducted in Nigeria and the Dammam zone in
the east of Saudi Arabia on the effect of crude oil contaminated soil on the availability
of nutrient elements and the properties of soil (Agbogidi, 2013; Shukry et al., 2013).
They treated the soils with different levels of oil (w/w). The results in both areas
showed that an increase of trace metals Cu, Mn, Cd and Pb, Fe and Pb in soils and
plant tissues with increasing crude oil concentration oil. Iwegbue (2011) and Omaka et
al. (2011) investigated the effect of organic and inorganic fractions on the trace metals
mobility and bioavailability in soils contaminated with crude oil in the Niger Delta
using conventional extraction methods and 0.2-µm nucleopure polycarbonate
membrane filters before being analysed for metals by atomic absorption
spectrophotometry (Perkin Elmer, A3100). Cu and Cd were found at low
concentrations in the soils affected with oil due to the formation of organometallic
complexes with organic matter from oil. Ni and Cr were governed by residual
fractions and found at higher concentrations maybe due to their release from oil
contamination. Fu et al. (2014) pointed out that oil industries in the field contribute to
the trace metal loads in the soil located nearby oil refineries and extraction processes
using acid conventional extraction and high pressure microwave digestion before
analysis by ICP-MS, 7700i, algilent, USA. The results demonstrated that all targeted

57
metals were increased and by fractionation analysis the mobility of them in soil
contaminated with crude oil decreased in the order Cd > Mn >Zn > Ni > Pb > Cu > Cr
> V. All studies revealed that some trace metals (Ni, Cu, Cd and Cr) in contaminated
soils and sediments were found at a wide range of varieties, maybe due to the oil
composition and level of pollutants entering the soil.
Most studies on the effect of crude oil constituents on trace metals in soils
focused on measuring the total concentrations rather than speciation and investigating
the influence of the matrix in biogeochemical processes in the environment. All
studies revealed that some trace metals (Ni, Cu, Cd and Cr) in contaminated soils and
sediments were found at a wide range of varieties, may be due to the oil composition
and level of pollutants entering the soil.
Relatively limited or no sufficient information is available regarding the effect
of crude oil constituents on trace metals availability in soils. For the three decades the
sultanate of Oman relied on crude oil and petroleum products as a main source for
economic support. Moreover, the industrial estates and economic port activities were
increased. On the other hand, this rapid growth leads to serious environmental
problems on the environment in terms of its increasing risks of contamination of
coastal soils and communities. Sohar industrial region (SIR) in Sultanate of Oman has
crude oil refinery and large number of industries operating in a confined area closer to
agriculture farms, which cultivates area as fodder for their livestock (Jamrah et al.,
2007; Abdul-Wahab and Jupp, 2009; Al-Rashdi and Sulaiman, 2013). (SIR) has
indicated an interest in evaluating the potential influence of industrial and crude oil
ligands on the trace metals availability in costal soils around industrial area. However,
there is still limited studies of heavy metals in economic ports in Sultanate of Oman;
in particular, published work is scarce for the main economic ports and industrial

58
regions (Al-Husaini et al., 2014). Moreover, there was lack information about trace
metals speciation in these regions. Therefore, it is very difficult to interpret the
contaminants inputs due to unavailable of natural concentrations of dissolved trace
metals. These ambiguous findings probably can be explained by lack of standardised
laboratory protocols, by treating different soils of varying properties with different
levels of crude oil (%w/w) followed by field assessment to see the contribution of oil
ligands to trace metals fractionation (Omaka et al., 2011; Kleindienst et al., 2015). The
in situ speciation technique, DGT, has alternatively been used to determine the amount
of metals that kinetically resupplied from the solid phase to the soil solutions (Zhang
et al., 2004; Zhang and Young, 2005). The reduction in the resupply rate of metals
fractions from solid phase into soil solution is typically attributed to the presence of
high levels of large organic ligands and colloids from contamination. This could
increase the amounts of binding sites for retaining cations (Kovaříková et al., 2007). If
the R = CDGT/Csoln is 0.1 < R < 0.9, it indicates the soil solid phase able to resupply
metals fractions into soil solution. When greater than (0.9), the metal is present in soil
solution kinetically labile fractions and mobile due to high capacity of solid phase to
resupply soil solution with metals species. If the R value is very low and less than 0.1,
it indicates that capacity of solid phase to resupply soil solutions by metals species is
very low or no metals can be resupplied and kinetically limited (Zhang et al., 1998;
Senila et al., 2012).
2.12. Assessment of trace metals pollution in sediments
Sediment pollution poses one of the serious nationwide environmental
problems in marine systems especially in economic ports. Sediments samples act as a
pools or sinks of inorganic and organic contaminants coming from seawaters through
various processes including complexation, adsorption, bioaccumulation or
59
precipitation, this will affect the sediments quality (Li et al., 2012; Diop et al., 2015).
Discharges from oil refinery production can make a great and numerous contributions
to coastal contamination of metals in the sediments. Studies on the species of trace
metals in coastal sediments around refinery discharge point can provide information
on the degree of pollution and contribution of crude oil ligands on the trace metals
discrimination (Omaka et al., 2011; Liang et al., 2014; Ngeve et al., 2015). These
discharges, despite they treated in the refinery by oil companies still affecting the trace
metals speciation measurements. Within organic compounds in sediments derived
from discharged oil, organic and inorganic fractions, aromatic/substituted aromatic
molecules (Wang and Stout, 2010; Omaka et al., 2011), including resins and organic
complexes containing various functional groups such as carboxylic acids and organic
acids etc), are the most dominant species released oil constituents in the polluted area
(Tissot and Welte, 1984; Abha and Singh, 2012; Garrido Reyes et al., 2013; Osam et
al., 2013).
It was found (Omaka et al., 2011; Shukry et al., 2013; Fu et al., 2014) that
crude oil complexes in soils and sediments could either enhance or decrease the
availability of trace metals depending on the oil composition. The decreased
concentrations were probably due to the complexation with strong organic and
inorganic ligands of high molecular weight from oil.
Sohar and Al Fahal ports are a significant harbor located in Oman’s as
mentioned above in section 2.1. Effluents from Al Fahal port contribute to the release
of trace metals such as Pb, Cr, Fe, Cu, Zn, Cd and V into the marine sediment. Al-
Husaini et al. (2014) evaluated heavy metals contamination of Pb, Cd, V and Cu in the
marine sediments at Al Fahal port and found concentrations V and Cu were high
around SBM3 station due to the high effluents of ballast water from the tankers

60
anchoring near exporter zone. Also Al-Shuely et al. (2009) assessed the heavy metals
contents of V, Ni, Cd, Pb, Cu, Zn, Mn, Cr and Se in coastal sediments around (SIR).
The study observed that the concentrations of Cr, Mn, Ni and as contents were high in
some selected locations as shown in Table 2.5.
Table 2.5. The measured heavy metals contents in (SIR) (mg/kg) and compared with other studies (Al-Shuely et al., 2009).
Fowler et al. (1993) reported that the total concentration of vanadium (V) in
the most coastal sediments regions in Sultanate of Oman were exceeded 20 mg/kg,
which reflects the presence of crude oil contaminants in these areas. Vanadium (V)
could be used as a potential marker for exposures for crude oil hydrocarbon
contamination (Al-Husaini et al., 2014). However, the environmental behavior of trace
metals fractions in sediments are not only associated to their total contents, but also
requires to a large extent to determine their chemical fractions. Moreover, Al Fahal
and (SIR) coastal areas are regions that strongly influenced by crude oil constituents.
Thus, the interactions of trace metals with natural and oil ligands play an important
role in their transport, fate, and bioavailability in coastal sediments (Gao et al., 2012;
Al-Husaini et al., 2014).

61
The organic matter in sediments often takes place by biological activities and
followed by release of fractions (solid phase) such as Fe/Mn oxyhydroxide releasing
metals after reduction process. Therefore, an reliable information required regarding
metals distributions and exchange between the solid and solution phases for managing
the trace metals contamination in sediments (Gao et al., 2012).
2.13. Determination of labile trace metals fractions in groundwaters
Trace metal contamination in groundwaters is one of the important
environmental issues and it can be increased by anthropogenic activities (Li et al.,
2014). Trace metals transported from soil to underground waters. Groundwater
contains a wide variety of dissolved organic matter and inorganic elements in different
concentrations that influenced by dissolution/precipitation reactions and adsorption
including the rates (kinetics) of the geochemical process. The use of municipal solid
waste (MSW) compost as fertilizer may pose a threat to groundwater quality due to the
leaching of the high content of trace metals humic substances and EDAT are the major
organic materials in in groundwaters, occurs as a mixture of phenol-carboxylate
polyelectrolytes influence the lability and mobility of trace metals. Additionally, the
metal complexation of metals could enhance the transport of trace metals fractions to
groundwater. Most of the organic ligands are stable and uncharged or could be present
as a negatively charged sites ions not easily removed from solution (Komy, 1993;
Nowack et al., 1997). The groundwaters in Sultanate of Oman are increasingly under
pressure due to overexploitation in view of population growth, activities related to
development as well as environmental degradation. Groundwaters (open wells) around
industrial regions, (SIR) and Rusyal Industrial Estate (RIE) in Sultanate of Oman were
studied to assess the contribution of industrial activities around these sites on the

62
degree of loads in irrigation open wells (CHOUDRI et al., 2015). Moreover, there is
no comprehensive research concerning the speciation of trace metals in Oman’s open
wells to see the contribution of industrial and refineries activities to the trace metals
loads in groundwaters.
2.14. Water quality challenges in Oman
Oil refineries, wastewater treatment plants, heavy industry, atmospheric
deposition and industrial by-products often produce point sources of primary trace
metals contamination in marine systems (Alagarsamy et al., 2005; Freije, 2015).
Recent rapid rises in coastal developments in the Sultanate of Oman include large
economic harbors and ports with industrial and crude oil activities which will result in
increasing risks of the contamination of coastal habitats and communities by trace
metals and oil constituents (Abdul-Wahab and Jupp, 2009; Hamzeh et al., 2013).
Sohar industrial region (SIR) and Al Fahal port have been identified as the
important commercial regions in the Sultanate of Oman. Considerable amounts of
trace metals and organic substances are transported to the Omani coastal environment
by anthropogenic activities in the economic ports in the form of industrial effluents, oil
refinery discharges and ballast waters from tankers and ships.
Trace metals are not easily degraded or destroyed in the environment due to
their stability and persistence, they are neither degraded nor destroyed, and can
bioaccumulate through the food chain, with serious health and environmental impacts
(Patrick, 1978). The potential exists for the formation of toxic organometallic
compounds that could affect the coastal ecosystem. Heavy metal contaminants can
lead to a dramatic deterioration in terms of biodiversity by depleting ecologically
sensitive species and eliminating water quality. Such a study in the coastal region is

63
necessary to provide a good benchmark for the establishment of control strategies to
improve marine environmental quality (Wan et al., 2008).
Therefore, water quality assessment is an important concern for determining
the state of Omani aquatic systems, and regulating anthropogenic activities, which can
result in preventing the distribution of trace metals and so maintaining good marine
environmental quality (Sekabira et al., 2010; Hussein, 2012). Furthermore, seawater
quality issues are of extreme importance due to socio-economic reasons, protecting
aquatic species and the fact that many Omani regions depend on desalinated seawater
as a source of potable water for domestic and industrial use (Freije, 2015). Prior to this
time, the lack of full understanding of trace metals behavior in Omani seawater and
groundwater due to the lack of more sensitive and applicable techniques that provide
reliable information with adequate data quality is a serious hindrance to understanding
Omani aquatic systems (Sekabira et al., 2010).
This study is directed towards the development of the dynamic diffusive gradients
in thin films (DGT) technique for assessing water quality and providing a good
benchmark for the establishment of control strategies to improve marine
environmental quality in the Sultanate of Oman.

64
Chapter 3 – Effects of Crude Oil Contamination on Trace Metals Availability in Seawater Using Diffusive Gradient in Thin Films
3.1. Introduction
Trace metals are the main inorganic constituents in seawater that are perceived
to be contaminants of concern. They result from industrial and oil refinery activities in
economic harbours and are discharged into marine waters at many sites. There are still
limited research studies of trace metals in global seawater and the impact of oil spills
on the quality of marine systems, in particular, published data are scarce for this study
area (Sadiq and McCain, 1993). According to study conducted by Al-Sayed et al.
(1994), Cu, Zn, Pb, Mn, Ni, Cd, and Fe recorded highest concentrations in two sites
around Bahrain (Gulf country) after Gulf war oil spill. Based on study by Santos-
Echeandía et al. (2008) enrichment factors for Sr, Zr, Pb, Ba, and Fe were very high in
all collects seawaters samples due to the heavy fuel spill from the Prestige tanker
wreckage in the overlying seawater column in North Atlantic ocean. In Lebanon, a
work conducted by Barbour et al. (2009), demonstrated that the Jiyeh oil spill in the
Eastern Mediterranean Sea caused the levels of Pb, Ni and V in seawater higher than
normal values. Basically, trace metal contamination assessment in marine systems
under oil spill incidents are lack of reliable dynamic technique, assessing of
environmental impacts associated with the oil industry as a whole, from drilling to
refining for meaningful interpretation of the large set of environmental data (Ziolli and
Jardim, 2002; Mustafa et al., 2015).
Recent increases in coastal development in the Sultanate of Oman including
large economic ports with oil refinery industries in Muscat, Sohar, Al duqum and

65
Salalah have made the scientific community aware of the possibility of metal loads
around contaminated areas (Abdul-Wahab and Jupp, 2009). The oil composition
introduced to seawater in the form of WSF and WISF is also strongly governed by the
type of oil and weathering processes as described and discussed in Chapter 2. Some
oil constituents of lower molecular weight are soluble in seawater and while oil
spreads over the surface of sea it tends to dissolve rapidly. The chemical constituents
of WSF of crude oil in seawater principally influence the determination of labile trace
metals species in crude oil contaminated marine systems. Therefore, it is worth
proposing a reliable method for speciation measurements of trace metals in order to
assess water quality around economic ports. The environmental impacts of trace
metals pollutants strongly depend on the fractionation and mobility of metals in
marine systems. It is necessary for understanding the mobility, lability and pathways
of trace metals to have reliable information about their physicochemical properties in
seawater. None or little research has been conducted to assess the impact of crude oil
contamination on trace metals fractionation. Ambiguous and incomparable findings
were obtained by previous studies. This could be explained by a lack of standardised
laboratory experiments by using varying concentrations of WSF containing low
concentrations of trace metals from different ratios of oil to water (OWR%) to
evaluate the effect of oil ligands on the trace metals speciation in seawater.
In this study, a series of laboratory experiments will be conducted to develop a
robust and reliable DGT method to further quantitatively understand the effect of
crude oil ligands on trace metals fractionation in the synthetic solution of high ionic
strength.

66
3.2. Materials and Methods
3.2.1. Reagents, materials and solutions Crude oil was provided by the Ministry of Oil and Gas in the Sultanate of
Oman, high purity Milli-Q water (≥ 18 MΩ/cm) was used to prepare all solutions. A
1000 mg/L stock solutions of multielements (Cd, Ni, Zn, Cu, Co and Pb) were
prepared from their nitrate salts by dissolving the salts in Milli.Q water. All
experimental components were acid-cleaned in 10% (v/v) HNO3 overnight and rinsed
thoroughly with Milli.Q water before use. The binding layer used is (Chelex-100, Bio-
Rad). The diffusive layer 0.78 mm was prepared in the Lancaster DGT research clean
labs. Diffusive gels and filter membranes were soaked in 0.5 M NaNO3 solution
before use to take a shorter time to attain equilibrium and eliminate diffusional
artifacts present at low ionic strengths. The plastic moldings for the DGT devices were
provided from DGT Research Limited (Lancaster, UK). In this study all diffusive gels
were soaked in the NaNO3 solution of the same ionic strength of solutions in the
laboratory experiments or seawater for field deployment for ions equilibrium.
3.2.2. Diffusion coefficients measurements
The diffusion coefficients of trace metals ions through filter membrane and
diffusive gel were measured according to the procedures described by Zhang and
Davison (1999) and Scally et al. (2006). The diffusion cell consists of two
compartments of about 120 ml with 2 cm diameter openings in each. Discs of filter
membrane and hydrogel 2.5 cm each were placed between the openings and the
compartments were clamped together properly. The filter membrane soaked in Milli-
Q water overnight and washed in 0.1 M v/v HNO3 overnight, then removed from acid
and washed with Milli-Q water then stored in Milli-Q water. The hydro gel used in the
experiment was APA gel sort, which is mainly used for the DGT method.

67
The diffusive gel membrane was stored in 0.5 M NaNO3. Then both partitions
were filled with 100 ml solutions of the same matrix synthetic solution of 0.5 M NaCl.
One of the compartments, A (source solution) contained 5 mg/L of (Ni, Zn and Cu)
and 1 mg/L of (Cd, Co and Pb) as a carrier. The other compartment, B (known as a
receptor solution), aimed to accumulate the masses of the diffused metals ions. The
temperature was measured at the beginning, middle and the end of the experiments
using a thermal thermometer. Both sections were stirred properly and continuously
using an overhead stirrer to prevent the effect of DBL. The experiment was carried out
for 8 hours. Sub-samples of 0.2 mL were taken from each compartment at various
intervals and analysed by ICP-MS. In total 12 subsamples were taken from each
compartment. The diffusion coefficients D were calculated at registered temperatures
during the experiment, using equation (3.1):
𝐷 = .∆.
(3.1)
m: slope of the linear part of the plot of diffused masses versus the time.
g: the thickness of membranes and hydrogel.
C: the concentration in the compartment (A, receiving).
This equation estimates the diffusion coefficient for the temperature, T, at which the
experiment was performed.
Equation (3.2) can be applied to estimate diffusion coefficients at any given
temperature DT, from its value at 25 °C, D25 (Zhang and Davison, 1995; Scally et al.,
2003).
LogDT=[(1.37023(T-25) +8.36×10⁻⁴(T-25)2)/(109+T)] +log(D25(273+T)/298) (3.2)

68
Temperature effects on the diffusion coefficients of the metals were corrected
according to Stokes–Einstein equation (3.3):
𝑫𝟏 𝜼𝟏
𝑻𝟏 = (3.3)
Where D1 and D2 are the diffusion coefficients of metals ions at known temperatures
T1 and T2, respectively. 𝜂 and 𝜂 are denoted for the viscosities of water at
temperatures T1 and T2, respectively (Fan et al., 2013).
3.2.3. DGT Performance
In order to investigate the effect of high ionic strength on the DGT
performance, the DGT devices were deployed in triplicate in 8 L well-stirred 0.5
mol/L NaCl solution with Cd, Cu, Pb, Ni, Zn and Co (all at about 100 µg/L) over
periods of time from 4 to 15 h. A dequate volume of the sample solution was used to
ensure that the depletion of studied metals, by the DGT can be ignored. The DGT
devices were also tested in 0.7 mol/L NaCl solution, spiked with 50 µg/L of Cd, Cu,
Pb, Ni, Zn and Co, for the same deployment periods. The DGT validation was
performed by assessing the linear relationship between the accumulated mass (M) of
metals ions in resin gel and the deployment periods (t) using theoretical lines, derived
from the DGT equation with known concentrations of deployment. Assessment can
also be made by comparing CDGT to Csoln and the ratio of close to 1 indicating good
performance.

69
3.2.4. Effect of crude oil ligands on the trace metals fractions To investigate the reliability of the DGT method for measuring trace metal
fractions in synthetic solutions affected by complex matrices of crude oil, a series of
experiments were conducted in the laboratory environment.
The testing of DGT was performed in separated 8 L capacity containers filled with
well-stirred synthetic solutions containing ≈ 20 µg/L of the targeted trace metals ions
impacted with varying OWR% and mixing times. The devices were exposed to the
water-soluble fractions (WSF) solutions of OWR to investigate the effect of crude oil
ligands on the measurement of labile metals.
3.2.4.1. Measurement of labile trace metals in crude oil To measure labile metals in crude oil, standard DGT devices were carried out
in 8 L of WSF of 3% OWR (w/v) at pH ≈ 5.8 for 14 h. The WSF was prepared
according to Anderson et al. (1974), and Maher (1986) by adding 240 g of crude oil to
7760 ml of synthetic solution of 0.5 mol/L NaCl ionic strength. The mixture was
gently stirred for 48 hours using a magnetic stir bar so that a vortex was not produced.
Then the mixture was left overnight for standing before separating the lower phase
using a plastic tap or clean pipette.
The temperatures were measured at the beginning and at the end of the
deployment by thermometer for trace metals, so that the diffusion coefficient of the
metal across the diffusive layer can be estimated. The mean temperature was 20 ºC.
Solution samples (1 ml) were taken before and after adding oil (WSF). Also a liquots
(1 ml) of the solution samples were taken at the onset and at the end of the DGT
deployment for subsequent analysis.
At the end of deployment, the DGT units were removed out from the solution
and rinsed with Milli-Q water thoroughly. Then, the DGT units were disassembled and

70
the binding layers were immediately removed from the devices and placed in a clean
1.5 ml polypropylene micro centrifuge vial. Then 1 ml of 1 M HNO3 was added and
left overnight for eluting the metals from resin gels. The solutions were diluted
accordingly for ICP-MS analysis (ICP-MS, Thermo X-7, Thermo Fisher, Cheshire,
U.K.). The internal standard in all samples was rhodium (Rh).
The accumulated mass (M) of trace metals in the resin gel was calculated using
the following equation (3.4):
𝑀 = 𝑪𝒆(𝑰𝑪𝑷 𝑴𝑺)(𝑴𝑯𝑵𝑶𝟑 𝑽𝒓𝒆𝒔𝒊𝒏 𝒈𝒆𝒍)𝒇𝒆
(3.4)
Where Ce is the concentration of trace metals in the 1 M HNO3 elution solution (in
µg/L), measured using ICP-MS, VHNO3 is the volume of added acid (1ml) to binding
gel, Vgel is resin gel. The used elution factor (fe) for calculating mass of trace metals
accumulated in the binding layer (Chelex-100) = 0.85. The estimated concentrations of
trace metals in DGT (CDGT) were calculated by using equation (3.7) (Zhang and
Davison, 1995; Warnken et al., 2006).
The following sections investigate the factors that could affect the trace metals
lability in crude oil contaminated synthetic solution of high ionic strength using DGT.
3.2.4.2. Effect of mixing time of oil and water
To examine the effect of mixing time on DGT measured labile studied metals
species in crude oil contaminated waters, DGT devices were deployed in triplicates in
8 L of synthetic solutions for 16 h. The solutions were prepared in separate containers
by stirring gently synthetic solutions of 0.5 mol/L NaCl containing (35-40) µg/L, (30-
60) µg/L, (25-45) µg/L, (50-60) µg/L, 60 µg/L, (40-60) µg/L of Cd, Cu, Co, Pb, Ni,
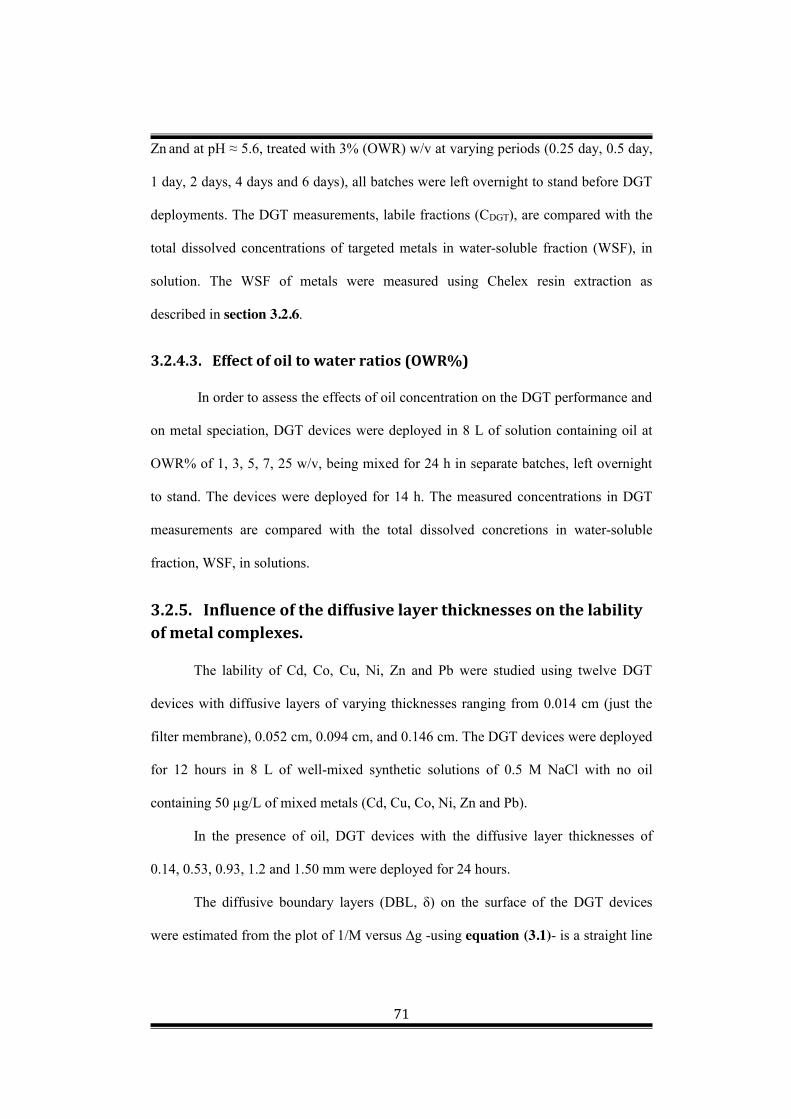
71
Zn and at pH ≈ 5.6, treated with 3% (OWR) w/v at varying periods (0.25 day, 0.5 day,
1 day, 2 days, 4 days and 6 days), all batches were left overnight to stand before DGT
deployments. The DGT measurements, labile fractions (CDGT), are compared with the
total dissolved concentrations of targeted metals in water-soluble fraction (WSF), in
solution. The WSF of metals were measured using Chelex resin extraction as
described in section 3.2.6.
3.2.4.3. Effect of oil to water ratios (OWR%) In order to assess the effects of oil concentration on the DGT performance and
on metal speciation, DGT devices were deployed in 8 L of solution containing oil at
OWR% of 1, 3, 5, 7, 25 w/v, being mixed for 24 h in separate batches, left overnight
to stand. The devices were deployed for 14 h. The measured concentrations in DGT
measurements are compared with the total dissolved concretions in water-soluble
fraction, WSF, in solutions.
3.2.5. Influence of the diffusive layer thicknesses on the lability of metal complexes.
The lability of Cd, Co, Cu, Ni, Zn and Pb were studied using twelve DGT
devices with diffusive layers of varying thicknesses ranging from 0.014 cm (just the
filter membrane), 0.052 cm, 0.094 cm, and 0.146 cm. The DGT devices were deployed
for 12 hours in 8 L of well-mixed synthetic solutions of 0.5 M NaCl with no oil
containing 50 µg/L of mixed metals (Cd, Cu, Co, Ni, Zn and Pb).
In the presence of oil, DGT devices with the diffusive layer thicknesses of
0.14, 0.53, 0.93, 1.2 and 1.50 mm were deployed for 24 hours.
The diffusive boundary layers (DBL, δ) on the surface of the DGT devices
were estimated from the plot of 1/M versus ∆g -using equation (3.1)- is a straight line

72
with a slope (S) = 1/ (CDGTADgel) and a y- intercept (I) = δ/CDGTADwt. The equation
was obtained using the following steps (equations (3.7) - (3.11)):
𝑀 = . . .∆
(3.5)
= ∆ . . .
(3.6)
= . . .↓
∆𝑔 + . . .↓
(3.7)
= . . .
∙ 𝐷𝑔𝑒𝑙 ∙ 𝑡 ∙ 𝐴 ∙ C (3.8)
= ∙ 𝐷𝑔𝑒𝑙 (3.9)
𝛿 = (3.10)
The values of Dgel=0.85Dw, where Dw is the value measured in water at an infinite
dilution. The mass (M) of the analyte accumulated in the resin gel eluted for ICP-MS
analysis can be expressed by equation (3.9) (Zhang and Davison, 1995; Warnken et
al., 2006; Chen et al., 2012; Panther et al., 2012).
3.2.6. Chelex resin extraction method
The total water-soluble metal concentrations (or total dissolved metal
concentrations) in solution were measured by Chelex resin extraction before ICP-MS
analysis as the ionic strength was too high and the metal concentrations were too low
for appropriate dilution. Chelex-100 resin (Bio-Rad Laboratories, 100-200 mesh and
Na form) was used. An aliquot of dry resin (0.3 g) and 17 ml of the synthetic solutions
were placed in 50 ml centrifuge tubes. The mixtures were shaken for 2 h in closed
tubes to allow complete extraction.
73
Then, the aqueous solutions were carefully removed using clean pipettes. In
order to elute trace metals preconcentrated on the Chelex resin, 2 ml of 1 M HNO3
was added and left over night. The schematic representation of the resin extraction
procedure is shown in Figure 3.1. Samples of (1ml) each at the beginning and at the
end of the experiments were taken from deployment solutions to determine total metal
concentrations. The samples were diluted 20 times for ICP-MS analysis.
Figure 3.1. Chelex-100 resin extraction method using ion-exchange resin Chelex-100 for measuring WSF of metals.
3.3. Results and Discussion
3.3.1. Diffusion Coefficients
The diffusion coefficients of trace metals ion of Ni, Cd, Cu, Co, Zn, Pb were
measured in the solutions 0.5 M NaCl using the diffusion cell. The plots of mass vs
time were linear and they are presented in the Figure 3.2. The values of diffusion
coefficients were calculated using equation (3.1). The slops and intercepts of the
linear lines and the parameter of ∆g = 0.92 mm (diffusive gel + filter membrane), A =
1.78 cm2 and C= 5 mg/L of (Ni, Zn and Cu) and 1 mg/L of (Cd, Co and Pb) are used.
The measurements were carried out at pH 5.6 and temperature of 19.0 ± 0.5 °C. For
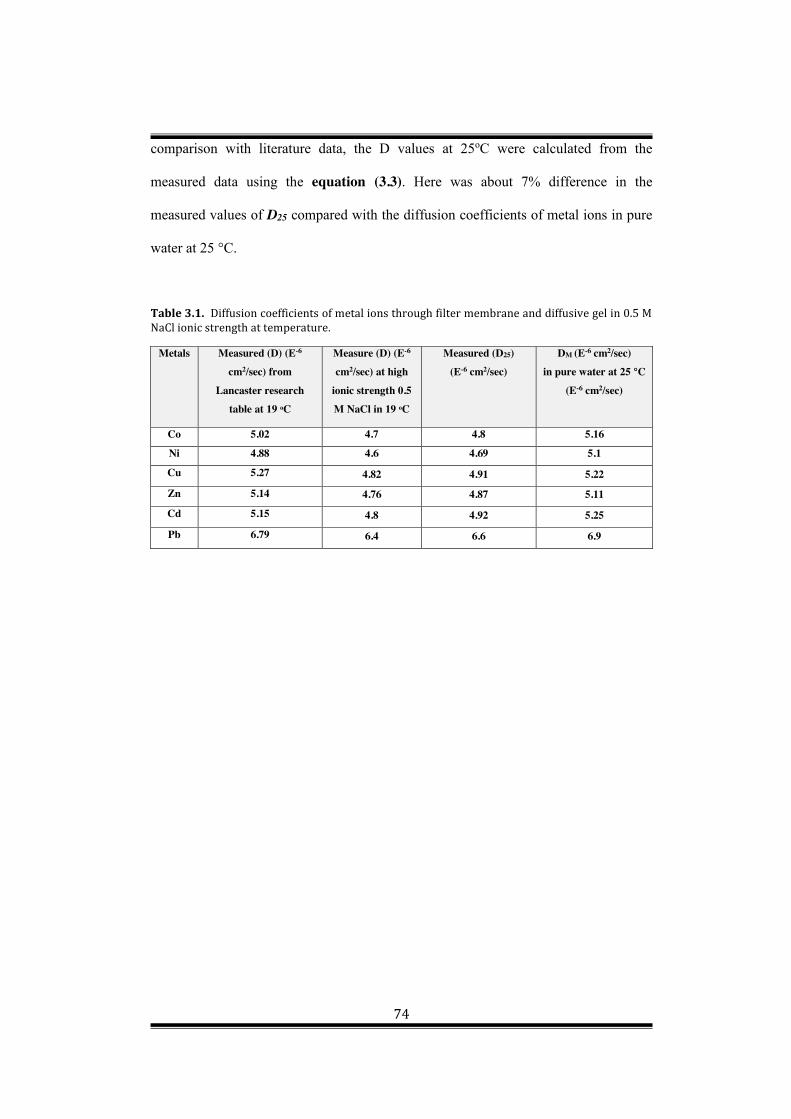
74
comparison with literature data, the D values at 25oC were calculated from the
measured data using the equation (3.3). Here was about 7% difference in the
measured values of D25 compared with the diffusion coefficients of metal ions in pure
water at 25 °C.
Table 3.1. Diffusion coefficients of metal ions through filter membrane and diffusive gel in 0.5 M NaCl ionic strength at temperature.
Metals Measured (D) (E-6 cm2/sec) from
Lancaster research table at 19 ᵒC
Measure (D) (E-6 cm2/sec) at high
ionic strength 0.5 M NaCl in 19 ᵒC
Measured (D25) (E-6 cm2/sec)
DM (E-6 cm2/sec) in pure water at 25 °C
(E-6 cm2/sec)
Co 5.02 4.7 4.8 5.16
Ni 4.88 4.6 4.69 5.1
Cu 5.27 4.82 4.91 5.22
Zn 5.14 4.76 4.87 5.11
Cd 5.15 4.8 4.92 5.25
Pb 6.79 6.4 6.6 6.9

75
Figure 3.2. Trace metal masses diffused across the diffusive gel and filter membrane with time during targeted metals diffusion cell experiment. The ionic strength 0.5 NaCl and the average temperature during the experiment was 19 ± 0.5 oCatpH≈5.6.
The results showed that the diffusion coefficients of metal ions in a solution of
0.5 M NaCl ionic strength are at most only about 7% lower than that in pure water.
The difference could be attributed to the difference in the viscosity between the gel
and the water. It confirms previous observations (Sangi et al., 2002) of free diffusion
for ion Cd2+ in the NaNO3 solution in the range 0.01 mol/L to 1 mol/L using DDGT
y = 0.8226x - 163.51R² = 0.9994
0
5000
10000
15000
20000
25000
0 9000 18000 27000 36000
Mas
s (µg
)
Time (s)
Ni
y = 1.3141x - 548.53R² = 0.9962
0
10000
20000
30000
40000
0 20000 40000
Mas
s (µg
)
Time (s)
Pb
y = 0.7347x - 208.93R² = 0.9966
0
5000
10000
15000
20000
25000
0 20000 40000
Mas
s (µg
)
Time (s)
Zn
y = 0.763x - 577.42R² = 0.9952
0
5000
10000
15000
20000
25000
0 20000 40000
Mas
s (µg
)
Time (s)
Cu
y = 0.6414x + 10.698R² = 0.9942
0
5000
10000
15000
20000
0 10000 20000 30000 40000
Mas
s (µg
)
Time (s)
Cd
y = 0.537x - 221.54R² = 0.9969
0
5000
10000
15000
20000
0 8000 16000 24000 32000
Mas
s (µg
)
Time (s)
Co
76
agarose cross-linked polyacrylamide gel. More likely explanations are that the slight
decrease in the Cd diffusion coefficient was observed by Alfaro-De la Torre et al.
(2000) and he attributed this to the viscosity caused by ionic strength. Some variations
in diffusion coefficients could be expected and not more than 8% between pure water
and seawater. Some charges at the gel surface may affect the diffusion coefficients in
freshwaters at low ionic strength according to previous studies (Chang et al., 1998;
Zhang and Davison, 1999; Scally et al., 2006; Warnken et al., 2006; Panther, 2008).
These will not be a problem for this study, because the gels were conditioned in 0.5
mol/L NaNO3, and all experiments were carried out in 0.5 mol/L NaNO3
3.3.2. Effect of deployment time and ionic strength on the DGT measurements
The effect of ionic strength on the capability of DGT devices to accumulate
metal ions in the resins as a function of time was investigated in two synthetic
solutions of 0.5 and 0.7 mol/L NaCl contain 100 µg/L and 50 µg/L, respectively. The
experiment investigated whether DGT sampler meets the application of the DGT
equation as shown in Figure 3.3. The regression lines are very close to the theoretical
lines for all metals in both 0.5 M and 0.7 M NaCl solutions. Good agreements between
the experimental data and DGT theoretical lines in Figure 3.3 indicate that DGT
principle works well at high ionic strength.
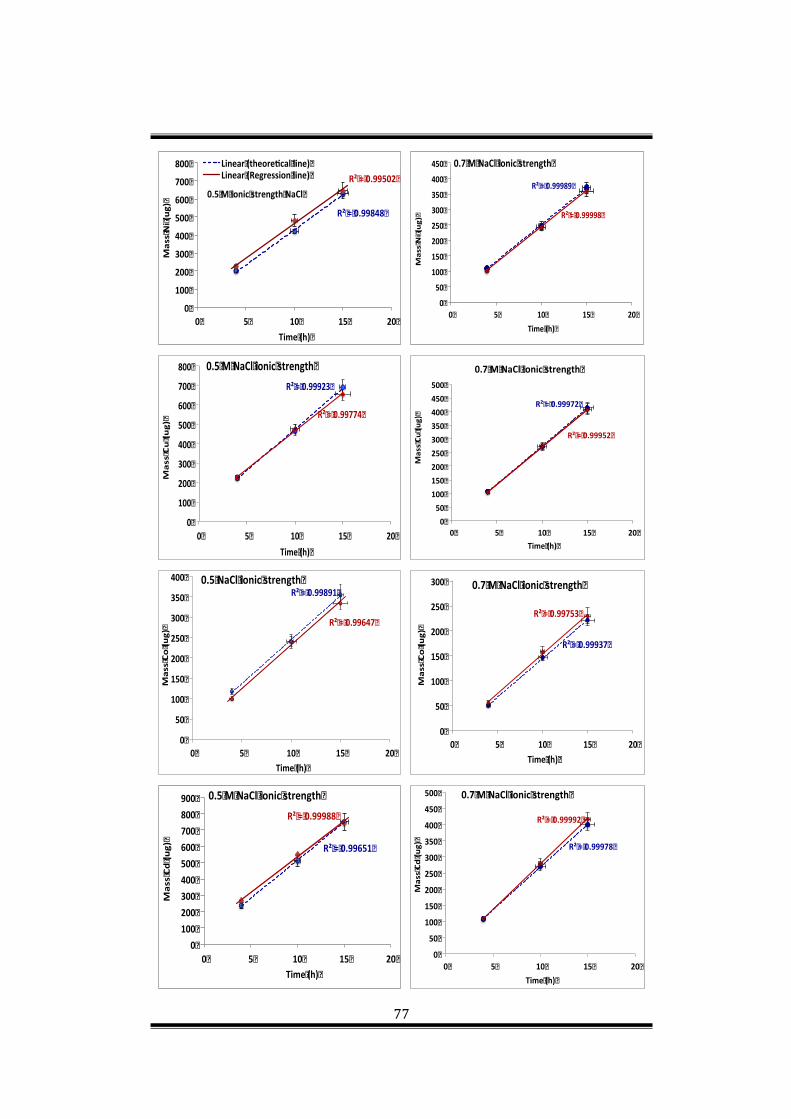
77
R²�=�0.99848�
R²�=�0.99502�
0�
100�
200�
300�
400�
500�
600�
700�
800�
0� 5� 10� 15� 20�
Mass�Ni�(ug)�
Time�(h)�
0.5�M�ionic�strength�NaCl�
Linear�(theore cal�line)�Linear�(Regression�line)�
R²�=�0.99989�
R²�=�0.99998�
0�
50�
100�
150�
200�
250�
300�
350�
400�
450�
0� 5� 10� 15� 20�
Mass�Ni�(ug)�
Time�(h)�
0.7�M�NaCl�ionic�strength�
R²�=�0.99923�
R²�=�0.99774�
0�
100�
200�
300�
400�
500�
600�
700�
800�
0� 5� 10� 15� 20�
Mass�Cu�(ug)�
Time�(h)�
0.5�M�NaCl�ionic�strength�
R²�=�0.99937�
R²�=�0.99753�
0�
50�
100�
150�
200�
250�
300�
0� 5� 10� 15� 20�
Mass�Co�(ug)�
Time�(h)�
0.7�M�NaCl�ionic�strength�
R²�=�0.99988�
R²�=�0.99651�
0�
100�
200�
300�
400�
500�
600�
700�
800�
900�
0� 5� 10� 15� 20�
Mass�Cd�(ug)�
Time�(h)�
0.5�M�NaCl�ionic�strength�
R²�=�0.99978�
R²�=�0.99992�
0�
50�
100�
150�
200�
250�
300�
350�
400�
450�
500�
0� 5� 10� 15� 20�
Mass�Cd�(ug)�
Time�(h)�
0.7�M�NaCl�ionic�strength�
R²�=�0.99972�
R²�=�0.99952�
0�
50�
100�
150�
200�
250�
300�
350�
400�
450�
500�
0� 5� 10� 15� 20�
Mass�Cu�(ug)�
Time�(h)�
0.7�M�NaCl�ionic�strength�
R²�=�0.99891�
R²�=�0.99647�
0�
50�
100�
150�
200�
250�
300�
350�
400�
0� 5� 10� 15� 20�
Mass�Co�(ug)�
Time�(h)�
0.5�NaCl�ionic�strength�

78
Figure 3.3. The mass of the metals accumulated by resin gel DGT devices as a function of time. DGT devices were suspended in a well-stirred solution 0.5 M NaCl and 0.7 M NaCl containing known concentrations for different time periods. The solid lines are the lines of best fit for the experimental data. The dashed lines are predicted relationships calculated from known deployment conditions and the DGT equation.
In all DGT deployments, enough volume of solutions was used to ensure that
the depletion of Cd, Cu, Co, Ni, Zn and Pb was negligible. When DGT devices were
deployed for varying times, the accumulated mass (M) of metals on the resin gel
increased with time (t), at both ionic strengths with R2 ranged between 0.983- 0.999 for
all metals solutions as shown in the Figure 3.3.
DGT performs well with a good agreement between measured CDGT and
deployment concentrations solutions at both ionic strengths at pH ≈ 5.67 with ratios
R²�=�0.99098�
R²�=�0.99589�
0�
100�
200�
300�
400�
500�
600�
700�
0� 5� 10� 15� 20�
Mass�Zn�(ug)�
Time�(h)�
0.5�NaCl�ionic�strength�
R²�=�0.99806�
R²�=�0.99803�
0�
50�
100�
150�
200�
250�
300�
350�
400�
450�
0� 5� 10� 15� 20�
Mass�Zn�(ug)�
Time�(h)�
0.7�M�NaCl�ionic�strength�
R²�=�0.99667�
R²�=�0.99993�
0�
100�
200�
300�
400�
500�
600�
700�
0� 5� 10� 15� 20�
Mass�Pb�(ug)�
Time�(h)�
0.7�M�NaCl�ionic�strength�
R²�=�0.99977�
R²�=�0.99343�
0�
200�
400�
600�
800�
1000�
1200�
0� 5� 10� 15� 20�
Mass�Pb�(ug)��
Tiem�(h)�
0.5�M�NaCl�ionic�strength�

79
ranged between 97% ± 4.6 - 102% ± 4.3 of all targeted metals, confirming previous
findings of free diffusion for simple ions obtained by Zhang and Davison (1995) and
Sangi et al. (2002).
The relative standard deviations (RSDs) of the DGT measurements in both
solutions were in the range between 4% and 10%, which indicate good precision of
DGT technique.
3.3.3. Resin extraction for labile metals (WSF)
Six series of experiments were conducted to determine the trace metal ions in
the same synthetic solutions where DGT deployments were carried out. From the
results presented in Table 3.2 it can be observed that the uptake of metals ions onto
Chelex-100 in Na+ form was independent of ionic strength. Within the precision of the
analytical technique, the concentrations measured by resin extraction agreed well with
the direct solution measurements after dilution with a ratio of Cresin/Csoln ranged
between 91% ± 2.6 - 107% ± 5.4 of all metals.
Table 3.2. Measured trace metals by resin extraction (WSF) and DGT methods in synthetic solutions of 0.5 M and 0.7 M NaCl, contain 100 µg/L and 50 µg/L, respectivelyatpH≈5.64.
Metal
0.5 M NaCl, I.S 0.7 M NaCl, I.S WSF CDGT WSF CDGT
Ni 87.5 87 45.96 45.13 Cu 80.97 81.1 41.96 42.16 Co 44.7 44.3 21.85 23.83 Cd 90.0 96.4 41.62 47 Zn 78.8 78.5 40.25 38.2 Pb 90 90.35 42.19 45.00
Average 78.7 79.61 38.97 40.22 Correl 0.99 0.95

80
3.3.4. Comparison between DGT and resin extraction methods
The measured metal concentrations by both DGT and resin extraction methods
are presented in Table 3.2 and showed a good correlation. The results indicated that
there were no differences in the measured concentrations of ion-exchangeable Cd, Cu,
Pb, Zn, Co and Ni at both ionic strengths of t-test that p value P (T<=t) two-tail = 0.73
is high (greater than 0.05).
Figure 3.4. Percentages of CDGT/Cresin of determined trace metals ions by resin
extraction and DGT methods in synthetic solutions of 0.5 M (�) and 0.7 M NaCl (•), contain100µg/Land50µg/L,respectivelyatpH≈5.64.
This is consistent with observations from studies found by Sangi et al. (2002),
Veguería et al. (2013), and Amara-Rekkab and Didi( 2015), which assessed the
influence of the ionic strength of solutions medium on the equilibrium uptake of Hg2+
and Cd2+ from the aqueous solution by DGT and Chelex-100 resin. The ratios of the
measured concentrations obtained by both CDGT and resin extraction methods to the
concentrations measured by ICP-MS in both ionic strengths solutions were similar and
in the range 0.9 – 1.1 as shown in Figure 3.4.
0
0.2
0.4
0.6
0.8
1
1.2
Ni Cu Co Cd Zn Pb
CD
GT/
CR
esin
Metals

81
From Table 3.2, t-test it is illustrated that p value P (T<=t) two-tail = 0.73 is
high (greater than 0.05).
From the above results it can be noted that the DGT and resin extraction
methods agree well in both solutions for all metals, which indicate that DGT can
provide reliable measurements for trace metals in seawaters.
3.3.5. Effect of mixing times in the presence of 3% OWR The DGT-labile measurements of Cu, Co, Cd, Ni, Zn and Pb in different
solutions containing 3% OWR at varying mixing times were obtained and presented in
Table 3.3 and Figure 3.5. The relative standard deviation values (RSD%) at all
measurements were 2% - 5%, which indicate a good precision for DGT. The DGT-
labile fractions Cd showed a dramatic decrease with time (from 38.5 ± 1.5 µg/L to
14.2 ± 1.6 µg/L and labile Cu showed generally increase with time (6.7 ± 2.6 µg/L to
28.4 ± 0.7 µg/L), see Table 3.3.
Table 3.3. Trace metal fractions measured in WSF of crude oil at varying mixing times.
Before Oil
C.DGT With
oilSTD Before
Oil
C.DGT With
oilSTD Before
Oil
C.DGT With
oilSTD Before
Oil
C.DGT With
oilSTD Before
Oil
C.DGT With
oilSTD Before
Oil
C.DGT With
oilSTD
0.25 39 38.5 1.5 58 6.7 2.6 29 30 2 55 51 2.6 60 65 3 60 57.76 100.5 38 35 2 55 5 1 30 29 1 55 49.31 3.7 60 67.3 10 60 61 3.11 34 23 2.3 42 3.1 0.2 25 25 1.3 45 46 2 60 60 3 55 48 22 37 12.4 0.9 45 12 0.8 32 36 1.5 60 53 1.7 59 58 2 40 55 2.44 36 13 0.3 31 27 1.7 33 29 1.4 61 50 2.2 61 54 3 40 48 2.96 37 14.2 1.6 50 28.4 0.7 36 28 1.1 60 49 1.4 61 53 1 47 59 1.7
Mixing Time
(days)
Trace Metals (µg/L)Cd Cu Co Pb Ni Zn

82
The higher concentrations of labile Cd than that of labile Cu, is attributed to
the tendency of Cd to form inorganic complexes especially with chloride (Cl-) in
solution and the predominantly stronger organic complexes DGT-labile forms of Cu
than Cd fractions, impeding fast dissociation. The complexation of Cd with the large
excess of CI- ion (forming CdCl2 and CdCl+), depresses organic chelation (Simpson,
1981; Christensen and Christensen, 2000).
The inorganic and organic ligands released from oil to solutions increase with
time and form strong complexes with Cd and reduce the mobility and lability of Cd.
The complexation by strong large aromatic ligands DOM cannot dissociate fast
enough to be measured by DGT (Zhang and Davison, 1995; Montero et al., 2012).
Large complexes may be too big to diffuse through the diffusive gel layer. All these
factors can cause reduction in DGT measured concentrations.
The increase in Cu concentration indicates release of Cu from oil and
complexation of Cu from the organic ligands did not compete with the total input of
Cu. previous studies showed that the increase of Cu and other trace metals associated
to crude oil contamination. An increase on dissolved copper (2.8–4.7 nM) and nickel
(2.2–8.0 nM) with respect to natural values (1–3 nM for Cu and 1.6–5 nM for Ni) was
observed in the column above the Prestige wreckage (NE Atlantic ocean) associated
with the mixing of seawater with the fuel spill from the Prestige tanker (Santos-
Echeandía et al., 2008). Liu et al. (2012) evaluated the impact of weathering processes
on the chemical composition of crude oil in seawater after released during the Deep-
water Horizon (DWH) oil spill accident in the northern Gulf of Mexico. The obtained
results showed that concentrations of V, Ni, Co, Cu, As and Pb increased due the
crude oil spill to seawater (Liu et al., 2012).

83
There was no significant overall difference with time for DGT labile Ni, Co,
Pb, and Zn. This can likely be attributed to the used crude oil samples provided by the
Sultanate of Oman (Arabic Gulf) containing relatively low contents of these metals,
which can be released to water.
Figure 3.5. The influence of mixing time of oil to water on DGT-labile fractions of Cd, Cu, Co, Pb, Ni, Zn in WSF (dissolved species) of 3% OWR, containing 50 µg/L of targeted trace metals and at pH ≈ 5.6 and 16 h deployment, using varying mixing periods (0.25, 0.5, 1, 2, 4 and 6 days).
It is similar to the observations obtained by Bu-Olayan et al. (1998) which
found high concentrations of trace metals Zn, V, Pb, Cr, Mn, Ni, Cu, and Cd in
Persian Gulf along the coastal belts of Kuwait after the Gulf War oil spills.
As metal concentrations become stable after 4 days of mixing, the mixing time
of 4 days was used before DGT deployments for this work.
0
10
20
30
40
50
60
70
80
0 2 4 6 8
CD
GT
(μg/
L)
Mixing Time (days)
Cu Cd CoPb Ni Zn

84
3.3.6. Effect of oil to water ratios OWR% on DGT measurements
The DGT measured concentrations of labile metals in solution containing 3%
oil (OWR, w/v) after 14 hours deployment are shown in Table 3.4. Low OWR (1%-
5%) is more suitable to measure the trace metal concentration in the crude oil using
oil/water emulsion method as it reduces compounds saturation extent, and increases
their partitioning in water medium (Tsvetnenko and Evans, 2002).
The results show that the water soluble fraction of metals and the DGT
measured labile metals are very low compared to the total concentrations in Oman
crude oil. The complete analysis of Oman crude oil using the 389 UOP method (using
wet ashing and ICP-OES) are provided by Petroleum Development Oman (PDO) in
Appendix (A)-Table (1). This is similar with previous studies of trace metal
determination in various types of crude oils (Witherspoon and Nagashima, 1957;
Dekkers and Daane, 1999; Silset, 2008). The much lower labile concentrations
indicate DGT discriminating metals in WSF fractions based on dissociation kinetics,
only labile fractions including free metal ions, inorganic complexes and some small
organic complexes.
Table 3.4. Measured trace metals in crude oil using DGT compared with the obtained results in Oman oil provided by PDO.
Metals CDGT in solution of 3% oil, (µg/L)
Total concentrations of WSF (µg/L) in solution
Total concentrations in oil provided by Oman (PDO),
(µg/L)
Cd 0.01 1.6 2.8 Cu 1.35 4 10
Co 2 4.1 10 Ni 3 7 12 Zn 4.1 10 60 Pb 2 1.24 10 Al 20 31 120 Cr 0.3 5 10

85
In order to investigate the effect of crude oil ligands on the DGT measurement,
deployment solutions were spiked with varying oil to water ratios (%OWR, w/v) as
described in the experimental section. The DGT measured concentrations for each
metal are plotted against the varying OWR% and are presented in Figure 3.6.
Nickel (Ni) and Cobalt (Co). The total dissolved Ni and Co concentrations (by ICP-
MS) in solutions before adding oil (control), DGT measured labile concentrations and
resin measured WSF were almost the same. This indicates: i) the low concentrations of
Ni and Co in Oman’s crude oil, ii) metal association with inorganic species and
aromatic complexes are small enough to diffuse through the hydrogel of the DGT and
iii) they can all dissociate and accumulate in the binding layer (Zhang and Davison,
2001; Guéguen et al., 2011). This is inconsistent with information in the literature
showed that Ni is present almost in crude oils at high concentrations depending on the
geochemistry of the original well of extracted oil (Duyck et al., 2008; Khuhawar et al.,
2012). Similar information obtained by others (de Mora et al., 2004; Al-Husaini et al.,
2014; Freije, 2015) who investigated the levels of trace metals in the Sultanate of
Oman near refineries and in seawaters affected by industrial and crude oil activities.

86
Figure 3.6. The measured concentrations by CDGT in WSF and ICP-MS in WSF and before adding oil with various concentrations of WSF (dissolved species) (1,3,5,7 and 25 OWR%, w/v): ionic strength of 0.5 mol/L NaCl containing (35-40) µg/L, (30-60) µg/L, (25-45) µg/L, (50-60) µg/L, 60 µg/L, (40-60) µg/L of Cd, Cu,Co,Pb,Ni,ZnatpH≈5.6.

87
Aluminium (Al). The added crude oil contributed to the alumnium (Al) load in
solutions with increased WSF of Al compared to the control solution. The WSF of Al
increased proportionally with increasing oil to water ratio up to 7% OWR and
decreased at 25% OWR. The percentages increase was ranging from 32 ± 1.20% to 85
± 6.14%. The total dissolved concentrations of Al (directly measured by ICP-MS) in
control solution are comparable to labile CDGT. DGT measured Al concentrations were
consistently lower than those of WSF Al. This suggests that Al contributed from oil as
WSF was complexed by organic ligands and they are too large to diffuse through the
DGT diffusive gel.
Zinc (Zn). Slight increase in concentrations of Zn at 5% and 7% OWR showing
contribution of Zn from oil. More than doubled the concentration at 25% OWR. DGT
measured concentration of Zn and WSF of Zn are very similar indicating all the
contribution of Zn from oil were complexed with oil-ligands and they are small
enough to diffuse through DGT gel and labile enough to dissociate and to be
measured.
Lead (Pb). DGT-labile Pb has an inverse relationship with WSF concentrations and
slowly decreases with the increasing of OWR%. No significant change in Pb
concentration with added oil up to 7%. At 25% OWR marked decrease for CDGT and
WSF Pb. This could imply low concentration of Pb in the oil and possibly form strong
organic complexes with oil ligands unable to dissociate and be accumulated by DGT.
Similar observations were found in the studies performed by Baeyens et al. (2011) and
Omanović et al. (2015). It can be observed that, in the presence of crude oil, CDGT and
WSF Pb were consistently lower than the total dissolved concentrations of Pb in
control solutions due to the formation of inert Pb complexes with oil’s ligands.

88
Cadmium (Cd). No significant change of WSF Cd concentration with increasing of
oil addition up to 25% OWR. This indicates no net contribution of Cd from oil.
Slightly lower WSF compared to total dissolved Cd before the oil addition, suggesting
strong and inert complexes of Cd and oil-ligands were formed. DGT measured Cd
was decreasing with increasing of OWR and also significantly lower than WSF Cd.
The results indicate: i) increased ligand contribution from the oil, ii) large complexes
of Cd with oil-ligands that not able diffuse through gel and iii) inert complexes of Cd
with oil-ligands that cannot dissociate and unavailable to DGT. This agreeing with the
findings obtained by Wallner-Kersanach et al. (2009) and Omanović et al. (2015).
They demonstrated that non-DGT-labile of Cd fractions were in general high due to
the formation of strong complexes by organic ligands that are less immobile and non-
labile in the contaminated sites around oil and petrochemical industries.
Copper (Cu). CDGT for Cu were much lower than other metals and dropped from 3.7 ±
0.12 µg/L (at 1% OWR) to 1.3 ± 0.34 µg/L (at 25% OWR). The results of Cu were
similar to those of Cd, but with much more pronounced differences of the three
measurements (control, CDGT and WSF) suggesting much stronger and larger
complexes of Cu oil-ligands compared to Cd complexes with oil-ligands.
3.3.7. Effect of oil to water ratio on WSF of metals
Four series experiments were carried out using Chelex resin (Bio-Rad
Laboratories, 100-200 mesh and Na form) to extract water soluble fraction (WSF) of
trace metals in synthetic solution without and with different amount of crude oil (3%,
5%, 25% OWR, w/v). After 24h mixing time, the results are shown in Figure 3.7 and
Table 3.5.
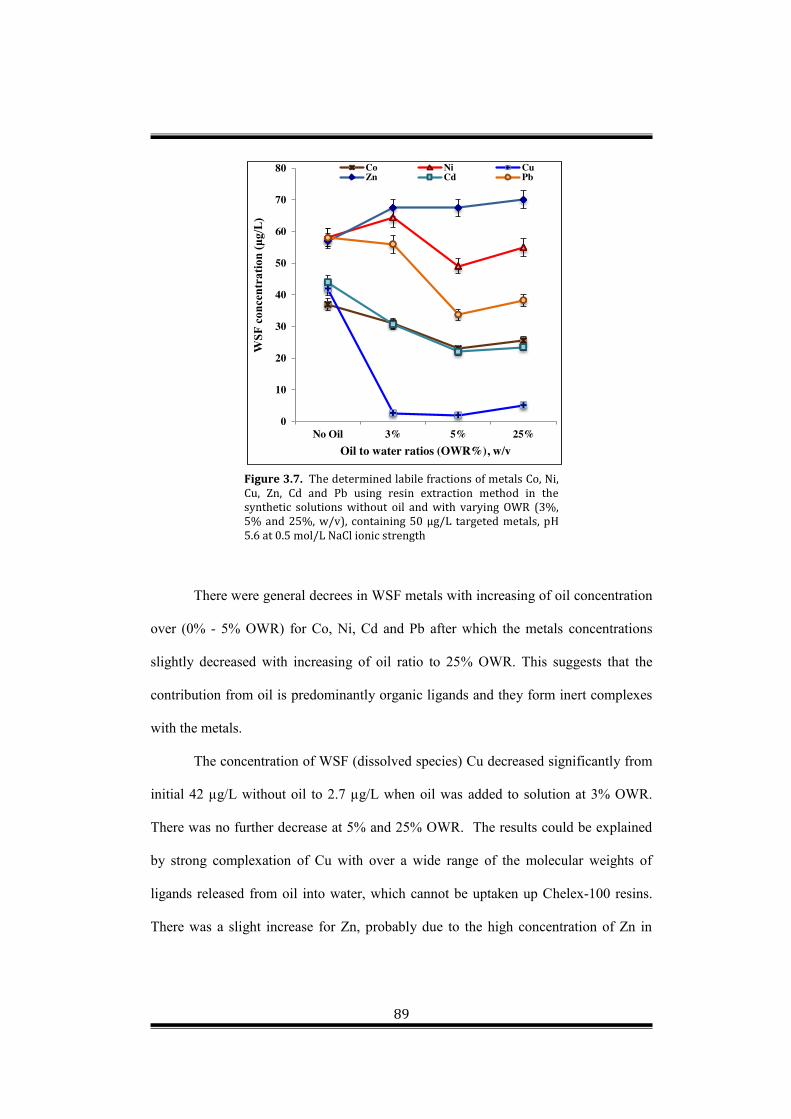
89
Figure 3.7. The determined labile fractions of metals Co, Ni, Cu, Zn, Cd and Pb using resin extraction method in the synthetic solutions without oil and with varying OWR (3%, 5% and 25%, w/v), containing 50 µg/L targeted metals, pH 5.6 at 0.5 mol/L NaCl ionic strength
There were general decrees in WSF metals with increasing of oil concentration
over (0% - 5% OWR) for Co, Ni, Cd and Pb after which the metals concentrations
slightly decreased with increasing of oil ratio to 25% OWR. This suggests that the
contribution from oil is predominantly organic ligands and they form inert complexes
with the metals.
The concentration of WSF (dissolved species) Cu decreased significantly from
initial 42 µg/L without oil to 2.7 µg/L when oil was added to solution at 3% OWR.
There was no further decrease at 5% and 25% OWR. The results could be explained
by strong complexation of Cu with over a wide range of the molecular weights of
ligands released from oil into water, which cannot be uptaken up Chelex-100 resins.
There was a slight increase for Zn, probably due to the high concentration of Zn in
0
10
20
30
40
50
60
70
80
No Oil 3% 5% 25%
WSF
con
cent
ratio
n (μ
g/L)
Oil to water ratios (OWR%), w/v
Co Ni CuZn Cd Pb

90
Oman’s oil or/and weakly complexed Zn and oil-ligands which easily available to
Chelex resin (Hart and Davies, 1977; Figura and McDuffie, 1980).
Table 3.5. The measured concentrations of labile trace metals (µg/L) in synthetic solutions with and without varying concentrations of WSF of different OWR%.
Metals No Oil 3% 5% 25%
Co 37 31.00 22.00 25.48
Ni 58 64.40 49.07 55.13
Cu 42 2.70 2.00 5.13
Zn 57 67.47 67.47 70.1
Cd 44 30.67 22.00 23.5
Pb 58 56.00 33.73 38.31
3.3.8. Theinfluenceofdiffusivegelthicknesses(∆g)
To investigate whether the DGT measurements in solutions with and with no
oil are dependent on (∆g), DGT devices of varying diffusive gel thicknesses were
deployed in solutions without oil and with oil at 3% OWR for 24 h with a 700 rpm
stirring rates as described in the experimental section. The plots of 1/M (ng-1) vs.
diffusive layer thicknesses (∆g, cm) obtained for solution without oil are presented in
Figure 3.8. The DBL (G) thicknesses were estimated using equation (3.10). The
results were not significantly different for all 6 metals studied, ranged between 0.011
cm to 0.030 cm with the mean value of (0.020 ± 0.0072 cm), which is about 21.28% of
the diffusion layer thickness (∆g) of the standard DGT sampler. It is similar to the
results obtained previously (Zhang and Davison, 1995; Warnken et al., 2006).
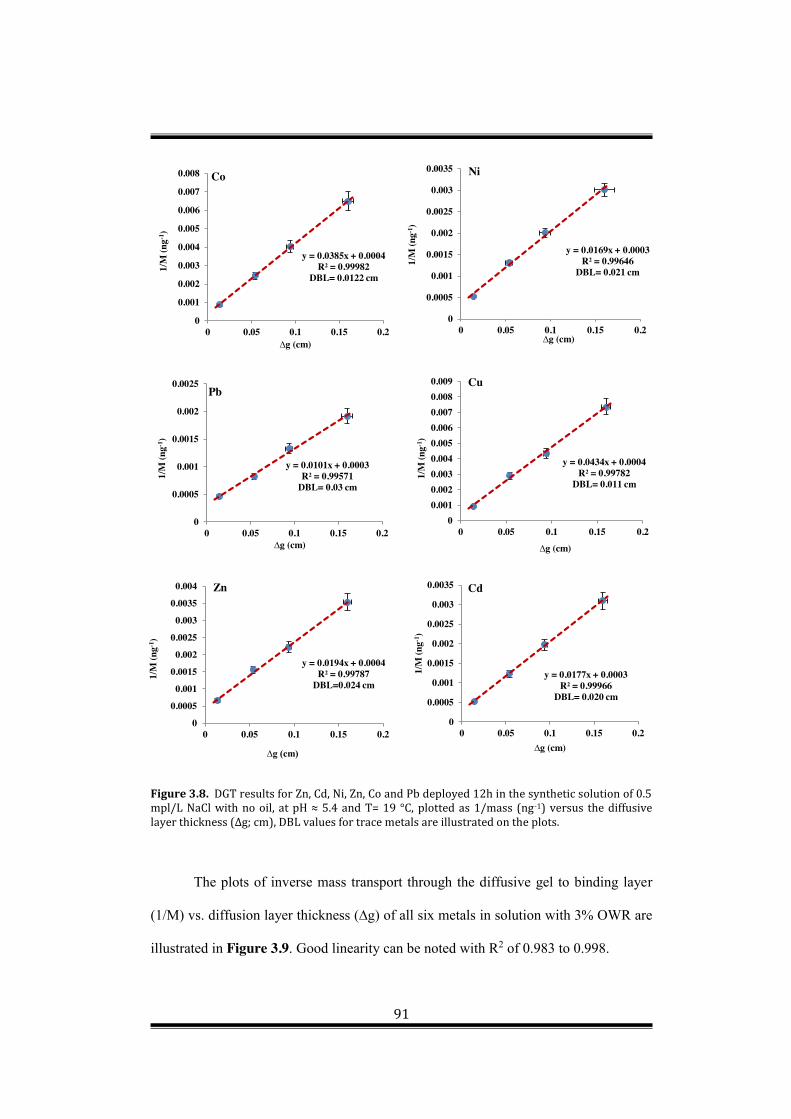
91
Figure 3.8. DGT results for Zn, Cd, Ni, Zn, Co and Pb deployed 12h in the synthetic solution of 0.5 mpl/LNaClwithnooil, atpH≈5.4andT=19 °C, plottedas1/mass (ng-1) versus the diffusive layerthickness(∆g;cm), DBL values for trace metals are illustrated on the plots.
The plots of inverse mass transport through the diffusive gel to binding layer
(1/M) vs. diffusion layer thickness (∆g) of all six metals in solution with 3% OWR are
illustrated in Figure 3.9. Good linearity can be noted with R2 of 0.983 to 0.998.
y = 0.0434x + 0.0004R² = 0.99782
DBL= 0.011 cm
00.0010.0020.0030.0040.0050.0060.0070.0080.009
0 0.05 0.1 0.15 0.2
1/M
(ng-1
)
∆g (cm)
Cu
y = 0.0101x + 0.0003R² = 0.99571
DBL= 0.03 cm
0
0.0005
0.001
0.0015
0.002
0.0025
0 0.05 0.1 0.15 0.2
1/M
(ng-1
)
∆g (cm)
Pb
y = 0.0385x + 0.0004R² = 0.99982
DBL= 0.0122 cm
0
0.001
0.002
0.003
0.004
0.005
0.006
0.007
0.008
0 0.05 0.1 0.15 0.2
1/M
(ng-1
)
∆g (cm)
Co
y = 0.0169x + 0.0003R² = 0.99646
DBL= 0.021 cm
0
0.0005
0.001
0.0015
0.002
0.0025
0.003
0.0035
0 0.05 0.1 0.15 0.2
1/M
(ng-1
)
∆g (cm)
Ni
y = 0.0177x + 0.0003R² = 0.99966
DBL= 0.020 cm
0
0.0005
0.001
0.0015
0.002
0.0025
0.003
0.0035
0 0.05 0.1 0.15 0.2
1/M
(ng-1
)
∆g (cm)
Cd
y = 0.0194x + 0.0004R² = 0.99787
DBL=0.024 cm
0
0.0005
0.001
0.0015
0.002
0.0025
0.003
0.0035
0.004
0 0.05 0.1 0.15 0.2
1/M
(ng-1
)
∆g (cm)
Zn

92
The DBL thicknesses obtained from Cu, Co, Ni, Pb and Zn plots were similar
with mean value of 0.027 ± 0.0079 cm, which is approximately 29% of the diffusive
layer (∆g) in the standard DGT sampler. It is approximately 26% higher than the
estimated DBL in the solution without oil. The measured DBL of Cd was significantly
larger with a thickness about 0.08 cm, which is about 85.11% of the diffusion layer
(∆g) of the standard DGT sampler and 75% higher than the obtained DBL layer in the
solution not affected by oil. This could be explained as a result of the slow dissociation
of Cd, Pb and Cu complexes that can be enhanced when increases the thickness of
diffusion layer (Turner et al., 2014).
From the above discussion it can be observed that DBLs are influenced by oil
ligands (apparent layer) and it is greater than the (physical layer) (G) explained
according to the Eigen mechanism (Warnken et al., 2006; Uher et al., 2013). The
apparent layer is caused by chemical dissociation of trace metals from larger ligands.
The differences in the thicknesses of DBL for the targeted metals in solutions with and
without oil were attributed to the kinetic limitation.
y = 0.0191x + 0.0004R² = 0.99013
DBL= 0.0246 cm
0
0.0005
0.001
0.0015
0.002
0.0025
0.003
0.0035
0.004
0 0.05 0.1 0.15 0.2
1/M
(ng-1
)
∆g (cm)
Co
y = 0.012x + 0.0002R² = 0.988
DBL= 0.020
0
0.0005
0.001
0.0015
0.002
0.0025
0 0.05 0.1 0.15 0.2
1/M
(ng-1
)
∆g (cm)
Ni

93
Figure 3.9. DGT results for Zn, Cd, Ni, Zn, Co and Pb deployed 24h in the 3 % OWR, WSF solution of0.5mol/LNaCl,atpH≈5.4andT=19°C,plottedas1/mass(ng-1) versus the diffusive layer thickness(∆g;cm), DBL values for studied trace metals are illustrated on the plots.
To further understand the effect of diffusive gel layer thickness on DGT
measurements, CDGT was calculated with and without DBL being added to the
diffusion layer. When DBL was considered the effective surface area of 3.08 cm2 was
used in the calculation. Otherwise, the physical surface area of 2.54 for the DGT
exposure window was used.
y = 0.0138x + 0.0003R² = 0.9831
DBL= 0.022 cm
0
0.0005
0.001
0.0015
0.002
0.0025
0.003
0 0.05 0.1 0.15 0.2
1/M
(ng-1
)
∆g (cm)
Zn
y = 0.0526x + 0.0012R² = 0.98888
DBL= 0.027 cm0
0.002
0.004
0.006
0.008
0.01
0.012
0 0.05 0.1 0.15 0.2
1/M
(ng-1
)
∆g (cm)
Cu
y = 0.0092x + 0.0003R² = 0.99154
DBL= 0.04 cm
00.00020.00040.00060.00080.001
0.00120.00140.00160.00180.002
0 0.05 0.1 0.15 0.2
1/M
(ng-1
)
∆g (cm)
Pb
y = 0.0518x + 0.0036R² = 0.99816
DBL= 0.08 cm
0
0.002
0.004
0.006
0.008
0.01
0.012
0.014
0 0.05 0.1 0.15 0.2
1/M
(ng-1
)
∆g (cm)
Cd

94
Figure 3.10. The ratio CDGT/Csolution, calculated where the DBL thickness is ignored and included, 12 h deployment in synthetic solution of 0.5 mol/L NaCl ionic strength contains 50 µg/L of nitrates of (Cd, Cu, Co, Ni, Zn and Pb), atpH≈5.4andT=19°Cwithoutoil.
0
0.2
0.4
0.6
0.8
1
1.2
0.14 0.53 0.93 1.6
Co
CD
GT/
Cso
l
∆g (mm)
CDGT/Csolution, ignored DBLCDGT/Csolution, included DBL
0
0.2
0.4
0.6
0.8
1
1.2
0.14 0.53 0.93 1.6
Cu
CD
GT/
Cso
l
∆g (mm)
0
0.2
0.4
0.6
0.8
1
1.2
1.4
0.14 0.53 0.93 1.6
Zn C
DG
T/C
sol
∆g (mm)
0
0.2
0.4
0.6
0.8
1
1.2
1.4
0.14 0.53 0.93 1.6
Cd
CD
GT/
Cso
l
∆g (mm)
0
0.2
0.4
0.6
0.8
1
1.2
1.4
0.14 0.53 0.93 1.6
Pb C
DG
T/C
sol
∆g (mm)
0
0.2
0.4
0.6
0.8
1
1.2
1.4
0.14 0.53 0.93 1.6
Ni C
DG
T/C
sol
∆g (mm)

95
Recalculating CDGT, accounting for the DBL and using an effective area of 3.08
cm2 using equation (3.5) as proposed by Warnken et al. (2006) for all devices
deployed. The obtained results were improved with the mean of the theoretical values
from (0.93 ± 0.028) (2.8% RSD) to (1.01 ± 0.024) (2.4% RSD) for all studied metals
as shown in the Figure 3.10. The observations obtained were in good agreement with
findings reported by Warnken et al. (2006) and Uher et al. (2013). Ratio of 1 indicates
good performance of DGT. The results suggest that DBL can be neglected for
calculations of CDGT for Co, Ni, Cd, Zn and Pb when the diffusion layer thickness is
above 0.53 mm. For diffusion layer thickness is at 0.14 mm, DBL has a greater effect
and it cannot be ignored for the DGT calculations. For Cu, DBL should be considered
in all calculations even for thicker diffusion layers.
The results for DGT devices deployed for 24 hours in solution containing 3%
OWR oil are shown in Figure 3.11. By ignoring the DBL, the mean ratios for
CDGT/Csoln, ranged between (0.33 ± 0.12 to 1.2 ± 0.13) of (5.4% RSD) for Co, Ni, Zn
and Pb and (0.075 ± 0.096 to 0.89 ± 0.17) of (5.87% RSD) for Cd and Cu. Similarly,
the results indicate that DBL cannot be ignored for thinner diffusion layer.
0
0.2
0.4
0.6
0.8
1
1.2
0.14 0.54 0.94 1.2 1.5
Ni C
DG
T/C
WSF
∆g (mm)
0
0.2
0.4
0.6
0.8
1
1.2
1.4
0.14 0.54 0.94 1.2 1.5
Co
CD
GT/
CW
SF
∆g (mm)
CDGT/CWSF, included DBL, A=3.08 cm2CDGT/CWSF, ignored DBL, A=2.54 cm2

96
Figure 3.11. The ratio CDGT/CWSF of different diffusion layers, calculated where the DBL thickness is neglected and included using 3.08 cm2 sampling area, for 24 h deployment in a synthetic solution of 0.5 mol/L NaCl ionic strength containing 50 µg/L of nitrates of (Cd, Cu, Co, Ni, Zn and Pb),atpH≈5.4andT=19°Cwith3%OWR, w/v.
The ratios of CDGT/Csoln for Cu were all below 1. This is attributed to the strong
complexation of Cu and oil-ligands that is less labile. Much lower ratios (about only
0.5) are observed for Cd. This indicates even stronger complexes that are inert or large
complexes that cannot diffuse through the DGT diffusive gel.
From the above discussion it can be observed that the degree of the metal-
DOM dissociation as a function of metal lability in solution with oil can be listed as
Zn > Co > Ni > Pb> Cu >> Cd. Results for other metals under the same experiments at
varying hydro gel thicknesses are shown in the Appendix (B)-Figure 1.
0
0.2
0.4
0.6
0.8
1
1.2
0.14 0.54 0.94 1.2 1.5
Cu
CD
GT/
CW
SF
∆g (mm)
0
0.2
0.4
0.6
0.8
1
1.2
0.14 0.54 0.94 1.2 1.5
Zn C
DG
T/C
WSF
∆g (mm)
0
0.2
0.4
0.6
0.8
1
1.2
0.14 0.54 0.94 1.2 1.5
Cd
CD
GT/
CW
SF
∆g (mm)
0
0.2
0.4
0.6
0.8
1
1.2
0.14 0.54 0.94 1.2 1.5
Pb C
DG
T/C
WSF
∆g (mm)

97
y = 27.573x + 2.6916R² = 0.9996
y = 26.577x + 5.9123R² = 0.99976
0
200
400
600
800
1000
1200
0 10 20 30 40
Mas
s(ug
)
1/(∆g )
Co -no Oil
Experimental data
Theoritical line (solution Concentration)
y = 49.703x + 26.032R² = 0.9973
y = 46.278x + 12.431R² = 0.9999
0.00
250.00
500.00
750.00
1000.00
1250.00
1500.00
1750.00
0 10 20 30 40
Mas
s(ug
)
1/(∆g)
Co- 3% oil
y = 43.843x + 36.968R² = 0.9992
y = 43.674x + 20.832R² = 0.9994
0.00
250.00
500.00
750.00
1000.00
1250.00
1500.00
1750.00
0 10 20 30 40
Mas
s (ug
)
1/∆g
Zn- no oil
y = 64.893x + 2.2833R² = 1
y = 70.746x + 40.821R² = 0.9962
0250500750
1000125015001750200022502500
0 10 20 30 40
Mas
s(ug
)
1/∆g
Zn-3% oil
y = 30.627x - 32.502R² = 0.9986
y = 32.211x - 27.106R² = 0.999
0.00
200.00
400.00
600.00
800.00
1000.00
1200.00
0 10 20 30 40
Mas
s (ug
)
1/(∆g )
Cu-no oil
y = 16.321x + 11.455R² = 0.9979
y = 20.945x + 2.4383R² = 0.9999
0.00
100.00
200.00
300.00
400.00
500.00
600.00
700.00
0 10 20 30 40
Mas
s(ug
)
1/(∆g)
Cu-3% oil
y = 40.723x - 1.581R² = 0.9996
y = 3.6431x + 92.14R² = 0.9873
0
200
400
600
800
1000
1200
1400
0 10 20 30 40
Mas
s(ug
)
1/(∆g)
Cd- 3% oil.
y = 57.113x - 8.4181R² = 0.9998
y = 55.154x - 3.9881R² = 0.9991
0.00
500.00
1000.00
1500.00
2000.00
2500.00
0 10 20 30 40
Mas
s(ug
)
1/(∆g)
Cd - no oil

98
Figure 3.12. The mass of the labile metal fractions accumulated by resin gel in DGT devices asa functionof thicknesses (∆g).TheDGTunitsofdifferent thicknessesofhydrogelwereexposedtothesyntheticsolutionswith3%OWRandwithnooil,containing≈50µg/LofCd,Cu, Co, Ni, Pb and Zn nitrates, pH =5.6 and 0.5 mol/L NaCl ionic strength. Using the measured diffusion coefficients and including DBL and soil device effective sampling area =3.08 cm2. The solid lines are well fit for the experimental data; the dashed lines are predicted relationships derived from deployment parameters using DGT equation.
The above findings have also been confirmed by the plots of DGT accumulated
mass versus 1/∆g, where experiment data were compared with DGT theoretical lines.
Slight deviation of Cu and huge deviation of Cd can be observed, in consistent with
the conclusions from Figure 3.10 and Figure 3.11.
y = 56.338x - 9.1251R² = 0.999
y = 53.535x + 9.4096R² = 0.9999
0.00
500.00
1000.00
1500.00
2000.00
2500.00
0 10 20 30 40
Mas
s (ug
)
1/∆g
Ni - no oil
y = 82.573x + 44.019R² = 0.996
y = 80.533x - 3.7856R² = 0.9999
0.00
500.00
1000.00
1500.00
2000.00
2500.00
3000.00
0 10 20 30 40
Mas
s (ug
)
1/∆g
Ni-3% oil
y = 57.797x + 259.21R² = 0.9906
y = 63.024x + 189.01R² = 0.9992
0.00
500.00
1000.00
1500.00
2000.00
2500.00
0 10 20 30 40
Mas
s(ug
)
1/∆g
Pb-no oily = 79.351x + 199.06
R² = 0.9952
y = 80.906x + 118.72R² = 0.999
0.00
500.00
1000.00
1500.00
2000.00
2500.00
3000.00
0 10 20 30 40
Mas
s (ug
)
1/∆g
Pb-3% oil
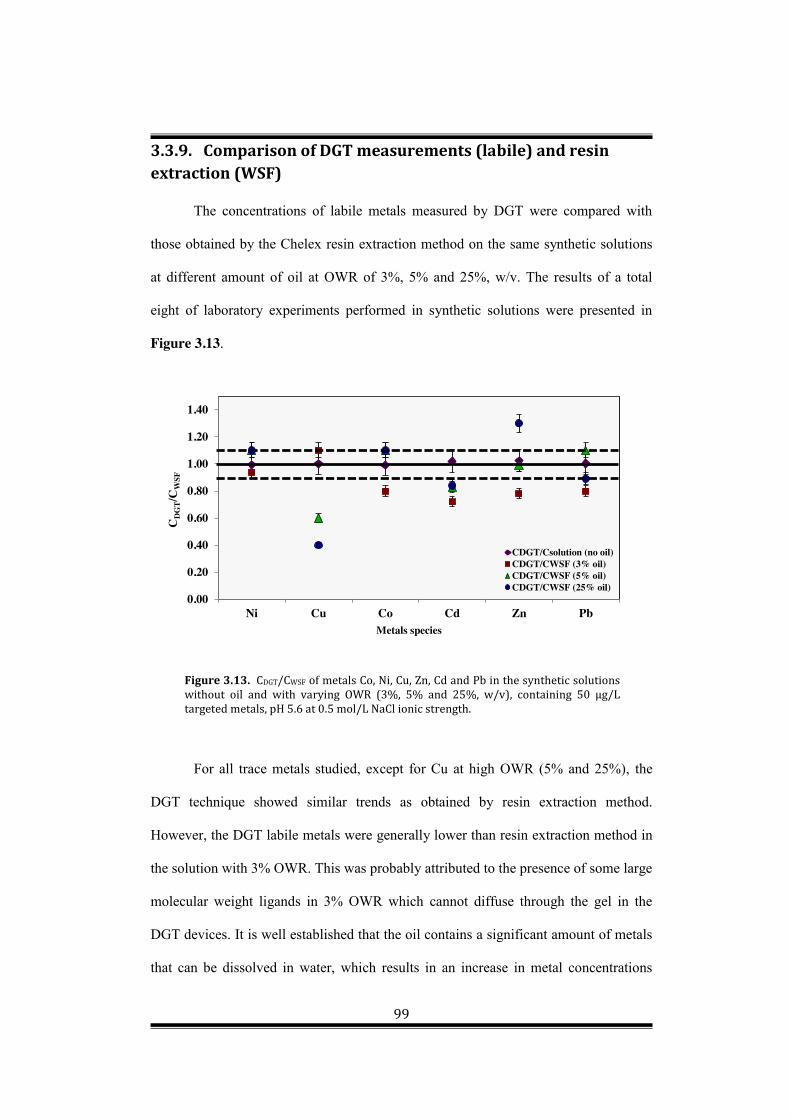
99
3.3.9. Comparison of DGT measurements (labile) and resin extraction (WSF)
The concentrations of labile metals measured by DGT were compared with
those obtained by the Chelex resin extraction method on the same synthetic solutions
at different amount of oil at OWR of 3%, 5% and 25%, w/v. The results of a total
eight of laboratory experiments performed in synthetic solutions were presented in
Figure 3.13.
Figure 3.13. CDGT/CWSF of metals Co, Ni, Cu, Zn, Cd and Pb in the synthetic solutions without oil and with varying OWR (3%, 5% and 25%, w/v), containing 50 µg/L targeted metals, pH 5.6 at 0.5 mol/L NaCl ionic strength.
For all trace metals studied, except for Cu at high OWR (5% and 25%), the
DGT technique showed similar trends as obtained by resin extraction method.
However, the DGT labile metals were generally lower than resin extraction method in
the solution with 3% OWR. This was probably attributed to the presence of some large
molecular weight ligands in 3% OWR which cannot diffuse through the gel in the
DGT devices. It is well established that the oil contains a significant amount of metals
that can be dissolved in water, which results in an increase in metal concentrations
0.00
0.20
0.40
0.60
0.80
1.00
1.20
1.40
Ni Cu Co Cd Zn Pb
CD
GT/
CW
SF
Metals species
CDGT/Csolution (no oil)CDGT/CWSF (3% oil)CDGT/CWSF (5% oil)CDGT/CWSF (25% oil)

100
(Nduka and Orisakwe, 2009; de Souza et al., 2014). This is the case for Zn at 25%
OWR.
For Cu, the DGT measured labile concentration is similar to the WSF
measured by resin extraction method in solution with 3% OWR. In solutions of 5%
and 25% OWR, DGT labile Cu was much lower than Cu concentrations obtained by
resin extraction method. This indicated that Cu in both solutions with 5% and 25%
OWR may form large and strong complexes, could not diffuse through the hydrogel or
could not dissociate during diffusion (Chakraborty et al., 2009; Kersanach et al.,
2009). Combination of DGT and resin extraction methods for trace metals in solutions
of different OWR% is useful for understanding the effect of crude oil ligands on trace
metal speciation in oil contaminated seawater.
3.4. Conclusion
This chapter demonstrates the potential of DGT technique for determining the
labile speciation of trace metals in seawaters polluted with varying concentrations of
crude oil OWR% under varying mixing times. DGT performance was validated in
synthetic solutions of 0.5 mol/L and 0.7 mol/L NaCl without and with oil at varying
concentrations. Using DGT devices containing varying thicknesses of diffusive gel
showed that DGT labile species increased as a function of the diffusive layer thickness
in synthetic solutions with and without oil. For Cd and Cu, DGT measurements were
significantly lower than those measured by resin extraction (WSF) due to
complexation with large ligands which cannot diffuse across the hydrogel. The DBLs
are influenced by oil ligands (apparent layer) and it is greater than the (physical layer)
(G) explained according to the Eigen mechanism. For all trace metals studied, except
for Cu at high OWR (5% and 25%), the DGT technique showed similar trends as
obtained by resin extraction method. Combination of DGT and resin extraction

101
methods for trace metals in solutions of different OWR% is useful for understanding
the effect of crude oil ligands on trace metal speciation in oil contaminated seawater.
The DGT technique was shown to be a reliable and robust procedure for trace metal
speciation in crude oil contaminated marine system.

102
Chapter 4 – Development of DGT technique with different membranes for metal speciation in crude Oil contaminated marine environments
4.1. Introduction
Many research achievements have demonstrated that the standard DGT is an
effective dynamic technique for metal speciation measurements in natural waters
(Davison and Zhang, 2012). However, it has not been used in oil contaminated
seawaters for measuring different metal speciation. Reliable direct measurement of
trace metals speciation in crude oil contaminated marine systems is a challenge for
analytical method due to their complex chemistry, oil complexes matrix, high salinity
and frequent occurrence at low concentrations. More important, however, is the lack
of knowledge on trace metals speciation in seawater impacted with crude oil
contamination. Therefore, further experimental work needs to be done in developing
DGT dynamic technique so that only targeted metals species is to discriminate trace
metals species in crude oil contaminated seawater. It is necessary for providing
reliable and sufficient information to interpret the reactivity of metals in biological and
environmental processes.
In seawaters, trace metal ions may exist in a different chemical forms,
categorised by the size, charge and density, all of which account in part for their
distribution in the marine systems (Singhal et al., 2006). The trace metals in seawaters
are associated with varying sizes of dissolved colloidal inorganic, organic ligands. A
variety of filtration and dialysis membranes were applied for trace metals
discrimination in seawater on the basis of molecular size. The separation of the
dissolved phase of trace metals species can be achieved on the basis of filtration
103
methods, either with conventional filters membrane or the use of numerous ultra-
filtration techniques. A single filtration step, through 0.4 µm and 0.45 µm is often
employed as a preliminary separation for the dissolved and particulate phases
(Harrison et al., 1981). Forsberg et al. (2006) used 0.22 µm membrane filtration in the
Baltic Sea immediately after sampling as an on-site fractionation procedure prior the
1kD ultrafiltration and as a stand-alone speciation step. They measured Cd, Cu, Mn,
Ni, and Zn species at two sites and the results were compared with DGT
measurements. The measured concentrations of Mn, Zn, and Cd in DGT agreed well
with those obtained in 1 kDa ultrafiltered samples. The DGT-labile concentrations of
Cu and Ni species were lower than ultrafiltered concentrations. All metals in the work
were influenced by large organic ligands and phytoplankton activity (Forsberg et al.,
2006). However, this separation is complicated by the presence of colloids often
results in clogging of the filters membrane during filtration decreases the effective
pore size and can cause the retention of increasing amounts of colloids, which then
decreasing the concentration of the metals (Mello et al., 2005). Various factors also
can affect metals speciation measurements during filtration procedure including (1)
type of filter, (2) filtration method, (3) filter diameter, (4) trace metals sorption or
desorption from the filter or from retained particles, (6) concentration of organic
complexes, and (7) volume of sample used in filter (Gimpel et al., 2003; Forsberg et
al., 2006).
Equilibrium dialysis, for the study of trace metal speciation in seawaters has
been used. However, the literature in this area is limited. Dialysis membrane allows
the separation of different groups of metals species on the basis of molecular weight
(Landner, 1987). Apte et al. (1989) used equilibrium dialysis to study Cd, Ni, Cu and
Zn speciation in seawater. Ideally, the dialysis membranes should permeable only to

104
species in true solution, but it has been concluded from other studies some high
molecular weight ligands, colloids can pass through membrane (Caroli, 1996; Gimpel
et al., 2003).
4.1.1. Nafion membrane properties
Nafion membrane is a unique perfluorosulphonate ionomers separator
membrane (Ahmed et al., 2009). It has extensive applications due to its chemical and
electrochemical inertness, its insolubility in water, its hydrophilicity, and chemical and
thermal stability, which all lead to it possessing almost ideal properties as a chemical
modifier (Hurst and Bruland, 2005; Ahmed et al., 2009; Ramkumar, 2012). It has
immense possibility for use as a cation exchange membrane for trace metals in the
contaminated marine systems owing to its high ion-conductivity (0.083 S/cm/ Nafion-
112) and ionic content and shelf life of the membrane (Slade et al., 2002; Ramkumar,
2012). It is a very strong Bronsted acid due to the presence of (–SO3-) groups attached
to the Teflon backbone and Nafion is a very strong proton donor owing to the
stabilizing effect enhanced by sulfonic acid in the large polymer matrix (Lim et al.,
2009; Ramkumar, 2012). The permeation rate through a membrane is directly related
to the thickness (Manea and Mulder, 2002). A higher performance separation and
selectivity can be achieved by using a thinner thickness as is applied in this study
(Blom et al., 2003). The molecular weight of Nafion is difficult to determine using
conventional methods because it is insoluble. It can be described by using equivalent
weight or material thickness (Ramkumar, 2012).

105
4.1.2. The synthesis and structure of Nafion membrane Nafion membrane made from a precursor co-polymerization of different
amount of tetrafluoroethylene (TFE) and unsaturated perfluoroalkyl sulfonyl fluoride
as shown in the Scheme 4.1. The strongly acidic sulfonic acid group cation exchange
site can be easily produced from the hydrolyzation of sulfonyl fluoride group (Ahmed
et al., 2009).
Scheme 4.1. Nafion synthesis (Ramkumar, 2012).
The sodium hydroxide NaOH used to convert SO2F group to sodium form
SO2Na precursor that can be extruded into sheets of the demanded thicknesses.

106
Thereafter, the membrane film is soaked in a concentrated acid HNO3 solution to
produce –SO3H form (Sahu et al., 2009; Ramkumar, 2012).
Nafion is not covalently cross-linked polymer, which makes its solvent welling
properties depend on large extent of the hydration characteristics of counter ions and
it’s pretreatment (Ahmed et al., 2009). Most importantly, the occurrence of transition
interphases between hydrophilic cation exchange sites (–SO3H) and hydrophobic
fluorinated backbone domains in the same polymer leads to the unique micro-phase
separation (Ahmed et al., 2009). The membrane has 40 Å clusters of sulphonate-ended
perfluoroalkyl ether groups that are organised as inverted micelles arranged on a
lattice as shown in the Figure 4.1 (a) (Smitha et al., 2005; Sahu et al., 2009). The size
of pores or channels that connect these micelles is 10 Å. When the polymers exposed
to the water or other hydrophilic solvents, it tends to segregates in two subphases
(Sahu et al., 2009). The hydrophilic subphase formed by water, sulphonate groups and
mobile ionic counter region contains absorbed water. Hydrophobic subphase
comprising the polymer backbone (perfluorinated polymer backbones) and by the side
chains, except of their sulphonate end sites Figure 4.1 (b) (Vishnyakov and Neimark,
2001; Sahu et al., 2009; Ramkumar, 2012).

107
(a)
(b)
Figure 4.1. Cluster-network model for the interactions between polymer and water in Nafion membrane (Smitha et al., 2005; Ramkumar, 2012).
In this study a thinner Nafion 112 of 0.05 mm thickness and 1100 equivalent
weight (EW) was used owing to its high permeation rate, rapid hydration and high
conductivity. The EW is defined as the weight of Nafion (in grams) per mole of
sulphonic acid group when the membrane is in acid form (Smitha et al., 2005;
Ramkumar, 2012). For example, Nafion 112 represents 1100 g EW (amu) and
thickness of 0.002 inches or 0.05 mm, which matches to 6.8 % of the Nafion
membrane being sulfonate groups by mass (Sahu et al., 2009).
4.1.3. Use of Nafion film for excluding anionic species. The Nafion polymer as a modifier has been widely and ideally used for
analytical purposes and plays crucial roles for analytical methods owing to its
chemical and physical properties (Hurst and Bruland, 2005). Nafion, due to its high
selectivity and the negatively charged properties, have been employed to prevent

108
diffusion of almost all negatively charged species to an electrode or adsorbent depends
on their sizes and affinities for the membrane (Murimboh et al., 2000; Blom et al.,
2003; Hurst and Bruland, 2005).
The pKa of the Nafion ≈ 1 owing to the –SO3- groups. At pH 5 of the samples,
the –SO3H groups tend to dissociate and became negatively charged and act as a
cation exchange (Murimboh et al., 2000). Nafion-coated electrode has been used for
lead (Pb) speciation studies synthetic solution at pH 8 and ionic strength of 0.6 M
NaCl. The complexing agents studied were nitrilotriacetic acid, ethylenediamine,
oxalic acid (PbOx) and humic acid. At pH 8 Pb-NTA species were non labile and
difficult to measurable due to the high stability constant, whereas the observed labile
Pb fractions from Pb-EDTA complexes was about 20% and the negatively charged
complexes are repelled by Nafion membrane. Although Pb-O complex was partly
hindered, it was more labile and small negatively charged Pb-Ox transport to the
adsorbent (Dam and Schrøder, 1996).
Nafion coated electrodes have been also widely applied for identifying the
biological species at different pH mediums. At pH 5, ascorbic acid occurs in the
anionic form and prevented by Nafion film from reaching the electrode surface,
whereas uric acid is in the cationic form and can be freely exchanged into the Nafion
membrane (Zen, 1998). Above pH 6, uric acid is essentially ionized and Nafion cation
exchange polymer eliminated the passage of both anions (ascorbic acid and uric acid)
through the membrane to adsorbent in electrode surface (Zen, 1998; Yuan et al.,
2005). A passive sampling device similar to DGT consists of a receiving membrane;
used a filter membrane coated with Nafion to eliminate transport of M-NOM to
chelating membrane. In contrast to the Nafion applications described above, smaller

109
negatively charged complexes M-NTA and oxine-5-sulfonate are permeated Nafion
coating membrane to receiving disc (Blom et al., 2003).
4.1.4. Dialysis membranes
The membranes are used for the separation of the smaller hydrated metal
cations and soluble inorganic complexes from the larger metal-DOM complexes.
Number of studies used anodic stripping voltammetry with dialysis to divide the metal
species into different sized fractions. The species that permeates the smallest pore size
are generally taken to be free metal ions or small labile complexes (Berggren, 1990;
Dewey, 1994; Förstner and Wittmann, 2012). DGT has also been used in conjunction
with dialysis to study speciation of trace metals in lake water. Gimpel et al. (2003)
used DGT and dialysis in speciation of trace metals in five lakes for characterising
accurately the distribution of trace metal species. They found that Zn by dialysis in
circumneutral water were slightly higher than DGT measurements, as zinc might be
partially complexed by fulvic or humic acid. The substantial differences between
dialysis and DGT measurements for Cu were attributed to the complexation by
fulvic or humic substances in the studied lakes waters (Gimpel et al., 2003). Pouran et
al. (2013 and 2014) applied 1000 MWCO (molecular weight cut off) dialysis in front
of DGT diffusive gel for measuring ZnO Nanoparticles in soils. The diffusion of ZnO
NPs can be prevented. Recently the Micro Float-A-Lyzer dialysis of different volumes
and pore sizes is designed to stand upright on bench-tops during experimental
preparation as well as float and self-orient during dialysis Figure 4.2. In this work,
two types of equilibrium dialysis, 3500 Da and 1000 were used in DGT technique for
distinction between free metals and M-DOM metals in synthetic solutions with and
without oil matrix. Smaller MWCO dialysis was used to restrict the diffusion of
organic complexes through diffusive gel to resin gel. The applicability of DGT
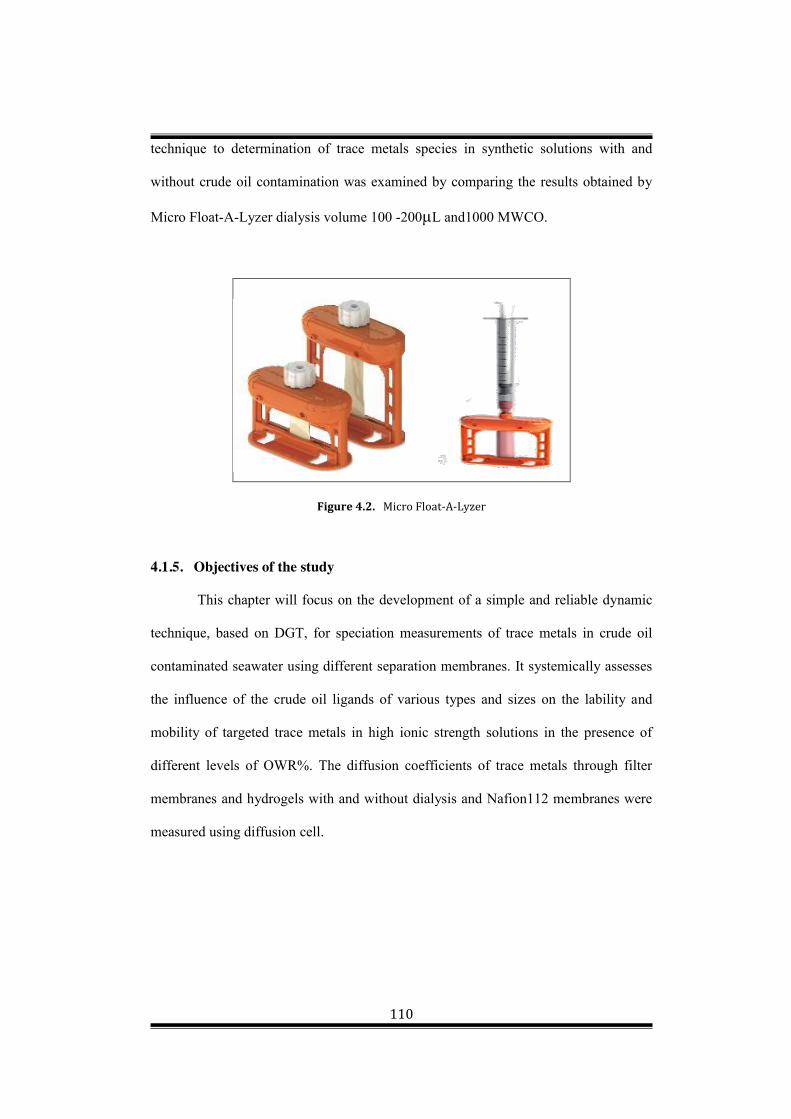
110
technique to determination of trace metals species in synthetic solutions with and
without crude oil contamination was examined by comparing the results obtained by
Micro Float-A-Lyzer dialysis volume 100 -200µL and1000 MWCO.
Figure 4.2. Micro Float-A-Lyzer
4.1.5. Objectives of the study
This chapter will focus on the development of a simple and reliable dynamic
technique, based on DGT, for speciation measurements of trace metals in crude oil
contaminated seawater using different separation membranes. It systemically assesses
the influence of the crude oil ligands of various types and sizes on the lability and
mobility of targeted trace metals in high ionic strength solutions in the presence of
different levels of OWR%. The diffusion coefficients of trace metals through filter
membranes and hydrogels with and without dialysis and Nafion112 membranes were
measured using diffusion cell.

111
4.2. Materials and Methods
4.2.1. Reagents, materials and solutions. Crude oil was provided by Ministry of Oil and Gas in Sultanate of Oman, high
purity Milli-Q water (≥ 18 MΩ/cm) was used to prepare all solutions. A 1000 mg/L
stock solutions of multielements (Cd, Ni, Zn, Cu, Co and Pb) for experiments were
prepared from their nitrate salts by dissolving the salts in Milli.Q water. All
experimental components were acid-cleaned in 10% (v/v) HNO3 overnight and rinsed
thoroughly with Milli.Q water before use. The binding layer, chelating resin (Chelex-
100, Bio-Rad), the diffusive layers, including open pore (thickness ≈ 0.78 mm), and
restricted gels (thickness ≈ 0.76 mm) were prepared in the laboratory following
procedure Chapter 3, section 3.2.1. The Nafion-112 with thickness of 0.05 mm was
provided by Alfa Aesar, 1000 and 3500 MWCO (molecular weight cut off) dialysis
membranes (thickness ≈0.05 mm), pore sizes of semi-permeable ≈1.9 nm and 3.3 nm,
respectively, and were purchased from Spectrum Biotech. All gels and membranes
were soaked in 0.5 M NaNO3 solution before use to take a shorter time to attain
equilibrium and eliminate diffusional artifacts present at low ionic strengths. The
plastic moldings for the DGT devices were obtained from DGT Research Limited
(Lancaster, UK). Micro Float-A-Lyzer dialysis, volume: 100 – 200 µL, concise
MWCO's of 1000, were purchased from Spectrum Company.
4.2.2. Nafion preparation Nafion-112 membrane was soaked in Milli.Q water for 8 days at room
temperature, and then cut to 2.5 cm diameter disks using a stainless steel cutter. The
membranes disks were washed by soaking in 1.12 mol/L (v/v) HNO3 (Aristar, BDH)
for 24 hours; they were then rinsed in Milli-Q water and stored in a 0.5 mol/L NaCl

112
solution at pH ≈5.6 at room temperature until use. The Nafion membranes can be
reused after soaking in Milli-Q water overnight and cleaning in 1.12-mol/L HNO3.
4.2.3. Float-A-Lyzer dialysis preparation. The micro dialysis was prepared following the instruction provided by
Spectra/Pro. First wet the membrane to remove glycerin and achieve maximum
membrane permeability. The Micro Float-A-Lyzer device soaked in 10% v/v ethanol
(EtOH) followed by thoroughly flushing and soaking in Milli.Q water before dialysis.
The cap of Micro Float-A-Lyzer device were removed and loaded with 10% (EtOH)
using the provide 1 ml syringe, then place in the same alcohol solution for 15 minutes.
Then device removed from alcohol solution and use the 1 ml syringe to remove the
alcohol from the sample chamber. The device then rinsed several times with Milli.Q
water to flush alcohol out of the sample chamber using 1 ml syringe. Then the device
filled with Milli.Q water and placed in the Milli.Q water for 30 minutes to remove
alcohol from membrane. The device removed from Milli.Q water and rinsed with
MilliQ water several times to flush the sample chamber with water and remove it.
Then the sample chamber in the device was loaded with (100 -200 µL) of sample
using a rinsed 1 ml syringe. The filled devices (with inside solutions) were placed in
the deployment solution using stir bar and magnetic stirrer during dialysis.
4.2.4. Diffusion coefficients measurements
The experiment was carried out to determine the diffusion coefficients of
metals ions Cd2+, Co2+ Ni2+, Zn2+, Cu2+ and Pb2+ through hydrogels and filter
membranes (0.45μm pore size) with dialysis on the hydrogel using diffusion cell
according to the procedure, which is thoroughly described by Zhang and Davison
(1999) (Figure 4.3).

113
Figure 4.3. Diffusion Cell
The cell comprised of two compartments, each with an interconnecting 2 cm
diameter opening. A 2.5 cm diameter disks of filter membrane and dialysis (∆g =
0.005 mm) membrane were placed in the front of hydrogels (∆g = 0.78 mm) between
the openings. All measurements were carried out using 100 ml synthetic solutions of
0.5 mol/L NaCl at pH = 5.6 for both compartments (A, source and B, receiving). The
carrier solution (A, source) contained 1mg/L of all targeted metals. Both
compartments were stirred continuously for 3h and 45min using with magnetic-
followers activated by magnetic stirrers to minimize DBL effect. The compartments
were covered during experiments to prevent any evaporation.
The diffusion coefficients of the above trace metals were measured, in this
way, through hydrogels and filter membranes with Nafion112 on the diffusive layer.
The compartment A (source) contained 5 mg/L of (Ni, Zn and Cu) and 1 mg/L of (Cd,
Co and Pb) as a carrier solution. Both compartments were stirred continuously for 8

114
hours using with magnetic-followers activated by magnetic stirrers to minimize DBL
effect.
Sub samples of 0.1 ml were taken from each compartment. The sub-samples
from compartment (B) were diluted 20 times using Milli-Q water and HNO3 for ICP-
MS analysis. Subsamples from compartment (A) were diluted 50 times using the same
matrix (0.1 mol/L HNO3). The temperature was measured at the beginning, middle
and the end of experiments using (thermal thermometer). In total 12 subsamples were
taken from each compartment. The measured concentrations of analytes obtained by
ICP-MS analysis were used to estimate the mass of diffused analytes to compartment
(B). The diffusion coefficients were calculated for the temperatures at which the
experiment was achieved following the steps as described in Chapter 3.
The diffusion coefficients of metals were also measured, in this way, through
filter membrane and hydrogel with Nafion112 membrane. The experiment was carried
out for 8 hours.
4.2.5. DGT devices
For preparing and using standard DGT samplers of open pore (OP) and
restricted pore (RP) diffusive gels, the procedures as explained in Chapter 3 were
followed. To make DGT sampler using 1000 MWCO dialysis membrane, first a
binding layer disc is placed on the DGT base. The diffusive gel disc was then put on
the top of the resin gel. Next, 1000 MWCO (molecular weight cut off) dialysis
membrane is placed on the diffusive gel. A clean 25 mm diameter and 0.45 μm
cellulose nitrate filter membranes of 0.14 mm is placed on the dialysis. The assembly
completed by pushing the cap carefully and firmly over the piston and pressed to
ensure a good seal between the cap and base. To prevent the formation of air bubbles
between gel layers and filter membrane, they kept wet during DGT assembly.

115
(Nafion112)-DGT and (3500 MWCO dialysis)-DGT devices were assembled by
following the above steps using Nafion112 and 3500 MWCO instead of 1000 MWCO
dialysis membrane Figure 4.4.
Figure 4.4. Nafion112- DGT assembly
4.2.6. Performance of DGT devices of different diffusive layers in the synthetic solutions with and without crude oil. The performance of five versions of DGT devices (OP-DGT, RG-DGT,
(dialysis 1000Da)-DGT, (dialysis 3500Da)-DGT, (Nafion112)-DGT was investigated
in well-stirred 8 L synthetic solution of 0.5 mol/L NaCl, at pH= 5.6 containing ≈ 20
µg/L nitrate salts of Cd, Cu, Co, Pb, Ni, Zn with and without oil. The solution was left
on magnetic stirring for two days to equilibrate. The DGT samplers were deployed in
triplicates without oil for 17 h except (Nafion112)-DGT were carried out for 24 h.
The influence of oil ligands on the measurement of labile metals species by
DGT devices was investigated in 8 L of synthetic solutions of the same ionic strength
and pH of the above solution, treated with two different ratios of crude oil: 1 and 4%
w/v in two separate containers. The synthetic solutions were stirred slowly 10 L
capacity plastic containers for 48 hours. After mixing, the oil water mixture was

116
allowed to stand overnight. The lower phase was collected for DGT deployments. All
DGT devices were carried out in well-stirred 8 L of 0.5 mol/L NaCl synthetic solution
contain 20 µg/L of Ni, Cd, Co, Cu, Pb and Zn, without oil.
Aliquots of 1 ml of sample were taken from the synthetic deployment solution
at the start, middle and end of the experiment for subsequent analysis to estimate total
concentration. For solutions with oil addition, also sample 1 ml was taken before oil
addition and after. The temperature was measured during taking samples using
(thermal thermometer). The accumulated mass, M, is measured in the laboratory.
Obtained diffusion coefficient, D, deployment time, t, thickness of the diffusive layer,
∆g, and area of the exposure opening, A, the concentration, C, can be calculated:
CDGT = ∆
(4.1)
4.3. Micro Float microdialysis of 1000 MWCO For the microdialysis experiments, Micro Float-A-Lyzer device of 100-200 µL
and 1000 MWCO was used. It designed to stand upright on bench-tops during
experimental preparation as well as float and self-orient during dialysis. The
microdialysis device pretreatment demonstrated in the section 4.2.3. To test the
efficiency of the device it is equilibrated 1, 2 and 4 days in 3 L synthetic solution of
0.5 mol/L NaCl, pH=5.4, containing 20 µg/L of nitrate salts of Cd, Cu, Co, Pb, Ni and
Zn, referred to as the outside solution. Three Float Microdylsis devices were filled
with solutions without metals referred to as the inside solutions. The devices in
duplicates were immersed in the stirred solution using magnetic stirrers. The

117
equilibrium is reached when the concentrations in the inside and outside solutions are
equal after 24 hours.
For the main experiments using synthetic solutions of the same ionic strengths
and pH without and with crude oil of 1 and 4 OWR%, Float Microdialysis devices in
duplicates were deployed in separate containers for 24 hours. In order to avoid the
effects of ionic strength viscosity and the disturbance from metals-ligands binding
equilibrium in the sample as a result of metals transport into the inside solutions, all
chamber devices in experiments were filled with solutions matching the concentration
and pH of the outside solution. Aliquots (0.1 ml) of the samples were taken at the
onset and at the end from both inside and outside solutions of all experiments for total
metals concentrations analysis. The determined concentrations of inorganic species
were used for comparison to those obtained with (dialysis 1000 MWCO)-DGT) in all
synthetic solutions with and without oil.
4.4. Results and discussion
4.4.1. Diffusion Coefficients. From DGT equation (4.2) it can be noted that the calculation of DGT labile
concentration is dependent on the diffusion coefficients and it is important factor for
the overall accuracy. Very limit work has been reported in literature about the
estimated diffusion coefficients of metals ions using Nafion or dialysis membranes.
The diffusion coefficients of metals through filter membrane and diffusive gels with
and without dialysis and Nafion112 membranes were obtained according to the
procedure described above Table 4.1.

118
Table 4.1. Diffusion coefficients through filter membrane and diffusive gel with and without dialysisandNafion112membranes(pH=5.6,∆g=0.097cm;A=1.77cm2)
Metals
D through filter membrane and diffusive gel
(D, × 𝟏𝟎 𝟔 𝐜𝐦𝟐𝐬 𝟏), T=19 ºC
D through filter membrane and diffusive gel with dialysis, (D, × 𝟏𝟎 𝟔 𝐜𝐦𝟐𝐬 𝟏), T=21 ºC
D through filter membrane and diffusive gel with
Nafion112, (D, × 𝟏𝟎 𝟕 𝐜𝐦𝟐𝐬 𝟏), 22 ºC
Co 4.7 4.5 1.2
Cu 4.82 4.7 3
Cd 4.8 4.1 1.87
Ni 4.6 3.8 1.8
Pb 6.33 4.4 1.86
Zn 4.76 3.5 1.3
4.4.2. The measurements of diffusion coefficients of metal ions using dialysis Figure 4.5. shows the plot of the masses (ng) of metals diffused and
accumulated the receptor compartment (B) vs. time (s). Good linear relationship (R2 ≈
0.98 -0.996) was obtained for all metals.
y = 0.2991x - 206.85R² = 0.9828
0
700
1400
2100
2800
3500
4200
0 3000 6000 9000 12000 15000
Mas
s Ni (
ng)
Time (s)
Ni
y = 0.0679x - 0.7341R² = 0.9809
0150300450600750900
1050
0 3000 6000 9000 12000 15000
Mas
s Cd
(ng)
Time (s)
Cd
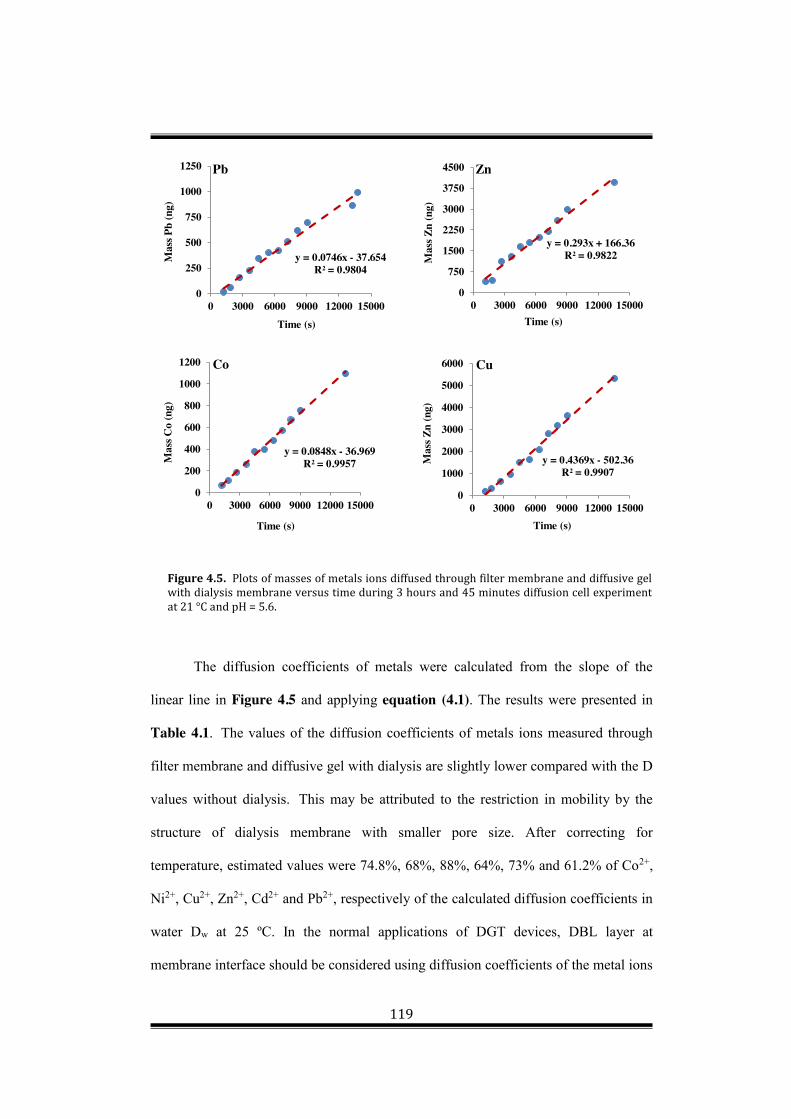
119
Figure 4.5. Plots of masses of metals ions diffused through filter membrane and diffusive gel with dialysis membrane versus time during 3 hours and 45 minutes diffusion cell experiment at 21 °C and pH = 5.6.
The diffusion coefficients of metals were calculated from the slope of the
linear line in Figure 4.5 and applying equation (4.1). The results were presented in
Table 4.1. The values of the diffusion coefficients of metals ions measured through
filter membrane and diffusive gel with dialysis are slightly lower compared with the D
values without dialysis. This may be attributed to the restriction in mobility by the
structure of dialysis membrane with smaller pore size. After correcting for
temperature, estimated values were 74.8%, 68%, 88%, 64%, 73% and 61.2% of Co2+,
Ni2+, Cu2+, Zn2+, Cd2+ and Pb2+, respectively of the calculated diffusion coefficients in
water Dw at 25 ºC. In the normal applications of DGT devices, DBL layer at
membrane interface should be considered using diffusion coefficients of the metal ions
y = 0.0746x - 37.654R² = 0.9804
0
250
500
750
1000
1250
0 3000 6000 9000 12000 15000
Mas
sPb
(ng)
Time (s)
Pb
y = 0.293x + 166.36R² = 0.9822
0
750
1500
2250
3000
3750
4500
0 3000 6000 9000 12000 15000
Mas
sZn
(ng)
Time (s)
Zn
y = 0.4369x - 502.36R² = 0.9907
0
1000
2000
3000
4000
5000
6000
0 3000 6000 9000 12000 15000
Mas
s Zn
(ng)
Time (s)
Cu
y = 0.0848x - 36.969R² = 0.9957
0
200
400
600
800
1000
1200
0 3000 6000 9000 12000 15000
Mas
s Co
(ng)
Time (s)
Co

120
in water (Dw). The dialysis membrane thickness can be used as an extension of the
total diffusion thickness ∆g in the applied DGT equation. Some research groups (Li et
al., 2003; Fan et al., 2013) used diffusion cells to measure the diffusion coefficients of
Cu, Cd and Pb ions through dialysis membranes of 12000 MWCO in a synthetic
solution contained a binding agents as a receptors at varying ionic strengths. They
found there was no interaction between the metal ions and the dialysis membrane. Li
et al. (2003) reported decreased diffusion coefficients of Cu and Cd with increasing
ionic strength. Chen et al. (2011) showed that the diffusion coefficients of Cd through
the dialysis membrane immersed in simple inorganic receptor solution without binding
agent increased as ionic strength decreased from 1.0 to 0.001M.
Diffusion coefficients of metal ions in Nafion112
Figure 4.6 illustrates the results obtained from the diffusion cell experiment
using Nafion112 membrane. It shows the mass of metals diffused into the receptor
compartment of the diffusion cell versus time. Reasonably good linearity (R2 ≈ 0.983-
0.994) was found. The diffusion coefficients of metals ions through filter membrane
and diffusive gel with Nafion112 were calculated using slopes of the plots in Figure
4.6. The obtained values of diffusion coefficients are presented in Table 4.1.
y = 0.0286x + 423.23R² = 0.9909
0
400
800
1200
1600
0 9000 18000 27000 36000
Mas
s (ng
)
Time (s)
Ni
y = 0.0185x - 60.109R² = 0.9835
0
100
200
300
400
500
0 9000 18000 27000 36000
Mas
s (ng
)
Time (s)
Cd

121
Figure 4.6. Plots of masses of metals ions diffused through filter membrane and diffusive gel plus Nafion112 membrane versus time during 8 hours diffusion cell experiment at 22 °C and pH = 5.6.
The use of Nafion112 in the diffusion cell experiment reduced the diffusion
rate of metals due to the negative charges on the membrane and the exclusion of most
metal complexes, which carry negative charges. The obtained diffusion coefficients
were much lower than those measured through filter membrane and diffusive gel with
and without dialysis (Table 4.1), 35 to 40 times lower for Co, 20 to 26 times lower for
Cu, Cd and Ni, 26 to 35 times lower for Pb and Zn. These results agree with the
diffusion coefficients of Cu2+ and Ni2+ reported by Huang et al. (2003) using Nafion
117 cation exchange membrane. Limited work has been done in this area. Panther et
al. (2008) reported the diffusion coefficient of As3+ through the Nafion112 membrane
y = 0.029x - 155.65R² = 0.9823
0100200300400500600700800
0 9000 18000 27000 36000
Mas
s (ng
)
Time (s)
Pb
y = 0.0167x + 113.74R² = 0.9932
0
100
200
300
400
500
600
700
0 9000 18000 27000 36000
Mas
s (ng
)
Time (s)
Zn
y = 0.0104x - 47.072R² = 0.9905
0
90
180
270
360
0 9000 18000 27000 36000
Mas
s (ng
)
Time (s)
Co
y = 0.069x + 367.4R² = 0.9883
0
500
1000
1500
2000
2500
3000
0 9000 18000 27000 36000
Mas
s (ng
)
Time (s)
Cu

122
with a value of 2.30 ± 0.15x 10⁻⁷ cm2/s (pH 5.0, 24.5 ± 0.5 oC) using diffusion cell.
The obtained value was different from diffusion coefficient across a Nafion117. The
transport of metals ions through Nafion membrane depends on the thickness,
pretreatment and conductivity of the used membrane. The wet thicknesses of
Nafion117 and Nafion112 membranes are 215 µm and 58µm, respectively (Slade et
al., 2002; Zaidi and Matsuura, 2009). Thus, increasing membrane thickness leads, to
decreased metal permeability rate and selectivity. A thinner membrane is usually
preferred for higher performance studies (Blom et al., 2003).
The separation of ions and excluding the negative complexes is the main
advantage of membrane in its applications (Tant, 1997). Therefore, it is likely that
only free metal ions and maybe some positively charged inorganic and small organic
complexes could be measured by DGT method. Some metal complexes of such Pb-
ligands able to cross Nafion membrane, which are expected of small molecular,
neutral or positive charge. Normally Pb-ligands excluded out form the membrane due
to the continuum of Pb-ligands of the same stability with heterogeneous,
polyfunctional organic complexants like humic substances, which are abundant in
contaminated marine systems.
4.5. Influence of crude oil on metal speciation using different types of DGT
Five different membranes were used for the measurements of different labile
metal species. The membranes were effectively distinguishing the metals species
according to molecular size and diffusions alterations. The effect of crude oil on metal
speciation was investigated at two OWR of 1% and 4%. The complicated mixture of
ligands of a variety of functional groups often arising from oil refineries and industrial
sources form metal complexes varying in stability depending on medium condition

123
and type and composition of oil. The DGT measurements determined by several
mechanisms including; exclusion of large species by pore size of diffusive gels and
dialysis membranes (Li et al., 2005), anions and negatively charged complexes using
Nafiion membrane. The mass transport can be restricted (low diffusion coefficients)
during dissociation through diffusion layer to binding layer. Dissociation of the
complexes within the time frame required for the species to diffuse across the
diffusive layer before they are bound by resin gel (Scally et al., 2003; Li et al., 2005).
The obtained results are shown in Figure 4.7 and Figure 4.8.
Figure 4.7 presents the accumulated masses of metals in synthetic solutions
without and with different OWR% using five different versions of DGT devices. The
accumulated masses of metals were too low in Nafion112-DGT devices at all synthetic
solutions. This indicates most of the metals are complex and negatively charged. They
were excluded by Nafion membrane, which restricts the mass transport to binding
layer.
The masses of metals accumulated by DGT with dialysis 1000 MWCO and
DGT with dialysis 3500 MWCO in the three synthetic solutions gave the same results
for all metals. It indicates that the determined labile inorganic and organic complexes
contributed from the oil are small and may be limited to <1000 MWCO. The masses
accumulated by DGT devices with open pore (OP) gels gave the highest values as the
diffusive gel has the largest pore size and it allows the large organic ligands and metal
complexes diffuse through and to be measured. The masses accumulated by DGT with
restricted pore (RP) gel were lower than those of masses by OP-DGT for all metals in
all three solutions (no oil, 1% and 4% oil). However, they were higher than those of
masses in solution without oil for all metals except Cd, which was very similar. For
solution with oil, only the masses of Zn and Pb were higher. These demonstrate that
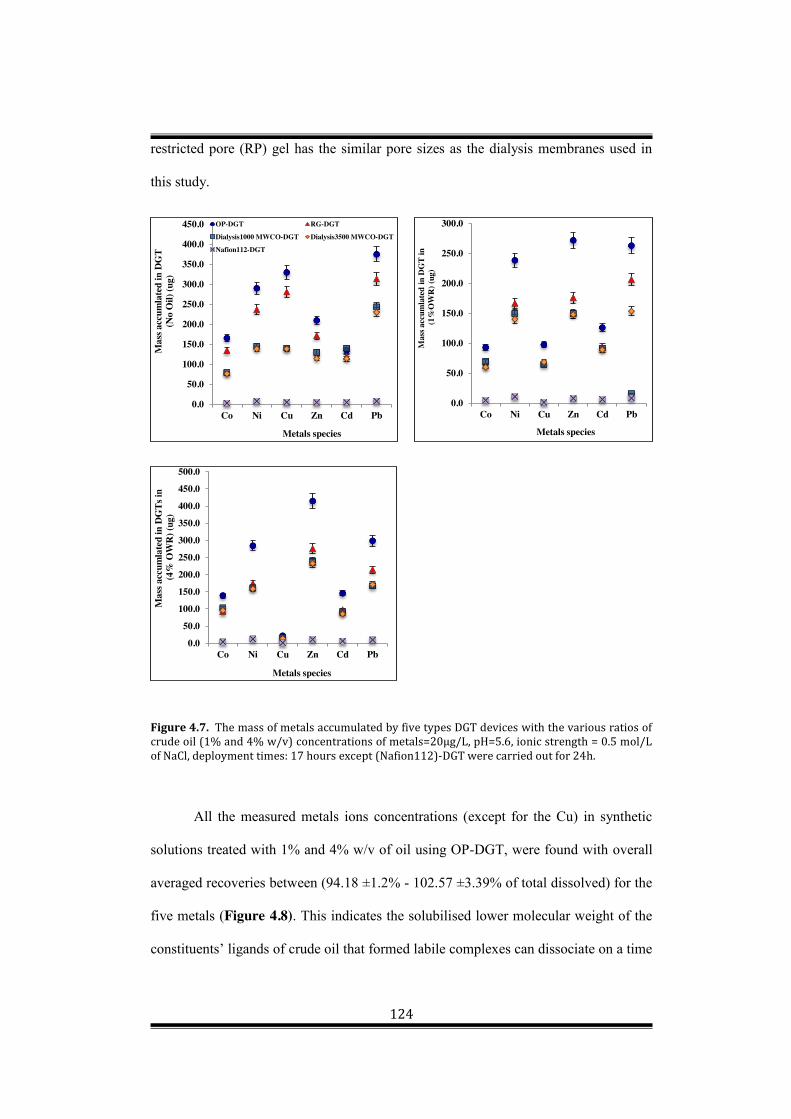
124
restricted pore (RP) gel has the similar pore sizes as the dialysis membranes used in
this study.
Figure 4.7. The mass of metals accumulated by five types DGT devices with the various ratios of crude oil (1% and 4% w/v) concentrations of metals=20µg/L, pH=5.6, ionic strength = 0.5 mol/L of NaCl, deployment times: 17 hours except (Nafion112)-DGT were carried out for 24h.
All the measured metals ions concentrations (except for the Cu) in synthetic
solutions treated with 1% and 4% w/v of oil using OP-DGT, were found with overall
averaged recoveries between (94.18 ±1.2% - 102.57 ±3.39% of total dissolved) for the
five metals (Figure 4.8). This indicates the solubilised lower molecular weight of the
constituents’ ligands of crude oil that formed labile complexes can dissociate on a time
0.0
50.0
100.0
150.0
200.0
250.0
300.0
350.0
400.0
450.0
Co Ni Cu Zn Cd Pb
Mas
s acc
umla
ted
in D
GT
(No
Oil)
(ug)
Metals species
OP-DGT RG-DGT
Dialysis1000 MWCO-DGT Dialysis3500 MWCO-DGT
Nafion112-DGT
0.0
50.0
100.0
150.0
200.0
250.0
300.0
Co Ni Cu Zn Cd PbM
ass a
ccum
late
d in
DG
T in
(1%
OW
R) (
ug)
Metals species
0.0
50.0
100.0
150.0
200.0
250.0
300.0
350.0
400.0
450.0
500.0
Co Ni Cu Zn Cd Pb
Mas
s acc
umla
ted
in D
GTs
in(4
% O
WR
) (ug
)
Metals species

125
scale during their diffuse through the diffusive gel. The DGT-labile concentrations of
Cu were decreased from 61.18±1.4% to 15.57±1.02% in 1% and 4% OWR% of added
oil, respectively. This is possibly due to the higher ligand concentrations in solution
with 4% oil and larger and stronger Cu-DOM complexes (Gimpel et al., 2003;
Guéguen et al., 2011). Zhang and Davison (2000) and Lehto et al. (2006) suggested
that RP-DGT permits diffusion of free metals ions with small inorganic species and
excludes labile organic species less than 1nm of pore size. It seems clear from Figure
4.7 that there is a lack of significance differences between OP and RG-DGT labile
fractions of dissolved Co, Ni, Zn and Pb in solution of 1% OWR and Co, Ni and Pb in
solution of 4% OWR. This could be attributed to the labile complexes in solution
containing were smaller than the pore size of the restricted diffusive gel or may due to
the release of Co, Ni, Zn and Pb from oil to solution. For Cu, the percentages of labile
Cu by RG-DGT in the synthetic solution treated with 1% w/v of oil was 12.2% ±
1.38% and 56.09% ±1.77% in solution spiked with 4% w/v of crude oil. The measured
labile Cd fractions by RG-DGT device in the synthetic solutions of 1% and 4%w/v
crude oil were 80.04±2.11 % and 86.72±1.2% and respectively. For Zn RG-DGT
labile fractions in synthetic solution of 4% w/v oil was 89.26 ±2.74%.

126
Figure 4.8. Effect of pH on performance of five types used DGT samplers for the measurement of Pb, Zn, Co, Cu, Cd and Ni in well-stirred synthetic solutions containing various ratios of crude oil (0, 1 and 4 w/v%) concentrations of metals=20µg/L, pH=5.6, ionic strength = 0.5 mol/L of NaCl, deployment times: 17 hours except (Nafion112)-DGT were carried out for 24h.
0.00
20.00
40.00
60.00
80.00
100.00
120.00
Co Ni Cu Zn Cd Pb
% C
DG
Ts in
solu
tion
with
out o
il
Metals species
0.00
20.00
40.00
60.00
80.00
100.00
120.00
Co Ni Cu Zn Cd Pb
% C
DG
Tsin
1%
OW
R
Metals species
NG-DGT RG-DGT3500 MWCO dialysis-DGT 1000 MWCO dialysis-DGTNafion-DGT
0.0
20.0
40.0
60.0
80.0
100.0
120.0
Co Ni Cu Zn Cd Pb
% C
DG
Tsin
4%
OW
R
Metals species

127
The diffusive permeability of dialysis membranes depends on pore size. Both
labile and inert species allowed passing through dialysis except larger metal-DOM and
colloids are prevented from diffuse to resin gel. Cu, Zn and Pb did not show any
significant difference between the two dialysis–DGT types at both solutions of 1 and 4
% w/v oil. This indicates that small inorganic species of molecular sizes less than a
few nm were the predominant DGT-labile forms of metals for Cu, Cd and Pb in the
both synthetic solutions with 1 and 4 OWR%, w/v. Metals fractions of Co, Ni and Cd
were unable to diffuse through dialysis (1000 MWCO)-DGT represented fractions of
12%, 14% and 19% in synthetic solution of 1% w/v oil and 14%, 17% and 20% in
solution treated with 4% w/v oil, respectively (Figure 4.8). This is due to the Co-
DOM and Ni-DOM complexes in solution, too large to diffuse through the dialysis
membrane and not measured by DGT. Non-DGT labile Cu fractions (i.e. colloidal
DOM) using dialysis membranes were 60% and 56% in WSF of 1%w/v oil and > 87%
at the synthetic solution impacted with 4% w/v oil. This attributed to the presence of
highly aromatic DOM substances in solution with increased of OWR% forms highly
stable complexes, hence reducing the concentration of free/labile Cu.
The percentages of labile metals fractions using Nafion112-DGT did not show
significant trends at any of the solutions with 1% and 4% w/v crude oil for all metals
except Cu and Cd. Significantly lower Nafion112-DGT-labile concentrations were
found only 15-20% for Cu and 78 -80% for Cd at both synthetic solutions. This may
be due to metal complex formation with ligands dissolved from oil could not pass
through the Nafion112 membrane in Nafion112-DGT sampler. Organic complexation
dominates Cu speciation in both solutions with oil matrix, and a substantial fraction of
organically complexed Cu is DGT-labile. Nafion in (Nafion112)-DGT prevented

128
colloids or large and negatively charged metal complexes from diffuse through
membrane to resin gel.
Although the accumulated masses showed significant differences when use
different gels and membranes, the various in DGT measured labile concentrations are
much less marked, except for Cu, when taken into account of diffusion coefficients for
different membrane. The results are presented in Figure 4.9.

129
Figure 4.9. Concentrations of metals in five versions of DGT devices in well-stirred synthetic solutions containing various ratios of crude oil (0, 1 and 4 w/v%) concentrations of metals=20µg/L, pH=5.6, ionic strength = 0.5 mol/L of NaCl, deployment times: 17 hours except (Nafion112)-DGT were carried out for 24 h.
For Co and Pb, the labile concentrations measured by all types of DGT devices
decreased in the solution with 1% w/v of oil and increased at 4% w/v of OWR%. This
can be explained by its association with aromatic organic matters in oil at 1% w/v. At
4%, although complexation still existed, more Co and Pb were released from the oil
(Omaka et al., 2011; Pimsee et al., 2014). The labile Cu significantly decreased with
increasing oil concentrations due to the presence of strong binding ligand for Cu in oil.
This suggests that copper in both synthetic solutions treated with 1% and 4% w/v oil
formed Cu-DOM complexes either too large to diffuse through the gels and
membranes or too strong to dissociate or both. The labile Cu concentrations measured
by Nafion-DGT are similar for both 1% and 4% oil addition, but with big difference
for other types of DGT devices (less labile Cu at 4% oil with similar concentration as
Nafion-DGT measurement). This suggests that the reduction on labile Cu at 4% oil is

130
mainly for negatively charged complexes and all types of DGT devices were
measuring free metal ions plus positively charged complexes. For Cd and Ni, slight
increase for all DGT-labile concentrations with increasing oil to water ratios can be
observed. This could be due to the release of both metals from the oil. For Zn, the
significant increase of labile Zn concentration with increasing of oil w/v% for all DGT
measurements and total dissolved, indicating the input of Zn from oil.
This work has demonstrated that DGT is a suitable time integrated dynamic
technique for characterising chemical speciation in oil contaminated seawater. In such
a dynamic system where metals are continually being complexed and affected by other
reactions processes, it is useful to use an in situ dynamic technique.
4.6. Comparison of measurements by (1000 MWCO)-DGT and Micro Float microdialysis of 1000 MWCO
The results obtained by (1000 MWCO)-DGT were compared with those
obtained by Micro Float microdialysis of 1000 MWCO in the same synthetic
solutions. DGT measures labile concentration (species can pass through the dialysis
and can be dissociated for uptake) and microdialysis measures total concentration of
metal that can pass through the dialysis membrane. The results are shown in Figure
4.10 for Cd, Co, Cu, Ni, Pb and Zn in three types of synthetic solutions without and
with 1 and 4% w/v of oil. The error bars represent the standard deviation of replicate
devices for DGT measurements and the instrumental deviation for microdialysis
measurements.

131
Figure 4.10. Concentrations of Co, Cu, Ni, Zn, Cd and Pb in synthetic solutions with and without oil measured by (Dialysis1000 MWCO)-DGT and Micro Float microdialysis of 1000 MWCO.
0
5
10
15
20
25
No Oil 1% OWR 4% OWR
Con
c (Pb
) µg/
L
Crude oil level %(w/v)
0
5
10
15
20
25
30
No Oil 1% OWR 4% OWR
Con
c (N
i) µg
/L
Crude oil level %(w/v)
0
2
4
6
8
10
12
14
16
No Oil 1% OWR 4% OWR
Con
c (C
d) µ
g/L
Crude oil level %(w/v)
0
5
10
15
20
25
30
No Oil 1% OWR 4% OWR
Con
c (C
u) µ
g/L
Crude oil level %(w/v)
05
1015202530354045
No Oil 1% OWR 4% OWR
Con
c (Z
n) µ
g/L
Crude oil level %(w/v)
0
2
4
6
8
10
12
14
16
No Oil 1% OWR 4% OWR
Con
c (C
o) µ
g/L
Crude oil level %(w/v)
Micro Float-A-lyzer dialysis 1000 MWCO1000 MWCO dialysis-DGT

132
Ni and Pb. The measured concentrations of Ni and Pb by two methods were very
similar for all three kinds of synthetic solutions with and without oil, especially for Pb
(almost the same), indicating all species diffused through dialysis are labile. However,
the measured concentrations of Ni in microdialysis were slightly higher than the
concentrations that measured in (1000 MWCO)-DGT. It suggests slightly slower
dissociation of Ni ligands during transport through hydrogel to binding layer in DGT
sampler (Odzak et al., 2002). In contrast to the results obtained in the present study,
other work investigated the effect of DOM from mining activities on the trace metals
(Omanović et al., 2015) shown that Pb can be strongly complexed with organic
complexes and very low DGT-labile concentrations obtained. On the other hand, they
found that Ni was predominantly present as a labile, potentially bioavailable fraction
(>90%). This indicates that the complexation of trace metals with functional sites in
DOM and kinetics alters depending on the environmental conditions and the
agreement between the two methods as evident for Pb as for Ni.
Co, Cd, Cu and Zn. The measured concentrations for this group of metals by (1000
MWCO)-DGT samplers were significantly lower than those obtained in (1000
MWCO) Micro Float microdialysis in synthetic solutions with 1% and 4% w/v oil.
This shows that the lower molecular weight of Co, Cd, Cu and Zn species are small
enough to pass the dialysis membrane but fraction of those are no able to dissociate to
be measured by-DGT samplers. Larger portions of the Zn-DOM fractions can be
expected more labile for DGT due to the weak Zn bound with oil ligands compared to
Co and Cu. The results obtained in this study using (1000 MWCO)-DGT are
consistent with those observed by Odzak et al. (2002) indicated that the DGT-labile Zn
was around 40% of Zn total concentration. Various studies have shown that Cu can be
complexed by organic ligands in marine systems. For both methods the measured Cu

133
fractions showed a significant decrease with the increase of oil concentrations. The
lowest concentration in solution containing 4% was reasonable due to higher
concentration of crude oil ligands forming strong complexes with Cu that cannot
dissociate to be measured. The organic complexes have diffusion coefficients
substantially lower than free metal ions. Since diffusion coefficients for free ions are
used in the calculations, the DGT-labile concentrations are probably underestimated,
contributing to the difference in concentrations measured by the two methods. Dialysis
method can essentially be widely applied for environmental analysis as a separation
method based on size. However, it suffers from various weaknesses, which may limit
its performance and applicability. It is time consuming, often requires days to reach
equilibrium. The obtained metals fraction inside solution (dialyzable) does not
represent bioavailable fraction. Furthermore, small species of < 1000 MWCO could be
inorganic and organic metal complexes and colloids can diffuse through a dialysis
membrane (Gimpel et al., 2003). Oil has strong effect on labile Zn concentration. The
results in Figure 4.10 show marked increase on labile Zn and total dissolved Zn with
increasing of oil. These findings indicate oil is also a source for Zn pollution in marine
system. Similar effect of oil on Cd, but much less pronounced. For the other three
metals, Co, Ni and Pb, there was a decrease at 1% oil and then increase at 4%. This
indicates complexing process is dominating at low oil concentration and release
process is dominating at high oil concentration (4%).
134
4.7. Conclusions
The diffusion coefficients through filter membrane and hydro gel with
Nafioin112 were much lower than those measured through filter membrane and
diffusive gel with and without dialysis, 35 to 40 times lower for Co, 26 to 35 times
lower for Pb and Zn 20 to 26 times lower for Cu, Cd and Ni, The concentrations of
labile metals by all versions of DGT samplers were markedly affected by the presence
of oil ligands and showed an increase as well as a decrease in metal concentrations as
a result of increased OWR%. Using Nafion112 membrane or/and dialysis membrane
in DGT can further understanding metal speciation in solutions of varying OWR%.
Similar concentrations obtained by OP and RG-DGT devices for metals such
as Co, Ni, Zn and Pb in the presence of oil suggesting the complexes were smaller
than the pore size of RG gel and they are all labile. No significant differences between
the (Dialysis1000 MWCO)-DGT and (Dialysis3500 MWCO)-DGT in the accumulated
masses of metals also suggests that small, possibly inorganic species (<1000 MWCO)
were the predominant DGT-labile forms of metals in the solutions.
The measured concentrations of Co, Cd, Cu and Zn in (Dialysis1000 MWCO)-
DGT samplers were lower than those determined in 1000 MWCO Micro Float
microdialysis concentrations. This attributed to the existence of low molecular weight
Co, Cd, Cu and Zn species, small enough to pass through the 1000 MWCO- Micro
Float microdialysis but not labile enough to be retained in the (Dialysis 1000
MWCO)-DGT samplers. This study represents a benchmark for future metal
speciation assessment in the Sultanate of Oman marine systems around large
economic harbours with industries and refineries.

135
Chapter 5 – Investigation the effect of crude oil on metal availability in soils and aging processes
5.1. Introduction
Soils are geochemical sinks for a wide range of chemical substances produced
by various anthropogenic activities, and act as a natural buffer that governs the
transport of contaminants to aquatic environments and the terrestrial food chain
(Rocha et al., 2011). Soil sampling and analysis have been carried out by scientists and
regulators to assess crude oil contamination around refinery industries or commercial
ports. It is crucial to evaluate the environmental impact of oil contaminated soils.
There is a need for simple, reliable and low cost technique that determine the influence
of oil ligands on chemical speciation and availability in soils (Relić et al., 2005).
Economic development plays an important role in the distribution and migration of
metals and oil related chemicals in the soils associated with industrial activities, crude
oil extraction processes, and refineries, all of which threaten the soils quality.
Numerous studies have shown that crude oil contamination strongly influences the
mobility and bioavailability of trace metals in soils around oil production and refining
facilities (Zhang et al., 1998; Iwegbue, 2011; Omaka et al., 2011; Rocha et al., 2011;
Fu et al., 2014). Assessment of the effect of crude oil contamination on the soils
quality and the need of remediation can be hampered by a poor understanding of
chemical speciation in these soils. When trace metals are introduced into the soils,
they interact with inorganic and organic ligands and colloids depend on the affinity
(Guéguen et al., 2011). Trace metals availability in soils varies with soil properties
which influence the partition with resupply from solid phase through
adsorption/desorption and dissolution/precipitation processes (Zhang et al., 1998). To

136
sufficiently understand the above processes, it is worth proposing a simple and robust
technique for the simultaneous determination of trace metals chemical forms in soils
impacted with crude oil, rather than measuring the total concentrations. Various
sampling and measuring techniques were widely used for determining concentration of
metals in soils such as chemical extraction, either partial or sequential extraction
(Fernández et al., 2004; Katana et al., 2013; Fu et al., 2014). All these extraction
techniques are broad in scope but varied in findings. The selective extraction
techniques have been shown to be better and more efficient than measuring total metal
content using acid digestion (Venn, 2008). However, these extraction methods using
unrealistic volume and concentration of chemicals and they really represent the
available metals in soils. Batch extraction methods using ion-exchange resin were used
for metals speciation in soils. A certain amount of soil and resin (beads or membranes
can be used as a membrane or capsules resin had a uniform spherical shape), are
mixed in a sufficient amount of water and shaken for suggested periods then the resin
capsulated or membrane separated for elution. The obtained results from this method
are strongly governed by resin/soil/solution ratios, shaking time temperature and type
of resin (McLaughlin et al., 1993; Dobermann et al., 1994; Qian and Schoenau, 2002).
However, they cannot provide detailed information on the transportation of ions from
the soil to the resin sink, which is important for assessing bioavailability.
Metal bioavailability has been associated to the activity of metal ions in soil
solution and the metal species exchange (Antunes and Kreager, 2009). However, there
is still no general consensus in the scientific literature regarding the definition of
bioavailability measurements. This probably due to the many inconsistencies between
the bioavailable species measured and the retain of metals by plants and various
processes that may governing bioavailability existing in the rhizospher (Van Hees et
137
al., 2004; Başar, 2009). Numerous attempts have been performed to find suitable
experiments for determining metal bioavailability in soils and varied from
concentrations measurements of the directly bioavailable metal to also including
estimates of capacity of the soil to re-supply the metal species concentration as it is
removed from the soil solution (Riechaman, 2002). Measurements using conventional
chemical extraction methods, generally applied with chemical extraction reagents
including complexing agents, such as dilute acid HNO3 and HCl and salt solutions
0.1M NaNO3, 0.1M CaCl2 (Houba et al., 1996). Strong acids, such as HF, HClO4,
HNO3 and aqua regia (HNO3/HCl) are usually used to extract the ‘total’ metal in a
soil. Various researches into the literature shows that there is a connection between the
crude oil contamination and increase or decrease in trace metal concentration, with
higher concentrations near crude oil refineries in Nigeria (Anglin-Brown et al., 1995;
Omaka et al., 2011).
Extraction by chelation methods comprising aminopolycarboxylic acids such a
diethylene-triaminepenta-acetic acid (DTPA) and ethylene-diamine-tetra-acetic acid
(EDTA) have been applied widely to determine the availability of metals in soils.
However, they were designed to study soils containing low concentrations of organic
matter. The metals levels in the soils often exceed the capacity of chelating of the
compound; using EDTA requires the compound to control pH sometime to 6, which
could affect the solubility of metals especially Cd and Zn (Stevenson et al., 1984;
Huang et al., 2011).
Weak and neutral salts for extraction such as CaCl2, and NaNO3 have been
assessed in various studies with promising findings. Menzies et al. (2007) reviewed
different types of extractants applied to determine metals species. The review showed

138
that neutral salt solutions can provide a good relationship between metals
concentration in extracts and concentration in plant tissues.
Metal species in soil solution has been considered available for uptake. Ivezić
et al. (2013) used water extraction (soil solution) technique to predict plant uptake of
(Cd, Cu, Fe, Mn and Zn). The results were compared to those obtained by aqua regia
extraction, HNO3 extraction and EDTA extraction methods (Ivezić et al., 2013). Water
extraction (soil solution) was in good correlation with plant uptake.
Although, the above extraction methods allow better understanding of metal
bioavailability, they are still unrealistic and cause great perturbation to soil system and
there is no information on kinetic resupply from solid phase to solution, which are
crucial for plant uptake. A dynamic in situ technique, DGT, has been developed and
applied in soils to quantitative measure the labile metal resupply and bioavailability
(Dočekalová et al., 2012; Senila et al., 2012; Garrido Reyes et al., 2013).
5.1.1. DGT in soils
Diffusive gradients in thin films (DGT) have recently been used in soils to
measure labile metals and the flux of available species resupplied from solid phase to
solution (Davison and Zhang, 1994; Zhang and Davison, 2001). It has been used
successfully for speciation measurements in soils, groundwaters, and sediments, as
described previously in Chapter 2, sections 2.11-2.13.
When DGT is deployed in soil, it removes metal from soil solution by
accumulating it on the binding layer of the DGT device. The metal must first diffuse
through the filter membrane and the layer of diffusive gel, which sets a maximum
possible flux to the DGT devices. DGT continuously removes and accumulates metal
and so supply processes from the soil must be considered dynamically. In response to
the removal, the concentration of metal in soil solution adjacent to the device is

139
lowered. Metal will therefore dissociate from complexes in solution to try to re-
establish the equilibrium state that has been perturbed. Consequently, all species that
are labile, that is able to dissociate sufficiently rapidly to contribute to the flux to the
device, will be measured (Zhang and Davison, 2000). However, there is also a
dynamic exchange of metal between solution and solid phase. Local depletion of metal
in soil solution will induce release of metal from the solid phase at the site of
depletion. As for release from complexes in solution, the extent of this supply of metal
from the solid phase will depend on its rate of release.
Figure 5.1 illustrates how the extent of depletion in soil solution depends on
the rate of release of metal from the solid phase. When the rate of release is very fast,
the supply from the large pool of metal in the solid phase effectively buffers the metal
concentration in soil solution so that very little depletion occurs. The rate of metal
uptake is then controlled by the DGT device. Depletion of metal in solution will
eventually occur, even when there is fast release, because the metal in the solid phase
adjacent to the device will gradually be used up. If the rate of release from the solid
phase is very slow, there will be little supply from this source, and metal supply will
depend on diffusion of labile species in solution. The metal in solution adjacent to the
device is quickly depleted with time, causing the flux of metal to the DGT device to
decline quite rapidly. The intermediate case occurs when metal is released from the
solid phase at an appreciable rate, but it is insufficient to sustain fully the
concentration in solution adjacent to the device.

140
Figure 5.1. Schematic representation of the concentration of metal in solution in DGT and the adjacent soil after 24 hours, for three cases: (i), very fast release from solid phase; (ii), fairly slow release; (iii), no release. Layer A is the resin gel and layer B is the diffusion layer. (Taken from Zhang and Davison, NATO book chapter)
The above processes can be quantified by modeling simultaneously and
dynamically the supply of metal by diffusion and its release from the solid phase
(Harper et al., 1998). A one dimensional version of this model, known as DIFS (DGT-
induced fluxes in soils) has been developed by Harper et al. (2000). A full two
dimensional version, which more accurately reflects the diffusional supply, has been
developed by Sochaczewski et al. (2005).
A diffusion
Csoln Csolid
fast
'g 1 2 mm
diffusion
Csoln Csolid
slow diffusion
Csoln
(i)
A
A
B
B
B
(ii)
(iii)

141
As the DGT device continuously takes metals out of the soil system during
deployment, it is inevitable that for most cases some depletion of the concentration of
metal in soil solution at the interface of the DGT device and soil will occur
(Ernstberger et al., 2002). The extent of the depletion is indicated using the (R) value
of CDGT to the independently measured initial concentration of metal in the soil
solution (Csoln): The value of R is affected by the solid-phase labile pool size and the
response time of the soil to the depletion (Tc) (Harper et al., 1998).
The DIFS model uses the partition coefficient for labile species (Kd) to
calculate the labile pool size in the solid phase and quantifies the relationship between
R, Kd, and Tc. As Tc is directly related to the rate constant of the supply process from
solid phase to solution (k-1), it can be obtained if R and Kd are known.
Input parameters of particle concentration (Pc), soil porosity (M), and the diffusion
coefficients of metals in the soil (Ds) were calculated using equations (5.1-5.3)
(Harper et al, 1998, Boudreau, 1996):
Pc = m/V (5.1)
M = dp/(Pc+ dp) (5.2)
Ds = Do/(1 - lnM2) (5.3)
Where m is the total mass of all soil particles; V is the porewater volume in a
given volume of total soil; Do is the diffusion coefficient in water; and dp is the
density of the soil particles, which is commonly assumed to be 2.65 g cm-3 in soils
(Bielders et al., 1990).

142
5.1.2. Objectives of the Study The present work has been undertaken in order to:
(1) Assess the effects of crude oil contaminated soils on the studied trace metals
speciation in soils solutions, as well as the changes in soil properties using
DGT dynamic sampler.
(2) Investigate the aging effect on fractionation and lability of targeted trace
metals in soils.
(3) To investigate the correlation of extracted trace metals in CaCl2 solutions to
CDGT-labile species.
5.2. Methods and Materials
5.2.1. Reagents, chemicals and solutions
Crude oil was provided by the Ministry of Oil and Gas in the Sultanate of
Oman, and high purity Milli-Q water (≥ 18 MΩ/cm) was used to prepare all solutions.
A stock solution of 1000 mg/Lmixed metals using nitrate salts and Milli.Q water was
prepared for spiking soils. All containers DGT mouldings, and glass plates and spacers
for making gels were acid washed in 10% (v/v) nitric acid, (BDH), for at least 24
hours, and rinsed thoroughly with M.Q water before use. Nitric Acid BDH
ARISTAR® ULTRA, a high purity acid for quantitative trace metals analysis, was
used for elution. The Chelex 100 resin for making DGT binding layer was from Bio-
Rad.
5.2.2. Preparation of DGT devices
The procedures for preparing and using DGT samplers have been explained in
detail by Zhang and Davison (1995) and Zhang et al. (1998). DGT plastic mouldings
with a sampling window area of 2.54 cm2 were supplied by DGT Research Limited,

143
Lancaster, UK. A diffusive gel layer (0.8 mm thick) and binding layer (Chelex 100
resin, 0.4 mm thick) were used in all experiments.
5.2.3. Soil amendments and soil sampling
Three soil types (surface samples, 0-20 cm depth) with a different pH and
organic content were collected from three allotments in Birmingham area in UK:
Coney Green, Gibson, and Knowle Road. Soils were air dried at room temperature and
passed through a 2 mm sieve, then stored in plastic containers. Soil pH, OM%, and
water holding capacity (MWHC), were measured as described in the following
sections. For all collected soils, each soil of 2 kg was spiked with different
concentrations of the metals in solution to achieve the final metal concentration in
soils as 2 mg/kg Co, 2 mg/kg Cd, 30 mg/kg Ni; 30 mg/kg Cu, 30 mg/kg Pb, and 100
mg/kg Zn. The solution and soil ratio for spiking was 10ml:100g. The solution was
added to soil drop by drop and mixed thoroughly. They were divided into three parts,
about 600g of each. They were left for 2 days before being amended with a crude oil
matrix. Soils then were treated with two levels of crude oil: 0, 2 and 8% w/w,
representing slightly and highly contaminated soils.
All soil samples with and without oil were left to equilibrate for two days prior
to the metals measurements by DGT, soil solutions and extraction in 0.01 M CaCl2
solutions. The same measurements were carried out at different times: 1 day, 4 days, 8
days, 2 weeks, 4, 6, and 8 weeks after spiking. Aliquots of soil samples were taken for
DGT measurements and extraction.
5.2.4. Soil pH and organic matter content
The soil pH was measured at 1:5 soil:0.01M CaCl2, by adding 10 g of 0.01 M
CaCl2 solution to 2 g of dried soil in a 50 ml polyethylene beaker, and shaken for 1

144
hour. This was then left to stand for 30 minutes. The pH of the solutions was
determined using a pH meter, and making sure to avoid the settled soil particles
coming into contact with the electrode.
The organic content (OM%) of selected soils was measured by loss on ignition
(LOI). The OM% of selected soils was estimated as the mass of the oven-dried soil
lost as a proportion of the mass of ignited soils. The obtained pH and OM% values of
the three studied soils are shown in Table 5.1.
Table 5.1. The pH values and OM% of the three soils.
Soil 1 Soil 2 Soil 3 Selected sites Coney Green Gibson Knowle Road
Soil pH 6.9 5.65 7.43 OM proportion 2.02% 2.45% 3.54%
5.2.5. DGT deployment and retrieval
The water holding capacity (MWHC) of the soils was measured previously in
other studies. The values were 62.8%, 50.03%, and 54.89% for Coney Green, Gibson,
and Knowle Road, respectively. For DGT deployment, a subsample of 60 g soil was
weighted in a clean beaker, and then mixed well with Milli-Q water in order to achieve
soil moisture content of about 80% MWHC. The amounts of Milli-Q water added to
each soil were 26.38 g for Coney Green, 23.05 g for Gibson, and 21 g for Knowle
Road. They were all well mixed and then equilibrated for 24 hours. Each soil sample
was then averagely divided into three clean pots. DGT devices were gently pushed
into the surface of the paste to ensure that the filter membrane of the DGT window
made good contact with the soil, and then they were loosely covered with a plastic
sheet to prevent water evaporation. The DGT deployment were carried out on day 1
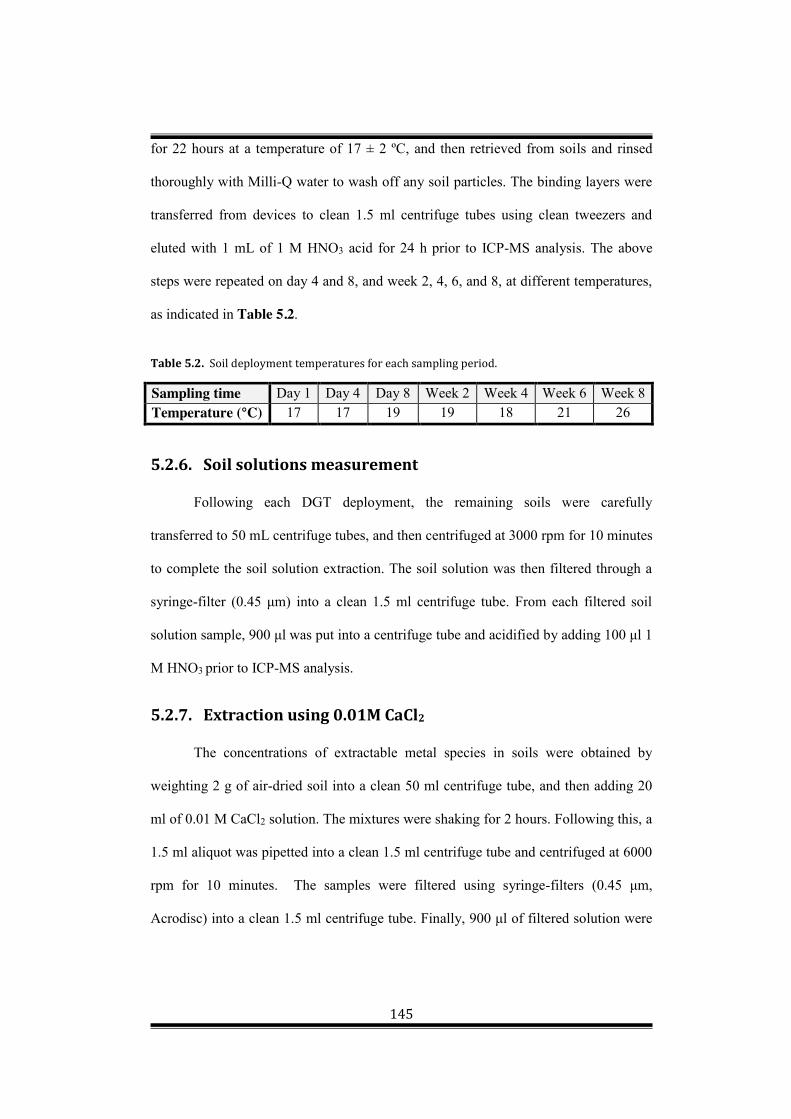
145
for 22 hours at a temperature of 17 ± 2 ºC, and then retrieved from soils and rinsed
thoroughly with Milli-Q water to wash off any soil particles. The binding layers were
transferred from devices to clean 1.5 ml centrifuge tubes using clean tweezers and
eluted with 1 mL of 1 M HNO3 acid for 24 h prior to ICP-MS analysis. The above
steps were repeated on day 4 and 8, and week 2, 4, 6, and 8, at different temperatures,
as indicated in Table 5.2.
Table 5.2. Soil deployment temperatures for each sampling period.
Sampling time Day 1 Day 4 Day 8 Week 2 Week 4 Week 6 Week 8 Temperature (°C) 17 17 19 19 18 21 26
5.2.6. Soil solutions measurement
Following each DGT deployment, the remaining soils were carefully
transferred to 50 mL centrifuge tubes, and then centrifuged at 3000 rpm for 10 minutes
to complete the soil solution extraction. The soil solution was then filtered through a
syringe-filter (0.45 μm) into a clean 1.5 ml centrifuge tube. From each filtered soil
solution sample, 900 μl was put into a centrifuge tube and acidified by adding 100 μl 1
M HNO3 prior to ICP-MS analysis.
5.2.7. Extraction using 0.01M CaCl2
The concentrations of extractable metal species in soils were obtained by
weighting 2 g of air-dried soil into a clean 50 ml centrifuge tube, and then adding 20
ml of 0.01 M CaCl2 solution. The mixtures were shaking for 2 hours. Following this, a
1.5 ml aliquot was pipetted into a clean 1.5 ml centrifuge tube and centrifuged at 6000
rpm for 10 minutes. The samples were filtered using syringe-filters (0.45 μm,
Acrodisc) into a clean 1.5 ml centrifuge tube. Finally, 900 μl of filtered solution were
146
put in the 1.5 ml clean centrifuge tube and acidified by adding 100 μl of 1 M HNO3,
for subsequent ICP-MS analysis.
5.2.8. Quality control and quality assurance
The quality assurance (QA) and quality control (QC) were used in the
experiments for reducing the errors of data analysis (Zhang, 2007). Blanks were
assessed during all experiments. For each DGT deployment, three devices were kept
as blanks. Acid blanks and reagent blanks were also measured for each experiment.
Internal standard and QC samples were used for ICPMS analysis.
5.2.9. Samples analysis and calculations
After 10 times dilution using 0.1 M HNO3 followed by adding 20 µl of internal
standard (Rh) in to 1ml of samples, they were analysed by inductively coupled
plasma-mass spectrometry (ICP-MS).
The concentrations of labile metals measured by DGT (CDGT) were calculated using
the following equation (Liang et al., 2014):
C = ∆ (5.4)
Where M is mass of metal accumulated in the resin gel, ∆g is the thickness of the
diffusive gel (0.078 cm) and the filter membrane (0.014 cm); A is the surface area of
DGT window (2.54 cm2), t is the time of deployment, and D is the diffusion
coefficient of metals in gel.
The R value, representing the degree of the depletion at the interface of the
DGT device and soil, can be calculated using equation (5.5).
R = CDGT/Csoln (5.5)

147
The Csoil is a total dissolved metal concentration in in soil solution. The R
values can be used to evaluate the capacity of the solid phase for resupplying the soil
solution. It is strongly dependent on the deployment time, and the quantity of metals
resupplied from the solid phase, and the degree of this resupply (Harper et al., 2000).
5.2.10. Using Two-Dimensional DGT-Induced Fluxes in Soils (2D-DIFS) DIFS model can be downloaded freely from the following website:
http://www.es.lancs.ac.uk/wdgroup/difs.htm.
It can be used to estimate response time to perturbation of metal removal (Tc), and
dissociation rate constant (k-1), provided the R value and Kd are known. The
distribution coefficient (Kd) is usually defined as the ratio of labile concentrations in
the solid phase and in solution, it represents the adsorbed species to the solid phase
that are able to desorb and accumulated in DGT (Harper et al., 2000; Di Bonito et al.,
2008). Tc represents the inverse of a dissociation rate and thus embraces the capacity
of the labile metals species on the solid phase and its rate of release. The rapid
resupply kinetics (R ≥ 0.95) can be achieved at large Kd (high proportion in soil
solution) during the depletion process (very low Tc, ≤ 1 s, and large k-1) (Zhang et al.,
1998; Harper et al., 2000). The dissociation rate constant k-1 can be estimated by using
the following equation (Harper et al., 2000).
k-1 = 1/((1 + KdPc)Tc) (5.6)
These kinetic parameters are obtained in this study to estimate the rate exchange of
labile metals between solid phase and solution phase of the soil and to assess the
resupply of metals from soil particles to solution.

148
5.3. Results and Discussion
Crude oil ligands in soils can form stable complexes with trace metals cations
at varying ratios. Aromatic hydrocarbons and phenolic substances play a crucial role
as the main oil constituents for trace metals distribution and fractionation (Omaka et
al., 2011; Fu et al., 2014). They can form stable metal-ligands and make metals
species have less lability in solid phase and soil solutions. However, organic matter in
soil may have a strong competition with oil ligands to form meta-ligand with trace
metals at varying stability and different capacities of resupply metals species from
solid phases (Conesa et al., 2010). The DGT sampler was carried out in three different
soils of different properties treated with varying crude oil content (0%, 2%, and 8%
w/w) and aging time. Based on the study performed by Scally et al. (2003) and
Garrido Reyes et al. (2013), the obtained results will be interpreted by the lability of
the complexes formed between a metal and a ligand that pass through hydro gel
accumulated in the binding layer.
5.3.1. DGT measured concentrations
The measured CDGT labile species of studied metals reflect the flux of metal
species supplied from solid phases to soil solution. It measures concentrations of
metals species in soil solutions (water-soluble), labile pool in the solid phase (CDGT
and R value) and kinetic exchange between the two (dissociation rate, k−1) (Liang et
al., 2014).

149
(C)
(A)
(B)
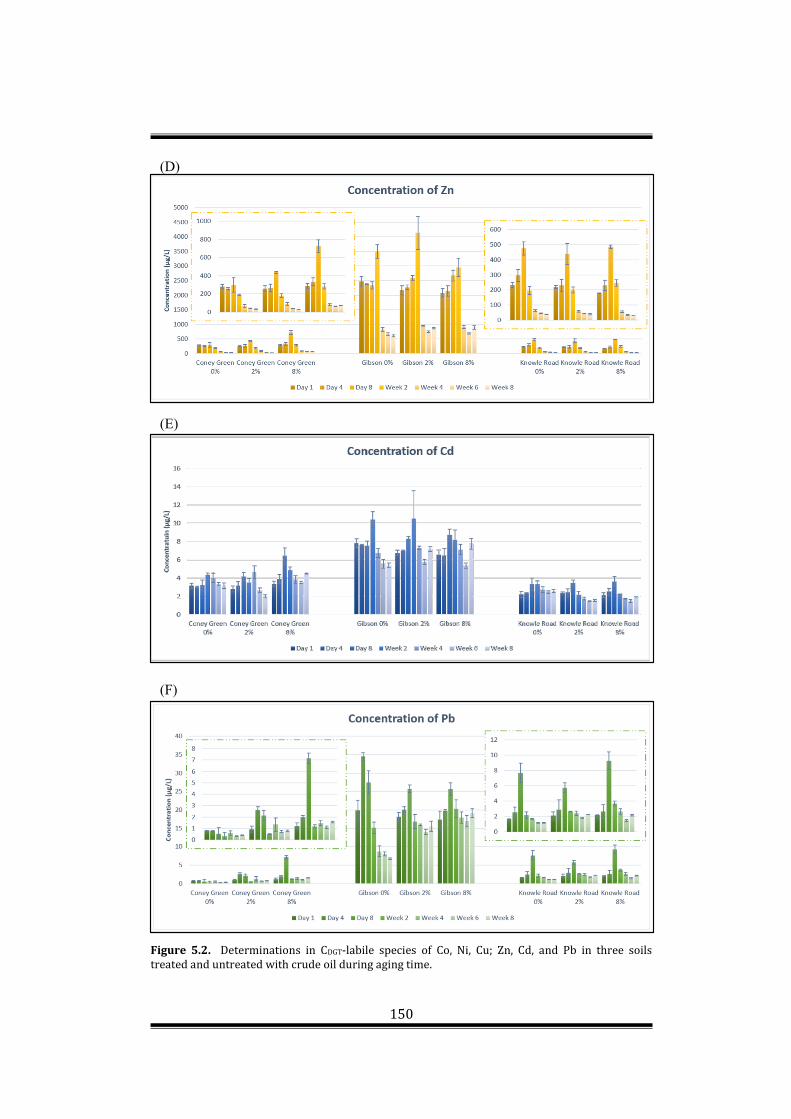
150
Figure 5.2. Determinations in CDGT-labile species of Co, Ni, Cu; Zn, Cd, and Pb in three soils treated and untreated with crude oil during aging time.
(D)
(E)
(F)

151
Cobalt (Co). The measured CDGT-labile species of Co showed no significant
difference in three studied soils with increasing of crude oil amendment (0, 2 and 8
%w/v) as shown in Figure 5.2-(A). This is may be attributed to the low concentration
of Co in crude oil.
It can be observed that, gradual decreases in CDGT of labile Co species with
incubation period, suggesting that labile metals changed to non-labile with aging
(Liang et al., 2014). This also could be explained by the complexation of metals with
colloidal organic ligands in soils, which are maybe increased due to microbial
oxidation with aging (Martínez and McBride, 1999).
Nickel (Ni). A gradual increase of CDGT–labile species of Ni was observed with
increasing of crude oil contamination in three soils with average range between 81.3
µg/L and 105 µg/L in Coney Green soil, 183.2 µg/L to 191 µg/L in Gibson soil and
64.15 µg/L and 128.1 µg/L in Knowle Road soil, this is probably due to the release of
Ni from oil to soils.
A declining trend of Ni CDGT was observed in three selected soils with no oil
during aging, due to Ni complexation and adsorption with organic matters sites in soils
during incubation time (Sabir et al., 2008). The CDGT-labile species of Ni in Coney
Green and Knowle Road soils treated with 2% and 8% w/v were increases at first two
weeks, and then showed a slow decrease at the rest of incubation time Figure 5.2-(B).
It is likely that the proportions of Ni species at first two weeks associated with the
weakly bound ligands and available from solid phase to solution. With aging, more
stable and stronger binding oil ligands formed and reduce the availability (Jalali and
Khanlari, 2008). For Gibson soil with and with no oil, the CDGT-labile species of Ni
showed a markedly decrease during the incubation time, possibly the Ni species could

152
be rapidly adsorbed on solid phase surfaces and precipitated. The organic ligands in
oil-amended soils also maybe contributed to OM in soils for inducing a rapid decrease
in CDGT-labile Ni species (Relić et al., 2005; Ma et al., 2013).
Copper (Cu). The CDGT of Cu in three soils showed a general increase with increasing
quantity of crude oil treatments at average range from 54.1-87.13 µg/L for Coney
Green soil, 136.4-148.5 µg/L for Gibson soil and 48.3-156.4 µg/L for Knowle Road
soil. This is may be because Cu was most strongly associated with ligands in
unamended soils, and weakly associated to organic complexes in oil-amended soils; in
the latter, maybe the strongest sites of organic complexes were completely saturated.
Moreover, the soluble organic ligands could be adsorbed by iron oxides (Martínez and
McBride, 1999; Twiss and Moffett, 2002).
The CDGT of Cu in Gibson soil with no oil showed a slow decrease with
incubation time. This is maybe Cu was most strongly associated with ligands in
unamended soils and became more stable with aging time. At amended soil with 2%
and 8% v/w oil, CDGT gradually increased at first two weeks then decreased at the
reminder of aging time, this is probably at first two weeks Cu weakly associated to
organic complexes in oil-amended soils due to the competition between OM in soils
and oil’s ligands then became non-labile with rest of aging time. Moreover, the soluble
organic ligands could be adsorbed by iron oxides (Martínez and McBride, 1999; Twiss
and Moffett, 2002).
The lability of Cu in Coney Green and Knowle Road soils steadily increased
from day (1) to week (2), and then significantly decreased during the rest of aging
time. This may be attributed to the strong competition of oil organic ligands with
organic complexes in soils. At first two weeks Cu could bound with inorganic ligands

153
and weakly associated to organic ligands and then tend to form more stable complexes
with aging time (Jalali and Khanlari, 2008; Ma et al., 2013; Liang et al., 2014).
Zinc (Zn). The CDGT-labile species of Zn species showed a substantial variation in
three soils with increasing of crude oil amendment, which is maybe attributed to the
variation in redox processes in soils or due to varying stability of OM contributed by
metals and oil amendments (Jalali and Khanlari, 2008; Sabir et al., 2008).
As shown in Figure 5.2-(E), the CDGT-labile species of Zn species slowly
increased at first two weeks incubation times for Coney Green and Knowle Road soils
after which the lability of Zn species continually decreased during the rest of aging
time, and changed to more stable forms. For Gibson soil, the CDGT slowly increased at
the first two weeks then decreased during the rest of the incubation time. This is
probably attributed to the Zn being weakly bound to organic ligands, and inorganic
complexes at first 8 days. The Zn species then changed into less available forms,
possibly into the forms associated with large stable organic ligands which increased
substantially after week 2 due to microbial activity with incubation time (Ma and
Uren, 2006; Antoniadis et al., 2007).
Cd and Pb. The concentrations of Cd and Pb for all three studied soils were the
lowest compared to the other five metals species during incubation time. The
measured CDGT of Cd in Coney Green, Gibson and Knowle Road soils were ranged
between 3.0 µg/L to 4.0 µg/L and 5.4µg/L to 10.4 µg/L and 2.2 µg/L to 3.4 µg/L,
while the concentrations of labile Pb species were in the range between 0.2-0.8, 6.8-
34.5 and 1.16-7.7, respectively Figure 5.2-(E) and Figure 5.2-(F). This is probably
attributed to the present of humic matter and iron oxides in minerals in soils can form
strong complexes with both metals or may be due to low content of metals in soils. It
can be noted that the CDGT of Cd and Pb species in Coney Green and Knowle Road

154
soils are the smallest comparing to those in Gibson soil, due to their strong fixation
onto soil organic ligands and their affinity for Mn and Fe (hydr) oxides from soils and
oil (Trakal et al., 2011). The measured concentrations of Cd and Pb in DGT showed
no significant differences with increasing of crude oil treatments. This is probably due
to formation of stable organic complexes with oil ligands of similar range (Trakal et
al., 2011).
The measured concentration in DGT of Cd in three soils with and with no oil
showed no significant changes may due to the mutual competition with the metals in
soils.
For Pb, the CDGT of Pb in Cony Green and Knowle Road soils with and with no
oil was not significantly changed during aging time possibly due to the decrease in
organic matter content stability in soil with increasing of oil amendments (Sabir et al.,
2008).
The concentration of labile Pb in Gibson soil with no oil was gradually
decreased with aging time probably due to the conversion of organic ligands in soil
into more stable form that could bind more Pb during incubation period. However, for
the oil-amended Gibson soil, the CDGT of Pb was varying with incubation period,
which could be attributed to varying stability of organic matter in soil contributed by
aging and oil amendments (Martínez and McBride, 1999).
5.3.2. Soil solution concentrations The overall distribution of studied trace metal concentrations in soil solutions
Figure 5.3-(A-F) mirroring the DGT-measured concentrations Figure 5.2-(A-F),
although total dissolved concentrations of metals species in the soils solutions are
often higher than DGT values. Crude oil amendments significantly affected soil-
dissolved Ni, Cu and Zn concentrations after incubation period as shown in Figure
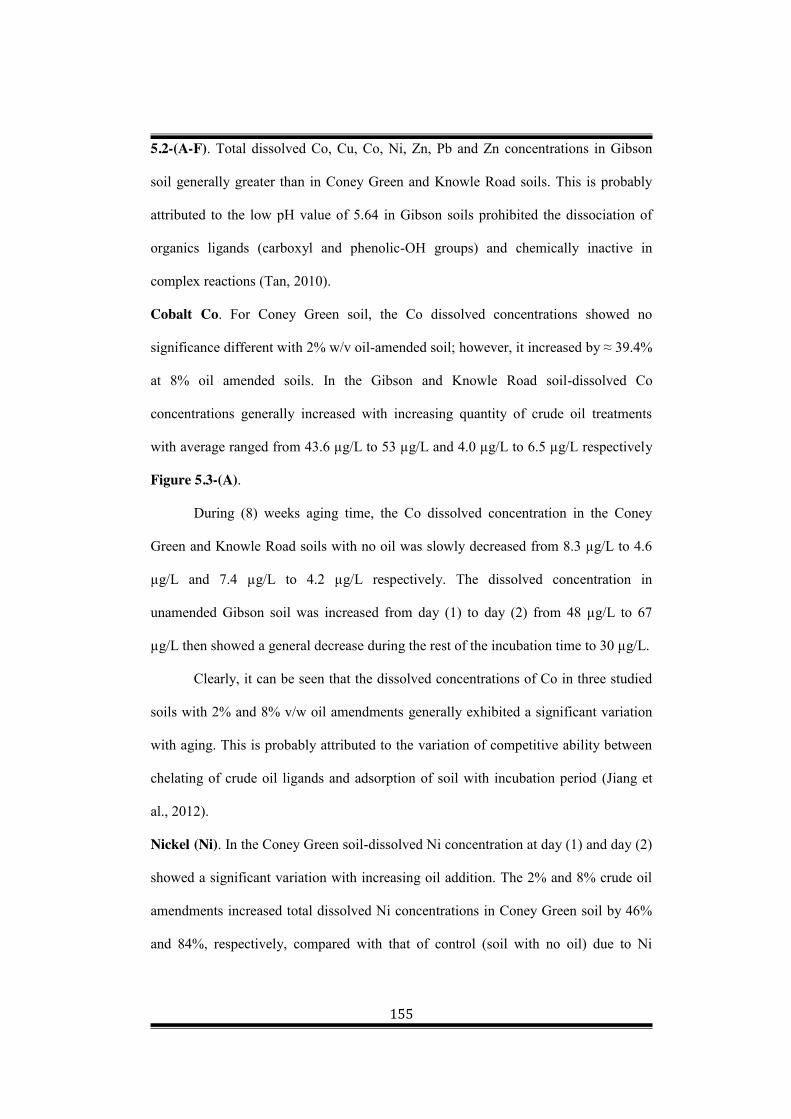
155
5.2-(A-F). Total dissolved Co, Cu, Co, Ni, Zn, Pb and Zn concentrations in Gibson
soil generally greater than in Coney Green and Knowle Road soils. This is probably
attributed to the low pH value of 5.64 in Gibson soils prohibited the dissociation of
organics ligands (carboxyl and phenolic-OH groups) and chemically inactive in
complex reactions (Tan, 2010).
Cobalt Co. For Coney Green soil, the Co dissolved concentrations showed no
significance different with 2% w/v oil-amended soil; however, it increased by ≈ 39.4%
at 8% oil amended soils. In the Gibson and Knowle Road soil-dissolved Co
concentrations generally increased with increasing quantity of crude oil treatments
with average ranged from 43.6 µg/L to 53 µg/L and 4.0 µg/L to 6.5 µg/L respectively
Figure 5.3-(A).
During (8) weeks aging time, the Co dissolved concentration in the Coney
Green and Knowle Road soils with no oil was slowly decreased from 8.3 µg/L to 4.6
µg/L and 7.4 µg/L to 4.2 µg/L respectively. The dissolved concentration in
unamended Gibson soil was increased from day (1) to day (2) from 48 µg/L to 67
µg/L then showed a general decrease during the rest of the incubation time to 30 µg/L.
Clearly, it can be seen that the dissolved concentrations of Co in three studied
soils with 2% and 8% v/w oil amendments generally exhibited a significant variation
with aging. This is probably attributed to the variation of competitive ability between
chelating of crude oil ligands and adsorption of soil with incubation period (Jiang et
al., 2012).
Nickel (Ni). In the Coney Green soil-dissolved Ni concentration at day (1) and day (2)
showed a significant variation with increasing oil addition. The 2% and 8% crude oil
amendments increased total dissolved Ni concentrations in Coney Green soil by 46%
and 84%, respectively, compared with that of control (soil with no oil) due to Ni

156
release from crude oil to soil. Total dissolved concentration in Gibson soils showed no
significant different with increasing crude oil treatments may due to the naturally
occurrence of high Ni in soil. In the Knowle Road soil-dissolved concentration varied
with oil treatments, which could be attributed to varying stability of organic ligands
contributed by oil amendments. However, general increase in total dissolved Ni
concentrations in three selected soils with and with no oil considerably varied with
incubation time, which probably attributed to varying decomposition/oxidation of
organic complexes by soil microorganisms during aging time (Wuana et al., 2015).
Copper (Cu). Total dissolved Cu concentrations in three soils exhibited a substantial
variation with both increasing quantity of crude oil amendment and aging time Figure
5.3-(C). This is may be due to the competition among multiple and mixed solid phases
for Cu retention with oil addition and aging time (Martínez and McBride, 1999).

157
(A)
(B)
(C)
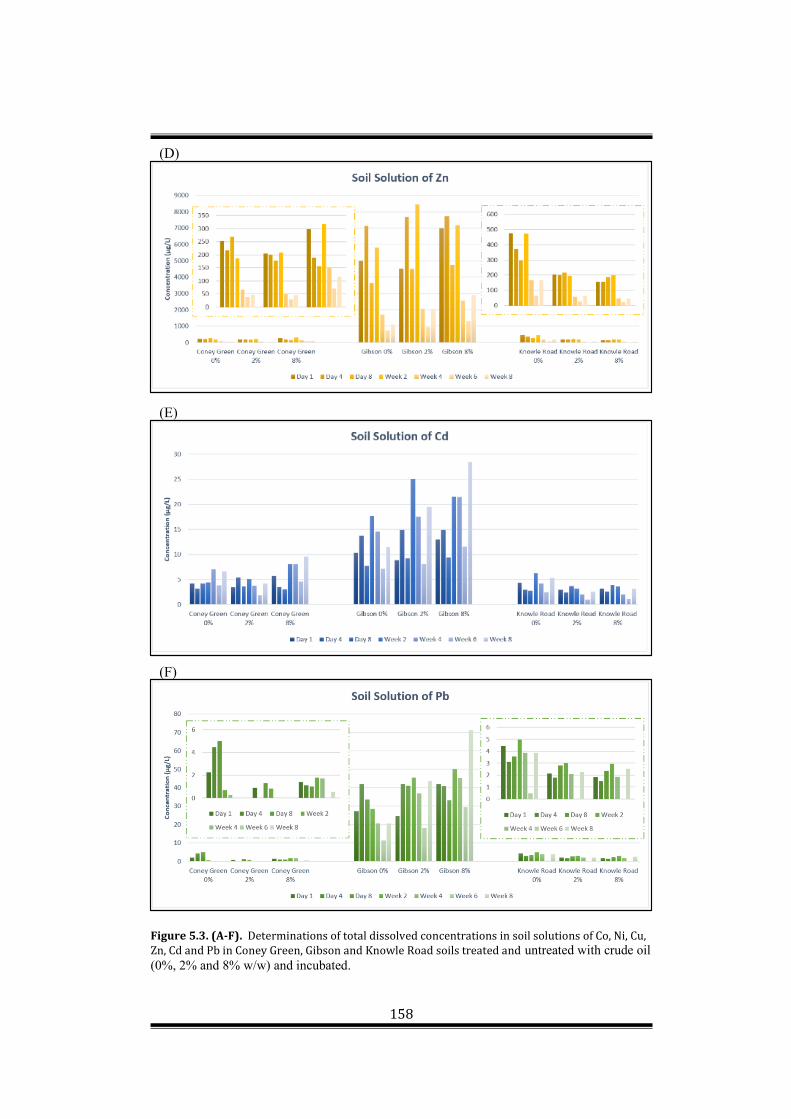
158
Figure 5.3. (A-F). Determinations of total dissolved concentrations in soil solutions of Co, Ni, Cu, Zn, Cd and Pb in Coney Green, Gibson and Knowle Road soils treated and untreated with crude oil (0%, 2% and 8% w/w) and incubated.
(D)
(E)
(F)
159
Zinc (Zn). At both crude oil treatments of Coney Green and Gibson soils, total
dissolved Zn showed a general increase varied with increasing quantity of crude oil
application due to varying stability of organic complexes contributed by amendments
(Sabir et al., 2008).
With incubation periods, the total dissolved Zn concentrations in three soils
with and with no oil showed a general decrease with a slight variation due to changes
in redox and decomposition condition with aging.
Cadmium (Cd) and Lead (Pb). The total dissolved concentrations of Cd and Pb in
soil solutions of three selected soils with and with no oil were low and not
substantially different with incubation time as shown in Figure 5.3-(E) and Figure
5.3-(F). This is probably attributed to the stable organic ligands in soils associated
with both metals in the presence of oil and during aging or to the presence of low
content of this metal in soil’s solid and soil phases (Ford et al., 1997; Lock and
Janssen, 2003; Jalali and Khanlari, 2008). The measured concentrations in soil
solutions of Pb often were effectively at or below the detection limit. This is possibly
due to extracting insufficient quantity of soil solutions for analysis.
5.3.3. Effect of oil and aging on R values
Tables 5.3-5.5 show the obtained R values of the concentrations measured by
DGT to that in soil solutions, (Csoln), for studied metals in three selected soils with and
with no oil. The R value CDGT/Csoln (0 < R < 1) indicates the capacity of the solid
phase in soil to resupply metals into soil solutions. When R > 0.95, the metal is present
as mobile and kinetically labile species in the solid phase and the capacity of the solid
phase to resupply the pore water is high. If CDGT/Csoln approaching (0) indicates very
limited or no metal resupply from solid phase into soil solution (Senila et al., 2012).

160
Cobalt (Co). The R values for Co in soil with no oil ranged between 0.37 - 0.77
(average 0.57), while in the 2% and 8% oil mended soils ranged between 0.30 - 1.04
(average 0.67) and 0.2 - 0.89 (average 0.55) respectively Table 5.3. This indicates in
general an intermediate capacity for Co resupply from the solid phase to soil solution.
Soil amendment with crude oil generally decreased R values for Co except at day (4)
and day (8), R values were higher may be due to the release of Co from oil in these
two periods. If the metal in the soil is significantly complexed stable organic ligands,
DGT will capture only a proportion of the labile metal species in soil solution (Zhang
et al., 2006). With incubation time R values for Co in Coney Green soil with and with
no oil showed a gradual decrease may be due to the conversion of organic complexes
into more stable form that could bind more Co (Martínez and McBride, 1999).
Table 5.3. (R) Values for studied metals in Coney Green soil with and without crude oil.
Co Ni Cu Zn Cd Pb
Soils Aging�time 0%�w/w 2%�w/w 8%�w/w 0%�w/w 2%�w/w 8%�w/w 0%�w/w 2%�w/w 8%�w/w 0%�w/w 2%�w/w 8%�w/w 0%�w/w 2%�w/w 8%�w/w 0%�w/w 2%�w/w 8%�w/w
Day�1 0.61 0.66 0.46 0.39 0.47 0.33 0.37 0.45 0.39 1.11 1.26 0.97 0.75 0.82 0.59 0.35 1.01 0.87
Day�4 0.77 1.04 0.89 0.52 0.42 0.61 0.44 0.33 0.60 1.20 1.32 1.76 0.94 0.60 1.11 0.16 -0.50 1.77
Coney�Green Day�8 0.61 0.82 0.67 0.35 0.46 0.74 0.29 0.40 0.61 1.11 2.45 1.80 0.77 1.16 2.10 0.08 1.63 7.04
Week�2 0.77 0.38 0.43 0.46 0.22 0.25 0.38 0.39 0.40 1.02 0.86 0.89 0.97 0.69 0.60 0.42 0.58 0.65
Week�4 0.42 0.30 0.34 0.31 0.26 0.25 0.26 0.34 0.35 0.99 1.84 0.57 0.57 1.24 0.48 0.80 -22.17 0.84
Week�6 0.65 0.60 0.49 0.39 0.35 0.19 0.39 0.70 0.59 1.05 1.31 0.90 0.87 1.43 0.76 -0.22 -0.58 -1.86
Week�8 0.37 0.30 0.24 0.24 0.19 0.18 0.20 0.52 0.37 0.70 0.64 0.61 0.47 0.48 0.47 -0.42 -0.96 2.77

161
Table 5.4. (R) Values for studied metals in Gibson soil with and without crude oil.
Table 5.5. (R) Values for studied metals in Knowle Road soil with and without crude oil.
For Gibson and Knowle Road soils, R values for Co ranged between 0.1-0.83
(average 0.47), indicating an intermediate capacity for Co resupply from the solid
phase Table 5.4. The R values for Co in both soils with and with no oil exhibited
fluctuations decreases during aging time may be due to the varying stability of organic
complexes with incubation periods (Martínez and McBride, 1999).
Nickel (Ni). The R values in three soils with and with no oil ranged between 0.18-0.74
(average 0.46), indicating in general a poorer capacity re-supply of Ni from solid
phase to solution Tables (5.3-5.5). With increasing of crude oil treatments and
incubation time for three soils, R-values showed a general decrease compared with
Co Ni Cu Zn Cd Pb
Soils Aging�time 0%�w/w 2%�w/w 8%�w/w 0%�w/w 2%�w/w 8%�w/w 0%�w/w 2%�w/w 8%�w/w 0%�w/w 2%�w/w 8%�w/w 0%�w/w 2%�w/w 8%�w/w 0%�w/w 2%�w/w 8%�w/wDay�1 0.65 0.67 0.41 0.63 0.64 0.40 0.54 0.54 0.37 0.49 0.48 0.30 0.76 0.76 0.50 0.73 0.74 0.41Day�4 0.44 0.40 0.37 0.41 0.38 0.36 0.37 0.32 0.33 0.33 0.30 0.28 0.55 0.47 0.43 0.82 0.48 0.49Day�8 0.67 0.62 0.63 0.54 0.51 0.59 0.35 0.32 0.40 0.64 0.58 0.56 0.97 0.91 0.93 0.82 0.63 0.77
Gibson Week�2 0.50 0.40 0.39 0.43 0.34 0.32 0.30 0.28 0.24 0.60 0.49 0.41 0.59 0.42 0.38 0.53 0.37 0.41Week�4 0.42 0.40 0.35 0.37 0.36 0.31 0.30 0.29 0.26 0.49 0.45 0.35 0.46 0.41 0.33 0.42 0.43 0.40Week�6 0.65 0.61 0.50 0.53 0.44 0.43 0.45 0.51 0.39 0.89 0.79 0.53 0.78 0.71 0.47 0.71 0.77 0.58Week�8 0.41 0.35 0.30 0.32 0.32 0.26 0.22 0.25 0.19 0.55 0.42 0.31 0.47 0.37 0.27 0.33 0.38 0.27

162
that of control soils probably due to Ni formation of organic and inorganic complexes
from oil that adsorbed to solid phase (Sabir et al., 2008; Wuana et al., 2015).
Copper (Cu). The R values of Cu in three soils sensibly ranged from 0.19 - 0.79
(average 0.49), indicating poor buffering from solid phase re-supply of the Cu in soil
solution. For Coney Green and Knowle Road soils, R values exhibited a general
increase with increasing of crude oil amendments compared with that for control. This
is may be Cu was most strongly associated with ligands in unamended both soils, and
weakly associated to organic complexes in oil-amended soils; in the latter, maybe the
strongest sites of organic complexes were completely saturated. On the other hand, the
soluble organic ligands could be adsorbed by iron oxides from oil (Martínez and
McBride, 1999; Twiss and Moffett, 2002). For Gibson soil, the R values for Cu
showed a gradual decrease with increasing of oil amendments compared with that of
control soil. This may be Cu less affected by competition with OM in soil of low pH
and form more stable complexes increasing of oil ligands (Torri and Corrêa, 2012).
The R values in three soils decreased with slight fluctuations during incubation times
due to the varying competition between OM in soils and oil ligands.
Zinc (Zn). The R values for Zn in the three soils with and with no oil were slightly
higher than those in soils with no oil (control); this may be due to the release of Zn
species from the oil into the soils. In Coney Green and Knowle soils, the R values are
greater than 1, which is not possible. This only means contamination of Zn during
DGT assembly, sample treatments or analysis. Therefore, those data cannot be used
and interpreted.
The R values for Gibson soil showed a gradual decrease with increasing oil
treatments compared to that for control, due to complexation of Zn with oil ligands
Table 5.4. During aging time the R values for Zn in Gibson soil with and with no oil

163
showed a substantial variation again due to the varying stability of ligands with
incubation time.
Cadmium (Cd). The R values for Cd in three studied soils were ranged between
0.27-1.28 (average 0.80), indicating high capacity of solid phase to resupply Cd
species concentrations into soil solution (Table 5.3-5.5). There was a significant
variation of R values for Cd in three soils with and with no oil during aging period.
The often overestimated Cd in Coney Green and in Knowle Road could be attributed
to the contamination of samples and handling during extraction step.
Lead (Pb). For Gibson soil, the R values of Pb were ranged between 0.27-0.77
(average 0.52), indicating an intermediate and partial resupply from solid phase to soil
solutions. The R values for Pb in Gibson soil showed a general decrease with
increasing of crude oil amendments and varied during incubation time. The often
overestimation and underestimation of R values for Pb in Coney Green and Knowle
Road soils attributed to the contamination of samples and handling during extraction
step.
5.3.4. CaCl2 extractable concentrations
Figures 5.4-(A-F) show the measured CaCl2-extractable of studied trace metals
contents in the three selected soils with and with no oil. The concentrations of studied
trace metals measured as Csolution and CDGT were substantially lower than those
extracted in 0.01 M CaCl2 because CaCl2 was in direct contact with the solid phase
(Garrido Reyes et al., 2013).
Co. A slight increase in CaCl2-extractable Co for Coney Green and Gibson soils was
observed with increasing of crude oil amendment compared with that of control,
ranged from 25.7-31 µg/Kg and 29-33 µg/Kg respectively. This may be attributed to
the release of Co from crude oil and due to the present of organic ligands with

164
saturated sites with adding oil. The CaCl2-extractable Co in Knowle Road soil showed
a slight decrease with increasing crude oil ranged from 22 µg/Kg -10 µg/Kg probably
due to the complexation of Co with oil organic ligand.
A general decrease in CaCl2-extractable Co for both three soils with and with
no oil was observed with aging time Figure 5.4-(A). This is probably due to the
conversion of organic ligands into more stable form that could bind more Co with
incubation time (Qin et al., 2004; Sabir et al., 2008).
Ni and Cu. There was a significant variation in CaCl2-extractable Ni and Cu for three
soils with increasing quantity of crude oil amendments may be due to the competition
between OM in soils and oil ligands Figures 5.4-(B) and 5.4-C). The measured
CaCl2-extractable Ni and Cu in three soils showed a significant variation with
increasing crude oil treatments and incubation times. This is attributed to the varying
in organic ligands competition and stability with increasing oil and aging time. The
higher extractability of Ni and Cu probably attributed to high dissolved concentrations
of organic matter, which can strongly complex with the metals (Iwegbue et al., 2007).
Zn. The CaCl2-extractable Zn is the highest and exhibited a significant decrease in
Coney Green and Knowle Road soils with increasing of crude oil amendments
compared with that for control with average range from 1030.4-950 µg/kg and 1790-
590 µg/kg respectively Figure 5.4-(D). This is may be attributed to the formation of
stable organic complexes with increasing of oil ligands. In Gibson soil the extracted
Zn varied with increasing of crude oil treatments possibly due to the varying in
stability of ligands with adding oil.
The CaCl2-extractable Zn in three soils with and with no oil exhibited a general
decrease due to the increase of organic ligands stability with incubation time.

165
Cd and Pb. As shown in Figures 5.6-(E) and 5.6-(F) the CaCl2-extractable both
metals were low and not significantly different with increasing oil amendments and
incubation period, which was consistent with CDGT and water-soluble Cd and Pb in
soil solutions in Figures 5.2-(E), 5.2-(F), 5.3-(E) and 5.3-(F). This is could be
attributed to the low content of both metals in soils.
(A)
(B)

166
(C)
(E)
(D)

167
Figure 5.4-(A-F). Determinations of trace metals concentrations in extracted in CaCl2 species of Co, Ni, Cu, Zn, Cd and Pb in three soils with without crude oil during aging time.
5.3.5. Effect of oil and aging on Kd
As discussed above in section 5.2.10, the DIFS model quantifies the
dependence of (R) on trace metals species re-supply from solid phase into soil
solutions coupled to diffusional supply to the interface and through the diffusion layer
to the binding layer (Lehto et al., 2008). The DIFS was applied to model the obtained
(R) values (Tables 5.3-5.5) in order to determine Kd values (plotted in Figure 5.5) and
TC (Table 5.6).
The distribution coefficient (Kd) values were estimated by measuring the
concentrations of each trace metals species released in soil solutions and extractants in
0.01 M CaCl2. To contribute to CDGT-labile species, the trace metals in the labile solid
phase pool must dissociate during time of deployment (Ernstberger et al., 2002). The
distribution coefficient, Kd, expresses the ratios between the concentrations of labile
trace metals species in the solid phase and its concentration in soil solutions using the
following equation (5.7) (Lehto et al., 2008).
(F)

168
K =
(5.7)
The resupply kinetics of studied trace metals species in three selected soils discussed
by (Kd) Figure 5.7
High Kd values suggest that the metal species has been retained by the solid
phase through sorption reactions, whereas low Kd values show that high concentration
of metal species are occur in soil solution.
Co. It can be seen that the Kd values of Co in Coney Green soil showed a general
decrease with increasing of crude oil amendments compared with that for control with
average range from 50 at (no oil) to 42.7 at (2% oil-amended soil) to 32 at (8% oil oil-
amended soil). The crude oil amendments seemed to reduce the available solid phase
pool of Co for Coney Green soil. For Gibson soil, Kd of Co values showed no
significant different at (2% oil-amended soil) and decreased by nearly 22.4% at (8%
oil-amended soil) compared to that for control may be due to the release of more Co
concentration in solution or because of competition in reducing the sorption of metal
by oil ligands (Antoniadis et al., 2007). The Kd of Co in Knowle Road soil decreased
from 55 at (no oil) to 29 (2% oil-amended soil) the increased to 48 (8% oil-amended
soil) probably due to the increase of solid phase capacity in soil to retain Co with
increasing of oil ligands.
The (Kd) values in Coney Green soil with and with no oil were gradually
decreased during incubation time, indicating an increase of Co species load in soil
solutions and a decrease in the solid phase Co species pool with aging period. This is
also possibly when sorption sites become saturated a lower metal complexations with
organic ligands in solid phase, which inducing a rapid reduce of labile metal in the

169
solid phase, and thus the Kd may become lower (Zhang et al., 1998; Dabrin et al.,
2012). For Knowle Road, the Kd values of Co showed no significant difference in
unamended soil during incubation time but decreased to nearly by 79.7% at (2% oil-
amended soil) and increased with a greater variation at (8% oil-amended soil). This is
possibly attributed to the varying in competition between the capacity of soil solid
phase and oil ligands in solution to retain metal. For Gibson soil with and with no oil
the Kd values exhibited a considerable variation with incubation time may be due to
the varying in the capacity of solid phase sites for adsorbing metal during aging time
(Antoniadis et al., 2007).
Ni. The Kd values of Ni were generally decreased with adding of crude oil
amendments in three soils. For Coney Green the Kd decreased from 38 at (soil with no
oil) to 30 at (2% oil-amended soil) to 20 at (8% oil-amended soil). Ni Kd values for
Gibson soil were slowly decreased from 62 at (soil with no oil) to 59 at (2% oil-
amended soil) to 51 at (8% oil-amended soil). The Kd values for Knowle Road soil
slightly decreased to nearly by 26% with increasing of oil treatments compared to that
for control (unamended soil). This is probably attributed to the release of Ni species
from solid phase and crude oil to soil solution. On the other hands, in the presence of
oil ligands the enrichment of the Ni on the solid phase could be decreases, and the Kd
values are also reduced (Rocha et al., 1997).
The Kd values in three soils with and with no oil exhibited a general decrease
with a slight variation during aging. This is probably Ni ions form more stable anionic
complexes from crude oil and have noticeable reduction in Kd values with incubation
time.
Cu. The Kd values of the Cu in Coney Green soil were decreased slowly from 25 at
(soil with no oil) to 20 at (2% oil-amended soil) to 14 at (8% oil-amended soil). Also

170
in Gibson and Knowle Road soils, the Kd values were low with average range from
12-14 and exhibited no significance different with increasing of crude oil amendments.
This is probably attributed to the increase of stable Cu-ligands with oil increase. High
organic content introduced by more quantity of crude oil could modify the availability
of Cu from the solid phase. Thus, the proportion of labile Cu species in the solid phase
probably reduced, and therefore the Kd values decrease (Zhang et al., 1998).
A gradual decrease of Kd values with incubation period can be observed for
three selected soils with and with no oil, possible due to the strongest tendency of Cu
to be associated with the solid phase with increasing incubation time (Refaey et al.,
2014).
Zn. For Zn, the Kd values of Zn in three studied soils with and with no oil were similar
irrespective of treatment and showed substantial variations. This reflects the variation
in Zn may present as the free (hydrated) zinc ion or as dissolved complexes and
compounds with similar extent of stability of in solid phase with incubation time. On
the other hand, the increase of crude oil treatments could modify binding sites and
changing the rate constants of Zn resupply to lower values (Zhang et al., 1998). The
higher values of Kd suggest a high Zn species retention by the solid phase through
sorption reactions and low concentration available in the soil solution (Mench et al.,
2000).
Cd. The Kd values of Cd in three studied soils exhibited greater variations with
increasing of crude oil due to varying in competition of metal for soil sorption sites.
On the other hand, could be attributed to the varying in stability of organic ligands
with increasing oil treatments (Antoniadis et al., 2007).
The Kd values in Coney Green soil with no oil and with 8% crude oil (w/w)
amendments showed a gradual decrease during incubation time. This is maybe at un-

171
amended oil soil; Cd sorption appeared to be strongly influenced by more stable
organic matter with incubation time. However, at 8% oil-amended soil organic ligands
may be modified the availability of Cd species from the solid phase. Therefore, the
proportion of labile Cd species in the solid phase can be reduced, and lowering the Kd
values with incubation time (Zhang et al., 1998; Antoniadis et al., 2007). The
measured Kd values at 2% oil amended soil increased quickly for the first couple of
days and then the rate of increase in Kd slowed but continued to rise through the rest of
incubation period. This suggests that at lower level of oil amendment, Cd probably
strongly associated with organic ligands, which decreases it amount in soil solution
(Antoniadis et al., 2007).
For Gibson soil, the Kd values at unamended and 2% oil amended soils
significantly decreased and then the rate of decrease in Kd values continued with no
considerable difference during the rest of the aging time. At 8% crude oil
contamination the Kd values dramatically increased and showed no significant
difference with incubation time, this is probably due to the depletion of labile Cd
species with increasing of crude oil amendment (Carrillo-Gonzalez et al., 2006).
For Knowle Road with no oil, the Kd was high and significantly decreased
continually during the rest of incubation time with no substantial difference. This
indicating a strong Cd species retention that may be attributed to strong association to
organic matter (Silveira et al., 2003). However, the Kd values at 2% and 8% oil
amended-soils exhibited a general increase with no significant difference during
incubation. This is attributed to the strong association of Cd species to oil ligands and
adsorbed in the solid phase to a higher extent, thus is less likely to move throughout
the soil solution due to low lability and mobility (Silveira et al., 2003).

172
0.0
20.0
40.0
60.0
80.0
100.0
120.0
Day 1 Day 4 Day 8 Week 2 Week 4 Week 6 Week 8
(Kd)
cm
3g-1
Aging time
Co, Coney Green
0% crude oil (w/w)2% crude oil (w/w)8% crude oil (w/w)
0.0
20.0
40.0
60.0
80.0
100.0
120.0
140.0
160.0
Day 1 Day 4 Day 8 Week2
Week4
Week6
Week8
(Kd)
cm
3g-1
Aging time
Co, Gibson
0.0
20.0
40.0
60.0
80.0
100.0
Day 1 Day 4 Day 8 Week 2 Week 4 Week 6 Week 8
(Kd)
cm
3g-1
Aging time
Co, Knowle Road
0.0
10.0
20.0
30.0
40.0
50.0
60.0
70.0
Day 1 Day 4 Day 8 Week 2 Week 4 Week 6 Week 8
(Kd)
cm
3 g-1
Aging time
Ni, Coney Green
0.0
20.0
40.0
60.0
80.0
100.0
120.0
140.0
Day 1 Day 4 Day 8 Week 2Week 4Week 6Week 8
(Kd)
cm
3g-1
Aging time
Ni, Gibson
0.0
10.0
20.0
30.0
40.0
50.0
60.0
Day 1 Day 4 Day 8 Week 2 Week 4 Week 6 Week 8
(Kd)
cm
3g-1
Aging time
Ni, Knowle Road
0.05.0
10.015.020.025.030.035.040.045.0
Day 1 Day 4 Day 8 Week 2 Week 4 Week 6 Week 8
(Kd)
cm
3g-
1
Aging time
Cu, Coney Green
0.0
5.0
10.0
15.0
20.0
25.0
30.0
35.0
40.0
Day 1 Day 4 Day 8 Week2
Week4
Week6
Week8
(Kd)
cm3
g-1
Aging time
Cu, Gibson
0.0
5.0
10.0
15.0
20.0
25.0
30.0
Day 1 Day 4 Day 8 Week 2 Week 4 Week 6 Week 8
(Kd)
cm
3g-1
Aging time
Cu, Knowle Road
0.0
20.0
40.0
60.0
80.0
100.0
120.0
140.0
Day 1 Day 4 Day 8 Week 2 Week 4 Week 6 Week 8
(Kd)
cm
3 g-1
Aging time
Zn, Coney Green
0.0
25.0
50.0
75.0
100.0
125.0
150.0
175.0
Day 1 Day 4 Day 8 Week2
Week4
Week6
Week8
(Kd)
cm
3g-1
Aging time
Zn, Gibson
0.0
20.0
40.0
60.0
80.0
100.0
Day 1 Day 4 Day 8 Week 2Week 4Week 6Week 8
(Kd)
cm
3g-1
Aging time
Zn, Knowle Road

173
Figure 5.5. The Kd values for Co, Ni, Cu, Zn, Cd and Pb on Coney Green, Gibson and Knowle Road soils treated with varying levels of crude oil 0%, 2% and 8% w/w during incubation time.
Pb. The Kd values of Pb in three studied showed significant differences with
increasing of crude oil due to varying in stability of organic ligands with increasing oil
treatments (Antoniadis et al., 2007).
The Kd values in Coney Green and Knowle Road soils very low during the
incubation time and not possible to calculate Kd values at weeks (4, 6 and 8)
incubation time due to below-detection-limit concentrations of Pb species, which
indicates low Pb content in soils.
For Gibson soils with and with no oil, the Kd values of Pb were gradually
decreased with incubation time may be due to the increasing soil solution
concentration with aging time. On the other hand, OM in soil and oil ligands may alter
the availability of Pb from the solid phase. Thus the proportion of labile metal in the
0.0
50.0
100.0
150.0
200.0
250.0
300.0
Day 1 Day 4 Day 8 Week 2 Week 4 Week 6 Week 8
(Kd)
cm
3g-
1
Aging time
Cd, Coney Green
0.0
90.0
180.0
270.0
360.0
450.0
Day 1 Day 4 Day 8 Week 2 Week 4 Week 6 Week 8
(Kd)
cm
3g-1
Aging time
Cd, Gibson
0.0
40.0
80.0
120.0
160.0
200.0
Day 1 Day 4 Day 8 Week 2Week 4Week 6Week 8
(Kd)
cm
3g-1
Aging time
Cd, Knowle Road
-600.0
-400.0
-200.0
0.0
200.0
400.0
600.0
800.0
1000.0
1200.0
1400.0
Day 1 Day 4 Day 8 Week 2 Week 4 Week 6 Week 8
(Kd)
cm
3 g-1
Aging time
Pb, Coney Green
0.0
10.0
20.0
30.0
40.0
50.0
60.0
Day 1 Day 4 Day 8 Week 2 Week 4 Week 6 Week 8(K
d) c
m3
g-1
Aging time
Pb, Gibson
-2000.0
-1500.0
-1000.0
-500.0
0.0
500.0
1000.0
Day 1 Day 4 Day 8 Week2
Week4
Week6
Week8
(Kd)
cm
3 g-
1
Aging time
Pb, Knowle Road

174
solid phase could be decreased, and therefore the Kd will be reduced (Zhang et al.,
1998; Antoniadis et al., 2007).
5.3.6. DIFS calculations and interpretations for Tc
Tc represents the response time of the systems to perturbation of trace metals
species from solid phase to soil solutions. The kinetic parameter TC values of studied
metals were determined for day (1) and week (8) in three selected soils with and with
no oil in order to investigate the effect of crude oil and aging time on TC.
For Co, it can be seen from the Table 5.6 that the Tc values in three studied
soils at day (1) and week (8) incubation time with increasing of crude oil amendments
were very low and ranged between 0.12s and 0.40s, which indicates a very fast soil re-
supply of Co species from the solid phase to solution solutions (Lehto et al., 2006;
Lehto et al., 2008). This is simply reflecting Co depletion of the solid phase.
For Gibson soil, the TC values at day (1) were gradually increased with
increasing of oil amendments, which indicated that Co dissociation rate from the solid
phase decreased with increasing of crude oil contamination, which was consistent with
decrease in in water-soluble Co species in soil solutions Figure 5.3 and CDGT-labile
species of Co Figure 5.2. At week (8), the TC values slowly decreased at 2% w/w
crude oil treatment then significantly increased with increasing of crude oil treatment
to 8% w/w. This is possibly at 2% w/w oil amendment, the Co species will released
from crude oil to water soluble species in soil solution and improve buffering from oil
on the solid phase. However, with increasing of oil amendment to 8% w/w, TC
increased due to the increase of organic ligands supply from oil addition, which is
limiting the kinetics of Co dissociation on the supply of Co species into soil solution
(Lehto et al., 2006).

175
For Knowle Road soil at day (1), the Tc values were very low and not
significantly different with increasing of crude oil contamination ranged between
0.28s and 0.5s Table 5.6. This reflects a rapid supply from the solid phase ensures that
the Co species in soil solution are well buffered and a larger mass accumulated in the
DGT device. At week (8), the Tc values in the amended soil with 2% and 8% w/w of
crude oil were ~ 97% lower than those determined in untreated soil, which suggested
that the supply of Co species from solid phase is limited kinetically in crude oil
contaminated soil. This decreases the concentration of Co species in soil solutions.
For Cu, the TC values were very low in three selected soils with and with no
oil at day (1) and week (8) incubation time, which indicated that very fast resupply
from solid phase to soil solution, which was consistent with increase in water-soluble
Cu Figure 5.3 and CDGT-labile species Figure 5.2. On the other hand, the total
dissolved concentrations of Cu species may include small colloidal forms and
kinetically labile complexes released from oil. Even if most of the Cu species are
strongly associate to the solid phase and not available in the labile pool, it is not
necessary that the Kd values based on the labile species will be low (Harper et al.,
1998; Lehto et al., 2006).
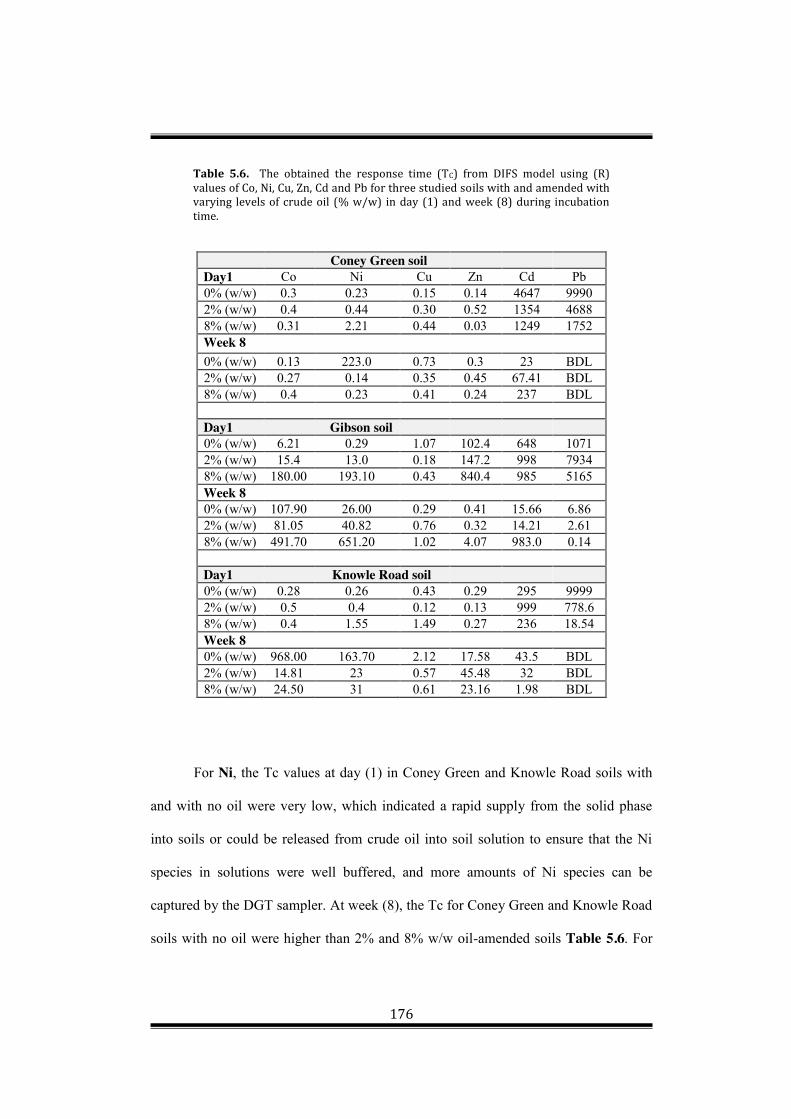
176
Table 5.6. The obtained the response time (TC) from DIFS model using (R) values of Co, Ni, Cu, Zn, Cd and Pb for three studied soils with and amended with varying levels of crude oil (% w/w) in day (1) and week (8) during incubation time.
Coney Green soil
Day1 Co Ni Cu Zn Cd Pb 0% (w/w) 0.3 0.23 0.15 0.14 4647 9990 2% (w/w) 0.4 0.44 0.30 0.52 1354 4688 8% (w/w) 0.31 2.21 0.44 0.03 1249 1752 Week 8 0% (w/w) 0.13 223.0 0.73 0.3 23 BDL 2% (w/w) 0.27 0.14 0.35 0.45 67.41 BDL 8% (w/w) 0.4 0.23 0.41 0.24 237 BDL
Day1 Gibson soil 0% (w/w) 6.21 0.29 1.07 102.4 648 1071 2% (w/w) 15.4 13.0 0.18 147.2 998 7934 8% (w/w) 180.00 193.10 0.43 840.4 985 5165 Week 8 0% (w/w) 107.90 26.00 0.29 0.41 15.66 6.86 2% (w/w) 81.05 40.82 0.76 0.32 14.21 2.61 8% (w/w) 491.70 651.20 1.02 4.07 983.0 0.14
Day1 Knowle Road soil 0% (w/w) 0.28 0.26 0.43 0.29 295 9999 2% (w/w) 0.5 0.4 0.12 0.13 999 778.6 8% (w/w) 0.4 1.55 1.49 0.27 236 18.54 Week 8 0% (w/w) 968.00 163.70 2.12 17.58 43.5 BDL 2% (w/w) 14.81 23 0.57 45.48 32 BDL 8% (w/w) 24.50 31 0.61 23.16 1.98 BDL
For Ni, the Tc values at day (1) in Coney Green and Knowle Road soils with
and with no oil were very low, which indicated a rapid supply from the solid phase
into soils or could be released from crude oil into soil solution to ensure that the Ni
species in solutions were well buffered, and more amounts of Ni species can be
captured by the DGT sampler. At week (8), the Tc for Coney Green and Knowle Road
soils with no oil were higher than 2% and 8% w/w oil-amended soils Table 5.6. For
177
Gibson soils, the TC values gradually increased with increasing crude oil
contamination at day (1) and week (8) incubation period, indicating a decrease in the
resupply of Ni species from solid phase to soil solutions with incubation time and
increasing crude oil concentrations, in which case the soil solutions become gradually
depleted as Ni mass continuously taken up by the DGT sampler with aging Figure
5.3-(B) and Table 5.5 (Harper et al., 1998; Lehto et al., 2006). The raise in TC values
in Gibson soil with increasing of crude oil amendments at day (1) and week (8)
suggested that Ni species sorption degree from the solid phase decrease with
incubation time, which was consistent with decrease in (R) values of Ni (Table 5.3)
and CDGT-labile Ni species Figure 5.3-(B).
For Zn, it can be noted that TC values in three soils with and with no oil were
very low, which indicated that a rapid resupply from the solid phase to soil solution
within the deployment time may be due to high content in soils and oil.
For Cd and Pb, the TC values in Coney Green soil at day (1) with and with no
oil decreased with increasing crude oil contamination, which represent a slower
resupply of both metals from the solid phase to solutions. This implies that the
dissociation of both metals from solid phase is limited kinetically due to the low
content of metals in soil, which was consistent with low CDGT-labile species of Cd and
Pb species in soil solutions Figures 5.2 (E and F) and Figure 5.3 (E and F). However
the results for both metals were inconsistent with determined (R) ratios in Tables 5.3-
5.5, this is likely to have resulted from a competition between organic ligands for
sorption or complexation sites on solid phase and soil solutions (Yang et al., 2013). At
week (8), the Tc values of Cd exhibited a gradual increase with increasing oil
treatment; probably oil ligands induced a reduction of resupply from the solid phase to
soil solution within the incubation time. However, the TC values of Pb in the same soil

178
were not determined because Pb concentrations in soils solutions and CaCl2 extract
were at below the detection limit (BDL) Figures 5.3 and 5.4. This is possibly due to
Pb species tightly bound to solid phase and not available in the labile pool or attributed
to the low Pb content in the soil (Harper et al., 1998).
For Gibson soil, at day (1), the Tc values for both metals were higher in treated
soils with oil, which suggested faster resupply of both metals from solid phase in
unamended soil. At week (8), it appears that the kinetics of dissociation of both metals
from solid phase to solutions is fast, except of Cd, which exhibited a stronger kinetics
limitation at 8% oil-amended soil. This my imply that the oil ligands can form chelates
with Cd species tightly bound to solid phase, which is consistent with decrease in (R)
ratios of Cd labile species in Table 5.4 (Lin et al., 2015). The Tc values of Cd in
Knowle Road soil with oil at day (1) were higher than those at week (8), probably due
to the form of fast dissociating complexes with oil ligands during incubation time
(Lehto et al., 2006; Degryse et al., 2009). For Pb, at day (1) there was a significant
decrease in Tc values with increasing oil amendment overall (p<0.05), Tc decreases
from 3 hours to 18.54s and not detected at week (8) incubation time Table 5.6. This is
because Kd values of Pb could not be estimated due to the concentrations of Pb species
in soil solutions and CaCl2 extracts were below detection limits. This is maybe Pb
species were tightly bound to solid phase with incubation time and increasing oil
ligands, thus unavailable for release to the soil solution and extractants calcium
chloride (CaCl2), which is significantly reduce Pb lability and mobility in the soil
solution (Sauvé et al., 1998).
5.3.7. Dissociation rate (K-1)
The dissociation rates k-1 in Figure 5.6 were calculated from Tc, Pc, and Kd
using equation (5.6). The obtained values of k-1 have been showed for three selected

179
soils Coney Green, Gibson and Knowle Road soils at day (1) and week (8) amended
by varying ratios of crude oil; (0, 2, 8 %w/w). In general, the highest values of TC
produce minimum values of k-1. The dissociation rate K-1 represents the inverse of Tc,
therefore embraces the capacity of the labile trace metals on the solid phase to
dissociate and release into soil solution (Zhang et al., 2006). For three soils K-1 values
were substantially variables with crude oil treatment.
Cobalt (Co). For Co, in Coney Green and Knowle Road soils, K-1 values with
increasing crude oil treatments exhibited similar trends at day (1) and week (8). The
values were increased at 2% w/w crude oil treatment then decreased with increasing
crude oil treatments. For Gibson soils, the K-1 decreased gradually with increasing
crude oil amendment and incubation time. The pattern of k-1 values for three soils with
and with no oil at day (1) and week (8) showed no significant differences and ranged
between (1.8 x 10⁻³ s-1 and 2.3 s-1). This indicates that the slight differences in obtained
Tc values above are may be as a result of the increased concentration of Co species
supplied by crude oil amendments rather than kinetic effects. The trend changes with
crude oil amendments in three soils at day (1) and week (8) incubation, which could be
an evident for the influence of crude oil contamination on the Kinetics of Co
exchange.

180
Figure 5.6. Dissociation rate, K-1 estimated for Co, Ni, Cu, Zn, Cd and Pb using DIFS at day (1) and week (8) of three studied soils impacted with different concentrations of crude oil, (0, 2, 8 % w/w).
Nickel (Ni). For Ni, the estimated K-1 values show an inverse relationship when
compared to the Tc values in the Table 5.6. For Cony Green soil, during incubation
time, the slow decrease in Ni species desorption rate (k−1) from solid to solution phase
0.00000
0.10000
0.20000
0.30000
0.40000
0.50000
0.60000
0.70000
Co Ni Cu Zn Cd Pb
K-1
(/s)
Metals species
Day (1), Coney Green soil0% (w/w) crude oil2% (w/w) crude oil8% (w/w) crude oil
0.00000
0.50000
1.00000
1.50000
2.00000
2.50000
Co Ni Cu Zn Cd Pb
K-1
(/s)
Metals species
Week (8), Coney Green soil
0.00000
0.02000
0.04000
0.06000
0.08000
0.10000
Co Ni Cu Zn Cd Pb
K-1
(/s)
Metals species
Day (1), Gibson soil
0.000000.050000.100000.150000.200000.250000.300000.350000.40000
Co Ni Cu Zn Cd Pb
K-1
(/s)
Metals species
Week (8), Gibson soil
0.00000
0.05000
0.10000
0.15000
0.20000
0.25000
0.30000
0.35000
Co Ni Cu Zn Cd Pb
K-1
(/s)
Metals species
Day (1), Knowle Road
0.00000
0.20000
0.40000
0.60000
0.80000
1.00000
1.20000
Co Ni Cu Zn Cd Pb
K-1
(/s)
Metals species
Week (8), Knowle Road

181
in soil with no oil from (8.15 x 10⁻² s-1 to 1.13 x 10⁻⁴ s-1) was consistent with decrease
in Ni CDGT and water-soluble Ni, Figure 5.2 and Figure 5.3, indicating that labile Ni
was changed to non-labile. The K-1 values for 8% v/w oil amended–soil were
increased from 9.7 x 10⁻³ s-1 at day (1) to 0.26 s-1 at week (8), which was consistent
with the increase of CDGT-labile Ni species in soils 8% v/w oil-amended soil during
aging. The K-1 values for 2% v/w oil-amended soil showed a general decrease as
shown in Figure 5.6, but inconsistent with the increase of CDGT-labile factions of Ni
and the increase of Ni total dissolved concentrations in soil solutions. This suggests
that the increase of Ni CDGT labile species at 2% w/w oil treatment as described above
are may be attributed to the increase of spiked Ni concentration or Ni release from oil
rather than kinetic effects (Lehto et al., 2006; Zhang et al., 2006).
For Gibson soil, at day (1) and week (8) there was a slight decrease in K-1
values for soil with and with no oil with incubation time and inversely related to Tc
values in Table 5.6, which is consistent with decrease of Ni labile species in CDGT and
in soils solution.
For Knowle Road soil, the K-1 values of Ni at day (1) were gradually decreased
with increasing crude oil contamination from (0.048 s-1 to 0.012 s-1). At week (8), the
K-1 values were increased at 2% w/w oil treatment from (1.3 x 10⁻³ s-1 to 0.3 s-1) then
decreased slightly to 0.2 s-1. This is consistent with the measured concentrations of Ni
in CDGT and soil solutions.
Copper (Cu). The K-1 values of Cu for three soils with and with no oil exhibited
substantial variations at day (1) and week (8) as shown in Figure 5.6. It is likely that
the differences to Tc values following treatment again because of the increased
concentration of Cu or oil ligands instead of kinetic influences. This is also consistent
with obtained concentrations of Cu in CDGT and soils solutions.
182
Zinc (Zn). The K-1 values of Zn for Coney Green soil at day (1) were increased
gradually with increasing crude oil. At week (8) the values of K-1 were increased at
2% w/w oil treatment from (0.07 s-1 to 0.352 s-1) then decreased to 0.08 s-1 with
increasing of oil treatment. These values are inconsistent with the decreases of Zn
labile species in CDGT probably due to the competition between organic ligands in soils
with those from oil amendments rather than kinetic influences.
For Gibson soil at the K-1 values day (1) very low and decreased gradually
from 4.7 x 10⁻⁵ s-1 to 8.0 x 10⁻⁶ s-1. At week (8) the K-1 values are larger than those in
day (1) and decreased from (0.14 s-1 to 2.5 x 10⁻³ s-1). The K-1 values at week (8)
inconsistent with increases of Zn concentrations in DGT and in soil solutions with
increasing crude oil amendment, probably due to the release of Zn species from crude
oil or sorbed to the weakly sites in soils. For Knowle Road soil, the K-1 values were
increased gradually with increasing oil amendment and incubation time at day (1) and
week (8), which is consistent with decreases of Zn concentrations in DGT and soils
solutions. The K-1 values of three soils with and with no oil amendment were inversely
related to Tc values. The reductions in availability of added Zn with incubation time
probably attributed to the conversion of Zn species into more stable FeOx–Zn or Zn-
ligands (Ma and Uren, 2006).
Cadmium (Cd). The K-1 values at day (1) and week (8) for three soils with and with
no oil treatment were very low, ranged from 1.07 x 10⁻⁶ s-1 to 3.9 x 10⁻² s-1. These
results were constent with the measured cocmntrations of Cd in DGT and soil
solutions. The values showed inverese relatioship with TC values in three soils.
Lead (Pb). For Coney Green and Knowle Road soils with and with no oil, the K-1
values of Pb at day (1) were very low, 1.58 x 10⁻⁵ s-1 to 3.2 x 10⁻³ s-1. At week (8) the
183
K-1 values were not determined because Kd values were below dection limit (BDL) as
discussed above in section 5.3.5.
For Gibson soils, the K-1 values of Pb at day (1) and week (8) were gradually
increased with increasing crude oil treatment. During incubation time, the K-1 values
consistent with decrease in Pb CDGT and water-soluble Pb, indicating that labile Pb
was changed to more stable Pb-ligands and not labile.
From above it can be obsereved that the trend changes for K-1 values of studied
metals in three selected soils were influenced by crude oil amendemnets and aging
time. It is expected that because the duration of the experiment is only (8) weeks, there
was insufficient time for treatments to significantly influence kinetic parameters.
From the above discussion, a comparison of two different rates (2% and 8%)
v/w of applied crude oil often showed no significant changes for Coney Green and
Knowle Road soils on the concentration of Cd and Pb in soil solutions and DGT.
Thus, it is necessary to mention that the applied concentrations (1% and 2% v/w) were
insufficient in some cases for such enormously contaminated soils, where intensive
competition and strong ligand formation during sorption of studied metals was
recorded.
5.4. Conclusion
The present work showed the effect of crude oil and aging on the trace metals
availability in soils of different properties. Both factors were found to significantly
influence the measured metal concentrations of DGT-labile, extractable by CaCl2 and
soil solutions. It can be indicated that the measurement of studied metals species by
DGT applied to soil solution for a described time corresponds to a small species of the
total metal. In this study low proportion of the total Cd and Pb present in the soil
solutions of the three studies soils with and without oil. Increases of crude oil

184
treatments in soils promoted the formation of non-labile species of Cu and Pb and
limited the availability of both metals. The time scales of the kinetic exchanges
obtained from DGT measurements and DIFS modelling was reflected by the range of
determined Tc values: from seconds to 3 hours. The study showed that Co, Cu, Ni and
Zn are supplied rapidly from the solid phase to soil solutions that the DGT
measurements do not affected by supply kinetics. The distribution coefficients (Kd), is
an index studied metal’s potential mobility. The greater the Kd values of metal mean
the stronger of its sorption onto the soil surfaces, and therefore the lower its solubility
in soil solution. The gradual decrease of Cu Kd values in three studied soils with and
without oil application during incubation time may be attributed to the strongest
tendency of Cu to be associated with the solid phase with increasing incubation time.
The Kd values of Ni were decreased with increasing of crude oil amendments in three
soils may be due to the release of Ni species from solid phase and crude oil to soil
solution.
The dissociation rate constant (k−1) from the solid phase, which indicated
dynamic process in soils, decreased with aging time. The trend changes for k-1 values
of studied metals in three selected soils were influenced by crude oil amendemnets and
aging time. The work has demonstrated that DGT technique is robust and reliable tool
that can be used to assess the effect of crude oil ligands on the concentrations of
available trace metals species in soils. Furthermore, two different applied ratios (2%
and 8% v/w) often had no significance effect on Cd and Pb labile metals
concentrations in studied soils. Therefore, it is necessary to point out that future work
need to be conducted on crude oil contaminated soils using higher concentrations and
different type of crude oil to assess the effect of oil ligands on metals speciation in
soils.

185
Chapter 6 – Assessing Water Quality and soil quality in Oman Using Developed Dynamic Speciation Technique DGT
6.1. Introduction
The present study represents an important part of research in this thesis in
regard to applying the DGT technique to the contamination of metals and crude oil in
the aquatic environment of Oman. There has been a rapid increase recently in the
economic activities along the coast of the Sea of Oman. Industries and oil refineries
around the commercial ports have great impact on marine systems and groundwaters
because of the discharge of chemical contaminants into the surrounding area. Some
research has been conducted to assess the level of trace metals and their impact on the
marine systems around Al Fahal and Sohar ports (Al-Shuely et al., 2009; Al-Husaini et
al., 2014). These studies indicated that the trace metals of considerable concern were
Cu, Zn, Cd, Pb, Cr and V, due to their increased levels in seawaters around industrial
regions, oil spills during shipping, terminal transfers, or discharge point of refineries
(Al-Shuely et al., 2009; Baawain, 2011; Al-Husaini et al., 2014). However, no study
has been done to measure the speciation of metals and to assess the effect crude oil
ligands on the availability of metals in marine systems and surrounding areas.
Moreover, so far very little data on trace metals concentrations and speciation have
been published for the Sohar Industrial Region (SIR) and Al Fahal port in the
Sultanate of Oman. Bazzi (2014) measured the total concentrations of heavy metals
Cu, Zn, Pb, Cd, Cr, Ni, fe and Mn in coastal waters along the Oman Sea and they were
ranged between 3.37 to 5.74, 18.01 to 22.62, 4.24 to 4.52, 0.15 to 0.19, 20.16 to 21.46,
16.42 to 17.14, 15.43 to 24.76 μg/L and 7.06 to 8.67 μg/L, respectively. The highest
186
values of heavy metals were observed during summer and the lowest during winter
due to high levels of industrial and domestic discharges (Bazzi, 2014). Study by Al-
Rashdi and Sulaiman (2013) assessed the presence of heavy metals Fe, Al, Ni, Zn, Cr,
Co, Cu, Pb in farm soils and alfalfa around Sohar Industrial Region, (SIR). The heavy
metals content in the soils were high but within the permissible limits of the USEPA
standards (Al-Rashdi and Sulaiman, 2013). Al-Shuely et al. (2009) investigated
environmental status of coastal sediments, with respect to heavy metals content around
(SIR). The study found that Cr, Ni and Mn were high at some sites.
Therefore, it is important to introduce the dynamic speciation technique as a
new robust tool for the assessment of labile metals in Sohar and Rusail industrial
regions, and Al Fahal port, to understand and to prevent metal contaminations in that
area. Firstly, because most regions in Sultanate of Oman heavily upon the
groundwaters and seawater as a source of irrigation and fresh water through
desalination (de Mora et al., 2004). Furthermore, to determine the contribution of oil
refineries and industrial areas to the trace metals loads in marine and groundwaters.
Moreover, the simultaneous determination of labile concentrations of arsenic (As),
molybdate (Mo), antimonite (Sb), vanadate (V), selenium (Se), and tungstate (W) in
these areas, also need to be determined to assess the contribution of oil contamination
on oxyanions trace metals availability in dominant anthropogenic activities, and
alterations in the organic and inorganic ligands concentrations.
The determination of trace metal concentrations and chemical form
(speciation) is challenging in the Sea of Oman around Sohar Industrial Region (SIR)
and Al Fahal port due to their complex chemistry, oil ligands matrix, high salinity, and
frequent occurrence at low concentrations. According to data obtained by Al-Shuely et
al. (2009) using HNO3 acid extraction, to investigate the environmental status of

187
coastal sediments, with respect to heavy metals content around (SIR), can appear the
high total content of As, Ni, Mn and Cr attributed to industrial effluents from (SIR)
(Al-Shuely et al., 2009). However, there is no information about the background
concentrations of trace metals fractionation in the Sea of Oman; in particular, no
published data for the economic ports.
The concentration of metals species in natural waters is influenced by dynamic
interchanges rather than existing in a regular equilibrium situation. Therefore,
collecting a volume of water samples will not represent the real situation as it affect
the balanced physical and chemical processes that govern the distribution of trace
metals (Gimpel et al., 2003). For in situ measurements, without transferring water
samples to the laboratory, a reliable and robust technique is highly sought after. Few
techniques are available that can be applied easily in the field apart from DGT.
The DGT is a simple, reliable, and robust dynamic technique that can be
deployed in situ in groundwater, seawater, rivers, sediments and soils (Zhang and
Davison, 1995; Zhang and Davison, 2000).
The aim of this study is to apply DGT technique in Oman environments and to
assess the water quality and the soil quality in selected areas. Measure the labile
concentrations of Cu, Ni, Co, Zn, Pb, Cd, Al, Fe, Mn, Cr, As, Sb, Se, W, Mo and V by
deploying DGT with Chelex as binding layer and DGT with ferrihydrite as binding
layer. Simultaneous deploy DGT with different membranes, OP-DGT, (1000
MWCO)-DGT, (Nafion112)-DGT for further speciation measurements. It is crucial to
obtain more complete speciation information and to understand fully the geochemical
cycling and bioavailability of trace metals in the Sea of Oman. The DBLs thicknesses
were determined in seawater locations and in groundwaters (6 wells) by deploying
DGT devices containing four varying hydrogel thicknesses.
188
Deploy DGT in soils near SIR, and in sediments in Al Fahal port near the
discharge point to assess the available metal concentrations and their resupply from
soild phase to solution. The DIFS model was used for soils to estimate Tc (response
time) and k-1 (dissociation rate). The information provided in the study will contribute
to generating frameworks, standards, and regulations that will assist in the
development of criteria for protecting the Omani environment.
6.2. Experimental and Field Deployments
6.2.1. Description of the study area
Two economic ports: Al Fahal port and the Rusayl Industrial Estate located in
the Muscat region, and SIR and Sohar ports in the Al Batinah in the Sultanate of
Oman, were chosen for this study. They occupy an important location on the Coast of
the Sea of Oman. Al Fahal port is located in the Muscat region at about 23°39′N.,
58°32′E., and Sohar port in Al Batinah region is sited at about 24°23′N., 56° 45′E
(L.L.C., 2010; NATIONAL GEOSPATIAL-INTELLIGENCE AGENCY Springfield,
2014). Mina Al Fahal is a significant harbour located in Muscat. It comprises three
Single Buoy Mooring (SBM) Systems named SBM1, SBM2, and SBM3, which are
located at separate sites throughout the harbour, see Figure 6.1 (Badawy et al., 1992;
Al-Husaini et al., 2014).
The industrial and port areas were selected for their crude oil activities.
Moreover, as Muscat port (Mina Qaboos) is to be converted into a tourism area, all
shipping activities were transferred by the end of August 2014 to Sohar port, which
led to an increase in trade and anthropogenic activities in the Sohar Industrial Region
(SIR) (Potter, 2014). Approximately 90% of the Sohar port catchment is industrialised,
and developments include refineries, petrochemical industries, heavy industries, iron
and aluminum works, commercial and marine shipping facilities (Costenla, 2014).
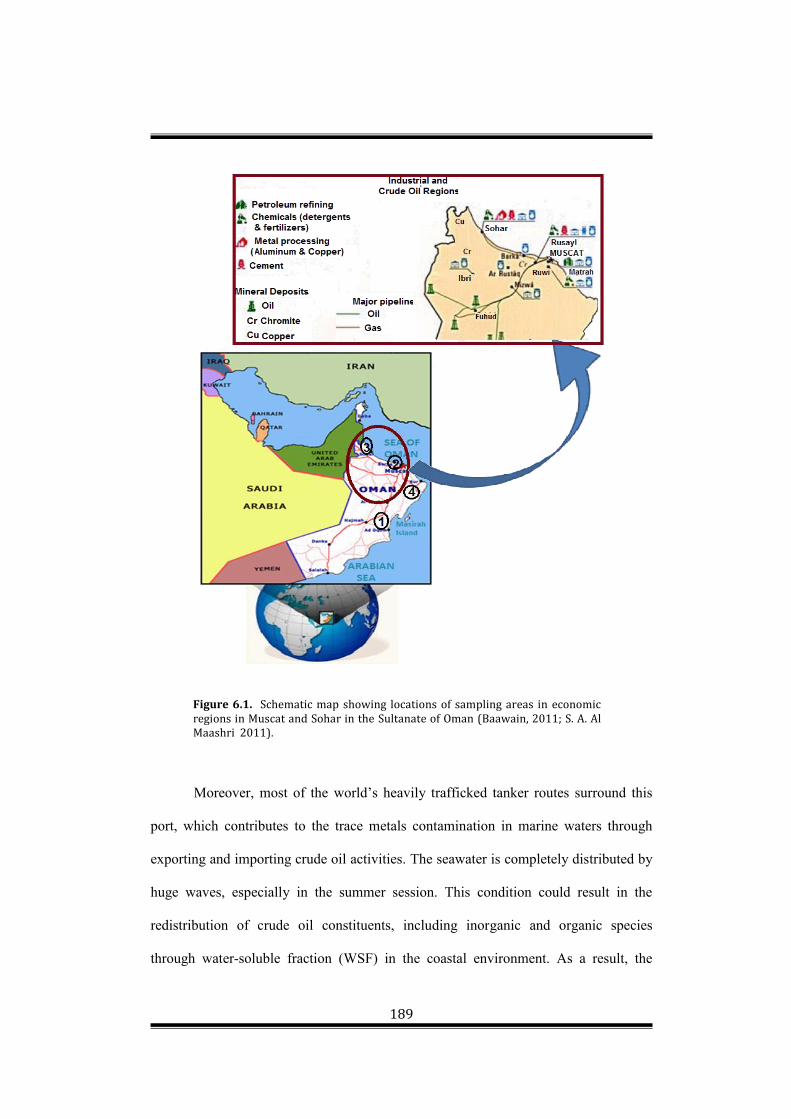
189
Figure 6.1. Schematic map showing locations of sampling areas in economic regions in Muscat and Sohar in the Sultanate of Oman (Baawain, 2011; S. A. Al Maashri 2011).
Moreover, most of the world’s heavily trafficked tanker routes surround this
port, which contributes to the trace metals contamination in marine waters through
exporting and importing crude oil activities. The seawater is completely distributed by
huge waves, especially in the summer session. This condition could result in the
redistribution of crude oil constituents, including inorganic and organic species
through water-soluble fraction (WSF) in the coastal environment. As a result, the
190
elevated inorganic and organic discharges will put strong pressure on marine waters
and coastal areas. Thus, it is necessary to ascertain to what extent those inputs can
impact the water quality around the economic ports. The sampling areas included
seawaters, groundwaters, soils, and sediments at both areas. The sampling site for
wells is at 300-500 meters from each port area and indusrial region. A number of
sediments and coastal soils were collected to evaluate the effect of anthropogenic
sources on the environment quality around the economic ports.
6.2.2. Chemicals and Materials
All types of DGT devices (OP-DGT, (1000 MWCO)-DGT, (Nafion112)-DGT
and FH-DGT), containing varying diffusive gel thicknesses (0.014 (filter membrane),
0.039 cm, 0.08 cm, 0.196 cm) were prepared as described in Chapters 3 and 4.
Chemicals and materials needed for field work also include Milli-Q water (high purity
water, Milli-Q water system, provided by SQU, Sultanate of Oman), HNO3 (BDH
ARISTAR® ULTRA, high purity acid for quantitative trace metals analysis), fish cage
for protecting DGT devices in seawater, clean cool box with ice to protect samples and
DGT devices, acid washed syringes, cellulose nitrate filters (0.45 µm porosity), acid
washed 1 L bottles for collecting water samples and cylinder measurement. A
thermometer, a pH and conductivity meter, were provided by the Food and Water
Laboratories Center (FWLC) in Muscat, Sultanate of Oman. All bottles, DGT
samplers, filters, filtration devices and containers for trace metal analysis were
carefully acid washed in 10% (v/v) HNO3 (ARISTAR grade, Merck) for 24 hours and
rinsed thoroughly with Milli.Q water before use, and were protected during transport
with clean polyethylene plastic bags. All handling was performed with plastic gloves.

191
6.2.3. Field deployments and sample collections The DGT devices were deployed in December 2014 and January 2015 in sites located
in Muscat (Al Fahal port and Rusayl Industrial Estate) and Sohar (SIR and Kadafan).
6.2.3.1. Deployment in seawater The DGT deployments were carried out at Al Fahal port in Muscat and Sohar
port (SIR). Four types of DGT samplers (OP-DGT, (1000 MWCO)-DGT,
(Nafion112)-DGT and FH-DGT) were deployed in triplicates at two locations 300
meters from each other at each site. Twelve DGT samplers containing varying
hydrogel thicknesses (0.014 cm (only filter membrane), 0.039 cm, 0.08 cm, 0.196 cm)
for estimating DBL thicknesses were deployed at both sites at each location. The DGT
devices were deployed for 5 days at ≈ 1–1.5 m beneath the seawater surface by being
fastened to the outside of large fish net cages Figure 6.2.
The DGT units were fastened using a clean fishing rope attached inside the
cage, and had a weight of 30 kg at the end of the rope attached below the cage. Floats
and a 5 kg floating buoy on the surface were used for flagging, also a light was
fastened to it. The parameters including pH, conductivity, temperature, and salinity
were measured daily at all locations in Muscat and Sohar using a conductivity/pH
meter, thermometer, and thermosalinometer.
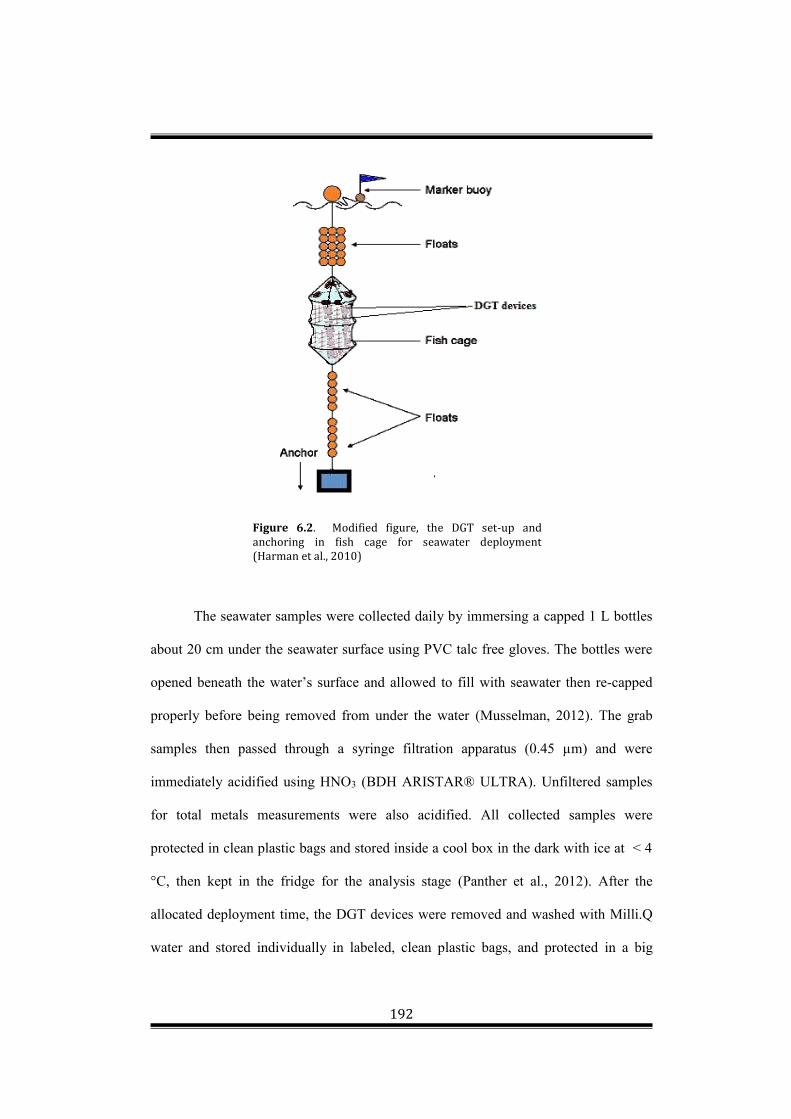
192
Figure 6.2. Modified figure, the DGT set-up and anchoring in fish cage for seawater deployment (Harman et al., 2010)
The seawater samples were collected daily by immersing a capped 1 L bottles
about 20 cm under the seawater surface using PVC talc free gloves. The bottles were
opened beneath the water’s surface and allowed to fill with seawater then re-capped
properly before being removed from under the water (Musselman, 2012). The grab
samples then passed through a syringe filtration apparatus (0.45 µm) and were
immediately acidified using HNO3 (BDH ARISTAR® ULTRA). Unfiltered samples
for total metals measurements were also acidified. All collected samples were
protected in clean plastic bags and stored inside a cool box in the dark with ice at < 4
°C, then kept in the fridge for the analysis stage (Panther et al., 2012). After the
allocated deployment time, the DGT devices were removed and washed with Milli.Q
water and stored individually in labeled, clean plastic bags, and protected in a big

193
clean plastic bag in a cool box in ice at < 4°C, and then transferred to the fridge and
kept until further laboratory treatments.
6.2.3.2. Deployment in groundwaters The assessment of groundwaters quality in the present work was carried out by
selecting six open wells near industrial areas and economic ports, three open wells at
each site, representing localities around the industrial areas in Muscat and Sohar
regions. The wells were located at 300 – 500 meters from industrial areas and about
150 meters from each other. The investigation was achieved by deploying in triplicates
the same set of the above DGT devices at each open well water. The DBL thicknesses
at each well water were determined using DGT devices containing different
thicknesses of diffusion layer following procedures in Warnken et al. (2006). The
DGT devices were fastened by fishing rope (Polypropylene rope) and attached to a
float and weight, and deployed 50 cm below the water surface for 5 days. A rope was
used to attach a weight to a clean acid washed 1 L bottle (Figure 6.3). The bottle was
carefully uncapped to avoid the entry of dust or any contamination. The weighted
bottle was lowered into the well and immersed under the water surface without
touching the bottom or sides of the well, or moving the sediment (Bartram and
Ballance, 1996).
Figure 6.3. Collecting well water samples by lowering a weighted bottle into an open well (Bartram and Ballance, 1996)
194
Temperature, salinity, conductivity (EC), and pH parameters for each open
well were measured daily during DGT deployments for each site. Unfiltered well
waters for total metals measurements and 0.45 µm filtered grab water samples were
collected daily in an acid cleaned 1 L bottles during DGTs deployments. The grab
samples were immediately acidified to 2% HNO3 after passing through an acid washed
syringe filtration apparatus as described above. The blank values of metals at each
deployment location was obtained by analysing the Chelex-100 resin gel in 4 or 5
blank DGT devices (not deployed in water samples), which are prepared in the same
way.
Samples analysis. After returning to the laboratory, the DGT devices were opened,
and all binding layers carefully removed using clean tweezers. They were then
transferred to the clean 1.5 centrifuge tubes and 1 ml of 1 M HNO3 was added to each
tube for elution and left for 24 hours prior to ICP-MS analysis. For the ICP-MS
analysis, an aliquot of 0.1 ml was taken from each tube and diluted 10 times. The
groundwaters samples were diluted 10 times; however, seawaters samples were
diluted 50 times for IC-PMS analysis to minimise the effect of chloride and Na
suppress in the seawater due to high ionic strength, as referenced in Chapters 3 and 4.
6.2.3.3. Collection of sediments and DGT deployments.
Marine sediments from nine locations at two sites were collected around
discharge points of the Mina Al Fahal oil refinery. Surface water was collected from
the same locations. The collected samples were kept at about < 4°C and transported
immediately to the laboratory for deployment. All sediments were homogenised and
distributed carefully into nine clean containers to obtain a 2-2.5 cm layers of
subsamples. The collected surface water samples were poured carefully on to all
sediments in containers to make a 5 cm overlying layer of seawater. The sediments
195
were left for 4 days to equilibrate at 23±0.25°C in the laboratory. The overlying
seawater in all selected sediments in containers was slowly and carefully removed to
preserve the natural state of the sediment water interface (SWI) as much as feasible
(Gao et al., 2012). Two versions of DGT devices (OP-DGT and FH-DGT) were
immersed 1 cm deep into prepared sediments (Roulier et al., 2010; Gao et al., 2012).
The DGT units were deployed for 5 days, and the average temperature measured was
21±0.5°C. After 5 days, the DGT devices were removed from the sediments and
washed using Milli.Q water to remove sediment particles. After the devices being
opened, the Chelex-100 gel and the ferrihydrite gel were transferred to 1.5 centrifuge
tubes and eluted with a 1 ml of 1M HNO3 solution for 24 hours. The pore waters were
extracted by centrifuging sediments at 3000 rpm for 15 minutes, then 1 ml for each
sediment passed through a Acrodisc 0.45 μm, syringe filter (Whatman), and acidified
with 10 μL of 7 M HNO3 (Nitric Acid, BDH ARISTAR® ULTRA) (Gao et al., 2012).
6.2.3.4. Collection of soils and DGT deployment.
The contribution of an oil refinery and industrial region in Sohar on trace
metals loads was studied in coastal soils near (SIR). Fifteen soils were collected in
January 2015 from two sites around SIR to assess the environmental status of its
coastal soils with respect to trace metals fractionation south and north of SIR, as
shown in Figure 6.4. Two versions of DGT samples, OP-DGT and FH-DGT, were
used as described above in the experimental section. Sandy coastal soils were collected
from fifteen locations about 400 meters the distances between each other, from the top
of 40 cm of each location around Sohar port and industrial area, and brought to the
laboratory. They were air dried and sieved to 2-mm, and stored in plastic containers
before use. The soils’ maximum water holding capacity (MWHC) was determined in
the laboratory, as described in Chapter 5.

196
Figure 6.4. Modified map of soils sampling locations in (SIR) (Al-Shuely et al., 2009).
Soil samples were prepared for DGT deployments using 200 g of each soil
sample and appropriate amounts of Milli.Q waters were added to bring samples soils
to 40%-60% (MWHC); They were left for 1 day before further water added to reach
about 80% of MWHC. The soils were equilibrated for further 24 hours before DGT
deployment. The temperature was maintained at 22±2°C, and two OP-DGT and FH-
DGT versions were deployed for 16 hours (Zhang et al., 1998; Liang et al., 2014). The

197
DGT devices were removed from soils and washed by rinsing with Milli.Q water and
eluted as described above. All samples were diluted 10 times for ICP-MS analysis.
6.3.3.5. Properties of soils Organic carbon content (%OC)
Traditional method of loss on ignition (LOI) was performed to obtain the
organic carbon content. 10 g of dried soil sample was placed in a clean porcelain
crucible and baked at 450 ºC for 16 hours in a furnace. Then the sample was re-
weighed immediately after cool down to room temperature. The percentage of organic
matter was calculated using the following equation (6.1):
%OC =
× 100 (6.1)
Soil pH
The pH of all soils was measured in a suspension of soil and calcium chloride
(CaCl2) solution, as described in Chapter 5. Solution mixture of 25 ml Milli.Q water
and 2 ml of 0.125 M CaCl2 was added to 10 g of dried soil in a 50 ml polyethylene
beaker. They were mixed and stirred vigorously using a glass rod and left for 30
minutes to stand. The pH of the solution was determined by pH meter, taking care to
avoid contacting the electrode with the settled soil particles.
Total metals content
All collected soil samples were acid digested by pressurised microwave for
metals extraction in soils. The soil digestion was followed by procedure in SW846-
3051 method (CEM, 1991). Approximately 0.5 g of each soil sample was weighted
into acid washed Teflon microwave vessels followed by adding 10 ml 69%

198
concentrated nitric acid (HNO3). Two acid blanks of the same matrix were also
included in the experiment. The containers were sealed and placed in the microwave
for heating for 10 minutes. They were then carefully removed from the microwave and
left to stand for 2 hours. The digestion vessels were opened, and diluted five times by
solubilizing 2 ml of the digests in 10 ml of Milli.Q water, and then filtered with
0.45μm qualitative cellulose filters. The filtrates were diluted 10 times for ICP-MS
analysis.
6.3.3.6. Calculation of kinetic parameters using DIFS
The metal concentrations in soil solution were measured after DGT
deployments to estimate the ratio of CDGT to Csoln using the following equation (6.2):
𝑅 = (6.2)
Kinetic parameters, response time (Tc) and rate constant of dissociation (k-1), as
mentioned in Chapter 5, were estimated from measurements of (R) values and Kd
using DIFS model.
6.4. Results and Discussion
6.4.1. Metal concentrations and speciation in seawater
Water samples from studied locations (seawaters and groundwaters) were
collected daily at the DGT deployment sites and the salinity, pH, conductivity, and
temperature were measured and presented in Table 6.1.

199
Table 6.1. Parameters for ten sampling locations in Muscat and Sohar regions.
Parameters Muscat Sohar Site Seaw
ater-L1
Seawater-L2
Well-1 Well-2 Well-3
Seawater-L1
Seawater-L2
Well-1
Well-2
Well-3
Salinity 36.7 36.4 4.5 5 1.8 36.6 36.68 10.5 17 10
Conductivity (µS/cm)
50000 49500 8150 8879 3310 51000 49700 18500 28350 18355
Temperature (C)
23 22 28 26 27 23 24 29 27 30
pH 8.2 8.3 6.52 7.3 6.8 8.083 8.1 7.8 7.3 6.7
6.4.1.1. Measurements of DBL
The DGT devices containing varying thicknesses of diffusive gel (0.014 cm
(only filter membrane), 0.039 cm, 0.08 cm, 0.196 cm) were deployed in triplicates for
five days in two locations in seawater in Al Fahal port and (SIR) to determine the
thicknesses of the diffusive boundary layer (DBL, δ) using equation (6.3) (Warnken
et al., 2006).
𝛿 = (6.3)
The plots of inversed mass accumulated by DGT devices 1/mass (ng-1) versus ∆g (cm)
of metals Cd, Cu, Ni and Co showed a good linearity of regressions with R2 values
ranging between 0.9940 – 0.9987 despite low mass accumulated (Figure 6.5).
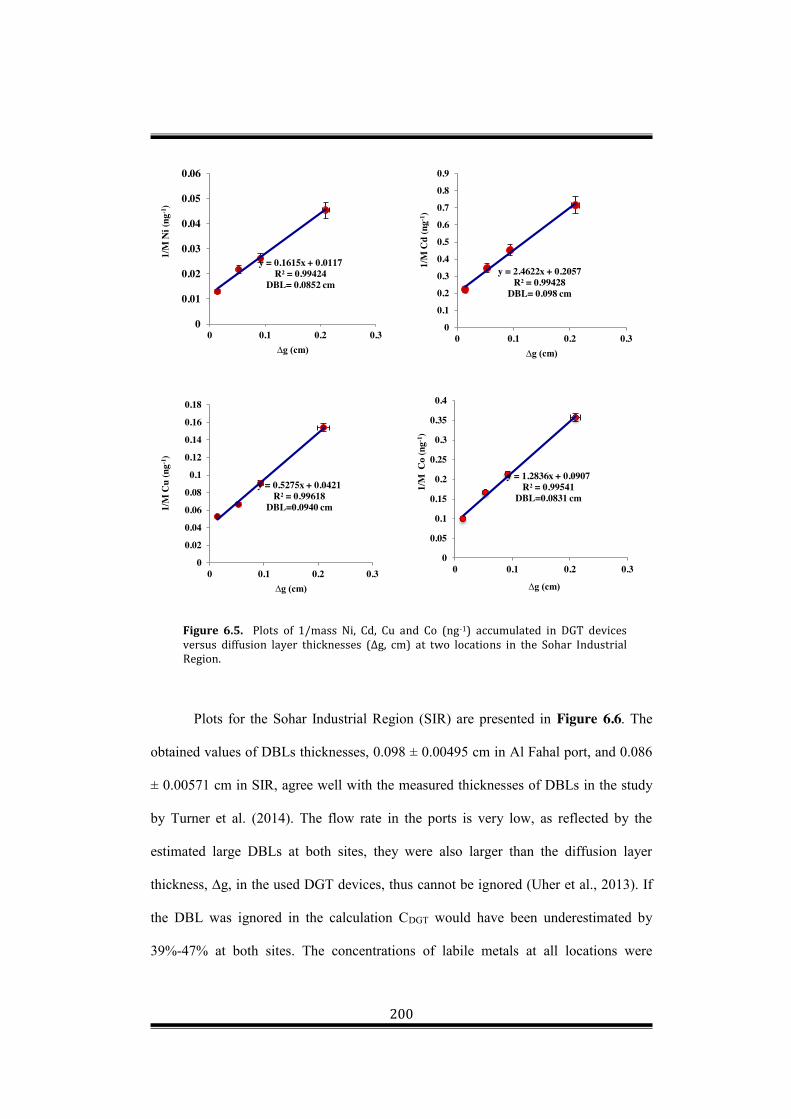
200
Figure 6.5. Plots of 1/mass Ni, Cd, Cu and Co (ng-1) accumulated in DGT devices versus diffusion layer thicknesses (∆g, cm) at two locations in the Sohar Industrial Region.
Plots for the Sohar Industrial Region (SIR) are presented in Figure 6.6. The
obtained values of DBLs thicknesses, 0.098 ± 0.00495 cm in Al Fahal port, and 0.086
± 0.00571 cm in SIR, agree well with the measured thicknesses of DBLs in the study
by Turner et al. (2014). The flow rate in the ports is very low, as reflected by the
estimated large DBLs at both sites, they were also larger than the diffusion layer
thickness, ∆g, in the used DGT devices, thus cannot be ignored (Uher et al., 2013). If
the DBL was ignored in the calculation CDGT would have been underestimated by
39%-47% at both sites. The concentrations of labile metals at all locations were
y = 2.4622x + 0.2057R² = 0.99428
DBL= 0.098 cm
0
0.1
0.2
0.3
0.4
0.5
0.6
0.7
0.8
0.9
0 0.1 0.2 0.3
1/M
Cd
(ng-1
)
∆g (cm)
y = 0.1615x + 0.0117R² = 0.99424
DBL= 0.0852 cm
0
0.01
0.02
0.03
0.04
0.05
0.06
0 0.1 0.2 0.3
1/M
Ni (
ng-1
)
∆g (cm)
y = 0.5275x + 0.0421R² = 0.99618
DBL=0.0940 cm
0
0.02
0.04
0.06
0.08
0.1
0.12
0.14
0.16
0.18
0 0.1 0.2 0.3
1/M
Cu
(ng-1
)
∆g (cm)
y = 1.2836x + 0.0907R² = 0.99541
DBL=0.0831 cm
0
0.05
0.1
0.15
0.2
0.25
0.3
0.35
0.4
0 0.1 0.2 0.3
1/M
Co
(ng-1
)
∆g (cm)
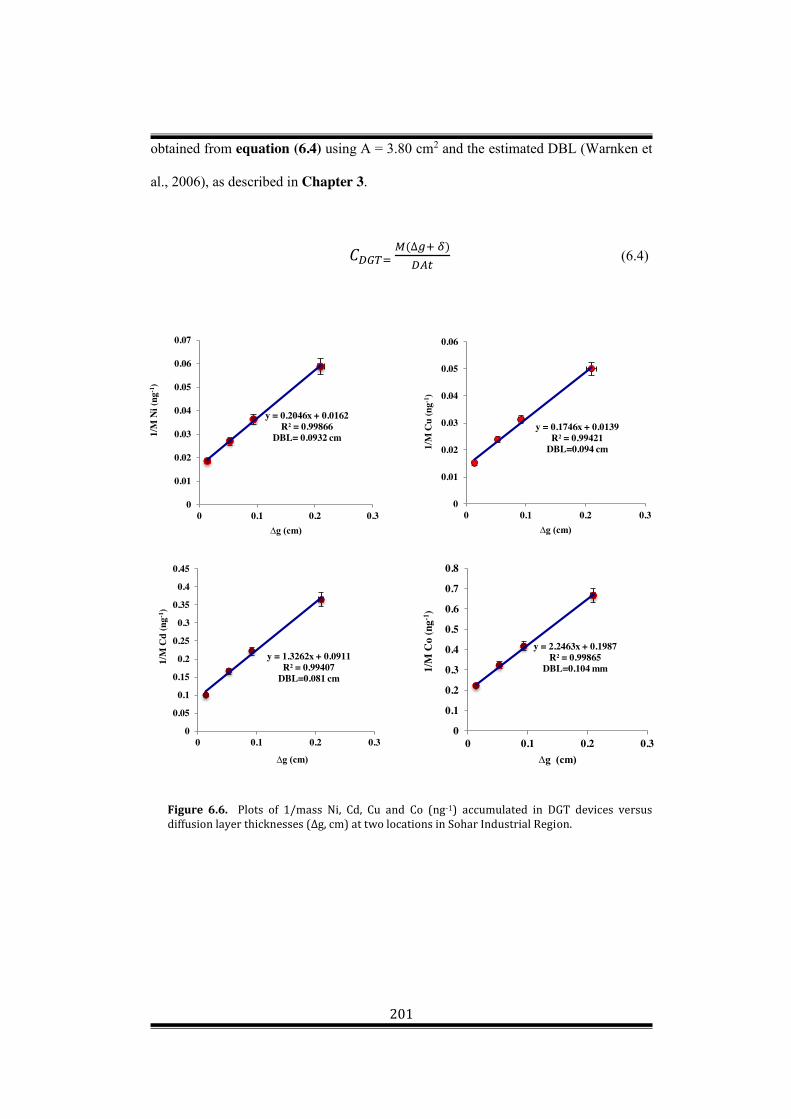
201
obtained from equation (6.4) using A = 3.80 cm2 and the estimated DBL (Warnken et
al., 2006), as described in Chapter 3.
𝐶 (∆ ) (6.4)
Figure 6.6. Plots of 1/mass Ni, Cd, Cu and Co (ng-1) accumulated in DGT devices versus diffusionlayerthicknesses(∆g,cm)attwolocationsinSoharIndustrialRegion.
y = 0.2046x + 0.0162R² = 0.99866
DBL= 0.0932 cm
0
0.01
0.02
0.03
0.04
0.05
0.06
0.07
0 0.1 0.2 0.3
1/M
Ni(
ng-1
)
∆g (cm)
y = 1.3262x + 0.0911R² = 0.99407
DBL=0.081 cm
0
0.05
0.1
0.15
0.2
0.25
0.3
0.35
0.4
0.45
0 0.1 0.2 0.3
1/M
Cd
(ng-1
)
∆g (cm)
y = 0.1746x + 0.0139R² = 0.99421
DBL=0.094 cm
0
0.01
0.02
0.03
0.04
0.05
0.06
0 0.1 0.2 0.3
1/M
Cu
(ng-1
)
∆g (cm)
y = 2.2463x + 0.1987R² = 0.99865
DBL=0.104 mm
0
0.1
0.2
0.3
0.4
0.5
0.6
0.7
0.8
0 0.1 0.2 0.3
1/M
Co
(ng-1
)
∆g (cm)

202
6.4.1.2. Speciation of cation metals
The metals speciation in Oman Sea at Al Fahal and (SIR) ports were assessed
by deploying in triplicates three versions of DGT samplers, OP-DGT, (1000 MWCO-
dialysis)-DGT and (Nafion112)-DGT in the same seawater locations at the same time.
The measured labile species of all trace metals studied in both ports locations (1 and 2)
except (Zn in L2-AlFahal) and (L1 and L2 in SIR) were much lower and did not agree
with the 0.45 μm filtered measurements obtained from grab samples (CSol (0.45μm)), as
shown in Figure 6.7 and Table 6.2. This is attributed to the influence of crude oil
activities in the ports regions releasing high concentrations of Zn into the seawaters.
For Al and Fe, the measured concentrations of labile species in OP-DGT at
both selected locations in (SIR) are 7.5±0.42 µg/L - 10±1.07 µg/L and 19.5± 0.67
µg/L - 26 ±1.31 µg/L, and Al Fahal port are 7±1.27 - 9±1.04 µg/L, respectively. The
percentages of measured labile metal by OP-DGT- account in locations of AlFahal
port for 4%-5% Al and 9%-13% Fe, whereas 2%-6.5% Al and 10.4%-20% Fe for
(SIR) locations, respectively as illustrated in Figure 6.7. This reflects the presence of
strong complexing ligands from refinery industries bound with both metals and unable
to dissociate fast within the time scale to be taken up by the resin (Mengistu et al.,
2012). More than 97% of Al and 94% of Fe were non-labile fractions in 1000 MWCO-
dialysis and Nafion112 at all the selected seawaters locations in Al Fahal and (SIR)
ports. This indicated that the dissolved both metals fractions were dominated by
negatively charged organic ligands and large molecular weight (>1000 MWCO)
ligands, which are excluded by the membranes (Panther, Bennett et al. 2012, Liu, Lead
et al. 2013). At (SIR) the obtained concentrations of labile trace metals of Al and Fe
by OP-DGT samplers at both locations are slightly higher than the locations studied at
the Al Fahal port site, which is consistent with the presence of industrial discharges

203
around the main economic activities in Sohar port (Figure 6.7). The obtained Fe labile
species in SIR locations were slightly higher than those measured in Al Fahal port
locations reflecting the presence of more aromatic organic complexes and colloids
near SBM3 oil refinery area at selected locations in Al Fahal port (Al-Husaini et al.,
2014).
Figure 6.7. Measured labile metal concentrations by OP-DGT, (1000 MWCO-dialysis)-DGT and (Nafion112)-DGT at four locations of seawaters in the Al Fahal port and SIR.
0
2
4
6
8
10
12
14
16
18
20
Al Cr Mn Fe Co Ni Cu Zn Cd Pb
CD
GT
(µg/
L)
Metals species
Al Fahal refinery port (Muscat)-L-1
OP-DGT Dialysis-DGT Nafion-DGT
0
2
4
6
8
10
12
14
16
18
20
Al Cr Mn Fe Co Ni Cu Zn Cd Pb
CD
GT
(µg/
L)
Metals species
Al Fahal refinery port (Muscat)-L2
0
5
10
15
20
25
30
Al Cr Mn Fe Co Ni Cu Zn Cd Pb
CD
GT
(µg/
L)
Metals species
Sohar Harbour -L-1
0
5
10
15
20
25
Al Cr Mn Fe Co Ni Cu Zn Cd Pb
CD
GT
(µg/
L)
Metals species
Sohar Harbour-L2

204
For Cr, Co, Ni, Cu, Cd, and Pb, it can be noticed that the measured CDGT-
labile fractions of Cr, Co, Ni, Cu, Cd, and Pb using all DGT versions were in general
low with no significant difference at all selected seawater locations near refineries and
industrial activities Figure 6.7. This suggests that the labile fractions in both locations
were complexed strongly with ligands that are less dynamic and unable to dissociate
fast enough (non-labile) to be measured by the DGT sampler. On the other hand, most
concentrations of these trace metals are probably present in the forms of colloids and
complexes ligands in seawater in a similar range of sizes (Ingri et al., 2004). The
percentages of measured these metals by OP-DGT in Al Fahal port were, 7%-9% Cr,
7%-15% Co, 12%-16% Cu, 9%-11% Cd, 10%-12% Ni and 55%-68% Pb and 6%-7%
Cr, 6%-8% Co, 18%-19% Cu, 8%-13% Cd, 10%-28% Ni and 77%-82% Pb in (SIR)
Figure 6.8.
The percentages of labile Cr, Co, Ni, Cu, Cd species in (1000 MWCO-
dialysis)-DGT and (Nafion112)-DGT were very low comparing to those measured in
OP-DGT, ranging between 4.6% and 11% at all locations in selected seawaters sites as
shown Figure 6.8. The concentrations of labile species of these metals in (Nafion112)-
DGT samplers were very low and close to those values obtained in (1000 MWCO-
dialysis)-DGT devices; this indicates that most these metals complexes are large (>
1000MWCO) and most of them are negatively charged excluded by Nafion112
membrane (Blom et al., 2003; Sahu et al., 2009; Ramkumar, 2012).
The percentages of labile Pb species in (1000 MWCO-dialysis)-DGT and
(Nafion112)-DGT at all studied seawater’s locations were not significantly different;
except at location-2 in (SIR), where they were 34% and 41% respectively as shown in
Figure 6.8. This implies that Pb-complexes in location-2 in (SIR) are of small sizes
and positively charged; therefore, they diffused through Nafion112 and dialysis

205
membrane in DGT devices to be retained in resin gel. The Nafion112-DGT measured
higher percentages of Pb labile species than (1000MWCO-dialysis)-DGT in L1-
AlFahal probably due to small-sized nonlabile Pb-complexes crossing the Nafion112
membrane barrier. The Pb complexes must be neutral or positively-charged in order to
pass the Nafion112 membrane (Lam et al., 1997).
Figure 6.8. The ratios of DGT labile metal species in 0.45 µm filtered grab samples from four selected locations in Al Fahal port and Sohar Industrial Region (SIR).
For Zn, the measured OP-CDGT-labile fractions of Zn in the selected AlFahal-
location-2 and both locations in (SIR) is very close to total metal concentration in the
0
10
20
30
40
50
60
70
80
90
100
110
Al Cr Mn Fe Co Ni Cu Zn Cd Pb
%C
DG
T/C
solu
tion(
0.45
um)(g
rab
sam
lple
s)
Metal species
Al Fahal refinery port (Muscat)-L-1 OP-DGT Dialysis-DGT Nafion-DGT
0
10
20
30
40
50
60
70
80
90
100
110
Al Cr Mn Fe Co Ni Cu Zn Cd Pb
%C
DG
T/C
solu
tion(
0.45
um)(g
rab
sam
lple
s)
Metals species
Al Fahal refinery port (Muscat)-L2
0
10
20
30
40
50
60
70
80
90
100
Al Cr Mn Fe Co Ni Cu Zn Cd Pb
%C
DG
T/Cs o
lutio
n(0.
45um
)(gra
b sa
mlp
les)
Metal species
Sohar Harbour -L1
0
10
20
30
40
50
60
70
80
90
100
Al Cr Mn Fe Co Ni Cu Zn Cd Pb
%C
DG
T/C
solu
tion(
0.45
um)(g
rab
sam
lple
s)
Metal species
Sohar Harbour-L2

206
filtered grab samples (CSol (0.45 μm filtered)) with the %CDGT ranged between 82% and
111%. The agreement between CDGT-labile fractions of Zn and total fractions in the
filtered grab samples is attributed to the Zn release from oil and small ligands (size < 5
nm), which were more predominant in the DGT-labile species of Zn in locations-2
near to the most heavily trafficked oil tanker routes. Only 60% of Zn labile fractions
measured in L-1 of Al Fahal port, which reflecting the presence of large organic
ligands size (> 5nm) in the location maybe attributed to the oil organic ligands
discharged into the ballast water from the tankers anchoring near location of Al Fhal
port (Al-Husaini et al., 2014). The percentages of labile Zn species in (1000 MWCO-
dialysis)-DGT and (Nafion112)-DGT at location-2 of Al Fahal port were 98% and
82% respectively, which are also very close to the total metal content in the 0.45 µm
filtered grab samples at location-2 of Al Fahal port, and in comparison to other
selected seawater areas. This consistency could reflect the presence of total labile
content as free and organic or inorganic complexes of smaller molecular mass (< 1000
MWCO), and is positively charged compared to the other selected locations; it can be
measured by both DGT devices only in location-2.
For Mn, the Mn species in natural waters exist generally as simple inorganic
fractions due to its weak tendency to associate with organic ligands (Gimpel, Zhang et
al. 2003). The measured CDGT-labile species of Mn in the four locations were similar
to those obtained by Kersanach et al. (2009) in impacted marine waters with fertiliser,
oil and petrochemical industry activities. About 15-20% of total Mn exist in the
particulates and colloids (size > 0.45 µm), see Table 6.2. The measured concentrations
of Mn labile fractions in (1000 MWCO-dialysis)-DGT were low and ≈48% of
measured Mn species in OP-DGT at the four locations, ranging from 3.5±0.30 µg/L to
5±0.11 µg/L with no significant differences in percentages ranging between 5%-8%

207
Figures 6.7 and 6.8. This is attributed to the presence of high amounts of particulate
species and large ligands tend to form strong organic metallic fractions. The measured
Mn species in (Nafion112)-DGT were lower than (1000MWCO dialysis)-DGT at both
locations of (SIR) probably due to the presence of higher proportions of the large
negatively charged organic complexes near oil refineries, which are eliminated by the
Nafion barrier (Blom et al., 2003).
Filtration normally conducted on samples to for metals content analysis. The
difference is usually made between a water sample to be analysed for total metal
content (unfiltered) and a sample to be analysed for total dissolved metals content in
grab samples (filtered samples). Typically, a dissolved metals analysis of a water
sample can be achieved by removing the particulates with a filter membrane, followed
by analysing the filtered water for metals. The most common filters used for this
purpose have a 0.45 µm pore size (Saar, 1997). From Table 6.2 it can be seen that the
total metals content (unfiltered) at four selected locations in Oman Sea are slightly
higher than total dissolved metals (filtered) in seawaters. Similar findings obtained for
all four studied sites. Al is the highest at all locations, which is probably attributed to
the crude oil activities in the area. Pb is the lowest maybe due to the presence of oil
ligands (size >0.45µm) in selected locations able to form large and stable Pb-
complexes. Although a comparison of time-integrated DGT-labile data with 0.45 mm-
filtered data from grab samples is uncertain, it may assist in validating DGT data. For
the targeted trace metals at all locations in Al Fahal port and (SIR), filtered samples
Csol (0.45 µm) ranged from 33.3% - 92.1% of the total trace metals measurement Csol
(unfiltered) as shown in Table 6.2.

208
Table 6.2. The total metals concentrations in 0.45 mm- filtered grab samples and unfiltered samplesmeasurements(μgL−1) ratios of (Csol(0.45 µm filtered grab)/ Csol(unfiltered)) of all targeted metals in four sites of Sea of Oman.
Locations Metals Al Cr Mn Fe Co Ni Cu Zn Cd Pb
AlFahal port. L1
Csol(0.45µm) 175.0 8.0 61.0 65.0 4.0 27.0 11.0 8.0 3.6 0.7
Csol(UF) 190.0 11.0 75. 80.0 5.0 36.0 15.0 13.0 6.0 1.1
%Csol(0.45µm) 92.1 72.7 81. 81.3 80.0 75.0 73.3 61.5 60.7 62.6
AlFahal port. L2
Csol(0.45µm) 170.0 8.0 64.0 82.0 4.0 31.5 16.0 9.0 4.0 0.8
Csol(UF) 190.0 11.3 80.0 120.0 5.0 40.0 21.0 12.0 6.0 1.0
%Csol(0.45µm) 89.5 70.8 80.0 68.3 80.0 78.8 76.2 75.0 66.7 80.0
(SIR). L1
Csol(0.45µm) 173.0 10.0 75.0 106.0 4.5 36.0 21.0 11.5 4.0 0.9
Csol(UF) 197.0 13.0 86. 155. 6.0 45.0 27.0 17.0 5.7 1.1
%Csol(0.45µm) 87.8 76.9 87.2 68.4 75.0 80.0 77.8 67.6 70.2 79.1
(SIR). L2
Csol(0.45µm) 172.0 10.0 67.0 103.0 4.8 38.0 24.0 11.0 4.6 0.7
Csol(UF) 198.0 16.0 78.0 151.0 7.0 47. 31.0 14.0 7.0 2.0
%Csol(0.45µm) 86.9 62.5 85.9 68.2 68.6 81.09 77.4 78.6 65.7 32.5
6.4.1.3. Concentrations of oxyanion metals
Ferrihydrite Fe(OH)3)-DGT has proved to be useful for oxyanions
determination in aquatic systems (Luo et al., 2010; Österlund et al., 2010; Price et al.,
2013). In this study, FH-DGT was used for the simultaneous measurements of V, As,
Mo; Se, Sb, and W in Oman Sea at same selected above sites. The DGT
concentrations were calculated using equation (6.3). The diffusion coefficients (D) for
vanadate, arsenate, molybdate, antimonate, selenium, and tungstate were recalculated
using values obtained by Luo et al. (2010) and Panther et al. (2013), and by using the
equation in Zhang and Davison (1995), as described in Chapter 4. This equation gives
diffusion coefficients of every analytes at any given temperature DT, at which
deployment was achieved Scally et al. (2003). For high ionic strength deployments in
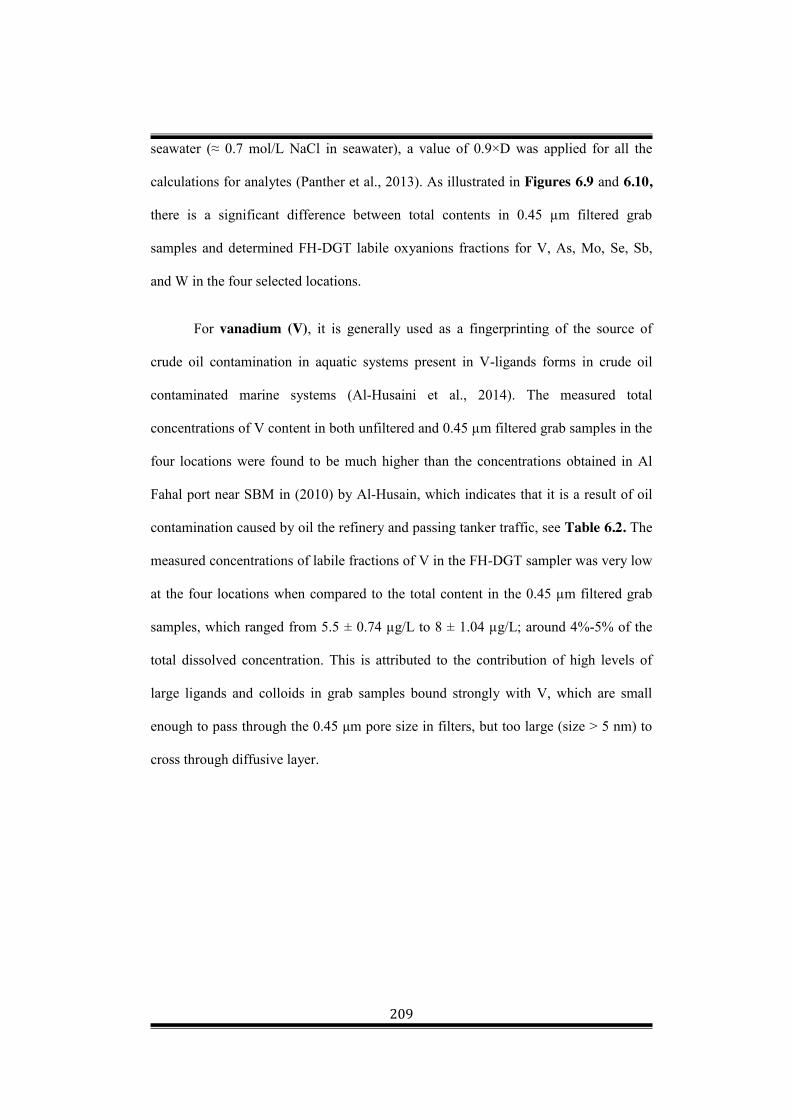
209
seawater (≈ 0.7 mol/L NaCl in seawater), a value of 0.9×D was applied for all the
calculations for analytes (Panther et al., 2013). As illustrated in Figures 6.9 and 6.10,
there is a significant difference between total contents in 0.45 µm filtered grab
samples and determined FH-DGT labile oxyanions fractions for V, As, Mo, Se, Sb,
and W in the four selected locations.
For vanadium (V), it is generally used as a fingerprinting of the source of
crude oil contamination in aquatic systems present in V-ligands forms in crude oil
contaminated marine systems (Al-Husaini et al., 2014). The measured total
concentrations of V content in both unfiltered and 0.45 µm filtered grab samples in the
four locations were found to be much higher than the concentrations obtained in Al
Fahal port near SBM in (2010) by Al-Husain, which indicates that it is a result of oil
contamination caused by oil the refinery and passing tanker traffic, see Table 6.2. The
measured concentrations of labile fractions of V in the FH-DGT sampler was very low
at the four locations when compared to the total content in the 0.45 µm filtered grab
samples, which ranged from 5.5 ± 0.74 µg/L to 8 ± 1.04 µg/L; around 4%-5% of the
total dissolved concentration. This is attributed to the contribution of high levels of
large ligands and colloids in grab samples bound strongly with V, which are small
enough to pass through the 0.45 μm pore size in filters, but too large (size > 5 nm) to
cross through diffusive layer.
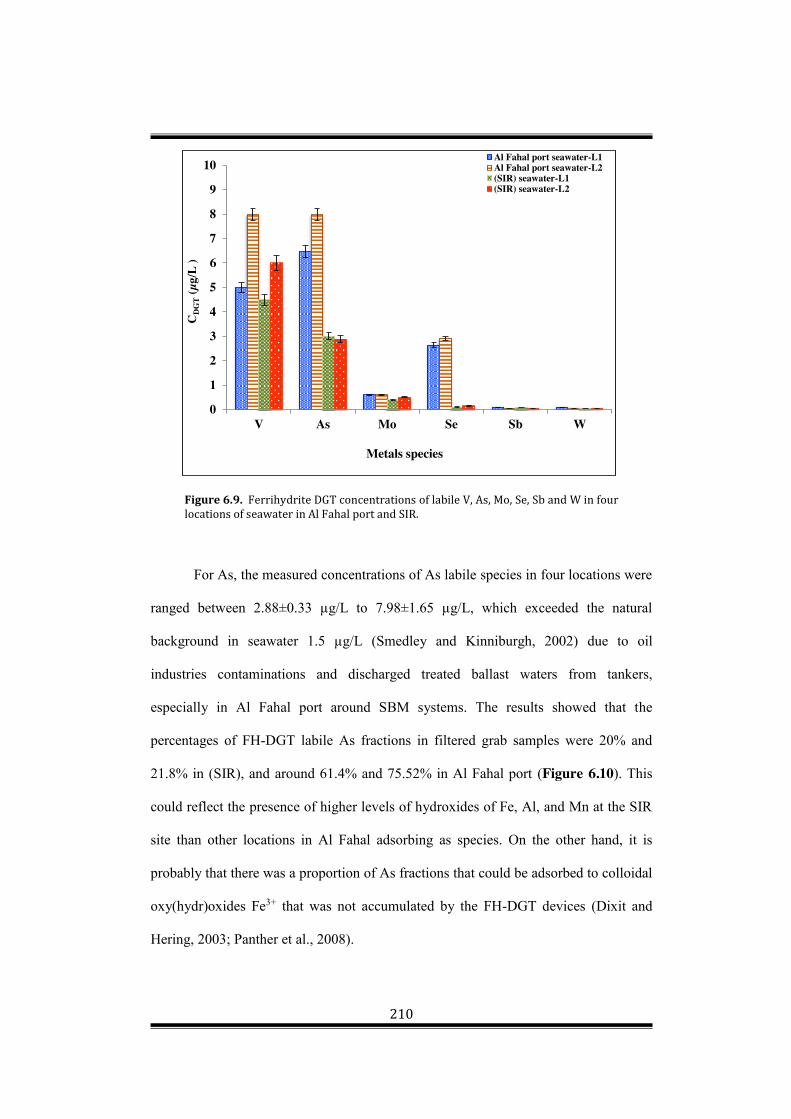
210
Figure 6.9. Ferrihydrite DGT concentrations of labile V, As, Mo, Se, Sb and W in four locations of seawater in Al Fahal port and SIR.
For As, the measured concentrations of As labile species in four locations were
ranged between 2.88±0.33 µg/L to 7.98±1.65 µg/L, which exceeded the natural
background in seawater 1.5 µg/L (Smedley and Kinniburgh, 2002) due to oil
industries contaminations and discharged treated ballast waters from tankers,
especially in Al Fahal port around SBM systems. The results showed that the
percentages of FH-DGT labile As fractions in filtered grab samples were 20% and
21.8% in (SIR), and around 61.4% and 75.52% in Al Fahal port (Figure 6.10). This
could reflect the presence of higher levels of hydroxides of Fe, Al, and Mn at the SIR
site than other locations in Al Fahal adsorbing as species. On the other hand, it is
probably that there was a proportion of As fractions that could be adsorbed to colloidal
oxy(hydr)oxides Fe3+ that was not accumulated by the FH-DGT devices (Dixit and
Hering, 2003; Panther et al., 2008).
0
1
2
3
4
5
6
7
8
9
10
V As Mo Se Sb W
CD
GT
(µg/
L )
Metals species
Al Fahal port seawater-L1Al Fahal port seawater-L2(SIR) seawater-L1(SIR) seawater-L2

211
Figure 6.10. The percentage of DGT labile V, As, Mo; Se, Sb and W 0.45 µm filtered grab samples from four selected locations in Al Fahal port and Sohar Industrial Region (SIR).
The FH-DGT concentrations of labile Mo species in all locations were very
low, ranging between 0.37±0.08 µg/L and 0.6±0.23 µg/L with percentages of 3%-
3.5% of total concentration in grab samples. This reflects that Mo is present in
colloidal and organic ligands forms (size > 5 nm) in natural waters, and can pass
through 0.45 µm filtration in grab samples; but unable to cross the diffusive gel to
binding layer. This is also probably because of weaker binding of these anions to (FH)
resin at high pH in seawater; observed for molybdate measurements at all locations
(Österlund et al., 2010; Vasyukova et al., 2010).
For Se, the measured FH-DGT concentrations of labile Se at the Al Fahal site
were higher than those obtained in (SIR), ranging between 2.6 ± 0.04 µg/L to 3.0 ±
0.10 µg/L and 0.1 ± 0.012 µg/L and 0.14 ± 0.013 µg/L respectively. This probably
attributed to the presence of high levels of Fe, Al, and Mn dissolved organic
complexes some of them present in the form of colloidal particles of hydrous metallic
0
10
20
30
40
50
60
70
80
90
100
V As Mo Se Sb W
%C
DG
T/C
solu
tion(
0.45
um)(g
rab
sam
lple
s)
Metals species
Muscat (Alfahal Refinery)-L1 Muscat (Alfahal Refinery)-L2Sohar (Sohar Harbour)-L1 Sohar (Sohar Harbour)-L2

212
oxides can bound strongly to Se species. This is consistent with findings obtained in
seawater by Price et al. (2013). Vasyukova et al. (2010) also found similar
observations in seawater for other oxyanions.
For Sb and W, the FH-DGT labile concentrations of both oxyanions were very
low at the four locations, and ranged between 0.01 ± 0.007 µg/L and 0.09 ± 0.002
µg/L respectively. This is may be attributed to the weaker binding of Sb and W anions
to Ferrihydrite at a high pH in seawater. On the other hand, that aromatic organic
ligands and organo-mineral colloids, Al, Mn, and Fe3+ oxyhydroxides, act as the main
carriers of these anions at all selected locations (Österlund et al., 2010; Vasyukova et
al., 2010).
Table 6.3 highlights that the levels and overall mean concentrations of
oxyanion metals As, Mo, Se and V, are high in all collected 0.45 μm filtered grab and
unfiltered samples at all locations. This is possibly attributed to the illegal discharges
of oil and wastes by passing tankers at all locations throughout the neighborhoods of
refineries and those conducting industrial activities. Vanadium (V) is oil related
metals, and mainly occur in metal complexes forms in crude oil, normally considered
as an indicator of oil ligands pollution (Al-Husaini et al., 2014). W is the lowest in all
selected locations of Oman Sea due to its very low occurrence in seawater. For Mo,
molybdenum in marine systems are mostly present as MoO42- fractions and its
concentration is unaffected by 0.45 µm filtration in grab samples, which is very close
to the total content in unfiltered samples at the four selected locations, as shown in
Table 6.3.

213
Table 6.3. The total oxyanion metals concentrations in 0.45 mm- filtered grab samples and unfiltered samples measurements (μg L−1) ratios of (Csol(0.45 µm filtered grab)/ Csol(unfiltered)) of all targeted metals in four sites from the Sea of Oman.
Locations Metals V As Mo Se Sb W
AlFahal port. L1 Csol(0.45µm) 110.0 11.3 17.0 20.0 0.4 0.2
Csol(UF) 125.0 14.0 20.0 24.0 0.6 0.4 %Csol(0.45µm) 88.0 80.7 85.0 83.3 65.6 42.9
AlFahal port. L2 Csol(0.45µm) 105.0 13.0 17.0 21.0 0.5 0.1
Csol(UF) 125.0 16.0 22.0 27.0 0.7 0.3 %Csol(0.45µm) 84.0 81.3 77.3 77.8 64.3 33.3
(SIR). L1 Csol(0.45µm) 129.0 14.0 15.0 12.0 0.4 0.2
Csol(UF) 140.0 17.0 19.0 23.0 0.8 0.4 %Csol(0.45µm) 92.1 82.4 78.9 52.2 50.6 52.6
(SIR). L2 Csol(0.45µm) 113.0 13.0 15.0 11.0 0.4 0.2
Csol(UF) 152.0 18.0 18.2 16.0 1.0 0.4 %Csol(0.45µm) 74.3 72.2 82.4 68.8 44.3 42.9
Consequently, it can be observed that according to DGT findings in Al Fahal
port and SIR, the high extent of anthropogenic activities in these two economic
regions has been identified as showing evidence of contributing most to trace metals
loads in marine systems. The distribution of the various groups and forms of labile
trace metals species indicates the presence of the different contamination sources in
the studied sites. In fact, both sites characterised by the presence of refinery and
industrial activities may represent point sources of primary trace metals
contamination, which are extensively present in crude oil or used in industries such as
aluminum, iron, and copper mining. All obtained concentrations for V, Ni, Zn, Mn,
Al, and Fe in 0.45 µm filtered grab samples in all locations were high, which confirms
that all port sites have been impacted by oil spills and/or oil transportation and
industrial discharges taking place in both selected locations. Significantly low DGT-
labile of fractions were measured compared to the concentrations in 0.45 µm filtered
grab samples at all DGT types. This reflects the presence of high concentrations of

214
large aromatic ligands and colloids, including oxide-hydroxides, in the studied areas
where oil refineries, tankers, and industries influence the trace metals speciation.
6.4.2. Metal concentrations and speciation in groundwaters
Following seawater quality assessment around two main economic ports,
groundwaters quality around Rusyal Industrial Estate (RIE) in Muscat, and (SIR) were
also assessed by deploying the same set of the above DGT versions at the same time in
six open wells. Water temperature, EC, salinity, and pH of all selected six wells were
measured daily during the deployment period using the average values of the obtained
values, Table 6.1.
6.4.2.1. DBL measurements
Diffusive boundary layer (DBL) was determined at each deployment open well
waters to investigate if the DBL thickness affected by very low flow rates in the
studied six well waters. To measure the thickness of the DBL in open well waters,
DGT devices were deployed at each well’s waters around RIE in Muscat and in
Khadafan near (SIR) in Sohar for 5 days as described above. The inverse of mass of
metal retained by DGT unites (1/M) were plotted versus diffusion layers (∆g), as
shown in Figure 6.11. A good linearity of regressions (R2) 0.9935-0.99837, despite
the low mass of some targeted trace metals such as Cd (0.01±0.0015 µg/L –
0.14±0.012 µg/L) in Well-1 in Khadafan near SIR, and Pb (0.83±0.013 µg/L –
2.6±0.017 µg/L) in Well-3 in RIE, were accumulated by DGT units in all open wells
of the studied locations, probably due to the presence of large ligands and colloids
bound strongly to trace metals unfilterable through 0.45 µm pore size. The determined
thicknesses of DBL of trace metals in the selected open wells using the equation (6.3),
were larger than those obtained in the laboratory (see Chapter 3) and in seawater in
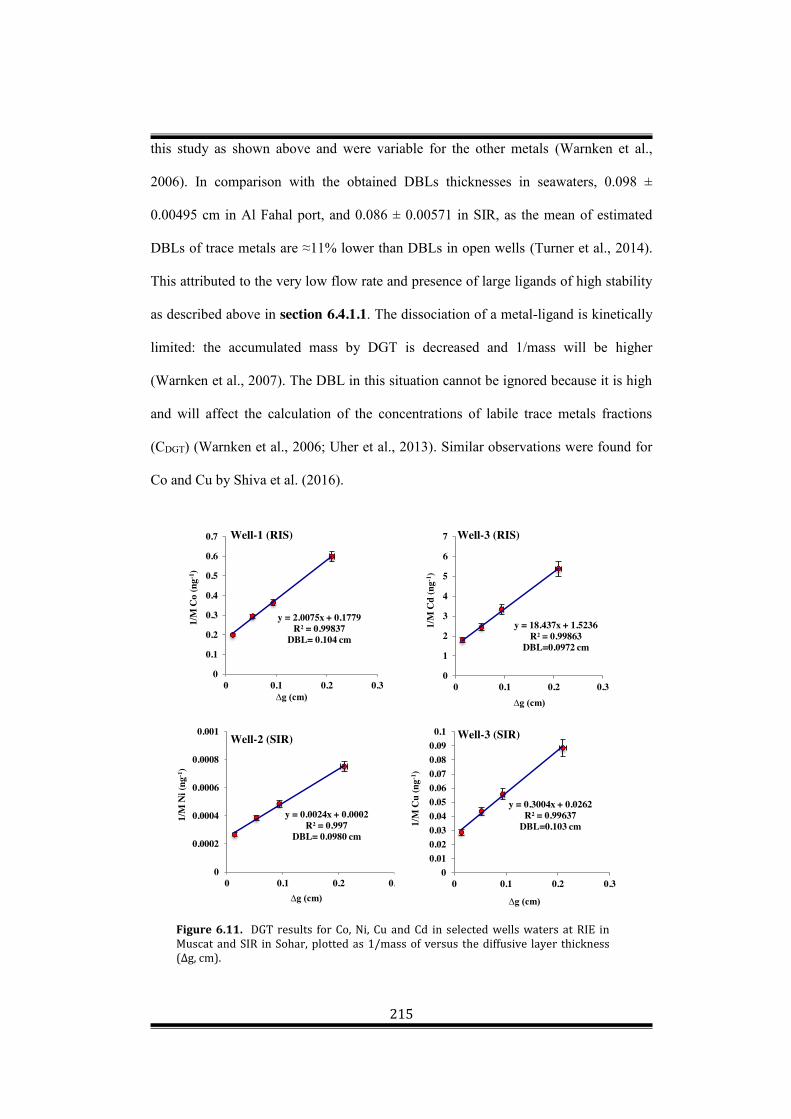
215
this study as shown above and were variable for the other metals (Warnken et al.,
2006). In comparison with the obtained DBLs thicknesses in seawaters, 0.098 ±
0.00495 cm in Al Fahal port, and 0.086 ± 0.00571 in SIR, as the mean of estimated
DBLs of trace metals are ≈11% lower than DBLs in open wells (Turner et al., 2014).
This attributed to the very low flow rate and presence of large ligands of high stability
as described above in section 6.4.1.1. The dissociation of a metal-ligand is kinetically
limited: the accumulated mass by DGT is decreased and 1/mass will be higher
(Warnken et al., 2007). The DBL in this situation cannot be ignored because it is high
and will affect the calculation of the concentrations of labile trace metals fractions
(CDGT) (Warnken et al., 2006; Uher et al., 2013). Similar observations were found for
Co and Cu by Shiva et al. (2016).
Figure 6.11. DGT results for Co, Ni, Cu and Cd in selected wells waters at RIE in Muscat and SIR in Sohar, plotted as 1/mass of versus the diffusive layer thickness (∆g, cm).
y = 2.0075x + 0.1779R² = 0.99837
DBL= 0.104 cm
0
0.1
0.2
0.3
0.4
0.5
0.6
0.7
0 0.1 0.2 0.3
1/M
Co
(ng-1
)
∆g (cm)
Well-1 (RIS)
y = 18.437x + 1.5236R² = 0.99863
DBL=0.0972 cm
0
1
2
3
4
5
6
7
0 0.1 0.2 0.3
1/M
Cd
(ng-1
)
∆g (cm)
Well-3 (RIS)
y = 0.0024x + 0.0002R² = 0.997
DBL= 0.0980 cm
0
0.0002
0.0004
0.0006
0.0008
0.001
0 0.1 0.2 0.3
1/M
Ni (
ng-1
)
∆g (cm)
Well-2 (SIR)
y = 0.3004x + 0.0262R² = 0.99637
DBL=0.103 cm
00.010.020.030.040.050.060.070.080.090.1
0 0.1 0.2 0.3
1/M
Cu
(ng-1
)
∆g (cm)
Well-3 (SIR)
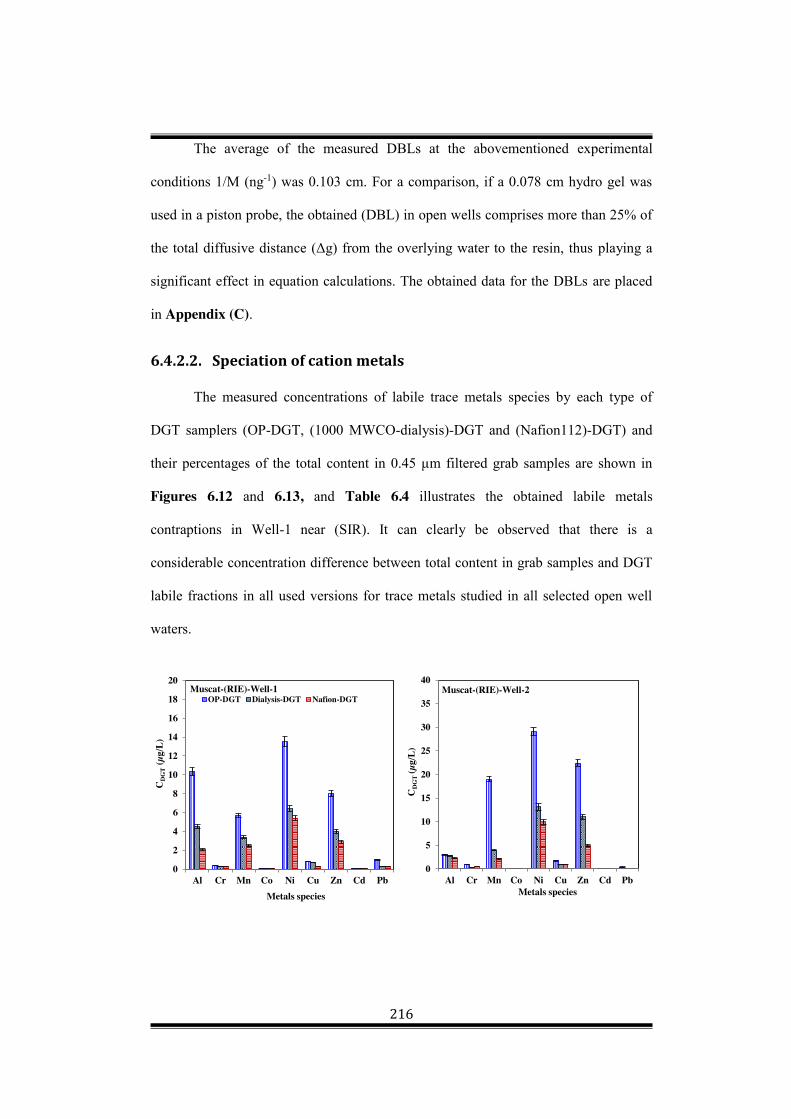
216
The average of the measured DBLs at the abovementioned experimental
conditions 1/M (ng-1) was 0.103 cm. For a comparison, if a 0.078 cm hydro gel was
used in a piston probe, the obtained (DBL) in open wells comprises more than 25% of
the total diffusive distance (Δg) from the overlying water to the resin, thus playing a
significant effect in equation calculations. The obtained data for the DBLs are placed
in Appendix (C).
6.4.2.2. Speciation of cation metals
The measured concentrations of labile trace metals species by each type of
DGT samplers (OP-DGT, (1000 MWCO-dialysis)-DGT and (Nafion112)-DGT) and
their percentages of the total content in 0.45 µm filtered grab samples are shown in
Figures 6.12 and 6.13, and Table 6.4 illustrates the obtained labile metals
contraptions in Well-1 near (SIR). It can clearly be observed that there is a
considerable concentration difference between total content in grab samples and DGT
labile fractions in all used versions for trace metals studied in all selected open well
waters.
0
2
4
6
8
10
12
14
16
18
20
Al Cr Mn Co Ni Cu Zn Cd Pb
CD
GT
(µg/
L)
Metals species
Muscat-(RIE)-Well-1OP-DGT Dialysis-DGT Nafion-DGT
0
5
10
15
20
25
30
35
40
Al Cr Mn Co Ni Cu Zn Cd Pb
CD
GT
(µg/
L)
Metals species
Muscat-(RIE)-Well-2

217
Figure 6.12. Measured trace metals fractions in five open well waters at different sites by three versions of DGT samplers.
Table 6.4. The measured concentrations of DGT labile species (µg/L) by OP-DGT, (1000 MWCO-dialysis)-DGT and (Nafion112)-DGT in open well water-(1) in SIR.
Metal Al Cr Mn Fe Co Ni Cu Zn Cd Pb OP-DGT 1.4 0.6 760 2628 1.72 10.2
3 0.11 37.0 0.03 0.038
Dialysis-DGT 1.25 0.22 523 1451 1.79 5.21 0.1 14.2 0.01 0.02
9
Nafion-DGT 0.38 0.24 493 493 1.35 5.27 0.1 13.5 0.01 0.035
0
1
2
3
4
5
6
7
8
9
10
Al Cr Mn Co Ni Cu Zn Cd Pb
CD
GT
(µg/
L)
Metals species
Muscat-(RIE)-Well-3
0
15
30
45
60
75
90
105
Al Cr Mn Fe Co Ni Cu Zn Cd Pb
CD
GT
(µg/
L)Metals species
Sohar Industrial Region-Well-2
0
4
8
12
16
20
24
28
32
Al Cr Mn Fe Co Ni Cu Zn Cd Pb
CD
GT
(µg/
L)
Metals species
Sohar Industrial Region-Well-3

218
Figure 6.13. The percentages of CDGT-labile metal species in studied wells of the total content in 0.45-μmfilterablegrabsamples.
0102030405060708090
100110120
Al Cr Mn Co Ni Cu Zn Cd Pb
%C
DG
T/ C
solu
tion(
0.45
um)(g
rab
sam
lple
s)
Metal species
Muscat (RIE)-Well-1
OP-DGT Dialysis-DGT Nafion-DGT
0102030405060708090
100110120130140
Al Cr Mn Co Ni Cu Zn Cd Pb
%C
DG
T/C
solu
tion(
0.45
um)(g
rab
sam
lple
s)
Metal species
Muscat-(RIE)-Well-2
0
10
20
30
40
50
60
70
80
90
100
Al Cr Mn Co Ni Cu Zn Cd Pb
%C
DG
T/C
solu
tion(
0.45
um)(g
rab
sam
lple
s)
Metals species
Muscat (RIE)-Well-3
0
20
40
60
80
100
120
Al Cr Mn Fe Co Ni Cu Zn Cd Pb
%C
DG
T/C
solu
tion(
0.45
um)(g
rab
sam
lple
s)
Metal species
Sohar Indusrial Region Well-1
0
10
20
30
40
50
60
70
80
90
100
110
Al Cr Mn Fe Co Ni Cu Zn Cd Pb
%C
DG
T/C
solu
tion(
0.45
um)(g
rab
sam
lple
s)
Metals species
Sohar Indusrial Region-Well-2
0
10
20
30
40
50
60
70
80
90
100
Al Cr Mn Fe Co Ni Cu Zn Cd Pb
%C
DG
T/C
solu
tion(
0.45
um)(g
rab
sam
lple
s)
Metals species
Sohar Industrial Region-Well-3

219
For Al, the measured concentrations of Al labile fractions OP-DGT were low
in all selected wells ranged between 1.0±0.046 µg/L and 10.36±0.93 µg/L. The
measured percentages of Al fractions obtained by OP- DGT in (RIE)’s wells (1,2 and
3) were 25.3%%, 47.1% and 36% of the total dissolved content in grab samples,
respectively. Whereas in (SIR)’s wells (1,2 and 3) were 20%, 16.5% and 97%,
respectively of the total content as shown in Figures 6.12 and 6.13. This is probably
due to the complexation of Al by large ligands and colloids in wells waters that can
cross the pore size 0.45 µm in filterable grab samples but find it difficult to diffuse
through the hydrogel. On the other hand, humic substances in wells waters favored the
formation of highly stable complexes that would slow the diffusion of Al species to
the resin layer, and are typically released from industrial and agricultural (pesticides
and fertilizers) practices near development sites and farms (Panther et al., 2012;
Malassa et al., 2013). The higher ratio in (SIR)-well 2 could be attributed to a species
of Al associated to DOMs and colloids, which are small enough to pass through a 5
nm pore size in the diffusive gel. The (1000 MWCO-dialysis)-DGT labile
concentrations closely followed those values measured by OP-DGT for Well-2 in RIE,
and Wells-1, -2 and -3 in SIR, with the smallest proportion of Al labile species (16.5%
- 23.3%) and a large percentage (89%) of the total content in grab samples for Well-2
at (SIR), see Figure 6.12. The big differences between (1000 MWCO-dialysis)-DGT
and OP-DGT measurements reflect the presence of large complexes of molecular mass
(> 1000 MWCO) in these open wells waters; they cannot diffuse through dialysis. In
(RIE)’s wells-(1) and (3), the measured labile Al by (1000 MWCO-dialysis)-DGT
were significantly lower than OP-DGT, with percentages 22.6% and 16.8%, probably
due to Al associated to DOMs and colloids, which are too large to diffuse through
dialysis (> 1000 MWCO).
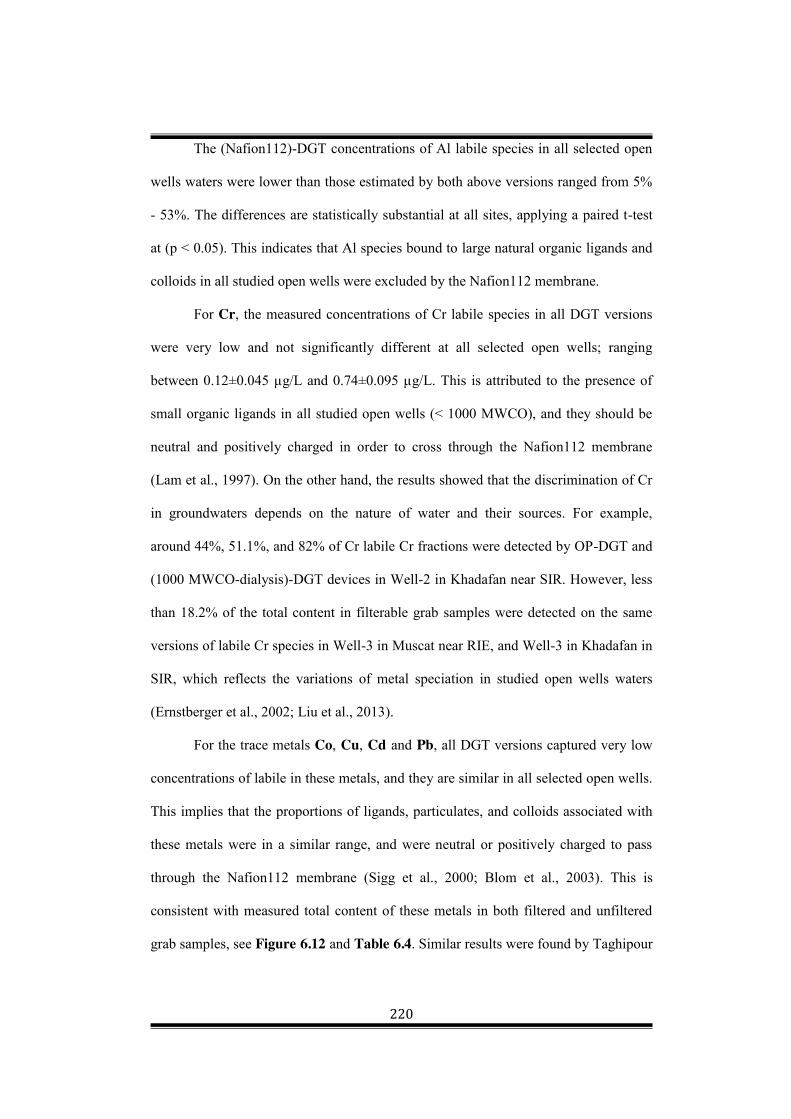
220
The (Nafion112)-DGT concentrations of Al labile species in all selected open
wells waters were lower than those estimated by both above versions ranged from 5%
- 53%. The differences are statistically substantial at all sites, applying a paired t-test
at (p < 0.05). This indicates that Al species bound to large natural organic ligands and
colloids in all studied open wells were excluded by the Nafion112 membrane.
For Cr, the measured concentrations of Cr labile species in all DGT versions
were very low and not significantly different at all selected open wells; ranging
between 0.12±0.045 µg/L and 0.74±0.095 µg/L. This is attributed to the presence of
small organic ligands in all studied open wells (< 1000 MWCO), and they should be
neutral and positively charged in order to cross through the Nafion112 membrane
(Lam et al., 1997). On the other hand, the results showed that the discrimination of Cr
in groundwaters depends on the nature of water and their sources. For example,
around 44%, 51.1%, and 82% of Cr labile Cr fractions were detected by OP-DGT and
(1000 MWCO-dialysis)-DGT devices in Well-2 in Khadafan near SIR. However, less
than 18.2% of the total content in filterable grab samples were detected on the same
versions of labile Cr species in Well-3 in Muscat near RIE, and Well-3 in Khadafan in
SIR, which reflects the variations of metal speciation in studied open wells waters
(Ernstberger et al., 2002; Liu et al., 2013).
For the trace metals Co, Cu, Cd and Pb, all DGT versions captured very low
concentrations of labile in these metals, and they are similar in all selected open wells.
This implies that the proportions of ligands, particulates, and colloids associated with
these metals were in a similar range, and were neutral or positively charged to pass
through the Nafion112 membrane (Sigg et al., 2000; Blom et al., 2003). This is
consistent with measured total content of these metals in both filtered and unfiltered
grab samples, see Figure 6.12 and Table 6.4. Similar results were found by Taghipour
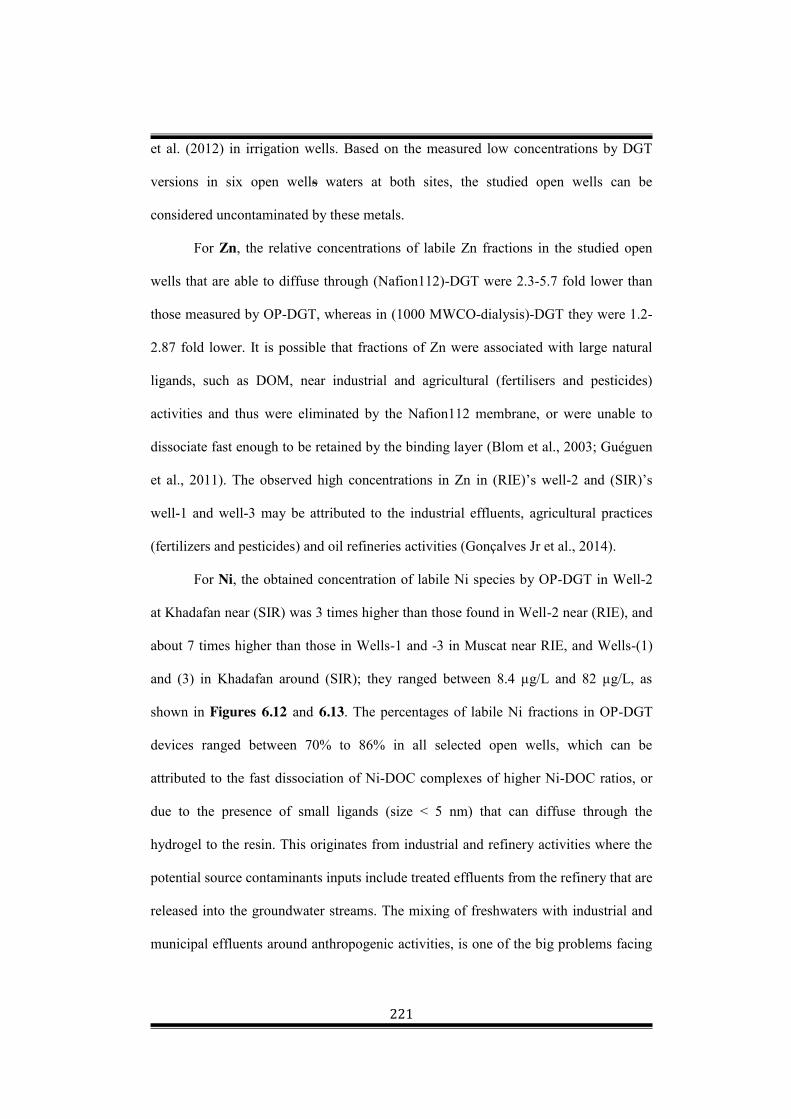
221
et al. (2012) in irrigation wells. Based on the measured low concentrations by DGT
versions in six open wells waters at both sites, the studied open wells can be
considered uncontaminated by these metals.
For Zn, the relative concentrations of labile Zn fractions in the studied open
wells that are able to diffuse through (Nafion112)-DGT were 2.3-5.7 fold lower than
those measured by OP-DGT, whereas in (1000 MWCO-dialysis)-DGT they were 1.2-
2.87 fold lower. It is possible that fractions of Zn were associated with large natural
ligands, such as DOM, near industrial and agricultural (fertilisers and pesticides)
activities and thus were eliminated by the Nafion112 membrane, or were unable to
dissociate fast enough to be retained by the binding layer (Blom et al., 2003; Guéguen
et al., 2011). The observed high concentrations in Zn in (RIE)’s well-2 and (SIR)’s
well-1 and well-3 may be attributed to the industrial effluents, agricultural practices
(fertilizers and pesticides) and oil refineries activities (Gonçalves Jr et al., 2014).
For Ni, the obtained concentration of labile Ni species by OP-DGT in Well-2
at Khadafan near (SIR) was 3 times higher than those found in Well-2 near (RIE), and
about 7 times higher than those in Wells-1 and -3 in Muscat near RIE, and Wells-(1)
and (3) in Khadafan around (SIR); they ranged between 8.4 µg/L and 82 µg/L, as
shown in Figures 6.12 and 6.13. The percentages of labile Ni fractions in OP-DGT
devices ranged between 70% to 86% in all selected open wells, which can be
attributed to the fast dissociation of Ni-DOC complexes of higher Ni-DOC ratios, or
due to the presence of small ligands (size < 5 nm) that can diffuse through the
hydrogel to the resin. This originates from industrial and refinery activities where the
potential source contaminants inputs include treated effluents from the refinery that are
released into the groundwater streams. The mixing of freshwaters with industrial and
municipal effluents around anthropogenic activities, is one of the big problems facing

222
managing and regulations of freshwater quality, as mentioned above (Chakraborty et
al., 2006). Around 30%-40.1% of the total Ni content in filterable grab samples were
(1000MWCO-dialysis)-DGT labile Ni2+ fractions in 6 open wells. This indicates that
Ni probably associated with organic ligands of molecular mass (>1000 MWCO) and
excluded from DGT measurements (Gimpel et al., 2003; Österlund et al., 2012). The
smallest proportion of Ni labile species (11%-29%) were measured by (Nafion112)-
DGT in all selected open wells except in Well-1 near (SIR) where it slightly exceeded
those in (1000 MWCO-dialysis)-DGT (44.5% of the total concentration in the
filterable grab sample).
For Mn, the measured concentrations of labile Mn fractions were low in the
studied open wells waters, except for Well-1in Khadafan near SIR by three DGT
versions. The higher levels of Mn is probably associated with the low amount of
dissolved oxygen in Well-1 in Khadafan which enhanced the reduction process of
MnO2 to Mn and Mn2+ (Liu et al., 2013). The ratios of DGT labile free Mn ions,
inorganic fractions, and small labile organic complexes in the above DGT devices are
in the range of 67%-79% in OP-DGT, 17%-47.6% in (1000 MWCO-dialysis)-DGT,
and 10%-44% in Nafion112. The measured low percentages of labile Mn inorganic
species by (1000 MWCO-dialysis)-DGT and (Nafion112)-DGT, reflects the presence
of large particulates and colloids of molecular weight >1000 MWCO bound strongly
to Mn. For Zn, the relative concentrations of labile Zn fractions in the studied open
wells that are able to diffuse through (Nafion112)-DGT were 2.3-5.7 fold lower than
those measured by OP-DGT, whereas in (1000 MWCO-dialysis)-DGT they were 1.2-
2.87 fold lower. It is possible that fractions of Zn were associated with large natural
ligands, such as DOM, near industrial and agricultural (fertilisers and pesticides)
activities and thus were eliminated by the Nafion112 membrane, or were unable to
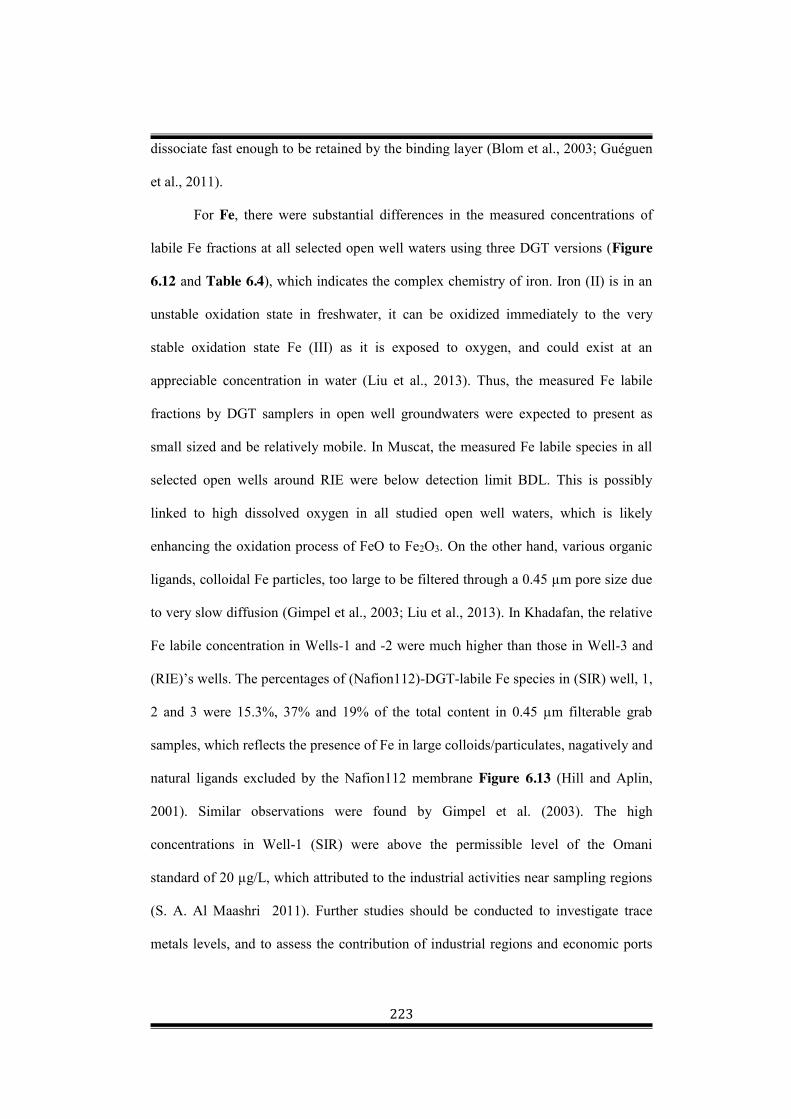
223
dissociate fast enough to be retained by the binding layer (Blom et al., 2003; Guéguen
et al., 2011).
For Fe, there were substantial differences in the measured concentrations of
labile Fe fractions at all selected open well waters using three DGT versions (Figure
6.12 and Table 6.4), which indicates the complex chemistry of iron. Iron (II) is in an
unstable oxidation state in freshwater, it can be oxidized immediately to the very
stable oxidation state Fe (III) as it is exposed to oxygen, and could exist at an
appreciable concentration in water (Liu et al., 2013). Thus, the measured Fe labile
fractions by DGT samplers in open well groundwaters were expected to present as
small sized and be relatively mobile. In Muscat, the measured Fe labile species in all
selected open wells around RIE were below detection limit BDL. This is possibly
linked to high dissolved oxygen in all studied open well waters, which is likely
enhancing the oxidation process of FeO to Fe2O3. On the other hand, various organic
ligands, colloidal Fe particles, too large to be filtered through a 0.45 µm pore size due
to very slow diffusion (Gimpel et al., 2003; Liu et al., 2013). In Khadafan, the relative
Fe labile concentration in Wells-1 and -2 were much higher than those in Well-3 and
(RIE)’s wells. The percentages of (Nafion112)-DGT-labile Fe species in (SIR) well, 1,
2 and 3 were 15.3%, 37% and 19% of the total content in 0.45 µm filterable grab
samples, which reflects the presence of Fe in large colloids/particulates, nagatively and
natural ligands excluded by the Nafion112 membrane Figure 6.13 (Hill and Aplin,
2001). Similar observations were found by Gimpel et al. (2003). The high
concentrations in Well-1 (SIR) were above the permissible level of the Omani
standard of 20 µg/L, which attributed to the industrial activities near sampling regions
(S. A. Al Maashri 2011). Further studies should be conducted to investigate trace
metals levels, and to assess the contribution of industrial regions and economic ports

224
on the trace metals loads and speciation in groundwater and marine systems in other
locations in the Sultanate of Oman.
Table 6.5 shows the average of total trace metals concentrations from
unfiltered grab samples and 0.45 µm filtered grab samples. The data obtained in grab
samples can be used to evaluate the suitability of DGT samplers in assessing the
quality of aquatic systems. The concentrations obtained in 0.45 µm filtered grab
samples are higher than CDGT, which indicates that the obtained measured
concentrations in all used DGT versions in the above discussion, represent the labile
fractions of either free metals ions or weak metal-DOM, which are bioavailable in the
samples. This is attributed to the presence of large metals-ligands and colloids in the
studied area that can pass through pore size in 0.45 m filters, but are too large to cross
the hydrogels and the membranes used in DGT devices (Gimpel et al., 2003; Mengistu
et al., 2012; Panther et al., 2012). It can be observed that the targeted trace metals in
all selected wells waters were low, except Al, Mn, Fe, Ni and Zn which were higher in
others selected open well waters, as shown in Table 6.5. This suggests that there is a
continuous input of more trace metals from oil refineries and industrial regions.

225
Table 6.5. Comparison of targeted trace metals concentrations (μg/L) in 0.45μm filtered and unfiltered collected waters from well samples at selected wells in RIE and SIR regions.
Locations Metals Al Cr Mn Fe Co Ni Cu Zn Cd Pb
Well-1(RIE)
Csol(0.45µm) 30 2 8 BDL 0.58 16.8 1.35 8 0.07 1.3
Csol(UF) 36 8 12.5 BDL 0.75 23 1.7 9.7 0.09 1.65 %Csol(0.
45µm) 83 25 64 BDL 77 73 79 82 78 79
Well-2(RIE)
Csol(0.45µm) 12 1.5 24 BDL 0.26 35 3.25 25 0.08
5 0.65
Csol(UF) 20 3.2 32 BDL 0.32 44 4.1 32 0.1 1.3 %Csol(0.
45µm) 60 46.87 75 BDL 0.1 79.5 79.3 78.1 85.0 50.0
Well-3(RIE)
Csol(0.45µm) 5.6 1.1 4.2 BDL 0.2 12 1.1 4.5 4 0.9
Csol(UF) 11 1.8 6 DDL 6 16 1.85 10 5.7 1.1 %Csol(0.
45µm) 50.9 61.1 70.0 DDL 3.3 75.0 59.5 45.0 70.2 81.8
Well-1 (SIR)
Csol(0.45µm) 7 2 1100 3012 4.4 13 1.1 36 0.05 0.12
Csol(UF) 9 3.4 1310 3240 5 30 1.3 54 0.083 0.23
%Csol(0.45µm) 77.8 58.8 84.0 93.0 88.0 43.3 84.6 66.7 60.2 52.2
Well-2 (SIR)
Csol(0.45µm) 39 0.9 12 130 0.22 96 2.5 10.4 0.04 5
Csol(UF) 45 1.26 16 141 0.56 115 3 15 0.062 8
%Csol(0.45µm) 86.7 71.4 75.0 92.2 39.3 83.5 83.3 69.3 64.5 62.5
Well-3 (SIR)
Csol(0.45µm) 5.02 2.02 4 6.2 0.05 22.5 1.6 33 0.09 0.45
Csol(UF) 7 3 6 8 0.13 27 2 45 0.14 0.7 %Csol(0.
45µm) 71.7 67.3 66.7 77.5 38.5 83.3 80.0 73.3 64.3 64.3
6.4.2.3. Concentrations of oxyanion metals
FH-DGT devices in triplicates were deployed at the same studied open wells
waters at the same sampling times as for the above cation metal measurements by
DGT. The labile concentrations of V, As, Mo, Se, Sb, and W (CDGT, µg/L) were
calculated using equation (6.3), and diffusion coefficients obtained by Luo et al.
(2010) and Österlund et al. (2010). The obtained DBLs values in the above section
were included in the calculations. The results are presented in Figure 6.14. The results
showed substantial differences at all studied open wells, with percentages ranging

226
between 8% and 95% of all studied oxyanions in filterable grab samples, see Figure
6.15.
For vanadium (V), V species normally enters aquatic systems due to oil sands,
industrial activities, and mine wastes. The FH-DGT concentrations of labile V species
in all studied wells, except Well-3 near (SIR), exceeded the typical background
concentration in groundwater of (1 < µg/L), with ratios ranging from 31% to 93.7% of
the total concentration in the filterable grab samples (Dušek, 2002; Li et al., 2014).
This is likely to originate from higher anthropogenic inputs near industrial regions.
Additionally, the lower level of FH-DGT labile V fractions attributed to the presence
of a high amount of particulates and large ligands bound to V species (size > 5 nm).
Figure 6.14. The measured concentrations of FH-DGT labile V, As, Mo, Se, Sb and W species in the selected six open Wells waters in Muscat near RIE and Sohar in Khadafan near SIR, in the Sultanate of Oman, in January 2015.
For As, Mo, Se, Sb and W, the FH-DGT labile species of these metals were very
low, and lower than their background concentrations in groundwater in most countries:
0
1
2
3
4
5
6
7
8
9
10
V As Mo Se Sb W
CD
GT
(μg/
L)
Metal species
(RIE)-Well-(1) (RIE)-well-(2)(RIE)-well-(3) (SIR)-well-(1)(SIR)-well-(2) (SIR)-well-(3)

227
<10 μg /L, < 10 μg /L, <10 μg /L, <5 μg /L and <1 μg /L respectively (Weiner, 2010;
Li et al., 2014). Based on the obtained results, the studied open wells at both sites can
be considered uncontaminated by the above oxyanions. The percentages of all targeted
oxyanions labile fractions in the three studied wells in Khadafan near (SIR) ranged
between 8% and 86%, which reflects the presence of iron and large organic colloidal
particles that are too large to pass through the diffusive gel (Vasyukova et al., 2010);
similar to the observations by Österlund et al. (2010) in river waters.
Figure 6.15. The percentages of FH-DGT labile V, As, Mo, Se, Sb and W fraction to 0.45 µm filterable grab samples in all studied six open well waters in Muscat near (RIE) and Sohar in Khadafan near (SIR), in the Sultanate of Oman, in January 2015.
It can be observed that the targeted oxyanions metals in all selected wells were
low as shown in Table 6.6. The filtered are lower than unfiltered which is consistent
with all findings. The W is the lowest because it is naturally occurring at very low
level (Thorgersen et al., 2015).
0
20
40
60
80
100
120
V As Mo Se Sb W
%C
DG
T/C
solu
tion(
0.45
um)(g
rab
sam
lple
s)
Metals species
Muscat-Well-1 Muscat-Well-2 Muscat-Well-3Sohar-Well-1 Sohar-Well-2 Sohar-Well-3
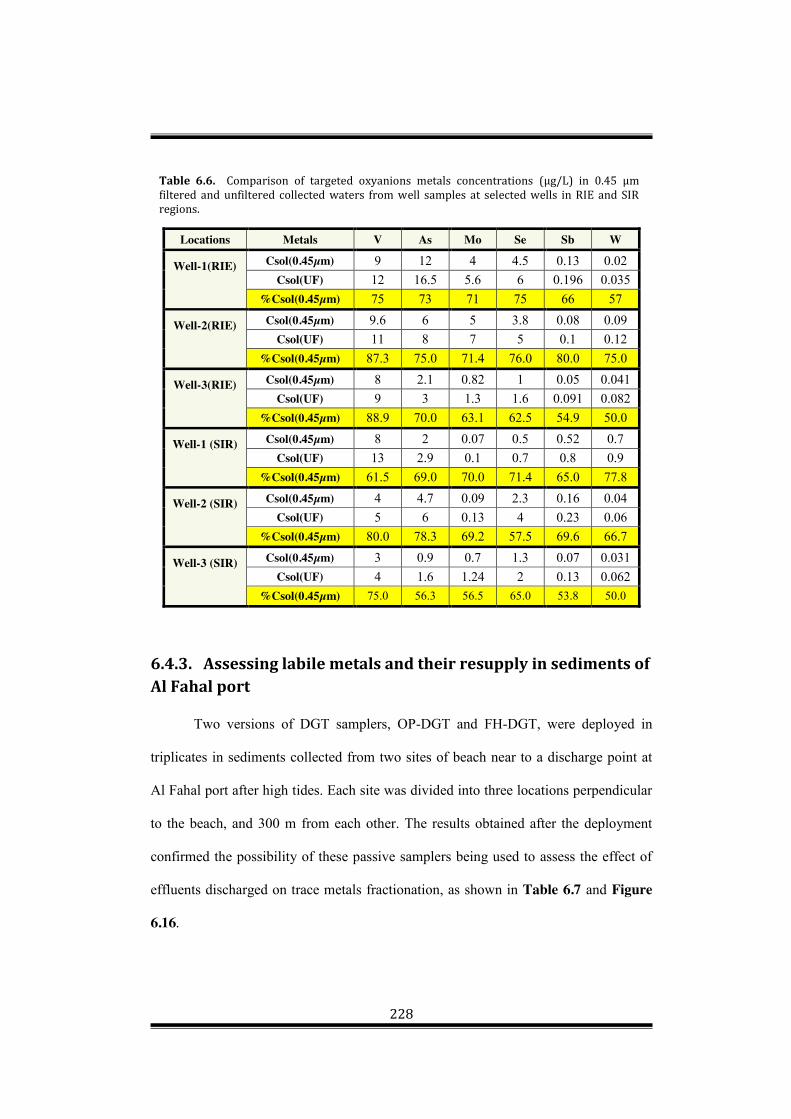
228
Table 6.6. Comparison of targeted oxyanions metals concentrations (μg/L) in 0.45 μm filtered and unfiltered collected waters from well samples at selected wells in RIE and SIR regions.
Locations Metals V As Mo Se Sb W
Well-1(RIE)
Csol(0.45µm) 9 12 4 4.5 0.13 0.02 Csol(UF) 12 16.5 5.6 6 0.196 0.035
%Csol(0.45µm) 75 73 71 75 66 57
Well-2(RIE)
Csol(0.45µm) 9.6 6 5 3.8 0.08 0.09 Csol(UF) 11 8 7 5 0.1 0.12
%Csol(0.45µm) 87.3 75.0 71.4 76.0 80.0 75.0
Well-3(RIE)
Csol(0.45µm) 8 2.1 0.82 1 0.05 0.041 Csol(UF) 9 3 1.3 1.6 0.091 0.082
%Csol(0.45µm) 88.9 70.0 63.1 62.5 54.9 50.0
Well-1 (SIR)
Csol(0.45µm) 8 2 0.07 0.5 0.52 0.7 Csol(UF) 13 2.9 0.1 0.7 0.8 0.9
%Csol(0.45µm) 61.5 69.0 70.0 71.4 65.0 77.8
Well-2 (SIR)
Csol(0.45µm) 4 4.7 0.09 2.3 0.16 0.04 Csol(UF) 5 6 0.13 4 0.23 0.06
%Csol(0.45µm) 80.0 78.3 69.2 57.5 69.6 66.7
Well-3 (SIR)
Csol(0.45µm) 3 0.9 0.7 1.3 0.07 0.031 Csol(UF) 4 1.6 1.24 2 0.13 0.062
%Csol(0.45µm) 75.0 56.3 56.5 65.0 53.8 50.0
6.4.3. Assessing labile metals and their resupply in sediments of Al Fahal port
Two versions of DGT samplers, OP-DGT and FH-DGT, were deployed in
triplicates in sediments collected from two sites of beach near to a discharge point at
Al Fahal port after high tides. Each site was divided into three locations perpendicular
to the beach, and 300 m from each other. The results obtained after the deployment
confirmed the possibility of these passive samplers being used to assess the effect of
effluents discharged on trace metals fractionation, as shown in Table 6.7 and Figure
6.16.
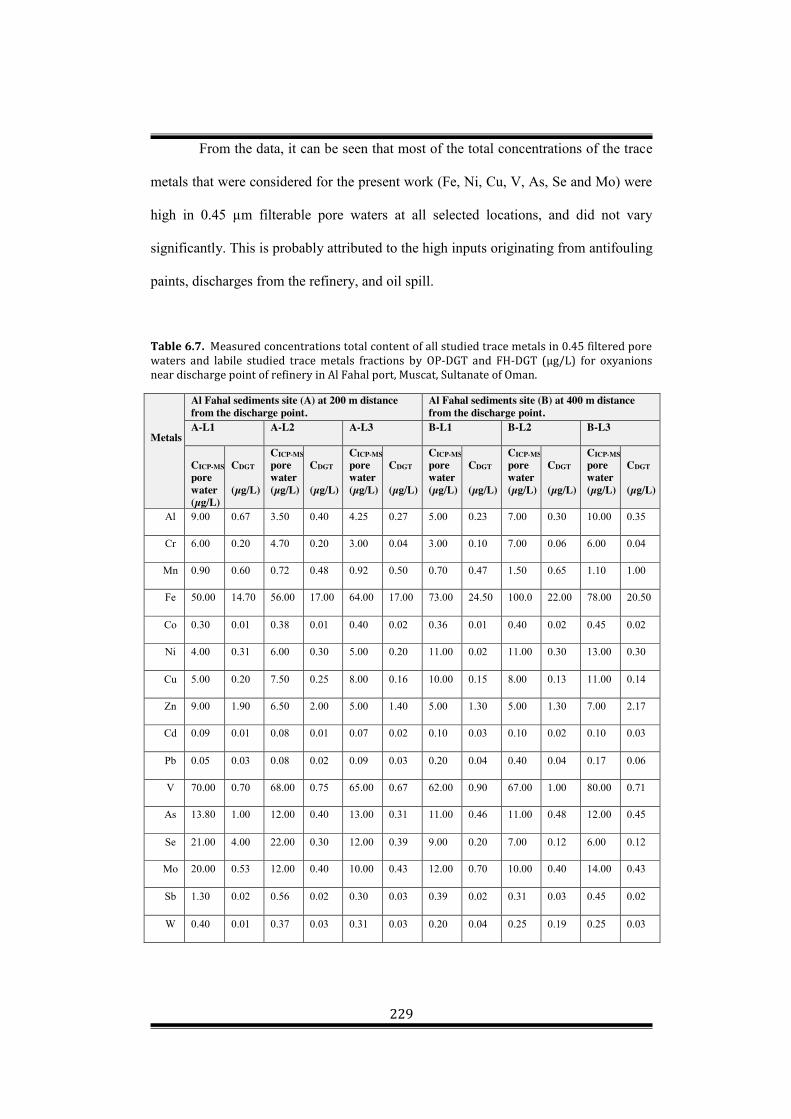
229
From the data, it can be seen that most of the total concentrations of the trace
metals that were considered for the present work (Fe, Ni, Cu, V, As, Se and Mo) were
high in 0.45 µm filterable pore waters at all selected locations, and did not vary
significantly. This is probably attributed to the high inputs originating from antifouling
paints, discharges from the refinery, and oil spill.
Table 6.7. Measured concentrations total content of all studied trace metals in 0.45 filtered pore waters and labile studied trace metals fractions by OP-DGT and FH-DGT (µg/L) for oxyanions near discharge point of refinery in Al Fahal port, Muscat, Sultanate of Oman.
Metals
Al Fahal sediments site (A) at 200 m distance from the discharge point.
Al Fahal sediments site (B) at 400 m distance from the discharge point.
A-L1 A-L2 A-L3 B-L1 B-L2 B-L3
CICP-MS pore water (µg/L)
CDGT
(µg/L)
CICP-MS pore water (µg/L)
CDGT
(µg/L)
CICP-MS pore water (µg/L)
CDGT
(µg/L)
CICP-MS pore water (µg/L)
CDGT
(µg/L)
CICP-MS pore water (µg/L)
CDGT
(µg/L)
CICP-MS pore water (µg/L)
CDGT
(µg/L)
Al 9.00 0.67 3.50 0.40 4.25 0.27 5.00 0.23 7.00 0.30 10.00 0.35
Cr 6.00 0.20 4.70 0.20 3.00 0.04 3.00 0.10 7.00 0.06 6.00 0.04
Mn 0.90 0.60 0.72 0.48 0.92 0.50 0.70 0.47 1.50 0.65 1.10 1.00
Fe 50.00 14.70 56.00 17.00 64.00 17.00 73.00 24.50 100.0 22.00 78.00 20.50
Co 0.30 0.01 0.38 0.01 0.40 0.02 0.36 0.01 0.40 0.02 0.45 0.02
Ni 4.00 0.31 6.00 0.30 5.00 0.20 11.00 0.02 11.00 0.30 13.00 0.30
Cu 5.00 0.20 7.50 0.25 8.00 0.16 10.00 0.15 8.00 0.13 11.00 0.14
Zn 9.00 1.90 6.50 2.00 5.00 1.40 5.00 1.30 5.00 1.30 7.00 2.17
Cd 0.09 0.01 0.08 0.01 0.07 0.02 0.10 0.03 0.10 0.02 0.10 0.03
Pb 0.05 0.03 0.08 0.02 0.09 0.03 0.20 0.04 0.40 0.04 0.17 0.06
V 70.00 0.70 68.00 0.75 65.00 0.67 62.00 0.90 67.00 1.00 80.00 0.71
As 13.80 1.00 12.00 0.40 13.00 0.31 11.00 0.46 11.00 0.48 12.00 0.45
Se 21.00 4.00 22.00 0.30 12.00 0.39 9.00 0.20 7.00 0.12 6.00 0.12
Mo 20.00 0.53 12.00 0.40 10.00 0.43 12.00 0.70 10.00 0.40 14.00 0.43
Sb 1.30 0.02 0.56 0.02 0.30 0.03 0.39 0.02 0.31 0.03 0.45 0.02
W 0.40 0.01 0.37 0.03 0.31 0.03 0.20 0.04 0.25 0.19 0.25 0.03

230
This is consistent with observations made by Al-Husaini et al. (2014) for Cu
and V in Al Fahal port. Vanadium (V) and Nickel (Ni) are generally considered as a
fingerprint of oil contamination present in organometallic complexes in crude oil
(Duyck et al., 2007).
The CDGT-labile fractions of Fe, Ni, Cu, and V increased towards location LB-3
as the distance increased away from the discharge point. Lacerda et al. (2013) found
similar observations near oil exploration activity. This could be attributed to the
decrease of large and strong organic ligands (size > 5 nm) away from the discharged
effluents, and water discharges from an oil production refinery. On the other hand,
they could be associated with organic ligands that can dissociate fast and cross the
diffusive gel to the resin. The ratios of concentrations of DGT-labile fractions of Al,
0
10
20
30
40
50
60
70
80
90
100
Al Cr Mn Fe Co Ni Cu Zn Cd Pb V As Mo Se Sb W
CD
GT/
C(0
.45
μm fi
ltere
dpo
re sa
mlp
les)
Elements species
LA-1 LA-2 LA-3LB-1 LB-2 LB-3
Figure 6.16. Percentages of labile trace metals fractions using OP-DGT and FH-DGT in0.45μm filterable porewatersneardischarge point of a refinery in Al Fahal port, Muscat, Sultanate of Oman.

231
Cr, Co; Ni, Cu, Zn, Cd, and Pb showed slow resupply from solid phase in sediments at
all selected locations, and varied slightly with ranging from 0.01-0.44 (Figure 6.16).
This suggests that all species associated with strong DOM in the areas studied, and
colloidal Fe oxy/hydroxides (size > 5 nm), are able to pass through the 0.45µm filters
sample, but they are too large to cross through the hydrogel to be trapped in the resin.
In many coastal and harbour environments, Mn and Fe can be measured at high
concentrations. It can be observed that Cu and Cr measured at very low percentages,
which indicates that both metals fractions associate more strongly to many different
chelating agents and large aromatic DOM, than other divalent species in all studied
locations, due to intensive oil transportation refinery industry activities.
For Mn, it binds more weakly with ligands compared to other metals, in
accordance with the Chelex-100 information in the manual from Bio-Rad. The
percentages of CDGT-labile Mn fractions were higher and ranged between 0.33 and
0.89, which reflects that Mn is present as free ions with fast diffusing species through
the hydrogel in DGT, or bound weakly to ligands that can dissociate fast. Often Mn2+
can be displaced by Fe2+ in sediments containing high levels of Fe, and measured at
very low concentrations (Tankéré-Muller et al., 2012). As Fe is not stable, it can be
oxidized to the more stable Fe, which is complexed strongly with carboxylic acid
functional groups in Chelx-100. The ratio of CDGT-labile of Fe labile species ranged
from 0.22 to 0.334 in all studied sites, which indicates that Fe species associated with
aromatic organic ligands/colloids and sulfides released from the refinery and
discharged water ballast from transport tankers (Gao et al., 2009; Al-Husaini et al.,
2014). Similar results were found by Ahumada et al. (2011) for the above trace metals
in sediments.

232
The FH-DGT concentrations of labile V, As, Se, and Mo fractions were very
low and not significantly different at all studied locations; they were consistently
higher than the concentrations in pore waters (p<0.001) with percentages (0.01-0.3) as
shown in Table 6.7 This is most probably attributed to the weaker binding of these
anions to FH at high pH ≈ 8.17, or it could be associated with Fe oxyhydroxides and
organic colloids around the refinery industry (Österlund et al., 2010; Vasyukova et al.,
2010).
Considering the above, it can be said that the fractionations of the studied trace
metals were strongly influenced by sulfide, carbonate, aromatic organic matter,
colloids, and other ligands, in the sediments at all selected locations in Al Fahal port
near a discharge point of the refinery. Based on the obtained findings, it can be
observed that certain locations in Al Fahal economic port suffer from a slight increase
in some metals, such as V, Fe, Ni, and Cu. This is consistent with a previous study by
Al-Husaini et al. (2014); furthermore, similar observations were found by Al-Shuely et
al. (2009).
6.4.4. Assessing labile metals, pool size and their kinetic properties in soils
6.4.4.1. Soil pH, Organic Matter and Total Metal Concentrations The chemical properties of collected soils (%OC, pH and total extractable
metals concentrations) obtained according to the methods described in section 6.3.3.5,
are presented in Table 6.8. The %OC levels were varied and ranged between 11% and
19% with significant differences between Locations (1, 12, 13, 14 and 15), (p<0.05)
for all the selected locations, which shows the variation degree of organic matter
contamination along the coast near SIR. All collected soils samples contained medium
organic matter levels, except in location-1 near to (SIR) which exhibited a high

233
percent of OM; this reflects the presence of more intense oil and industrial
contamination.
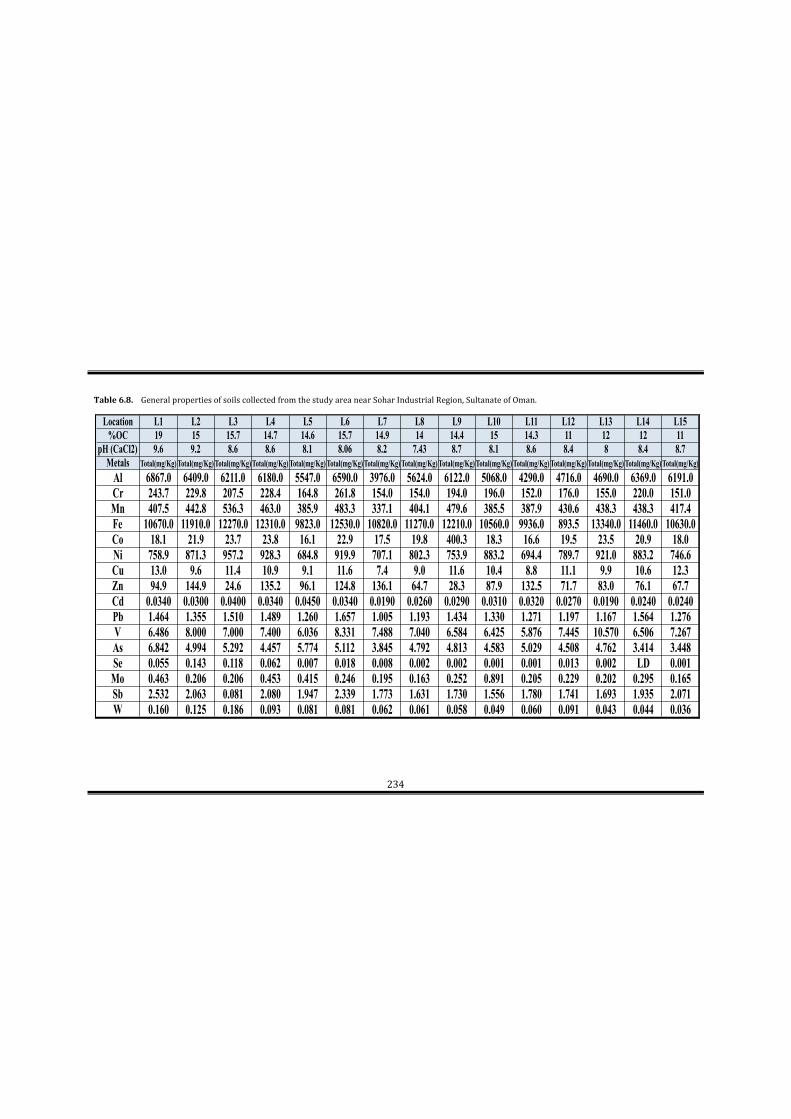
234
Table 6.8. General properties of soils collected from the study area near Sohar Industrial Region, Sultanate of Oman.
Location L1 L2 L3 L4 L5 L6 L7 L8 L9 L10 L11 L12 L13 L14 L15%OC 19 15 15.7 14.7 14.6 15.7 14.9 14 14.4 15 14.3 11 12 12 11
pH (CaCl2) 9.6 9.2 8.6 8.6 8.1 8.06 8.2 7.43 8.7 8.1 8.6 8.4 8 8.4 8.7Metals Total(mg/Kg) Total(mg/Kg) Total(mg/Kg) Total(mg/Kg) Total(mg/Kg) Total(mg/Kg) Total(mg/Kg) Total(mg/Kg) Total(mg/Kg) Total(mg/Kg) Total(mg/Kg) Total(mg/Kg) Total(mg/Kg) Total(mg/Kg) Total(mg/Kg)
Al 6867.0 6409.0 6211.0 6180.0 5547.0 6590.0 3976.0 5624.0 6122.0 5068.0 4290.0 4716.0 4690.0 6369.0 6191.0Cr 243.7 229.8 207.5 228.4 164.8 261.8 154.0 154.0 194.0 196.0 152.0 176.0 155.0 220.0 151.0Mn 407.5 442.8 536.3 463.0 385.9 483.3 337.1 404.1 479.6 385.5 387.9 430.6 438.3 438.3 417.4Fe 10670.0 11910.0 12270.0 12310.0 9823.0 12530.0 10820.0 11270.0 12210.0 10560.0 9936.0 893.5 13340.0 11460.0 10630.0Co 18.1 21.9 23.7 23.8 16.1 22.9 17.5 19.8 400.3 18.3 16.6 19.5 23.5 20.9 18.0Ni 758.9 871.3 957.2 928.3 684.8 919.9 707.1 802.3 753.9 883.2 694.4 789.7 921.0 883.2 746.6Cu 13.0 9.6 11.4 10.9 9.1 11.6 7.4 9.0 11.6 10.4 8.8 11.1 9.9 10.6 12.3Zn 94.9 144.9 24.6 135.2 96.1 124.8 136.1 64.7 28.3 87.9 132.5 71.7 83.0 76.1 67.7Cd 0.0340 0.0300 0.0400 0.0340 0.0450 0.0340 0.0190 0.0260 0.0290 0.0310 0.0320 0.0270 0.0190 0.0240 0.0240Pb 1.464 1.355 1.510 1.489 1.260 1.657 1.005 1.193 1.434 1.330 1.271 1.197 1.167 1.564 1.276V 6.486 8.000 7.000 7.400 6.036 8.331 7.488 7.040 6.584 6.425 5.876 7.445 10.570 6.506 7.267As 6.842 4.994 5.292 4.457 5.774 5.112 3.845 4.792 4.813 4.583 5.029 4.508 4.762 3.414 3.448Se 0.055 0.143 0.118 0.062 0.007 0.018 0.008 0.002 0.002 0.001 0.001 0.013 0.002 LD 0.001Mo 0.463 0.206 0.206 0.453 0.415 0.246 0.195 0.163 0.252 0.891 0.205 0.229 0.202 0.295 0.165Sb 2.532 2.063 0.081 2.080 1.947 2.339 1.773 1.631 1.730 1.556 1.780 1.741 1.693 1.935 2.071W 0.160 0.125 0.186 0.093 0.081 0.081 0.062 0.061 0.058 0.049 0.060 0.091 0.043 0.044 0.036

235
The pH soils were measured following the method described in section
6.3.3.5. At all studied locations, there was no substantial difference in the obtained
values of the soils’ pH: they ranged from 7.43-9.6. At locations-1 and -2, pH values
exceeded 9 (highly alkaline), which indicates presence of high levels of bicarbonate,
carbonate, aluminum (Al), and iron (Fe) fractions due to the influence of various
human activities related to the refinery and heavy industries in (SIR) (Leytem and
Mikkelsen, 2005; Dursun and Mikailsoy, 2015).
Total concentrations of studied trace metals were determined according to the
method described in section 6.3.3.5. The background levels of trace metals in soils
are important: Soil background concentrations of heavy metals are essential
standards for assessing the quality of soils in the environment (Chen et al., 2004).
There is a lack of database on background concentrations in Oman soils, and there is
limited information on local measurements. Various international studies have
reported background concentrations of trace metals in soils, as shown in Table 6.9
(Boulding, 1996; Chen et al., 2004; Su and Yang, 2008; Alloway, 2010; Alfaro et al.,
2015).

236
Table 6.9. Natural background levels (mg/kg) of studied metals in soils from other countries in the literature.
Metals (mg/kg) Cuba China Ireland USA Beijing The
average Cd 1.2 0.07 0.2 1.6 0.119 0.64 Pb 34.6 24 20 16 57.5 30.42 Zn 90.7 67 72 48 57.5 67.04 Cu 83.7 20.0 19.15 17 18.7 31.71 Ni 294.2 23 12.45 13 24.6 73.45 Cr 463.2 54 37 37 29.8 124.20 V 127.1 77 47.5 58 ND 77.40 Sb 6.9 1.1 ND ND ND 4.00 Co 31.4 11 8.4 16.5 ND 16.83 Mo 0.5 1.2 0.3 ND ND 0.67 As 10.8 9.2 3.2 17.8 7.09 9.62
Al (g/kg) 49.9 49.90 Fe (g/kg) 19.1 19.10
W 0.7-2.7 0.7-2.7 Se 0.1-2 0.1-2 Mn 0.5-500 0.5-500
The average of the measured total content of studied trace metals in soil
samples at all selected locations was within the international standard for soils,
except for Co and Ni in all analysed samples which exceeded the alert levels, as
illustrated in Tables 6.8 and 6.9. The high concentrations of Ni and Co in the soils
around commercial areas is no doubt associated with the important influence of
refinery and industrial activities. Similar observations showing exceeding
concentrations of Ni were reported by Baawain et al. (2014).
6.4.4.2. Labile metals, soil solution and solid phase extraction DGT-measured concentrations.
The data for the concentrations of studied metals measured by DGT are
shown in Tables 6.10 and 6.11. It can be seen that all studied metals were detected
by DGT in almost all selected soils along coastal area around (SIR). Results showed
237
a significant variation of measured metal concentrations by both the DGT and soil
solutions methods in all selected soils probably attributed to the variation of
industrial effluents and crude oil spills. The highest DGT concentration of Al, Fe and
Mn at (L6, L7, L8, L9, L10, L11, L12 and L14) soils ranged from (12-22 µg/L), (14-
63 µg/L) and (9-17µg/L) respectively. The values indicate that, among the metal Fe
was present in high concentration; however, it was in the range of background level
(Aslam et al., 2013). Whereas, Cr, Co, Ni, Cu, Zn, Pb and Cu were present relatively
in low DGT concentrations at average range between 0.02 µg/L and 2.1 µg/L in all
selected soils samples. This is probably attributed to the stable colloids and large
aromatic ligands that hinder metals resupply from the solid phase. Additionally, it
may be possible to increase the time deployment of DGT from 16 hours to 24 hours,
which would allow for more dissociation of labile organic fractions and stable
colloidal ligands through the diffusive layer (Conesa, Schulin et al. 2010).
The FH-DGT concentrations of labile V, As, Se, Mo, Sb, and W fractions
were very low and follow a similar trend in all collected soils, with average range
between 0.02±0.0026 µg/L to 2.13± 0.12 µg/L. Based on the CDGT of studied trace
metals in the selected soils around (SIR), the coastal soils can be considered
uncontaminated and safe.
Soil solutions concentrations
The concentrations of studied trace metals in the soil solutions (post-DGT
deployment) are shown in Tables 6.10 and 6.11. Similarly, here also a significant
variation among the metals concentrations was observed and the highest
concentrations were detected by both the DGT and porewater methods in the
locations soils (L6, L7, L8, L9, L10, L11, L12 and L14). The general distribution of
Cr, Mn, Co, Ni and Zn and Sb concentrations in soil solutions is similar to that of the

238
measured concentrations in DGT Tables 6.10 and 6.11. The reasonable correlation
for most studied metals at most locations indicates that DGT sampler is a suitable
dynamic technique for assessing soil solutions metals concentrations trends in coastal
sandy soils impacted with industrial and crude oil activities. Interestingly, the
concentrations of Al in soil solutions at locations (L2, L12 and l3) was higher than 6
times higher than CDGT-labile Al fractions, which reflects the poorer accumulate of Al
by the Chelex resin (Panther et al., 2012). The highest soil solutions concentrations of
Fe were measured in the locations soils (L9, L10 and L11), 119, 129 and 133 µg/kg
respectively, however low ratios of Fe were detected by DGT in these selected soils
samples, indicating lower lability of Fe fractions in locations. The total dissolved
concentrations of Cd, Pb, V, As, Se, Mo, Sb, and W in all selected soils were
generally low, which was consistent with its lower total content.
R values = (CDGT/Csolution)
The R values of metals in all collected soils presented in Tables 6.10 and 6.11.
The R ratios for Cr, Mn, Co, Ni and Zn ranged between (0.30-0.80), (0.5-1.08) and
(0.39-0.84), (0.50-0.86) and (0.35-0.82) respectively, representing an intermediate
capacity for metal resupply from the solid phase. Also, it appears that Mn and Ni are
resupplied more easily than Cu from the soil solid phase. Whereas the R values of Al,
Fe, Cu, Cd and Pb ranged between 0.14 and 0.80, generally indicating an
intermediate capacity for metal resupply from the solid phase.
The obtained R values of V, As, Se, Mo, Sb, and W species in collected soils
ranged from 0.04 to 0.70 at all locations, as shown in the Tables 6.10 and 6.11, which
indicates poor buffering of metals concentrations from solid phase resupply. This is
attributed to the presence of non-labile metal-ligands and colloids dissociating very
slow providing poor resupply to the solution (Zhang et al., 1998; Senila et al., 2012).

239
The R values for all metals except Mn generally did not show such good
agreement between CDGT and Csolution for all selected soils. This appears that metals in
the soils generally are appreciably complexed by organic ligands and diffuse slowly
through the gel, and DGT will measure only a proportion of the metal in solution
(Zhang et al., 2006).
CaCl2 extraction (solid phase)
The averages of extractable targeted metal contents obtained by 0.01M CaCl2
extractions are presented in Tables 6.10 and 6.11. Compared to the metal contents in
the Table 6.8, the average concentrations of the CaCl2 extracted metals fractions were
relatively low in all selected soils may be due to Fe and Mn oxide minerals and
ligands. The concentrations of Co, Cr, Cu, Pb, Cd, V, As, Se, Mo, Sb, and W showed
a considerable variation and were low at all selected locations, which is consistent
with the findings in Table 6.8, probably due to the low content in soils. The measured
total dissolved concentrations of Fe and V were high in L13 and L15 probably due to
the crude oil contamination in these areas. Similarly, the obtained concentrations of
Al, Mn, Fe and Ni were also low (166-277), (22-44), (210-666) and (44-85)
respectively, which is inconsistent with the high total content in Table 6.8 this may be
attributed to the present of large stable oil ligands in the area.

240
Table 6.10. The measured CDGT (µg/L), Csol, R values and extracted concentrations in CaCl2
solutions (µg/kg) of targeted 10 trace metals in fifteen sandy coastal soils, around (Sohar Industrial Region), Sultanate of Oman, January 2015.

241
Table 6.11. The measured CDGT (µg/L), Csol, R values and extracted concentrations in CaCl2 solutions (µg/kg) of targeted oxyanions metals in fifteen sandy coastal soils, around (Sohar Industrial Region), Sultanate of Oman, January 2015.

242
6.4.4.3. Assessing resupply pool size and kinetic parameters using DIFS
Whereas Kd basically controls the extent of the amount of trace metals that can
be resupplied by the solid phase in soils, Tc and k−1 relate directly to capacity of solid
phase to resupply the metals concentration into soil solutions (Chen et al., 2014).
6.4.4.3.1. The distribution coefficient, (Kd)
The distribution coefficient, Kd, expressed as the ratio between the
concentrations extractable metal in the solid phase and its concentration in soil
solutions using the following equation (6.5) (Lehto et al., 2008):
K =
(6.5)
For 15 selected soils Kd ranged from (1.8-33) ml/g for (Al, Cr, Mn, Fe, Ni and
Cu) as illustrated in Table 6.11. The crude oil spills and industrial effluents in these
locations appeared to decrease the available solid phase pool of these metals for
selected soils. This is consistent with lower labile metals concentrations of (Al, Cr,
Mn, Fe, Ni and Cu) in DGT and the total dissolved content in soil solutions with a
significant variation in all soils. For Co, clearly the (Kd) values in soils samples of
(L1, l2, L3, L10, L12 and L14) are low and ranged between (5-34) ml/g, probably due
to the organic ligands introduced by crude oil spills may modify the availability of Co
species from the solid phase. For soils samples from locations (L4, L5, L6, L7, L8, L9
and L13), the Kd values were high and ranged between (46-555) ml/g, which suggests
that suggest that a substantial fraction of the background metal is in non-labile form.
The Kd values of Zn were low in soils at (L6, L8, L10, L11 an L13), ranged
between (14-33) ml/g and high at (L1-5, L7, L9, L12, L14 and L15) ranged from (41-

243
91) ml/g. For the soils collected from (L10-L13), the Kd values of Cd were higher
than other locations and ranged between (50-63) ml/g Table 6.11. The Kd values of
Pb were high at (L2, L7, L8 and L11) of 266, 65, 43 and 55 ml/g respectively. The
higher values of Kd indicated that a high metals fractions retention by the solid phase
through sorption reactions and low concentration available in the soil solution (Mench
et al., 2000).
The Kd values of oxyanion metals V, As, Se and Mo in Table 6.12 are low at
all selected locations, which suggests that the metals sorption appeared to be strongly
influenced by more stable colloidal organic ligands in the all selected soils or due to
their low contents in the soils. The elements Sb and W showed in general a high
average values of (Kd) in the selected soils, indicating highly labile, which imply that
a substantial fraction of the background metal is in non-labile form (Mench et al.,
2000).
6.4.4.3.2. Response time (Tc)
Tc values were obtained using DIFS model as described in Chapter 5. Tc
reflects the kinetics of supply, which is influenced by both the concentration in the
solid phase, pool size, and the dissociation rate (Zhang et al., 2006). It can be noted
that Tc values of all trace metals in selected metals were low, indicating a very fast
supply of metals (Table 6.12). For oxyanions metals they obtained Tc values
generally high in all selected soils, which indicates a reduction of resupply from the
solid phase to soil solution due to low content of these metals in soils (Table 6.13).
This is consistent with findings of total content in soils in Table 6.8.
244
6.4.4.3.3. Dissociation rate (K-1)
The dissociation rates k-1 were calculated from Tc, Pc, and Kd using equation
(5.6) in Chapter 5. The maximum values of Tc produce minimum values of k-1 as
shown in Tables 6.12 and 6.13. For Al in soils samples in (L1 and L2), Co in (L13),
Cu in (L8 and L9), Zn in (L2, L3, l4, L6 and L9), Cd in (L1, L3, L4, L5, L10, L11,
L12, L13 and L15), values of k-1 were approximately in the average 6.1 x 10⁻⁵ /s. This
is consistent with the high R values in Table 6.9, showing that soils in the locations
had poorer resupply ability from solid phases to the soil solutions. For Pb, the K-1
values for soils in locations (L1, L2, L4, L8, L9, L12, L15) were, 4.3 x 10⁻⁶ /s, 1.0 x
10-6 /s, 2.92 x 10⁻⁵ /s, 5.0 x 10⁻⁴ /s, 3.4 x 10⁻⁶ /s, 9.5 x 10⁻⁶ /s, 1.1 x 10⁻⁵/s. which
indicates slow supply of Pb in these locations comparing to others selected locations.
For the oxyanions metals the k-1 values for all selected soils generally exhibited a very
slow resupply from solid phase to solutions, as shown in Table 6.13.
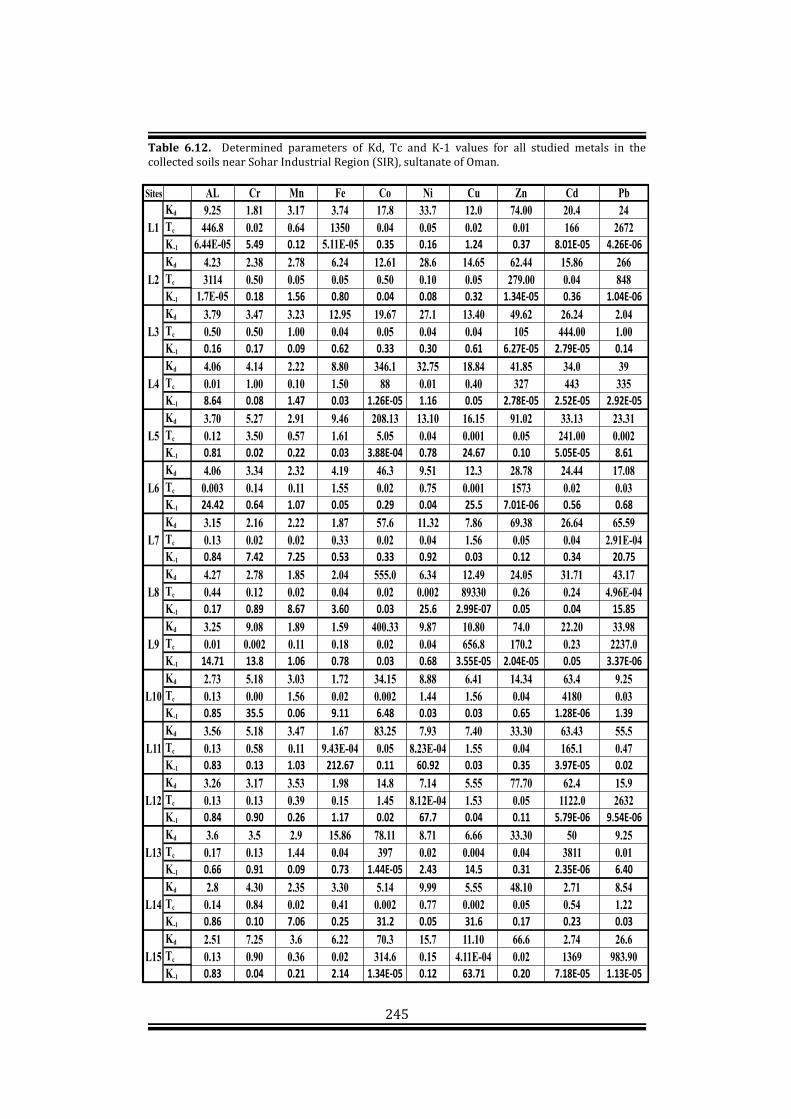
245
Table 6.12. Determined parameters of Kd, Tc and K-1 values for all studied metals in the collected soils near Sohar Industrial Region (SIR), sultanate of Oman.
Sites AL Cr Mn Fe Co Ni Cu Zn Cd PbKd 9.25 1.81 3.17 3.74 17.8 33.7 12.0 74.00 20.4 24
L1 Tc 446.8 0.02 0.64 1350 0.04 0.05 0.02 0.01 166 2672K-1 6.44E-05 5.49 0.12 5.11E-05 0.35 0.16 1.24 0.37 8.01E-05 4.26E-06
Kd 4.23 2.38 2.78 6.24 12.61 28.6 14.65 62.44 15.86 266L2 Tc 3114 0.50 0.05 0.05 0.50 0.10 0.05 279.00 0.04 848
K-1 1.7E-05 0.18 1.56 0.80 0.04 0.08 0.32 1.34E-05 0.36 1.04E-06
Kd 3.79 3.47 3.23 12.95 19.67 27.1 13.40 49.62 26.24 2.04L3 Tc 0.50 0.50 1.00 0.04 0.05 0.04 0.04 105 444.00 1.00
K-1 0.16 0.17 0.09 0.62 0.33 0.30 0.61 6.27E-05 2.79E-05 0.14
Kd 4.06 4.14 2.22 8.80 346.1 32.75 18.84 41.85 34.0 39L4 Tc 0.01 1.00 0.10 1.50 88 0.01 0.40 327 443 335
K-1 8.64 0.08 1.47 0.03 1.26E-05 1.16 0.05 2.78E-05 2.52E-05 2.92E-05
Kd 3.70 5.27 2.91 9.46 208.13 13.10 16.15 91.02 33.13 23.31L5 Tc 0.12 3.50 0.57 1.61 5.05 0.04 0.001 0.05 241.00 0.002
K-1 0.81 0.02 0.22 0.03 3.88E-04 0.78 24.67 0.10 5.05E-05 8.61
Kd 4.06 3.34 2.32 4.19 46.3 9.51 12.3 28.78 24.44 17.08L6 Tc 0.003 0.14 0.11 1.55 0.02 0.75 0.001 1573 0.02 0.03
K-1 24.42 0.64 1.07 0.05 0.29 0.04 25.5 7.01E-06 0.56 0.68
Kd 3.15 2.16 2.22 1.87 57.6 11.32 7.86 69.38 26.64 65.59L7 Tc 0.13 0.02 0.02 0.33 0.02 0.04 1.56 0.05 0.04 2.91E-04
K-1 0.84 7.42 7.25 0.53 0.33 0.92 0.03 0.12 0.34 20.75
Kd 4.27 2.78 1.85 2.04 555.0 6.34 12.49 24.05 31.71 43.17L8 Tc 0.44 0.12 0.02 0.04 0.02 0.002 89330 0.26 0.24 4.96E-04
K-1 0.17 0.89 8.67 3.60 0.03 25.6 2.99E-07 0.05 0.04 15.85
Kd 3.25 9.08 1.89 1.59 400.33 9.87 10.80 74.0 22.20 33.98L9 Tc 0.01 0.002 0.11 0.18 0.02 0.04 656.8 170.2 0.23 2237.0
K-1 14.71 13.8 1.06 0.78 0.03 0.68 3.55E-05 2.04E-05 0.05 3.37E-06
Kd 2.73 5.18 3.03 1.72 34.15 8.88 6.41 14.34 63.4 9.25L10 Tc 0.13 0.00 1.56 0.02 0.002 1.44 1.56 0.04 4180 0.03
K-1 0.85 35.5 0.06 9.11 6.48 0.03 0.03 0.65 1.28E-06 1.39
Kd 3.56 5.18 3.47 1.67 83.25 7.93 7.40 33.30 63.43 55.5L11 Tc 0.13 0.58 0.11 9.43E-04 0.05 8.23E-04 1.55 0.04 165.1 0.47
K-1 0.83 0.13 1.03 212.67 0.11 60.92 0.03 0.35 3.97E-05 0.02
Kd 3.26 3.17 3.53 1.98 14.8 7.14 5.55 77.70 62.4 15.9L12 Tc 0.13 0.13 0.39 0.15 1.45 8.12E-04 1.53 0.05 1122.0 2632
K-1 0.84 0.90 0.26 1.17 0.02 67.7 0.04 0.11 5.79E-06 9.54E-06
Kd 3.6 3.5 2.9 15.86 78.11 8.71 6.66 33.30 50 9.25L13 Tc 0.17 0.13 1.44 0.04 397 0.02 0.004 0.04 3811 0.01
K-1 0.66 0.91 0.09 0.73 1.44E-05 2.43 14.5 0.31 2.35E-06 6.40
Kd 2.8 4.30 2.35 3.30 5.14 9.99 5.55 48.10 2.71 8.54L14 Tc 0.14 0.84 0.02 0.41 0.002 0.77 0.002 0.05 0.54 1.22
K-1 0.86 0.10 7.06 0.25 31.2 0.05 31.6 0.17 0.23 0.03
Kd 2.51 7.25 3.6 6.22 70.3 15.7 11.10 66.6 2.74 26.6L15 Tc 0.13 0.90 0.36 0.02 314.6 0.15 4.11E-04 0.02 1369 983.90
K-1 0.83 0.04 0.21 2.14 1.34E-05 0.12 63.71 0.20 7.18E-05 1.13E-05

246
Table 6.13. Determined parameters of Kd, Tc and K-1 values for all studied oxyanions in the collected soils near Sohar Industrial Region (SIR), sultanate of Oman.
Sites V As Se Mo Sb WKd 3.35 7.14 6.94 7.77 111 59.5
L1 Tc 0.3235 1209 7038 1574 0.0005 1997K-1 0.234 3.06E-05 5.40E-06 2.2E-05 4.92 2.3E-06Kd 0.78 5.24 7.40 21.65 139.96 88.80
L2 Tc 0.003 2514 6825 0.30 46 2.5K-1 76.72 1.71E-05 4.51E-06 0.04 3.6E-05 0.0011Kd 5.6 6.1 7.63 10.79 202.9 84.8
L3 Tc 2 0.001 9591 0.10 0.1 0.5K-1 0.03 51.52 4.31E-06 0.30 0.0162 0.0077Kd 2.69 6.38 7.40 7.32 174.43 84.36
L4 Tc 4451 0.01 7837 3851 363 839K-1 2.35E-05 5.68 6.34E-06 1.3E-05 6.1E-06 5.4E-06Kd 3.08 21.55 3.11 8.60 78.63 78.97
L5 Tc 13170 473.7 22540 676.4 1006 60320K-1 8.88E-06 3.93E-05 5.15E-06 6.7E-05 5.1E-06 8.5E-08Kd 4.27 7.65 6.22 7.4 111 209.7
L6 Tc 3780 7021 4196 0.773 196.7 697.8K-1 1.85E-05 5.74E-06 1.17E-05 0.054 1.5E-05 2.19E-06Kd 5.4 10.3 5.00 5.96 19.4 172.7
L7 Tc 6545 2782 24490 3.11E-04 440.8 334.1K-1 1.1E-05 1.34E-05 3.02E-06 209.06 4.56E-05 6.89E-06Kd 2.16 18.87 5.29 9.51 55.5 66.60
L8 Tc 9998000 1041 23190 0.035 772.4 4043K-1 1.37E-08 1.71E-05 2.62E-06 0.992 7.94E-06 1.26E-06Kd 3.00 7.42 9.25 12.33 38.95 138.75
L9 Tc 14780 1745 24670 2561 0.029 1260K-1 5.36E-06 1.92E-05 1.12E-06 7.12E-06 0.23 1.47E-06Kd 2.99 5.46 4.81 5.55 74 111
L10 Tc 72340 11990 22890 1667 637.51 2178K-1 1.42E-06 4.92E-06 2.12E-06 3.48E-05 7.22E-06 1.41E-06Kd 4.16 6.30 5.55 7.74 92.50 124.72
L11 Tc 8331 3.83E-04 114900 2.58E-03 945.51 281.9K-1 1.12E-05 162.5 6.11E-07 19.9 4.76E-06 1.19E-05Kd 2.84 6.44 3.7 8.33 55.50 92.5
L12 Tc 12750 9620 107500 136.9 773.12 267.8K-1 9.87E-06 6.20E-06 9.25E-07 3.42E-04 9.45E-06 1.64E-05Kd 20.81 8.325 4.625 6.66 88.81 41.669
L13 Tc 44990 3853 6788 3.41E-03 519.80 309.5K-1 4.70E-07 1.33E-05 1.31E-05 18.56 9.68E-06 2.14E-05Kd 4.76 5.18 7.4 8.63 137.64 70.2
L14 Tc 6152 638.4 2.26E-04 1.64 569.80 1570K-1 1.20E-05 1.07E-04 216.13 0.026 4.82E-06 3.42E-06Kd 4.93 5.27 9.08 4.40 53.25 50.97
L15 Tc 15670 2332 9646 0.0002 7693 1133K-1 3.64E-06 2.30E-05 3.30E-06 311.05 7.25E-07 5.14E-06
247
6.5. Conclusion
Four types of DGT with different membranes and binding layers,
(Nafion112)-DGT, (1000 MWCO-dialysis)-DGT, OP-DGT and FH-DGT, were used
to investigate the effect of chemical contaminants on the trace metals speciation
around economic large ports.
More than 97% of Al and 94% of Fe were non-labile fractions in 1000
MWCO-dialysis and Nafion112 at all the selected seawaters locations in AlFahal and
(SIR) ports. Both metals were dominated by negatively charged organic complexes
(>1000 MWCO). The concentrations of labile Al and Fe at (SIR) are slightly higher
than the concentrations at the Al Fahal port, which is consistent with the presence of
industrial discharges around (SIR). The labile concentrations of Cr, Co, Ni, Cu, Cd,
and Pb were generally low and not significantly difference between the sampling
locations. This suggests that theses metals may be complexed strongly with organic
ligands that are less labile. The measured concentrations of labile V in the FH-DGT
sampler was very low at the four selected seawaters locations ranged between 4%-5%
of the total dissolved concentration due to high levels of large colloidal and strong
complexing ligands in crude oil.
The obtained labile species of Ni in groundwaters were ranged between 8.4
µg/L and 82 µg/L. in SIR locations. The smallest proportion of Ni labile species
(11%-29%) were measured by (Nafion112)-DGT in all selected open wells. The
labile Fe concentration in Wells-1 and -2 were much higher than those in Well-3 and
(RIE)’s wells. The percentages of Fe measured by (Nafion112) were 15.3%, 37% and
19% of the total dissolved reflects the presence of fairly large negatively ligands. The
measured Al species in (Nafion112)-DGT at all selected open wells waters were
lower than those estimated by both above versions ranged from 5% - 53%. This
248
suggests that Al species bound to large natural and negatively charged colloidal
organic ligands in all studied open wells were excluded by the Nafion112 membrane.
In Khadafan near (SIR), the relative Fe labile concentration in Wells-1 and -2 were
much higher than those in Well-3 and (RIE)’s wells and the measured (Nafion112)-
DGT-labile Fe species were very low, 15.3%, 37% and 19% of the total content in
0.45 µm filterable grab samples respectively. This is due to the presence of Fe in large
colloids/particulates and negatively complexes excluded by the Nafion112 membrane.
The measured As, Mo, Se; Sb, and W concentrations in FH-DGT were very low, and
lower than their background concentrations in groundwater in most countries, which
indicates thate the studied open wells at both sites were uncontaminated by these
above oxyanions metals. However, the percentages of all targeted oxyanions labile
fractions in the three studied wells in Khadafan near (SIR) ranged between 8% and
86%, which reflects the presence of iron and large organic colloidal particles that are
too large to pass through the diffusive gel
For coastal sediments near the discharge point at Al Fahal port, the total
dissolved concentrations of trace metals (Fe, Ni, Cu, V, As, Se and Mo) in porewaters
were high at all selected locations and did not vary significantly. This is probably
attributed to the high inputs originating from antifouling paints, discharges from the
refinery, and oil spill. The DGT measured labile concentrations of Fe, Ni, Cu, and V
were higher near the discharge point. The ratios of concentrations of DGT-labile
species of Al, Cr, Co; Ni, Cu, Zn, Cd, and Pb showed slow resupply from solid phase
in sediments at all selected locations ranged from 0.01-0.44. Due to the complexation
with strong DOM in the areas studied, and colloidal Fe oxy/hydroxides from crude
oil.

249
The DGT concentration of Al, Fe and Mn in soils collected from SIR ranged
from (12-22 µg/L), (14-63 µg/L) and (9-17µg/L), respectively, in line with the
background level. The average concentrations of the CaCl2 extracted metals were
relatively low in all selected soils may be due to Fe and Mn oxide minerals and
ligands. The dissociation rate (k−1) from the solid phase decreased with increased
crude oil ligands contamination. The Kd basically controls the extent of the amount of
trace metals that can be resupplied by the solid phase in soils. For 15 selected soils Kd
ranged from (1.8-33) ml/g for (Al, Cr, Mn, Fe, Ni and Cu). The (Kd) values in soils
samples of (L1, l2, L3, L10, L12 and L14) are low and ranged between (5-34) ml/g.
For the soils collected from (L10-L13), the Kd values of Cd were higher than other
locations and ranged between (50-63) ml/g. The Kd values of Pb were high at (L2, L7,
L8 and L11) of 266, 65, 43 and 55 ml/g respectively. The higher values of Kd
indicated that a high metals fractions retention by the solid phase through sorption
reactions and low concentration available in the soil solution. The Kd values of
oxyanion metals V, As, Se and Mo were low at all selected locations, while Sb and W
showed in general a high average values of (Kd) in the selected soils.
Based on the CDGT of studied trace metals in the selected soils around (SIR),
the coastal soils can be considered uncontaminated and safe. The DGT technique has
shown to be robust and reliable, which can provide the precise information regarding
the quality of the seawaters, groundwaters, soils, and sediments in the Sultanate of
Oman.

250
Chapter 7 – General conclusions and future work
This work aims to further develop and apply the dynamic speciation technique
DGT (diffusive gradients in thin films) for assessing Oman’s aquatic environment.
The concentrations and speciation of trace metals in seawater, sediments, soils and
groundwaters at Sultanate of Oman around two large economic ports with industries
and refineries and near industrial regions were measured.
The work carried out in synthetic solutions with 0.5 - 0.7 M NaCl and crude
oil shows that crude oil contamination contributes to the trace metals load as WSF
and labile complexes. The DGT technique has been further improved by employing
varying thicknesses of diffusive layers (∆g), restricted gel, different pore size
(MWCO) dialysis and Nafion112 cation exchange membranes.
Firstly, the potential of DGT technique was assessed in Chapter 3 for
determining the labile speciation of trace metals in synthetic seawaters polluted with
varying concentrations of crude oil OWR% under varying mixing times. The
concentrations of labile metals by all versions of DGT samplers were significantly
affected by the presence of oil ligands and showed an increase as well as a decrease in
metal concentrations as a result of increased amounts of crude oil OWR%. Using
DGT devices containing varying thicknesses of diffusive gel showed that DGT labile
species increased as a function of the diffusive layer thickness in synthetic solutions
with and without oil. For Cd and Cu, DGT measurements were significantly lower
than those measured by resin extraction (WSF) due to complexation with large
ligands which cannot diffuse across the hydrogel. The DBLs are influenced by oil
ligands (apparent layer) and it is greater than the (physical layer) (G) explained
251
according to the Eigen mechanism. For all trace metals studied, except for Cu at high
OWR (5% and 25%), the DGT technique showed similar trends as obtained by resin
extraction method. DGT of varying thicknesses were validated by demonstrating a
linear mass versus 1/∆g relationship for studied trace metals in synthetic seawater
with and with no oil, where experiment data were compared with DGT theoretical
lines. Slight deviation of Cu and huge deviation of Cd was observed.
Combination of DGT and resin extraction methods for trace metals in
solutions of different OWR% is useful for further quantitatively understand the effect
of crude oil ligands on trace metals fractionation in the synthetic solution of high
ionic strength.
Secondly, further development of DGT for speciation measurements of trace
metals in crude oil contaminated seawater using different separation membranes was
achieved in Chapter 4. It was found to be capable to assess the influence of the crude
oil ligands of various types and sizes on the lability and mobility of targeted trace
metals in high ionic strength solutions in the presence of different levels of OWR%.
The diffusion coefficients through filter membrane and hydro gel with Nafioin112
were much lower than those measured through filter membrane and diffusive gel with
and without dialysis, 35 to 40 times lower for Co, 26 to 35 times lower for Pb and Zn
20 to 26 times lower for Cu, Cd and Ni. Using Nafion112 membrane or/and dialysis
membrane in DGT can further understanding metal speciation in solutions of varying
OWR%. The measured concentrations of Co, Cd, Cu and Zn in (Dialysis1000
MWCO)-DGT samplers were lower than those determined in 1000 MWCO Micro
Float microdialysis concentrations. This is due to the existence of low molecular
weight Co, Cd, Cu and Zn species, small enough to pass through the 1000 MWCO-

252
Micro Float microdialysis but not labile enough to be retained in the (Dialysis 1000
MWCO)-DGT samplers.
Thirdly, the effect of crude oil and aging time on the trace metals availability
in soils of different properties was investigated in Chapter 5. Both factors were found
to significantly influence the measured metal concentrations of DGT-labile,
extractable by CaCl2 and soil solutions. Increases of crude oil treatments in soils
promoted the formation of non-labile species of Cu and Pb and limited the availability
of both metals. Values of labile pool size, Kd, and R (ratio of CDGT and Csoln) were
calculated and the kinetic parameters (response time Tc and desorption rate k−1) were
obtained using DIFS (DGT Induced Fluxes in Soils and sediments) model. The trend
changes for k-1 values of studied metals in three selected soils were influenced by
crude oil amendemnets and aging time. Therefore, risk assessment of a wide range of
soil types is likely to be more effective when using a technique such as DGT, which
accommodates the kinetic limitation.
Fourthly, the developed dynamic speciation technique DGT was used for
assessing water quality and soil quality in Sultanate of Oman Chapter 6. Four
versions of DGT devices with different membranes, OP-DGT, (1000 MWCO)-DGT,
(Nafion112)-DGT and FH-DGT for speciation measurements were deployed in
seawaters, grounwaters, soils and sediments.
The study clarified the picture of chemical contaminants and their effect on
the trace metals concentration and speciation around these economic regions. Based
on findings, the measured concentrations studied trace metals in Nafion112-DGT and
(1000 MWCO-Dialysis)-DGT devices were much lower than total concentrations by
ICP-MS because they a dominated by large and negatively charged organic
complexes. The measured concentrations of labile V were very low at the four

253
selected seawaters locations due to high levels of large colloidal and strong
complexing ligands from crude oil contamination. The concentrations of labile Al, Ni,
Zn and Fe at (SIR) are slightly higher than the concentrations at the Al Fahal port,
which is consistent with the presence of industrial discharges around (SIR). The
concentrations of Cr, Co, Ni, Cu, Cd, and Pb in all used DGT versions were generally
low and not significantly difference between the sampling locations because they
complexed strongly with oil organic ligands that are less labile. The FH-DGT-labile V
species was very low at all selected seawaters due to the formation of large colloidal
and strong complexing ligands in crude oil. In Khadafan near (SIR), the relative Fe,
Mn and Ni labile concentration in Wells-1 and -2 were much higher than those in
Well-3 and (RIE)’s wells. The measured As, Mo, Se, Sb, and W concentrations in
FH-DGT were very low, and lower than their background concentrations in
groundwater in most countries, which implies that all selected open waters wells in
Muscat and Sohar were uncontaminated by these above.
For coastal sediments near the discharge point at Al Fahal port, the total
dissolved concentrations of trace metals (Fe, Ni, Cu, V, As, Se and Mo) in porewaters
were high at all selected locations and did not vary significantly due to the high inputs
originating from antifouling paints, discharges from the refinery, and oil spill. The
CDGT of Fe, Ni, Cu, and V were higher near the discharge point.
The DGT concentrations of Al, Fe and Mn in 15 soils collected from SIR were
in line with the background levels. The Kd values of oxyanion metals V, As, Se and
Mo were low at all selected locations, while Sb and W showed in general a high
average values of (Kd) in the selected soils. The dissociation rate (k−1) from the solid
phase decreased with elevated oil ligands contamination. The (Kd) values of Co in
soils samples of (L1, l2, L3, L10, L12 and L14) are low and high for Cd and Pb. The

254
Kd values of oxyanion metals V, As, Se and Mo were low at all selected locations,
while Sb and W showed in general a high average values of (Kd) in the 15 selected
soils.
The obtained Tc values of all trace metals in selected metals were low,
indicating a very fast supply of metals. For oxyanions metals they obtained Tc values
were generally high in all selected soils, which suggest a poor buffering of these
metals from the solid phase to soil solution. The Tc values of all trace metals in
selected metals were low, indicating a very fast supply of metals. For oxyanions
metals, the obtained Tc values generally high in all selected soils, which indicates a
reduction of resupply from the solid phase to soil solution due to low content of these
metals in soils. Based on the CDGT of studied trace metals in the selected soils around
(SIR), the coastal soils can be considered uncontaminated and safe.
The work has demonstrated that DGT technique is robust and reliable tool that
can be used to assess the effect of crude oil ligands on the concentrations of available
trace metals species in seawater, groundwater, sediments and soils.
Future work.
Although wide investigations on the DGT development has been performed in this
study, further studies using DGT with different membranes are needed to assess the
effect of crude oil ligands on the trace metals speciation.
(i) Application of these developed DGT versions to different types of crude
oils under varying mixing rate, temperature, salinity, pH, photo-oxidation
and separation time to gain more understanding on the performance and
usefulness of DGT.
(ii) Using dialysis membranes of smaller pore size in the range 100-500
(MWCO) in DGT for more selectivity and efficiency for metals fractions
255
discrimination in crude oil contaminated marine systems and
groundwaters.
(iii) Two different applied levels of crude oil (2% and 8% v/w) often had no
significance effect on Cd and Pb labile metals concentrations in studied
soils. Therefore, it is necessary to point out that future work need to be
conducted on crude oil contaminated soils using higher concentration and
different types of crude oil to obtain a more complete picture on the
assessment of the influence of oil ligands on trace metals speciation in
soils extremely contaminated with crude oil.
(iv) Further studies are recommended to extend for assessing the levels of trace
metals, organic compounds and pesticides in seawater, groundwaters,
sediments and soils around all economic ports, industrial and agricultural
practices in Sultanate of Oman using DGT dynamic technique.
(v) Develop a framework and standards that assists development of criteria for
the protection of Omani environment.

256
References
ABBASSE, G., B. OUDDANE and J. C. FISCHER (2003). "Determination of trace metal complexes by natural organic and inorganic ligands in coastal seawater." Analytical sciences 19(4): 529-535.
Abdul-Wahab, S. and B. Jupp (2009). "Levels of heavy metals in subtidal sediments in the vicinity of thermal power/desalination plants: a case study." Desalination 244(1): 261-282.
Abernathy, C. and A. Morgan (2001). "Exposure and health effects."
Abha, S. and C. S. Singh (2012). Hydrocarbon pollution: effects on living organisms, remediation of contaminated environments, and effects of heavy metals co-contamination on bioremediation, INTECH Open Access Publisher.
Achterberg, E. P. and C. Braungardt (1999). "Stripping voltammetry for the determination of trace metal speciation and in-situ measurements of trace metal distributions in marine waters." Analytica chimica acta 400(1): 381-397.
Adesina, G. O. and K. A. Adelasoye (2014). "Effect of crude oil pollution on heavy metal contents, microbial population in soil, and maize and cowpea growth." Agricultural Sciences 2014.
Agbogidi, O. (2013). Trace metal components of Gambaya albida (Linn.) grown in soils contaminated with spent lubricating oil. Proceedings of the International conference on Environmental Pollution and Remediation organized by the World Academy of Science, Engineering and Technology held at the Holiday Inn, Sandton, Johannesburg, South Africa.
Ahmad, H., A. Tsafe, A. Zuru, R. Shehu, F. Atiku and A. Itodo (2010). "Physicochemical and heavy metals values of Nigerian crude oil samples." International Journal of Natural and Applied Sciences 6(1).
Ahmed, F., M. H. Bibi, K. Seto, H. Ishiga, T. Fukushima and B. P. Roser (2010). "Abundances, distribution, and sources of trace metals in Nakaumi–Honjo coastal lagoon sediments, Japan." Environmental monitoring and assessment 167(1-4): 473-491.
Ahmed, M. E. I., K.-L. Huang and T. M. Holsen (2009). "Nafion-117 behavior during cation separation from spent chromium plating solutions." Industrial & Engineering Chemistry Research 48(14): 6805-6810.

257
Ahumada, R., A. Rudolph, E. González, G. Fones, G. Saldías and R. Ahumada-Rudolph (2011). "Dissolved trace metals in the water column of Reloncaví Fjord, Chile." Latin American Journal of Aquatic Research 39(3): 567-574.
Al-Awadhi, F. M. (1999). "The Year of the Ocean and its crucial importance to the Gulf." Desalination 123(2): 127-133.
Al-Husaini, I., S. Abdul-Wahab, R. Ahamad and K. Chan (2014). "Levels of Cd, Cu, Pb and V in marine sediments in the vicinity of the Single Buoy Moorings (SBM3) at Mina Al Fahal in the Sultanate of Oman." Marine Pollution Bulletin 83(1): 337-342.
Al-Husaini, I. S. I. (2010). Heavy metals in marine sediments, water and fish of single buoy moorings (SBM3), Mina Al Fahal, Sultanate of Oman, Universiti Teknologi Malaysia, Faculty of Science.
Al-Rashdi, T. T. and H. Sulaiman (2013). "Bioconcentration of heavy metals in Alfalfa (Medicago sativa) from farm soils around Sohar industrial area in Oman." APCBEE Procedia 5: 271-278.
Al-Sayed, H. A., A. M. Mahasneh and J. Al-Saad (1994). "Variations of trace metal concentrations in seawater and pearl oyster Pinctada radiata from Bahrain (Arabian Gulf)." Marine Pollution Bulletin 28(6): 370-374.
Al-Shuely, W., Z. Z. Ibrahim, A. Al-Kindi, S. Al-Saidi, T. Khan, F. Marikar and M. Al-Busaidi (2009). "Heavy metals contents on beach sediments north and south of Sohar industrial area, Oman." Journal of Environmental Science and Technology 2(2): 73-79.
Al-Yousuf, M., M. El-Shahawi and S. Al-Ghais (2000). "Trace metals in liver, skin and muscle of Lethrinus lentjan fish species in relation to body length and sex." Science of the total environment 256(2): 87-94.
Alagarsamy, R., G. A. Wolff and R. Chester (2005). "Partitioning and speciation of trace metal diagenesis in differing depositional environments in the sediments of the Oman Margin." Aquatic Geochemistry 11(2): 195-213.
Alfaro, M. R., A. Montero, O. M. Ugarte, C. W. A. do Nascimento, A. M. de Aguiar Accioly, C. M. Biondi and Y. J. A. B. da Silva (2015). "Background concentrations and reference values for heavy metals in soils of Cuba." Environmental monitoring and assessment 187(1): 1-10.
Alfaro-De la Torre, M. C., P.-Y. Beaulieu and A. Tessier (2000). "In situ measurement of trace metals in lakewater using the dialysis and DGT techniques." Analytica Chimica Acta 418(1): 53-68.

258
Ali, A., E. Elazein and M. Alian (2011). "Investigation of heavy metals pollution in water, sediment and fish at Red Sea-Jeddah Coast-KSA at two different locations." J. Appl. Environ. Biol. Sci 1: 630-637.
Alloway, B. (2010). Heavy metals in soils. Trace metals and metalloids in soil and their bioavailability, Springer, NY: 560-566.
Amara-Rekkab, A. and M. A. Didi (2015). "Removal of Cd (II) and Hg (II) by chelating resin Chelex-100." Oriental Journal of Chemistry 31(1): 205-214.
Anderson, J., J. Neff, B. Cox, H. Tatem and G. M. Hightower (1974). "Characteristics of dispersions and water-soluble extracts of crude and refined oils and their toxicity to estuarine crustaceans and fish." Marine biology 27(1): 75-88.
Anglin-Brown, B., A. Armour-Brown and G. Lalor (1995). "Heavy metal pollution in Jamaica 1: Survey of cadmium, lead and zinc concentrations in the Kintyre and Hope Flat districts." Environmental Geochemistry and Health 17(2): 51-56.
Antoniadis, V., C. D. Tsadilas and D. J. Ashworth (2007). "Monometal and competitive adsorption of heavy metals by sewage sludge-amended soil." Chemosphere 68(3): 489-494.
Antunes, P. and N. J. Kreager (2009). "Development of the terrestrial biotic ligand model for predicting nickel toxicity to barley (Hordeum vulgare): ion effects at low pH." Environmental Toxicology and Chemistry 28(8): 1704-1710.
Apte, S., M. Gardner and D. Hunt (1989). "An evaluation of dialysis as a size‐based separation method for the study of trace metal speciation in natural waters." Environmental Technology 10(2): 201-212.
Arifin, Z., R. Puspitasari and N. Miyazaki (2012). "Heavy metal contamination in Indonesian coastal marine ecosystems: A historical perspective."
Aslam, J., S. A. Khan and S. H. Khan (2013). "Heavy metals contamination in roadside soil near different traffic signals in Dubai, United Arab Emirates." Journal of Saudi Chemical Society 17(3): 315-319.
Avila-Pérez, P., M. Balcázar, G. Zarazúa-Ortega, I. Barceló-Quintal and C. Dıaz-Delgado (1999). "Heavy metal concentrations in water and bottom sediments of a Mexican reservoir." Science of the total environment 234(1): 185-196.
Awad, H., S. Al Eissa and M. Al Moharamy (1990). "Oil pollution in waters, fish and sediments in Gulf of Oman Environment." JKAU Mar. Sci 1: 9-16.

259
Ayres, D. C. and D. G. Hellier (1997). Dictionary of environmentally important chemicals, CRC Press.
Baawain, M. (2011). "Characterisation of Wastewater Sludge in Oman.ppt." ppt.
Baawain, M. S., A.-J. Mohsin and B. Choudri (2014). "Characterization of Domestic Wastewater Sludge in Oman from Three Different Regions and Recommendations for Alternative Reuse Applications." Iranian Journal of Public Health 43(2): 167-177.
Badawy, M. I., M. D. Hernandez and F. T. Al-Harthy (1992). "Sources of pollution at Mina al Fahal coastal area." Bulletin of environmental contamination and toxicology 49(6): 813-820.
Baeyens, W., A. R. Bowie, K. Buesseler, M. Elskens, Y. Gao, C. Lamborg, M. Leermakers, T. Remenyi and H. Zhang (2011). "Size-fractionated labile trace elements in the Northwest Pacific and Southern Oceans." Marine Chemistry 126(1): 108-113.
Bakker, E. and E. Pretsch (2002). "Peer Reviewed: The new wave of ion-selective electrodes." Analytical chemistry 74(15): 420 A-426 A.
Balistrieri, L. S., J. W. Murray and B. Paul (1992). "The biogeochemical cycling of trace metals in the water column of Lake Sammamish, Washington: Response to seasonally anoxic conditions." Limnology and Oceanography 37(3): 529-548.
Barbour, E. K., A. H. Sabra, E. G. Bianu, L. S. Jaber and H. A. Shaib (2009). "Oppositional dynamics of organic versus inorganic contaminants in oysters following an oil spill." Journal of Coastal Research: 864-869.
Bartram, J. and R. Ballance (1996). "Water quality monitoring: a practical guide to the design and implementation of freshwater quality studies and monitoring programs."
Başar, H. (2009). "Methods for estimating phytoavailable metals in soils." Communications in Soil Science and Plant Analysis 40(7-8): 1087-1105.
Batley, G. E. (1989). Chapter2, Trace Elemnet Speciation and its Relatioship to Bioavailability and Toxicity in Natural Waters, CRC Press.
Batley, G. E., S. C. Apte and J. L. Stauber (2004). "Speciation and bioavailability of trace metals in water: progress since 1982." Australian Journal of Chemistry 57(10): 903-919.
260
Bayen, S., P. Gunkel-Grillon, I. Worms, M. Martin and J. Buffle (2009). "Influence of inorganic complexes on the transport of trace metals through permeation liquid membrane." Analytica chimica acta 646(1): 104-110.
Bazzi, A. (2014). "Heavy metals in seawater, sediments and marine organisms in the Gulf of Chabahar, Oman Sea." Journal of Oceanography and Marine Science 5(3): 20-29.
Beneš,P. (1980). "Semicontinuousmonitoringof trulydissolved formsof traceelements in streams using dialysis In Situ—I. Principle and conditions." Water Research 14(5): 511-513.
Bennett, W. W., P. R. Teasdale, J. G. Panther, D. T. Welsh and D. F. Jolley (2011). "Speciation of Dissolved Inorganic Arsenic by Diffusive Gradients in Thin Films: Selective Binding of AsIII by 3-Mercaptopropyl-Functionalized Silica Gel." Analytical Chemistry 83(21): 8293-8299.
Berggren, D. (1990). "Speciation of cadmium (II) using Donnan dialysis and differential-pulse anodic stripping voltammetry in a flow-injection system." International Journal of Environmental Analytical Chemistry 41(3-4): 133-148.
Bernhard, M., F. Brinckman and P. Sadler (1986). The importance of chemical" speciation" in environmental processes, Springer-Verlag Berlin.
Blom, L. B., G. M. Morrison, M. S. Roux, G. Mills and R. Greenwood (2003). "Metal diffusion properties of a Nafion-coated porous membrane in an aquatic passive sampler system." Journal of Environmental Monitoring 5(3): 404-409.
Board, M. and O. S. Board (2003). Oil in the Sea III:: Inputs, Fates, and Effects, national academies Press.
Boulding, J. R. (1996). EPA environmental assessment sourcebook, CRC Press.
Bowen, H. (1966). Trace elements in biochemistry, Academic Press, New York.
Bowles, K., S. Apte, G. Batley, L. Hales and N. Rogers (2006). "A rapid Chelex column method for the determination of metal speciation in natural waters." Analytica chimica acta 558(1): 237-245.
Bremner, H. A. (2002). Safety and quality issues in fish processing, Elsevier.
Broekaert, J. A., S. Gücer and F. Adams (2013). Metal speciation in the environment, Springer Science & Business Media.
261
Brown, P., R. Pirog, A. Vann, I. F. Fergusson, M. Ratner and J. L. Ramseur (2014). "US crude oil export policy: Background and considerations." Congressional Research Service 43442: 2014.
Bruland, K. and M. Lohan (2006). "Controls of trace metals in seawater." The oceans and marine geochemistry. Elsevier: 23-47.
Bryan, G. W. and W. J. Langston (1992). "Bioavailability, accumulation and effects of heavy metals in sediments with special reference to United Kingdom estuaries: a review." Environmental Pollution 76(2): 89-131.
Bu-Olayan, A., M. Subrahmanyam, M. Al-Sarawi and B. Thomas (1998). "Effects of the Gulf War oil spill in relation to trace metals in water, particulate matter, and PAHs from the Kuwait Coast." Environment international 24(7): 789-797.
Buck, K. N., J. Moffett, K. A. Barbeau, R. M. Bundy, Y. Kondo and J. Wu (2012). "The organic complexation of iron and copper: an intercomparison of competitive ligand exchange‐adsorptive cathodic stripping voltammetry (CLE‐ACSV) techniques." Limnology and Oceanography: Methods 10(7): 496-515.
Buffle, J. and M.-L. Tercier-Waeber (2005). "Voltammetric environmental trace-metal analysis and speciation: from laboratory to in situ measurements." TrAC Trends in Analytical Chemistry 24(3): 172-191.
Burtis, C. A., E. R. Ashwood and D. E. Bruns (2012). Electrolytes and Blood Gases, Tietz textbook of clinical chemistry and molecular diagnostics, Elsevier Health Sciences.
Buszewski, B., A. Jastrzębska, T. Kowalkowski and A. Górna-Binkul (2000). "Monitoring of selected heavy metals uptake by plants and soils in the area of Toruń,Poland."Pol. J. Environ. Stud 9(6): 511-515.
Capodaglio, G., G. Scarponi, G. Toscano, C. Barbante and P. Cescon (1995). "Speciation of trace metals in seawater by anodic stripping voltammetry: critical analytical steps." Fresenius' journal of analytical chemistry 351(4-5): 386-392.
Caroli, S. (1996). Element speciation in bioinorganic chemistry, John Wiley & Sons.
Carrillo-Gonzalez, R., J. Simunek, S. Sauve and D. Adriano (2006). "Mechanisms and pathways of trace element mobility in soils." Advances in agronomy 91(06): 111-178.
CEM (1991). "SW 846-3051, microwave sample preparation note EN-4. CEM Corporation." (P.O. Box 200, Matthews, NC 28106.).

262
Cempel, M. and G. Nikel (2006). "Nickel: a review of its sources and environmental toxicology." Polish Journal of Environmental Studies 15(3): 375-382.
Chakraborty, P., Y. Gopalapillai, J. Murimboh, I. I. Fasfous and C. L. Chakrabarti (2006). "Kinetic speciation of nickel in mining and municipal effluents." Analytical and bioanalytical chemistry 386(6): 1803-1813.
Chakraborty, P., J. Zhao and C. Chakrabarti (2009). "Copper and nickel speciation in mine effluents by combination of two independent techniques." Analytica chimica acta 636(1): 70-76.
Chakraborty, S. and G. Owens (2014). "Metal distributions in seawater, sediment and marine benthic macroalgae from the South Australian coastline." International Journal of Environmental Science and Technology 11(5): 1259-1270.
Chang, L.-Y., W. Davison, H. Zhang and M. Kelly (1998). "Performance characteristics for the measurement of Cs and Sr by diffusive gradients in thin films (DGT)." Analytica Chimica Acta 368(3): 243-253.
Chen, C.-E., K. C. Jones, G.-G. Ying and H. Zhang (2014). "Desorption kinetics of sulfonamide and trimethoprim antibiotics in soils assessed with diffusive gradients in thin-films." Environmental science & technology 48(10): 5530-5536.
Chen, C.-E., H. Zhang and K. C. Jones (2012). "A novel passive water sampler for in situ sampling of antibiotics." Journal of Environmental Monitoring 14(6): 1523-1530.
Chen, H., T. Sun, D. Sui and J. Dong (2011). "Effective concentration difference model to study the effect of various factors on the effective diffusion coefficient in the dialysis membrane." Analytica Chimica Acta 698(1–2): 27-35.
Chen, T., Y. Zheng, H. Chen and G. Zheng (2004). "[Background concentrations of soil heavy metals in Beijing]." Huan jing ke xue= Huanjing kexue/[bian ji, Zhongguo ke xue yuan huan jing ke xue wei yuan hui" Huan jing ke xue" bian ji wei yuan hui.] 25(1): 117-122.
Chester, R. (1990). Trace elements in the oceans. Marine Geochemistry, Springer Netherlands: 346-421.
CHOUDRI, B., M. BAAWAIN and M. AHMED (2015). "REVIEW OF WATER QUALITY AND POLLUTION IN COASTAL AREAS OF OMAN." ResearchGate: 229-239.
263
Christensen, J. B. and T. H. Christensen (2000). "The effect of pH on the complexation of Cd, Ni and Zn by dissolved organic carbon from leachate-polluted groundwater." Water Research 34(15): 3743-3754.
Collins, R. N. and A. S. Kinsela (2010). "The aqueous phase speciation and chemistry of cobalt in terrestrial environments." Chemosphere 79(8): 763-771.
Connell, D. W. (2005). Basic concepts of environmental chemistry, CRC Press.
Coso, E. B. (2004). Trends in Electrochemistry and Corrosion the Beginning of the 21st Century, Edicions Universitat Barcelona.
Costenla, M. M. d. M. (2014). "Heavy metal contamination in seafood and consumer exposure in the Gulf Cooperation Council."
Cuong, D. T., S. Karuppiah and J. P. Obbard (2008). "Distribution of heavy metals in the dissolved and suspended phase of the sea-surface microlayer, seawater column and in sediments of Singapore’s coastal environment." Environmental monitoring and assessment 138(1): 255-272.
Dabrin, A., C. L. Durand, J. Garric, O. Geffard, B. J. Ferrari and M. Coquery (2012). "Coupling geochemical and biological approaches to assess the availability of cadmium in freshwater sediment." Science of the Total Environment 424: 308-315.
Dam, M. E. and K. H. Schrøder (1996). "Mercury film electrodes coated with negatively charged polymer films in speciation studies of trace amounts of lead." Electroanalysis 8(11): 1040-1050.
Davison, W., G. Fones, M. Harper, P. Teasdale and H. Zhang (2000). "Dialysis, DET and DGT: in situ diffusional techniques for studying water, sediments and soils." In situ monitoring of aquatic systems: chemical analysis and speciation.: 495-569.
Davison, W. and H. Zhang (1994). "In situspeciation measurements of trace components in natural waters using thin-film gels." Nature 367(6463): 546-548.
Davison, W. and H. Zhang (2012). "Progress in understanding the use of diffusive gradients in thin films (DGT)–back to basics." Environmental Chemistry 9(1): 1-13.
de Haan, F. A. and M. I. Visser-Reyneveld (1996). Soil pollution and soil protection, International Training Centre (PHLO), Wageningen Agricultural University.
264
de Mora, S., S. W. Fowler, E. Wyse and S. Azemard (2004). "Distribution of heavy metals in marine bivalves, fish and coastal sediments in the Gulf and Gulf of Oman." Marine pollution bulletin 49(5): 410-424.
de Souza, J. M., A. A. Menegário, M. A. de Araújo Júnior and E. Francioni (2014). "Measurements of labile Cd, Cu, Ni, Pb, and Zn levels at a northeastern Brazilian coastal area under the influence of oil production with diffusive gradients in thin films technique (DGT)." Science of The Total Environment 500: 325-331.
Degryse, F., E. Smolders and D. R. Parker (2009). "Partitioning of metals (Cd, Co, Cu, Ni, Pb, Zn) in soils: concepts, methodologies, prediction and applications – a review." European Journal of Soil Science 60(4): 590-612.
Degryse, F., E. Smolders, H. Zhang and W. Davison (2009). "Predicting availability of mineral elements to plants with the DGT technique: a review of experimental data and interpretation by modelling." Environmental Chemistry 6(3): 198-218.
Dekkers, C. and R. Daane (1999). "Metal contents in crudes much lower than expected." Oil and Gas Journal 97(9): 44-51.
Denuault, G. (2009). "Electrochemical techniques and sensors for ocean research." Ocean Science 5(4): 697-710.
Dewey, F. (1994). "Flow injection potentiometric and voltammetric stripping analysis using a dialysis membrane covered mercury film electrode." Analyst 119(8): 1813-1818.
Di Bonito, M., N. Breward, N. Crout, B. Smith and S. Young (2008). "Overview of selected soil pore water extraction methods for the determination of potentially toxic elements in contaminated soils: operational and technical aspects."
Diop, C., D. Dewaelé, F. Cazier, A. Diouf and B. Ouddane (2015). "Assessment of trace metals contamination level, bioavailability and toxicity in sediments from Dakar coast and Saint Louis estuary in Senegal, West Africa." Chemosphere 138: 980-987.
Dixit, S. and J. G. Hering (2003). "Comparison of arsenic (V) and arsenic (III) sorption onto iron oxide minerals: Implications for arsenic mobility." Environmental Science & Technology 37(18): 4182-4189.
Dobermann, A., H. Langner, H. Mutscher, J. Yang, E. Skogley, M. Adviento and M. Pampolino (1994). "Nutrient adsorption kinetics of ion exchange resin capsules: A study with soils of international origin." Communications in Soil Science & Plant Analysis 25(9-10): 1329-1353.
265
Dočekalová, H., V. Kovaříková and B. Dočekal (2012). "Mobility andbioaccessibility of trace metals in soils assessed by conventional extraction procedures and passive diffusive samplers." Chemical Speciation & Bioavailability 24(4): 261-265.
Donat, J. R., K. A. Lao and K. W. Bruland (1994). "Speciation of dissolved copper and nickel in South San Francisco Bay: a multi-method approach." Analytica Chimica Acta 284(3): 547-571.
Dragoe,D.,N.Spătaru,R.Kawasaki,A.Manivannan,T.Spătaru,D.A.TrykandA.Fujishima (2006). "Detection of trace levels of Pb 2+ in tap water at boron-doped diamond electrodes with anodic stripping voltammetry." Electrochimica acta 51(12): 2437-2441.
Dryden, C. L., A. S. Gordon and J. R. Donat (2007). "Seasonal survey of copper-complexing ligands and thiol compounds in a heavily utilized, urban estuary: Elizabeth River, Virginia." Marine Chemistry 103(3): 276-288.
Dursun, S. A. and F. Mikailsoy (2015). "BORLU TOPRAKLARIN ISLAHINDA KÜKÜRTÜNETKİSİ."NWSA: Ecological Life Sciences: 1-10.
Dušek, J. (2002). "Weiner, E.R.: Applications of Environmental Chemistry. APractical Guide for Environmental Professionals." Photosynthetica 40(2): 206-236.
Dutta, T. K. and S. Harayama (2000). "Fate of crude oil by the combination of photooxidation and biodegradation." Environmental science & technology 34(8): 1500-1505.
Duursma, E. K. and R. Dawson (2011). Marine organic chemistry, Elsevier.
Duyck, C., N. Miekeley, C. L. P. da Silveira, R. Q. Aucelio, R. C. Campos, P. Grinberg and G. P. Brandao (2007). "The determination of trace elements in crude oil and its heavy fractions by atomic spectrometry." Spectrochimica Acta Part B: Atomic Spectroscopy 62(9): 939-951.
Duyck, C., N. Miekeley, T. C. Fonseca, P. Szatmari and S. Neto (2008). "Trace element distributions in biodegraded crude oils and fractions from the Potiguar Basin, Brazil." Journal of the Brazilian Chemical Society 19(5): 978-986.
Eissa-MA, H. A.-S. A. and A. Moharamy (1990). "Oil Pollution Waters, Fish & Sediments in Gulf Of Oman Environment."
Ekpenyong, N. S. and U. S. Udofia (2015). "Crude Oil Spills and Its Consequences on Seafoods Safety in Coastal Area of Ibeno: Akwa Ibom State." Studies in Sociology of Science 6(1): 16-21.

266
Eriyamremu, O. S. O. a. E. G. (2013). "
Effect of Different Crude Oil Fractions on Growth and Oxidative Stress Parameters of Maize Radicle." International Journal of Plant & Soil Science 2(1)(1): 144-145.
Ernstberger, H., W. Davison, H. Zhang, A. Tye and S. Young (2002). "Measurement and dynamic modeling of trace metal mobilization in soils using DGT and DIFS." Environmental science & technology 36(3): 349-354.
Ernstberger, H., H. Zhang and W. Davison (2002). "Determination of chromium speciation in natural systems using DGT." Analytical and bioanalytical chemistry 373(8): 873-879.
Fan, H.-T., J.-X. Liu, D.-P. Sui, H. Yao, F. Yan and T. Sun (2013). "Use of polymer-bound Schiff base as a new liquid binding agent of diffusive gradients in thin-films for the measurement of labile Cu2+, Cd2+ and Pb2+." Journal of Hazardous Materials 260(0): 762-769.
Fan, H.-T., J.-X. Liu, D.-P. Sui, H. Yao, F. Yan and T. Sun (2013). "Use of polymer-bound Schiff base as a new liquid binding agent of diffusive gradients in thin-films for the measurement of labile Cu 2+, Cd 2+ and Pb 2+." Journal of hazardous materials 260: 762-769.
Fernández, E., R. Jiménez, A. Lallena and J. Aguilar (2004). "Evaluation of the BCR sequential extraction procedure applied for two unpolluted Spanish soils." Environmental Pollution 131(3): 355-364.
Figura, P. and B. McDuffie (1980). "Determination of labilities of soluble trace metal species in aqueous environmental samples by anodic stripping voltammetry and chelex column and batch methods." Analytical Chemistry 52(9): 1433-1439.
Fingas, M. (2012). The basics of oil spill cleanup, CRC Press.
Ford, R. G., P. M. Bertsch and K. J. Farley (1997). "Changes in transition and heavy metal partitioning during hydrous iron oxide aging." Environmental Science & Technology 31(7): 2028-2033.
Forsberg, J., R. Dahlqvist, J. Gelting-NystrÖm and J. Ingri (2006). "Trace metal speciation in brackish water using diffusive gradients in thin films and ultrafiltration: comparison of techniques." Environmental science & technology 40(12): 3901-3905.
Förstner, U. and G. T. Wittmann (2012). Metal pollution in the aquatic environment, Springer Science & Business Media.

267
Fowler, S., J. Readman, B. Oregioni, J.-P. Villeneuve and K. McKay (1993). "Petroleum hydrocarbons and trace metals in nearshore Gulf sediments and biota before and after the 1991 war: an assessment of temporal and spatial trends." Marine Pollution Bulletin 27: 171-182.
Freije, A. M. (2015). "Heavy metal, trace element and petroleum hydrocarbon pollution in the Arabian Gulf: Review." Journal of the Association of Arab Universities for Basic and Applied Sciences 17(0): 90-100.
Fu, X., Z. Cui and G. Zang (2014). "Migration, speciation and distribution of heavy metals in an oil-polluted soil affected by crude oil extraction processes." Environmental Science: Processes & Impacts 16(7): 1737-1744.
Gao, Y., M. Leermakers, A. Pede, A. Magnier, K. Sabbe, B. L. Cabana, G. Billon, W. Baeyens and D. C. Gillan (2012). "Response of diffusive equilibrium in thin films (DET) and diffusive gradients in thin films (DGT) trace metal profiles in sediments to phytodetritus mineralisation." Environmental chemistry 9(1): 41-47.
Gao, Y., L. Lesven, D. Gillan, K. Sabbe, G. Billon, S. De Galan, M. Elskens, W. Baeyens and M. Leermakers (2009). "Geochemical behavior of trace elements in sub-tidal marine sediments of the Belgian coast." Marine chemistry 117(1): 88-96.
Garmo, Ø. A., O. Røyset, E. Steinnes and T. P. Flaten (2003). "Performance study of diffusive gradients in thin films for 55 elements." Analytical chemistry 75(14): 3573-3580.
Garrido Reyes, T., J. Mendoza Crisosto and Y. Velásquez Vergara (2013). "Extractability of copper and application of diffusive gradients in thin films: metal availability in contaminated soil by biosolids." Journal of the Brazilian Chemical Society 24(9): 1442-1450.
Ghani, S. A. A. (2015). "Trace metals in seawater, sediments and some fish species from Marsa Matrouh Beaches in north-western Mediterranean coast, Egypt." The Egyptian Journal of Aquatic Research.
Gimpel, J., H. Zhang, W. Davison and A. C. Edwards (2003). "In situ trace metal speciation in lake surface waters using DGT, dialysis, and filtration." Environmental science & technology 37(1): 138-146.
Gimpel, J., H. Zhang, W. Hutchinson and W. Davison (2001). "Effect of solution composition, flow and deployment time on the measurement of trace metals by the diffusive gradient in thin films technique." Analytica Chimica Acta 448(1): 93-103.

268
Gonçalves Jr, A. C., H. Nacke, D. Schwantes and G. F. Coelho (2014). "Heavy Metal Contamination in Brazilian Agricultural Soils due to Application of Fertilizers."
Govind, P. and S. Madhuri (2014). "Heavy metals causing toxicity in animals and fishes." Research Journal of Animal, Veterinary and Fishery Sciences 2(2): 17-23.
Gramlich, A., S. Tandy, V. Slaveykova, A. Duffner and R. Schulin (2012). "The use of permeation liquid membranes for free zinc measurements in aqueous solution." Environmental Chemistry 9(5): 429-437.
Gregušová,M.,B.DočekalandH.Dočekalová(2008)."CharacterizationofResinGels for Diffusive Gradient in Thin Films Technique."
Guéguen, C., O. Clarisse, A. Perroud and A. McDonald (2011). "Chemical speciation and partitioning of trace metals (Cd, Co, Cu, Ni, Pb) in the lower Athabasca river and its tributaries (Alberta, Canada)." Journal of Environmental Monitoring 13(10): 2865-2872.
Gunkel-Grillon, P. and J. Buffle (2008). "Speciation of Cu (II) with a flow-through permeation liquid membrane: discrimination between free copper, labile and inert Cu (II) complexes, under natural water conditions." Analyst 133(7): 954-961.
Guo, F., R. S. Yost and R. C. Jones (1996). "Evaluating iron‐impregnated paper strips for assessing available soil phosphorus." Communications in Soil Science & Plant Analysis 27(11-12): 2561-2590.
Hamzeh, M., M. Shah-hosseini and A. Naderi Beni (2013). "Effect of fishing vessels on trace metal contamination in sediments of three harbors along Iranian Oman Sea coast." Environmental Monitoring and Assessment 185(2): 1791-1807.
Haraldsson, C., B. Lyvén, M. Pollak and A. Skoog (1993). "Multi-element speciation of trace metals in fresh water adapted to plasma source mass spectrometry." Analytica Chimica Acta 284(2): 327-336.
Harman, C., E. Farmen and K. E. Tollefsen (2010). "Monitoring North Sea oil production discharges using passive sampling devices coupled with in vitro bioassay techniques." Journal of Environmental Monitoring 12(9): 1699-1708.
Harper, M. P., W. Davison and W. Tych (2000). "DIFS—a modelling and simulation tool for DGT induced trace metal remobilisation in sediments and soils." Environmental Modelling & Software 15(1): 55-66.

269
Harper, M. P., W. Davison, H. Zhang and W. Tych (1998). "Kinetics of metal exchange between solids and solutions in sediments and soils interpreted from DGT measured fluxes." Geochimica et Cosmochimica Acta 62(16): 2757-2770.
Harrison, R. M., D. P. Laxen and S. J. Wilson (1981). "Chemical associations of lead, cadmium, copper, and zinc in street dusts and roadside soils." Environmental Science & Technology 15(11): 1378-1383.
Hart, B. and H. Davies (1977). "A batch method for the determination of ion-exchangeable trace metals in natural waters." Marine and Freshwater Research 28(3): 397-402.
Hatje, V., G. Birch and D. Hill (2001). "Spatial and temporal variability of particulate trace metals in Port Jackson Estuary, Australia." Estuarine, Coastal and Shelf Science 53(1): 63-77.
Hergert, G. W. (1998). "A futuristic view of soil and plant analysis and nutrient recommendations." Communications in Soil Science & Plant Analysis 29(11-14): 1441-1454.
Hernández-Crespo, C. and M. Martín (2015). "Determination of background levels and pollution assessment for seven metals (Cd, Cu, Ni, Pb, Zn, Fe, Mn) in sediments of a Mediterranean coastal lagoon." Catena 133: 206-214.
Hill, D. M. and A. C. Aplin (2001). "Role of colloids and fine particles in the transport of metals in rivers draining carbonate and silicate terrains." Limnology and oceanography 46(2): 331-344.
Hirose, K. (2006). "Chemical speciation of trace metals in seawater: a review." Analytical Sciences 22(8): 1055-1063.
Holland, H. D. and K. K. Turekian (2010). Geochemistry of Earth Surface Systems: A Derivative of the Treatise on Geochemistry, Academic Press.
Houba, V., T. M. Lexmond, I. Novozamsky and J. Van der Lee (1996). "State of the art and future developments in soil analysis for bioavailability assessment." Science of the Total Environment 178(1): 21-28.
HOYER, B. and T. FLORENCE (1987). "Application of polymer-coated glassy carbon electrodes to the direct determination of trace metals in body fluids by anodic stripping voltammetry." Analytical chemistry 59(24): 2839-2842.
Huang, K.-L., T. M. Holsen and J. R. Selman (2003). "Impurity diffusion through Nafion and ceramic separators used for electrolytic purification of spent chromium plating solutions." Journal of Membrane Science 221(1–2): 135-146.

270
Huang, P. M., Y. Li and M. E. Sumner (2011). Handbook of soil sciences: resource management and environmental impacts, CRC Press.
Hurst, M. P. and K. W. Bruland (2005). "The use of Nafion-coated thin mercury film electrodes for the determination of the dissolved copper speciation in estuarine water." Analytica Chimica Acta 546(1): 68-78.
Hussein, K. (2012). "A Review of Sequential Extraction Procedures for Heavy Metals Speciation in Soil and Sediments."
Huynh, T., H. H. Harris, H. Zhang and B. N. Noller (2015). "Measurement of labile arsenic speciation in water and soil using diffusive gradients in thin films (DGT) and X-ray absorption near edge spectroscopy (XANES)." Environmental Chemistry 12(2): 102-111.
Hwang, D.-W., S.-G. Kim, M. Choi, I.-S. Lee, S.-S. Kim and H.-G. Choi (2015). "Monitoring of trace metals in coastal sediments around Korean Peninsula." Marine pollution bulletin.
Hydes, D. J. (1977). "Dissolved aluminium concentration in sea water." Nature 268(5616): 136-137.
Ingri, J., S. Nordling, J. Larsson, J. Rönnegård, N. Nilsson, I. Rodushkin, R. Dahlqvist, P. Andersson and Ö. Gustafsson (2004). "Size distribution of colloidal trace metals and organic carbon during a coastal bloom in the Baltic Sea." Marine chemistry 91(1): 117-130.
Ishibashi, M., T. Shigematsu and Y. Nakagawa (1954). "Quantitative determination of tungsten and molybdenum in sea-water." Bulletin of the Institute for Chemical Research, Kyoto University 32(5): 199-202.
Ivezić,V.,Z.Lončarić,M.Engler,D.KerovecandB.R.Singh(2013)."Comparisonof different extraction methods representing available and total concentrations of Cd, Cu, Fe, Mn and Zn in soil." Poljoprivreda 19(1): 53-58.
Ivezić,V.,B.R.Singh,V.GvozdićandZ.Lončarić(2015)."TraceMetalAvailabilityand Soil Quality Index Relationships under Different Land Uses." Soil Science Society of America Journal 79(6): 1629-1637.
Iwegbue, C., F. Emuh, N. Isirimah and A. Egun (2007). "Fractionation, characterization and speciation of heavy metals in composts and compost-amended soils." African Journal of Biotechnology 6(2).
Iwegbue, C. M. (2011). "Assessment of heavy metal speciation in soils impacted with crude oil in the Niger Delta, Nigeria." Chemical Speciation & Bioavailability 23(1): 7-15.

271
Jakimska, A., P. Konieczka, K. Skóra and J. Namiesnik (2011). "Bioaccumulation of metals in tissues of marine animals. Part I: The role and impact of heavy metals on organisms." Pol. J. Environ. Stud 20(5): 1117-1125.
Jalali, M. and Z. Khanlari (2008). "Effect of aging process on the fractionation of heavy metals in some calcareous soils of Iran." Geoderma 143(1): 26-40.
Jamrah, A., A. Al-Futaisi, H. Hassan and S. Al-Oraimi (2007). "Petroleum contaminated soil in Oman: Evaluation of bioremediation treatment and potential for reuse in hot asphalt mix concrete." Environmental monitoring and assessment 124(1-3): 331-341.
Jiang, H., L. Zhang, B. Zheng and G. Wang (2012). "Role of organic acids in desorption of mercury from contaminated soils in eastern Shandong Province, China." Chinese geographical science 22(4): 414-421.
Jilani, S. (2014). "Status of Metal Pollution in the River and Coastal Areas of Karachi." Middle-East Journal of Scientific Research 22(9): 1288-1293.
Jones, G. B. and F. Thomas (1988). "Effect of terrestrial and marine humics on copper speciation in an estuary in the Great Barrier Reef Lagoon." Marine and Freshwater Research 39(1): 19-31.
Jung, S.-C., K.-M. Kim, K.-S. Lee, S. Roh, W.-C. Jeong, S.-J. Kwak, I.-J. Lee, Y.-H. Choi, S. R. Noh and J.-I. Hur (2013). "Respiratory effects of the hebei spirit oil spill on children in taean, Korea." Allergy, asthma & immunology research 5(6): 365-370.
Karst, U. (2004). Handbook of Elemental Speciation. Techniques and Methodology. Edited by Rita Cornelis, Joe Caruso, Helen Crews, and Klaus Heumann, Wiley Online Library: 2-5.
Katana, C., M. Jane and M. Harun (2013). "Speciation of Zinc and Copper in Open-Air Automobile Mechanic Workshop Soils in Ngara Area-Nairobi Kenya."
Kennish, M. J. (1996). Practical handbook of estuarine and marine pollution, CRC press.
Kennish, M. J. (1997). Pollution impacts on marine biotic communities, CRC Press.
Kennish, M. J. (2000). Practical handbook of marine science, crc press.
Kersanach, M. W., C. F. F. d. Andrade, H. Zhang, M. R. Milani and L. F. H. Niencheski (2009). "In situ Measurement of Trace Metals in Estuarine Waters of Patos Lagoon using Diffusive Gradients in Thin Films (DGT)." J. Braz. Chem. Soc 20(2): 333-340.
272
Khuhawar, M., M. A. Mirza and T. Jahangir (2012). Determination of metal ions in crude oils, INTECH Open Access Publisher.
Kibria, G., M. M. Hossain, D. Mallick, T. Lau and R. Wu (2016). "Trace/heavy metal pollution monitoring in estuary and coastal area of Bay of Bengal, Bangladesh and implicated impacts." Marine pollution bulletin.
Kleindienst, S., J. H. Paul and S. B. Joye (2015). "Using dispersants after oil spills: impacts on the composition and activity of microbial communities." Nat Rev Micro 13(6): 388-396.
Klemas, V. (2010). "Tracking oil slicks and predicting their trajectories using remote sensors and models: case studies of the Sea Princess and Deepwater Horizon oil spills." Journal of Coastal Research: 789-797.
Kogut, M. B. and B. M. Voelker (2001). "Strong copper-binding behavior of terrestrial humic substances in seawater." Environmental science & technology 35(6): 1149-1156.
Komy, Z. R. (1993). "Determination of trace metals in Nile River and ground water by differential pulse stripping voltammetry." Microchimica Acta 111(4-6): 239-249.
Kovaříková,V.,H.Dočekalová,B.DočekalandM.Podborská(2007)."Useofthediffusive gradients in thin films technique (DGT) with various diffusive gels for characterization of sewage sludge-contaminated soils." Analytical and bioanalytical chemistry 389(7-8): 2303-2311.
Kramer, C. and J. C. Duinker (2013). Complexation of trace metals in natural waters: Proceedings of the International Symposium, May 2–6 1983, Texel, The Netherlands, Springer Science & Business Media.
Kumar, H. D. and D.-P. Häder (2012). Global aquatic and atmospheric environment, Springer Science & Business Media.
Kvenvolden, K. and C. Cooper (2003). "Natural seepage of crude oil into the marine environment." Geo-Marine Letters 23(3-4): 140-146.
L.L.C., P. D. O. (2010). "MINA AL FAHAL, PORT REGULATIONS & INFORMATION."
Lacerda, L., R. Campos and R. Santelli (2013). "Metals in water, sediments, and biota of an offshore oil exploration area in the Potiguar Basin, Northeastern Brazil." Environmental monitoring and assessment 185(5): 4427-4447.
273
Laffon, B., T. Rábade, E. Pásaro and J. Méndez (2006). "Monitoring of the impact of Prestige oil spill on Mytilus galloprovincialis from Galician coast." Environment International 32(3): 342-348.
Lam, M. T., C. Chakrabarti, J. Cheng and V. Pavski (1997). "Rotating disk electrode voltammetry/anodic stripping voltammetry for chemical speciation of lead and cadmium in freshwaters containing dissolved organic matter." Electroanalysis 9(13): 1018-1029.
Landner, L. (1987). Speciation of Metals in Water, Sediment and Soil Systems: Proceedings of an International Workshop, Sunne, October 15–16, 1986, Springer.
Langston, W. J. and M. J. Bebianno (1998). Metal metabolism in aquatic environments, Springer Science & Business Media.
Lattemann, S. and T. Höpner (2008). Impacts of seawater desalination plants on the marine environment of the Gulf. Protecting the Gulf’s Marine Ecosystemsfrom Pollution, Springer: 191-205.
Lead, J. R., W. Davison, J. Hamilton-Taylor and J. Buffle (1997). "Characterizing Colloidal Material in Natural Waters." Aquatic Geochemistry 3(3): 213-232.
Leermakers, M., Y. Gao, J. Navez, A. Poffijn, K. Croes and W. Baeyens (2009). "Radium analysis by sector field ICP-MS in combination with the Diffusive Gradients in Thin Films (DGT) technique." Journal of Analytical Atomic Spectrometry 24(8): 1115-1117.
Lehto, N., W. Davison, W. Tych and H. Zhang (2008). "Quantitative assessment of soil parameter (K D and T C) estimation using DGT measurements and the 2D DIFS model." Chemosphere 71(4): 795-801.
Lehto, N., W. Davison, H. Zhang and W. Tych (2006). "Theoretical Comparison of How Soil Processes Affect Uptake of Metals by Diffusive Gradients in Thinfilms and Plants." Journal of Environmental Quality 35(5): 1903.
Lehto, N. J., W. Davison, H. Zhang and W. Tych (2006). "An evaluation of DGT performance using a dynamic numerical model." Environmental science & technology 40(20): 6368-6376.
Levy, J., H. Zhang, W. Davison and R. Groben (2011). "Using diffusive gradients in thin films to probe the kinetics of metal interaction with algal exudates." Environmental Chemistry 8(5): 517-524.
Leytem, A. and R. Mikkelsen (2005). "The nature of phosphorus in calcareous soils." Better Crops 89(2): 11-13.

274
Li, J., F. Li, Q. Liu and Y. Zhang (2014). "Trace metal in surface water and groundwater and its transfer in a Yellow River alluvial fan: Evidence from isotopes and hydrochemistry." Science of the Total Environment 472: 979-988.
Li, W., P. R. Teasdale, S. Zhang, R. John and H. Zhao (2003). "Application of a poly (4-styrenesulfonate) liquid binding layer for measurement of Cu2+ and Cd2+ with the diffusive gradients in thin-films technique." Analytical chemistry 75(11): 2578-2583.
Li, W., P. R. Teasdale, S. Zhang, R. John and H. Zhao (2003). "Application of a Poly(4-styrenesulfonate) Liquid Binding Layer for Measurement of Cu2+ and Cd2+ with the Diffusive Gradients in Thin-Films Technique." Analytical Chemistry 75(11): 2578-2583.
Li, W., H. Zhao, P. R. Teasdale, R. John and S. Zhang (2002). "Application of a cellulose phosphate ion exchange membrane as a binding phase in the diffusive gradients in thin films technique for measurement of trace metals." Analytica Chimica Acta 464(2): 331-339.
Li, W., H. Zhao, P. R. Teasdale and F. Wang (2005). "Trace metal speciation measurements in waters by the liquid binding phase DGT device." Talanta 67(3): 571-578.
Li, X., L. Liu, Y. Wang, G. Luo, X. Chen, X. Yang, B. Gao and X. He (2012). "Integrated assessment of heavy metal contamination in sediments from a coastal industrial basin, NE China." PloS one 7(6): e39690.
Li, Y.-H. (2000). A compendium of geochemistry: from solar nebula to the human brain, Princeton University Press.
Li, Y.-T., T. Becquer, C. Quantin, M. Benedetti, P. Lavelle and D. Jun (2005). "Microbial activity indices: sensitive soil quality indicators for trace metal stress." Pedosphere 15(4): 409-416.
Liang, S., D.-X. Guan, J.-H. Ren, M. Zhang, J. Luo and L. Q. Ma (2014). "Effect of aging on arsenic and lead fractionation and availability in soils: Coupling sequential extractions with diffusive gradients in thin-films technique." Journal of hazardous materials 273: 272-279.
Liang, S.-x., X. Wang, Z. Li, N. Gao and H. Sun (2014). "Fractionation of heavy metals in contaminated soils surrounding non-ferrous metals smelting area in the North China Plain." Chemical Speciation & Bioavailability 26(1): 59-64.
Lim, D.-i., J.-W. Choi, H. H. Shin, D. H. Jeong and H. S. Jung (2013). "Toxicological impact assessment of heavy metal contamination on macrobenthic communities

275
in southern coastal sediments of Korea." Marine pollution bulletin 73(1): 362-368.
Lim, H., M. Yarmo, N. Huang, P. Khiew and W. Chiu (2009). "Synthesis, characterisation and catalytic performance of porous nafion resin/silica nanocomposites for esterification of lauric acid and methanol." J. Phys. Sci 20(2): 23-36.
Lin, Z., A. Schneider, T. Sterckeman and C. Nguyen (2015). "Ranking of mechanisms governing the phytoavailability of cadmium in agricultural soils using a mechanistic model." Plant and Soil: 1-19.
Liu, R., J. R. Lead and H. Zhang (2013). "Combining cross flow ultrafiltration and diffusion gradients in thin-films approaches to determine trace metal speciation in freshwaters." Geochimica et Cosmochimica Acta 109: 14-26.
Liu, Z., J. Liu, Q. Zhu and W. Wu (2012). "The weathering of oil after the Deepwater Horizon oil spill: insights from the chemical composition of the oil from the sea surface, salt marshes and sediments." Environmental Research Letters 7(3): 035302.
Lock, K. and C. R. Janssen (2001). "Ecotoxicity of zinc in spiked artificial soils versus contaminated field soils." Environmental science & technology 35(21): 4295-4300.
Lock, K. and C. R. Janssen (2003). "Influence of aging on metal availability in soils." Reviews of environmental contamination and toxicology 178(1): 1-21.
Luo, J., H. Zhang, J. Santner and W. Davison (2010). "Performance characteristics of diffusive gradients in thin films equipped with a binding gel layer containing precipitated ferrihydrite for measuring arsenic (V), selenium (VI), vanadium (V), and antimony (V)." Analytical chemistry 82(21): 8903-8909.
Luoma, S. N., P. S. Rainbow and S. Luoma (2008). Metal contamination in aquatic environments: science and lateral management, Cambridge University Press.
M.L.S. SIMÕES GONÇALVES, A. M. M., M.M. CORREIA DOS SANTOS (1997). "Influence of Organic Matter in Natural Water Mechanisms." Rev. Port. Quím. 4.
Ma, Y., E. Lombi, M. J. McLaughlin, I. W. Oliver, A. L. Nolan, K. Oorts and E. Smolders (2013). "Aging of nickel added to soils as predicted by soil pH and time." Chemosphere 92(8): 962-968.
Ma, Y. and N. Uren (2006). "Effect of aging on the availability of zinc added to a calcareous clay soil." Nutrient Cycling in Agroecosystems 76(1): 11-18.

276
Mackey, K. R., C.-T. Chien, A. F. Post, M. A. Saito and A. Paytan (2015). "Rapid and gradual modes of aerosol trace metal dissolution in seawater." Frontiers in Microbiology 5: 794.
Madsen, M. (2013). "Pollution Effects on Oceans and Marine Life."
Maher, W. (1986). "Preparation of water soluble fractions of crude oils for toxicity studies." Bulletin of environmental contamination and toxicology 36(1): 226-229.
Majolagbe, A. O., O. Osibanjo, K. A. Yusuf and R. A. Olowu (2012). "Trace metals distribution and contamination in the surface marine sediments of Roro Bay in Lagos, Nigeria." Chemistry Journal 2(2): 69-78.
Maktoof, A. A., B. Y. ALKhafaji and Z. Z. Al-janabi (2014). "Evaluation of Total Hydrocarbons Levels and Traces Metals in Water and Sediment from Main Outfall Drain in Al-Nassiriya City/Southern Iraq." Natural Resources 5(13): 795.
Malassa, H., M. Al-Qutob, M. Al-Khatib and F. Al-Rimawi (2013). "Determination of Different Trace Heavy Metals in Ground Water of South West Bank/Palestine by ICP/MS." Journal of Environmental Protection 4(08): 818.
Mamboya, F. A. (2007). "Heavy metal contamination and toxicity: Studies of macroalgae from the Tanzanian Coast."
Manea, C. and M. Mulder (2002). "New polymeric electrolyte membranes based on proton donor-proton acceptor properties for direct methanol fuel cells." Desalination 147(1): 179-182.
Martínez, C. E. and M. B. McBride (1999). "Dissolved and labile concentrations of Cd, Cu, Pb, and Zn in aged ferrihydrite-organic matter systems." Environmental science & technology 33(5): 745-750.
Mason, S., R. Hamon, A. Nolan, H. Zhang and W. Davison (2005). "Performance of a Mixed Binding Layer for Measuring Anions and Cations in a Single Assay Using the Diffusive Gradients in Thin Films Technique." Analytical Chemistry 77(19): 6339-6346.
Masto, R. E., S. Sheik, G. Nehru, V. A. Selvi, J. George and L. C. Ram (2015). "Assessment of environmental soil quality around Sonepur Bazari mine of Raniganj coalfield, India." Solid Earth 6(3): 811-821.
Matar, Z., G. Chebbo, M. Troupel, L. Boudhamane, E. Parlanti, E. Uher, C. Gourlay and G. Varrault (2013). Influence of organic matter from urban effluents on trace metal speciation and bioavailability in river under strong urban pressure.
277
Functions of Natural Organic Matter in Changing Environment, Springer: 517-521.
McLaughlin, M. J., P. Lancaster, P. Sale, N. Uren and K. Peverill (1993). Use of cation/anion exchange membranes for multi-element testing of acidic soils. Plant Nutrition—from Genetic Engineering to Field Practice, Springer: 249-252.
Mello, L. C., A. Claudino, I. Rizzatti, R. L. Bortoluzzi and D. R. Zanette (2005). "Analysis of trace metals Cu2+, Pb2+ and Zn2+ in coastal marine water samples from Florianópolis, Santa Catarina State, Brazil." Journal of the Brazilian Chemical Society 16(3A): 308-315.
Mench, M., A. Manceau, J. Vangronsveld, H. Clijsters and B. Mocquot (2000). "Capacity of soil amendments in lowering the phytoavailability of sludge-borne zinc." Agronomie 20(4): 383-397.
Menegário, A. A., P. S. Tonello and S. F. Durrant (2010). "Use of Saccharomyces cerevisiae immobilized in agarose gel as a binding agent for diffusive gradients in thin films." Analytica Chimica Acta 683(1): 107-112.
Mengistu, H., O. Roeyset, A. Tessema, T. Abiye and M. Demlie (2012). "Diffusive gradient in thin-films (DGT) as risk assessment and management tools in the Central Witwatersrand Goldfield, South Africa." Water SA 38(1): 15-22.
Montero, N., M. Belzunce-Segarra, J.-L. Gonzalez, J. Larreta and J. Franco (2012). "Evaluation of diffusive gradients in thin-films (DGTs) as a monitoring tool for the assessment of the chemical status of transitional waters within the Water Framework Directive." Marine pollution bulletin 64(1): 31-39.
Morel, F. M. and J. G. Hering (1993). Principles and applications of aquatic chemistry, John Wiley & Sons.
Morrison, R. D. and B. L. Murphy (2010). Environmental forensics: contaminant specific guide, Academic Press.
Mulak, M. (1997). "[The effect of heavy metals (lead, cadmium, and manganese) on the function of the visual system]." Medycyna pracy 49(6): 603-607.
Munksgaard, N. C. and D. L. Parry (2003). "Monitoring of labile metals in turbid coastal seawater using diffusive gradients in thin-films." Journal of Environmental Monitoring 5(1): 145-149.
Murdock, C., M. Kelly, L.-Y. Chang, W. Davison and H. Zhang (2001). "DGT as an in Situ Tool for Measuring Radiocesium in Natural Waters." Environmental Science & Technology 35(22): 4530-4535.

278
Murimboh, J., M. T. Lam, N. M. Hassan and C. Chakrabarti (2000). "A study of Nafion-coated and uncoated thin mercury film-rotating disk electrodes for cadmium and lead speciation in model solutions of fulvic acid." Analytica chimica acta 423(1): 115-126.
Musselman, R. (2012). Sampling procedure for lake or stream surface water chemistry, US Department of Agriculture, Forest Service, Rocky Mountain Research Station.
Mustafa, A. D., H. Juahir, K. Yunus, M. A. Amran, C. N. C. Hasnam, F. Azaman, I. Z. Abidin, S. H. Azmee and N. H. Sulaiman (2015). "OIL SPILL RELATED HEAVY METAL: A REVIEW." Malaysian Journal of Analytical Sciences 19(6): 1348-1360.
Naser, H. A. (2013). "Assessment and management of heavy metal pollution in the marine environment of the Arabian Gulf: A review." Marine Pollution Bulletin 72(1): 6-13.
NATIONAL GEOSPATIAL-INTELLIGENCE AGENCY Springfield, V. (2014). "SAILING DIRECTIONS (ENROUTE), RED SEA AND THE PERSIAN GULF " e.book: 190-200.
Nduka, J. K. and O. E. Orisakwe (2009). "Effect of effluents from warri refinery petrochemical companyWRPConwaterandsoilqualitiesof “contiguoushost”and “impacted on communities” of Delta State, Nigeria." The Open Environmental Pollution & Toxicology Journal 1: 11-17.
Ndung’u, K., R. P. Franks, K. W. Bruland and A. R. Flegal (2003). "Organiccomplexation and total dissolved trace metal analysis in estuarine waters: comparison of solvent-extraction graphite furnace atomic absorption spectrometric and chelating resin flow injection inductively coupled plasma-mass spectrometric analysis." Analytica Chimica Acta 481: 127-138.
Nebbioso, A. and A. Piccolo (2013). "Molecular characterization of dissolved organic matter (DOM): a critical review." Analytical and Bioanalytical Chemistry 405(1): 109-124.
Neff, J. M. (2002). Bioaccumulation in marine organisms: effect of contaminants from oil well produced water, Elsevier.
Ngeve, M. N., M. Leermakers, M. Elskens and M. Kochzius (2015). "Assessment of trace metal pollution in sediments and intertidal fauna at the coast of Cameroon." Environmental monitoring and assessment 187(6): 1-14.
Nickson, R. A., S. J. Hill and P. J. Worsfold (1995). Analytical perspective. Solid phase techniques for the preconcentration of trace metals from natural waters.

279
Analytical Proceedings including Analytical Communications, Royal Society of Chemistry.
Nollet, L. M. (2005). Chromatographic analysis of the environment, CRC Press.
Nowack, B., H. Xue and L. Sigg (1997). "Influence of Natural and Anthropogenic Ligands on Metal Transport during Infiltration of River Water to Groundwater." Environmental Science & Technology 31(3): 866-872.
Noyhouzer, T. and D. Mandler (2013). "A new electrochemical flow cell for the remote sensing of heavy metals." Electroanalysis 25(1): 109-115.
Odzak, N., D. Kistler, H. Xue and L. Sigg (2002). "In situ trace metal speciation in a eutrophic lake using the technique of diffusion gradients in thin films (DGT)." Aquatic sciences 64(3): 292-299.
Ogawa, H. and E. Tanoue (2003). "Dissolved Organic Matter in Oceanic Waters." Journal of Oceanography 59(2): 129-147.
Ogbo, E. and J. Okhuoya (2011). "Bioavailability of some heavy metals in crude oil contaminated soils remediated with Pleurotus tuber-regium Fr. singer." Asian J. Biol. Sci 4: 53-61.
Omaka, N. O., J. O. Igidi, F. N. Iyke and E. J. Itumoh (2011). "The impacts of oil spill and soil factors on trace metals in sediments (soils) of Abakaliki and Afikpo, Nigeria." Journal of Emerging Trends in Engineering and Applied Sciences 2(4): 648-657.
Omanović, D., I. Pižeta, P. Vukosav, E. Kovács, S. Frančišković-Bilinski and J. Tamás (2015). "Assessing element distribution and speciation in a stream at abandoned Pb–Zn mining site by combining classical, in-situ DGT and modelling approaches." Science of The Total Environment 511: 423-434.
Osam, M. U., M. O. Wegwu and E. O. Ayalogu (2013). "An Assessment of Some Heavy Metal Elements in Crude Oil Contaminated Soils Remediated By Some Wild-Type Legumes." International Journal of Engineering Science Invention 2(11): 37-42.
Österlund, H., S. Chlot, M. Faarinen, A. Widerlund, I. Rodushkin, J. Ingri and D. C. Baxter (2010). "Simultaneous measurements of As, Mo, Sb, V and W using a ferrihydrite diffusive gradients in thin films (DGT) device." Analytica chimica acta 682(1): 59-65.
Österlund, H., J. Gelting, F. Nordblad, D. C. Baxter and J. Ingri (2012). "Copper and nickel in ultrafiltered brackish water: Labile or non-labile?" Marine Chemistry 132: 34-43.
280
Pais, I. and J. B. Jones Jr (1997). The handbook of trace elements, CRC Press.
Pan, K. and W.-X. Wang (2012). "Trace metal contamination in estuarine and coastal environments in China." Science of the total environment 421: 3-16.
Panther, J. G. (2008). "Diffusive Gradients in Thin Films for Inorganic Arsenic Speciation and Electrothermal Atomic Absorption Spectrometry with a Coupled Microcolumn for Trace Metal Speciation." Thesis
Panther, J. G., W. W. Bennett, P. R. Teasdale, D. T. Welsh and H. Zhao (2012). "DGT measurement of dissolved aluminum species in waters: comparing Chelex-100 and titanium dioxide-based adsorbents." Environmental science & technology 46(4): 2267-2275.
Panther, J. G., W. W. Bennett, D. T. Welsh and P. R. Teasdale (2013). "Simultaneous Measurement of Trace Metal and Oxyanion Concentrations in Water using Diffusive Gradients in Thin Films with a Chelex–Metsorb Mixed Binding Layer." Analytical chemistry 86(1): 427-434.
Panther, J. G., K. P. Stillwell, K. J. Powell and A. J. Downard (2008). "Perfluorosulfonated Ionomer-Modified Diffusive Gradients in Thin Films: Tool for Inorganic Arsenic Speciation Analysis." Analytical Chemistry 80(24): 9806-9811.
Patin, S. (1999). Environmental impact of the offshore oil and gas industry.
Patrick, R. (1978). "Effects of Trace Metals in the Aquatic Ecosystem: The diatom community, base of the aquatic food chain, undergoes significant changes in the presence of trace metals and other alterations in water chemistry." American Scientist: 185-191.
Patterson, J. W. (1987). Metals speciation separation and recovery, CRC Press.
Peer, F. E. and A. Safahieh (2011). "Temporal and spatial variations of heavy metals (Cu, Pb and Ni) concentration in the sediment from intertidal zone along the Iranian coasts of the Oman Sea." Journal of Oceanography and Marine Science 2(7): 158-164.
Pesavento, M., G. Alberti and R. Biesuz (2009). "Analytical methods for determination of free metal ion concentration, labile species fraction and metal complexation capacity of environmental waters: a review." Analytica Chimica Acta 631(2): 129-141.
Pescim, G., G. Marrach, M. Vannuci-Silva, L. Souza and A. Menegário (2012). "Speciation of lead in seawater and river water by using Saccharomyces cerevisiae immobilized in agarose gel as a binding agent in the diffusive
281
gradients in thin films technique." Analytical and Bioanalytical Chemistry 404(5): 1581-1588.
Peters, A. J., H. Zhang and W. Davison (2003). "Performance of the diffusive gradients in thin films technique for measurement of trace metals in low ionic strength freshwaters." Analytica chimica acta 478(2): 237-244.
Pimsee, P., C. Sablayrolles, M. Montréjaud-Vignoles, J. Guyomarch, N. Lesage and P. de Caro (2014). "Dynamic Behavior of Polycyclic Aromatic Hydrocarbons and Their Derivatives after Oils Spill in Water." Journal of Environmental Protection 2014.
Pinheiro, J. P., A. M. Mota and H. P. van Leeuwen (1999). "On lability of chemically heterogeneous systems: Complexes between trace metals and humic matter." Colloids and Surfaces A: Physicochemical and Engineering Aspects 151(1–2): 181-187.
Potter, L. G. (2014). The Persian Gulf in Modern Times: People, Ports, and History, Palgrave Macmillan.
Pouran, H. M., F. L. Martin and H. Zhang (2014). "Measurement of ZnO nanoparticles using diffusive gradients in thin films: binding and diffusional characteristics." Analytical chemistry 86(12): 5906-5913.
Price, H. L., P. R. Teasdale and D. F. Jolley (2013). "An evaluation of ferrihydrite-and Metsorb™-DGT techniques for measuring oxyanion species (As, Se, V, P): Effective capacity, competition and diffusion coefficients." Analytica chimica acta 803: 56-65.
Prince, R. (2002). "Biodegradation of petroleum and other hydrocarbons." Encyclopedia of environmental microbiology. Wiley, New York: 2402-2416.
Pujol, L., D. Evrard, K. Groenen-Serrano, M. Freyssinier, A. Ruffien-Cizsak and P. Gros (2014). "Electrochemical sensors and devices for heavy metals assay in water: the French groups' contribution." Frontiers in chemistry 2.
Qari, R. and S. A. Siddiqui (2008). "HEAVY METAL POLLUTION IN COASTAL SEA WATER OF NATHIA GALI, KARACHI (PAKISTAN)." Journal of Environmental Research And Development Vol 3(1).
Qian, P. and J. Schoenau (2002). "Practical applications of ion exchange resins in agricultural and environmental soil research." Canadian Journal of Soil Science 82(1): 9-21.

282
Qin, F., X.-q. Shan and B. Wei (2004). "Effects of low-molecular-weight organic acids and residence time on desorption of Cu, Cd, and Pb from soils." Chemosphere 57(4): 253-263.
Ramkumar, J. (2012). 13 - Nafion Perfluorosulphonate Membrane: Unique Properties and Various Applications. Functional Materials. S. B. K. Tyagi. London, Elsevier: 549-577.
Refaey, Y., B. Jansen, A.-H. El-Shater, A.-A. El-Haddad and K. Kalbitz (2014). "The role of dissolved organic matter in adsorbing heavy metals in clay-rich soils." Vadose Zone Journal 13(7).
Relić,D.,D.Đorđević,A.PopovićandT.Blagojević(2005). "Speciationsof tracemetals in the Danube alluvial sediments within an oil refinery." Environment International 31(5): 661-669.
Riechaman, M. (2002). "The responses of plants to metal toxicity: A review focusing on copper, manganese and zin." Australian Minerals and Energy Environment Foundation: 54.
Rieuwerts, J. (2015). The Elements of Environmental Pollution, Routledge.
Rocha, J. C., I. A. Toscano and A. A. Cardoso (1997). "Relative lability of trace metals complexed in aquatic humic substances using íon-exchanger cellulose-hyphan." Journal of the Brazilian Chemical Society 8(3): 239-243.
Rocha, L., S. Rodrigues, I. Lopes, A. Soares, A. Duarte and E. Pereira (2011). "The water-soluble fraction of potentially toxic elements in contaminated soils: relationships between ecotoxicity, solubility and geochemical reactivity." Chemosphere 84(10): 1495-1505.
Roulier, J.-L., S. Belaud and M. Coquery (2010). "Comparison of dynamic mobilization of Co, Cd and Pb in sediments using DGT and metal mobility assessed by sequential extraction." Chemosphere 79(8): 839-843.
S. A. Al Maashri , U. K. A., and M. H. Hussain ( 2011). "Investigation of Heavy Metal Contents in Ground Water Samples of the
Sultanate of Oman." Empowering Science, Technology and Innovation Towards a Better Tomorrow.
Saar, R. A. (1997). "Filtration of ground water samples: a review of industry practice." Groundwater Monitoring & Remediation 17(1): 56-62.
Sabir, M., A. Ghafoor, M. Z.-u.-R. Saifullah and G. Murtaza (2008). "Effect of organic amendments and incubation time on extractability of Ni and other
283
metals from contaminated soils." Pakistan Journal of Agricultural Sciences 45(1): 18-24.
Sadiq, M. (1992). "Chapter 1, introduction, Toxic metal chemistry in marine environments." 1-5.
Sadiq, M. and J. C. McCain (1993). Impact of the war on the marine environment. The Gulf War Aftermath, Springer: 5-58.
Saghali, M., R. Baqraf, R. Patimar, S. Hosseini and M. Baniemam (2014). "Determination of heavy metal (Cr, Zn, Cd and Pb) concentrations in water, sediment and benthos of the Gorgan Bay (Golestan province, Iran)." Iranian Journal of Fisheries Sciences 13(2): 449-455.
Sahu, A. K., S. Pitchumani, P. Sridhar and A. K. Shukla (2009). "Nafion and modified-Nafion membranes for polymer electrolyte fuel cells: An overview." Bulletin of Materials Science 32(3): 285-294.
Sander, S. G. and A. Koschinsky (2011). "Metal flux from hydrothermal vents increased by organic complexation." Nature Geosci 4(3): 145-150.
Sangi, M. R., M. J. Halstead and K. A. Hunter (2002). "Use of the diffusion gradient thin film method to measure trace metals in fresh waters at low ionic strength." Analytica Chimica Acta 456(2): 241-251.
Santos-Echeandía, J., R. Prego and A. Cobelo-García (2008). "Influence of the heavy fuel spill from the Prestige tanker wreckage in the overlying seawater column levels of copper, nickel and vanadium (NE Atlantic ocean)." Journal of Marine Systems 72(1): 350-357.
Sauvé, S., M. McBride and W. Hendershot (1998). "Lead phosphate solubility in water and soil suspensions." Environmental Science & Technology 32(3): 388-393.
Saxena, J. (2013). Hazard assessment of chemicals: current developments, Elsevier.
Scally, S., W. Davison and H. Zhang (2003). "In situ measurements of dissociation kinetics and labilities of metal complexes in solution using DGT." Environmental science & technology 37(7): 1379-1384.
Scally, S., W. Davison and H. Zhang (2006). "Diffusion coefficients of metals and metal complexes in hydrogels used in diffusive gradients in thin films." Analytica Chimica Acta 558(1): 222-229.

284
Scarpetti, E. A. (2007). Progress in Colloid and Surface Science Research, Nova Publishers.
Sekabira, K., H. O. Origa, T. A. Basamba, G. Mutumba and E. Kakudidi (2010). "Assessment of heavy metal pollution in the urban stream sediments and its tributaries." International Journal of Environmental Science & Technology 7(3): 435-446.
Senila, M., E. A. Levei and L. R. Senila (2012). "Assessment of metals bioavailability to vegetables under field conditions using DGT, single extractions and multivariate statistics."
Shafaei Arvajeh, M., N. Lehto, Ø. Garmo and H. Zhang (2012). "Kinetic studies of Ni organic complexes using diffusive gradients in thin films (DGT) with double binding layers and a dynamic numerical model." Environmental science & technology 47(1): 463-470.
Sharma, V. K., S. D. Hicks, W. Rivera and F. G. Vazquez (2002). "Characterization and degradation of petroleum hydrocarbons following an oil spill into a coastal environment of south Texas, USA." Water, Air, and Soil Pollution 134(1-4): 111-127.
Sherrell, R. M. and E. A. Boyle (1992). "The trace metal composition of suspended particles in the oceanic water column near Bermuda." Earth and Planetary Science Letters 111(1): 155-174.
Shi, Z., S. Tao, B. Pan, W. Liu and W. Shen (2007). "Partitioning and source diagnostics of polycyclic aromatic hydrocarbons in rivers in Tianjin, China." Environmental Pollution 146(2): 492-500.
Shimy, T. (1997). "Distribution of selected trace metals and its relation with environmental pollution." Energy sources 19(8): 851-860.
Shiva, A. H., W. W. Bennett, D. T. Welsh and P. R. Teasdale (2016). "In situ evaluation of DGT techniques for measurement of trace metals in estuarine waters: a comparison of four binding layers with open and restricted diffusive layers." Environmental Science: Processes & Impacts 18(1): 51-63.
Shukry, W., G. Al-Hawas, R. Al-Moaikal and M. El-Bendary (2013). "Effect of petroleum crude oil on mineral nutrient elements, soil properties and bacterial biomass of the rhizosphere of jojoba." British Journal of Environment and Climate Change 3(1): 103-118.
Sigg, L., H. Xue, D. Kistler and R. Sshönenberger (2000). "Size fractionation (dissolved, colloidal and particulate) of trace metals in the Thur River, Switzerland." Aquatic Geochemistry 6(4): 413-434.

285
Silset, A. (2008). Emulsions (w/o and o/w) of Heavy Crude Oils. Characterization, Stabilization, Destabilization and Produced Water Quality.
Silveira, M. L. A., L. R. F. Alleoni and L. R. G. Guilherme (2003). "Biosolids and heavy metals in soils." Scientia Agricola 60(4): 793-806.
Simpson, W. (1981). "A critical review of cadmium in the marine environment." Progress in Oceanography 10(1): 1-70.
Singhal, R., J. Preetha, R. Karpe, K. Tirumalesh, S. Kumar and A. Hegde (2006). "The use of ultra filtration in trace metal speciation studies in sea water." Environment international 32(2): 224-228.
Slade, S., S. Campbell, T. Ralph and F. Walsh (2002). "Ionic conductivity of an extruded Nafion 1100 EW series of membranes." Journal of the Electrochemical Society 149(12): A1556-A1564.
Slaveykova, V. I., N. Parthasarathy, J. Buffle and K. J. Wilkinson (2004). "Permeation liquid membrane as a tool for monitoring bioavailable Pb in natural waters." Science of the total environment 328(1): 55-68.
Smedley, P. and D. Kinniburgh (2002). "A review of the source, behaviour and distribution of arsenic in natural waters." Applied geochemistry 17(5): 517-568.
Smitha, B., S. Sridhar and A. A. Khan (2005). "Solid polymer electrolyte membranes for fuel cell applications—a review." Journal of Membrane Science 259(1–2): 10-26.
Snow, B., I. Moulitsas, A. Kolios and M. De Dominicis (2014). "CranSLIK v1. 0: stochastic prediction of oil spill transport and fate using approximation methods." Geoscientific Model Development 7(4): 1507-1516.
Stevenson, B., C. Parkinson and M. Mitchell (1984). "Effect of sewage sludge on decomposition processes in soils." Pedobiologia 26(2): 95-105.
Stockdale, A. (2005). LITERATURE REVIEW: The Use of Cation-Exchange Resins in Natural Water Trace Metals Research. ARTICLE: Determination of Free Ion Trace Metal Concentrations in Freshwaters Using Cation-Exchange Resin Equilibrium. A Preliminary Investigation.
Stockdale, A., W. Davison and H. Zhang (2008). "High-resolution two-dimensional quantitative analysis of phosphorus, vanadium and arsenic, and qualitative analysis of sulfide, in a freshwater sediment." Environmental Chemistry 5(2): 143-149.
286
Stockdale, A., E. Tipping and S. Lofts (2015). "Dissolved trace metal speciation in estuarine and coastal waters: Comparison of WHAM/Model VII predictions with analytical results." Environmental Toxicology and Chemistry 34(1): 53-63.
Sturgeon, R., S. Willie and S. Berman (1985). "Preconcentration of selenium and antimony from seawater for determination by graphite furnace atomic absorption spectrometry." Analytical Chemistry 57(1): 6-9.
Su, Y.-z. and R. Yang (2008). "Background concentrations of elements in surface soils and their changes as affected by agriculture use in the desert-oasis ecotone in the middle of Heihe River Basin, North-west China." Journal of Geochemical Exploration 98(3): 57-64.
Taghipour, H., M. Mosaferi, M. Pourakbar and F. Armanfar (2012). "Heavy Metals Concentrations in Groundwater Used for Irrigation." Health promotion perspectives 2(2): 205.
Tan, K. H. (2010). Principles of soil chemistry, CRC Press.
Tankéré-Muller, S., W. Davison and H. Zhang (2012). "Effect of competitive cation binding on the measurement of Mn in marine waters and sediments by diffusive gradients in thin films." Analytica chimica acta 716: 138-144.
Tant, M. R. (1997). Ionomers: synthesis, structure, properties and applications, Springer Science & Business Media.
Teasdale, P. R., S. Hayward and W. Davison (1999). "In situ, High-Resolution Measurement of Dissolved Sulfide Using Diffusive Gradients in Thin Films with Computer-Imaging Densitometry." Analytical Chemistry 71(11): 2186-2191.
Temminghoff, E. J., A. C. Plette, R. Van Eck and W. H. Van Riemsdijk (2000). "Determination of the chemical speciation of trace metals in aqueous systems by the Wageningen Donnan Membrane Technique." Analytica Chimica Acta 417(2): 149-157.
Thorgersen, M. P., W. A. Lancaster, B. J. Vaccaro, F. L. Poole, A. M. Rocha, T. Mehlhorn, A. Pettenato, J. Ray, R. J. Waters and R. A. Melnyk (2015). "Molybdenum availability is key to nitrate removal in contaminated groundwater environments." Applied and environmental microbiology 81(15): 4976-4983.
Tissot, B. P. and D. H. Welte (1984). "Petroleum formation and occurrence." 375-389.

287
Torri, S. I. and R. S. Corrêa (2012). "Downward movement of potentially toxic elements in biosolids amended soils." Applied and Environmental Soil Science 2012.
Trakal, L., M. Komárek,J.Száková,V.ZemanováandP.Tlustoš(2011)."Biocharapplication to metal-contaminated soil: evaluating of Cd, Cu, Pb and Zn sorption behavior using single-and multi-element sorption experiment." Plant Soil Environ 57(8): 372-380.
Tsvetnenko, Y. and L. Evans (2002). "Improved approaches to ecotoxicity testing of petroleum products." Marine pollution bulletin 45(1): 148-156.
Turner, G. S., G. A. Mills, M. J. Bowes, J. L. Burnett, S. Amos and G. R. Fones (2014). "Evaluation of DGT as a long-term water quality monitoring tool in natural waters; uranium as a case study." Environmental Science: Processes & Impacts 16(3): 393-403.
Twiss, M. R. and J. W. Moffett (2002). "Comparison of copper speciation in coastal marine waters measured using analytical voltammetry and diffusion gradient in thin-film techniques." Environmental science & technology 36(5): 1061-1068.
Uher, E., M.-H. Tusseau-Vuillemin and C. Gourlay-France (2013). "DGT measurement in low flow conditions: diffusive boundary layer and lability considerations." Environmental Science: Processes & Impacts 15(7): 1351-1358.
Uher, E., H. Zhang, S. Santos, M.-H. l. n. Tusseau-Vuillemin and C. Gourlay-Francé (2012). "Impact of biofouling on diffusive gradient in thin film measurements in water." Analytical chemistry 84(7): 3111-3118.
Ure, A. and C. Davidson (2008). Chemical speciation in the environment, John Wiley & Sons.
Van Hees, P., D. Jones, G. Jentschke and D. Godbold (2004). "Mobilization of aluminium, iron and silicon by Picea abies and ectomycorrhizas in a forest soil." European Journal of Soil Science 55(1): 101-112.
van Leeuwen, H. P. and R. M. Town (2005). "Kinetic limitations in measuring stabilities of metal complexes by competitive ligand exchange-adsorptive stripping voltammetry (CLE-AdSV)." Environmental science & technology 39(18): 7217-7225.
Vasyukova, E., O. Pokrovsky, J. Viers, P. Oliva, B. Dupré, F. Martin and F. Candaudap (2010). "Trace elements in organic-and iron-rich surficial fluids of the boreal zone: Assessing colloidal forms via dialysis and ultrafiltration." Geochimica et Cosmochimica Acta 74(2): 449-468.

288
Veguería, S. F. J., J. M. Godoy, R. C. de Campos and R. A. Gonçalves (2013). "Trace element determination in seawater by ICP-MS using online, offline and bath procedures of preconcentration and matrix elimination." Microchemical Journal 106: 121-128.
Venn, R. F. (2008). Principles and practice of bioanalysis, CRC Press.
Verner, S. (1974). Proceedings of seminar on methodology for monitoring the marine environment, Seattle, Washington, October 1973, Environmental Protection Agency, Washington, DC (USA).
Vishnyakov, A. and A. V. Neimark (2001). "Molecular dynamics simulation of Nafion oligomer solvation in equimolar methanol-water mixture." The Journal of Physical Chemistry B 105(32): 7830-7834.
Vrana, B., I. J. Allan, R. Greenwood, G. A. Mills, E. Dominiak, K. Svensson, J. Knutsson and G. Morrison (2005). "Passive sampling techniques for monitoring pollutants in water." TrAC Trends in Analytical Chemistry 24(10): 845-868.
Wallner-Kersanach, M., C. F. F. d. Andrade, H. Zhang, M. R. Milani and L. F. H. Niencheski (2009). "In situ measurement of trace metals in estuarine waters of Patos Lagoon using diffusive gradients in thin films (DGT)." Journal of the Brazilian Chemical Society 20(2): 333-340.
Wallner-Kersanach, M., C. F. F. d. Andrade, H. Zhang, M. R. Milani and L. F. H. Niencheski (2009). "In situ measurement of trace metals in estuarine waters of Patos Lagoon using diffusive gradients in thin films (DGT)." Journal of the Brazilian Chemical Society 20: 333-340.
Walther, H. J. (1989). "J. Buffle: Complexation Reactions in Aquatic Systems; Analytical Approach. Chichester, J. Wiley & Sons Ltd./Ellis Horwood Ltd., 1988, 692 S., 247 Abb., 126 Tab.,£ 69, 50, ISBN 0‐470‐20830‐9/085312‐557‐0." Acta hydrochimica et hydrobiologica 17(2): 230-230.
Wan, L., N. Wang, Q. Li, B. Sun, Z. Zhou, K. Xue, Z. Ma, J. Tian and L. Song (2008). "Distribution of dissolved metals in seawater of Jinzhou Bay, China." Environmental Toxicology and Chemistry 27(1): 43-48.
Wang, S.-L., X.-R. Xu, Y.-X. Sun, J.-L. Liu and H.-B. Li (2013). "Heavy metal pollution in coastal areas of South China: a review." Marine pollution bulletin 76(1): 7-15.
Wang, Z. and S. Stout (2010). Oil spill environmental forensics: fingerprinting and source identification, Academic Press.

289
Warnken, K. W., W. Davison, H. Zhang, J. Galceran and J. Puy (2007). "In situ measurements of metal complex exchange kinetics in freshwater." Environmental science & technology 41(9): 3179-3185.
Warnken, K. W., H. Zhang and W. Davison (2004). "Performance characteristics of suspended particulate reagent-iminodiacetate as a binding agent for diffusive gradients in thin films." Analytica Chimica Acta 508(1): 41-51.
Warnken, K. W., H. Zhang and W. Davison (2005). "Trace Metal Measurements in Low Ionic Strength Synthetic Solutions by Diffusive Gradients in Thin Films." Analytical Chemistry 77(17): 5440-5446.
Warnken, K. W., H. Zhang and W. Davison (2006). "Accuracy of the diffusive gradients in thin-films technique: diffusive boundary layer and effective sampling area considerations." Analytical chemistry 78(11): 3780-3787.
Weiner, E. R. (2010). Applications of environmental chemistry: a practical guide for environmental professionals, CRC press.
Wells, M. L., G. J. Smith and K. W. Bruland (2000). "The distribution of colloidal and particulate bioactive metals in Narragansett Bay, RI." Marine Chemistry 71(1–2): 143-163.
Weng, L., F. A. Vega and W. H. Van Riemsdijk (2011). "Strategies in the application of the Donnan membrane technique." Environmental Chemistry 8(5): 466-474.
Whitby, H. and C. M. van den Berg (2015). "Evidence for copper-binding humic substances in seawater." Marine Chemistry 173: 282-290.
Winegardner, D. L. and S. M. Testa (2000). Restoration of Contaminated Aquifers: Petroleum Hydrocarbons and Organic Compounds, CRC Press.
Witherspoon, P. A. and K. Nagashima (1957). "Use of trace metals to identify Illinois crude oils." Circular no. 239.
Wuana, R. A. and F. E. Okieimen (2011). "Heavy metals in contaminated soils: a review of sources, chemistry, risks and best available strategies for remediation." ISRN Ecology 2011.
Wuana, R. A., F. E. Okieimen and R. N. Vesuwe (2015). "Mixed contaminant interactions in soil: Implications for bioavailability, risk assessment and remediation." African Journal of Environmental Science and Technology 8(12): 691-706.

290
Xiao, M., F. Wu, H. Liao, W. Li, X. Lee and R. Huang (2010). "Characteristics and distribution of low molecular weight organic acids in the sediment porewaters in Bosten Lake, China." Journal of Environmental Sciences 22(3): 328-337.
Yang, R. and C. M. van den Berg (2009). "Metal complexation by humic substances in seawater." Environmental science & technology 43(19): 7192-7197.
Yang, X., S. Zhang, Y. Tian, W. Guo and J. Wang (2013). "The influence of humic acids on the accumulation of lead (Pb) and cadmium (Cd) in tobacco leaves grown in different soils." Journal of soil science and plant nutrition 13(1): 43-53.
Yariv, S. and H. Cross (1979). Geochemistry of colloid systems for earth scientists, Springer-Verlag Berlin.
Yuan, C.-J., C.-L. Hsu, S.-C. Wang and K.-S. Chang (2005). "Eliminating the Interference of Ascorbic Acid and Uric Acid to the Amperometric Glucose Biosensor by Cation Exchangers Membrane and Size Exclusion Membrane." Electroanalysis 17(24): 2239-2245.
Zaidi, S. J. and T. Matsuura (2009). Polymer membranes for fuel cells, Springer.
Zen, J.-M. (1998). "Selective voltammetric method for uric acid detection using pre-anodized Nafion-coated glassy carbon electrodes." Analyst 123(6): 1345-1350.
Zhang, H. and W. Davison (1995). "Performance characteristics of diffusion gradients in thin films for the in situ measurement of trace metals in aqueous solution." Analytical chemistry 67(19): 3391-3400.
Zhang, H. and W. Davison (1999). "Diffusional characteristics of hydrogels used in DGT and DET techniques." Analytica Chimica Acta 398(2): 329-340.
Zhang, H. and W. Davison (2000). "Direct in situ measurements of labile inorganic and organically bound metal species in synthetic solutions and natural waters using diffusive gradients in thin films." Analytical Chemistry 72(18): 4447-4457.
Zhang, H. and W. Davison (2001). "In situ speciation measurements. Using diffusive gradients in thin films (DGT) to determine inorganically and organically complexed metals." Pure and Applied Chemistry 73(1): 9-15.
Zhang, H. and W. Davison (2015). "Use of diffusive gradients in thin-films for studies of chemical speciation and bioavailability." Environmental Chemistry 12(2): 85-101.

291
Zhang, H., W. Davison, R. Gadi and T. Kobayashi (1998). "In situ measurement of dissolved phosphorus in natural waters using DGT." Analytica Chimica Acta 370(1): 29-38.
Zhang, H., W. Davison, B. Knight and S. McGrath (1998). "In situ measurements of solution concentrations and fluxes of trace metals in soils using DGT." Environmental Science & Technology 32(5): 704-710.
Zhang, H., W. Davison, A. M. Tye, N. M. Crout and S. D. Young (2006). "Kinetics of zinc and cadmium release in freshly contaminated soils." Environmental toxicology and chemistry 25(3): 664-670.
Zhang, H., E. Lombi, E. Smolders and S. McGrath (2004). "Kinetics of Zn release in soils and prediction of Zn concentration in plants using diffusive gradients in thin films." Environmental science & technology 38(13): 3608-3613.
Zhang, H. and S. Young (2005). "Characterizing the availability of metals in contaminated soils. II." Soil Use and Management 21(s2): 459-467.
Zhang, H., F.-J. Zhao, B. Sun, W. Davison and S. P. Mcgrath (2001). "A new method to measure effective soil solution concentration predicts copper availability to plants." Environmental Science & Technology 35(12): 2602-2607.
Zhang, Z., J. Buffle, H. P. van Leeuwen and K. Wojciechowski (2006). "Roles of metal ion complexation and membrane permeability in the metal flux through lipophilic membranes. Labile complexes at permeation liquid membranes." Analytical chemistry 78(16): 5693-5703.
Zhou, Z., L. Guo, A. M. Shiller, S. E. Lohrenz, V. L. Asper and C. L. Osburn (2013). "Characterization of oil components from the Deepwater Horizon oil spill in the Gulf of Mexico using fluorescence EEM and PARAFAC techniques." Marine Chemistry 148: 10-21.
Ziolli, R. L. and W. F. Jardim (2002). "Operational problems related to the preparation of the seawater soluble fraction of crude oil." Journal of Environmental Monitoring 4(1): 138-141.

292
Appendixes
Appendix (A) Table1.1- Crude analysis the results of Oman crude oil analysis using the 389 UOP method using wet ashing and ICP-OES, provided by Petroleum Development Oman (PDO).
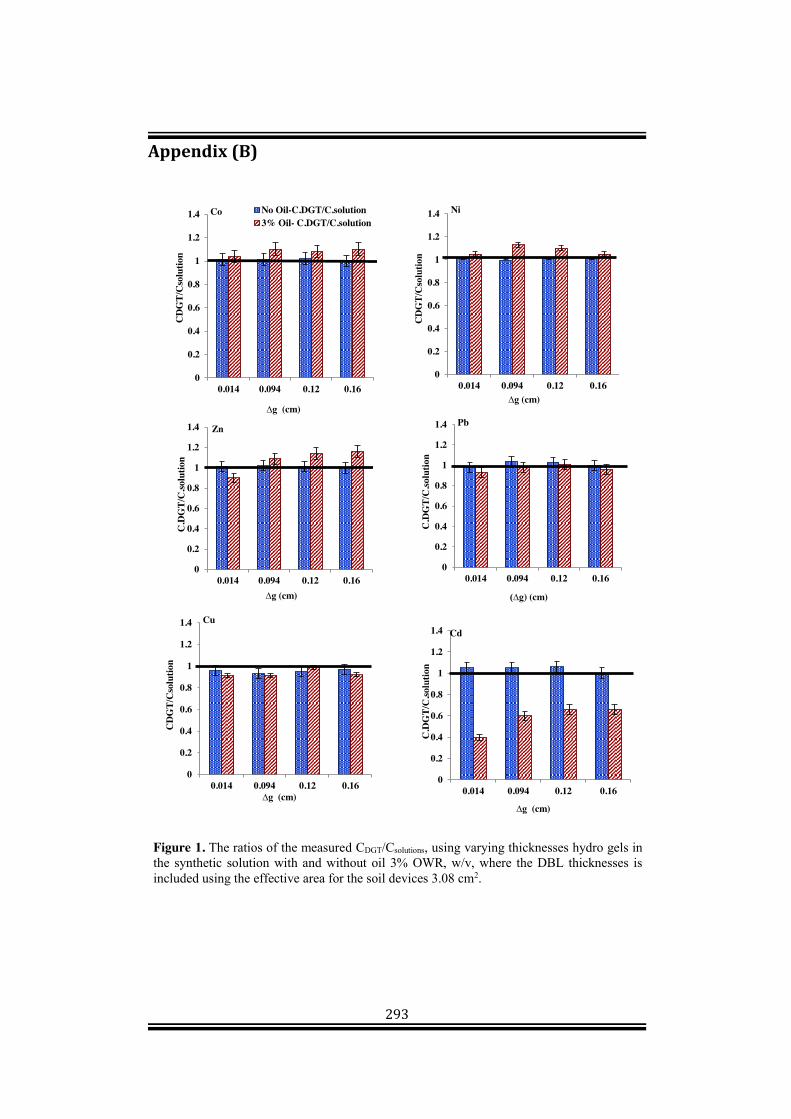
293
Appendix (B)
0
0.2
0.4
0.6
0.8
1
1.2
1.4
0.014 0.094 0.12 0.16
CD
GT/
Cso
lutio
n
∆g (cm)
Cu
0
0.2
0.4
0.6
0.8
1
1.2
1.4
0.014 0.094 0.12 0.16
C.D
GT/
C.so
lutio
n
∆g (cm)
Cd
0
0.2
0.4
0.6
0.8
1
1.2
1.4
0.014 0.094 0.12 0.16
CD
GT/
Cso
lutio
n
∆g (cm)
Co No Oil-C.DGT/C.solution3% Oil- C.DGT/C.solution
0
0.2
0.4
0.6
0.8
1
1.2
1.4
0.014 0.094 0.12 0.16
CD
GT/
Cso
lutio
n
∆g (cm)
Ni
0
0.2
0.4
0.6
0.8
1
1.2
1.4
0.014 0.094 0.12 0.16
C.D
GT/
C.so
lutio
n
∆g (cm)
Zn
0
0.2
0.4
0.6
0.8
1
1.2
1.4
0.014 0.094 0.12 0.16
C.D
GT/
C.so
lutio
n
(∆g) (cm)
Pb
Figure 1. The ratios of the measured CDGT/Csolutions, using varying thicknesses hydro gels in the synthetic solution with and without oil 3% OWR, w/v, where the DBL thicknesses is included using the effective area for the soil devices 3.08 cm2.
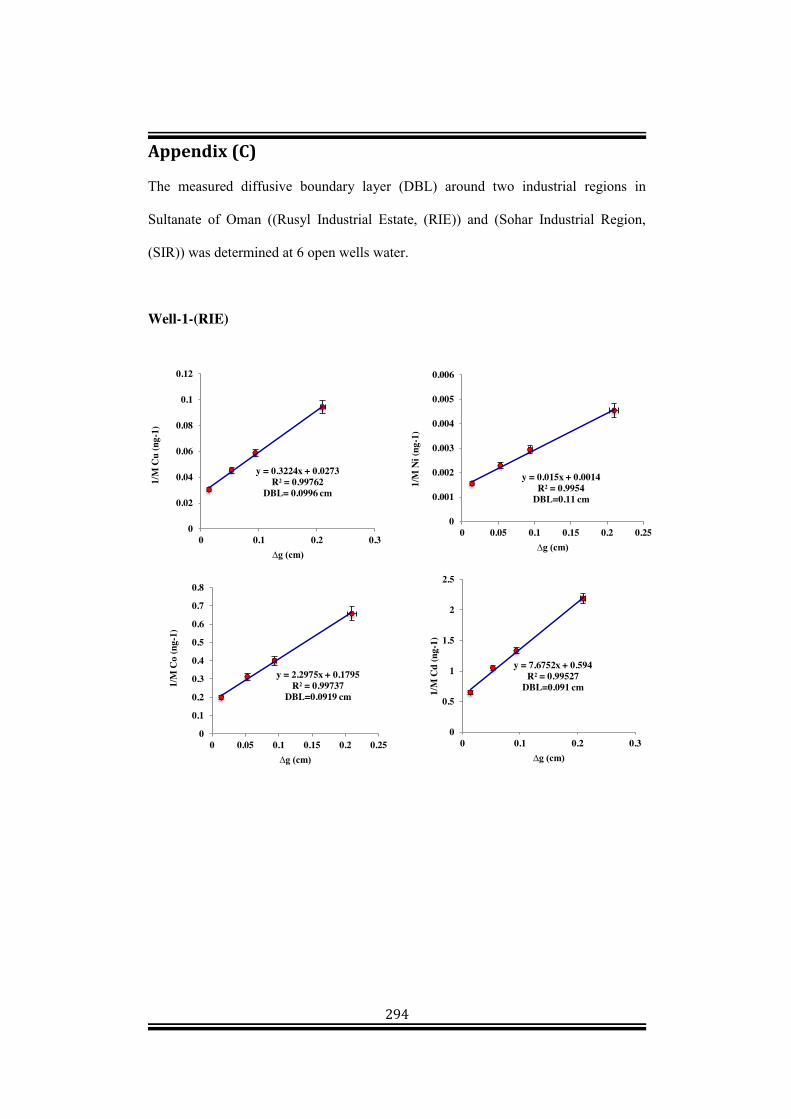
294
Appendix (C) The measured diffusive boundary layer (DBL) around two industrial regions in
Sultanate of Oman ((Rusyl Industrial Estate, (RIE)) and (Sohar Industrial Region,
(SIR)) was determined at 6 open wells water.
Well-1-(RIE)
y = 0.015x + 0.0014R² = 0.9954
DBL=0.11 cm
0
0.001
0.002
0.003
0.004
0.005
0.006
0 0.05 0.1 0.15 0.2 0.25
1/M
Ni (
ng-1
)
∆g (cm)
y = 0.3224x + 0.0273R² = 0.99762
DBL= 0.0996 cm
0
0.02
0.04
0.06
0.08
0.1
0.12
0 0.1 0.2 0.3
1/M
Cu
(ng-
1)
∆g (cm)
y = 7.6752x + 0.594R² = 0.99527
DBL=0.091 cm
0
0.5
1
1.5
2
2.5
0 0.1 0.2 0.3
1/M
Cd
(ng-
1)
∆g (cm)
y = 2.2975x + 0.1795R² = 0.99737
DBL=0.0919 cm
0
0.1
0.2
0.3
0.4
0.5
0.6
0.7
0.8
0 0.05 0.1 0.15 0.2 0.25
1/M
Co
(ng-
1)
∆g (cm)

295
Well-2 (RIE)
y = 0.0094x + 0.0008R² = 0.99696
DBL= 0.10 cm
0
0.0005
0.001
0.0015
0.002
0.0025
0.003
0 0.05 0.1 0.15 0.2 0.25
1/M
Ni (
ng-1
)
∆g (cm)
y = 0.1504x + 0.0119R² = 0.99363
DBL= 0.0931 cm
00.0050.01
0.0150.02
0.0250.03
0.0350.04
0.0450.05
0 0.05 0.1 0.15 0.2 0.25
Cu
1/M
(ng-
1)
∆g (cm)
y = 3.7702x + 0.3272R² = 0.99625
DBL= 0.102 cm
0
0.2
0.4
0.6
0.8
1
1.2
1.4
0 0.05 0.1 0.15 0.2 0.25
1/M
Cd
(ng-
1)
∆g (cm)

296
Well 3- (RIE)
y = 28.767x + 2.2729R² = 0.99582
DBL=0.093 cm
0123456789
0 0.1 0.2 0.3
1/M
Co
(ng-
1)
∆g (cm)
y = 0.0262x + 0.0022R² = 0.99738
DBL=0.0988 cm
0
0.002
0.004
0.006
0.008
0.01
0 0.1 0.2 0.3
1/M
Ni (
ng-1
)
∆g (cm)
y = 0.322x + 0.0251R² = 0.99637
DBL=0917 cm
0
0.02
0.04
0.06
0.08
0.1
0.12
0 0.1 0.2 0.3
1/M
Cu
(ng-
1)
∆g (cm)

297
(SIR)-Well 1
y = 0.0828x + 0.0067R² = 0.99556
DBL=0.0952 cm
0
0.005
0.01
0.015
0.02
0.025
0.03
0 0.05 0.1 0.15 0.2 0.25
1/M
Co
(ng-
1)
∆g (cm)
y = 0.0463x + 0.0036R² = 0.99409
DBL=0.0915 cm
0
0.002
0.004
0.006
0.008
0.01
0.012
0.014
0.016
0 0.1 0.2 0.3
1/M
Ni (
ng-1
)
∆g (cm)
y = 13.361x + 1.0746R² = 0.99592
DBL=0.0946 cm
00.5
11.5
22.5
33.5
44.5
0 0.05 0.1 0.15 0.2 0.25
1/M
Cu
(ng-
1)
∆g (cm)
y = 89.867x + 6.1129R² = 0.9979
0
5
10
15
20
25
30
0 0.05 0.1 0.15 0.2 0.25
1/M
Cd
(ng-
1)
∆g (cm)

298
(SIR)- Well-2
y = 3.1649x + 0.2539R² = 0.99556
DBL= 0.0944 cm
0
0.2
0.4
0.6
0.8
1
1.2
0 0.1 0.2 0.3
1/M
Co
(ng-
1)
∆g (cm)
y = 0.4571x + 0.0369R² = 0.99631
DBL=0.0950 cm
0
0.02
0.04
0.06
0.08
0.1
0.12
0.14
0.16
0 0.1 0.2 0.3
1/M
Cu
(ng-
1)
∆g (cm)
y = 13.393x + 1.1698R² = 0.99351
DBL=0.1027 cm
0
0.5
1
1.5
2
2.5
3
3.5
4
4.5
0 0.05 0.1 0.15 0.2 0.25
1/M
Cd
(ng-
1)
∆g (cm)

299
(SIR)-well -3
y = 4.4266x + 0.3998R² = 0.99331
DBL= 0.1063 cm
0
0.2
0.4
0.6
0.8
1
1.2
1.4
1.6
0 0.1 0.2 0.3
1/M
Co
(ng-
1)
∆g (cm)
y = 0.0151x + 0.0014R² = 0.99436
DBL=0.109 cm
00.00050.001
0.00150.002
0.00250.003
0.00350.004
0.00450.005
0 0.1 0.2 0.3
1/M
Ni (
ng-1
)∆g (cm)
y = 15.985x + 1.3664R² = 0.99734
DBL= 0.101 cm
0
1
2
3
4
5
6
0 0.1 0.2 0.3
1/M
Cd
(ng-
1)
∆g (cm)
Figure 1. DGT results for Co, Ni, Cu and Cd in selected wells waters at RIE in Muscat and SIR in Sohar, plotted as 1/mass of versus the diffusive layer thickness (∆g; cm).