assessing wrf pbl schemes for wind energy...
TRANSCRIPT

NATIONAL CENTER FOR ATMOSPHERIC RESEARCH
Branko Kosović,Yubao Liu,
Youwei Liu, Will Cheng
NCAR WorkshopMay 12, 2010
Assessing WRF PBL Schemes for Wind Energy Applications
© 2009, University Corporation for Atmospheric Research. All rights reserved.

In the Past PBL Parameterizations Have Not Been Evaluated with Respect to Wind Forecasting at 80m
Accurate representation of internal PBL processes and PBL interaction with surface and upper troposphere is important for accurate wind forecasting in PBL.
We are trying to determine optimal PBL parameterization configuration for wind forecasting:• PBL scheme, • vertical resolution, and • input parameters.
We focus on PBL parameterizations available in WRF.
© 2009, University Corporation for Atmospheric Research. All rights reserved.

We Need to Identify and Address Limitations of PBL Schemes that Impact Wind Forecasting
When are wind forecast errors largest?
How can we improve performance of PBL schemes?
• daytime or nightime• are there seasonal differences• under what synoptic conditions, etc.
• through improved representation of physical processes
• by reducing uncertainty in model parameters• better accounting for uncertainties in model
parameters
What is the level of uncertainty in external forcing?
© 2009, University Corporation for Atmospheric Research. All rights reserved.

© 2008, University Corporation for Atmospheric Research. All rights reserved.
Surface Weather Map March 5, 2010
Lake Benton
Wildorado

High and Low Temperatures March 5, 2010
© 2009, University Corporation for Atmospheric Research. All rights reserved.

During Several Days at the Beginning of March We Observed Significant Under Prediction of Wind Speed
© 2009, University Corporation for Atmospheric Research. All rights reserved.

Qualitative Comparison with Data from A Profiler Shows that Upper Level Winds are Accurately Predicted
Hei
ght [
m]
24
20
16
8
0
12
4
4000
3000
2000
1000
03 4 5 6 7
March 2010
Wildorado Profilerm/s
© 2009, University Corporation for Atmospheric Research. All rights reserved.

Hei
ght [
m]
Qualitative Comparison with Data from A Profiler Shows that Upper Level Winds are Accurately Predicted
3 4 5 6 7March 2010
24
20
16
8
0
12
4
4000
3000
2000
1000
0
Wildorado Wind Speed Forecast m/s
© 2009, University Corporation for Atmospheric Research. All rights reserved.

Operational Forecast for XXXX Wind Farm Underestimated Wind Speed Between March 3 and 7
© 2009, University Corporation for Atmospheric Research. All rights reserved.

Qualitative Comparison with Data from A Profiler Shows that Upper Level Winds are Accurately Predicted
Hei
ght [
m]
3 4 5 6 7March 2010
4000
3000
2000
1000
0
24
20
16
8
0
12
4
m/sXXXX Profiler
© 2009, University Corporation for Atmospheric Research. All rights reserved.

March 2010
Hei
ght [
m]
Qualitative Comparison with Data from A Profiler Shows that Upper Level Winds are Accurately Predicted
3 4 5 6 7
4000
3000
2000
1000
0
24
20
16
8
0
12
4
Wind Speed Forecast m/s
© 2009, University Corporation for Atmospheric Research. All rights reserved.
We used several PBL parameterizations available in WRF in our SCM study
• Yonsei University - YSU• Melor-Yamada-Janic - MYJ• Melor-Yamada-Nakanishi-Niino – MYNN (2.5)• Melor-Yamada-Nakanishi-Niino – MYNN3• Quasi Normal Scale Elimination – QNSE
Initial conditions and forcing were derived from the operational NCEP GFS (1 deg) analysis with 6h data frequency to force SCM simulations
We used 56 and 84 grid points in vertical direction© 2009, University Corporation for Atmospheric Research. All rights reserved.

Hei
ght [
m]
March 2010
Temperature from SCM with YSU Parameterization and 56 Grid Points at XXXX Wind Farm
3 4 5 6 7
800
600
400
200
0
© 2009, University Corporation for Atmospheric Research. All rights reserved.

Hei
ght [
m]
March 2010
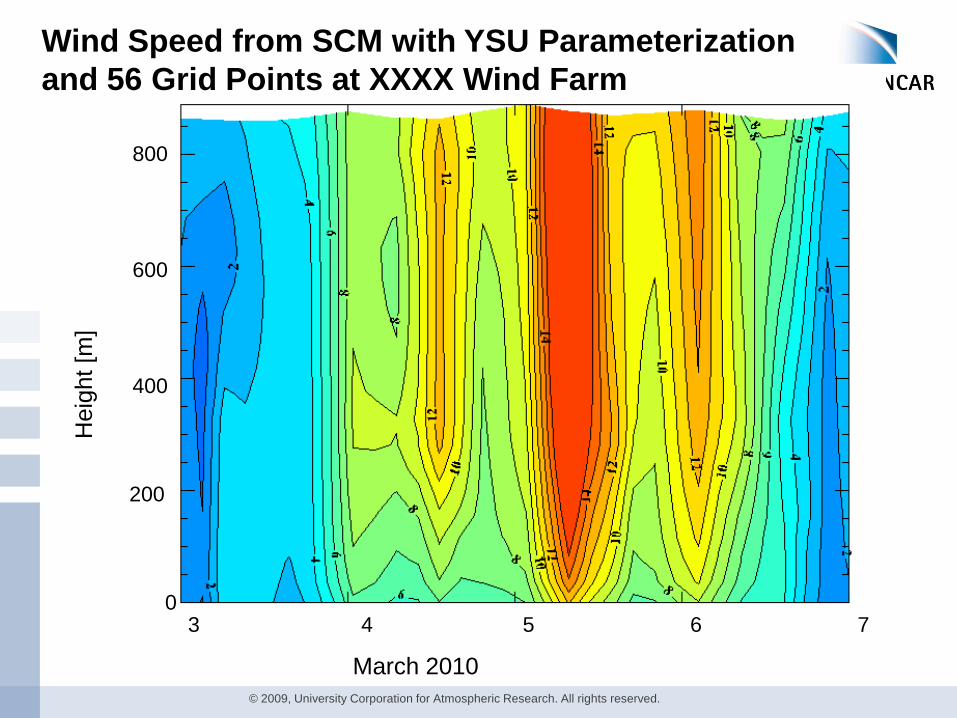
Wind Speed from SCM with YSU Parameterization and 56 Grid Points at XXXX Wind Farm
3 4 5 6 7
800
600
400
200
0
© 2009, University Corporation for Atmospheric Research. All rights reserved.

Hei
ght [
m]
3 4 5 6 7March 2010
Wind Speed Difference Between SCM Simulations with YSU and MYJ Schemes are Negligible800
600
400
200
0
m/s1.0
0.5
0.0
-0.5
-1.0
© 2009, University Corporation for Atmospheric Research. All rights reserved.

Wind Speed Difference Between SCM Simulations with YSU and MYNN Schemes are Small
Hei
ght [
m]
3 4 5 6 7March 2010
800
600
400
200
0
m/sm/s1.0
0.5
0.0
-0.5
-1.0
© 2009, University Corporation for Atmospheric Research. All rights reserved.

Wind Speed Difference Between SCM Simulations with YSU and MYNN3 Schemes are Negligible
Hei
ght [
m]
March 2010
m/s800
600
400
200
0
1.0
0.5
0.0
-0.5
-1.03 4 5 6 7
© 2009, University Corporation for Atmospheric Research. All rights reserved.

Wind Speed Difference Between SCM Simulations with YSU and QNSE are Small
Hei
ght [
m]
March 2010
1.0
0.5
0.0
-0.5
-1.0
800
600
400
200
03 4 5 6 7
m/s
© 2009, University Corporation for Atmospheric Research. All rights reserved.

GFS Analysis Does Not Include Snow Cower Over the Domain of Interest at the Beginning of March
During the time of interest near Lake Benton snow cover was estimated at ~20in.However, without snow cover the grassland surface roughness, z0=0.5, while for snow cover it is significantly lower, z0=0.01.We modified input data to account for snow cover and rerun SCM simulations.

Wind Speed Difference Between SCM Simulations with YSU Scheme with and without Snow Cover
Hei
ght [
m]
March 2010
2.0
1.0
0.0
-1.0
-2.0
800
600
400
200
03 4 5 6 7
© 2009, University Corporation for Atmospheric Research. All rights reserved.
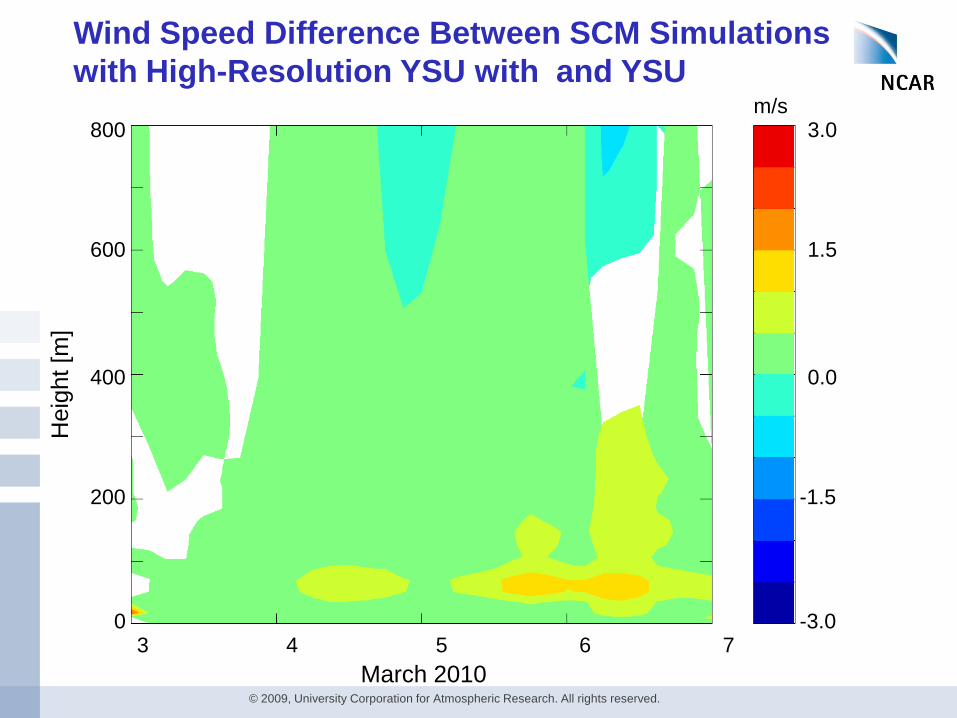
Wind Speed Difference Between SCM Simulations with High-Resolution YSU with and YSU
Hei
ght [
m]
March 2010
800
600
400
200
03 4 5 6 7
3.0
1.5
0.0
-1.5
-3.0
m/s
© 2009, University Corporation for Atmospheric Research. All rights reserved.

Win
d S
peed
[m
/s]
Comparison of Measured Wind Speed at XXXX on with SCM Prediction with YSU Scheme
3 4 5 6 7March 2010
Solid line – measurementsDotted line – SCM 14
12
10
6
0
8
2
4
© 2009, University Corporation for Atmospheric Research. All rights reserved.

March 2010
Hei
ght [
m]
Temperature from SCM with YSU Parameterization and 56 Grid Points at XXXX Wind Farm
800
600
400
200
03 4 5 6 7
© 2009, University Corporation for Atmospheric Research. All rights reserved.
March 2010
Hei
ght [
m]
Wind Speed from SCM with YSU Parameterization and 56 Grid Points at XXXX Wind Farm
800
600
400
200
03 4 5 6 7
© 2009, University Corporation for Atmospheric Research. All rights reserved.

March 2010
Hei
ght [
m]
Wind Speed Difference Between SCM Simulations with YSU and MYJ at XXXX Wind Farm800
600
400
200
03 4 5 6 7
m/s1.0
0.5
0.0
-0.5
-1.0
© 2009, University Corporation for Atmospheric Research. All rights reserved.

Win
d S
peed
[m/s
]
Solid line – measurementsDotted line – SCM 14
12
10
6
0
8
2
4
3 4 5 6 7March 2010
Comparison of Measured Wind Speed at XXXX with SCM Prediction with YSU Scheme
© 2009, University Corporation for Atmospheric Research. All rights reserved.

Summary and Next Steps• SCM captures southerly LLJ but the magnitude of the wind at turbine
hub is significantly underestimated
• Little difference between SCM simulations with different PBL schemes
• SCMs over predict 10m winds while under predicting hub-height winds
• It is important to assimilate reliable, quality controlled local data not assimilated in large scale forecasts (analysis)
• By correctly accounting for surface roughness and by increasing vertical resolution we reduced the error in wind speed prediction by 1.5 m/s
• More and better data are needed to further study and better understand PBL processes that affect LLJ
• We will further analyze surface layer parameterizations and PBL parameterizations and their interaction© 2009, University Corporation for Atmospheric Research. All rights reserved.

Hypothesis: Accurate representation of internal PBL processes and PBL interaction with surface and upper troposphere is important for accurate wind forecasting in PBL
Objective: Improved wind forecasting in PBL
Steps:• Analyze simple PBL parameterizations w.r.t. wind
forecasting below 300m • Analyze PBL parameterizations in WRF• Analyze how PBL parameterization(s) affect wind
forecasting in WRF
For Wind Energy Applications We Need to Improve Wind Forecasting in Planetary Boundary Layer (PBL)
© 2009, University Corporation for Atmospheric Research. All rights reserved.

During Several Days at the Beginning of March We Observed Significant Under Prediction of Wind Speed
© 2009, University Corporation for Atmospheric Research. All rights reserved.

© 2009, University Corporation for Atmospheric Research. All rights reserved.

A number of reasons exists to have a realistic representation of the boundary layer in a large scale model:
From A. Beljaars’ ECMWF training course on BLs
In the Past PBL Parameterizations Have Not Been Evaluated with Respect to Wind Forecasting at 80m
• The large-scale budgets of momentum heat and moisture are considerably affected by the surface fluxes on time scales of a few days.
• Model variables in the boundary layer are important model products.
• The boundary layer interacts with other processes e.g. clouds and convection.

To Improve PBL Parameterizations We Need to Answer Some of Following Questions
What is the level of uncertainty in external forcing?
What is the level of uncertainty in representation of internal processes (or parameters)?
Are there processes that are not represented at all or that are not represented accurately?
Which processes and parameters affect wind forecasting the most?
What can we do to improve representation of these processes or reduce uncertainty in parameters toward improving wind forecasting in PBL?
© 2009, University Corporation for Atmospheric Research. All rights reserved.

Surface Weather Map March 4, 2010
Lake Benton
Wilderado
© 2009, University Corporation for Atmospheric Research. All rights reserved.

March 2010
Wind Speed Difference Between SCM Simulations with YSU and QNSE at XXXX Wind Farm
800
600
400
200
0
Hei
ght [
m]
© 2009, University Corporation for Atmospheric Research. All rights reserved.