assessingclimatechange in cities … · health effects the urban heat island » cities tend to be...
TRANSCRIPT

ASSESSING CLIMATE CHANGE IN CITIES
USING URBCLIM
ASSESSING CLIMATE CHANGE IN CITIES
USING URBCLIM
Hooyberghs, H.; De Ridder, K.; Lauwaet, D.; Maiheu, B.; Lefebvre, W.

» The urban heat island
» UrbClim model
» Description
» Validation
» Current climate assessment
» Temperature maps
Overview
» Temperature maps
» Evolution of the UHI during a day
» Analysis of night-time temperature in 100 EU-cities
» Number of heat-wave days
» Future climate assessment
Assessing climate change in cities using UrbClim Hooyberghs, H.
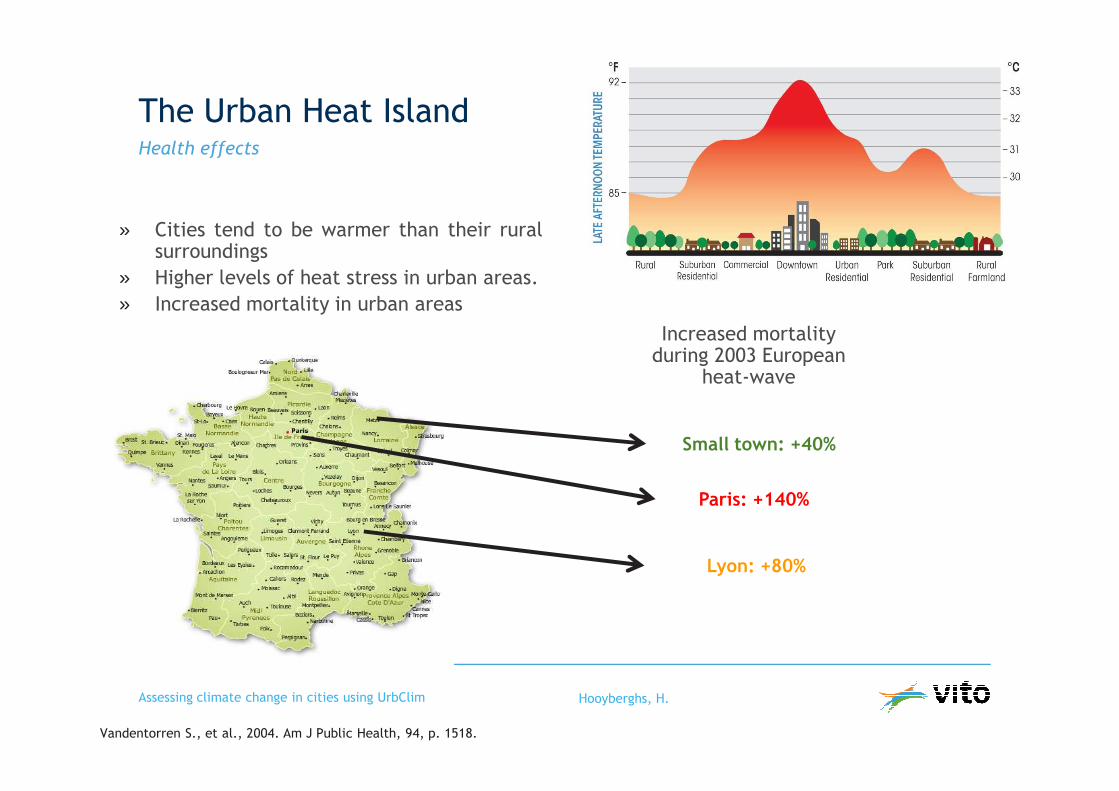
Health effects
The Urban Heat Island
» Cities tend to be warmer than their ruralsurroundings
» Higher levels of heat stress in urban areas.
» Increased mortality in urban areas
Increased mortalityduring 2003 European
heat-wave
Assessing climate change in cities using UrbClim Hooyberghs, H.
Small town: +40%
Lyon: +80%
Paris: +140%
Vandentorren S., et al., 2004. Am J Public Health, 94, p. 1518.

The UrbClim model
hourly gridded (250-m)
• temperature
• humidity
• wind speed
Terrain (Corine/GlobCover)
Brief description
Assessing climate change in cities using UrbClim Hooyberghs, H.
UrbClimInput Output
large-scale meteorology
ERA-Interim data (ECMWF) UHI maps
De Ridder K., et al., 2015. Urban Climate, 12, p. 21.
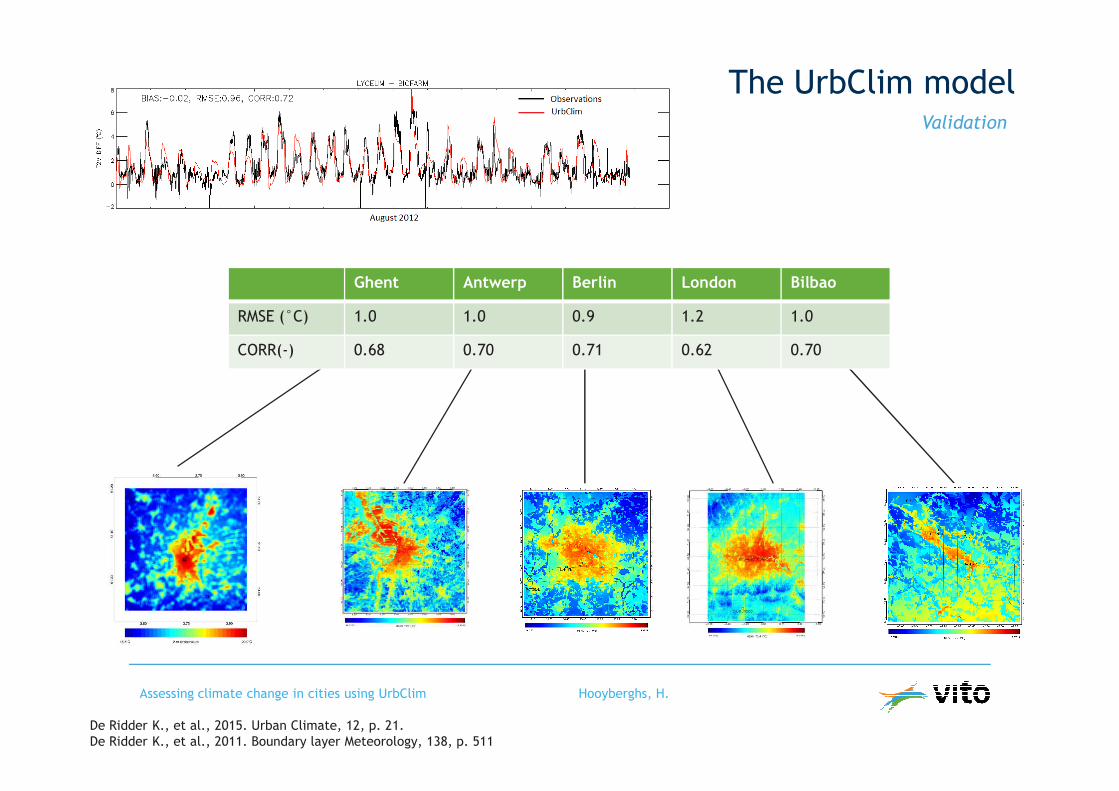
The UrbClim modelValidation
Ghent Antwerp Berlin London Bilbao
RMSE (°C) 1.0 1.0 0.9 1.2 1.0
CORR(-) 0.68 0.70 0.71 0.62 0.70
Assessing climate change in cities using UrbClim Hooyberghs, H.
De Ridder K., et al., 2015. Urban Climate, 12, p. 21.
De Ridder K., et al., 2011. Boundary layer Meteorology, 138, p. 511

Example result
Current climate assessment
Assessing climate change in cities using UrbClim Hooyberghs, H.
95th percentile of the minimal temperature during
summer months (May - September) for London (1986 – 2010)

Evolution of the UHI during a day
Current climate assessment
Assessing climate change in cities using UrbClim Hooyberghs, H.

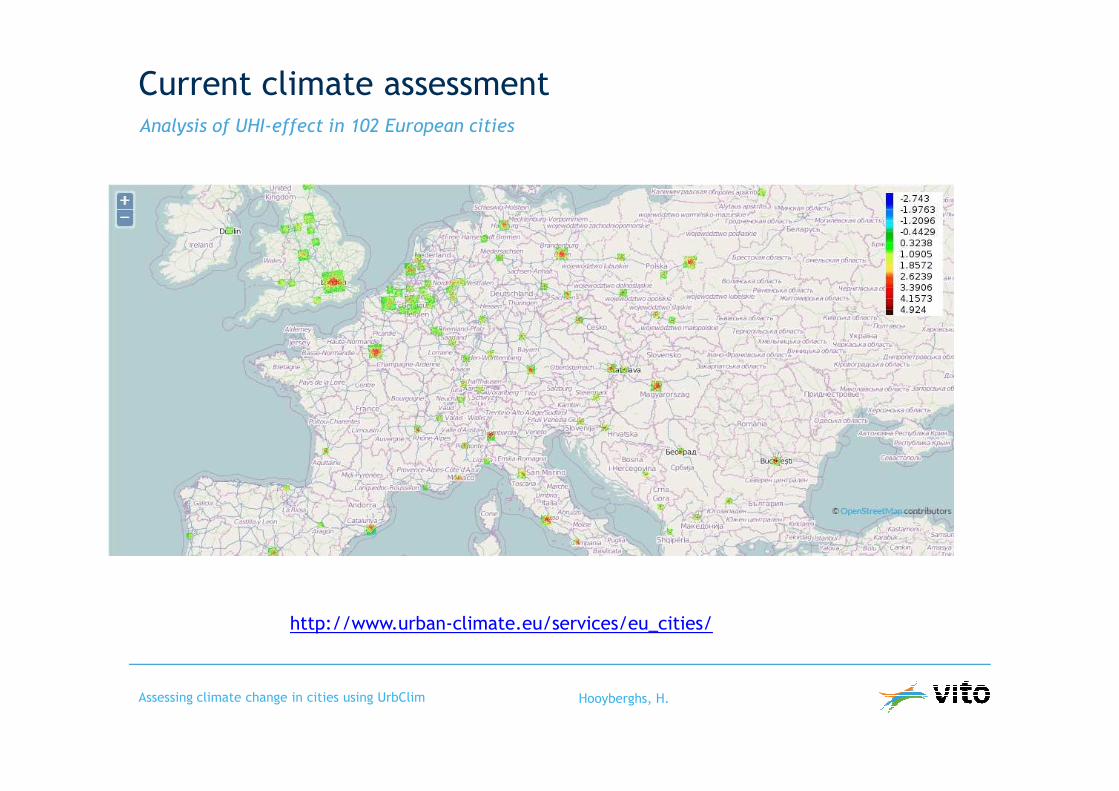
Analysis of UHI-effect in 102 European cities
Current climate assessment
Assessing climate change in cities using UrbClim Hooyberghs, H.
http://www.urban-climate.eu/services/eu_cities/

» Temperature difference between urban and rural location at midnight is explained as a
function of the total number of inhabitants of a city (in a 20 km window), in combination
with the mean 10m wind speed
Analysis of UHI-effect in 102 European cities
Current climate assessment
Assessing climate change in cities using UrbClim Hooyberghs, H.
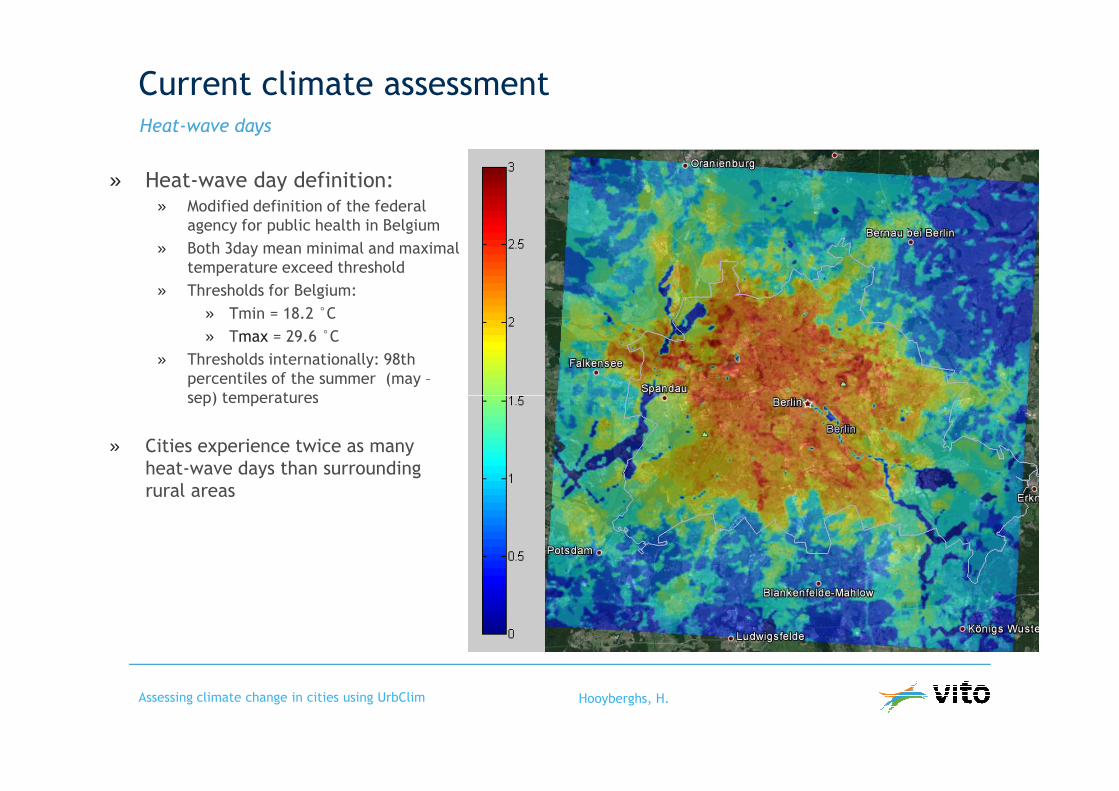
» Heat-wave day definition:» Modified definition of the federal
agency for public health in Belgium
» Both 3day mean minimal and maximal
temperature exceed threshold
» Thresholds for Belgium:
» Tmin = 18.2 °C
» Tmax = 29.6 °C
» Thresholds internationally: 98th
percentiles of the summer (may –
sep) temperatures
Heat-wave days
Current climate assessment
sep) temperatures
» Cities experience twice as many
heat-wave days than surrounding
rural areas
Assessing climate change in cities using UrbClim Hooyberghs, H.

Future urban climate
hourly gridded (250-m)
• temperature
• humidity
• wind speed
Terrain (Corine/GlobCover)
Assessment
Assessing climate change in cities using UrbClim Hooyberghs, H.
UrbClimInput Output
ERA-Interim data (ECMWF)
Global climate models UHI maps
De Ridder K., et al., 2015. Urban Climate, 12, p. 21.

» UrbClim is coupled to the output of 11 global climate models (incl. bias-correction)
» Time frames:
» Reference period (1986 – 2005)
» Near future (2026 – 2045)
» Far future (2081 – 2100)
» Scenario: RCP8.5
» Strongest scenario, but assumes emissions well below what the current energy mix would
produce in the future
Details of assessment
Future urban climate
Assessing climate change in cities using UrbClim Hooyberghs, H.
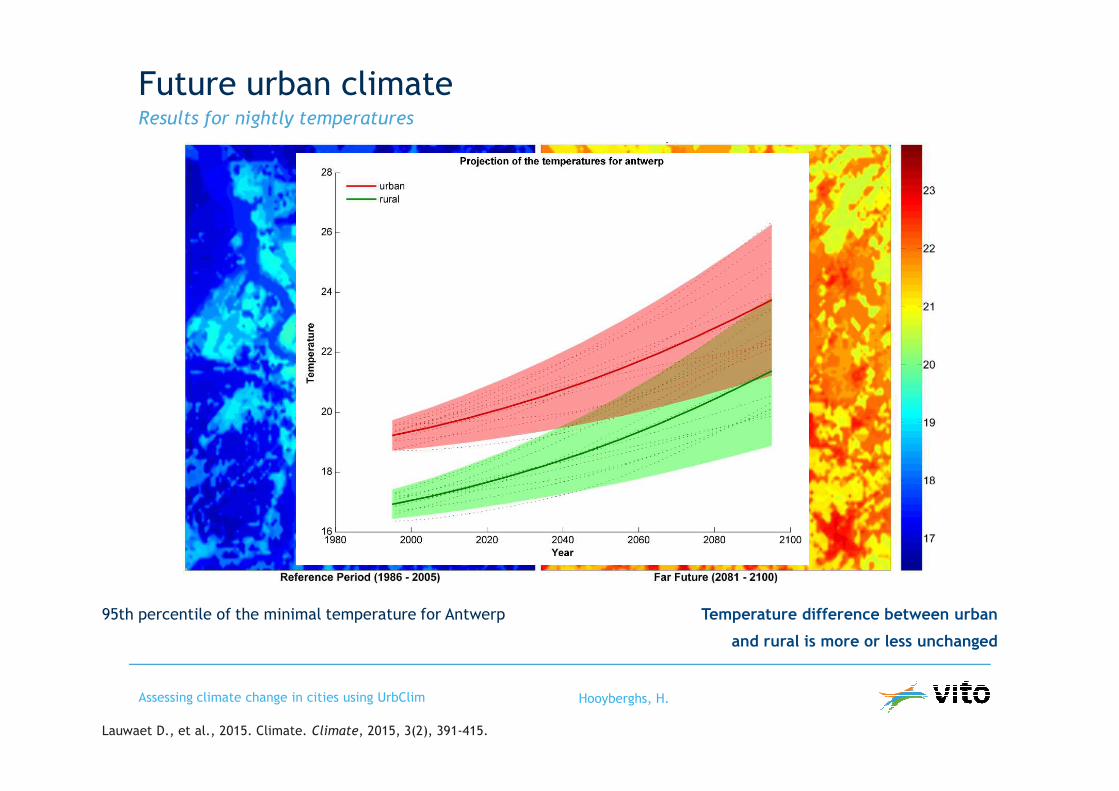
Results for nightly temperatures
Future urban climate
Assessing climate change in cities using UrbClim Hooyberghs, H.
95th percentile of the minimal temperature for Antwerp Temperature difference between urban
and rural is more or less unchanged
Lauwaet D., et al., 2015. Climate. Climate, 2015, 3(2), 391-415.

Heat-wave days
Future urban climate
1986 – 2005 2081 - 2100
Assessing climate change in cities using UrbClim Hooyberghs, H.
Lauwaet D., et al., 2015. Climate. Climate, 2015, 3(2), 391-415.
Number of heat wave days in London for 11 global climate modelsScenario: RCP8.5
Number of heat wave days
increases by a factor ∼∼∼∼ 10, bothin urban and rural areas

1986-2005
Number of heat wave days
increases by a factor ∼∼∼∼ 10, bothin urban and rural areas
Lisbon London Antwerp Bilbao Berlin Rio New York
Assessing climate change in cities using UrbClim Hooyberghs, H.
2081-2100
in urban and rural areas

» Cities tend to be warmer than their rural surroundings (UHI-effect)
» UrbClim model provides hourly temperature maps and number of heat-wave days
for current and future urban climate
» Cities experience twice as many heat-wave days than rural areas
Conclusions
» Future climate
» Temperature difference between urban and rural remains approximately the
same
» Number of heat-wave days increases by a factor 10, both in urban and rural
areas
Assessing climate change in cities using UrbClim Hooyberghs, H.

» Questions?
Thank you!
Assessing climate change in cities using UrbClim Hooyberghs, H.