assessment in education: principles, policy and practice (2016)...
TRANSCRIPT

This work is licensed under a Creative Commons Attribution 4.0 International License
Newcastle University ePrints - eprint.ncl.ac.uk
Humble S, Dixon P, Schagen I.
Assessing intellectual potential in Tanzanian children in
poor areas of Dar es Salaam.
Assessment in Education: Principles, Policy and Practice (2016)
DOI: 10.1080/0969594X.2016.1194257
Copyright:
© 2016 The Authors. Published by Informa UK Limited, trading as Taylor & Francis Group This is an
Open Access article distributed under the terms of the Creative Commons Attribution License
(http://creativecommons.org/licenses/by/4.0/), which permits unrestricted use, distribution, and
reproduction in any medium, provided the original work is properly cited.
DOI link to article:
http://dx.doi.org/10.1080/0969594X.2016.1194257
Date deposited:
18/05/2016

Full Terms & Conditions of access and use can be found athttp://www.tandfonline.com/action/journalInformation?journalCode=caie20
Download by: [81.153.166.109] Date: 09 August 2016, At: 22:47
Assessment in Education: Principles, Policy & Practice
ISSN: 0969-594X (Print) 1465-329X (Online) Journal homepage: http://www.tandfonline.com/loi/caie20
Assessing intellectual potential in Tanzanianchildren in poor areas of Dar es Salaam
Steve Humble, Pauline Dixon & Ian Schagen
To cite this article: Steve Humble, Pauline Dixon & Ian Schagen (2016): Assessing intellectualpotential in Tanzanian children in poor areas of Dar es Salaam, Assessment in Education:Principles, Policy & Practice, DOI: 10.1080/0969594X.2016.1194257
To link to this article: http://dx.doi.org/10.1080/0969594X.2016.1194257
© 2016 The Author(s). Published by InformaUK Limited, trading as Taylor & FrancisGroup
Published online: 08 Aug 2016.
Submit your article to this journal
View related articles
View Crossmark data

Assessment in educAtion: PrinciPles, Policy & PrActice, 2016http://dx.doi.org/10.1080/0969594X.2016.1194257
© 2016 the Author(s) . Published by informa uK limited, trading as taylor & Francis Groupthis is an open Access article distributed under the terms of the creative commons Attribution license (http://creativecommons.org/licenses/by/4.0/), which permits unrestricted use, distribution, and reproduction in any medium, provided the original work is properly cited.
Assessing intellectual potential in Tanzanian children in poor areas of Dar es Salaam
Steve Humble, Pauline Dixon and Ian Schagen
education, newcastle university, newcastle upon tyne, uK
ABSTRACTThe research set out in this paper attempts to identify whether one of three conventional IQ tests is more capable of identifying intellectual potential amongst poor children in Dar es Salaam. To this end 1857 children from 17 government schools in poor districts of Dar es Salaam were asked to complete a questionnaire and undertake a range of tests. The study included teacher, peer and self-nomination. It has been noted that static testing may not fully elicit the abilities of African children. It has been suggested that dynamic testing might provide a more fair and equitable means of assessment. Therefore 101 students took part in a control and intervention group in order to investigate. The findings show a significant correlation between IQ test scores and other test outcomes. Those with larger families and older children perform less well on IQ tests. Peer ability and self-confidence positively influence test scores.
Introduction
There has been much debate around the utilisation of conventional intellectual ability tests with Black Africans living in developing contexts. According to Sternberg et al. (2002) ‘it has been suggested that Black Africans living in non-westernised settings might score rel-atively poorly on conventional tests for intelligence’ (Sternberg et al., 2002, p. 157). There is some debate regarding what previous studies show concerning average IQ scores. Work by Lynn (2003) and Lynn and Vanhanen (2002, 2006) concluded that the average IQ of Black Sub-Saharan Africans lies below 70 based on western norms and conventional IQ tests. Others disagree. Wicherts, Dolan, Carlson, and van der Maas (2010) carried out a systematic literature review of selected published data on performances on the Standard Progressive Matrices (SPM) and the Coloured Progressive Matrices (CPM) in Sub-Saharan African countries. Initially they calculated a score only using papers that complied with certain criteria (i.e. no time limit for the test, the test rules were followed, sample size representable of the population) critiquing the methodological approach of Lynn and Vanhanen’s (2002) who did not justify study selection. Wicherts et al. (2010) found utilising the selective meth-odology that IQ scores in Africa (based on SPM and CPM) were somewhere between 78 (UK standards) and 80 (US standards), 11 IQ points higher than Lynn and Vanhanen (2002)
KEYWORDSdynamic testing; tanzania; developing countries; assessing intellectual potential; peer ability; self-confidence; poverty
ARTICLE HISTORYreceived 14 october 2015 Accepted 18 may 2016
CONTACT Pauline dixon [email protected]
OPEN ACCESS

2 S. Humble eT Al.
had reported. An investigation by Wicherts et al. (2010) into the reliability of the Raven’s test based on African samples (countries included Nigeria, Ghana, South Africa, Congo, Kenya, Uganda and Zambia) suggested a high level of concordance (.80 Cronbach’s alpha) in line with findings from western studies. However, they report that the retest reliability conducted after 6 months was quite low (.59) and concurred with the literature in their study. Interestingly, from the studies cited there was a positive rank order correlation between reliability and publication date; that is, reliability improved with newer published studies.
Convergent validity was also investigated and reported as being low in comparison to British samples. However, Wicherts et al. (2010) point to 16 studies that demonstrate some significance of the value of SPM and CPM measures within African-only educational settings. The studies included had a range of scores from low to moderately high, but all positively reported SPM and CPM as being predictively valid. For example, Sternberg et al. (2001) examined children in rural Kenya and found a moderately weak correlation between CPM and English and mathematics achievement (N = 85, r = .19). The same study reported significant negative correlations with practical intelligence (tacit knowledge). One relatively high correlation included the work by Maqsud (1980) who examined boys from Nigerian schools and reported a significant correlation between SPM and English and arithmetic (r = .59) test scores. However, the authors adopt a cautious approach when considering both Ravens tests (including the Advanced Progressive Matrices) and their predictive associations with educational outcomes.
Different explanations have been given regarding why the average IQ of Black Sub-Saharan Africans might be lower based on western norms. These include:
• genetic differences (Herrnstein & Murray, 1994);• cultural differences in interpretations of test questions (Cole, Glick, & Sharp, 1971);• that cognitive tests scores are influenced by the amount of schooling and therefore
when children profit less from their school environment scores will be lower (Ceci & Williams, 1997);
• that static testing focuses on developed ability that children in difficult circumstances may not have had an opportunity to ‘develop’ (Sternberg et al., 2002); and
• children who are not familiar with test content and/or format (i.e. not testwise) may not perform at their capacity in static testing (Sternberg et al., 2002).
In poor areas of developing countries, some school stakeholders, such as government offi-cials, teachers and district education officers believe that children who are often first gen-eration learners, with illiterate parents, are incapable of learning (Humble, 2015; Frasier, 1987; Iyer & Nayak, 2009). The contribution to the economic development of their country through their human capital and cognitive skills is therefore often overlooked. It is impor-tant to be able to dispel any myths regarding these children’s inability to excel. According to Hanushek and Woessmann (2012) ‘school policy can, if effective in raising cognitive skills, be an important force in economic development’ (p. 300). It is key, therefore, in such developing settings, to ensure that children’s potential does not remain unrecognised, unsupported and untapped. The use of foreign or imported tests to study psychological constructs in settings other than where they were developed is contentious (Greenfield, 1997; International Test Commission, 2010; Mpofu & Ortiz, 2009). The presuppositions behind test items and testing procedures cannot be assumed to translate cross culturally. There is a need, therefore, to understand the potential for cross-cultural adaptation of

ASSeSSmenT In eDucATIon: PrIncIPleS, PolIcy & PrAcTIce 3
existing measures of human abilities. The evidence would be of value to allow the tailor-ing of instruments to different contexts and to modify or develop new measures more appropriate to each setting (Hambleton, Merenda, & Spielberger, 2005; Mpofu, Oakland, Ntinda, Maree, & Seeco, 2015). Sternberg et al. (2002) suggests that ‘conventional’ western IQ tests ‘may fail fully to elicit the abilities’ (p. 142) of African children. This in part could be owing to the children being unaccustomed to the methods for taking such tests. It is also suggested that disadvantaged students (those having unequal learning opportunities owing to the lack of education) may benefit from dynamic testing, which should reduce educational inequalities by providing a more fair and equitable means of assessment. Dynamic testing implies measuring the ‘psychological processes involved in learning and change’ (Sternberg et al., 2002, p. 143) alongside feedback from the examiner after each task so providing a two-way interactive relationship between examiner and examinee. Vygotsky (1962) is credited for introducing the concept of dynamic testing and others have carried out research directly from Vygotsky’s theory (Brown & Ferrara, 1985; Guthke, 1992; Lidz, 1987). By contrast, static testing examines pre-existing skills providing no feedback during the test where a neutral relationship exists between examiner and exam-inee. There have been a number of research programmes carried out looking at dynamic testing, reviewed by Grigorenko and Sternberg (1998) and Sternberg and Grigorenko (2002). As Grigorenko and Sternberg (1998) state there are a wide variety of testing con-texts in which dynamic testing has been explored, including with disadvantaged pupils (Bolig & Day, 1993; Borland & Wright, 1994; Hickson & Skuy, 1990). Indeed the work of Feuerstein, Rand, and Rynders (1988) looks at the application of dynamic testing with disadvantaged children who may perform poorly on conventional static tests. These pupils are those ‘having unequal learning opportunities due to deficient previous education’ and that dynamic testing for these students would ‘reduce educational inequalities by providing what are seen as more compassionate, fair, and equitable means for assessing students’ learning capacities’ (Grigorenko & Sternberg, 1998, p. 76). Dynamic testing, according to the overall review, allows for a more true evaluation of disadvantaged children’s potential. The intervention in the dynamic testing process allows a re-evaluation that could dramat-ically change performance.
Using the concept of dynamic testing Sternberg et al. (2002) tested 458 children in stand-ards 2–5 in rural villages near Bagamoyo, Tanzania. There were 358 in the experimental group who experienced dynamic testing and 100 in the control group who experienced static testing. The hypothesis was that dynamic testing exposed the mental abilities of chil-dren more than the static testing. The tests/tasks included Syllogisms, Sorting and Twenty Questions. Children were given a pre-test and a post-test. Those in the experimental group benefited from an intervention, teaching cognitive skills and strategies, that contributed to greater success on the specific test(s) (pre-test-intervention-post-test design). The control group had no intervention. The intervention was less than an hour per task. The intervention was not specifically on the post-test but on skills that could be used to help understand how to carry out the test more efficiently and effectively. The findings revealed that the experi-mental group improved more than the control group from pre- to post-testing. Rank order also changed. The correlation between pre-test and post-test for the experimental group was weak. The control group correlation was substantial and significantly higher than the experimental group. The research however suggests that dynamic testing is a supplement to static testing but not a substitute.

4 S. Humble eT Al.
Klingelhofer (1967) used the SPM to test 3692 secondary school children in Tanzania. These children were made up of different Tanzania tribes as well as Asian children living in Tanzania. Regarding the findings, consideration should be given to the fact that in the 1960s children of African, Asian and European descent would have been racial segregated owing to the colonial education system operating in Tanzania at that time (Anangisye & Fussy, 2014). The findings showed that when looking for any significant difference in scores there were none between different Tanzania tribes or Asian community sub-groups. However, considering differences in mean level SPM scores there was a significant difference between all African and all Asian pupils. Reasons suggested for this included cultural factors, such as Asian students living in town, starting school earlier and hailing from literate families. Another suggestion is that in Asian languages compared to Kiswahili there are terms such as ‘divergence’ and convergence’ which assist with some concepts used in the Progressive Matrices (PM) tests, but such concepts do not exist in Kiswahili.
The India languages are apparently more effective and economical in dealing with these com-plex abstract notions and represent an additional cultural factor which is probably involved with the PM scores. (Klingelhofer, 1967, p. 212)
The data also show a statistically significant inverse relationship between age and score, possibly implying that older children in their grade are late starters or slower learners.
This paper considers two issues. The first is to try to determine whether one of three conventional IQ tests would fit more accurately with other methods to identify intellectual potential in children living in poor urban areas of Tanzania. To this end three different IQ tests, three conventional subject tests, along with background and self-perception question-naires and teacher opinions were gathered. The second focus is to ascertain whether the children’s static performance on a traditional IQ test could be seen as a true indicator of their ability and level of knowledge. Children in urban Tanzania will never have undertaken tests where they need to utilise their cognitive capacity to encode and analyse information in such an abstract form. Therefore this research set out to investigate whether dynamic testing would allow children to gain a greater understanding in order to complete different items more effectively and efficiently.
The research questions to be explored around these two issues are:
• Of the three IQ tests does one correlate more strongly with other indicators of intel-lectual potential and high ability?
• Are there any correlations between the IQ standardised test scores and other learning outcomes, family background and school factors?
• Does dynamic testing lead to an increase in score levels?• If there are gain differences in the static and dynamic group scores could this imply
dynamic testing provides a greater understanding of what the test items require?
Method
Participants
Conventional IQ test sampleA total of 1857 primary students from 17 government schools situated in poor areas of Dar es Salaam in Tanzania were asked to complete a questionnaire as well as undertake tests as part

ASSeSSmenT In eDucATIon: PrIncIPleS, PolIcy & PrAcTIce 5
of an Economic and Social Research Council funded project which looked to identify talented children living in poverty. The 1857 children were made up of 52% girls and the mean age for the whole sample was 11 years (standard deviation 1.1 years). Students in groups of 40–50 in classes 4 and 5 completed the tests/questionnaires. In total 33 scripts had missing data, thus 1824 have been analysed. The study also included teacher interviews, parent interviews and household surveys.1 All students and their parents were informed through their schools that the purpose of the assessment exercise was to assess the strengths or talent areas of the students, that participation was voluntary, and that the results of the assessment would be kept strictly confidential and for research use only (Dixon, Humble, & Chan, 2016).
Dynamic and static sampleTo explore issues highlighted in the literature regarding performance by disadvantaged students on conventional IQ tests a sample of 101 children were recruited – 52 girls and 49 boys – to whom the same SPM test was administered twice. These children were in grade six, aged 10 through 12 years old. They were all from one school operating in a poor part of the Kinondoni district, Dar es Salaam. The static and dynamic groups had approximately equal proportions of boys and girls; the static having 24 girls and 25 boys, the dynamic 28 girls and 24 boys.
Materials
Conventional IQ test focusTests administered included one of three conventional IQ tests. These were the Ravens Standard Progressive Matrices Plus Version (SPM), the Matrix Reasoning test from the Wechsler Abbreviated Scale of Intelligence – Second Edition (WASI-II) and the Naglieri Nonverbal Ability test (NNAT2). Mathematics, English reading and Kiswahili tests were also administered. The mathematics test was made up of 26 items taken from GMADE 1 to 4 (Pearson) and the English reading test from the ‘Single Word Reading Test’ (National Foundation for Educational Research) made up of 60 words. The schools in which the different IQ tests were to be distributed were randomly selected. As the SPM (n = 823) and the NNAT2 (n = 833) are whole class administered, seven schools were randomly allocated for each of these (all children in class 4 and 5). Three schools took the WASI-II as this is individually administered taking up much of the researchers’ time, thus fewer children took this test (n = 168 all children in class 4 and 5). In order to address issues around cross-cul-tural transportability of tests, pilots were carried out in Morogoro schools, west of Dar es Salaam. Teachers and educationalists in Nairobi devised the Kiswahili test made up of ten items. Changes were made after the pilot through discussions and in collaboration with local teachers. Similar procedures were carried out for developing the mathematics and English reading tests. The questionnaire included a background questionnaire, thoughts around, and peer nomination of children regarded as high ability and a self-perception questionnaire the Student Multiple Intelligences Profile (SMIP). The SMIP is a likert-scale questionnaire developed by Chan (2001) based on Gardner’s Multiple Intelligences theory.
Dynamic and static focusBoth groups took the SPM twice. The static group sat the test, followed by an hour break (playing outside) and then took the same test again. The dynamic group took the test
6 S. Humble eT Al.
followed by an intervention, which discussed a range of non-verbal reasoning items. This was carried out during a workshop where there was interaction between the examiner and examinees. Following directly on from the workshop the dynamic group then retook the SPM test.
During the hour workshop the children in the dynamic group were given questions that utilised different skills to help in their acquisition of new cognitive operations. These skills included the recognition of one and two line symmetry and the identification of sequen-tial patterns developing within rows and columns. The intervention was carried out with the whole dynamic group with the questions becoming progressively more difficult over the hour. Children were given feedback until they either solved the problem or could not proceed to gain the answer. Instruction was given in Kiswahili and diagrams were drawn on the board to help support concrete understanding.
The testing occurred in the morning for both groups and they were from the same grade at the same government school in the Kinondoni area of Dar es Salaam. It was reported that their teacher had randomly put these children into two groups.
Results
Effect of IQ test taken
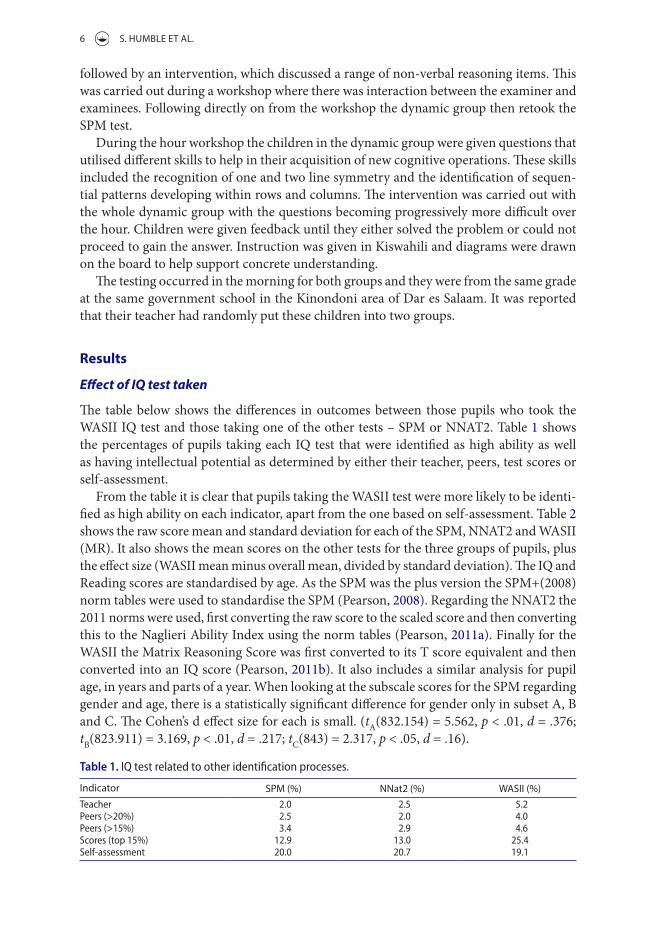
The table below shows the differences in outcomes between those pupils who took the WASII IQ test and those taking one of the other tests – SPM or NNAT2. Table 1 shows the percentages of pupils taking each IQ test that were identified as high ability as well as having intellectual potential as determined by either their teacher, peers, test scores or self-assessment.
From the table it is clear that pupils taking the WASII test were more likely to be identi-fied as high ability on each indicator, apart from the one based on self-assessment. Table 2 shows the raw score mean and standard deviation for each of the SPM, NNAT2 and WASII (MR). It also shows the mean scores on the other tests for the three groups of pupils, plus the effect size (WASII mean minus overall mean, divided by standard deviation). The IQ and Reading scores are standardised by age. As the SPM was the plus version the SPM+(2008) norm tables were used to standardise the SPM (Pearson, 2008). Regarding the NNAT2 the 2011 norms were used, first converting the raw score to the scaled score and then converting this to the Naglieri Ability Index using the norm tables (Pearson, 2011a). Finally for the WASII the Matrix Reasoning Score was first converted to its T score equivalent and then converted into an IQ score (Pearson, 2011b). It also includes a similar analysis for pupil age, in years and parts of a year. When looking at the subscale scores for the SPM regarding gender and age, there is a statistically significant difference for gender only in subset A, B and C. The Cohen’s d effect size for each is small. (tA(832.154) = 5.562, p < .01, d = .376; tB(823.911) = 3.169, p < .01, d = .217; tC(843) = 2.317, p < .05, d = .16).
Table 1. iQ test related to other identification processes.
Indicator SPm (%) nnat2 (%) WASII (%)teacher 2.0 2.5 5.2Peers (>20%) 2.5 2.0 4.0Peers (>15%) 3.4 2.9 4.6scores (top 15%) 12.9 13.0 25.4self-assessment 20.0 20.7 19.1

ASSeSSmenT In eDucATIon: PrIncIPleS, PolIcy & PrAcTIce 7
All the differences between WASII pupils and the rest were significant, except for maths score. WASII pupils tended to be older and score higher in each test apart from maths. Table 3 shows the correlations between IQ and the other test scores for the three groups of pupils.
There are few major differences here, except that WASII IQ scores have lower correlation with maths.
Multiple regression was carried out using SPSS and the results are provided in Table 4 showing any correlations with the IQ measures – SPM, NNAT2 and WASII. The table shows the variables with significant correlations only, (p < .05), their impact size and their quasi-ef-fect size related to the IQ measure. Some conclusions from the analysis are given as follows:
• if you perform well in reading, mathematics and Kiswahili, you are more likely to obtain a higher score in the SPM and the NNAT2 tests;
• if your peers in the class gain a higher average IQ standardised score when taking either the SPM or the NNAT2 the more likely your own IQ score will be higher;
• the older you are and if you are a girl then the likelihood is that you will score lower in the SPM and the NNAT2;
• the mother’s level of education is negatively related to the NNAT2 score;• the larger the family, i.e. more brothers and sisters in the home, the more likely you
are to have a lower WASII standardised score; and• if you are identified by your peers as being high ability then there is a likelihood that
your SPM standardised score will be higher.It is interesting to note that none of the school or teacher factors have any significant correlations with any of the IQ measures.
Static and dynamic
Approximately 50 pupils in two groups were tested and retested using the SPM. There were two sets of children known as the ‘static’ and ‘dynamic’ groups as follows:
Table 2. test scores.
notes: For raw scores sPm total 60; nnat2 total 48; WAsii total 30. the cronbach’s Alpha are as follows: sPm = .823; nnAt2 = .824; WAsii = .518.
SPm nnat2 WASII overall S.d. eSiQ raw score (mean) 16.65 16.97 11.09iQ raw score (sd) 6.00 7.54 3.08iQ standardised score 64.75 68.09 81.99 67.86 14.41 .98reading score 75.21 75.31 79.49 75.65 8.77 .44maths score 19.77 19.45 19.97 19.64 4.78 .07Kiswahili score 4.92 5.03 5.55 5.03 1.82 .29
N = 823 N = 833 N = 168 N = 1824Age in years 11.02 10.98 11.45 11.04 1.16 .36
Table 3. correlations between iQ and other test scores.
SPm nnat2 WASIIreading score .299 .297 .285maths score .332 .444 .232Kiswahili score .266 .277 .270combined scores .652 .729 .544

8 S. Humble eT Al.
• ‘Static’ – with no additional training between tests; and• ‘Dynamic’ – with additional training between tests.
The overall raw score gains for the two groups were compared and are shown in Table 5. The ‘dynamic’ group clearly made stronger gains than the other where the mean score raised by 5 points. It’s interesting to note that there were only 2 children in the static group who increased their score in the second testing round by more than 5 marks. However, in the dynamic group there were 22 children scoring more than 5 marks with 6 children scoring between 14 and 22 marks higher than their first test score.
Table 4. ordinary linear regression on personal background, school and iQ measures.
notes: numbers in the above table are – impact size (quasi-effect size schagen, 2004).For variable list see table A1 in Appendix 1.
outcome
Significant regression coefficients
SPm (N = 823) nnAT2 (N = 833) WASII (N = 168)peer 15 11.779 (.96)tidenselfind 2.298 (.15)iQssreadss .200 (.19) .138 (.11) .192 (.37)maths .444 (.25) 1.015 (.45) .291 (.21)kiscore .724 (.237) 1.142 (.19)ptrschfact1schfact2teachergenderclasssizeavageaviQss .742 (.03) .364 (.16)avreadss −.681 (−.14)teachexteachqualgender (girl) −3.853 (−.31) −3.451 (−.23)age −1.152 (−.15) −2.389 (−.25)eldestyoungestengliswbrotherenglishbrosis −.772 (−.31)maleincomefemaleincomefatheredmothered −.748 (−.10)wealthlooinsideelectric
Table 5. overall score gain – difference between test 1 and test 2.
note: difference in means is significant t(78.912) = −4.490, p < .001.
N mean Std. deviation Std. error0 static 49 .53 3.361 .4801 dynamic 52 5.00 6.287 .872total 101 2.83 5.534 .551

ASSeSSmenT In eDucATIon: PrIncIPleS, PolIcy & PrAcTIce 9
Table 6 shows the gains in scores for the questions related to symmetry. This is relevant as in the workshop the dynamic group discussed and worked through items that included a recognition of one and two line symmetry.
Many of the questions in the SPM are based around column and row pattern develop-ment, another skill developed for the dynamic group only. Therefore looking at the gains in scores for the total of the other items there is a statistically significant difference between the static and dynamic groups (Table 7).
It seems clear that the ‘dynamic’ group are making more gains than the other on all parts of the test. However, it is important to note that the two groups were not balanced initially. Looking at the differences in their initial scores, the mean score of the static group was lower than the dynamic group (Table 8). This may call into question the results, as it could be that the ‘dynamic’ group are more able and capable of making more progress than the other, even without training.
Therefore a regression model was used to predict the final score on the initial score, the group, the pupil’s gender and pupil’s age. The results are given in Table 9. The final score is significantly related to the initial score and the group, and almost significantly to gender (girls making more progress than boys), but not to pupil’s age.
Item progressIt is interesting to look at the progress made on five items in the SPM that specifically illustrate the skills discussed in the workshop session with the dynamic group. Figure 1 compares the progress of both the static and dynamic groups on these items. The cognitive operations that could be utilised in the items are as follows:
Table 6. Gains in scores for the symmetrical items.
note: difference in means is significant t(90.91) = −2.476, p < .05.
N mean Std. deviation Std. error0 static 49 .20 1.020 .1461 dynamic 52 .83 1.478 .205total 101 .52 1.308 .130
Table 7. Gains in scores for ‘other items’.
note: difference in means is significant t(79.711) = −4.239, p < .001.
N mean Std. deviation Std. error0 static 49 .33 3.105 .4441 dynamic 52 4.17 5.708 .792total 101 2.31 4.997 .497
Table 8. differences in initial scores.
note: difference in means is significant t(99) = −4.625, p < .001.
N mean Std. deviation Std. error
Total score on first test0 static 49 17.82 9.105 1.3011 dynamic 52 26.75 10.23 1.419total 101 22.42 10.644 1.059

10 S. Humble eT Al.
B4 two lines of symmetry; B5 and B6 one line of symmetry; C5 and D12 pattern devel-opment with rows and columns.
Figure 1 illustrates this, in terms of the four possible categories:
• Right to wrong• Wrong to wrong• Right to right• Wrong to right
In terms of ‘wrong to right’, the ‘dynamic’ group is clearly making better progress on each item.
Progress on separate sections of the testProgress on the five different sections of the test (A–E) was also analysed. Table 10 shows the changes in the five section scores for the two groups, and the significance of the between-group differences.
Three sections are significant at the 5% level – A, B and D. Regression models for each section produced the results shown in Table 11, for the final total vs. initial total, group, gender and age. In this analysis, final score is significantly related to initial score in all cases, and greater for the dynamic group in all cases except section E. Girls make significantly more progress for sections B and D, and age is not significant in any case. Table 12 shows
Table 9. coefficients for the final score.
note: dependent variable: final score.
Independent variables
unstandardised coefficients Standardised coefficients
t Sig.B Std. error beta(constant) −.549 4.475 −.123 .903initial score .865 .052 .772 16.606 .000static or dynamic group 5.876 1.118 .248 5.257 .000Gender (girl) 1.878 .995 .079 1.887 .062Age .231 .401 .025 .576 .566
Figure 1. training items.

ASSeSSmenT In eDucATIon: PrIncIPleS, PolIcy & PrAcTIce 11
the test–retest correlations for each of the subsets. For sections B, C and D the dynamic group correlations are lower than the static group.
A Wilcoxon signed rank test was carried out on the test–retest scores for the static and dynamic groups. For the static group there were 22 of the 49 participants who scored more on the second test than on the first, 11 of the ranks were tied. In contrast for the dynamic group scores were higher in 38 of the 52 cases with only 3 tied. For the static group the Wilcoxon shows no statistically significant change in rank order (z = −1.306, p > .05, r = −.187) but for the dynamic group the change in rank order was statistically significant (z = −4.81, p < .01, r = −.667). As the effect size in this case is greater than Cohen’s bench-mark of .5 this represents a large change in the dynamic group scoring.
Discussion
The literature shows much debate around the use of conventional intellectual ability tests in developing contexts (Lynn & Vanhanen, 2002, 2006; Lynn, 2003; Maqsud, 1980; Sternberg et al., 2001, 2002; Wicherts et al., 2010; Wicherts, Dolan, & van der Maas, 2009). This paper sets out the findings from research that attempts to identify in part, whether one of three such tests was deemed more suitable in the Tanzanian context as part of a multidimen-sional procedure searching for intellectual potential amongst poor children. It also looked at the hypothesis that dynamic testing might provide a more fair and equitable means of
Table 10. Five section scores.
Section mean change in score – static mean change in score – dynamic SignificanceA .12 .67 .04B .49 1.79 .00c .08 .79 .06d −.24 1.56 .00e .02 .17 .43
Table 11. coefficients for final score.
*correlations are significant at the .05 level.**correlations are significant at the .01 level.
Independent variables
coefficients for final score
A b c D einitial score .615** .780** .760** .667** .816**Group (dynamic vs. static) .998** 1.983** 1.246** 2.795** .195Girls vs. boys .363 .916* .207 .857* −.006Age .007 .117 .048 .265 −.106
Table 12. test–retest correlations for the sPm subsets.
**correlations are significant at the .01 level.
SPm subsets Static group Dynamic groupA .675** .737**B .816** .677**c .906** .689**d .831** .697**e .616** .730**

12 S. Humble eT Al.
assessment. Static testing may not fully elicit the abilities of African children owing to the possible lack of development of certain skills, the cultural differences in interpreting the test questions or the lack of experience in the school environment (Ceci & Williams, 1997; Cole et al., 1971; Sternberg et al., 2002). The intervention for this research regarding static and dynamic testing was similar to that undertaken by Sternberg et al. (2002) regarding the time duration of the intervention, the use of Kiswahili as the language of instruction and the focus on skills that could contribute to the success on this kind of non-verbal reasoning test. To this end the paper addresses two issues through four research questions. Each one will be discussed in turn.
• Of the three IQ tests does one correlate more strongly with other indicators of intel-lectual potential and ability?
Three IQ tests were trialled with different groups of children from government schools in poor areas of Kinondoni, Dar es Salaam. Two of them (SPM and NNAT2) were group administered and the other (WASII) individually, one on one with an administrator and pupil. Fewer children took the WASII (168) owing to restrictions on time and finance with 823 and 833 taking the SPM and NNAT2, respectively. The results show that children who scored highly in the WASII IQ test were more likely to be identified as high ability possessing intellectual potential by their peers, teachers and test scores. The SPM and NNAT2 mean standardised scores were quite similar with the WASII being much higher. There were sig-nificant correlations between the IQ tests and all of the other test outcomes. The correlation for the WASII with the maths score is lower than the other IQ tests.
• Are there any correlations between the IQ standardised test scores and other learning outcomes, family background and school factors?
There is a statistically significant positive correlation between all of the IQ standardised test scores and the maths and reading outcomes. Only the WASII standardised score does not correlate with the Kiswahili score. The findings are as expected with larger families and older children performing less well on the IQ tests. Peer ability and self-confidence also have a positive influence on test scores.
• Does dynamic testing lead to an increase in score levels?Our results show there is a significant increase in the mean test score using a dynamic approach. The dynamic group make more gains in all parts of the test. Running a regression model to predict the final score on the initial score (because the groups were not homog-enous initially) reveals that the final score is significantly related not only to the initial score but also to the group to which you belonged, i.e. static or dynamic. This research, in agreement with others, shows that a short intervention not only increases scores, but also has a statistically significant effect on rank order (Grigorenko & Sternberg, 1998; Sternberg & Grigorenko, 2002; Sternberg et al., 2002).
• If there are gain differences in the static and dynamic group scores could this imply dynamic testing provides a greater understanding of what the test items require?
Sternberg et al. (2002) say it may not come as a ‘surprise’ that ‘children’s performance on novel cognitive tasks improves after practice and being taught specific strategies for taking the same test’ (p. 158). However, the intervention for the dynamic group was only around one hour and children were not tested on the same problems they were trained on. Such

ASSeSSmenT In eDucATIon: PrIncIPleS, PolIcy & PrAcTIce 13
gains in performance over such a short period of time are difficult and the transfer of new cognitive operational skills to different items is not easy (Detterman & Sternberg, 1993; Sternberg et al., 2002). Therefore the improvement by the dynamic group and the result that the final score is significantly related to the group to which the child belonged indicates that dynamic testing may provide complementary information than that obtained through static testing. It could also be suggested in agreement with Klingelhofer (1967) that the workshop introduced the children to concepts used in the SPM, such as ‘divergence’ and ‘convergence’ that do not exist in the Kiswahili language.
It is recognised that our study has limitations. Testing only took part in one district in one country. More tests could have been used in order to consider what could be a culturally appropriate test for identifying intellectual potential. Our results show that utilising different conventional IQ tests may actually produce different standardised average IQ scores. Those administered to the whole class produced lower average scores than those administered one on one. However our sample size for the one on one test was much smaller, which could call this hypothesis into question. For the dynamic testing the intervention and control groups were not balanced initially. Only SPM tests scores were gathered for these 101 students. It would have been beneficial to collect other test scores and background data as in the con-ventional IQ test sample of 1857.
So where next? Regarding the data collected in this project, it would be interesting to carry out tests of differential item functioning on the items of the SPM comparing the Tanzanian results to those in western samples. Such analysis would shed light on the psy-chometric comparability of the cognitive tests. This research has also raised other interesting questions to take forward. First, if the research were carried out again in different African countries would similar results be obtained? Second, are different conventional IQ tests more cross culturally transportable than others (Mpofu, 2002)? Third is the beneficial gain attributed to dynamic testing worth the additional time involved? The results from this research suggest that more consideration and exploration is justified around these concepts to further our understanding and assessment of intellectual abilities.
Note
1. Findings reported elsewhere.
Disclosure statement
No potential conflict of interest was reported by the authors.
Funding
The author(s) received funding from the Economic and Social Research Council (ESRC) [grant number ES/K011987/1] for the research.
Notes on contributors
Steve Humble, MBE is a lecturer at Newcastle University and a Fellow of the Institute of Mathematics and its Applications. His research interests focus on improving access to and the quality of schooling in developing context as well as creativity, intelligence and gifted education.

14 S. Humble eT Al.
Pauline Dixon, PhD is professor of International Development and Education at Newcastle University. Her seminal work around school choice, school management types and international aid in developing contexts has won her awards and honours around the world.
Ian Schagen, PhD was head of Statistics at the National Foundation for Educational Research (Nfer) and is now an independent statistical consultant and a visiting scholar at Newcastle University.
References
Anangisye, W. A. L., & Fussy, D. (2014). Tanzania: Revisiting eastern and Central African Education Systems. In C. Wolhunter (Ed.), Education in East and Central Africa (pp. 373–398). London: Bloomsbury Academic.
Bolig, E. E., & Day, J. D. (1993). Dynamic assessment and giftedness: The promise of assessing training responsiveness. Roeper Review, 16, 110–113. http://dx.doi.org/10.1080/02783199309553552
Borland, J. H., & Wright, L. (1994). Identifying young, potentially gifted, economically disadvantaged students. Gifted Child Quarterly, 38, 164–171. http://dx.doi.org/10.1177/001698629403800402
Brown, A. L., & Ferrara, R. A. (1985). Diagnosing zones of proximal development. In J. V. Wertsch (Ed.), Culture, communication and cognitions: Vygotskian perspectives (pp. 273–305). New York, NY: Cambridge University Press.
Ceci, S. J., & Williams, W. M. (1997). Schooling, intelligence and income. American Psychologist, 52, 1051–1058. http://dx.doi.org/10.1037/0003-066X.52.10.1051
Chan, D. W. (2001). Assessing giftedness of Chinese secondary students in Hong Kong: A multiple intelligences perspective. High Ability Studies, 12, 215–234. http://dx.doi.org/10.1080/13598130120084348
Cole, M., Glick, G. J., & Sharp, D. W. (1971). The cultural context of learning and thinking. New York, NY: Basic Books.
Detterman, D. K., & Sternberg, R. J. (Eds.). (1993). Transfer on trial. Norwood, NJ: Ablex.Dixon, P., Humble, S., & Chan, D. W. (2016). How children living in poor areas of Dar Es Salaam,
Tanzania perceive their own multiple intelligences. Oxford Review of Education, 42, 230–248. http://dx.doi.org/10.1080/03054985.2016.1159955
Feuerstein, R., Rand, Y., & Rynders, J. E. (1988). Don’t accept me as I am: Helping “retarded” people to excel. New York, NY: Plenum Press.
Frasier, M. M. (1987). The identification of gifted black students: Developing new perspectives. Journal for Education of the Gifted, 10, 155–180.
Greenfield, P. (1997). “You can’t take it with you”: Why abilities tests do not cross cultures. American Psychologist, 52, 1115–1124. http://dx.doi.org/10.1037/0003-066X.52.10.1115
Grigorenko, E. L., & Sternberg, R. J. (1998). Dynamic testing. Psychological Bulletin, 124, 75–111. http://dx.doi.org/10.1037/0033-2909.124.1.75
Guthke, J. (1992). Learning tests: The concepts, main research findings, problems and trends. Learning and Individual Differences, 4, 137–151. http://dx.doi.org/10.1016/1041-6080(92)90010-C
Hambleton, R. K., Merenda, P. F., & Spielberger, C. D. (2005). Adapting educational and psychological tests for cross-cultural assessment. Hillsdale, NJ: Erlbaum.
Hanushek, E., & Woessmann, L. (2012). Do better schools lead to more growth? Cognitive skills, economic outcomes, and causation. Journal of Economic Growth, 17, 267–321. http://dx.doi.org/10.1007/s10887-012-9081-x
Herrnstein, R. J., & Murray, C. (1994). The bell curve: Intelligence and class structure in American life. New York, NY: Free Press.
Hickson, J., & Skuy, M. (1990). Creativity and cognitive modifiability in gifted disadvantaged pupils: A promising alliance. School Psychology International, 11, 295–301. http://dx.doi.org/10.1177/0143034390114007

ASSeSSmenT In eDucATIon: PrIncIPleS, PolIcy & PrAcTIce 15
Humble, S. (2015). In search of human capital – identifying gifted children in poor areas of Dar es Salaam, Tanzania. In P. Dixon, S. Humble, & C. Counihan (Eds.), Handbook of International Development and Education (pp. 343–367). Cheltenham: Edward Elgar.
International Test Commission. (2010). Guidelines for translating and adapting tests. Retrieved April 2016, from http://www.intestcom.org
Iyer, G., & Nayak, A. (2009). The quality of school education in Bhutan: Reality and opportunities. Delhi: Government of Bhutan, Ministry of Education.
Klingelhofer, E. L. (1967). Performance of Tanzanian secondary school pupils on the Raven standard progressive matrices test. The Journal of Social Psychology, 72, 205–215. http://dx.doi.org/10.1080/00224545.1967.9922316
Lidz, C. S. (Ed.). (1987). Dynamic assessment. New York, NY: Guildford Press.Lynn, R. (2003). The geography of intelligence. In H. Nyborg (Ed.), The scientific study of general
intelligence (pp. 127–146). Oxford: Elsevier Science.Lynn, R., & Vanhanen, T. (2002). IQ and wealth of nations. Westport, CT: Praeger.Lynn, R., & Vanhanen, T. (2006). IQ and global inequality. Augusta, GA: Washington Summit
Publishers.Maqsud, M. (1980). Relationships between personal control, moral reasoning, and socioeconomic
status of Nigerian Hausa adolescents. Journal of Youth and Adolescence, 9, 281–288. http://dx.doi.org/10.1007/BF02087979
Mpofu, E. (2002). Psychology in sub-Saharan Africa: Challenges, prospects and promises. International Journal of Psychology, 37, 179–186. http://dx.doi.org/10.1080/00207590244000061
Mpofu, E., & Ortiz, J. (2009). Equitable assessment practices in diverse contexts. In E. Grigorenko (Ed.), Multicultural psychoeducational assessment (pp. 41–76). New York, NY: Springer Publishing Company.
Mpofu, E., Oakland, T., Ntinda, K., Maree, J. G., & Seeco, E. G. (2015). Locality, observability and community action (LOCUM) in test development and use in emerging education settings. In P. Dixon, S. Humble, & C. Counihan (Eds.), Handbook of international development and education (pp. 326–342). Cheltenham: Edward Elgar.
Pearson. (2008). Standard progressive matrices – Plus version and mill hill vocabulary scale. London: Author.
Pearson. (2011a). Hand scoring guide: Level D. San Antonio, TX: Author.Pearson. (2011b). WASI-II manual. San Antonio, TX: Author.Schagen, I. (2004). Presenting the results of complex models – Normalised coefficients, star wars
plots, and other ideas. In I. Schagen & K. Elliot (Eds.), But what does it mean? The use of effect sizes in educational research (pp. 25–41). Slough: NFER.
Sternberg, R. J., & Grigorenko, E. L. (2002). Dynamic testing. New York, NY: Cambridge University Press.
Sternberg, R. J., Nokes, C., Geissler, P. W., Prince, R., Okatcha, F., Bundy, D. A., & Grigorenko, E. L. (2001). The relationship between academic and practical intelligence: A case study in Kenya. Intelligence, 29, 401–418. http://dx.doi.org/10.1016/S0160-2896(01)00065-4
Sternberg, R. J., Grigorenko, E. L., Ngorosho, D., Tantufuye, E., Mbise, A., Nokes, C., Jukes, M., & Bundy, D. A. (2002). Assessing intellectual potential in rural Tanzanian school children. Intelligence, 30, 141–162. http://dx.doi.org/10.1016/S0160-2896(01)00091-5
Vygotsky, L. S. (1962). Thought and language. Cambridge, MA: MIT Press (Original work published 1934).
Wicherts, J. M., Dolan, C. V., & van der Maas, H. L. J. (2009). A systematic literature review of the average IQ of sub-Saharan Africans. Intelligence, 38, 1–20. http://dx.doi.org/10.1016/j.intell.2009.05.002
Wicherts, J. M., Dolan, C. V., Carlson, J. S., & van der Maas, H. L. J. (2010). Raven’s test performance of sub-Saharan Africans: Average performance, psychometric properties, and the Flynn effect. Learning and Individual Differences, 20, 135–151. http://dx.doi.org/10.1016/j.lindif.2009.12.001

16 S. Humble eT Al.
Appendix 1
Table A1. list of variables.
Variable name labelpeer15 identified by at least 15% of your peers as high abilitytiden identified by the teacher as high abilityselfind self-confidentiQss iQ standardised score (sPm, nnAt2 or WAsi)readss english reading standardised scoremaths mathematics scorekiswahili Kiswahili scoreptr Pupil teacher ratioschfact1 the school has a tv and a computerschfact2 the school has desks and musical instrumentsteachergender the teacher’s genderclasssize the size of the classavage Average age in the classaviQss Average iQ standardised score in the classavreadss Average reading standardised score in the classteachex teacher experienceteachqual teacher qualificationgender child’s genderage child’s ageeldest the child is the eldest child in the familyyoungest the child is the youngest child in the familyenglisw A member of the family is fluent in englishbrotherenglish the brother or sister can speak or write english fluentlybrosis number of brothers and sistersmaleincome the income level of the father or male guardianfemaleincome the income level of the mother or female guardianfathered the father’s education levelmothered the mother’s education levelwealth Wealth as determined by a wealth indexlooinside the family home has a toilet inside the homeelectric the family home has electricity in the home