assessment of a rapid approach for estimating catchment areas for surface drainage lines lawrence...
TRANSCRIPT

Assessment of a Rapid Approach for Assessment of a Rapid Approach for Estimating Catchment Areas for Estimating Catchment Areas for
Surface Drainage LinesSurface Drainage Lines
Lawrence Stanislawski, Science Applications International Lawrence Stanislawski, Science Applications International Corporation (SAIC)Corporation (SAIC)Michael Finn, U.S. Geological SurveyMichael Finn, U.S. Geological SurveyE. Lynn Usery, U.S. Geological SurveyE. Lynn Usery, U.S. Geological SurveyMark Barnes, U.S. Geological SurveyMark Barnes, U.S. Geological Survey
ACSM-IPLSA-MSPS 2007, March 9-12, St. Louis, MO

Brief overview of the National Hydrography Dataset Brief overview of the National Hydrography Dataset (NHD)(NHD)
Generalization Process for NHDGeneralization Process for NHD• Pruning of Drainage NetworkPruning of Drainage Network• Preprocessing RequirementsPreprocessing Requirements
MethodsMethods• Thiessen-polygon-derived (TPD) catchmentsThiessen-polygon-derived (TPD) catchments• Elevation-derived (ED) catchmentsElevation-derived (ED) catchments• Catchment comparisonsCatchment comparisons
ResultsResults• Between subbasin comparisonsBetween subbasin comparisons• Within subbasin comparisonsWithin subbasin comparisons• Extended resultsExtended results
SummarySummary
ACSM-IPLSA-MSPS 2007, March 9-12, St. Louis, MO

Conceptual Generalization Conceptual Generalization FrameworkFrameworkEnrichment (NHD)
Stratification Catchments
Upstream DensityDrainage Area Partitions
LowHigh
Feature Class Generalization
• Pruning (Radical Law)
• Simplification and other generalization operations
• Symbolization
Database
Validation
• Generalization metrics
• Benchmark comparisons
Products
• Level of detail
• Graphic product
Summary report
Users

NHD FeaturesNHD Features
Areal Stream/River
Areal Lake/Pond
Areal Lake/Pond
Linear Streams
Linear Canal/Ditch
Linear Connector
Artificial Paths
ACSM-IPLSA-MSPS 2007, March 9-12, St. Louis, MO

NHD FeaturesNHD Features
ACSM-IPLSA-MSPS 2007, March 9-12, St. Louis, MO

NHD FeaturesNHD FeaturesExample surface water flow network (NHDFlowline feature class)
ACSM-IPLSA-MSPS 2007, March 9-12, St. Louis, MO

National Hydrography Dataset (NHD)National Hydrography Dataset (NHD)
• Vector data layer of The National Map representing surface waters of the United States.
• Includes a set of surface water reaches
Reach: significant segment of surface water having similar hydrologic characteristics, such as a stretch of river between two confluences, a lake, or a pond.
A unique address, called a reach code, is assigned to each reach, which enables linking of ancillary data to specific features and locations on the NHD.
Reach code from Lower Mississippi subbasin
08010100000413
region-subregion-accounting unit-subbasin-reach number
08010100000696
08010100000413
ACSM-IPLSA-MSPS 2007, March 9-12, St. Louis, MO

NHD Generalization StrategyNHD Generalization Strategy
Base data: highest resolution NHD that covers desired area.
Feature pruning – removal of features that are too small for desired output scale.• select a subset of network features• select a subset of area features• remove point features associated with pruned line or area features
Feature simplification• removal of vertices• aggregation, amalgamation, merging, linearization of area features,
etc.
ACSM-IPLSA-MSPS 2007, March 9-12, St. Louis, MO

NHD GeneralizationNHD Generalization
Catchment: The area associated with a segment of a drainage network is referred to as the segment’s catchment area, or just catchment. Surface runoff in the catchment flows into the associated network segment.
Catchments (cyan) associated with each network segment (red) of a hydrographic network.
The network pruning strategy of our NHD generalization process is based on upstream drainage area, which requires catchment area estimates for each network segment.
ACSM-IPLSA-MSPS 2007, March 9-12, St. Louis, MO

NHD GeneralizationNHD Generalization
Upstream drainage area (UDA) for any network segment is the sum of all upstream catchment areas, including the segment of interest.
For instance, the UDA for the network segment marked with the green square is the yellow shaded area (~ 11.2 sq km).
ACSM-IPLSA-MSPS 2007, March 9-12, St. Louis, MO

Generalization: Network Pruning Generalization: Network Pruning ExampleExample
Gasconade-Osage subregion (1029) falls in the Interior Plains and Interior Highlands physiographic divisions.
ACSM-IPLSA-MSPS 2007, March 9-12, St. Louis, MO

Generalization: Network Pruning ExampleGeneralization: Network Pruning Example
Feature pruning – removal of feature that are too small for desired output scale.• select a subset of network features
Pruning test on Gasconade-Osage subregion (1029)Pruning test on Gasconade-Osage subregion (1029)Green, blue, red: 1:100,000Green, blue, red: 1:100,000 Blue, red: 1:500,000 Blue, red: 1:500,000Red: 1:2,000,000Red: 1:2,000,000
ACSM-IPLSA-MSPS 2007, March 9-12, St. Louis, MO

NHD GeneralizationNHD Generalization
Preprocessing requirements for network pruning:• Catchment area estimates• Upstream drainage area estimates
Values not available for high resolution NHD Layer
Therefore, we developed a rapid approach to estimate catchment areas using Thiessen polygons.
ACSM-IPLSA-MSPS 2007, March 9-12, St. Louis, MO
MethodsMethodsThiessen-polygon-derived (TPD) catchmentsThiessen-polygon-derived (TPD) catchments
ACSM-IPLSA-MSPS 2007, March 9-12, St. Louis, MO
###########
####
##
###
##
##
##
####
##
##
##
##
###
##
##
##
##
##
####
####
##
#
###### # #
##### # #
########
########
##
##
########
##
##
#######
########
##
#####
##
#####
##
###
##
##
##
#
# # # #########
MethodsMethodsComparison to elevation-derived (ED) catchmentsComparison to elevation-derived (ED) catchments
ACSM-IPLSA-MSPS 2007, March 9-12, St. Louis, MO
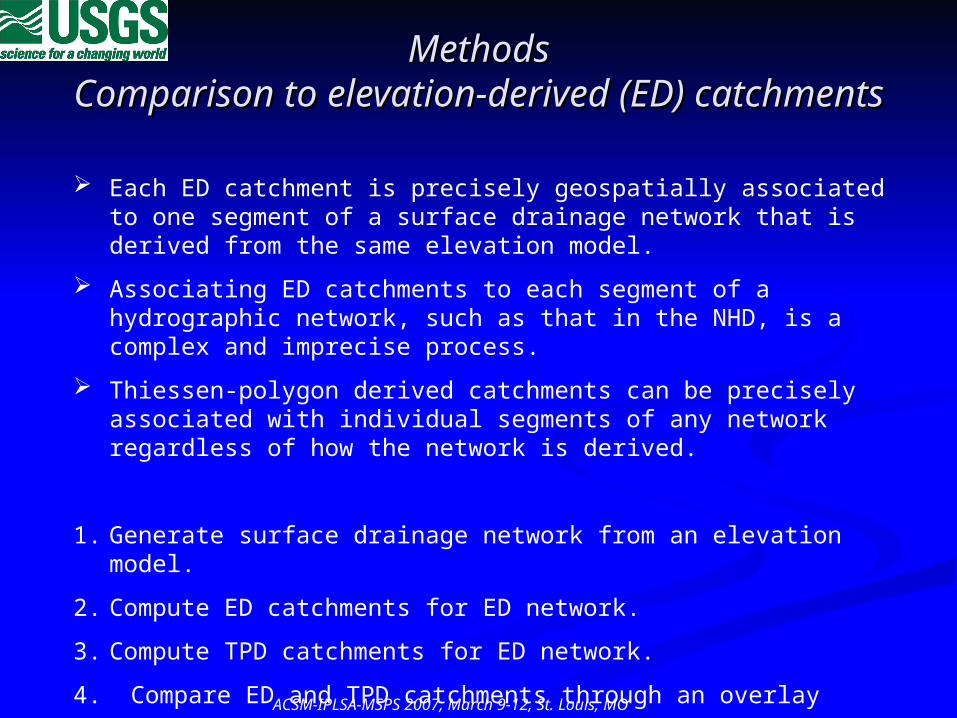
Each ED catchment is precisely geospatially associated to one segment of a surface drainage network that is derived from the same elevation model.
Associating ED catchments to each segment of a hydrographic network, such as that in the NHD, is a complex and imprecise process.
Thiessen-polygon derived catchments can be precisely associated with individual segments of any network regardless of how the network is derived.
1. Generate surface drainage network from an elevation model.
2. Compute ED catchments for ED network.
3. Compute TPD catchments for ED network.
4. Compare ED and TPD catchments through an overlay process.

MethodsMethods
ACSM-IPLSA-MSPS 2007, March 9-12, St. Louis, MO
Study subbasins
Subbasin name State
NHD subbasin number Regime
Physiographic division1
Upper Suwannee
FL, GA 03110201 Flat Humid
Atlantic Plain of Coastal Plain
Lower Beaver UT 16030008 Flat Dry
Intermontane Plateaus of Basin and Range
Pomme De Terre MO 10290107 Hilly Humid
Interior Highlands of Ozark Plateaus
Lower Prairie Dog Town Fork Red TX 11120105 Hilly Dry
Interior Plains of Great Plains and Central Lowland
South Branch Potomac WV 02070001
Mountainous Humid
Appalachian Highlands of Valley and Ridge
Piceance-Yellow CO 14050006
Mountainous Dry
Intermontane Plateaus of Colorado Plateaus
Six NHD subbasins that fall in one of six regimes based on climate and
topography were evaluated.
For each subbasin: A 30-meter resolution DEM was
extracted from the National Elevation Dataset.
ED Streams and catchments were derived for several (7) stream formation thresholds.
TPD catchments were generated for all ED network segments
ED catchments and TPD catchments were compared through a spatial union.

MethodsMethods
ACSM-IPLSA-MSPS 2007, March 9-12, St. Louis, MO
Catchment comparison computations:
For each TPD catchment in all networks:• percent correct, • percent omission, and • percent commission
For all TPD catchments in each stream-formation threshold:
• Mean percent correct• Mean percent omission, and• Mean percent commission• Total percent correct
For all stream-formation thresholds in each subbasin:
• Average mean percent correct• Average mean percent omission, and• Average mean percent commission• Average total percent correct
Thiessen-derived catchment (red outline) overlaying associated elevation-derived catchment (gray outline) with correct area in green, and areas of commission error in purple and omission error in pink .

MethodsMethods
ACSM-IPLSA-MSPS 2007, March 9-12, St. Louis, MO
Computations:
Coefficient of areal correspondence (CAC) is computed for any two associated areas as the area of intersection, divided by the area of union. In the figure, CAC is the computed as the green area divided by the sum of all colored (pink, purple, and green) areas.
CAC was computed for all catchments of each subbasin and stream-formation threshold, and summarized in the same manner as percent correct values.
Thiessen-derived catchment (red outline) overlaying associated elevation-derived catchment (gray outline) with correct area in green, and areas of commission error in purple and omission error in pink .

ResultsResults
ACSM-IPLSA-MSPS 2007, March 9-12, St. Louis, MO
Number of catchments computed ranged from 957 to 24,603, with catchment density increasing with decreasing stream-formation threshold.
Processing (Pentium 4 CPU, 3.0 GHz, 1 GB RAM)Speed
ED catchments: ~ 10 minutes to 2 hours. TPD catchments: 2 to 14 minutes (5 to 10 times faster)
Reliability ED process failed for some of the more dense network
computations. TPD process never failed.
Applicability ED catchments: requires an integrated DEM and ED
network. TPD catchments: can be applied to any network.

ResultsResults
ACSM-IPLSA-MSPS 2007, March 9-12, St. Louis, MO
0.0
10.0
20.0
30.0
40.0
50.0
60.0
70.0
80.0
Flat Humid Flat Dry Hilly Humid Hilly Dry Mountainous Humid Mountainous Dry
Average Total Percent Correct
Average Mean Percent CorrectAverage Mean Percent Commission Error
Average Mean Percent Omission Error
Between subbasin comparisons:
Averages of mean percent correct values range from about 50 to 65, with averages better than 60 on hilly and mountainous subbasins.
Average total percent correct values
•range from about 58 to 75.
•greater than average mean percent correct for all subbasins.
Average mean omission errors are about 7 percent larger that average mean commission errors.

ResultsResults
ACSM-IPLSA-MSPS 2007, March 9-12, St. Louis, MO
0
20
40
60
80
100
120
0 500000 1000000 1500000 2000000 2500000
Catchment Area (sq m)
Per
cen
t C
orre
ct
Distribution of percent correct values for all catchments from the 100-cell stream-formation threshold for the mountainous humid subbasin (WV). Mode of distribution is 71.
Distribution of percent correct values compared to catchment size for the 100-cell stream-formation threshold in the mountainous humid subbasin (WV).

ResultsResults
ACSM-IPLSA-MSPS 2007, March 9-12, St. Louis, MO
0
20
40
60
80
100
120
0 500000 1000000 1500000 2000000 2500000
Catchment Area (sq m)
Per
cent
Cor
rect
Distribution of percent correct values compared to catchment size for the 100-cell stream-formation threshold in the mountainous humid subbasin (WV).
0
20
40
60
80
100
120
0 1000 2000 3000 4000 5000 6000
Segment length (m)
Per
cent
Cor
rect
Distribution of percent correct values compared to network segment length for the 100-cell stream-formation threshold in the mountainous humid subbasin (WV).

ResultsResults
ACSM-IPLSA-MSPS 2007, March 9-12, St. Louis, MO
0.000
0.100
0.200
0.300
0.400
0.500
0.600
Flat Humid Flat Dry Hilly Humid Hilly Dry MountainousHumid
Mountainous Dry
Co
eff
icie
nt
of
Are
al C
orr
esp
on
den
ce
Between subbasin comparisons:
Average mean coefficient of areal correspondence (CAC) ranges from 0.34 to 0.51, with better correspondence in the hilly and mountainous subbasins.
CAC = Co / (Co+Om+Cm) and Co + Om = 1
Flat subbasins: ~ 0.5 / (1 + 0.93(0.5)) = 0.34
Hilly and Mountainous subbasins: ~ 0.67 / (1 + 0.93(0.33)) = 0.51

ResultsResultsWithin subbasin comparisonsWithin subbasin comparisons
y = -0.012x + 0.5559
R2 = 0.6398
0.000
0.100
0.200
0.300
0.400
0.500
0.600
0.765 0.912 1.228 1.395 1.673 2.233 2.947
Drainage Density (km/sq km)
Co
effi
cien
t o
f A
real
Co
rres
po
nd
ence
y = -0.0075x + 0.5364
R2 = 0.7053
0.430
0.440
0.450
0.460
0.470
0.480
0.490
0.500
0.510
0.520
0.530
0.540
0.712 0.861 1.189 1.364 1.660 2.311 3.232
Drainage Density (km/sq km)
Coe
ffici
ent o
f Are
al C
orre
spon
denc
e
y = 0.0014x + 0.3341
R2 = 0.5311
0.326
0.328
0.330
0.332
0.334
0.336
0.338
0.340
0.342
0.344
0.346
0.348
0.838 1.042 1.498 1.736 2.153 3.148 4.540
Drainage Density (km/sq km)
Coe
ffici
ent o
f Are
al C
orre
spon
denc
e
ACSM-IPLSA-MSPS 2007, March 9-12, St. Louis, MO
Humid: Mountainous (WV) Hilly (MO) Flat (FL,GA)
Dry: Mountainous (CO) Hilly (TX) Flat (UT)
y = -0.0099x + 0.5053
R2 = 0.8358
0.400
0.410
0.420
0.430
0.440
0.450
0.460
0.470
0.480
0.490
0.500
0.510
0.748 0.901 1.230 1.401 1.683 2.323
Drainage Density (km/sq km)C
oeffi
cien
t of A
real
Cor
resp
onde
nce
y = -0.0042x + 0.5044
R2 = 0.4456
0.440
0.450
0.460
0.470
0.480
0.490
0.500
0.510
0.736 0.899 1.240 1.411 1.689 2.270
Drainage Density (km/sq km)
Coe
ffici
ent o
f Are
al C
orre
spon
denc
e
y = -0.0078x + 0.3813
R2 = 0.969
0.320
0.330
0.340
0.350
0.360
0.370
0.380
0.669 0.838 1.286 1.549 1.983
Drainage Density (km/sq km)
Coe
ffici
ent o
f Are
al C
orre
spon
denc
e

ResultsResults
ACSM-IPLSA-MSPS 2007, March 9-12, St. Louis, MO
Within subbasin comparisons:
Catchments were separated into headwater (light green) and non-headwater catchments (light blue) based on whether or not they contained a dangling node (cyan) of a stream line.
Mean percentages were recomputed for headwater and non-headwater catchments.

ResultsResults
ACSM-IPLSA-MSPS 2007, March 9-12, St. Louis, MO
0.0
0.1
0.2
0.3
0.4
0.5
0.6
Flat Humid Flat Dry Hilly Humid Hilly Dry Mountainous Humid Mountainous Dry
CA
C
Headwater Average Mean CAC
Average Mean CAC
Non-Headwater Average Mean CAC
Headwater average, average, and non-headwater average of the mean coefficient of areal correspondence (CAC) for each formation threshold is shown for each subbasin.

Results: Pruning TestsResults: Pruning Tests
ACSM-IPLSA-MSPS 2007, March 9-12, St. Louis, MO
200-cell stream-formation threshold network (green, pink, blue) for hilly dry subbasin (TX).
Pruned networks using UDA values based on ED catchments
Pruned to 1:100,000-scale (pink, blue)
Pruned to 1:500,000-scale (blue)
200-cell stream-formation threshold network (green, purple, cyan) for hilly dry subbasin (TX).
Pruned networks using UDA values based on TPD catchments
Pruned to 1:100,000-scale (purple, cyan)
Pruned to 1:500,000-scale (cyan)

Results: Pruning TestsResults: Pruning TestsPrune to 0.925 km/sq km
(1:100,000-scale)
0
20
40
60
80
100
Flat Humid Flat Dry Hilly Humid Hilly Dry MountainousHumid
Mountainous Dry
Pe
rce
nt
Percent CorrectPercent OmissionPercent Commission
ACSM-IPLSA-MSPS 2007, March 9-12, St. Louis, MO
Prune to 0.150 km/sq km(1:500,000-scale)
0
20
40
60
80
100
Flat Humid Flat Dry Hilly Humid Hilly Dry MountainousHumid
Mountainous Dry
Perc
en
t
Percent CorrectPercent OmissionPercent Commission

Results: Pruning TestsResults: Pruning TestsPrune to 0.925 km/sq km (1:100,000-scale)
0.50
0.60
0.70
0.80
0.90
1.00
Flat Humid Flat Dry Hilly Humid Hilly Dry MountainousHumid
MountainousDry
Co
effi
cien
t o
f L
inea
r C
orr
esp
on
den
ce
ACSM-IPLSA-MSPS 2007, March 9-12, St. Louis, MO
Prune to 0.150 km/sq km (1:500,000-scale)
0.50
0.60
0.70
0.80
0.90
1.00
Flat Humid Flat Dry Hilly Humid Hilly Dry MountainousHumid
MountainousDry
Co
effi
cien
t o
f L
inea
r C
orr
esp
on
den
ce

SummarySummaryResults suggest that the TPD catchment process is: Less likely to fail because of hardware or software limitations than ED
process, About 5 to 10 times faster than the ED catchment process, Logistically much simpler to implement than ED process which
requires a network integrated to an elevation model.And that the: Fractional part that TPD catchments overlay ED catchments is about
½ for subbasins in flat terrain and about 2/3 for subbasins in hilly or mountainous terrain.
Headwater TPD catchments exhibit better areal correspondence (up to 17 percent) with ED catchments than do non-headwater catchments.
The lowest areal correspondence of TPD catchments to ED catchments occurs on relatively small catchments or on very short network segments.
Better than 80 percent linear correspondence can be expected between networks pruned to 1:100,000-scale or smaller using UDA based on TPD catchments and UDA based on ED catchments.
ACSM-IPLSA-MSPS 2007, March 9-12, St. Louis, MO

Questions?Questions?
Assessment of a Rapid Approach for Estimating Assessment of a Rapid Approach for Estimating Catchment Areas for Surface Drainage LinesCatchment Areas for Surface Drainage Lines
Lawrence Stanislawski, Science Applications International Lawrence Stanislawski, Science Applications International Corporation (SAIC)Corporation (SAIC)Michael Finn, U.S. Geological SurveyMichael Finn, U.S. Geological SurveyE. Lynn Usery, U.S. Geological SurveyE. Lynn Usery, U.S. Geological SurveyMark Barnes, U.S. Geological SurveyMark Barnes, U.S. Geological Survey
ACSM-IPLSA-MSPS 2007, March 9-12, St. Louis, MO