assessment of chsst maglev for u.s. urban transportation · report number fta-md-26-7029-2002.1 2....
TRANSCRIPT
U. S. Departmentof Transportation
Federal TransitAdministration
Assessment of CHSST Maglevfor U.S. Urban Transportation
July 2002Final Report
Report Number FTA-MD-26-7029-2002.1

NOTICE
This document is disseminated under the sponsorship ofthe U.S. Department of Transportation in the interest ofinformation exchange. The United States Governmentassumes no liability for its contents or use thereof.
The United States Government does not endorseproducts of manufacturers. Trade or manufacturer’snames appear herein solely because they are consideredessential to the objective of this report.

Assessment of CHSST Maglevfor U.S. Urban Transportation
July 2002
Prepared by:
Federal Transit Administration TeamLed by: Foster-Miller, Inc.
350 Second AvenueWaltham, MA 02451
Prepared for:
Federal Transit Administration400 7th Street, SWWashington, DC 20590


v
REPORT DOCUMENTATION PAGE Form ApprovedOMB No. 0704-0188
Public reporting burden for this collection of information is estimated to average 1 hour per response, including the time for reviewing instructions, searching existing data sources, gathering and maintaining the data needed,and completing and reviewing the collection of information. Send comments regarding this burden estimate or any other aspect of this collection of information, including suggestions for reducing this burden, to WashingtonHeadquarters Services, Directorate for Information Operations and Reports, 1215 Jefferson Davis Highway, Suite 1204, Arlington, VA 22202-4302, and to the Office of Management and Budget, Paperwork ReductionProject (0704-0188), Washington, DC 20503.
1. AGENCY USE ONLY (Leave blank)
Report Number FTA-MD-26-7029-2002.12. REPORT DATE
July 20023. REPORT TYPE AND DATES COVERED
Final Report
4. TITLE AND SUBTITLE
Assessment of CHSST Maglev for U.S. Urban Transportation5. FUNDING NUMBERS
4400052215
6. AUTHOR(S)
G. Samavedam1, S. Kokkins1, F. Raposa2, M. Thompson3, G. Anagnostopoulos4
7. PERFORMING ORGANIZATION NAME(S) AND ADDRESS(ES)
FTA Team: 1Foster-Miller, Inc., Waltham, MA 2Raposa Consulting, Cape Cod, MA 3Thompson Consulting, Harvard, MA 4Volpe Center, Cambridge, MA
8. PERFORMING ORGANIZATION REPORT NUMBER
DSAI.020226
9. SPONSORING/MONITORING AGENCY NAME(S) AND ADDRESS(ES)
U.S. Department of Transportation , Federal Transit Administration,Office of Technology, 400 Seventh Street, SW, Washington, DC 20590
10. SPONSORING/MONITORING AGENCY REPORT NUMBER
11. SUPPLEMENTARY NOTES
COTR: Venkat Pindiprolu, FTA
12a. DISTRIBUTION/AVAILABILITY STATEMENT
Limited Distribution12b. DISTRIBUTION CODE
N/A
13. ABSTRACT (Maximum 200 words)
This report provides an assessment of the Urban Maglev system proposed by the Maglev Urban Systems Associates MUSA team forapplication in the United States. The proposed system is the Japanese Chubu HSST Maglev which uses electromagnetic suspensionprinciples based on the attractive forces between the vehicle mounted electromagnets and the iron rail on the guideway for levitation.For propulsion, the system uses a vehicle mounted linear induction motor and a reactive aluminum plate on the guideway.
On the basis of the recent visit to Japan and the technical reports from MUSA and CHSST, the Federal Transit Administration (FTA)team evaluated:1. The system performance and safety characteristics of the guideway, vehicle, levitation, propulsion, braking, and automated train
operation,2. Environmental aspects, and3. System costs.
The evaluations focused on the FTA System and the U.S. mandatory requirements. This report identifies the requirements notsatisfied in the current CHSST design and operation. Specific recommendations are made for improvements in the CHSST system tomake it more suitable for U.S. deployment.
14. SUBJECT TERMS
Maglev, Magnetic Levitation, Propulsion, Low-Speed, Urban, CHSST15. NUMBER OF PAGES
11816. PRICE CODE
N/A17. SECURITY CLASSIFICATION OF REPORT
Unclassified
18. SECURITY CLASSIFICATION OF THIS PAGE
Unclassified
19. SECURITY CLASSIFICATION OF ABSTRACT
Unclassified
20. LIMITATION OF ABSTRACT
NSN 7540-01-280-5500 Standard Form 298 (Rev. 2-89)Prescribed by ANSI Std. 239-18

vi

vii
Acknowledgements
This work was performed under the overall technical and program direction of Mr.Venkat Pindiprolu, who is the Contracting Officer’s Technical Representative (COTR)from the Federal Transit Administration. The authors are grateful to him for his inputand rapid response to their questions and concerns during this project execution.
The funding for the work came from the FTA. Foster-Miller and FL Raposa Services aresubcontractors to SAIC. Special thanks are due to Messrs. David Keever and RogerHoopengardner, both from SAIC, for their help in the project management andcoordination of activities. Funding for Thompson Consulting is from the Volpe Centerand FTA.
The authors wish to thank Dr. John Harding of the Federal Railroad Administration forhis technical input during this project.
The authors are grateful to the Japanese HSST team, in particular Messrs. MasaakiFujino, Michio Takahashi and Junro Kato who put in hard work to respond to the FTAteam’s questions during the meetings in Japan. Special thanks are also due to Mr. RobertEvans and his MUSA team for their technical interaction and cooperation on the project.
Note: This report uses technical materials on CHSST Maglev. Readers who intend touse of reproduce the CHSST Maglev materials from this report must seek appropriatepermission from CHSST officials.
Contact: Mr. Michio TakahashiChubu HSST Development Corporation3-14 Kafuku-ChoMinami, Nagoya457-0837 Japan

viii
METRIC/ENGLISH CONVERSION FACTORSENGLISH TO METRIC METRIC TO ENGLISH
LENGTH (APPROXIMATE) LENGTH (APPROXIMATE)
1 inch (in) = 2.5 centimeters (cm) 1 millimeter (mm) = 0.04 inch (in)
1 foot (ft) = 30 centimeters (cm) 1 centimeter (cm) = 0.4 inch (in)
1 yard (yd) = 0.9 meter (m) 1 meter (m) = 3.3 feet (ft)
1 mile (mi) = 1.6 kilometers (km) 1 meter (m) = 1.1 yards (yd)
1 kilometer (km) = 0.6 mile (mi)
AREA (APPROXIMATE) AREA (APPROXIMATE)
1 square inch (sq in, in2) = 6.5 square centimeters (cm2) 1 square centimeter (cm2) = 0.16 square inch (sq in, in2)
1 square foot (sq ft, ft2) = 0.09 square meter (m2) 1 square meter (m2) = 1.2 square yards (sq yd, yd2)
1 square yard (sq yd, yd2) = 0.8 square meter (m2) 1 square kilometer (km2) = 0.4 square mile (sq mi, mi2)
1 square mile (sq mi, mi2) = 2.6 square kilometers (km2) 10,000 square meters (m2) = 1 hectare (ha) = 2.5 acres
1 acre = 0.4 hectare (he) = 4,000 square meters (m2)
MASS - WEIGHT (APPROXIMATE) MASS - WEIGHT (APPROXIMATE)
1 ounce (oz) = 28 grams (gm) 1 gram (gm) = 0.036 ounce (oz)
1 pound (lb) = 0.45 kilogram (kg) 1 kilogram (kg) = 2.2 pounds (lb)
1 short ton = 2,000 pounds(lb)
= 0.9 tonne (t) 1 tonne (t) =
=
1,000 kilograms (kg)
1.1 short tons
VOLUME (APPROXIMATE) VOLUME (APPROXIMATE)
1 teaspoon (tsp) = 5 milliliters (ml) 1 milliliter (ml) = 0.03 fluid ounce (fl oz)
1 tablespoon (tbsp) = 15 milliliters (ml) 1 liter (l) = 2.1 pints (pt)
1 fluid ounce (fl oz) = 30 milliliters (ml) 1 liter (l) = 1.06 quarts (qt)
1 cup (c) = 0.24 liter (l) 1 liter (l) = 0.26 gallon (gal)
1 pint (pt) = 0.47 liter (l)
1 quart (qt) = 0.96 liter (l)
1 gallon (gal) = 3.8 liters (l)
1 cubic foot (cu ft, ft3) = 0.03 cubic meter (m3) 1 cubic meter (m3) = 36 cubic feet (cu ft, ft3)
1 cubic yard (cu yd, yd3) = 0.76 cubic meter (m3) 1 cubic meter (m3) = 1.3 cubic yards (cu yd, yd3)
TEMPERATURE (EXACT) TEMPERATURE (EXACT)
[(x-32)(5/9)] °F = y °C [(9/5) y + 32] °C = x °F
QUICK INCH - CENTIMETER LENGTH CONVERSION10 2 3 4 5
Inches
Centimeters 0 1 3 4 52 6 1110987 1312
QUICK FAHRENHEIT - CELSIUS TEMPERATURE CONVERSION -40° -22° -4° 14° 32° 50° 68° 86° 104° 122° 140° 158° 176° 194° 212°
°F
°C -40° -30° -20° -10° 0° 10° 20° 30° 40° 50° 60° 70° 80° 90° 100°
For more exact and or other conversion factors, see NIST Miscellaneous Publication 286, Units of Weightsand Measures. Price $2.50 SD Catalog No. C13 10286 Updated 6/17/98

ix
List of Acronyms
ADA Americans with Disabilities Act
ATC automatic train control
ATO automatic train operation
CHSST Japanese Urban Maglev system
DC direct current
EDS electrodynamic suspension
EMS electromagnetic suspension
FTA Federal Transit Administration
EIS Environmental Impact Statement
LIM linear induction motors
LRT Light Rail Transit
LSM linear synchronous motors
NEMA National Electrical Manufacturers Association
NFPA National Fire Protection Association
O/M operations and maintenance
UTM Urban Transit Maglev

x

xi
Table of Contents
Executive Summary ..................................................................................... ES-11 Introduction .............................................................................................. 1-1
1.1 Objectives of Report.........................................................................................1-21.2 Report Organization .........................................................................................1-2
2 Background of CHSST Maglev System.................................................. 2-12.1 Guideway .........................................................................................................2-12.2 Vehicle .............................................................................................................2-2
2.2.1 Developmental Background ......................................................................2-32.2.2 Potential Deployment in Japan..................................................................2-42.2.3 Potential for U.S. Application ...................................................................2-6
3 Guideway System .................................................................................... 3-13.1 Construction Features .......................................................................................3-13.2 Design Basis.....................................................................................................3-43.3 Operational Experience.....................................................................................3-53.4 Performance Characteristics .............................................................................3-73.5 Switching .......................................................................................................3-123.6 Foundation and Supporting Pylons .................................................................3-153.7 U.S. Mandatory and FTA System Requirements.............................................3-15
3.7.1 Structural Aspects ...................................................................................3-153.7.2 Guideway Curves....................................................................................3-16
3.8 Evaluation and Issues .....................................................................................3-174 Vehicle Design and System Capacity..................................................... 4-1
4.1 Construction Features .......................................................................................4-14.2 Structural Design Basis.....................................................................................4-14.3 Operational Experiences ...................................................................................4-34.4 Train Capacity ..................................................................................................4-4
4.4.1 CHSST System Parameters. ......................................................................4-44.4.2 Capacity Example for Urban System.........................................................4-54.4.3 Effect of Maximum Speed on Trip Time...................................................4-54.4.4 Impact on Station Size ..............................................................................4-84.4.5 Summary of Capacity Issues for CHSST...................................................4-8
4.5 Curving Capability ...........................................................................................4-94.6 Passenger Egress and Safety .............................................................................4-94.7 Vehicle Crashworthiness ................................................................................4-104.8 Dynamics and Ride Quality ............................................................................4-104.9 Vehicle Manufacturing ...................................................................................4-114.10 U.S. Mandatory and FTA System Requirements .........................................4-11
4.10.1 U.S. Mandatory Requirements ................................................................4-114.10.2 The FTA System Requirements ..............................................................4-12
4.11 Vehicle Issues and Evaluation.....................................................................4-135 Levitation and Guidance ......................................................................... 5-1
5.1 System Features................................................................................................5-15.2 Design Basis and Specifications .......................................................................5-2
5.2.1 Vertical control .........................................................................................5-35.2.2 Lateral control ..........................................................................................5-3

xii
5.2.3 Backup power...........................................................................................5-35.3 Levitation Characteristics .................................................................................5-4
5.3.1 Levitation power vs. speed........................................................................5-45.3.2 Levitation power vs. Airgap......................................................................5-4
5.4 U.S. Mandatory and FTA System Requirements...............................................5-65.5 Evaluation and Issues .......................................................................................5-6
5.5.1 Overall Impressions ..................................................................................5-65.5.2 Overall advantages of EMS.......................................................................5-65.5.3 Vertical Control System............................................................................5-75.5.4 Small Levitation Gap of EMS ...................................................................5-75.5.5 Lateral Guidance.......................................................................................5-75.5.6 Motor-levitation Module Geometry Interactions .......................................5-75.5.7 Maximum Speed.......................................................................................5-8
6 Propulsion System And Power............................................................... 6-16.1 Operational Experience.....................................................................................6-16.2 Design Basis.....................................................................................................6-1
6.2.1 System Level Requirements......................................................................6-16.2.2 Vehicle Requirements ...............................................................................6-26.2.3 Drag Resistance Requirements..................................................................6-2
6.3 Propulsion Requirements and Characteristics....................................................6-66.3.1 System Configuration ...............................................................................6-66.3.2 LIM Design Requirements ........................................................................6-66.3.3 Performance Capability and Operating Characteristics..............................6-76.3.4 LIM Power Characteristics........................................................................6-8
6.4 Power Supply and Collection............................................................................6-96.4.1 Configuration............................................................................................6-9
6.5 U.S. Mandatory and FTA System Requirements.............................................6-106.6 Evaluation and Issues .....................................................................................6-11
6.6.1 Overall Observations and Impressions ....................................................6-116.6.2 Linear Induction Motor Operating Characteristics...................................6-126.6.3 Grade Climbing Capability .....................................................................6-13
7 Braking System........................................................................................ 7-17.1 Braking Modes .................................................................................................7-17.2 Design Basis.....................................................................................................7-1
7.2.1 System Level Requirements......................................................................7-17.2.2 Deceleration Rate Performance Characteristics .........................................7-27.2.3 Electric Braking Requirements and Characteristics ...................................7-37.2.4 Mechanical Brake Requirements and Characteristics ................................7-5
7.3 Operational Experience.....................................................................................7-57.4 U.S. Mandatory Requirements and FTA System Requirements.........................7-67.5 Evaluation and Issues .......................................................................................7-8
8 Automatic Train Operation...................................................................... 8-18.1 System Architecture .........................................................................................8-18.2 Automatic Train Protection...............................................................................8-38.3 Speed Detection................................................................................................8-48.4 Automatic Train Control...................................................................................8-58.5 Evaluation and Issues .......................................................................................8-6

xiii
9 Environmental Impact.............................................................................. 9-19.1 Noise ................................................................................................................9-1
9.1.1 Background ..............................................................................................9-19.1.2 FTA Requirements....................................................................................9-19.1.3 CHSST Noise Measurements ....................................................................9-29.1.4 Comparison with Other Systems ...............................................................9-29.1.5 Higher Speeds...........................................................................................9-3
9.2 Electric Fields...................................................................................................9-39.3 Magnetic Fields ................................................................................................9-39.4 U.S. Mandatory and FTA System Requirements...............................................9-49.5 Evaluation and Issues .......................................................................................9-5
10 Performance and Safety Tests.............................................................. 10-110.1 Additional Performance Tests .....................................................................10-210.2 Additional Safety Tests...............................................................................10-3
11 System Costs ......................................................................................... 11-111.1 Introduction ................................................................................................11-111.2 System Level Construction Cost Breakdown ..............................................11-211.3 Guideway Cost Breakdown.........................................................................11-311.4 Vehicle Cost Breakdown ............................................................................11-411.5 Power Supply Cost Breakdown...................................................................11-511.6 Automatic Train Operation/Protection, Signal and Communication CostBreakdown.............................................................................................................11-511.7 Station Costs...............................................................................................11-511.8 Cost Comparison with Light Rail................................................................11-5
11.8.1 Comparison For Japanese Systems..........................................................11-611.8.2 Need for Comparison For US Conditions................................................11-6
11.9 System Level Operating Cost Breakdown...................................................11-711.9.1 Revenue and Operating Costs .................................................................11-7
11.10 Evaluation and Comparison with FTA Cost Goals ......................................11-811.10.1 Capital and Construction Costs ...........................................................11-811.10.2 Operating Costs ..................................................................................11-9
12 Conclusions and Recommendations ................................................... 12-112.1 Conclusions ................................................................................................12-1
12.1.1 System Level ..........................................................................................12-112.1.2 System Costs ..........................................................................................12-212.1.3 Guideway Structure ................................................................................12-212.1.4 Vehicle Structure ....................................................................................12-312.1.5 Vehicle Levitation...................................................................................12-412.1.6 Vehicle Propulsion and Braking..............................................................12-412.1.7 Automatic Train Control .........................................................................12-4
12.2 Recommendations ......................................................................................12-512.2.1 Near Term (0-1 year) ..............................................................................12-512.2.2 Intermediate Term (1-2 years).................................................................12-612.2.3 Long Term ( >2 years) ............................................................................12-7
13 References.............................................................................................. 13-1

xiv
List of Tables
Table 3-1. Test and Experimentation Documentation for CHSST Guideway in 1993 Report [1] ...................................................................................................3-6
Table 3-2. Guideway Tolerance Table (Provided by CHSST/MUSA)........................3-10Table 4-1. Vehicle Specifications ................................................................................4-1Table 4-2. System Passenger Capacity vs. Train Headway and No. of
Passengers/Train.........................................................................................4-5Table 5-1. Levitation System Selected Specifications...................................................5-2Table 6-1. Selected Propulsion Related Operational Characteristics.............................6-1Table 6-2. Selected Vehicle Characteristics .................................................................6-2Table 6-3. Selected Thrust Force Requirements for the 100-L Three-Vehicle Train.....6-6Table 6-4. FTA System Requirements for Propulsion Sensitive Parameters...............6-11Table 6-5. Grade Climbing Capability for the CHSST 100-L Three-Car Train*.........6-14Table 7-1. Selected Braking Requirements ...................................................................7-2Table 7-2. FTA System Requirements for the Braking System ....................................7-7Table 7-3. FTA and CHSST Comparative Braking Distances .......................................7-7Table 11-1. Percentage of CHSST Construction and Deployment Costs* ..................11-2Table 11-2. Possible Breakdown of “Basic” Guideway Costs ....................................11-4Table 11-3. Projected Tobukyu Line Revenue Breakdown ........................................11-7Table 11-4. Running Cost Breakdown for Tobukyu Line...........................................11-7

xv
List of Figures
Figure 2-1. CHSST Maglev Rail and Module Cross-Section .......................................2-1Figure 2-2. CHSST Maglev Elevated Guideway (Walkway Version) ..........................2-2Figure 2-3. CHSST Maglev Vehicles at Test Track, Nagoya, Japan.............................2-3Figure 2-4. HSST Development History......................................................................2-4Figure 2-5. Detailed Layout of Tobukyu HSST Line, Aichi Expo 2005 .......................2-5Figure 2-6. Planned Tobukyu CHSST Line Construction Cost Allocation ...................2-6Figure 3-1. Cross Section of Standard CHSST Single Guideway.................................3-1Figure 3-2. Overall View of Guideway at Test Track ..................................................3-2Figure 3-3. Guideway Rail and Sleeper Supports.........................................................3-2Figure 3-4. Guideway Cross Sections for Tunnel and Elevated Sections......................3-3Figure 3-5. Sleeper Spacing for Guideway Rails..........................................................3-3Figure 3-6. Side of HSST Guideway--Levitation Rail Above & Trolley Rail on Side ..3-4Figure 3-7. Test Track Guideway Section with Horizontal and Vertical Curves...........3-6Figure 3-8. Vehicle Pylon Passing Frequency (vs. Fundamental Guideway Beam
Bending Frequency) ..................................................................................3-8Figure 3-9. Relationship of Beam Bending Frequency vs. Vehicle Passing Frequency.3-8Figure 3-10a. Allowable Guideway Tolerances (Provided by CHSST/MUSA)..........3-10Figure 3-11. 25 m Radius Curved Guideway Leading Into Switch.............................3-13Figure 3-12. CHSST Segmented Switch Operation at Test Track ..............................3-13Figure 3-13. Switch Moved from Through to Turnout Direction................................3-14Figure 3-14. Vertical Curve at CHSST Test Track......................................................3-16Figure 4-1. Proposed Tobukyu 3-Car Train Layout .....................................................4-2Figure 4-2. Station-to-Station Distances Needed to Utilize Higher Top Speeds............4-6Figure 4-3. Trip Time for 2 km Station Spacing ..........................................................4-7Figure 4-4. Trip Time for 10 km Station Spacing ........................................................4-8Figure 5-1. Simplified EMS Suspension with U-shaped Guideway [8] .........................5-1Figure 5-2. Detail of Levitation and Guidance Forces with Lateral Deflection.............5-2Figure 5-3. Levitation Power vs. Speed (Extrapolated Above 100 kph) .......................5-4Figure 5-4. Effects of Operating Airgap on Power Dissipation .....................................5-5Figure 6-1. Drag and Power Characteristics of the CHSST 100-S................................6-4Figure 6-2. Drag and Power Characteristics of the CHSST 100-L................................6-5Figure 6-3. CHSST 100-L Maximum Thrust-Acceleration Capability ..........................6-7Figure 6-4. Maximum Capability Power Characteristics for 100-L Three-Car Train ....6-8Figure 6-5. CHSST 100-S LIM Power Characteristics.................................................6-9Figure 6-6. Maximum Thrust-Grade Climbing Capability for a 2% Grade.................6-13Figure 7-1. Braking Characteristics for the 100-L Three-Car Train..............................7-4Figure 8-1. Configuration of signal communication equipment....................................8-2Figure 8-2. ATP Braking Pattern .................................................................................8-4Figure 8-3. Speed Detection Pattern ............................................................................8-5Figure 9-1. Noise from Selected Rail and Maglev Systems...........................................9-2Figure 9-2. External Magnetic Field Strength for Selected Rail and Maglev Vehicles...9-4


ES-1
Executive Summary
The Federal Transit Administration (FTA) is examining the possibility of introducingmagnetically levitated slow speed vehicles (under 160 kph (100 mph)) for urban masstransportation in the United States. Maglev has several advantages over conventionaltransportation, such as existing automated guideway transits (AGT), Light Rail system,and bus. These include: reduced travel time, congestion mitigation, decreased pollution,reduced noise, increased ride comfort, better grade-climbing capability, improved energyefficiency, reduced maintenance, and possibly, competitive capital, operating and life cyclecost.
The FTA is evaluating a few candidate technologies for application in its Urban MaglevProgram. One of the technologies being considered is the Chubu High Speed SurfaceTransport (CHSST) developed in Japan and proposed by the Maglev Urban SystemAssociates (MUSA). The FTA formed a team of consultants, the FTA Technical Team, toassist in the technical and cost evaluation of the urban maglev projects, including theCHSST Maglev. The team consists of selected technical staff from Foster-Miller, Inc., FLRaposa Services, Thompson Consulting, Inc., and the US DOT/Volpe NationalTransportation Systems Center. The team visited the CHSST facility and held technicalmeetings with CHSST and funding agencies for Japanese urban applications. Based on theinformation gathered during this visit and technical reports submitted by MUSA, the FTAteam evaluated the CHSST as presented in this report. Emphasis is placed on how well theCHSST system satisfies the FTA system level performance, safety and cost requirements,and the U.S. mandatory requirements for public transportation systems.
The evaluation led to the following major conclusions:
• The CHSST system is a tested and demonstrated low-speed system that is beingreadied for commercial application. It is based on mature Electromagnetic Suspension(EMS) technology.
• The CHSST system is intended for operation at 100 kph on the Aichi Prefectureproposed route of approximately 9.5 km in Japan. The system can be run at 130 kphwith some upgrades. To reach speeds of 160 kph, a major redesign and development isrequired.
• The CHSST Maglev is expected to be within safe limits of magnetic and electrical fieldstrengths. Its noise level with its present permissible speed in Japan (100 kph) isreasonably low.
• The system can negotiate 7% gradients, although with significant speed degradation.
• The smaller 100-S vehicle can negotiate 25 m radius curves, but the larger 100-L needsat least a 50 m radius curve.
• The CHSST has zero-speed levitation capability and can stay levitated at the stations,but its levitation gap while running is on the order of 6 mm. All EMS systems areinherently unstable, requiring continuous servo-controlled stabilization of the gap.

ES-2
• According to the Japanese estimates, it can be cost competitive with Light Railsystems. Similar estimates for U.S. conditions have not yet been made.
• At the present speed limit of 100 kph, the system may find application in the UnitedStates. If the system is upgraded and tested at a speed of at least 130 kph, as discussedin this report, it can find application on more urban and suburban routes in the UnitedStates.

1-1
1 Introduction
The Federal Transit Administration (FTA) has been chartered to perform research andevaluation of Magnetically Levitated train technology (Maglev) for urban passengertransportation in the United States. This mode of transportation in some U.S. cities cancompete with conventional transportation modes (such as light rail, monorail, bus) undercertain circumstances. Maglev can bring several socioeconomic benefits which include:
• Ride comfort,• No pollution in congested cities,• Quiet operation,• Ability to transport a large number of people at a rapid rate, and• Shortened trip time with reliable schedules
This can result in improved business activity, increased job opportunities in urban areas,and less dependency on foreign oil.
Maglev technologies are being deployed in other countries, i.e., Japan, Korea and China.The U.S. needs to make a decision on Maglev transportation to reduce traffic congestionand pollution in cities, whose problems may not improve with the use of additionalconventional modes of transportation
The FTA has selected candidate Maglev technologies and concepts for evaluation andpossible application in the U.S. One of the selected technologies comes from MaglevUrban System Associates (MUSA). This a consortium of the following firms:
• Earth Tech, Inc.,• Chubu HSST Development Corporation,• Kimley-Horn Associates,• Chamberlain Engineering, Inc., and• Delon Hampton & Associates.
To date, MUSA submitted three technical reports to the FTA on their proposedtechnology which is based on the Japanese HSST Maglev system. The levitation for theHSST cars is produced using electromagnets on vehicles attracted to steel rails on theguideway. The propulsion force is obtained from a vehicle-borne linear induction motorwhich utilizes reaction force from aluminum plates attached to the steel rails on theguideway. The levitation gap is continuously monitored by gap sensors and is activelycontrolled via current supply to the electromagnets on the vehicles.
The FTA sent a delegation to Japan in March, 2002 to experience, understand, and assessthe HSST technology. The delegation consisted of the authors of this FTA report and theMUSA team. During the visit with HSST and other staff in Japan, technical reports andpapers were collected, including a major report [1] prepared by the Japanese AichiPrefecture local government in 1993 which provides extensive technical passengerdemand, and economic analysis of the system. Based on these and the three technicalreports [2,3,4] submitted by the MUSA team, the FTA team prepared this report with an

1-2
overall objective assessment of the CHSST (Chubu HSST) technology as proposed by theMUSA team.
1.1 Objectives of Report
The specific objectives of the technical report are:
1. Evaluate the CHSST Maglev system on the basis of information gathered during thevisit to the demonstration site at Nagoya, Japan, technical interaction with the HSSTstaff, HSST manufacturers, Japanese government organizations, and the three reportsby MUSA to the FTA. Specific components include the following:
• Guideway,• Vehicle levitation and guidance,• Propulsion and power,• Braking,• Automatic train operation,• System safety, and• Costs.
Assess the degree of maturity of the technology, availability of reliable technical dataand promise of the technology for U.S. Maglev applications.
2. Specify the FTA system requirements and the U.S. mandatory requirements whichare critical to the introduction of the HSST technology in the U.S. Summarize thosewhich are not satisfied in the current practice, or intended use of the HSSTtechnology elsewhere.
3. Identify areas of required improvements and design modifications to make thetechnology more suitable for the U. S. applications. Identify those areas of designmodifications which are reasonably straightforward in the short term, and those whichwill require development over a long term.
4. Evaluate the system level life cycle costs supplied be the MUSA/Japanese sources.Comment on the cost benefits, if any, over a comparable transportation mode basedon conventional technology.
1.2 Report Organization
The report is organized as follows. Chapter 2 is a brief background of the CHSSTsystem. The guideway system, including switches, evaluation and issues, is presented inChapter 3. The vehicles, including capacity, dynamics and ride quality, is presented inChapter 4. Chapters 5 and 6 deal with levitation and guidance, and propulsion and powerrespectively. The braking system and automatic train operation issues are explained inChapters 7 and 8. Environmental issues are presented in Chapter 9. An outline ofperformance and safety tests conducted by the HSST and additional tests required for theU.S. application are presented in Chapter 10. System cost evaluation is in Chapter 11,followed by Chapter 12 which presents conclusions and recommendations.

2-1
2 Background of CHSST Maglev System
The HSST Maglev system has been in development in Japan for over 25 years, and hasevolved through several progressively more practical forms. Fundamentally, the CHSSTMaglev utilizes electromagnetic attractive forces between simple dual-poleelectromagnets and a steel rail to provide both levitation and guidance. The simplifieddiagram is shown in Figure 2-1. The upper, or fixed rail, side is a simple steel (iron)section with two downward facing poles mounted on the guideway structure. The lower,upward facing magnet is mounted on the vehicle and is an electromagnet whose intensityis varied continuously by a gap sensor to maintain a constant magnetic gap ofapproximately 8 mm. This active control is required since otherwise the levitation isunstable. Lateral guidance is provided by the tendency of the electromagnets on themoving train to line up laterally with the poles of the steel guideway. Propulsion andbraking is provided by a separate linear induction motor (LIM) system, with the active(energized) side being vehicle-mounted above the same steel rail used for levitation andguidance. There is an additional aluminum plate fastened to the rail top to provide areaction rail for the LIM. Finally, there are mechanical brakes and landing skids providedon the vehicle which also act on the outer flange and top, respectively, of the basic steelrail section.
Figure 2-1. CHSST Maglev Rail and Module Cross-Section
2.1 Guideway
The baseline guideway in both the test track and in planned applications is elevated, andcomprises a simple box girder for each travel direction topped with transverse steelsleepers, which in turn support the maglev rails described above. The elevatedconfiguration (other than tunnel) is preferred for urban/suburban infrastructure

2-2
compatibility (Figure 2-2). Two-way elevated guideways comprise the two parallelguideway beams, supported on traditional cross-beams and pylons/footings, designed forlocal conditions and long-term stability. All services, such as power transmission, signal& communication, etc. are located on the guideway. Rights of way of existing majorstreets can thus be utilized.
Figure 2-2. CHSST Maglev Elevated Guideway (Walkway Version)
2.2 Vehicle
Pictures of two current test vehicle pairs are shown in Figure 2-3 (a) and (b). The Maglevtechnology for these two types is essentially identical, each using different numbers ofthe same basic levitation/propulsion “modules” (the longer 100-L vehicle uses five perside; the shorter 100-S vehicle uses three per side). The vehicles can remain levitatedwhen stopped, such as at a station. Performance can be generally summarized for thecurrent version as having a maximum operating speed of 100 kph, with acceleration anddeceleration service rates of 1.1 m/sec2. Grade climb/descent capability is in the 7 degreerange, with horizontal minimum curving radii at slow speeds of 25 m and 50 m for the“short” 8.5 m and “long” 14 m vehicles respectively. These CHSST test vehicles aretermed 100-S and 100-L models, and planned deployments would utilize these basicvehicles with updated exteriors, interiors, required equipment, etc. En route 100 m radiusturns are negotiated in the 40 kph speed range, with 8 degree cant and net lateral gin-vehicle under 0.1 g. Many other performance and electrical parameters are defined indetailed sections later.

2-3
100-L “long” vehicle (2-car consist) 100-S “short” vehicle (2-car consist)(a) (b)
Figure 2-3. CHSST Maglev Vehicles at Test Track, Nagoya, Japan
The vehicles operate in train-type consists of separate, coupled vehicles. For eachconfiguration, an “A” car (end unit) and “B” car (intermediate unit) are provided. Trainlength is set by capacity requirements, speed, headway, etc. Two car (A-A) consistsoperate now on the test track (both 100-L and 100-S vehicles). Manual control is nowused, although future versions are planned for automatic operation (ATO). There aresystems for speed monitoring, entry/exit from fixed blocks, train protection,communications, etc. which are similar to other transit and monorail systems in Japanand the U.S. System capacity for future applications is set by the familiar combinationsof car size, number of cars in consist, minimum safe headways, train control system,acceleration/deceleration/speed profiles, etc. A more detailed discussion of thesubsystems and their initial assessment for U.S. conditions are contained in the followingChapters.
2.2.1 Developmental Background
The HSST system was developed in several stages since approximately 1975. A chartdepicting this furnished by CHSST is shown in Figure 2-4. This also shows the operatingsites (Expositions and Test Tracks) and passengers carried, and distances covered. Thepassenger-carrying experience has primarily been carried out in the expositionenvironment over very short single tracks on the order of a few hundred meters to over1 km long. There, it served as a demonstrator and “people mover”. The experience gainedsince 1985 is more relevant since the use of elevated guideways started at that time. Thisis the principal implementation in urban-suburban environments (except for shortsections in tunnels for cities, for which the track support is straightforward).

2-4
Figure 2-4. HSST Development History
The successive vehicles and demonstration sites served to introduce more refinedelements of the Maglev vehicles and track, and the current form discussed above isessentially the same as that promoted for deployment applications such as the TobukyuLine described below. The 1.5 km single-line test track in Oe, a Nagoya suburb, has beenin operation for over 15 years developing experience for several vehicle, subsystem andguideway designs.
2.2.2 Potential Deployment in Japan
Reportedly, the technology will be utilized in a 9.2 km / 9-station two-way revenue linein Aichi Prefecture for an Exposition in 2005, which will be known as the “TobukyuLine”. The planned location of this new line will form a “spoke” in the eastern suburbs ofthe Nagoya area rail network. A layout of the planned line is shown in Figure 2-5,including projected station locations and use of street rights-of-way. It is also intended asa permanent mass transit line. Approximately 7.4 km will use elevated guideway, with1.8 km in a tunnel at the western end.

2-5
Figure 2-5. Detailed Layout of Tobukyu HSST Line, Aichi Expo 2005
An evaluation and verification/test program for that project was conducted in the 1990-93time frame leading to approval by Japanese authorities for construction, financing andrevenue operation for the public. A detailed report supporting this process [1] gives adescription of the evolution, testing, and economic analyses of the systems performedover that period.
Financing is anticipated to come from a combination of prefectural and nationalgovernments, plus a consortium of public and private companies participating in variouselements of the project construction or operation. Construction has not yet started,although it is planned for sometime in 2003. Currently, construction costs are estimatedat about 110 billion ¥ (880 million $) for guideway, stations, power facilities, etc. Theunit cost of the elevated section is estimated at 9.1 B¥/km (115 million $/km), with thetunnel section costing three times as much on a unit basis.
The general arrangement is that 40% of the cost will be borne by a combination of privateand public companies, and will be recouped in about 20 years. 60% of the cost will beprovided by the local, prefectural and national government. The 40% portion alsorepresents the “Maglev” part (active guideway portion, cars, switches, etc.), and the 60%represents the infrastructure (guideway supporting structures, site work, tunnels, etc.).This is diagrammed in Figure 2-6 from their brochure. Revenue is projected to be about2.8 B¥/yr—90% of which is operating cost and 10% to retire the 40% investment portionabove, as shown in Figure 2-4. Carriage of 11 million passengers/year is currentlyplanned for.

2-6
Figure 2-6. Planned Tobukyu CHSST Line Construction Cost Allocation
Several situations in Japan have reportedly slowed the deployment of this system,including the lingering recession, and the high cost of recovery from the destructive Kobeearthquake several years ago. The hope of the government, CHSST and its partners is thatthe project will go forward as scheduled. However, it is likely to be several years beforesignificant operating experience in the revenue/transportation link setting will beobtained, which may highlight both the advantages and problems of this system. Thelevel of technology is matured, which could be considered as lowering the risk ofdeployment.
2.2.3 Potential for U.S. Application
The CHSST system is a matured Maglev, reasonably ready for urban transportationapplications in the U.S. It does not satisfy certain FTA system and U.S. mandatoryrequirements as discussed in the following chapters. If deployed in the U.S. with somemodifications indicated in this report, it can provide a good starting point for the U.S. toevaluate the benefits of Maglev technology over conventional urban transportationsystems, such as light rail and bus. At this moment, however, it is unknown whether theCHSST technology will prove to be more cost effective than the conventional systems orhow well it will compete with other emerging Maglev technologies.

3-1
3 Guideway System
3.1 Construction Features
The arrangement of the basic guideway beam, rails, sleepers, and support is shown inFigure 3-1. A picture of this guideway as installed at the test track is shown in Figure3-2. The steel rail section, specially designed, provides both the levitating two-polelower section and the upper LIM surface, covered with aluminum (insulated from steel),with the outer vertical flange also used for mechanical brakes. Guideway rail alignmentcan be done via adjustments in the seating of the sleepers on the beams, shown in theview in Figure 3-3. Lines in tunnel are also anticipated, using the sleepers on slabfoundation. Little or no at-grade operation is projected in the urban-type infrastructure.Pre-stressed concrete is used for the generic girders of 20 m span on the test track,although steel in special situations has also been used. The test track uses singleguideway, but for two-way lines, the two girders will be supported by a conventionaltransverse concrete cap beam on either single or double pylons, depending on the streetlayout below. Conventional footings, or piles down to stable bed are used where needed,with control of settlements an important objective. A diagram of various elevatedconfigurations, and one tunnel are shown in Figure 3-4.
Figure 3-1. Cross Section of Standard CHSST Single Guideway

3-2
Figure 3-2. Overall View of Guideway at Test Track
Figure 3-3. Guideway Rail and Sleeper Supports
The steel sleepers are spaced at 1.2 m (4 ft, as seen in a longer view in Figure 3-5) andprovisions for alignment are provided at the sleeper-to-main beam connections, and (forgage adjustments), at the rail-to-sleeper connection. Thus the guideway is of “open”construction which aids in preventing an accumulation of snow or water.
The guideway contains two exposed 1500 VDC power rails, one on each side of the boxbeam below the vehicle modules, as shown in Figure 3-6. Protection measures for anypersonnel near these rails would have to be taken in a U.S. revenue setting. Power takeoffis via sliding or roller contacts. All communications and train control services are locatedin a separate conduit down the guideway center on top of the sleepers. This can be seenin Figures 3-2 and 3-5. Other track services can also be included between the rails asseen in Figures 3-2 and 3-5.

3-3
Figure 3-4. Guideway Cross Sections for Tunnel and Elevated Sections
Figure 3-5. Sleeper Spacing for Guideway Rails
ElevatedStreet Straddle
Tunnel ElevatedStreet Center

3-4
Figure 3-6. Side of HSST Guideway--Levitation Rail Above & Trolley Rail on Side
3.2 Design Basis
The elevated version of the guideway utilizes conventional pre-stressed PS concretegirders, in simple spans, topped by transverse steel sleepers which in turn support themaglev rail sections. The design basis for spanning the supporting columns was notspecifically presented in the information available to us. A generic pylon support spacingof 20 m is used on the Oe test track, but would vary in specific applications.
According to CHSST staff, the design calculations are based on a modified dynamicmathematical model originally formulated by Prof. Janeway. The main girders need to bedesigned on the basis of a peak dynamic load anticipated in the service life, consideringthe additional effects of a degraded guideway condition such as loss of rail support, out-of-tolerance rail, etc. These loads should be evaluated by the model with the completevehicle-guideway interaction included via modeling of the magnetic and secondarysuspensions, vehicle and guideway deformations, damping, etc. The vehicle/consistspeeds, weight, support settlements etc., are also important constituents of this evaluation,which should be provided in detail for any projected new application.
The assumed factors of safety, in turn, need to be viewed in the light of the severity of theconsequences of failure, such as would be found as one product of a failure modes andeffects analysis (FMEA). A ranking of failure severity associated with each proposedfactor of safety should be used. Example: a guideway beam collapse during vehicleoperation could be the highest severity, while an stable increase of lateral railmisalignment within the maximum permitted would be a much smaller severity.
We would like to see the following design analysis performed for the CHSST guidewaystructural system, in particular the elevated configuration:• Earthquake dynamic loading simulation, considering the complete guideway system
plus moving and stopped vehicles.

3-5
• Adequate structural strength for the full spectrum of loads encountered in both serviceand in extreme environmental, degraded, and accident-type conditions
• Adequate structural stiffness in all modes considering the interaction of the vehiclesand dynamic environmental conditions, to prevent unforeseen dynamic interactions,amplification of loads, and high- and low-cycle fatigue.
• Adequate fatigue life of the guideway including its major components such as rail,attachments, structural members and any other hardware in which a premature failurecould cause a problematic or dangerous situation in the maglev system operation.
• Stability in guideway alignment, especially considering foundation and soilconditions. Settlements and tilts of the elevated guideway on pylons or piersobviously is undesirable when a stringent alignment accuracy in the 3-5 mm range isrequired for normal operations.
• Adequacy in other environmental conditions, such as distortions in heat/coldextremes, snow/ice control and corrosion/pollution deterioration must also beaddressed and controlled.
As a part of the design, we would like to see cost considerations based on intelligenttradeoffs among beam design, pylon footing/piling design, hardware, maintenanceresources, and safety requirements since the guideway and track structure (withoutservices or land) can constitute 40% or more of the total system cost.
3.3 Operational Experience
There have been several sites at which the CHSST system has been erected and operatedwith passengers carried, summarized in detail in the 1993 Report [1] and shownpreviously in Fig. 2-3. There have been at least three sites, each comprising a singleguideway section approximately 300 m long, for which operations in an Exposition-typesetting have been conducted for several months at a time. At each site, the number oftrips ranged from several thousand to over 30,000. However, these various site operationsused both at-grade and elevated guideway designs, and these latter differed inconstruction details.
The 1.5 km test track in Oe, a Nagoya suburb, has been in operation for over 15 yearscollecting experience for several vehicle, subsystem and guideway designs. A viewincluding vertical and horizontal curves is shown in Figure 3-7. An endurance test usingthe 2- vehicle 100-L consist was run from December 1995 through March 1999, in which27,500 trips on the 1.5 km Oe guideway were run, and a record kept of system failuresand repairs [4]. One of the 17 failures reported was a de-levitation due to a weak railstructure; it is not known if this was a fastener, rail or sleeper failure. (The test trackcontains approximately 300 10 m-long rail sections and 1250 steel sleepers.)

3-6
Figure 3-7. Test Track Guideway Section with Horizontal and Vertical Curves
The test track guideway was also used to perform many experimental tests of guidewayperformance and function, as explained in the 1993 Aichi Prefecture report in Ref. 1. Thetopics covered are summarized in Table 3-1 below, using their numbering system for easeof reference:
Table 3-1. Test and Experimentation Documentation for CHSST Guideway in 1993Report [1]
2.1 Establishment of design load condition
2.1.1 Measurement of displacement and girder strain from the weight of fullyloaded car
2.1.2 Measurement of displacement and girder strain from fully loaded carrunning at constant speed to determine impact load factor
2.1.3 Measurement of displacement and girder strain in case module of fullyloaded car fails to levitate
2.1.4 Measurement of displacement and girder strain in case of fully loaded carskidding (sliding) on the rail
2.1.5 Measurement of displacement and girder strain caused by temperaturechange
2.1.6 Measurement of strains of girder by the vehicle moving to start2.1.7 Measurement of strains of girder by the vehicle braking2.1.8 Measurement of strains of girder by centrifugal force from the vehicle
running along curved rail failure

3-7
2.2 Guideway structure
2.2.1 Examination of stress on experimental guideway structure components2.2.2 Inspection of rail after 2 years of operation2.2.3 Measurement of peculiar vibration frequency of experimental guideway
structure2.2.4 Examination of girder deflection conditions2.2.5 Examination of allowed limits for guideway accuracy2.2.6 Determination of maintenance method for guideway2.2.7 Investigation of guideway maintenance car2.2.8 Comparison of HSST construction cost with that of other systems2.2.9 Investigation of most suitable guideway structure for HSST system by
means of train running tests
2.3 Switching
1.3.1 Function test of switching accuracy and turn-out time1.3.2 Confirmation of vehicle running characteristics on switching track1.3.3 Endurance test of switching track1.3.4 Measurement of stress in switching components
Some conclusions from these tests were presented in the original report [1], althoughdetailed results are not shown in this report. It will be useful to have specificrecommendations from CHSST on how the structural integrity of the guideway should bemonitored. It can be done either using a permanent set of sensors located along theguideway, or by means of a specially instrumented inspection car deployed daily ahead ofscheduled runs to evaluate and ensure that the guideway irregularities and any otherconditions are within allowable limits. This is important in view of the stringentguideway tolerances, which are discussed later.
Another important aspect not apparently covered in the tests is the guideway/componentfatigue or endurance test which is discussed later.
3.4 Performance Characteristics
The key performance characteristics of the guideway, other than the structural coderequirements which must be met, are (a) the adequate bending stiffness to controldynamic coupling with the vehicles and verification of the actual stiffness vs. calculated,(b) deflection performance of the guideway, and (c) the control of thermal distortionswhich can cause excessive deflections. Each have had some limited testing performed asshown above in Table 3-1.
(a) Adequacy and verification of bending stiffness
The guideway beam stiffness was measured by determining the fundamental beambending frequency for the standard 20 m simply-supported beam w/guideway

3-8
components attached. (This was in the region of 5 Hz). We first wanted to confirm thatthis frequency was high enough to be comfortably above the stimulation caused by thepassage of consists over the beams, deflected between pylon supports. This is termed thepassing frequency, as diagrammed in Figure 3-8.
Figure 3-8. Vehicle Pylon Passing Frequency (vs. Fundamental Guideway BeamBending Frequency)
A simple analysis shows how maintaining the stiff/mass ratio (EI/m) well over thepassing frequency insures this. It is assumed for lower speed Maglev applications that thefundamental beam bending frequency can be designed to be well above the maximumvehicle pylon passing frequency. This assures low levels of coupling and henceconservatively low dynamic load factors. Figure 3-9 shows the relationship of the beamfrequency vs. the passing frequency, where it can be seen that such beams would likelybe stiff enough even for travel speeds of 160 kph (100 mph) which is the FTA speedrequirement.
Figure 3-9. Relationship of Beam Bending Frequency vs. Vehicle Passing Frequency

3-9
What appears to be a conservative stiffness from this dynamic point of view seems tojustify the MUSA contention that the factors of safety/dynamic load factors for the basiccode analysis can be reduced from 1.6 to 1.3 (other sections use different ratios but therationale is the same). This is based on the beam frequency being 3x the passingfrequency at 100 kph. However, the final product would require that a satisfactorydynamic model, with the actual train/car weights and the maximum possible irregularitiesbe made available showing how ride quality and safety considerations would always bemet. The dynamic measurements quoted in [1] were apparently only for the designmaximum irregularities (6mm range in center span) so the dynamic load factors werevery low—under 1.1 (in their report, a number of .05 or .06 was expressed as an adder to1.0—therefore equivalent to a multiplier of 1.05 or 1.06, etc.). This would be used to re-evaluate stiffness/speed margins for higher speeds such as 130 kph, or even 160 kph.
The structural limit loads from U.S. building code type analyses (combining wind,earthquake, etc. into various ultimate load capacities with safety factors) is also animportant issue which should be addressed in any submission for construction in the U.S..For the very high speed maglev systems, the required guideway stiffness (for dynamicload factors) rather than strength generally governs the structural design of the beams.For this low speed application, however, the dynamic stiffness required is relativelylower so either type of requirement (strength or stiffness) could govern.
(b) Deflection performance of the guideway
An issue needing resolution is the CHSST reference to deflection tests on selected beamsof the test track. The claim is that with the static loading of the vehicles, deflections areon the order of L/1500, so for a 20 m long beam, deflection would be 13 mm, orapproximately _ inch. Camber of the guideway is mentioned, but how it is considered isnot clear. The consistency of this value relative to the dynamic conditions tested shouldbe explained, since it appears that the deflection from this test is larger (by a 2x factor)than what would be allowable for gap variations and ride comfort tests.
(c) Guideway Construction and Operating Tolerances
The maglev guideway must be constructed and maintained to a high degree of accuracyfor safe and comfortable vehicle operations. These tolerances have been summarized byCHSST and MUSA in Table 3-2 below. They are reportedly appropriate for the 100 kphpresent maximum operating speed, and would obviously be re-evaluated for higherspeeds. Possibly the degree of any curve being negotiated, and the limit speed at thoselocations, would also require examination of these tolerances. It should be noted thatthese tolerances should represent a “stack up” of likely irregularities from differentsources, such as: static irregularity; thermal/environmental distortion, uncompensatedsettlements, etc.

3-10
Table 3-2. Guideway Tolerance Table (Provided by CHSST/MUSA)
Tolerance atConstruction
DuringOperation
Remarks
A. IrregularityDeviation fromAlignment (Versine)
3 mm(0.12 in.)
5 mm(0.2 in.)
Lateral and verticaldeviation from
alignment for any 10 m(32.8 ft) chord
B. Track Gauge (1.7 m)3 mm
(0.12 in.)5 mm
(0.2 in.)Distance between right
and left rail centers
C. Rail Joint Alignment1 mm/1 mm
(0.04 in.)1 mm/1.5 mm
(0.04 in./0.06 in.) Vertical/lateral steps
D. Level Difference3 mm
(0.12 in.)5 mm
(0.2 in.)
Difference betweenright and left rail levels(relative to any design
track cant)
There is a set of smaller tolerances for construction (initial alignment standard) and alarger set representing maximum allowable tolerances. Even these latter are still small,being 5 mm (0.2 in) for vertical or lateral deviation from a sliding 10 m chord reference,and also for gauge variation. Depictions of these different tolerances are shown in Figure3-10a through 3-10d.
Figure 3-10a. Allowable Guideway Tolerances (Provided by CHSST/MUSA)

3-11
Figure 3-10 b, c, d. Allowable Guideway Tolerances (Provided by CHSST/MUSA)
Past testing has been performed for these type of deviations, but the test cases for whichinformation has been provided to date do not replicate these values. For example, therewas test data furnished for the 100-S vehicle moving over a 2mm lateral deviation at100 kph (we believe for one rail, making it a gage variation), and the vehicle loads andstability were confirmed. This is smaller than the stated maximum allowable in Table3-2. Likewise, there was a similar test of a vertical “cusp” of 7 mm for the track over onepylon (unclear whether the one pylon was higher or lower) which showed that thedynamic gap variations were acceptable. For the sliding 10m gauge length on 20 m spans,this would represent a “versine” irregularity of 3.5 mm, again less than the statedmaximum allowable in Table 3-2. Therefore some clarification is required if largerirregularities have been used in the tests. If not, testing should confirm satisfactoryvehicle behavior for the maximum irregularities, consistent with maintenance andinspection strategy.
Clearly the tolerances are stringent and to control these in revenue operations, continuousmonitoring and frequent maintenance of the guideway may be required, particularly inpoor soil conditions and earthquake prone zones. Such a scenario will be similar to thepresent U.S. railroads who would like to spend minimally on maintenance, unlike inJapan where this problem is viewed differently. Some proponents of Maglev in the U.S.do perceive the system as requiring least maintenance.
(d) Thermal and Environmental Distortions
The major potential for a high-tolerance structure like the maglev guideway is fortransient thermal distortions to add to the “error budget” for overall allowableirregularities. A study by Foster-Miller in 1993 on Transrapid steel guideway showedsignificant transient deflections due to uneven heating [5] .The CHSST item 2.1.5 aboverefers to measurements taken in “springtime”, presumably of track deflections. Track wasin the unloaded state. However, no results were given and it would be necessary to knowfor projected U.S. conditions, in which climate is more extreme, what transient

3-12
deflections could be expected with high sun loading. This is likely to be less of an issuefor the CHSST concrete guideway design due to a lower thermal expansion coefficientrelative to all-steel. However, there are circumstances when this issue is important,which include:
• Special guideway steel sections, such as used on some curves, switches, and long-span crossings; and
• The steel rail (topped with aluminum sheet) exposed to sun, but broken into 10 m-long sections.
Stiff bolted connections at the joint sleeper, however, could induce some continuity andpotential for thermal buckling (hot) or cracking (cold). In the U.S., rail temperatures caneasily reach +140º F and -20º F, so some provision in the bolted rail joints can be made tominimize excessive rail axial (tension or compression) forces.
Also, for any direct fixation configuration of CHSST (no sleepers; rail directly fixed toguideway beam), the issues of both thermal bending and excessive rail force become ofgreater concern and must be considered in the tradeoffs.
(e) Fatigue Life and Detail Mechanical Features
The structural beams and components, especially those unique features to the CHSSTmaglev such as the rails and attachments to the guideway structure are subjected tofatigue loading situations, both from passage of trains, individual magnets, and loadcombinations such as oscillations from at- or out-of-tolerance guideway geometry. Afatigue life assessment should be provided, and applicable experience can be included.An example in the case of CHSST could be the overhung rail attachment to sleepers, inwhich a rail crack or bolt fastener failure would compromise operation. Past experiencewith the German Transrapid showed that the repeated passing of the individual bogies(not only the consist as a single event) was responsible for fatigue failures in theguideway coil attachments. The rate of failure here accelerated as bolts loosened. TheFTA requirement on the guideway life is 75 years. It is important to evaluate the CHSSTguideway and its component life.
3.5 Switching
A mechanical segmented switch has also been designed and incorporated into the Oe testtrack, providing a turnout which also includes a curve of 25 m radius. This ishydraulically operated, with the movable steel guideway sections and track supported byrollers and guides. The 25 m radius guideway section leading into this is shown in Figure3-11. The switch itself provides a change in direction of 12-15 degrees, with theremainder of the turnout being fixed track. The switch operation is shown in Figure 3-12.Figure 3-13 shows the actual switch as it is moved from the through to the turnoutdirection. The power rails on the guideway sides are included, having leaf-type contactsin the pivoting areas.

3-13
Figure 3-11. 25 m Radius Curved Guideway Leading Into Switch
Figure 3-12. CHSST Segmented Switch Operation at Test Track

3-14
(a) Through Direction (b) Turnout Position
Figure 3-13. Switch Moved from Through to Turnout Direction
Train speed in the through direction (assuming tangent track) is not limited by the switch.However, since curving negotiation is restricted by mechanical vehicle-to-guideway railinterference as discussed in Chapter 4, these same apply to the switch. Therefore, evenfor the 8.5 m-long 100-S vehicles, the switch can be negotiated only at low (yard-type)speeds. The three movable sections, progressively longer and totaling approximately25-30 m could be increased further in length to permit higher turnout speeds. However,the switch becomes bulky, cumbersome and costly.
However, there has been no information yet provided on how such switches would beused in either the new Tobukyu line or other projected applications. While of astraightforward design, the switch is expensive due to the inherent need for the wholeguideway structure to be part of the movable sections; this is true for many other systemssuch as monorail as well. A revenue operating system (as opposed to a demo test track)will have the need for many switches both in yard and en route. For example, if onedirection of the guideway is out of service or blocked, switches to the other side (in bothdirections) would be needed to use opposing track. Also, with maintenance yards, anetwork of switches to move rolling stock to/from the line is naturally required.Therefore, the size, speed and cost of the switches can affect the physical and economicplan of a system.
Also speed of operation could be an issue, since 15 sec is presently required for fulltravel. This might affect scheduling where tight headways are needed to achieve highpassenger line capacity. All these switching issues become important for potential U.S.application, in addition to improvements in the switch design for function and cost.

3-15
3.6 Foundation and Supporting Pylons
The history of the CHSST test track in this regard is good, in that no excessivesettlements needing correction have been reported, nor were there any pylon failures.However, the guideway foundation for the test track used piles due to the poor soilconditions. These pile-type foundations, although expensive, were apparently stable forefficient operations. This is a more costly solution than spread footings or mini-piles,which might be tempting for their lower costs in marginal soils. The maintenance plan,safety plan and costs must allow for the effects of settlements or have measures taken tominimize them with up-front investments. Also, the guideway height at the test track islow compared to the potential for revenue lines, where heights of 5-10 m (16.5-33 ft)would be needed especially in more hilly terrain. This would greatly increase movementsat track level from settlements (and exacerbate earthquake deflections), so these issuesmust be addressed in any specific planned deployment.
More data from CHSST is needed on the alignment maintenance activity needed over theyears on this guideway. The design-cost tradeoffs for each individual footing system(whether deep piles, mini-piles or spread footing and its area) obviously are interrelatedwith projected maintenance, as well as with the mechanical provisions (range) allowedfor future rail alignment adjustments. (As for highways, it is always tempting to reducethe upfront costs with a minimal design for the foundation structures, and defer highermaintenance consequences for later generations.) Although this approach apparently willnot be followed in Japan for the Tobukyu Line, according to the CHSST team and YahagiConstruction Co., care must be taken in a U.S. deployment that a conservative designphilosophy in this regard is also followed.
3.7 U.S. Mandatory and FTA System Requirements
3.7.1 Structural Aspects
There is an extensive list of guideway design conditions listed in the MUSA Report [3],delineating the many different structural design conditions to be required in the U.S.. Thissummary is generally adequate since the overall limit strength, dynamic stiffness andenvironmental conditions are addressed. (An exception regarding assumed dynamic loadfactors is discussed below in 3.8). Further, by reference the U.S. AASHTO bridge designcode (1996) includes a detailed set of design conditions to be demonstrated by structuralanalysis. The one condition not directly mentioned in the above references are the FTAwind gust structural condition of 160 kph. Experience with highway bridges, however,has generally found that satisfaction of the code regulations also provides adequateperformance for this wind speed as an isolated condition, since the wind loads requiredfor the load combinations are near or at this value.
However, in addition to the U.S. bridge and general building codes used as part of thedesign requirements, there exists a recommended design procedure for elevated concretetransit guideways including maglev. (This is available from the American Concrete

3-16
Institute as Publication ACI 358.1R-92.) Where not duplicated in the AASHTO designpractice, these conditions should also be addressed by MUSA CHSST.
3.7.2 Guideway Curves
The curve radii used in the CHSST guideway layout are restricted by the vehicle,specifically the mechanical guideway track clearances and also, at higher speeds, by ridecomfort limits. The latter is aided by superelevation (up to 8 degrees for both test trackand planned Tobukyu deployment). Horizontal curving is limited by clearances in themechanical brakes and skids, since mechanical braking uses a floating caliper on theouter flange of the steel levitation/guidance/LIM rail section. Vertical radii are limited byboth the module flat lower surface length, and also the vehicle length itself.
Note that as for all small radius curves, the beam construction is a steel sheet fabrication.As radii increase, at some point the intent of CHSST is to transition to pre-stressedconcrete (PC) box section beams; however, that radius range has not been established.Note that there is one long-span (40m) crossing in their test track which uses a steel boxsection, presumably since it is a “one-off” item there.
For vertical curve negotiation, a 1500 m radius limit would normally apply to the longer100-L cars, and 1000 m to the shorter 100-S car. The longer car is operated on the testtrack to 1000 m radius but without extra tolerance margins expected for a revenue line.The 1000m vertical curve min radius is an FTA requirement, met by the CHSST. Figure3-14 shows a test track section with a 1000 m radius vertical curve transitioning to a7 percent upward grade.
Figure 3-14. Vertical Curve at CHSST Test Track

3-17
3.8 Evaluation and Issues
The various aspects of the guideway structural design and performance, as they apply tothe CHSST system, have been discussed in the detailed sections above. The followingparagraphs summarize the assessments in these various areas.
• Structural safety (code) and ultimate load factors:The U.S. codes cited by MUSA [3] do cite an adequate U.S. code approach using theAASHTO highway design approach. This contains many combinations of dead, live,environmental, etc. loads and the multiplying factors for overall guideway strength.We also recommend that the guideway meet parallel requirements cited in theAmerican Concrete Institute Publication ACI 358.1R-92 developed specifically forconcrete guideways for any load conditions not repeated in the AASHTO code, andfurther that those unique load conditions be also applied to special guideway sectionsmanufactured from steel, such as long spans, curves, switches, etc.
• Structural stiffness adequacy:The dynamic modeling results should be provided for the full range of conditions thatproduce dynamic load magnification, including: guideway irregularities at maximumallowable vertical and lateral settlements; off-design vehicle conditions (lostlevitation, mechanical suspension failure, etc.) and environmental states (thermal,wind and combinations). Some clarification of the dynamic simulation modelingshould be provided for comparison to currently accepted methods, even for the lowerratios of vehicle passing frequencies to fundamental beam bending frequenciescurrently planned. CHSST has correctly estimated that the present guideway beams(simply-supported 20 m spans on the test track, potentially longer in otherapplications), would likely be sufficiently stiff for 130 kph operation, but reevaluationwould be needed for higher speeds, up to 160 kph (100 mph).
• Thermal IssueThe potential distortions (lateral and vertical) should be provided for U.S. conditionssimilar to those used for continuously-welded rail. Transient effects of uneven solarheating should be considered in combination with rail fix, especially in the direct-fixation rail-to-guideway configuration.
• Fatigue LifeThe structural beams and components, especially those unique features to the CHSSTmaglev such as the rails and attachments to the guideway structure should besubjected to a fatigue life assessment. Life of 75 years for permanent infrastructure(guideway beams, supports, mounting hardware) and half that for the rails andattachments should be taken as the goal. The steel sleepers and hardware can beconsidered in either category, but for all components replacement costs should beconsidered in the operating cost assessments.

3-18
• Foundation and Pylon CostThe past experience has been primarily with foundations comprising deep pilesystems to provide high stability in poor surface soils. These are higher in cost thanspread footings or mini-piles. Tradeoffs need to be done where the same level ofstability and need for realignment can be achieved with these less costly systemswhere subsurface conditions permit.
• Curved Guideway CostThe minimum guideway horizontal and vertical radii are limited by the CHSSTvehicle. The basic straight PC guideway beam girder can be optimized for the span,simple end support and stiffness conditions described previously. For the 1000 mradius vertical curves, it is likely that these straight beams can be used since thecurvature is less than 2 degrees and so adjustment in the sleeper supports can bemade. For horizontal curves, however, as radii diminish, the beam design maytransition to a steel box section, and these designs all need to be subjected to the sameevaluations as for the basic beam. For larger horizontal radii, use of straight PCbeams (“chords”) of straight beams may be preferred, as tolerated by the vehicle andlocal network speeds. This should be confirmed in the cost tradeoffs, considering thegreater fabrication expense of curved beam sections. Also, for some longer-spansituations, consideration might be given to providing a continuous (negative-moment-carrying) connection with adjacent spans, thereby restoring required stiffness withoutincreasing the basic section.
• Guideway Structural IntegrityA method of monitoring the guideway structural integrity and daily condition shouldbe identified for revenue service application. An inspection vehicle for detectingforeign objects, track structural degradation, and alignment deterioration will have tobe designed. This is particularly important for the CHSST guideway because of itsvery stringent alignment requirements.
• SwitchingThe current switch used on the test track is bulky, cumbersome and apparentlyexpensive. Alternate cost effective designs must be considered for applications inU.S. revenue service.

4-1
4 Vehicle Design and System Capacity
4.1 Construction Features
The CHSST 100 vehicle is a semi monocoque structure made up of aluminum plate andfiber reinforced plastic. The vehicle floor, made up of honeycomb panels, carries thelongitudinal load from couplers and provides a path for the vertical load from the vehiclemodules which support the car body.
The levitation, guidance, propulsion and braking functions on the vehicle are co-locatedinto “module” assemblies below the vehicles, mechanically interconnected with eachother and the vehicle body above. These modules are lined up consecutively below thevehicle because the full vehicle length is required for the available magnetic intensities toadequately lift, guide, propel and brake the vehicle. This may be seen in Figure 2-3.Since each of these modules is somewhat less than 3 m long (counting inter-spaces), thevehicle lengths under current use and consideration are multiples of this.
Two sizes of vehicles (100-S and 100-L) have been designed, as indicated in Section2.2 and summarized in Table 4-1. Both cars have been undergoing testing over the lastseveral years. An adaptation of the 100-L vehicle, in 3-vehicle consists, is currentlyplanned for the Tobukyu Line (Figure 4-1).
Table 4-1. Vehicle Specifications
Characteristic 100-S Specification* 100-L Specification*Vehicle Dimensions 8.5 m long
2.6 m wide3.36 m high
14.0 m long2.6 m wide3.2 m high
Empty Weight 9 tonnes 17.5 tonnesMaximum Loaded Weight 15 tonnes 28.0 tonnes
* “A” type or end/control vehicle
The occupied portion of the vehicle bodies follows conventional transit layout: two pairsof side doors and a mixture of transverse and wall seating allowing about 2 standees perone seated passenger (assuming U.S. passenger loading density). A control cab is locatedat each end of the consist. With 34-36 seats, the 100-L type car could accommodate about80-85 passengers, including standees, based on transit-type floor layouts and standeedensity typical for the U.S.
4.2 Structural Design Basis
According to MUSA Report #1 [2], the structural design is based on the maximum loadexpected in service life with a safety factor of 1.5. Additional safety factors (1.15) areused at fittings, castings, and welds. The static load design is adequate for sizing the
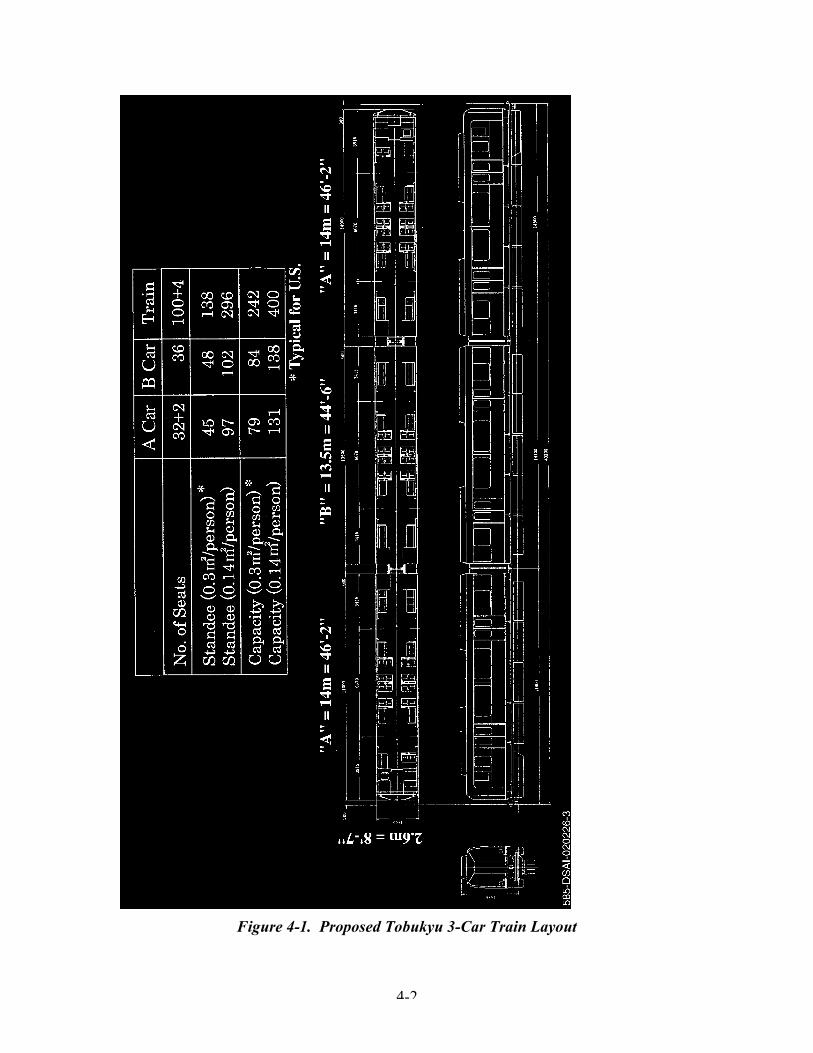
4-2
Figure 4-1. Proposed Tobukyu 3-Car Train Layout
4-3
vehicle body structural components to withstand peak quasi-static loads expected inservice life. The fatigue life of the vehicle body and components is also important but theMUSA reports do not address this. It is important to know the basis of the 20 year lifefor the vehicle. Although the manufacturer is very experienced, a design rationale for thelife span should be provided.
The expected 20 year life span for the vehicle probably results from the combined effectsof fatigue and corrosion. The honeycomb structure can be vulnerable to corrosion due totrapped water, humidity, and galvanic action with other materials at connections. Thefatigue life depends on:
• Speed and guideway irregularities/dynamic amplitude• Vehicle miles/number of cycles.
The stated 20 years life is short of the 30 year FTA requirement for the Maglev vehicles,which by virtue of their contact-free operations on the guideway, are expected to be“maintenance free” and provide long service life, to justify the high initial cost. In fact,the Aichi Prefecture report [1], stated that the time in which the HSST system will beprofitable is somewhat longer than for the monorail system.
4.3 Operational Experiences
The different HSST developmental vehicles have carried a sizable number of passengerssince 1974 at different exposition and test locations as indicated in Figure 2-4. The sumtotal of passengers at all expositions exceeds 3 million. The test sites report a similarnumber. The 100-S at Nagoya had carried 13,837 passengers over a distance of62,370 km prior to December 31, 2001. The 100-L at Nagoya carried 25,991 passengersover a distance of 130,206 km during the same time period.
Consider a 15 km long route which is expected to carry 12,000 passengers in eachdirection per hour (FTA requirement). Assume that the service runs for 20 hours in a24 hour day, also an FTA requirement. The total number of passenger km in 20 years is:
15 x 2 x 12000 x 20 x 365 x 20 = 42 x 109
The total passenger km for the 100-S is 0.88 x 10⁹. For the 100-L, the passenger km is1.62 x 109. The operational experience to date is therefore a small portion (< 4%) of theexpected service life of the system.
In MUSA Report #3 [4], the component failures during an endurance test lasting for3 years and 2 months are presented. There are failures such as hydraulic fluid losses, etc.But a major failure was the de-levitation of modules because of unstable levitationcontrol. The failure rate is noticeable—three times in three years, with a total runningdistance of 41,259 km. This was attributed to weakness in the rail structure. It isimportant to note that over a 20 year period, a vehicle is typically expected to traverse
4-4
about 500 x104 km, which is more than 100 times the distance simulated in theendurance test.
4.4 Train Capacity
Capacity refers here to the maximum passenger-carrying capacity of any transit-typesystem. This results from a simple multiplication of the passenger capacity of eachtrain/consist and the number of trains/consists per hour in each direction.
The critical factors in determining the capacity are:
• The capacity of each car, including seated and standee passengers, and the ability ofthe car to provide sufficient floor space, weight-carrying ability, and storage area.
• The length of the trains formed by these cars, which in turn requires stations ofadequate length, and layouts to permit good passenger flow on and off the trains. Theability to load and unload passengers in a short, set stop time is vital if schedules areto be maintained.
• The design of the train control system, signal and communications, train protection,level of safety, system redundancy and margin for malfunctions all influence the safetrain headway, or spacing in time. The ability to run trains continuously at shortheadways, allowing for discrepancies in the transportation network, is a challengingtask requiring a high level of sophistication in the system and dedication on the partof the management, operating and maintenance staffs.
• The performance of the trains (acceleration, deceleration and maximum speed)interact with the operating schedule and the train control system to limit reductions insafe headway. In extreme cases with short lengths between stops, the physical trainlength is a factor. Also, given maximum acceleration/deceleration rates suitable forstandees (0.15 g fore-aft as an example), shorter station spacing may not permitmaximum speeds to ever be attained over a significant portion of the journey.
4.4.1 CHSST System Parameters.
The Tobukyu Expo line capacity is planned for 4000 passengers/hour in each direction,claiming 400-passenger trains at 6-min headways operated automatically under ATO.The CHSST descriptive material refers to the 400-passengers capacity of these 3-carconsists. However, this assumes tightly packed 3-car consists (A-B-A) of “long” carssimilar to the 100-L, with only 0.14 m2 (1.5 sq. ft) of floor area allowed per standee.Using a more suitable 0.3 m2/standee (3.3 sq. ft), the norm in the US and Europe, thattrain would have 242 passengers, according to data furnished by CHSST. It wouldrequire proportional adjustments in headway and/or number of cars in the consist toachieve 4000 passengers/hour/way, such as that 3-car train at 3m 38s headway. The 1993Aichi Prefecture Report [1] assumed “short” 100-S cars, which with the 0.3 m2/standee

4-5
criterion resulted in a 4-car (ABBA), 200-passenger consist. (A 5-car ABBBA consist of100-S cars with 250 passengers would be roughly the same 42 m length as a 3-car ABAconsist of 100-L cars with 242 passengers.) Note that the CHSST cars are somewhatnarrower at 2.6 m than standard rail cars at 3 m.
4.4.2 Capacity Example for Urban System
Table 4-2 shows the system capacity as a function of trains/hour (also expressed asheadway) and train size (passengers/train) for a 242-passenger and 400-passenger train.To meet the FTA 12,000 passengers/hour/way requirement, 8-car trains (400 passengers)with 100-S cars would have to operate continuously at 2-min headways, or 12-car trains(600 passengers) at 3-min headways, etc. (The 100-S cars are used since these are theonly CHSST design that has curving capability down to 25 m, still shy of the presentFTA min requirement of 18.3 m/60 ft).
Table 4-2. System Passenger Capacity vs. Train Headway and No. of Passengers/Train
Trains Per Hour Passengersper Train
SystemCapacity**
Passengersper Train
SystemCapacity**
*10 (@ 6 min.) 242 2420 400 4000
12 (@ 5 min.) 242 2904 400 4800
15 (@ 4 min.) 242 3630 400 6000
20 (@ 3 min.) 242 4840 400 8000
30 (@ 2 min.) 242 7260 400 12,000
*Present CHSST Plan **Passengers/Hr, Each Way
Achieving this would be interdependent with the quality and design of the train controlsystem, train performance, equipment and human reliability levels, level of safety,control of maintenance practices, station lengths, station stop, passenger load and unloadtimes, etc. The 8-car train would be 66 m/218 ft long and the 12-car train 50% longerthan that at nearly 100 m/325 ft.. These combinations of long trains and short headwayscombine to demonstrate how large the 12,000 passengers/hour goal is, especially in viewof day-to-day operations.
4.4.3 Effect of Maximum Speed on Trip Time
For urban maglev, the FTA specified performance capability of 160 kph (44.4 m/s) withcorresponding acceleration and deceleration performance capabilities of 0.16 g areimportant criteria for trip time assessment. For station spacing of only 1-2 km or less, itis recognized that acceleration and deceleration performance, more so than maximumspeed capability, are the important considerations for determining trip time. However,

4-6
for station spacings on the order of 5-10 km or more, typified by corridor service betweenmajor activity centers, for example a city center to an airport, minimizing trip timerequires that an urban maglev system should have the FTA desired speed performancecapability of the 160 kph
Per the MUSA reports reviewed, the presently designed Chubu HSST 100L and 100Svehicles have maximum specified speeds of 100-110 kph with acceleration/decelerationcapabilities of about 0.11g. Chubu did state that the propulsion systems for both vehiclesdo have the capability of operating up to 130 kph. As stated by Chubu, they also have thecapability to operate at higher accelerations than they have specified with the provisionthat maximum power performance called for must be limited to the capability of thepresent design. This means that the transition from constant thrust to variable thrust mustoccur at lower speeds when accelerating at higher than the specified accelerationperformance.
Short Station Spacing
The trip time was evaluated in light of the present CHSST permitted speed of 100 kph,with the higher speed of 130 kph being a likely possible increase with minimumconsequences for the present vehicle and guideway design. Also, the FTA requirement of160 kph (100 mph) capability was included in this assessment. Figure 4-2 shows that a1.1 km (0.7 mi.) leg would be needed to touch 130 kph and a 1.7 km (1.1 mi.) leg neededto touch 160 kph. This is using the maximum FTA required acceleration/deceleration rateof 1.6 m/sec2 (0.16 g, appropriate max for standees) plus allowable jerk of .05 g/sec. Ineach case, zero time at the peak speed was accumulated. A reasonable safe brakingmargin of _ the actual braking distance was added for each of these legs.
Figure 4-2. Station-to-Station Distances Needed to Utilize Higher Top Speeds
For the potential benefit of higher speeds on trip times, we also evaluated time savings ona relatively longer leg of 2 km, typifying the general range of such longer legs in theurban-suburban network (Figure 4-3). The effects of a speed increase from 100 kph to130 kph produced a trip time reduction of 10 sec (from 1m 30s to 1m 20s) and an

4-7
additional speed increase to 160 kph gave an additional reduction of 5 sec to 1m 15s. Thelatter had only a 15 sec period at 160 kph (20% of the leg time).
Figure 4-3. Trip Time for 2 km Station Spacing
These evaluations show how diminishing returns are produced from higher speeds for theshort station spacing scenario. Therefore, the speed increase from 100 to 130 kph, ifachievable by CHSST without significant design changes, may be acceptable as a firststep for its application in the U.S. on routes with short station spacing.
Long Station Spacing
A trip time comparative assessment was performed for a 10-km station spacing using theFTA desired performance as a baseline. As shown in Figure 4-3, the trip time using FTArequirements and idealized acceleration-deceleration profiles would be approximately4.2 minutes (252 seconds). Using the Chubu currently specified 100 km/h and 0.11gperformance level for the 100L vehicle the CHSST would have a trip time of more than6.4 minutes (385 seconds) or a trip requirement of more than 50% for the route scenarioconsidered here. This difference would be reduced to about a 25% difference(320 second trip time) for the case of upgrading the 100L vehicle’s performance to the130 km/h speed capability.

4-8
0200040006000800010000120000100200300400500Time (s)
Dis
tan
ce (
m)
FTA Reqt (160 kph)Chubu HSST (130 kph)
Figure 4-4. Trip Time for 10 km Station Spacing
Whether even a 25% trip time difference would be acceptable to a potential urban maglevsystem operator would of course be dependant upon the desired operating service goalsof that operator. For station spacing significantly larger than 10 km, it would appear thathaving 160-km/h operational capabilities would be mandatory.
4.4.4 Impact on Station Size
The FTA specification for station size includes a typical footprint of 40m long assuminga 4-car train and 2 tracks/3 platforms, although this depends on train size. It is clear fromthe discussion in paragraph 4.4.2 above that a station with a 40m platform could notaccommodate trains of sufficient length to meet the capacity requirement of 12,000passengers/hour/direction. The example 8-car consist of 100-S cars with 400 passengerswould have to operate at 2-min headways (30 trains/hour), and the platform would be70m (approaching 250 ft, without additional stopping tolerance). Even considering thesmaller width of the CHSST cars at 8.5 ft vs. standard cars at nearly 10 ft, the platformsizes for such system capacities would have to be much larger than the FTA guideline.The 40m platform would be more consistent with trains operating at a 1-min or lessheadway.
4.4.5 Summary of Capacity Issues for CHSST
• A projected speed increase from 110 kph to 130 kph, with potentially low designimpact, can accomplish many of the time reductions for typical likely urban-suburbansystem networks. The CHSST vehicle potential to serve as a Maglev for U.S. urbanareas may be evaluated in that light.

4-9
• The FTA required acceleration/deceleration rate of 1.6 m/sec2 (0.16 g) plus allowablejerk of .05 g/sec is stated to be achievable with the CHSST design (and is themaximum appropriate for standees) and relates to the speed issue above.
• System capacity with CHSST cars for the FTA passenger density requires very shortheadways (down in the 2 minute range) with long trains over 200 ft. Reductions incapacity produce direct proportional reductions in train size and/or train frequency.
4.5 Curving Capability
Curving is limited by clearances in the mechanical brakes and skids, since mechanicalbraking uses a floating caliper on the outer flange of the main steel levitation/guidance/LIM rail section.
During vertical curve negotiation, a 1500 m radius limit would normally apply to thelonger 100-L cars, and 1000 m radius to the shorter 100-S car. The longer car is operatedon the test track to 1000 m radius but without the extra tolerance margins expected for arevenue line. For example, these limits are based on allowing for an air spring failure,therefore reducing bogie compliance to the curve.
On lateral curves for the Tobukyu line, minimum radius is 75 m to be taken at 30 kphusing a 5° cant and lateral (relative to the car) load felt of .075 g at passenger level. Onthe test track, the 100 m minimum radius turn with 8° cant is safely negotiated at 42-44kph. In all cases, these are above balance speed, with the lateral in-car g-load for comfortprevailing.
The HSST 100-S car can negotiate a 25m curve. The minimum radius that can benegotiated by the 100-L car is 50m. Clearly, the present FTA requirement that aminimum curve radius of 18.3m be negotiated is not satisfied by the HSST. If MUSA isproposing 100-L cars for U.S. applications, they must also identify in how many potentialroutes these cars can be used with their 50 m turn radius. Based on the percentage ofapplicable routes, these may be justified to provide Urban Maglev transportation.
4.6 Passenger Egress and Safety
There are two doors on each side of the car, similar to standard U.S. transit car practice.These can be either single or double-sliding doors with the usual interlocks: shut beforemotion starts, detect/retract if obstructed, etc. In the present and planned cars, there areno apparent additional emergency egress measures, such as fully opening removablewindows or roof hatches. The car-to-car end doors would be difficult to use for trainegress, as for any coupled transit car with end vestibules and exit doors.
Egress in the event of fire and smoke is an essential requirement. The passengers need tobe able to open the doors, using an alarm in the car, during an emergency. The doorsshould open after the vehicle comes to a complete halt. The passengers must be able to

4-10
step on the guideway and walk on it towards the station, or get down to ground level bysome means. Walkways were mentioned as being required on the Tobukyu line. Thisissue must be addressed in detail by MUSA.
4.7 Vehicle Crashworthiness
The vehicle body does not have any specific crashworthy features to absorb energy in theevent of a collision with another car or a large object on the guideway (such as a fallentree or large stone/obstruction placed by vandals). The designers of HSST intentionallydid not include this feature, since such collision possibilities are apparently eliminated intheir signal systems and safety inspection procedures.
For Maglev vehicles in the U.S., crashworthiness at full operating speeds may not berequired. However, during maintenance and yard operations, and at the stations, acrashworthiness requirement at some slow speed (say in the 15-30 kph range) isdesirable. Without increasing the vehicle weight significantly, MUSA and CHSSTshould satisfy this requirement by redesign of the end sections of the vehicles.
4.8 Dynamics and Ride Quality
Generally, to assess the dynamics and ride quality in any guided transport vehicle, arigorous dynamic model is used, followed by full scale testing with an instrumented car.Apparently, the HSST vehicles have undergone rigorous test procedures to improve theirdesign. In the early stages (1991), the vehicle suffered large yaw excursions, a commonproblem with Maglev vehicles lacking adequate lateral damping and guidance control.
Matsumoto and co-workers [6] performed tests on the Nagoya track and their resultsshowed significant improvement with the use of yaw dampers. The yaw oscillations nolonger exceeded those of some of the conventional vehicles. Additional test data on ridequality in terms of g levels has shown the level to be within the allowable limit forvehicle speeds up to 100 kph.
The various operational and limit guideway tolerances must be considered in assessingthe ride quality and the vehicle dynamic behavior. The CHSST guideway tolerance planwas shown in Section 3. The limiting factor for the guideway tolerance appears to be thevehicle dynamic behavior, i.e. large excursions with interference between componentssuch as the brake calipers and other module components, rather than the ride quality forthe passenger.
If the CHSST needs to run with a maximum speed of 130 kph in the U.S., the guidewaytolerances may have to be made less stringent and/or the vehicle components must beredesigned to reduce the interference. For that purpose, a rigorous dynamic modelaccounting for guidance and levitation forces/displacements, inertial properties of vehiclecomponents and bending flexibility of the car body and floor, is required. These models,generally available in the literature, should be exercised for the purpose of evaluating the

4-11
vehicle behavior and ride quality at 130 kph. Alternately, tests should be run at 130 kphon instrumented vehicles, thereby developing a redesign via trial and error.
4.9 Vehicle Manufacturing
The CHSST vehicle manufacturing core group and the major subcontractors are wellknown and have proven experience. Nippon Sharyo is responsible for the car body andassembly. Although this company has had extensive experience in car building, when itcame time to build the HSST-100 car bodies, the chief engineer of the companyexpressed significant concerns about this project to the FTA and MUSA team visitingthem in Japan. These include:
• Little margin in manufacturing cost, especially for low vehicle quantity
• Challenging weight requirements—vendors are not typically experienced inmanufacturing the vehicle and parts. They cannot adopt special or untried techniquesto optimize the weight. This is an important aspect, as the Maglev vehicle weight iscritical to its levitation and propulsion performance, which are discussed in latersections.
• The required coordination between the subcontractors is complex.
The problem of manufacturing HSST vehicles for U.S. applications could be even greaterbecause of the U.S. mandatory requirements plus the FTA system requirements. Also,the manufacturing infrastructure in the U.S. for rail type vehicles is not as strong as inJapan. MUSA must identify companies or subcontractors in the U.S. who can build partof the HSST vehicle or support Japanese manufacturers to satisfy the “Buy America”provision.
4.10 U.S. Mandatory and FTA System Requirements
4.10.1 U.S. Mandatory Requirements
• ADA:The system should be usable by all, including the blind and those dependent on awheel chair. Because of the smaller width of Maglev vehicles compared toconventional vehicles, problems may arise in accommodating this requirement.Suitable interior car seating arrangements need to be developed.
• Fire and Smoke Safety:U.S. flammability and smoke emission requirements as applied to passenger, vehiclesand interiors, etc., and NEPA 130 requirements for detection and suppression of fireexist. These shall be satisfied in the interior design of the vehicle structure.

4-12
• Egress:The FRA requirements for access and egress are presented in 49CFR, part 223.25. Itrequires that each passenger car have at least four deployable emergency windows.At present the HSST vehicles use doors for entry, exit and egress. Further studies arerequired to evaluate whether or not the door egress alone is adequate especially whenthe vehicle is occupied to its full capacity.
• Crashworthiness:The vehicles are to be designed for crashworthiness to protect passengers in the eventof the Maglev vehicle hitting a large obstruction such as fallen tree branches,maintenance equipment, or objects placed by vandals,. The present vehicles’ abilityto withstand even low speed impacts is unknown. MUSA must evaluate the level ofcrashworthiness that now exists in terms of speed vs. size and weight of obstruction.
4.10.2 The FTA System Requirements
• Curve Negotiation:The vehicle should be capable of negotiating lateral curves of 18.3 m radius andvertical curves of 1000 m. The 100-L car is designed to negotiate 50m or higherradius horizontal curves and 1500 m or higher radius vertical curves. The 100-S carcan negotiate 25 m or higher radius horizontal curves and 1000 m or higher radiusvertical curves. MUSA should evaluate opportunities (Maglev locations) in the U.S.where 100-L cars can be used.
• Maximum Speed:The FTA requirement is 160 kph peak speed and an average speed of 50 kph. TheHSST vehicles are expected to operate at 100 kph peak speed in Japan. Apparentlythey can be used to run at 130 kph without major design changes. This speed levelmay be acceptable on some route scenarios without sacrificing the trip timesachievable at 160 kph. The effect of this higher speed on ride comfort and safetyneeds to be assessed. This is discussed further in Chapter 6 on Propulsion Systemsand Power.
• Vehicle Life:The U.S. Maglev vehicle is expected to provide a service life of 30 years according tothe FTA requirement. According to the MUSA report, the service life of the vehiclesis 20 years. The method of determination of a 20 year life span, which is acombination of fatigue, corrosion and wear, is not given in the MUSA reports.MUSA must present analysis or historical data on this, and explore methods ofincreasing the life to 30 years.
• Ride Quality:The FTA ride quality requirement of “1 hour comfort level” is based on ISO 2631/1,1985. This standard has been adopted by the HSST developers. The test data shownto the authors for the current design and the allowable guideway tolerances, up to aspeed of 100 kph, seem to meet the FTA requirements. MUSA and CHSST shoulduse a general purpose non-linear dynamic model to evaluate the ride quality and

4-13
vehicle dynamic behavior at higher speeds, guideway tolerance, and service limits,plus consider any design modifications which are introduced.
4.11 Vehicle Issues and Evaluation
• The CHSST system uses a reasonably mature Maglev vehicle capable of transportingpassengers in urban areas. However, the vehicle falls short of satisfying certain U.S.mandatory and FTA system requirements identified in the previous section. If theCHSST cars can be operated safely at 130 kph without major redesign of the vehicle,it may be considered for U.S. application in certain site-specific scenarios, providingother issues (discussed in other chapters) are resolved at this speed.
• Despite two decades of development the CHSST operational experience in terms ofpassenger km is a small fraction of the expected usage during the life of the system.CHSST has made significant efforts in developing the technology during thesedecades, and performed a number of safety and performance evaluation testsHowever, the vehicle endurance testing was conducted over only a small percentageof the vehicle miles expected from the FTA requirements.
• To improve the performance of the vehicle, a critical consideration is reducing theweight of the vehicle structure. The aluminum construction does save weightcompared to steel. However, it is not clear how the weight is optimized. Modernmethods of using combinations of carbon composites and cheaper fiberglass may be asolution to be considered for the U.S. applications. Vehicle manufacturing, even withthe present aluminum design, can pose problems due to the lack of appropriateinfrastructure, particularly for vendors who prefer the off the shelf or previously madecomponents that can potentially increase the weight of the vehicle structure. At thesame time, crashworthiness and energy absorption need to be considered.


5-1
5 Levitation and Guidance
5.1 System Features
The HSST levitation system is based on a normal electromagnetic suspension (EMS)with active vertical and passive lateral control, and having the levitation modulesintegrated with a short-stator linear induction motor (LIM) [2]. The steel guideway usedfor levitation is also used as “backiron” for a single-sided LIM in which an aluminumreaction plate is mounted to the steel.
The technology is based on an earlier generation Transrapid version, the TR04, and theoriginal technology was purchased from Transrapid in 1974 by Japan Air Lines.
A U-shaped levitation magnet using an iron core and copper windings is attracted to aU-shaped rail; this arrangement generates both levitation and lateral centering forces. Asimplified version of this suspension is shown in Figure 5-1, which defines the magneticoperating gap, d.
Each levitation module has an inductive sensor that measures the magnetic operating airgap. Vertical control is accomplished actively; this is necessary in order to stabilize thevertical suspension which is unstable without feedback. Lateral control is done passivelywith some damping provided by airbags in the mechanical secondary suspension.
Figure 5-1. Simplified EMS Suspension with U-shaped Guideway [8]
Details of the levitation and guidance force profiles as a function of vertical airgap andlateral position, taken from a similar system [8] are shown in Figure 5-2. Note that achange in the lateral position (x) affects both the lateral restoring force (fguid) and thelevitation force (flev). The suspension can accommodate lateral forces of approximately0.3 g. Although there is vertical control, apparently there is no lateral control, whichmakes the lateral suspension under-damped.

5-2
Figure 5-2. Detail of Levitation and Guidance Forces with Lateral Deflection
5.2 Design Basis and Specifications
Selected levitation system specifications of HSST are shown in Table 5-1. Of note is theairgap; the magnetic airgap is nominally 8 millimeters, while the effective mechanicalairgap is only 6 millimeters due to coatings on the steel and other mechanicalinterferences that use 2 millimeters. Also, note that levitation power increases as speedincreases; this is due to additional control power needed at higher speed.
Table 5-1. Levitation System Selected Specifications
Nominal levitation airgap (magnetic) 8 mm
Nominal levitation airgap (mechanical) 6 mm
Levitation power (0 kph) 700 Watts/tonne
Levitation power (100 kph) 900 Watts/tonne
Levitation module power supply 275 VDC
Levitation backup power Provided by batteries; approximately 30second capacity
Magnet driver 2-quadrant chopper operating at 4 kHz
Gap sensor Inductive proximity sensor
Control method Digital signal processor
Control algorithm PDI (Proportional, derivative, integral)control

5-3
5.2.1 Vertical control
For electromagnetic suspensions, active control is mandatory as the attractive force isinversely proportional to airgap, and so is unstable without feedback. HSST utilizes aninductive proximity sensor that measures the distance between the magnet coil and therail. Using the signal from the proximity sensor, HSST employs PDI (proportional,derivative, integral) control in order to stabilize the suspension vertically. Control isimplemented with a digital signal processor and magnet control power is provided by a2-quadrant chopper operating at 4 kHz from a 275 Volt DC bus.
Without active control, or if there is an airgap sensor failure, such an EMS suspension isunstable. The magnet will either clamp to the rail, or fall off completely; therefore, thiscan be an intolerable failure mode. According to HSST, there is a possible single pointfailure mode in the suspension and control. As is noted in MUSA [4], there have beenseveral instances of levitation modules de-levitating due to sensor failures and the like.The details of this failure mode have not yet been forthcoming from HSST, which isstudying this issue.
5.2.2 Lateral control
In HSST, there is no active lateral control. The suspension is stable, but under-dampedlaterally. Some damping is provided laterally by airbags on the secondary side (moduleto car body), but HSST does not have data and analysis describing the damping ratio.During technical meetings in Nagoya, Mr. Yoshihide Yasuda from HSST did explain thatHSST has done some computer modeling, which shows a lateral offset of 6 millimeterswhen going through a 100-meter radius curve, which is below the 15-millimeterallowable deflection. However, there has been no analysis forthcoming yet from HSSTdescribing the system behavior under wind gusts, passing trains, etc. Lateral guidance isimportant since a likely US Urban Maglev alignment would include two-way operationwith passing trains. HSST should do further work on the dynamics of the lateralsuspension as well.
5.2.3 Backup power
Backup power for the levitation modules is provided by a bank of rechargeable batteries.The battery bank is able to provide levitation power for approximately 30 seconds. Thisshould be sufficient for a safe landing should levitation main power be lost. However,the backup battery capacity should be further evaluated to determine whether there issufficient energy capacity to the LIM for safe braking during a power outage.

5-4
5.3 Levitation Characteristics
5.3.1 Levitation power vs. speed
HSST has test data in the 0 – 100 kph range showing levitation power. As speedincreases, levitation power increases due to higher control power requirements toovercome guideway irregularities. Figure 5-3 shows the predicted levitation power overthe speed range 100 – 160 kph. If the suspension is to be operated at the higher speeds(over 100 kph), the power-handling capability of the suspension coils needs to be furtherevaluated.
HSST levitation power vs. speed02004006008001000050100150200Speed, kph
Lev
itat
ion
po
wer
,
Wat
ts/
ton
ne
Figure 5-3. Levitation Power vs. Speed (Extrapolated Above 100 kph)
5.3.2 Levitation power vs. Airgap
There is a strong relationship between the operating airgap and power dissipation in anelectromagnetic suspension, and there is a strong power penalty incurred when operatingat a larger airgap. The functional dependence can be inferred by considering thesimplified (2D) model in Figure 5-1. The effective magnetic operating airgap is d, thepole area is A and there are N turns energized with DC current I.
The airgap magnetic flux density assuming no saturation in the steel, and a purely 2-dimensional suspension is:
dm2
NIB o
g =(5-1)
The lift force is given by:

5-5
2
22
4
)(
dm
mANIAB
MgF o
o
gL ===
(5-2)
The power dissipation in the winding is:
RIPcoil2= (5-3)
where R is the winding resistance. Combining (5-1), (5-2) and (5-3) results in arelationship between operating airgap, total lifted weight, and power dissipation, whichis:
( )( )( ) 2
2
4d
mMg
ANR
Po
coil =(5-4)
The first term is a constant, which includes the effects of winding resistance. Note thatwinding resistance increases with temperature. The second term is the weight of the train,and the third term is the operating airgap. This scaling law favors lighter vehiclesoperating at a small airgap. From this, we can determine a power dissipation if theoperating airgap deviates from a nominal value of 8 millimeters (Figure 5-4). Forinstance, increasing the airgap from 8 to 10 millimeters requires a 56% increase insuspension power dissipation. Doubling the airgap increases the suspension powerdissipation by a factor of four.
Effects of operating airgap on power dissipation
0.00
0.501.00
1.50
2.002.50
3.00
3.504.00
4.50
8 10 12 14 16
Magnetic airgap, mm
No
rmal
ized
po
wer
dis
sip
atio
n
Figure 5-4. Effects of Operating Airgap on Power Dissipation

5-6
5.4 U.S. Mandatory and FTA System Requirements
Currently there is no FTA requirement on the minimum allowable limitation gap for theMaglev vehicles. The small gap in the EMS and its potential impact on safety and smoothvehicle movement has been a general concern.
Also, the control system should be further evaluated. There is anecdotal evidence fromHSST that there are possible single-point failure modes in the levitation and control;without active feedback, EMS suspensions are unstable so the control system should haveredundancy.
MUSA Report 3 [4] indicates that there were three de-levitation incidents in the vehicleendurance tests performed over a period of about 3 years over a distance of 41 km. Thisshows that the levitation system reliability may need to be further improved, even thoughthe cause of the de-levitation was attributed to weak spots on the guideway.
5.5 Evaluation and Issues
5.5.1 Overall Impressions
The test program implemented by HSST with regard to the levitation modules has beenlengthy and comprehensive, but empirical in nature. There has been little or no analyticinformation provided to the FTA team, and the test data provided has been summary innature. There have been several instances of vehicle de-levitation during testing, andfurther demonstration is required to determine whether the vertical control system issufficiently robust and redundant to meet U.S. safety standards. Other issues such as thelateral suspension need to be addressed, especially with regard to ride quality and theability to withstand wind gusts and aerodynamic forces arising from passing trains.
The vehicle is heavy and this constrains significantly the designs of the levitation,guidance, propulsion and guideway modules. Any weight reduction achievable, e.g., thecar body, will have a significant trickle-down effect on total vehicle weight and cost. Asan example, a reduction in train weight results in a reduction in levitation module weight;a lighter levitation module requires less levitation force, etc. This should be thoroughlyevaluated before adoption in the U.S.
5.5.2 Overall advantages of EMS
A significant advantage of the HSST EMS levitation is that there is lift at zero speed.Therefore, landing wheels are not needed as are needed in electrodynamic (EDS) Maglev.For the urban environment where there are frequent starts and stops there is anothersignificant advantage to EMS since there is no magnetic “drag peak” to transition as inEDS. In EDS the drag peak must be overcome by the linear motor, whereas the EMSlevitation is free of this restriction.

5-7
5.5.3 Vertical Control System
HSST has indicated that there is a possible single-point failure mode in the levitationsystem, as described previously. This must be evaluated with regard to the FTA overallsafety requirements. The reliability of the levitation control system may need to befurther improved.
5.5.4 Small Levitation Gap of EMS
The magnetic levitation airgap (from steel to steel) is nominally 8 millimeters. However,other interferences reduce the effective mechanical airgap to 6 millimeters, nominal.During testing, reported results [7] show maximum peak-to-peak levitation gapdeflections of ±3 millimeters at 100 kilometers per hour. The trend in the test data wasfor higher peak-to-peak deflections at higher speeds; hence it is expected that the peak-peak deflection will be even higher at the FTA requirement top speed of 160 kilometersper hour. Therefore, peak-to-peak deflections in the levitation module are a significantfraction of the 6-millimeter nominal mechanical airgap. This needs to be furtherevaluated, especially in light of allowable guideway irregularity tolerances.
With a copper-wound EMS magnet, there is a severe power penalty in increasing theoperating airgap. It would be desirable to increase the gap and improve its control by useof permanent magnets to assist levitation and advanced digital control techniques, but thisrequires redesign of the system.
The small levitation airgap may also be a factor on the stringent guideway constructiontolerances, which can increase construction and maintenance costs [9].
5.5.5 Lateral Guidance
Lateral guidance is accomplished passively; there is no active control of lateral position.Reported results [7] show significant lateral oscillations during normal operation. It isunclear from the available literature what the lateral load capacity of the system is beforehitting the guidance skid. HSST has apparently not performed tests to determine lateraldeflections under wind gusts from passing trains, nor the aerodynamic effects due to thetrains’ passing in opposing directions.
5.5.6 Motor-levitation Module Geometry Interactions
There is another interaction that constrains the design of the levitation section and thelinear induction motor. The linear motor and levitation sections are stacked, in thatvariation in the airgap of one inversely affects the airgap of the other. Someimprovement in LIM performance can be achieved by operating at a smaller airgap;however the LIM/levitation stack-up constrains this modification. Another factor in theLIM/levitation module interaction is that the LIM attractive force opposes the levitationmodule attractive force, and hence the levitation module must produce more lift than theweight of the train. It is unknown whether HSST has evaluated the tradeoffs inherent inthis LIM/levitation stack-up.

5-8
5.5.7 Maximum Speed
The maximum operating speed of HSST-100 is 100 kilometers per hour. For higherspeeds, performance of the levitation module needs to be evaluated, with regard to
• Peak-to-peak deflections• Lateral deflections• Levitation power requirement.
Test data [7] show that the levitation power consumption increases approximatelylinearly with train speed; levitation power at 100 kph is approximately 880 Watts/tonne;extrapolating to 160 kph shows that the module will dissipate approximately 1000Watts/tonne. This needs to be further evaluated to determine whether there is sufficientcooling.

6-1
6 Propulsion System And Power
6.1 Operational Experience
The CHSST development history dates from 1972 when, during its early phases,development was concentrated on a high-speed subscale model. From the late 1970s andonward, lower speed passenger carrying prototypes were built and demonstratedprimarily at various exposition sites. With respect to the propulsion system all knownHSST development and testing has been with the use of the linear induction motor(LIM).
Prior to the introduction of the 100-S version vehicle sometime in 1990, at least threeversions of the HSST had been built and demonstrated on relatively short tracks whereChubu reported accumulated distances traveled of more than 40,000 km. With respect tothe LIM, we were told that its development was based on the work of Prof. S. Nonaka.The FTA team has since identified several of his publications during that time period[10-15]. Upon review of those publications, we will report on the results of that researchand development as it pertains to the design criteria for the CHSST LIM.
The 100-S version was extensively tested on the CHSST test track in Nagoya during the1991-1992 period by the Japan Transportation Economics Research Center, AichiPrefecture [1]. With respect to the propulsion system, the testing was all accomplishedon the 100-S vehicle, as that was the only vehicle in existence during the test period. The100-L vehicle was introduced in 1994 and supposedly takes advantage of the testexperience gained on the 100-S vehicle.
6.2 Design Basis
6.2.1 System Level Requirements
Table 6-1 summarizes the CHSST principal top-level system requirements with respect topropulsion system design criteria as described in MUSA Report No.1 [3], and assupplemented by the information received during the FTA’s team visit to Chubu.
Table 6-1. Selected Propulsion Related Operational Characteristics
Characteristic Specification 100-L Specification 100-SPotentialCapability
Maximum Operating Speed 27.8 m/s (100kph) 30.6 m/s (110kph) 36.1 m/s(130 kph)
Maximum Initial Acceleration 1.11 m/s2 (4.0kph/s) 1.25 m/s2 (4.5kph/s) 1.6 m/s2
(5.8 kph/s)Maximum Gradient 7% 7%
Maximum Headwind 25 m/s 25 m/sMinimum Horizontal Curve Radius 50 m R 25 m R
Minimum Vertical Curve Radius 1500 m R 1000 m R

6-2
As shown in the above table, the maximum speed capability for the 100-L vehicle, aspublished in the MUSA report [2]is 100 kph. For the 100-S vehicle it is 110 kph asdescribed in the Aichi Prefecture report. These speed capabilities were modified byCHSST during our visit where it was stated that each vehicle was designed to and couldachieve a maximum speed of 130 kph. Acceleration performance capability was alsoupgraded during our visit to 1.5-1.6 m/s2. However, the break point speed, the speedwhich transitions from the constant thrust regime to a speed-dependent one, would haveto occur at a lower speed setting than is currently published.
6.2.2 Vehicle Requirements
Table 4-1 in Chapter 4 summarized the CHSST vehicle dimensions and weight. Table6-2 reproduces the vehicle characteristics for convenience as they relate to propulsionsystem requirements.
Table 6-2. Selected Vehicle Characteristics
Characteristic 100-S Specification* 100-L Specification*Vehicle Dimensions 8.5 m long
2.6 m wide3.36 m high
14.0 m long2.6 m wide3.2 m high
Empty Weight 9 tonnes 17.5 tonnes
Maximum Loaded Weight 15 tonnes 28.0 tonnes* “A” type or end/control vehicle
The small differences in vehicle height between the 100-S and 100-L vehicles is probablymore the result of the age differences between these two vehicles, and also that the 100-Swas probably originally built as a test vehicle, whereas our understanding of the 100-L isthat it is a passenger carrying prototype. For the analyses to follow it will be assumedthat both versions will have the same height of 3.2 m. The maximum weights given inthe table are most likely more related to levitation limits rather than to propulsion relatedissues.
6.2.3 Drag Resistance Requirements
Table 3-1 of the Aichi Prefecture report contains Chubu’s estimate of the dragcharacteristics for the HSST 100-S vehicle. The drag estimates were apparently based onthe tests conducted on the 100-S vehicle, which are summarized in that section of thetable. As shown, separate analytic models were empirically developed for each of themajor drag components, namely magnetic, power collector, and aerodynamic drag. Themodeling equations, on a per vehicle basis and when converted to metric SI units are asfollow. In these equations W is the weight of the train in metric tonnes, V is the speed ofthe train in m/s, and N is the number of vehicles in the train.
Magnetic Drag. The magnetic drag force (in newtons) is given by two differentrelationships and depends on whether or not the train speed is greater than 5.6 m/s(20 kph) and is estimated as:

6-3
Dm=3.354⋅W⋅V for 0£V<5.6 m/s (6-1)Dm=(18.22+0.074⋅V)W for V≥5.6 m/s (6-2)
Power Collector Drag. The power collector has been determined to have an approximateconstant drag resistance value and is estimated as:
Dc=41.67 (newtons) (6-3)
Aerodynamic Drag. The aerodynamic drag, which depends on both frontal area andtrain length, is estimated (for zero headwind) as:
Da=(1.652+0.572⋅N)V2 (newtons) (6-4)
Using the perhaps more familiar form for Da as Da=0.5rACdV2 where A is the frontal
cross sectional area of the vehicle and Cd is the composite aerodynamic drag coefficientincluding the effects for both frontal and total wetted area, one can then estimate Cd fromthe data given in Table 3-1. For a cross sectional area of the HSST 100 of about 8.6 m2
and for an assumed value of the air density coefficient r of 1.225, we then get anestimated value of Cd as 0.443, which seems to be a reasonable coefficient based on theoverall shape of the vehicle.
Composite Drag. From the above components we can then write for the case of zerogradient and zero headwind the composite drag as:
D=Dm+Dc+Da (newtons) (6-5)
Figure 6-1 provides the estimated drag resistance and mechanical output power for a two-vehicle 100-S train, and Figure 6-2 provides similar data for the two-vehicle 100-L train.Two-vehicle trains are considered here, since based on the equipment layout distributiondescriptions provided to us the minimum sized consist appears to be a two-vehicleconsist. Because of equipment layout the current 100-type versions are not intended tooperate as single vehicles. As seen from the data, the magnetic drag is dominant for lowspeed operation and as to be expected the aerodynamic drag dominates at the higherspeeds. These two drag resistance components also are roughly equivalent for speeds inthe range of 10-13 m/s. At the 28m/s point (100 kph) the required mechanical outputpower is 71 kW and 78 kW respectively for the 100-S and 100-L 2-car trains.
Accounting for a positive gradient we would need to add to the composite drag D, theterm DG=N(M⋅g)sin(q) where M is the mass of the vehicle in kg, g is the accelerationconstant due to gravity, and q=tan-1(G/100) where G is the gradient expressed as apercentage. Accounting for headwind, the Da term would have to be modifiedaccordingly by adding the headwind H in m/s to the vehicle velocity term, V. Theimpacts of these two effects will be discussed further on.

6-4
Drag Resistance(100S Two-Car Train)
0
500
1000
1500
2000
2500
3000
3500
4000
4500
0 10 20 30 40
Speed (m/s)
Dra
g (
N)
MagDrag
PwrColDrag
AeroDrag
AggrDrag
Mechanical Output Power(100S Two-Car Train)
0
20
40
60
80
100
120
140
160
0 10 20 30 40
Speed (m/s)
Po
wer
(kW
)
Power
Figure 6-1. Drag and Power Characteristics of the CHSST 100-S

6-5
Drag Resistance(100L Two-Car Train)
0
500
1000
1500
2000
2500
3000
3500
4000
4500
0 10 20 30 40
Speed (m/s)
Dra
g (
N)
MagDrag
PwrColDrag
AeroDrag
AggrDrag
Mechanical Power Output(100L Two-Car Train)
0
20
40
60
80
100
120
140
160
180
0 10 20 30 40
Speed (m/s)
Po
wer
(kW
)
Power
Figure 6-2. Drag and Power Characteristics of the CHSST 100-L

6-6
6.3 Propulsion Requirements and Characteristics
6.3.1 System Configuration
The CHSST is configured with two single-sided linear induction motors (LIM) each builtup from modules with a resultant series-parallel configuration. The LIM stator is aconventional laminated iron structure with aluminum windings. The guideway mountedreaction rail is a thin aluminum plate with back iron. The back iron is also part of themagnetic circuit for both guidance and levitation. A cross-section view of the LIM statorand reaction rail is shown in the Aichi Prefecture report. The 100-L vehicle has fivemodules per side and the 100-S vehicle has three modules per side. Each LIM sectionweighs 175 kg and has a nominal rating of 130 kVA. The IGBT power electronicsinverter for powering the LIM weighs 400 kg and is configured as a two-section inverterfor each 100-L vehicle and as one two-section inverter for each pair of 100-S vehicles.The LIM and its power electronics represent less than 15% of the vehicle weight.
The nominal air gap for the LIM is about 14 mm between the bottom of the stator surfaceto the top of the reaction rail surface. Estimated improvements in performance withreduced gaps are reported in a section of Table 3-1 of the Aichi Prefecture report. Anestimated improvement of 3-4% increase in thrust is estimated for each mm reduction ingap. For example, reducing the LIM gap from 14 mm down to 10 mm (which wouldtranslate to a corresponding increase in the levitation gap of from 6 mm to 10 mm) shouldincrease thrust capability by about 15%, but at a cost of additional levitation power.
6.3.2 LIM Design Requirements
The design criteria for the LIM requires that it be capable of developing the minimumthrust required to satisfy the requirements calculated in Equation (6-5), given theavailable installation and size and weight constraints of the vehicle. Additionally,maximum headwinds as well as grade climbing capability must be factored into theLIM’s design requirements. Table 6-3 lists some of the key selected performancecharacteristics and corresponding thrust force requirements for the 100-L three-vehicletrain assuming a maximum speed of 36.1 m/s (130kph) and the other requirements aslisted in Tables 6-1 and 6-2 above.
Table 6-3. Selected Thrust Force Requirements for the 100-L Three-Vehicle Train
Characteristic Value Required Thrust Force (N)Max Initial Acceleration 1.11 m/s2 (4.0kph/s) 84,900Max Speed @ 25m/s Headwind 36.1 m/s (130 kph) 12,530Grade Climbing Capability 7% 53,495
A LIM and its associated power electronics sized for simultaneously meeting all of theabove requirements would have to produce a thrust force of more than 150 kN.However, because of size, weight, and cost considerations the more conventional design

6-7
approach is to size the LIM for high thrust at low speeds and for high power at the higherspeeds. Grade climbing capability tends to complicate this somewhat, particularly whenhaving to design for constant speed operation while on a gradient.
6.3.3 Performance Capability and Operating Characteristics
MUSA report [2] contains a LIM thrust capability curve for the 100-L vehicle for a 3-cartrain with a maximum weight of 78 tonnes. That curve is replicated here in Figure 6-3 asthe “MaxThrust” curve. As shown, the curve has an approximate constant thrust ofnearly 90 kN out to a speed of about 11 m/s (40 kph) and then the thrust falls offexponentially as shown.
Also shown in this figure is the curve captioned, the “TotalDrag” curve. This curveincorporates all of the elements given in Equation (6-5). It also includes the effect of aheadwind condition of 25 m/s, but does not include the effects of a gradient. The curve,captioned here as the “AccelCap” curve, is the accelerating capability of the LIM takinginto account all of the drag resistance requirements contained in the “TotalDrag” curve.The LIM develops sufficient thrust force to meet or exceed the 0.113g requirement givenin the above table and can do so out to about 5 m/s (18 kph). Out to speeds of about13 m/s (47 kph) the acceleration capability meets or exceeds 0.1 g.
At the extended 36 m/s (130 kph) point the thrust capability just meets the thrustdemanded for operation with only a small accelerating capability remaining. Again all ofthe results discussed here are for operation on a zero gradient.
CHSST Maximum Thrust-Acceleration Capability(100L Three-Car Train)
0
10000
20000
30000
40000
50000
60000
70000
80000
90000
100000
0 5 10 15 20 25 30 35 40
Speed (m/s)
Th
rust
(n
ewto
ns)
0
0.02
0.04
0.06
0.08
0.1
0.12
0.14
Acc
eler
atio
n (
g)
TotalDrag (N)
MaxThrust (N)
AccelCap (g)
Figure 6-3. CHSST 100-L Maximum Thrust-Acceleration Capability

6-8
6.3.4 LIM Power Characteristics
Selected LIM input electrical characteristics for the 100-L three-vehicle train are given inMUSA Report No. 1. Figure 6-4 shows the mechanical output power capability (kW)and the corresponding required input power in kVA for the maximum thrust condition.
As seen from Figure 6-4, the CHSST propulsion system does not operate in a constantpower regime beyond the breakpoint. speed point shown. This is apparently theconsequence of how the LIM is controlled. The LIM operates in a variable voltage-variable frequency mode, for which there are at least two control philosophies that can beapplied. One control approach is to operate with a constant percentage slip, which istypified by a constant volts/hertz mode of operation. The other approach is to operatewith a constant slip frequency. The CHSST operates in this second mode with the furtherconstraint that the maximum input voltage to the LIM is reached at the breakpoint speed.The consequence of all of this is that as shown in Figure 6-4, the LIM does not operate ina constant power mode beyond the breakpoint speed and in fact its maximum power pointoccurs at the breakpoint.
Maximum Capability Power Characteristics100L Three-Car Train0500100015002000250030000510152025303540Speed(m/s)
Po
wer
(
kVA
,kW
)
Input (kVA)Output (kW)
Figure 6-4. Maximum Capability Power Characteristics for 100-L Three-Car Train
The data contained in the MUSA report is not sufficient to enable one to discuss theefficiency and power factor characteristics of the CHSST LIM. However, during our

6-9
meeting with Chubu, a maximum capability performance table for the 100-S LIM wasmade available to the FTA team. Figure 6-5, which has been derived from that tableshows the power characteristics for a single LIM section for the 100-S vehicle, and it isour understanding the LIM used on the 100-L is similar to it.
As shown here, the input and output power characteristics are similar to those discussedearlier for the 100-L. Note also that Figure 6-5 does show Chubu’s estimates of LIMpower factor and efficiency. The shapes of these curves are typical for the LIM; that is,a maximum power factor at zero speed and then decreasing with increasing speed (load),and an efficiency that increases with speed (load). More specifically for the CHSST LIMand at the design point speed of 110.0 kph (30.6 m/s), the estimated power factor andefficiency are 57% and 75% respectively.
CHSST 100S LIMPower Characteristics0.0020.0040.0060.0080.00100.00120.00140.000.005.0010.0015.0020.0025.0030.0035.00Speed (m/s)
Po
wer
(
kVA
,kW
)
0.0010.0020.0030.0040.0050.0060.0070.0080.0090.00
Eff
icie
ncy
, Po
wer
Fac
tor
(%)
Output (kW)Input (kVA)Efficiency (%)PowerFactor(%)
Figure 6-5. CHSST 100-S LIM Power Characteristics
6.4 Power Supply and Collection
6.4.1 Configuration
The CHSST operates with a DC power supply connected to solid trolley rails. Thenominal trolley rail voltage is 1500 Vdc. The propulsion system is capable of operationwith trolley rail voltages down to 900 V where system shutdown is supposed to occur.Based on the data made available for our review, full system performance should beavailable with a trolley rail voltage drop of about 400 V (more than a 25% voltage drop)from the nominal voltage setting.

6-10
Based on the data made available for our review, full system performance should beavailable with a trolley rail voltage drop of about 400 V (more than a 25% voltage drop)from the nominal voltage setting. Operational capability over this voltage range isconsistent with other modern dc transit systems and should also work for well spaced outrectifier traction substations. The trolley rails are insulated above ground and areexposed on each side of the guideway beam. For minimum wear, the trolley rails usestainless steel cladding over the aluminum conductors.
The power collectors, one for each of the insulated power rails, are located on eachvehicle and consist of a set of contact brushes. The CHSST power collectorconfiguration represents relatively standard technology for contact power collection, soachieving speeds of up to 160 kph (44.4 m/s) and well beyond does not represent anyparticular technological challenge. Input L-C filters are located on the vehicle at theinput to the LIM inverter. These weigh about 240 kg; for the 100-L configuration onefilter has the storage capacity to handle a three-car train. For the 100-S configuration,one filter can handle the storage capacity requirements for a four-car train.
6.5 U.S. Mandatory and FTA System Requirements
With respect to the mandatory requirements of fire safety, noise, magnetic andelectromagnetic fields, ADA, etc., most of these are system level issues with no directimpact to the propulsion system. As part of MUSA’s Americanization effort of theCHSST, the propulsion system would be expected to meet those codes and standards asoutlined in MUSA Report No. 2 [5]. A comparative review of the current Japanese codesand standards, for which the existing CHSST is built, would seem to be beyond the scopeof the evaluation being discussed here.
Table 6-4 summarizes the pertinent FTA system requirements, as they would relate topropulsion system design criteria. These requirements include not only speed relatedparameters—speed, acceleration and jerk—but also environmental/guideway constraintsthat influence propulsion system sizing and performance. The FTA requirements asshown were originally developed as a generic set of specifications intended to satisfy abroad set of urban type applications and was most likely not intended to be a firm set ofrequirements to be universally applied. It should be understood that these requirementsmay need to be modified to meet any site-specific topography and urban applicationconstraints. As described in Chapter 4, an urban application with long distances betweenstations would certainly want to exploit the high-speed, high acceleration capabilitywhereas a dense urban environment with close station spacing would make more use ofthe need for a tight turn radius and a lesser need for high-speed performance.Additionally, since grade climbing capability is perhaps one of the most demandingrequirements in propulsion system sizing, having grade climbing capability in apropulsion system would make sense only for those systems that would require it.

6-11
Table 6-4. FTA System Requirements for Propulsion Sensitive Parameters
Parameter FTA Requirement CHSST 100-L CHSST 100-S
Maximum Speed 160 kph 100 kph 110 kphLongitudinal Acceleration 0.16g 0.11g 0.13gLongitudinal Jerk 0.10 g/s 0.08 g/s 0.08 g/sGrade Climbing 7% full performance 7 % 7%
Horizontal Curves 18.3 m 50 m 25 mVertical Curves 1000 m 1500 m 1000 mHeadwind 50 kph full performance
80 kph ride comfort threshold90 kph 90 kph
The data shown for the CHSST 100-L and CHSST 100-S are those that have beenpublished in the references cited in this report. With respect to maximum speed, the FTAteam was informed during the Chubu site visit that both the 100-L and 100-S weredesigned for a speed of up to 130 kph. The thrust capability analysis done and reportedon here has shown that each system can operate at or near such a speed. The team alsowas informed that increasing the speed to the 160 kph range would require a substantiallynew design.
Similarly, the team was informed that acceleration performance also could be increasedto the 0.16 g limit with the understanding that the breakpoint speed from constant thrustto variable thrust would have to be reduced to stay within the power limits of the inverter.Although such a change appears to be a logical one, Chubu should provide the modifiedthrust performance curves. Changes to increase the jerk limit capability would appear tobe a control system adjustment problem and should be achievable, but needsconfirmation. The suitability of an equal value deceleration, for service brakingcapability, should also be confirmed, and is discussed further in Chapter 7.
6.6 Evaluation and Issues
6.6.1 Overall Observations and Impressions
The HSST is a mature technology at least with respect to the propulsion system. Linearinduction motor propulsion was developed, demonstrated and evaluated more than aquarter century ago for both high-speed and low-speed transportation systems.Numerous test track and exposition-type systems for urban applications have beendemonstrated. The power electronic controls also have matured during this time intervaland such systems are now widely utilized in many industrial applications. As such, thereis little technical risk to the eventual wide-scale deployment of LIM systems in an urbantransit setting. The deployment issue is that a comprehensive set of system requirementsmust be known and understood and adequately defined in order to properly size thepropulsion elements of the system.

6-12
The test program conducted by the Aichi Prefecture appears to have been acomprehensive program and seems to have addressed all of the key propulsion systemissues. Unfortunately, the summary nature of the document provided to the FTA team toreview has enabled only a cursory review of CHSST testing, as the report itself does notcontain any of the source data, test results and subsequent analyses referred to in thesummary report. Also, since all of the testing conducted and reported on has been withthe limited size Nagoya test track, the opportunity for endurance type testing wouldappear to have been limited.
The observations made at the site visit in Nagoya were helpful in gaining a betterunderstanding of CHSST and some key observations follow. With respect to thepropulsion system it was noted that the test vehicle could not maintain its speed while onthe 6-7% gradients of the test track. This will be discussed further in this evaluation.Noticeable jerk sometimes occurred during initial acceleration on some of the test rides,but this may have been more attributable to driver action rather than with problems withthe control system per se. Nevertheless, appropriate jerk limits on acceleration will needto be demonstrated.
Power collector noise appeared to be minimal during our viewing of vehicle-passingtests. However, the power or trolley rails are exposed as they are on the outboard sides ofthe guideway. These rails are located along each outside surface of the guideway girdersand under the running surface. This may require some sort of guarding to prevent thepossibility of electric shock in those locations where the guideway may becomeaccessible to the public.
6.6.2 Linear Induction Motor Operating Characteristics
As noted here, the single-sided LIM with back iron develops an attractive force betweenthe LIM surface and the reaction rail. As a point of reference, the LIM capabilities tablefor the single LIM section previously discussed shows a maximum thrust force of about3234 N and a concurrent lift force of about 1860 N. Furthermore, this 57% ratio of lift tothrust force is relatively constant over the entire speed-thrust range shown in the table.Because of the way propulsion and levitation are configured, the lift force produced bythe LIM is in a direction to oppose the levitation force, thus requiring the levitationsystem to buck out the LIM lift force. The net effect of this is that the LIM lift forcereflects itself as a slight increase in vehicle weight as far as the levitation system isconcerned. It is unknown the extent to which Chubu has investigated whether anorientation change to the installation of the LIM, in order to provide an assist to lift,would be beneficial or not. Additionally, any changes in the nominal air gap on either theLIM or levitation side would affect this aspect.
Also as noted here, the control philosophy chosen for the LIM of the CHSST is to operatethe LIM in a constant slip frequency mode as opposed to a constant slip mode. Althoughthese sound the same they are really quite different. The constant slip frequency moderuns at certain slip frequency such as12 HZ, and this frequency is held constant throughthe operating frequency (and speed) range. In the constant slip mode, for example a 10%

6-13
slip results in a variable slip frequency whose value depends upon what the operatingfrequency happens to be. At this point in the evaluation, we have been unable to reviewProf. Nonaka’s published work on the CHSST LIM development and the rationale forChubu adopting the constant slip frequency control philosophy. Its choice may havecompromised the performance capability of the LIM, although that is not known with anycertainty. It would appear that operating the LIM in a constant slip and constantvolts/hertz mode should enable the LIM to produce a constant output power above themaximum thrust breakpoint rather than the decreasing power characteristic that is shownin Figure 6-5 above. However, to exploit this constant Volts/Hertz mode and still use theexisting LIM requires a power supply voltage closer to 3 kV rather than the current1.5 kV supply. Further comments on this would really require a more thorough review ofthe design basis for the LIM and its controls and further discussions with Chubu.
6.6.3 Grade Climbing Capability
The presently configured CHSST has limited constant speed-grade climbing capability.Figure 6-6 illustrates this problem. The total drag resistance shown here is for the 100-Lthree-car train for the case of a 25 m/s headwind. The “TotalDrag” curve shown here isrepresented by Equation (6-5) for the case of a 25 m/s headwind and should represent aworst-case condition. Note that steady-state operation will occur where the total dragcurve intercepts the maximum capability curve. For a grade of 2% that intercept occursat slightly more than 26 m/s (94 kph). This means that if a vehicle is operating at anyspeed greater than that speed, the vehicle would have to slow down until it intercepts themaximum drag curve, which of course is the only stable operating point. Some samplecases for other grades are shown in Table 6-5.
CHSST Maximum Thrust-Grade Climbing Capability(100L Three-Car Train)01000020000300004000050000600007000080000900001000000510152025303540Speed (m/s)
Th
rust
(
new
ton
s)
TotalDrag (N)MaxThrust (N)
Figure 6-6. Maximum Thrust-Grade Climbing Capability for a 2% Grade

6-14
Table 6-5. Grade Climbing Capability for the CHSST 100-L Three-Car Train*
Grade (%) Steady-State Speed1 30 m/s (108 kph)2 26 m/s (94 kph)3 23 m/s (83 kph)5 19 m/s (68 kph)7 15 m/s (54 kph)10 12 m/s (43 kph)
*25 m/s headwind
As shown here the steady-state velocity for a 7% grade is only 15 m/s (54 kph). Underconditions of no headwind, as expected, the steady-state operating point increases onlyslightly to about 16 m/s. This means that the CHSST in its present configuration is notlikely to be suitable for a hilly corridor if higher speed operation on the corridor isrequired. Several possible solutions to providing more grade-climbing headwindcapability would include operating the LIM in a constant power mode. For this particularcase the peak power developed at the breakpoint as shown in Figure 6-5 is slightlygreater than 1000 kW compared to the 650 kW being developed at 15 m/s for the presentcontrol approach. For the hilly corridor situations, one should also consider thepossibility of using a copper winding for the LIM rather the presently used aluminumwinding, as well as possibly also increasing the power capacity of both the LIM and theinverter.
Although not explicitly stated in the FTA requirements, vehicle weight is perhaps one ofthe most critical elements of a maglev system, particularly to a system with onboardpropulsion. The 100-L has a 17,500 kg single-vehicle weight and for the 100-S acorresponding weight of 9,000 kg. These weights in conjunction with their payloadweights of 10,500 kg and 6,000 kg respectively impose severe design constraints on boththe propulsion and levitation systems. Any weight reduction that can be achieved withthe vehicle has a multiplier effect on both levitation and propulsion, since a vehicleweight reduction can also reduce the weight of levitation and propulsion, which in turnmeans a further reduction in overall vehicle weight.
The CHSST vehicles, given their overall size, exclusive of levitation and propulsion,appear to be heavy for maglev systems. In order to meet U.S. mandatory and FTAperformance requirements, Americanization of the CHSST will not only be desirable butmay be required. Any planned Americanization effort of CHSST should addressinnovative vehicle designs that have significant weight reduction as an objective, as wellas meeting any crashworthiness requirements as an additional factor.

7-1
7 Braking System
7.1 Braking Modes
The CHSST has three independent and redundant braking modes and utilizes bothelectrical and mechanical brakes. These brakes operate either independently or inconjunction with each other. The first braking mode is electric service braking using theLIM, and the second is the hydraulically controlled mechanical brakes. The third brakingmode is on the landing skids, in which the vehicle is de-levitated. This normally occursonly in the event of an emergency, where all other brakes have either failed or are notavailable.
The electric service brakes themselves operate in one of two modes dependent uponvehicle speed. The first mode is the regenerative mode, which normally operates at thehigher vehicle speeds and the second mode is the dynamic brake mode, which normallyoperates at the lower speeds. In the regenerative mode, the energy produced by thekinetic energy of the vehicle is converted into electrical energy and is transferred to thetrolley rails and power supply for use by other electric loads. In this mode, the linearinduction motor (LIM) is controlled to operate as an electric generator convertingvehicle’s mechanical energy into electrical energy. In the dynamic braking mode, energyis supplied by the power supply and trolley rail and is dissipated within the LIM, whichoperates in the plugging or reversed phase mode.
The mechanical brakes are hydraulically controlled caliper brakes in which redundantand independently controlled hydraulic power sources are located on each vehicle. Thecalipers grip the outer rail flange. One of the hydraulic power sources is used for normalservice braking and the other as an emergency back-up power source. The mechanicalbrakes are also used as the parking brake.
From high-speed operation, the normal braking sequence is to first apply electric brakes.At a lower speed the mechanical brakes are blended in and braking becomes fullymechanical at very low speeds. The various speeds at which these braking sequencesoccur are based on the relative energy efficiency as well as the effectiveness of eachbraking mode and will be further discussed in this section.
7.2 Design Basis
7.2.1 System Level Requirements
Table 7-1 summarizes the CHSST principal top-level system requirements with respect tothe system braking design criteria as described in MUSA Reports [2, 3], and assupplemented by the information received during the FTA’s team visit to Chubu. Therequirements as shown are applicable for all of the operational and environmentalcharacteristics previously discussed in Section 6 above.
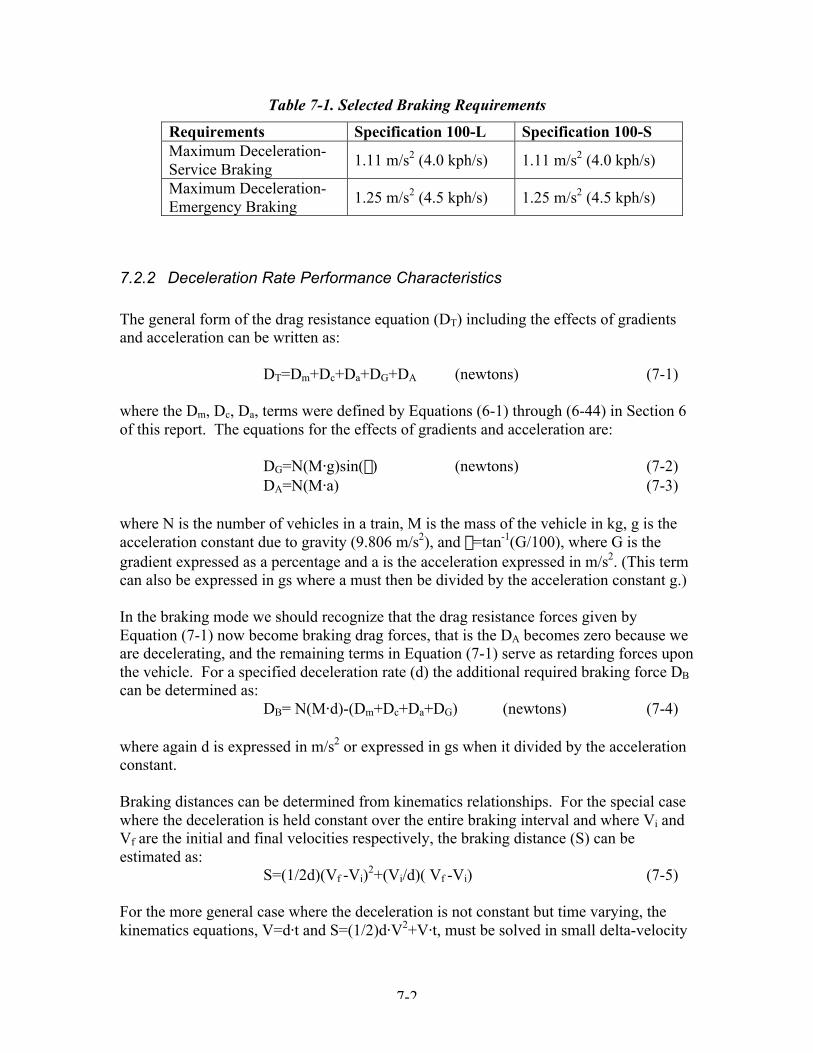
7-2
Table 7-1. Selected Braking Requirements
Requirements Specification 100-L Specification 100-SMaximum Deceleration-Service Braking
1.11 m/s2 (4.0 kph/s) 1.11 m/s2 (4.0 kph/s)
Maximum Deceleration-Emergency Braking
1.25 m/s2 (4.5 kph/s) 1.25 m/s2 (4.5 kph/s)
7.2.2 Deceleration Rate Performance Characteristics
The general form of the drag resistance equation (DT) including the effects of gradientsand acceleration can be written as:
DT=Dm+Dc+Da+DG+DA (newtons) (7-1)
where the Dm, Dc, Da, terms were defined by Equations (6-1) through (6-44) in Section 6of this report. The equations for the effects of gradients and acceleration are:
DG=N(M⋅g)sin(q) (newtons) (7-2)DA=N(M⋅a) (7-3)
where N is the number of vehicles in a train, M is the mass of the vehicle in kg, g is theacceleration constant due to gravity (9.806 m/s2), and q=tan-1(G/100), where G is thegradient expressed as a percentage and a is the acceleration expressed in m/s2. (This termcan also be expressed in gs where a must then be divided by the acceleration constant g.)
In the braking mode we should recognize that the drag resistance forces given byEquation (7-1) now become braking drag forces, that is the DA becomes zero because weare decelerating, and the remaining terms in Equation (7-1) serve as retarding forces uponthe vehicle. For a specified deceleration rate (d) the additional required braking force DB
can be determined as:DB= N(M⋅d)-(Dm+Dc+Da+DG) (newtons) (7-4)
where again d is expressed in m/s2 or expressed in gs when it divided by the accelerationconstant.
Braking distances can be determined from kinematics relationships. For the special casewhere the deceleration is held constant over the entire braking interval and where Vi andVf are the initial and final velocities respectively, the braking distance (S) can beestimated as:
S=(1/2d)(Vf -Vi)2+(Vi/d)( Vf -Vi) (7-5)
For the more general case where the deceleration is not constant but time varying, thekinematics equations, V=d⋅t and S=(1/2)d⋅V2+V⋅t, must be solved in small delta-velocity

7-3
increments by setting Dt=(Vf -Vi)/davg where davg is the average deceleration rate over asmall (Vf -Vi) interval.
7.2.3 Electric Braking Requirements and Characteristics
The electric braking characteristics of the LIM for a particular braking rate of 3.0 kph/s(0.085g) are given in MUSA Report [2] for a 78 metric tonne, 100-L three-car train.They are summarized here in Figure 7-1(a). The curve shown here is for the assumptionthat electric braking is being utilized throughout the entire speed regime and is for thecase of a constant LIM current of about 300 A. As seen in the figure, the braking thrustcapability curve varies from about 63 kN (14,180 lb) at 30.6 m/s (110 kph, 68 mph) toabout 68 kN (15,300 lb) at zero speed. Also shown on the figure is the three-car traindrag resistance for a 25 m/s headwind and zero gradient previously discussed in Section6. The net difference between these two curves is the braking thrust curve (captioned as“Braking Thrust”), which varies from about 57 kN (12, 800 lb) at the highest speedshown of 36.1 m/s up to the 68 kN point at zero speed. The calculated deceleration rateshown here is approximately 0.09g over the entire speed range and slightly exceeds thespecified 0.0856 g rate.
Figure 7-1(b) shows the mechanical output power required for the braking rate specifiedabove. This power varies from just under 2000 kW at the 110 kph speed point down to 0kW at zero speed. As shown, the input electrical power demand in kVA is eithernegative for regeneration where power is flowing from the inverter to the power rails andon to the rectifier substation for use by other loads, or is positive for dynamic (plugging)braking where power is being drawn from the rectifier substation and is consumed in theLIM. At the 110 kph speed point the power demand is nearly -8000 kVA (regenerative)and at the zero speed point is nearly +5000 kVA (dynamic).
The speed where the power demand approaches zero is at the approximate 38 kph speedpoint where the braking profile transitions from regenerative to dynamic. Since the LIMfunctions as an induction generator during regeneration it requires a source of excitation,which in this case is derived from the LIM inverter and vehicle input filter. It should benoted that different inverter-filter characteristics would result in different transition speedpoints. Extrapolating the data shown here to the Chubu specified maximum decelerationof 0.127g (4.5 kph/s) would result in a maximum braking power demand of more than2400 kW at the 110 kph speed point and an input power requirement varying betweenabout –9000 kVA for regenerative braking to about +6000 kVA for dynamic brakingassuming no change in LIM excitation.

7-4
CHSST Braking Capability(100L Three-Car Train)
0
10000
20000
30000
40000
50000
60000
70000
80000
0 5 10 15 20 25 30 35 40
Speed (m/s)
Th
rust
(N
)
0.05
0.06
0.07
0.08
0.09
0.1
0.11
0.12
0.13
0.14
0.15
Dec
eler
atio
n (
g)
DragResistance
BrakeThrustCap
BrakingThrust
DecelCap (g)
(a)
Braking Power Characteristics100L Three-Car Train
-10000
-8000
-6000
-4000
-2000
0
2000
4000
0 5 10 15 20 25 30 35 40
Speed (m/s)
Po
wer
(kV
A,k
W)
Sinput (kVA)
Pbrake (kW)
(b)
Figure 7-1. Braking Characteristics for the 100-L Three-Car Train

7-5
7.2.4 Mechanical Brake Requirements and Characteristics
Although intended to operate as a supplement to the electric brakes, the mechanicalbrakes are designed to have the capability to repetitively and safely stop a vehicle frommaximum speed. At some minimum speed point where electric braking loses itseffectiveness and is disengaged, the mechanical brakes then are intended to function asthe sole means for safe braking. As stated in the Aichi Prefecture report [1], allowablebrake pad wear of the caliper brake pads is 5 mm, and the allowable wear for theemergency landing copper powder alloy skid is 2 mm.
The mechanical braking system consists of calipers that clamp on to the vertical surfacesof the reaction rail iron. As described in MUSA Report [2], the calipers are hydraulicallycontrolled and the system operates with brake pressure control. The hydraulics operate ata pressure of 210 kg-f/cm2 (2990 psi). The hydraulic section principal componentsconsist of the hydraulic pump, primary and standby accumulators, and pressure controlsection. The hydraulic pressure range is design to operate between 185 kg-f/cm2 and210 kg-f/cm2 (2630-2990 psi). The pressure control section has three major elements;service brake pressure control, emergency brake pressure control and standby brakepressure control. Pressure switches are installed at the accumulators and regulate thepressure levels of both the primary and standby hydraulic systems. For the 100-Lconfiguration, six of the ten LIM modules are equipped with the caliper brakes and forthe 100-S four of the six modules are so equipped.
7.3 Operational Experience
According to the Aichi Prefecture report [1] CHSST braking performance wasextensively tested and reported on in several sections of Table 3-1 of the report. Thefollowing summarizes the relevant CHSST test experience.
Electric Brakes. Reported braking deceleration rates from high-speed operation appear tobe affected by LIM end effects, although the extent to which this effect impacted brakingperformance was not elaborated upon. For a fully loaded (100-S) vehicle, initialdecelerations achieved varied from 4.3-4.4 kph/s (0.122-0.125g) from 100 kph speeds.Below 50 kph and with supplemental mechanical braking applied, higher decelerations of6.5 kph/s (0.18 g) were reported.
Decelerations of about 0.14 g at 95 kph were reported for the empty vehicle condition.Reference also was made to some LIM control issues, the need to limit LIM current (andthus limit braking effort), and concerns about trolley voltage magnitude increases atspeeds approaching 100 kph.
Performance for the emergency braking mode in which both electrical and mechanicalbrakes were used indicated an achieved deceleration rate in the range of 5.4-5.7 kph/s(0.153-0.162g) from speeds of 100 kph and corresponding braking distances of 250 m orless. Similar results were reported for the case where emergency braking was achievedwith the electrical brakes disabled and only the mechanical brakes being available.

7-6
Mechanical Brakes. Tests were conducted to simulate electrical brake failure where allbraking then relied upon the mechanical system. For a fully loaded vehicle (100-S)condition and at 100 kph, a braking distance of 299 m (987 ft) and an averagedeceleration of 4.65 kph/s (0.132 g) were reported. Similar test results were reported foran empty vehicle condition.
Brake pad wear from 100 kph braking speeds was reported to vary from 0.06 mm to0.76mm depending on the specific location on the vehicle of the brake pads. The averagewear for an emergency braking cycle was found to be about 0.18 mm. Although thiswould enable 28 emergency braking cycles based on the 5 mm wear rate design criteria,CHSST adopted the number of allowable emergency braking cycles before brush change-out to be about 18 cycles.
Landing Skids. Wear measurements for landing skid wear for a fully loaded (100-S)vehicle in a de-levitated condition was performed and showed that skid wear from anemergency braking operation from 100 kph to a full stop was about 0.71-0.75 mm percycle. This indicated that the CHSST could tolerate at least two emergency brakingcycles from a high-speed condition before requiring replacement of the skid wear surface.Emergency braking tests from speeds lower than the 100 kph condition showedsomewhat less wear on the skids. For example, the Aichi report states that in the speedrange of 10-49 kph up to 16 emergency braking cycles could be tolerated, but above 50kph not more than 2 cycles should be expected. Emergency braking deceleration rateswere not reported so the potential impact to passengers is unknown.
7.4 U.S. Mandatory Requirements and FTA System Requirements
As stated earlier, with respect to the mandatory requirements of fire safety, noise,magnetic and electromagnetic fields, ADA, etc., most of these are system level issueswith no direct impact to the braking system with the exception of safety. The brakingsystem is a safety critical system and its design and operation must be demonstrated to befail-safe. The nature of the independent and redundant brakes answers only a part of thesafety critical issue; as a minimum a systems safety assessment including a hazardsanalysis, and failure modes and effects analysis should be performed and the fail-safeoperation verified.
Table 7-2 summarizes the pertinent FTA system requirements, as they would relate tobraking system design criteria.
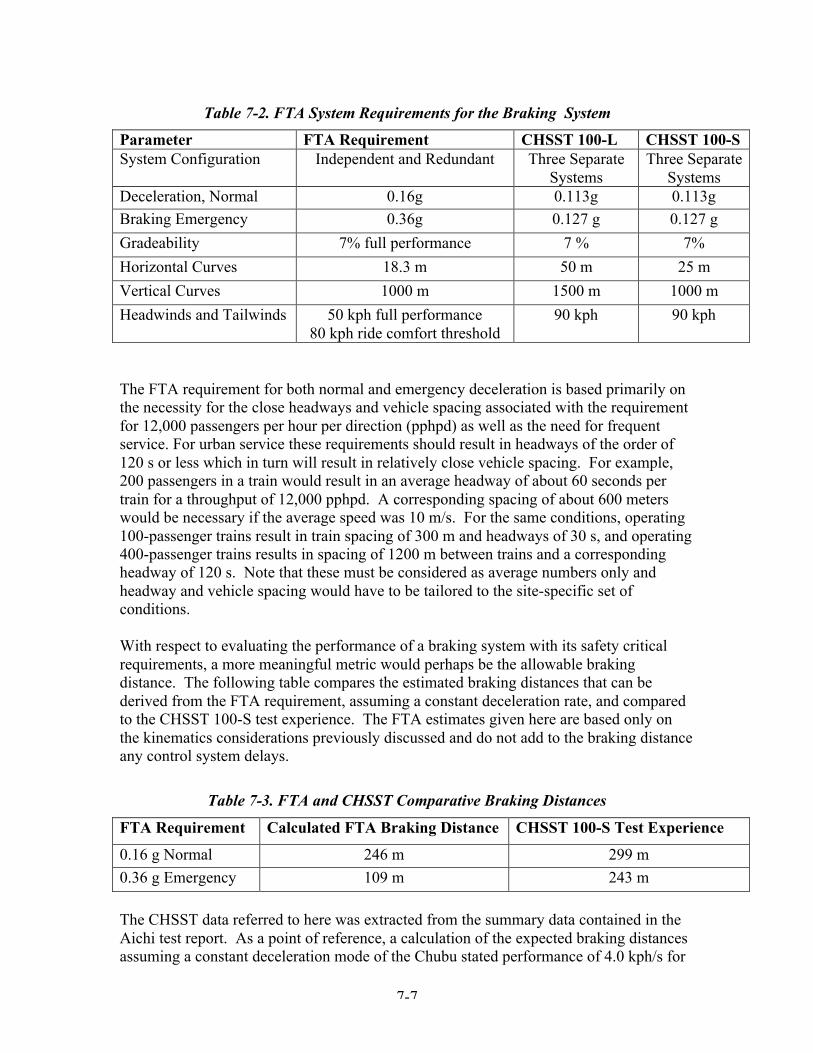
7-7
Table 7-2. FTA System Requirements for the Braking System
Parameter FTA Requirement CHSST 100-L CHSST 100-SSystem Configuration Independent and Redundant Three Separate
SystemsThree Separate
SystemsDeceleration, Normal 0.16g 0.113g 0.113g
Braking Emergency 0.36g 0.127 g 0.127 g
Gradeability 7% full performance 7 % 7%
Horizontal Curves 18.3 m 50 m 25 m
Vertical Curves 1000 m 1500 m 1000 m
Headwinds and Tailwinds 50 kph full performance80 kph ride comfort threshold
90 kph 90 kph
The FTA requirement for both normal and emergency deceleration is based primarily onthe necessity for the close headways and vehicle spacing associated with the requirementfor 12,000 passengers per hour per direction (pphpd) as well as the need for frequentservice. For urban service these requirements should result in headways of the order of120 s or less which in turn will result in relatively close vehicle spacing. For example,200 passengers in a train would result in an average headway of about 60 seconds pertrain for a throughput of 12,000 pphpd. A corresponding spacing of about 600 meterswould be necessary if the average speed was 10 m/s. For the same conditions, operating100-passenger trains result in train spacing of 300 m and headways of 30 s, and operating400-passenger trains results in spacing of 1200 m between trains and a correspondingheadway of 120 s. Note that these must be considered as average numbers only andheadway and vehicle spacing would have to be tailored to the site-specific set ofconditions.
With respect to evaluating the performance of a braking system with its safety criticalrequirements, a more meaningful metric would perhaps be the allowable brakingdistance. The following table compares the estimated braking distances that can bederived from the FTA requirement, assuming a constant deceleration rate, and comparedto the CHSST 100-S test experience. The FTA estimates given here are based only onthe kinematics considerations previously discussed and do not add to the braking distanceany control system delays.
Table 7-3. FTA and CHSST Comparative Braking Distances
FTA Requirement Calculated FTA Braking Distance CHSST 100-S Test Experience
0.16 g Normal 246 m 299 m
0.36 g Emergency 109 m 243 m
The CHSST data referred to here was extracted from the summary data contained in theAichi test report. As a point of reference, a calculation of the expected braking distancesassuming a constant deceleration mode of the Chubu stated performance of 4.0 kph/s for

7-8
normal deceleration and 4.5 kph/s for emergency deceleration would have resulted inestimated braking distances of 347 m and 308 m respectively, compared to the measuredvalues of 299 m and 243 m shown above. Therefore, the test data clearly demonstratesthat the deceleration profile is not constant but apparently increases with decreasingspeed, which seems to be consistent with the limited amount of information contained inthe Aichi report. It is assumed here that the expected braking performance of the 100-Lvehicle follows that of the 100-S version, although that should be verified.
Given the FTA requirements as stated above, there is a question as to the suitability of theCHSST for operation in the U.S. for the current “as is” design. It would appear that anupgrade in deceleration performance would have to be a necessary part of anAmericanization effort. As seen from the above discussion on electric braking, a simpleupgrading of the deceleration performance with the current design may require powerratings for both the LIM and its inverter that would probably be beyond the capability ofthe present design. Increasing deceleration performance of the LIM and its inverter willrequire a rather substantial increase in their power ratings and may well be beyond thatwhich is presently available. An alternative to this could be to make more extensive useof the mechanical brakes, but then the philosophy of the desired independent andredundant braking subsystems would have to be addressed.
7.5 Evaluation and Issues
• The brake performance test program conducted by the Aichi Prefecture appears tohave been a comprehensive program and seems to have addressed the key brakingsystem performance issues. Unfortunately, the summary nature of the documentprovided to the FTA team to review has enabled only a cursory review of CHSSTtesting, as the report itself does not contain any of the source data, test results andsubsequent analyses referred to in the summary report.
• Two principal observations were made as a result of our Chubu visit. The first is thequite noticeable noise of the caliper brakes when they engage and disengage thereaction rail iron surface when stopping on the 6-7% gradients. There was also anoticeable vibration when the brakes were released on the gradient and the vehiclebegan its initial movement. An explanation of this behavior by the CHSST/MUSAengineers is required.
• The second observation deals with the overall installation of the caliper brakes. Aspreviously stated these brakes, because of the inherent nature of the caliper-typedesign must surround and react in a pinching action against the vertical sides of thereaction rail iron. We were informed during our Chubu visit that the allowable lateraloffset of the reaction rail is only 2 mm, and this applies specifically to the verticalsurfaces of the reaction rail iron. We were also informed that this tolerance must bemaintained. The apparent reason for this is the concern that the caliper brake shoeswould suffer damage for larger lateral offsets, as a larger offset would interfere withthe brush assembly as the vehicle moves down the guideway. The cost implicationsto this design choice should be evaluated and perhaps alternative configurations

7-9
assessed. The effects on curve negotiation for small radii should also be included inthis assessment.
• The braking distance of the CHSST vehicles seems to be less than those implied inthe FTA requirement. An upgrade in the deceleration performance will be needed tosatisfy this FTA requirement. The upgrade does not seem to be straightforward, as itimpacts the LIM and inverter.


8-1
8 Automatic Train Operation
8.1 System Architecture
The Automatic Train Operation (ATO) system implemented at the 1.5 km Nagoya testtrack for the HSST-100 is a variant of the HSST-04 and –05 tested at the Saitama andYokohama Expositions. The HSST-05 was the first magnetically levitated trainauthorized to carry passengers in regular operations in Japan. This first operationalcontrol system used for the HSST-05 was designed for shuttling each train on a singletrack at the Yokohama Exposition. It provided automatic operation by indicating acontrol speed, which a driver was to follow. It also had an overrun protection function.The Yokohama Expo was operated on a 570 m long track at a maximum speed of42 km/h. Although the HSST at the Yokohama Expo was operated with a 99.9%reliability and a 99.8% availability, it did not have the operational characteristics of anurban maglev system that would have to operate at 110 km/h with minimum headways of100 seconds. Therefore, a cab-signal type architecture with an ATO backed up by anAutomatic Train Protection (ATP) system was designed by Kyosan ElectricManufacturing, Co., Ltd of Yokohama, Japan.
This configuration, which is shown in Figure 8-1, was developed incrementally. It firstincluded the overrun protection function in a point-control system using waysidemounted transponders in much the same way as was used in the Yokohama Expo [1]. Itwas then modified to a continuous control system using what CHSST terms a “patternbelt.” The current system was tested using a fixed-pattern ATP. However, according tothe literature [16], elements of a moving block system were also developed that canfollow the location of a preceding train, and determine the state of switches. Someverification experiments for these subsystems have been performed on the Nagoya testtrack, demonstrating their robustness for future application.
The system shown in Figure 8-1 may be classified into the following subsystems:
1. Signaling systema. Automatic Train Protection, which is essentially an Automatic Train Stop
(ATS) using transponders (emergency braking)b. Pattern type ATS for normal service brakingc. Speed detection equipmentd. Continuous train detection with check-in/check-oute. Interlocking equipment
2. Operation systema. Program Train Operation (PTO) providing automatic train operation
functions

8-2
Figure 8-1. Configuration of signal communication equipment

8-3
b. Manual Train Operation (MTO)c. Operation monitoringd. Car monitoring
3. Wayside-cab information transmission equipment4. Wayside-cab supervision
Signaling control is provided by the Automatic Train Stop subsystem, which uses un-powered transponders for overrun protection. At the Saitama and Yokohama Expositionswherein each demonstrated a simple shuttle between two terminals, the waysidetransponders without a power supply provided a safe, and simple economic signalingcontrol subsystem. However, an urban system in which a number of trains are operatedat reasonably close headways, it became necessary to incorporate a conventionalcontinuous detection and control system. A conventional continuous control systemrequires fixed blocks in which the position of a train is detected in each block so that apermissible speed is set for each block thereby controlling operations. Therefore, acontinuous pattern type ATS was introduced as a novel signaling control system, sinceonly one train is operated at the test track. The continuous pattern type ATS wasintroduced with the consideration that it will be modified and improved into a movingblock system in the future. Then operation of trains will be based on the location andspeed of trains through wayside-cab information transmission.
Presence detection of the train is implemented by a conventional continuous-detectioncheck-in/check-out system similar to other light and rapid rail systems. Train speed isdetermined by means of a velocity detection loop in the pattern belt that counts pulsesand is intended to provide speed and stopping distance information on an absolute fail-safe basis.
8.2 Automatic Train Protection
The ATP subsystem performs blocking controls for intermediate blocks and alsoperforms overrun protection functions via the pattern belt speed monitoring, so that atrain can enter a station section at the highest speed possible. This is possible because theoverrun allowance distance from a normal stop point to the absolute end is only about10 m in length. In essence, this ATP is a simple Automatic Train Stop subsystem basedon overrun protection being provided by wayside transponders. Safety is provided by theATS, which finally applies the emergency brake to stop the train if it violates the speedlimits pre-established between each pair of transponders. Figure 8-2 shows the fullservice braking pattern that is generated by the ATS from train speed information andmeasured distances between transponders. The points are controlled by a Type 1 electricrelay interlocking device using train detection information. Continuous train

8-4
detection check-in/check-out is provided by a continuous onboard high frequency signalthat is received by the wayside train detection loop and is an element of the pattern belt.The normal service braking pattern generator shown in Figure 8-2. compares the normalservice braking profile with the ATS speed limits to command the vehicle thrust andbrake control system. The minimum range resolution of the service braking pattern is60 cm at 110 km/h. The delay time for braking is 1.1 seconds; and the delay time forreleasing the brakes is 1.2 seconds. These times are cumulative.
Figure 8-2. ATP Braking Pattern
The HSST test system is manually operated with the automatic train control assistance.The continuous pattern type normal service braking pattern (ATP/ATS) is continuouslydisplayed on the operator’s console providing the operator with command speedinformation with which to follow. The operator can operate at a speed lower than theservice braking pattern allows, but this will increase passenger trip time and reduceproductivity. The human to machine interface console has been designed to supplyminimum essential information to follow the central control authority commands. Theactual speed is displayed digitally and as a conventional speedometer that can becompared to the speed limits in each section, which are displayed on the outer ring of thespeedometer.
8.3 Speed Detection
Speed detection and absolute distance detection use the pattern belt. The wayside patternbelt antenna has openings in 30 cm intervals that mate with three vehicle antennas eachlocated 20 cm apart as shown in Figure 8-3.

8-5
Figure 8-3. Speed Detection Pattern
Three speed ranges are used to construct the detection logic to achieve a reasonableaccuracy of detection. The minimum detection speed is 0.5 km/h (0.139 m/s). Pulses of10 cm in width are used for the speed range of 0.139 – 0.333 m/s. Pulses of 20 cm inwidth are used for the speed range of 0.333 m/s – 1.0 m/s. Above 1.0 m/s pulses of 60cm are used. Phases from the vehicle borne system of three antennas are compared toverify the logic and to determine movement in the reverse direction. There is a dual setof redundant antennas on board to eliminate missing signals in a turnout area and toimprove reliability. The relationship of speed vs. pulse frequency is given by thefollowing:
f [Hz] = K V [km/h], where K = 2.778
The absolute distance detection subsystem counts these pulses and accumulates thesepulses through (an un-described) fail-safe process. These pulses are the essentialinformation for the continuous pattern belt ATP/ATS and moving block system. Toensure that spurious signals from either passing trains or turnout interference does notcause a distance measurement error, transponders have been superimposed in each blockor section for check-in/check-out, and to reinitialize the processor.
8.4 Automatic Train Control
The CHHST test track system is an automatically aided, manually controlled system.The Automatic Train Control (ATC) provides the operator with speed limit information

8-6
for each fixed block established by transponder distances. The speed limits andtransponder distances establish the service braking pattern. A violation of these limits,enables the ATS, which puts the vehicle into emergency braking conditions. The ATCalso enables levitation and landing control, departure and door control, inter-stationcommand speed profiles, and fixed location stop control. The maximum allowance forthe fixed location stopping is about 10 m when applied at less than or equal to 2.77 m/s.The accuracy of fixed location stopping is about ± 20 cm.
8.5 Evaluation and Issues
The CHSST as implemented at the test track is an automatically aided manually operatedsystem that was incrementally developed from the Yokohama Exposition system. TheYokohama Expo system was a simple 570 m long shuttle system with fixed block speedcommands, which the operator was to follow. It also had a system of transpondersproviding check-in/check-out of each block and an over layered overrun protection atstations. However, a simple shuttle system does not have the operational characteristicsof a real urban environment that would support operation of many vehicles at 160 km/hwith a minimum headway of 100 seconds and many stations. This led to thedevelopment of a continuous control system using CHSST “pattern belt.”
The CHSST system that was designed in the 1970’s comes out of a paradigm that80 km/h and a manually operated signal controlled system is adequate. In the U.S. thereis a need for improved operating safety and lower operating subsidies. Maglev is atechnological solution to maintenance. That is, it lowers operating and maintenance costsand hence life cycle cost by eliminating friction and wear of mechanical elements inexchange for more easily replaceable electronic subsystems and components. Inaddition, all indications are that full automatic control can also greatly reduce theoperating subsidy and therefore, needs to be examined fully. The FTA requirements callfor full automatic control and operation.
The Chubu HSST engineers stated that the Tobukyu system in the Aichi Prefecture willbe fully automatic. However, the automatic control system architecture was not providedin detail. Therefore, it is incumbent upon the Chubu team to furnish to the FTATechnical Team documentation on their full automatic control system architecture. Sincemany of the components of the full automatic control system are derived from the currentcomputer aided manually controlled configuration, this configuration is shown inFigure 8-1. It is understood that the driver’s desk will be eliminated from thearchitecture.
The MUSA/CHSST must evaluate the consequences of operation in poor weatherenvironments (i.e., snow, fog, and heavy rain) that limit an operator’s capability to see farenough ahead to ensure safe operation. In the U.S. environment, it may not be acceptableunder these conditions to slow the system down because passengers have alternatives topublic transportation, namely automobiles which are currently used far more often thanpublic transportation systems of any kind. If Maglev systems do not demonstrate some

8-7
improvement over the auto, they will not achieve the expected ridership and Maglev willnot mitigate traffic congestion.
At issue is that CHSST is also developing a moving block architecture, but it too wouldonly be used to command the operator to follow a given pattern. The vigilance ofautomatic systems has repeatedly demonstrated their ability to outperform the human interms of response. In safety-critical transportation systems this is of extreme importance.The risk assessment approach developed by the FRA in a Notice of ProposedRulemaking examines all risk elements in a system and favors the system with the leastsafety risk to passengers and crew. If possible, the moving block architecture should beimplemented as a fully automatic control architecture. In many safety-critical systemsthe human operator represents a high risk element. The reliability and availability ofautomatic control systems have improved significantly over the last ten years and appearto offer the ability to ensure against any safety-critical failure that will result in a fatalityover the life of a system. This, in conjunction with lower operating subsidies, due in largeto lower operating and maintenance costs makes it essential to examine full automaticoperation as a paradigm.
In addition, an ATO system with a minimum headway of 100 seconds that has a humanin the control loop is prone to developing operational instabilities. As operators aredirected to stay as close as possible to the service brake pattern as possible, stress levelswill increase as well as errors that may result in incidents. In a shuttle system withtransponders for overrun protection, stress levels and errors would not be expected to behigh. But, a more complex system with operational characteristics of an urbanenvironment would result in many instabilities, which would be manifested as delays tothe system. An interim system between a simple shuttle system and a complex urbanenvironment would be a line haul system with many stations. This would also developdelay instabilities unless station delays were controlled or adequate margin is added toensure that sufficient time is available to damp out any possible instabilities. Theconsequence of adding a lot of margin to account for peak morning and afternoon delaysis that the trip time would be increased. This would make the system less attractive topassengers. The impact on the station lengths of short headways and the need for severalcars in a train to meet the 12,000 passenger/hour/direction was discussed previously inChapter 4 of this report.
In the limited time available during the technology assessment at the Chubu HSST testtrack, there were many unresolved issues in Automatic Train Control. The differencesbetween Automatic Train Control (ATC) and Automatic Train Protection (ATP) were notclarified. After some study of the references that this section is based on and the firsthand conversations with CHSST engineers, the current system as described aboverepresents the nature of the ATC. However, there are still a number of questions, whichrequire further inquiry.
• Switch interlocking in the currently designed fixed block control system isaccomplished in the usual manner. That is, a dispatcher provides limits of authorityto the end of a block that is green with no entry into a red block. Switch interlocksare controlled by the dispatcher. The very complex mechanical switch is also

8-8
interlocked with a hydraulic cylinder whose shaft must be in place to mechanicallylock the switch in a given direction before three upstream blocks can be released foroperation. The switch appears to function reasonably well allowing a minimumhorizontal radius of 25 m to branch from one line to another. The switching time of15 seconds does impose an operational constraint for an urban environment that needsto be examined more extensively.
• The absolute distance detection subsystem counts a set of pulses and accumulatesthese pulses through (an un-described) fail-safe process. Transponders in effectfunction as milestone markers for the check-in/check-out system. There is no knownway to make a software processing system fail-safe. It was this very point that wasresponsible for the Railroad Safety Advisory Committee (RSAC) and the Notice ofProposed Rulemaking (NPRM) investigation into fail-safe processor controls.Although it was determined that true fail-safe software processors could not bedesigned, fault tolerant processors could be designed. Because of the increasedreliability of these software processors, the safety risk associated with theseprocessors was indeed less than the safety risk associated with so called vital electro-mechanical relays. Due to their lower cost, the software processors have distinctadvantages, and are rapidly replacing vital relays that have been in operation foryears. At issue is the CHSST team apparent claim to make a software process controlsystem fail-safe. This issue should be resolved.
• The vehicle control system that receives a command signal from the ATS control,The Program Train Operation, and the driver is manually controlled by the operator.The operator responds to the service braking pattern established by the speed limitsand transponder locations, and moves the throttle control lever to the appropriatespeed setting. The vehicle control system in turn, generates the appropriate thrust bycontrolling the current from the Variable Voltage, Variable Frequency (VVVF)power supply for the linear induction motor. At the Nagoya test track the humanfunctions as the controller and provides the feedback loop to ensure that thrust doesnot increase speed above its limit. In the full automatic configuration this controlfunction must be performed automatically. The CHSST control engineers did notprovide information as to how this control loop would be implemented if it were to befully automatically controlled. That is, what type of control action would beimplemented (e.g., a PID), and how should the distance and speed detectioninformation be used? The method of providing thrust control is an important safety-critical issue that needs to be addressed, because for example, if not implementedcorrectly it may be possible to un-intentionally apply thrust in the forward directionwhen applying brakes. This is one of the key areas that should be addressed in asafety risk assessment. This thrust control function must also be examined withrespect to suspension system interactions.
• Because the full automatic train control system provides the principal means oflongitudinal control and safety, an independent safety risk assessment must beperformed prior to the HSST system being given a waiver for operation in the U.S..The assessment must also include all the safety-critical control functions.

9-1
9 Environmental Impact
This section addresses the impact and mitigation of noise from vehicle operations, andpresence of magnetic and electric fields. Both the effects on vehicle occupants and thewayside environment are considered in the FTA requirements. The baseline used is forelevated guideway, since that is the likely choice for urban-suburban networks, and isalso the configuration for which test data was taken.
9.1 Noise
9.1.1 Background
Noise from train-type systems, including Maglev, typically has three main components:
1. Structural/mechanical noise, predominant at low speeds (under 100 kph).There is no wheel/rail noise for Maglev, but sources do include magneto-striction(passage of strong magnets over discontinuities), mechanical brake contacts,structural and panel vibrations, and vehicle systems (heating-ventilating-airconditioning, etc.) Without the wheel/rail noise, Maglev system including the CHSSTare much quieter than conventional rail in the low speed regime. This would includeany re-radiation of noise from supported track components.
2. Aerodynamic noise, dominant at medium to high speeds (100-200 kph).This is a combination of various types of flow noise such as at corners, wakes, windshear, boundary layer separation and reattachment, etc. This is heavily dependent onvehicle shape and air interaction with guideway or track bed structures. Both Maglevand conventional rail vehicles, if aerodynamically the same, will have similar noise inthis regime.
3. Turbulent boundary layer noise at very high speeds (300 kph +)--not of interest in thisdiscussion, but characteristic of all high speed vehicles.
Noise measurements are typically made in decibels (dB), power-related so that each 6 dBgain is a doubling of the sound level intensity. The “A-weighted” sound level (dBA) isused for environmental noise assessments because this approximates the varyingfrequency sensitivity of human hearing. The noise criterion in recent FRA environmentalassessments used the Day-Night Sound Level (Ldn), which is based on dBA levels buttaken cumulatively over 24 hr with a 10 dBA penalty weighting in night time hours.
9.1.2 FTA Requirements
Noise level requirements (£ 67dBA) are defined for measurements inside the vehicle andnoise level requirements (£ 70dBA) outside the vehicle at 15.2 m (50 ft) from thecenterline of the (individual) guideway.

9-2
9.1.3 CHSST Noise Measurements
Noise measurements were made for the CHSST system. The measurements taken byHSST as described in Table 3-1, Sec. 6 [1] are given as dB, but it is assumed these aredBA. For external noise, at 10m from the center of the guideway, the measured noiselevel at 100 kph with traction power applied was 71 dBA for a two-car consist of the100-S vehicles. Since the sound level drops with distance, at 15 m this would equate to68 dBA, and at 25 m it would equate to about 63 dBA, based on information developedunder the National Maglev Initiative by Foster-Miller (FMI). Based on this data theCHSST has excellent low noise characteristics, and this was confirmed with an informalviewing of the passing 100-L CHSST 2-vehicle consist at the Nagoya test track by theFTA and MUSA team in March 2002. There, the traffic noise from a moderately busysecondary street nearby remained louder than the passing CHSST 100-l 2-vehicle consistat about 90 kph.
There is a slight increase in noise when the consists are lengthened with more cars. Basedon FMI studies for the NMI, an increase from 2-car to 4-car consists of the same “clean”design would increase sound levels about 2 dBA, so long HSST trains would remainrelatively quiet and would, within level of accuracy, meet FTA requirements at 15 m.
9.1.4 Comparison with Other Systems
Figure 9-1 below shows the noise level measured on a comparable basis for various railand Maglev systems. This again shows how the HSST system noise is expected to be ator below comparable noise levels for comparable transportation systems.
NN
Figure 9-1. Noise from Selected Rail and Maglev Systems
CHSSTNN

9-3
9.1.5 Higher Speeds
The aerodynamic noise component rapidly increases with speed, and this would alsooccur for HSST. Figure 9-1 suggests that with proper attention to aerodynamics, theHSST could remain low-noise and meet FTA requirements. Past HSST data wasobtained with the relatively blunt-nosed 100-S vehicles. However, the 100-L vehicle ismore streamlined, affecting the informal witnessing that occurred in Nagoya in March2002. The projected body style for the Tobukyu Line vehicles is more blunt than the100-L, so if higher speeds such as 130 kph and certainly 160 kph are required, a moreaerodynamic and streamlined body with small gaps and other projections should beconsidered.
It would also be appropriate to conduct additional measurements at 15.2m and 25mlaterally from the guideway center to confirm the expected results, using the present testvehicles. Also obtaining data from the Tobukyu Line when it is operational would bedesirable, since the present test track cannot be used for speeds over 100 kph.
9.2 Electric Fields
The electrical field limits are based on the ACGIH 1999 standards. The AC electric fieldallowable for public exposure is 1 kV/m for medical electronic wearers and 5 kV/m forthe general public. The AC electric field intensity for personnel working on theequipment for eight hours per day is 25V/m for frequencies up to 100Hz and 2.5x10⁶/fV/m from 100Hz to 4kHz (where f = frequency in Hz). This overlaps with a restrictionfor higher sub-radio frequencies (300 Hz to 30 kHz), where the allowable AC electricfield is 2.5x10⁶ kV/m for eight hour/day occupational exposure.
There is only one test data point of the electric field available for the CHSST vehicle. Itwas done at the trolley rail and the data is not presented in [1]. There is a comment thatthe specification would be met at a distance of 10m from the trolley. Therefore,additional testing or test data is required to verify that the specifications can be met.
9.3 Magnetic Fields
These magnetic field limits are also based on the ACGIH 1999 standards. The static(DC) magnet field continuously allowable is 5 Gauss (G), which is the limit for medicalelectronic device wearers. This standard was established based on persons with cardiacpacemakers and other implanted electronic devices, and is about 10x the earth’s magneticfield. The allowable AC time-varying magnetic field must be less than 1 Gauss atfrequencies from 1Hz to 300Hz. The static DC magnetic field is limited to 1 Gauss forworkers with cardiac pacemakers who also work on the equipment for eight hours/day.This AC magnetic field may increase to 2 Gauss for sub-radio frequencies (300Hz to30kHz).

9-4
The CHSST magnetic field strength was measured outside the vehicle at the platform.The measured value was 5.3G, which would equate to about 53 mG at 10 meters from thetrack.
Figure 9-2 below indicates the magnetic field strength for the TR-07 Maglev system,inner-city rail and normal urban transit systems. At ten meters distance, themeasurements for the DC field ranged from 40 mG to 60 mG. These measurements are inthe same range as the CHSST measurements, and so the CHSST vehicle presents nodifferent behavior than traditional electric transit vehicles. The CHSST specification is1 mG @ 25 m. This is in the same range as today’s Inter-City Rail Specification.
Figure 9-2. External Magnetic Field Strength for Selected Rail and Maglev Vehicles
The CHSST magnetic field strength was also measured inside the vehicle. The measuredvalue was 18.5 G (DC magnetic field) at the floor, and was reduced to less than 5 G atseat level (50cm above the floor). These measurements were made under full accelerationconditions, approximately 1.1 m/sec2. When static levitation tests were made, the valuewas 2.8 G at the floor, significantly lower than when the vehicle was accelerating at itsmaximum rate.
This is an area for additional performance tests to determine the field strength whenhigher acceleration rates are achieved, since that is the condition for greatest potentialmagnetic exposure.
9.4 U.S. Mandatory and FTA System Requirements
These have been described in the individual sections above. The FTA limits for noise andelectric and magnetic field exposure have been based on the referenced U.S. industry
CHSST EMI

9-5
sources, and represent conservative guidelines for long-term exposure for bothpassengers and workers. In some cases differences between the two levels are noted.
9.5 Evaluation and Issues
The CHSST system generally meets the FTA guidelines for noise and electric andmagnetic field exposure, as discussed in detail above. Also, they are comparable to otherconventional electric rail system vehicles now in service, within a reasonable range ofaccuracy. The following areas, however, need further clarification or testing:
• Additional testing or test data would be required for certain areas, especially if theperformance (speed, acceleration) were increased to meet other FTA requirements.This includes overall external noise at speeds greater than 100 kph, and with newbody shapes. Also, magnetic field strength needs to be confirmed with accelerationsraised to the FTA requirement of 1.6 from the present 1.1 m/sec2.
• Electromagnetic interference (EMI) measurements should be made inside the CHSSTvehicle since the initial measurements are greater than the specification.
• Electric field measurements must be repeated for the sub radio frequency range sincethese measurements exceeded the specification.


10-1
10 Performance and Safety Tests
Prior to 1993, the HSST engineers performed a large number of tests as reported in [1].In addition to the performance and safety tests on a “finished product” which are ofspecific interest here, the list presented in this reference also contains a number ofdevelopmental tests. Although testing continued after 1993, a comprehensive list of thesetests was not available to the authors. The Aichi Prefecture apparently considered thetests prior to 1993 adequate to conclude that the HSST system is a safe and economicMaglev deployable for urban transportation. The pre-1993 tests as reported in [4] are thefollowing:
1. Vehicle. A total of 44 items were tested. These tests were broken into threesubgroups: levitation/guidance, propulsion/braking, and vehicle/onboard equipment.The tests were conducted under different conditions: (dry, rainy and snowy weather; noload and full load; and various vehicle speeds).
Levitation and guidance were done with emphasis on the performance at 100 kph.Anomaly tests, such as the module drop test and skid slide test were included in thisseries of 15 tests. In the opinion of the Japanese engineers, only one item, landing skiddurability, needed improvement prior to production.
Propulsion and braking tests were focused on the deceleration of the vehicle from100 kph. Special emphasis was placed on brake performance in the electro-hydraulicbraking mode (i.e., the combination of linear motor and hydraulic mechanical brakes) andemergency measures. 17 test items were ranked OK, and only one item, electrical powerrequirement, needed additional design research.
Eleven tests of the car structure and onboard equipment were conducted. Based on theJapanese engineers’ assessments, all 11 tests were completed with no designimprovements required. These tests included a current collection test conducted at110 kph.
2. Guideway. Three groups of items were tested: track structure, switching devices, anddynamic load conditions on the structure.
Eight tests to establish the drop load of the vehicle and track load conditions while thevehicle was levitated were successfully completed. However, during the tests, all of thevalues were below the tentative values established for the construction of the test track.Various types of guideway configurations (steel beam, pre-stressed concrete beam, steelbeam plus steel sleepers, and pre-stressed beam plus steel sleepers) were measured.Track deflection and accuracy were also measured under multiple conditions. The ninthtest found that the steel sleeper style needed improvement prior to production. A 127 Hzrail vibration was observed at some guideway positions.
Four switching tests were completed which confirmed switching accuracy. An enduranceof 90,000 cycles completed successfully. No redesign was necessary prior to production.

10-2
3. Power Supply/Signal Security Systems. The systems were basically the same as usedin today’s railroads. Fourteen items were tested, all of which met the design criteria. Thecomplete tests included: higher harmonic measurement, ground fault detection, and noiselevel measurement for the signal system.
4. Safety in an Emergency. This was a test to verify that the emergency skid operationworked properly for a car that lost levitation on a 7 percent grade.
5. Overall Test/Operation Test. Noise and vibration were measured. The magnetic fieldstrength inside and outside the car were also measured. All nine items tested met theJapanese design criteria.
10.1 Additional Performance Tests
The following additional tests on the CHSST vehicle are recommended by the FTA team.
• Acceleration, Deceleration, and SpeedThese performance tests indicate certain limitations of the CHSST system. Clearly,the acceleration, deceleration and maximum speed are limited in view of the FTArequirements. CHSST acceleration is limited to an initial rate of 4 kph/sec(2.48 mph/sec) that drops to 2.87 kph/sec (1.78 mph/sec) at 85km (~53mph). CHSSTdeceleration is limited to 4.83 kph/sec (3 mph/sec). Note that today’s new steelwheel-steel rail transit cars have top speeds of 160 kph (~100mph), accelerations of4.84 kph/sec (3 mph/sec) and a decelerations of 8 kph/sec (~5 mph/sec). Maglev,which is independent of adhesion limits, should have superior performance.However, any changes to CHSST parameters require a system redesign or re-evaluation. This means that most of the performance tests would need to be repeatedafter the system was redesigned or upgraded. The present CHSST performancelimitations may lead to capacity restrictions or to decreased passenger satisfaction ifthe system is used in the U.S. environment.
• Power ConsumptionThe power requirements for levitation and propulsion favored the use of the two-rail1500 volt DC supply. This needs to be evaluated during a variety of weatherconditions. The electrical power consumption for levitation was measured at13.45kw at 100 kph per vehicle. This is 50% more than the power required forlevitation at a standstill. More testing is required to determine the fundamentalreasons for this change.
• Vehicle Endurance TestVehicle endurance tests have been performed for only a relatively short total distance(41 km). This test was performed after 1993 and test results are reported in [4]. Thistest should be continued for at least another 150 km, at full speed and fully loaded.
• Rail-Sleeper Endurance TestThe steel rail on the guideway transmits the vehicle load by means of a cantileveraction onto the sleeper. The rail is bolted to the sleepers. Each time a car passes over

10-3
a sleeper, cyclic stresses are created which can lead to fatigue cracks in thecantilevered rail section, bolts, and sleeper holes. The endurance test on therail/sleeper attachment should be simulated in the laboratory. The number of cyclesfor any fatigue failure and loosened bolts must be evaluated for correlation to theexpected service life. This will determine the required frequency of inspection.
• Vehicle Dynamic Response and Ride Quality TestVehicle dynamic response and ride quality measurements must be performed at fullspeed with all guideway irregularities set in the track and under full load of thevehicle. Much of the data shown by the HSST engineers seem to be generated fromtheoretical simulations. The testing provides confidence in the theoretical data andmay reveal problems, if any, of a vehicle negotiating simultaneously existingirregularities.
10.2 Additional Safety Tests
The FTA team recommends the following additional test for assurance of passengersafety.
• Passenger Interior Injury AssessmentWhen the emergency brakes are applied, the sitting and standing passengers in the carmay be displaced and injured due to their impact on rigid interior components.Substituting dummies for passengers, tests should be performed to assess the safety ofthe passengers under emergency braking conditions.
• Vertical Control System TestSince the Electromagnetic Suspension system is unstable, without active verticalcontrol, tests should be done to determine possible loss of vertical control underpower outages, electronic component failure, sensor failure, etc.
• Crashworthiness TestsVehicle structural crashworthiness tests simulating collisions with large sized objects(such as large tree branches, but still to be determined) are required to assurestructural integrity and the safety of passengers in the event of a crash.
• Egress TestSafe egress of passengers, including those defined under the ADA, must bedemonstrated in a test simulation.
• Flammability TestTests are required to demonstrate countermeasures and passenger safety under fireand smoke conditions.
• Automated Train OperationA test demonstration of the automated train operation under close headways isrequired, as discussed in Chapter 8.


11-1
11 System Costs
11.1 Introduction
Cost information for the CHSST system has been assembled from several sources. Theprimary sources were the local and central Japanese government bureaus responsible formanaging the financing, construction and operation of the Tobukyu Aichi Expo line.Construction of this system will start in 2003, with completion in 2005. This is the firstand only revenue application of CHSST to date, so the extensive planning and studyefforts conducted in Japan starting over ten years ago provided this cost data.
The Japanese projected cost information for this line in turn originated from both the1993 comprehensive planning document [1] used for approval of the system, andinformation provided by the Aichi Prefecture officials to the FTA/MUSA visit to Japan inMarch 2002. Both the national Ministry of Land, Infrastructure and Transportation(MLIT) and Aichi Prefecture provided planning and financing services. Program andoperations management was provided by the Prefecture supported by a network ofcontractors and subcontractors.
The cost breakdowns for both the initial construction and for operating costs weredetailed only down to the general category level: i.e., capital costs for track components,support structures (infrastructure), substations, signal communication system, passengerstations, etc. and operating costs for cost of electrical power for vehicles, station upkeep,guideway maintenance, etc.
The actual costs assembled in 1993 were for a “baseline” system that was not exactly thesame as the Tobukyu Line, which had not been laid out at that time. The ’93 baselinesystem was a 10 km, 11 station layout while the Tobykyu Line is a 9.2 km, 9 stationlayout with some infrastructure features tailored for the 2005 Aichi Expo. The ’93 studywas aimed at comparing the relative economic and social merit of the CHSST system vs.a typical Japanese monorail system and a “new” medium capacity rail-like system.However the proportioning for the various capital and operating cost categories wasvaluable and is used in this discussion.
These cost proportions as given in the 1993 analysis vs. the later 2002 visit were thencompared. Breakdowns given in 1993 were adjusted based on the later information.Also, the industrial inflation from 1993-2002 was looked at for both the U.S. and Japan,including the differing dollar-yen exchange rate. While a detailed economic analysis fora U.S. application is beyond the scope of this report, an attempt was made to identify anylikely and obvious U.S.-to-Japan differences and then project a range of costs for a U.S.application.

11-2
11.2 System Level Construction Cost Breakdown
Presently, construction costs for the new Tobukyu Line are estimated at about 110 billion¥ (880 million $ at the current 128 ¥ /$) for guideway, stations, power facilities, etc. Thetunnel section at 26.6 B¥/km will be 3x the unit cost of the elevated section at 9.1 B¥/km.40% of the cost will be borne by a combination of private and public companies, and willbe recouped in about 20 years. 60 percent of the cost will be provided by the local,prefectural and national government. The 40 percent portion represents the “Maglev”part (active guideway portion, cars, signals, etc.), and the 60 percent represents theinfrastructure (guideway supporting structures, site work, tunnels, etc.).
Using the elevated configuration as a common reference, the total cost of the CHSSTTobukyu Line is approximately $115 M/mile based on a straight translation of the currentestimate of 9.1 B¥/km to U.S.$ at a 2002 exchange rate of 128 ¥ /$. There are severalfactors which should be considered in understanding this cost.
A percentage cost breakdown of the CHSST system costs was computed from pastJapanese data used for study and approval of the Aichi Expo line (Table 4-6, Ref 1). Thisstudy estimated the costs/km for the “baseline system” to be 5.83 B¥/km in the 1992 timeframe.
Table 11-1. Percentage of CHSST Construction and Deployment Costs*
Guideway Structures & Track 37%
Power Substations & Distribution 12%
Signal & Communications 9%Stations & Buildings 19%
Infrastructure 12% Fitout & Equipment 5% Other Buildings 2%Vehicles 14%Yards 4%
Land (Substations/Yards) 5%
* Based on 1993 Economic Analysis of “Baseline” System (10 km, 11 stations, not “Expo” System)
Table 11-1 can be used as a general guideline, or starting point for proportional costs of aCHSST two-way urban-suburban system, excluding infrastructure impacts for the route.This reflects the Japanese environment, and U.S. vs. Japanese issues will be addressed ina later part of this section.

11-3
There has been more than a 50 percent increase in the overall estimated cost/km of theCHSST elevated configuration from 1992 to 2002: from 5.83 to 9.1 B¥/km. Tounderstand this, we considered several possible factors.
The relative inflation rate in Japan was very low (under 2 percent) over that time,although the inflation rate in the U.S. was approximately 22 percent. Therefore otherfactors should account for the increase of the costs in Japan. These could include:
• Current costs are based on actual “hard” quotes with specific bids based on detaileddesigns, as opposed to preliminary estimates;
• The Tobukyu Line may include “Expo” features not directly related to the Maglevsystem, such as more elaborate or larger stations, parking and roads;
• Negotiation of urban areas such as curves requiring building removal or eminentdomain proceedings;
• Design changes made over the interim based on technical needs, more stringentgovernment regulation, safety-related or reliability-related redundancy, etc.
The following subsections provide more detailed breakdowns of the major cost areas,where available from CHSST and MUSA. The guideway system, for example, is thesingle largest capital cost contributor, and so was subjected to a more detailedbreakdown. Also, supporting calculations and data available to FMI were used to assistthe discussion.
Cost breakdowns for other elements such as the vehicles, power system and traincontrol/protection systems however, were not provided, and so these subsections reflectonly their percentages of overall system costs as shown in Table 11-1 above. For thispurpose, an estimated cost for an “all-elevated” version of the Tobukyu Line wasprepared, based on reducing the cost of the 1.8 km tunnel portion by a factor of 3 (thetunnel section was 20 percent of the total 9.2 km length). Using current exchange rates,this “all-elevated” total cost was approximately 760 M$ (vs. the original 880 M$ costwith the tunnel section included at its full cost). These were based on costs cited earlier inthis subsection.
11.3 Guideway Cost Breakdown
Independent cost estimates at Foster-Miller showed a basic cost of approximately35-50 M$/mile for a two-way CHSST “basic” elevated guideway, not including vehicles,stations, substations, support facilities, signal/communication systems, yards, land, etc.This report considers the complete guideway structure, “Maglev” components and powerrails for the normal elevated single-pylon configuration . Standard 20-24m pre-stressedconcrete guideway beams plus sleepers were assumed, plus good soil conditions notrequiring deep pilings or other extraordinary measures.
There is good agreement, for example, between the FMI basic guideway cost estimate of40 M$/mile for the CHSST configuration and the Japanese-quoted costs, using the
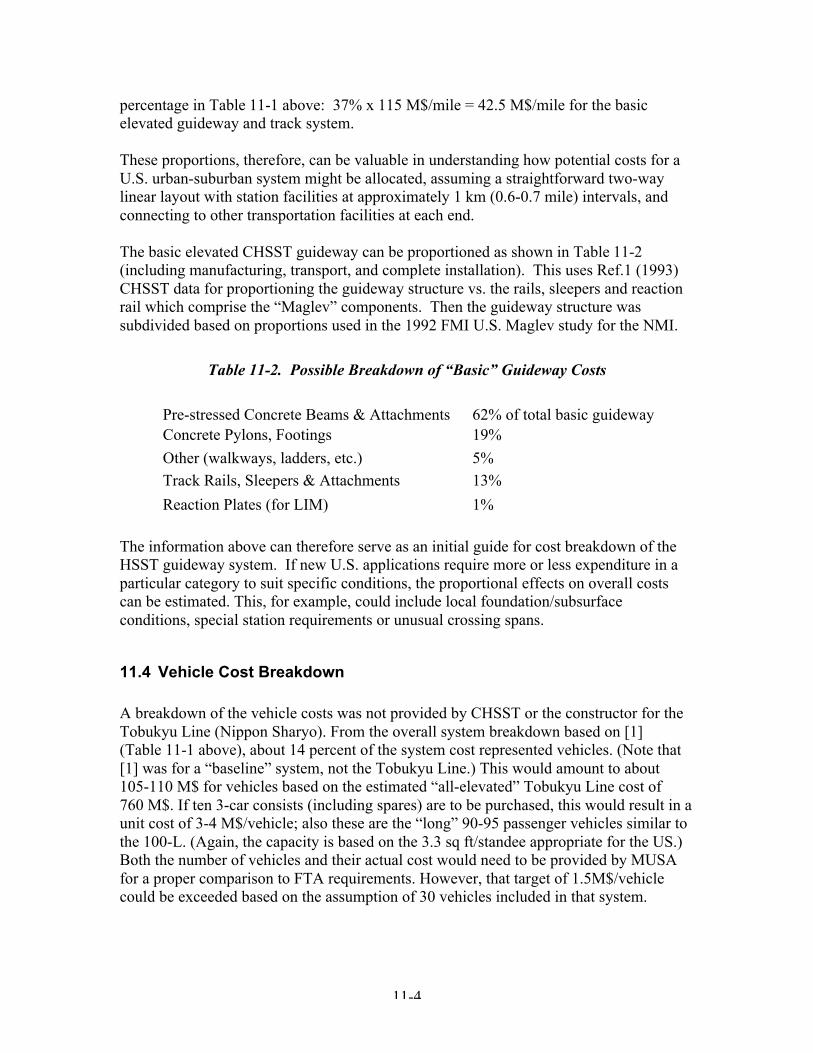
11-4
percentage in Table 11-1 above: 37% x 115 M$/mile = 42.5 M$/mile for the basicelevated guideway and track system.
These proportions, therefore, can be valuable in understanding how potential costs for aU.S. urban-suburban system might be allocated, assuming a straightforward two-waylinear layout with station facilities at approximately 1 km (0.6-0.7 mile) intervals, andconnecting to other transportation facilities at each end.
The basic elevated CHSST guideway can be proportioned as shown in Table 11-2(including manufacturing, transport, and complete installation). This uses Ref.1 (1993)CHSST data for proportioning the guideway structure vs. the rails, sleepers and reactionrail which comprise the “Maglev” components. Then the guideway structure wassubdivided based on proportions used in the 1992 FMI U.S. Maglev study for the NMI.
Table 11-2. Possible Breakdown of “Basic” Guideway Costs
Pre-stressed Concrete Beams & Attachments 62% of total basic guidewayConcrete Pylons, Footings 19%
Other (walkways, ladders, etc.) 5%Track Rails, Sleepers & Attachments 13%
Reaction Plates (for LIM) 1%
The information above can therefore serve as an initial guide for cost breakdown of theHSST guideway system. If new U.S. applications require more or less expenditure in aparticular category to suit specific conditions, the proportional effects on overall costscan be estimated. This, for example, could include local foundation/subsurfaceconditions, special station requirements or unusual crossing spans.
11.4 Vehicle Cost Breakdown
A breakdown of the vehicle costs was not provided by CHSST or the constructor for theTobukyu Line (Nippon Sharyo). From the overall system breakdown based on [1](Table 11-1 above), about 14 percent of the system cost represented vehicles. (Note that[1] was for a “baseline” system, not the Tobukyu Line.) This would amount to about105-110 M$ for vehicles based on the estimated “all-elevated” Tobukyu Line cost of760 M$. If ten 3-car consists (including spares) are to be purchased, this would result in aunit cost of 3-4 M$/vehicle; also these are the “long” 90-95 passenger vehicles similar tothe 100-L. (Again, the capacity is based on the 3.3 sq ft/standee appropriate for the US.)Both the number of vehicles and their actual cost would need to be provided by MUSAfor a proper comparison to FTA requirements. However, that target of 1.5M$/vehiclecould be exceeded based on the assumption of 30 vehicles included in that system.

11-5
11.5 Power Supply Cost Breakdown
A breakdown of the power system costs was not provided by CHSST. From the overallsystem breakdown based on [1] (Table 11-1 above), about 12 percent of the system costrepresented power supply and distribution. (Note that Ref. 1 was for a “baseline” system,not the Tobukyu Line.) This would amount to 90-95 M$ for the power/distributionsystem based on the estimated “all-elevated” Tobukyu Line cost. This category wouldinclude the utility tie-ins, power conversion (1500 VDC in this case), regulation,substations, distribution, etc. It is assumed that line sections would be fed in such a waythat a single line break would not stop the system, but that alternative feed routes wouldbe available, similar to conventional electric rail systems. Their current costs would needto be provided by MUSA for a proper understanding of their contribution to the system.
11.6 Automatic Train Operation/Protection, Signal and CommunicationCost Breakdown
A breakdown of the ATO, Train Protection, Signal and Communication system costs wasnot provided by CHSST. From the overall system breakdown based on Ref. 1 (Table 11-1above), about 9 percent of the system cost represented the train control/protection, signaland communication systems. This would amount to 65-70 M$ for those systems, basedon the estimated “all-elevated” Tobukyu Line cost. Their current costs would need to beprovided by MUSA for a proper understanding of their contribution to the system.
11.7 Station Costs
A breakdown of the station costs was not provided by CHSST. From the overall systembreakdown based on Ref. 1 (Table 11-1 above), about 17 percent of the system costrepresented stations (with fitout). This was for a “baseline” system with 11 stations, butusing the estimated “all-elevated” Tobukyu Line cost, this would work out to about130M$ for stations, or 10-12 M$ each. Their current costs would need to be provided byMUSA for a proper understanding of their contribution to the system, but it appearsstation costs could well exceed the FTA requirement of 2 M$/station. However, it is notknown what constituents are assumed to be present in either number (parking facilities,non-standard station features, access roads, etc.), so this awaits further clarification byMUSA.
11.8 Cost Comparison with Light Rail
The construction cost of the CHSST maglev, in its proposed revenue form, can becompared with other urban-suburban transportation systems such as a light rail line.Such a comparison must be obtained by comparing the capital costs of systems whichprovide the same level of ultimate service; i.e. the performance and physical differencesshould be accounted for in arriving at what are the truly “comparable” systems to servicea given area. Such aspects would include differences in acceleration/braking, maximum

11-6
speed, grade-climbing ability, and curving limitations to cite a few examples. Also,market demand differences should be accounted for in load factors, daily schedules ofoperation, train capacities, etc.
11.8.1 Comparison For Japanese Systems
Such a comparison was performed in the 1992 time frame as part of the HSST systemEconomic Feasibility Study [1]. For the HSST system, the “baseline” 10 km, 11-stationlayout was used, not the Tobukyu Line which had not yet been laid out. The comparisonwas made with two alternatives: a monorail system and a “new transportation system”,similar to elevated light rail adapted to the need for elevated layout in the urban-suburbanstreet environment. Each of these three alternatives was first specified in terms of theirperformance and capacity capability, plus adjusted for market demand/forecasting per thediscussion above in an effort to provide a valid basis.
To provide data for the monorail and “new” light rail systems, six examples of each thatalready existed in Japan were used, and then a representative system was developed foruse in the comparison. The “new transportation” or light rail alternative had, for example,a lower top speed (60 kph vs. 100 kph), slightly lower acceleration/braking rates, andslightly smaller capacity in the 4-car train (used for both). The system data are availablein detail in Tables 4-1, 2 and 3 [1].
When applied to the same “baseline” layout, both the new light rail system and amonorail system came out to a slightly higher cost than the HSST system. The detailedresults of the cost comparison is available in Table 4-6 [1], although there is ainconsistency between the written text and the table on the identification of these twoalternatives. In any case, recall that in 1992, the projected HSST system cost was5.83 B¥/km, while (according to Table 4-6 [1]) the “new” light rail alternative was6.13 B¥/km, about 5 percent higher. This is certainly within the accuracy of the manyassumptions required for such a comparison, so the conclusion is that for Japaneseapplications, and with the assumptions used for the 1992 study, that the costs arecomparable.
Also, it was remarked by Aichi Prefecture officials at the March 2002 meeting in Japanwith the FRA/MUSA team that the light rail alternative was thought to be about15 percent greater cost. This is a greater difference, possibly reflecting later interpretationof such a comparison.
11.8.2 Need for Comparison For US Conditions
For U.S. conditions, MUSA should perform a similar level of comparison with the lightrail alternative covering the factors discussed above. It is likely that the specifics of thesystem layout used as the basis of that comparison will affect the outcome, since thecomparison made in Ref. 1 showed the costs to be relatively close. Therefore, attentionshould be paid to the relative sensitivities of all the major assumptions such as

11-7
performance, capacity, etc. For example, it is reported that some newer light rail systemsmay have better performance than the older ones used in the 1992 Japanese comparison.Likewise, a system meeting the current FTA requirements also has a higher level ofperformance than the existing implementation of the CHSST in Japan.
11.9 System Level Operating Cost Breakdown
11.9.1 Revenue and Operating Costs
Using the Tobukyu Line figures provided by Aichi officials, revenue is projected to beabout 2.8 B¥/yr—90 percent of which is operating cost and 10 percent used to retire the 4investment portion above. The 2.5. B¥/yr (19.5 M$/yr) operating cost is divided asshown in Table 11-3.
Table 11-3. Projected Tobukyu Line Revenue Breakdown
Personnel 0.6 B¥/yr 24% of totalRunning, including power 0.7 B¥/yr 28%Taxes 0.3 B¥/yr 12%Debt Service 0.9 B¥/yr 36%
Total 2.5 B¥/yr
If revenue is 2.8 B¥/yr for 31,000 passengers/day averaged year-round, and the break-even point is 26,000 passengers/day, then the 0.3 B¥/yr can be used to retire the 40percent “Maglev Portion” cost.
A further breakdown of the “running” costs of 0.7 B¥/yr is shown in Table 11-4.
Table 11-4. Running Cost Breakdown for Tobukyu Line
Guideway maintenance 40 M¥/yr 6% of totalElectrical except Power 150 M¥/yr 22%Vehicles 110 M¥/yr 16.5%Traffic/Stations 110 M¥/yr 16.5%Power Costs 130 M¥/yr 19.5%Miscellaneous 130 M¥/yr 19.5%
Total 670 M¥/yr
These all can be useful benchmarks for proportioning costs in similar systems, allowingfor the differences in the specific layout, U.S. regulations and design features, operatingstructure, etc.

11-8
Labor costs for operations in the U.S. may be an issue when using these costs based onJapanese operating practices. For example, the projected Tobukyu labor costs are aquarter of the total operating costs, which could be a low proportion for a U.S. system.Also, the Japanese environment may tolerate relatively higher fares than the U.S., inwhich substantial subsidies are demanded for regional and urban systems. The projectedregional Tobukyu Line revenue of 22 M¥/yr carrying 11.2 M passengers means anaverage fare of $2 for a mix of trips on a 9-station 5.7 mile system, which is short by U.S.standards.
11.10 Evaluation and Comparison with FTA Cost Goals
11.10.1 Capital and Construction Costs
The projected capital costs for the elevated portion of the CHSST Tobukyu Lineincluding stations, at 115 M$/mile is 43% higher than the FTA goal of 80 M$/mile forthe complete two-way system. Higher specific costs in Japan could account for a highoverall amount relative to a U.S. deployment, including:
• Use of actual “hard” quotes as opposed to preliminary estimates
• Inclusion of “Expo” features not directly related to the Maglev system
• Negotiation of specific urban areas, and
• Design changes made during the interim
Thus, CHSST needs to point out these or any other special considerations that may havecontributed to assist in obtaining a more representative U.S. “baseline” cost figure.However, the overall observation is that this is not an inexpensive system even byMaglev standards, as shown by comparison to the current Transrapid deployment inChina. Note that the in-tunnel portion of the Tobukyu Line (at 3x the unit cost) was notincluded in this comparison.
The system breakdown analysis by FMI (Table 11-1) showed that proportioning of themajor cost elements based on the CHSST 1993 baseline system, was reasonable based onother Maglev system studies. CHSST should consider addressing any special costs in theTobukyu Line information above. The “basic” two-way elevated guideway, one of themost important system elements, came to a cost of approximately $37-42 M/mile,substantially exceeding the FTA goal of $22 M/mile. Again, this is higher thananticipated for a simple guideway with no active electrical elements in the guideway.
The further cost breakdown of the “basic” guideway (the structure and rail system,excluding the signal system, power distribution, associated infrastructure costs, etc.) wasshown in Section 11.3. 60-65% of this comprised the beams, and about 20% morecomprised the pylons/footings, based on earlier FMI studies of Maglev costs for the U.S.NMI program. This would suggest that efforts to highly engineer the design andmanufacture of the basic beam, by optimizing the reinforcement, material properties and

11-9
manufacturing plant, could reduce costs. However, the cost of the pylons/footings didnot consider the more expensive “all-piles” approach taken in Japan for conservatism intheir design and implementation for the Oe test track, nor for any (unidentified) areas ofthe Tobukyu Line.
The costs for the other system elements: vehicles, power supply/distribution and the traincontrol/protection, signal and communication, and stations were not broken down byCHSST. Only a rough estimate for their cost was made, based on the proportional costsused in the 1993 study by Aichi Prefecture (Ref. 1), and an adjusted total cost for aTobukyu Line assuming “all-elevated” construction. All these estimated costs exceededFTA targets, but they could be revised if actual cost data were furnished by CHSST orMUSA.
11.10.2 Operating Costs
The projections for the planned Tobukyu Line have been detailed above, showing anaverage fare of $2 for a mix of trips over the 9-station, 9-km system. The mix andaverage length of trips is not known. To compare with the FTA operating cost goal of$15/vehicle-mile ($9/vehicle-km), the average car loading (load factor) and average triplength should be provided by MUSA. Then the effect of US conditions vs. the Japaneseenvironment must be factored in, as needed. In general, a $2 fare for predominantly shorttrips might be considered excessive in the US, but this would depend on the demand andany subsidy available for a specific area.


12-1
12 Conclusions and Recommendations
The FTA team evaluated the CHSST system based on the trip to Japan during March2002, the three MUSA reports and the 1993 Aichi Prefecture report. The team arrived atthe following conclusions and tentative recommendations for consideration by the FTAand MUSA. The FTA requirements that have been used as a benchmark are for a genericsystem and specific to any alignment. The requirements of specific alignments may beless stringent than projected in the generic system.
12.1 Conclusions
12.1.1 System Level
The HSST is a mature Maglev system for urban applications developed in Japan over thelast 25 years. It has not been introduced on a commercial revenue line anywhere yet.Under financial support from the local and central governments in Japan,the CHSSTMaglev is expected to be built in the eastern suburb of Nagoya over a 9.2 km distance.Construction on the project is anticipated to start in 2003 to be completed in 2005, andwill provide revenue service for 31,000 passengers per day. A three car train with acapacity of 400 passengers is planned for the daily operations with a head way of 6minutes catering for 4,000 passengers per hour per direction. According to the 1993Aichi Prefecture study, the HSST Maglev can economically compete with Light Rail andprovide additional benefits such as quiet operation, reduced pollution, trip time savings,and the ability to negotiate 7 percent gradients.
The FTA requirement is 12,000 passengers/hour in each direction which can be met bythe CHSST system only by increasing the number of cars in the train and reducing theheadway significantly. For this capacity, a three car train will have to operate with75 second headway. This level of headway is stringent, and should be assessed for safetyand feasibility for the HSST system. An eight car consist of 100- S vehicles requires2 minute headway to meet the capacity requirement. Car capacities are figured onaccepted passenger densities for U.S. urban rail systems. The consist /station length willbe about 68m(225 ft) for this case. Hence, the increased number of cars increases thetrain length, which in turn requires long stations. Even if it is possible to locate suchlarge stations in an urban environment, every kilometer or two along the guideway, it willbe difficult to gain public acceptance due to aesthetic considerations.
The HSST in its current state of development does not satisfy some of the U.S.mandatory and FTA requirements, which are summarized later in this section. Despitethis, the system has a potential for application in the U.S. and is among a very fewcommercially feasible systems to date for Urban Maglev. If deployed in the U.S., itwould provide significant information, awareness and exposure of this urban maglevtechnology to the U.S. public, transportation planners, and investment sources such as thestate and federal governments, private companies, and financial institutions. Such atechnology can revolutionize the transportation industry. At the moment it is unknown

12-2
whether the CHSST Maglev can compete with a conventional system on a cost basisbecause of the lack of real data.
The HSST technology was conceptualized in the 1970’s with a Linear Induction Motoron a test vehicle. Alternate concepts by others have included the application of LinearSynchronous Motors (LSM) for propulsion and braking. The application of LSMtechnology would result in a lighter vehicle, but makes the guideway relativelyexpensive. However, the LSM concepts have not yet resulted in any full scale operatingvehicle for urban transportation. Hence it is not known how CHSST technologycompares in practice with other emerging Maglev technologies. Presumably the simplerguideway of the HSST system could reduce capital costs, but this needs to be proved forthe CHSST Maglev system.
12.1.2 System Costs
The projected capital cost for the two-way elevated portion ( i.e., excluding tunnel butincluding stations) of the CHSST Tobukyu line is $110-115 million/mile, over 40%higher than the FTA goal of $80 million/mile. The system costs include the basic two-way guideway, vehicles, electrical systems, stations, signal and communications, etc.The “basic” two-way CHSST elevated guideway cost is in the range of $37-42million/mile, which is almost double the FTA desired value of $22 million/mile.
The FTA requirement may be optimistic and difficult to achieve. Nevertheless, the costof the CHSST system should be further evaluated under the best possible normalizationfor U.S. conditions. The guideway structure, including foundation supports should beoptimized for strength and cost using a demonstrable rational procedure. Costcomparisons with elevated light rail and monorail, if appropriate, should be made whenconsidering the CHSST system deployment in the U.S.
12.1.3 Guideway Structure
• The selected structural safety and ultimate load factors seem to be reasonable.
• The life of the guideway and its components must be evaluated to satisfy the FTArequirements. For the permanent infrastructure (guideway, beams, supports) the goalis 75 years. The rail and attachment goal is not specified in the FTA requirement, buta life of 30 years is reasonable. The rail and sleeper life also should be evaluated.
• The foundation and pylon at the test site represent potential over designs for generalapplications, and tradeoffs are required to replace them with spread footings of minipiles where allowed by subsurface conditions.
• Thermal distortions should be thoroughly studied for special guideway sections usingsteel, and in the design of direct fixation techniques contemplated in futureapplications to reduce the guideway cost. The conditions at Nagoya do not representthe extreme conditions encountered in the U.S.

12-3
• In view of stringent guideway tolerances, a method of monitoring by speciallydesigned inspection vehicles and the inspection frequency should be addressed as apart of the guideway maintenance plan and safety assurance.
• The switch existing on the Nagoya test track appears bulky and expensive for revenueservice applications. Alternate switch designs for space efficiency and reduced costsshould be developed. Possibly different designs for both yard and en routeapplications are needed.
12.1.4 Vehicle Structure
• The HSST vehicle operational speed is currently limited to about 100 kph. It cannotsatisfy the FTA maximum speed requirement of 160 kph.. The CHSST technical staffstated that the vehicle can be operated at 130 kph without major redesign. Ourcalculations indicate that in the scenarios where the station spacing is not large, thisreduced speed may not impact trip time significantly and the 130 kph vehicle may beacceptable on some routes in the United States. For long station spacing, the trip timewill increase and the 160 kph speed for the vehicle will be needed. Since a majorredesign will be required to upgrade the current HSST vehicle to this higher speed,the current CHSST vehicle upgraded to130 kph would appear to be more applicablefor potential applications in the U.S. at locations with closer station spacing.
• The 100-L vehicle cannot satisfy the FTA requirement of the 18.3 m (60 ft) radiuscurve negotiation. The 100-S vehicle comes close to the requirement with aminimum radius capability of 25m (83 ft). MUSA must evaluate the applicability of100-L vehicles in the U.S. scenarios by studying potential Maglev routes in urbanareas.
• The HSST vehicle has a life of 20 years according to MUSA report. The FTArequirement is 30 years. The HSST vehicle life must be analyzed and some redesignmay be required to increase its life to the FTA minimum limit.
• There is a US mandatory requirement for passenger egress in the event of smoke, fireand other hazards. This must be adequately addressed, because the vehicle does nothave windows or hatches for passengers to open and escape, or for rescue access.
• The level of crashworthiness of the vehicle is unknown. The vehicle nose must beanalyzed and redesigned where necessary to assure some level of passengerprotection from impacts at reasonable speed.
• The vehicle interior layout should be modified to satisfy the mandatory ADArequirement, which can impact passenger capacity and interior seat layout.Additionally, the passenger car capacity for U.S. operations needs to be based on anadequate floor area of 0.3 m2 (3.3 ft2) per standee as reflected in some MUSA data.The smaller area of 0.14 m2/standee, while acceptable in Japan, is insufficient forU.S. application.

12-4
• The vehicle weight should be reduced to enable increased propulsion power and topotentially operate the vehicle at a higher levitation gap. Reduced vehicle weight canreduce trip time, increase grade climbing capability and lessen restrictions onguideway construction and maintenance tolerances.
12.1.5 Vehicle Levitation
• The HSST technology permits the vehicle to remain levitated at stations at zerospeed. This is an advantage over Electrodynamic Systems which generate repulsiveforces and need some minimum speed for levitation.
• The physical levitation gap of the HSST vehicle is on the order of 6 millimeters,which is quite small in view of the guideway tolerances, which must be maintainedand the transient loads that must be sustained.
• The robustness of the lateral guidance and control should be evaluated further withregard to effects from wind gusts and aerodynamic forces from passing trains.
• The reported delevitation of modules during the endurance testing should be properlyexplained and its impact, if any, on the design criteria and reliability of the levitationsystem should be clarified.
12.1.6 Vehicle Propulsion and Braking
• The CHSST vehicles do not have sufficient thrust capacity to climb the maximumgrades without degradation in speed. On a 7% grade with a headwind of 25 m/sec(55 mph), the achievable steady state speed is 53 kph, which does not satisfy the FTArequirement. To improve the thrust performance, the LIM will need to be redesignedas discussed in Chapter 6, and if possible, the car weight reduced as discussed inChapter 4.
• An upgrade in the braking performance of the CHSST vehicle will be needed tosatisfy the FTA requirement. The requirement arises because of close head wayoperations to meet the throughput requirement along with the need for frequentservice operation. Redesign for this upgrade impacts the LIM and inverter andpossibly the power supply.
12.1.7 Automatic Train Control
• The Chubu experience with train control has been primarily based on their experiencewith the relatively short track, simple shuttle service of expo-type operations.Although the system as currently installed at the Nagoya test track is an automaticallyaided manually operated system, it appears to have many of the features needed forfully automated train control. However, the FTA team is not aware that fully

12-5
automated operation has been demonstrated. The FTA requirements call for a fullautomatic operation of the Maglev system.
• It is understood that the driver’s station will be eliminated for the planned TobukyuAichi Prefecture system. The driver’s operational role must be integrated into theATO system. The details of the full automatic control system architecture need to besupplied and evaluated. In particular, the safety-critical thrust controller architecturemust be provided. Additionally, there are still a number of questions, which willrequire further inquiry of the exact roles and operation of the various functionscontained within the current and envisioned changes to the automatic train controlsystem.
• Finally, a risk assessment must be provided on the complete automatic control systemas it will be used in the U.S. The safety risk assessment must also include all safety-critical systems incorporated into the CHSST.
12.2 Recommendations
A number of comments and recommendations have been made in each of the chapters ofthis report for potential improvements to the CHSST system to satisfy the U.S.mandatory and FTA requirements. An outline plan of action on the recommendations ispresented in the following paragraphs for consideration by the FTA and MUSA.
It is clear that some of the FTA system requirements are both generic and site specific.Even then, the CHSST Maglev will need some upgrades and design modifications tomeet the U.S. mandatory and the FTA requirements. The FTA team recommends thefollowing measures be taken by MUSA/CHSST to enable their system to be deployablein the U.S. These measures are based on near, intermediate and long term timeperspectives.
12.2.1 Near Term (0-1 year)
The purpose of the near term work is to provide clarification and additional analysis andtest data on technical issues raised in this report, including:
• Analyze the guideway structure and component life for 160 kph operation in view ofthe fact that the guideway permanent structure is expected to serve for 75 years.Also, analyze the life of attachments and the impact on maintenance strategy andcost.
• Estimate the frequency of inspections, and associated costs for correcting guidewayirregularities.
• Analyze the vehicle dynamic behavior under worst possible combinations ofguideway tolerances, and ensure that no instabilities occur and the FTA ride qualityrequirement is satisfied at least at 130 kph speed.

12-6
• Provide justification for the 20 year vehicle life and estimate the proportion of lifeconsumed due to fatigue/wear and corrosion/degradation. Indicate how the life canbe extended to 30 years without increasing the size of the vehicle structural membersand hence, its weight.
• Evaluate the crashworthiness level of the vehicle as it exists. Provide designapproaches to improve the crashworthiness without significant increase in weight.Account for both standing and seated passengers in these evaluations.
• Evaluate the egress and rescue capability for the existing vehicle design under smokeand fire conditions and determine methods of improvement.
• Analyze the reliability of the levitation guidance system and suggest methods ofimprovement.
• Re-examine the LIM design, including its control system, and identify cost effectivemeans of increasing thrust capacity by substituting the aluminum winding withcopper or by other means, with the target of reaching full speed capability on7 percent gradients.
• Re-examine the caliper brakes in light of noise and vibration apparently generated intheir application as discussed in this report. Because the braking distances of thepresent CHSST are longer than required in the FTA standards, show how an upgradecan be provided to remedy this situation.
• Analyze the system costs addressed in this report, and show how the costs,particularly the initial costs of the “basic” two-way elevated guideway, can bereduced to meet FTA expectations, or come close to those expectations.
• In order to more fully understand the chosen ATO system, the MUSA/CHSST teamneeds to furnish a fully documented description of the train control andcommunications systems, including system architecture, ATO hardwareimplementation, identification and operational descriptions of safety critical elementsthat demonstrates the ability of the CHSST system to provide safe and fullyautomated operation. The description also needs to include present headwaycapability as well as the changes, if any, needed to operate with headways of100 seconds or less.
12.2.2 Intermediate Term (1-2 years)
The purpose of activities over this term will be to identify suitable deployment situationsin the U.S. and to analyze and test CHSST vehicles at a peak speed of 130 kph. As notedin this report, some components would require redesign to meet with U.S. mandatoryrequirements and FTA desired performance.
• Evaluate the market potential at possible specific locations in the U.S. Identify thoseurban locations and routes for which the redesigned system’s characteristics are

12-7
suitable, i.e., maximum speed of 130 kph, minimum turn radius of 25 m for 100-Sand 50 m for 100-L vehicles, etc. Select the most promising candidate site andperform sufficient route studies from which cost realistic cost estimates can bedeveloped.
• Determine system level capital and operating costs for the candidate site, andpotential revenues during operation. Compare the costs with competitive systems ofequivalent performance for the selected route location.
• Identify and obtain potential interest, support and commitments from financialpartners’ and from the appropriate local, state, and federal government entities.
• Provide a comprehensive analysis and a list of key issues for the CHSST to run at130 kph. Re-evaluate the system performance and safety for this speed by testing.
• Redesign the interior layout of the seating to satisfy the U.S. ADA mandatoryrequirements. Re-evaluate system passenger capacity after the redesign anddetermine measures required to satisfy the passenger capacity goal of the FTA whileaccounting for U.S. space requirements.
• Design one or more alternate cost effective and more efficient switches for theCHSST system.
• Re-assess the vehicle weight savings achievable through alternate construction anddesign changes as appropriate.
• CHSST needs to evaluate and demonstrate all-weather capability of their ATOsystem to operate under U.S. environmental conditions and thus provide all-weatheroperational capability.
12.2.3 Long Term ( >2 years)
The purpose of the long-term activities is to assure the readiness of the CHSST systemfor deployment in the U.S.
• Monitor the progress in Nagoya on the technology, financing and construction for theproposed 9.2 km Tobukyu revenue line. Upgrade the proposed system in the U.S. onthe basis of any relevant improvements and experience gained in Japan. Someadditional testing specified in this report can possibly be carried out on the Tobukyuguideway proposed in Japan. The Tobukyu Line signal system may not be designedfor speed of 130 kph and the Nagoya test track may be too short for 130 kph runs.MUSA and CHSST should examine this issue of 130 kph test demonstrations.
• Test, evaluate and perform endurance tests on a suitable test track the design changesimplemented of a CHSST system suitable for deployment in the U.S.

12-8
• A fully automatic train control system provides the principal means of longitudinalcontrol and safety. Therefore, an independent safety risk assessment consistent withcurrent DOT guidelines must be performed prior to the CHSST being given approvalfor operation in the U.S. This assessment also should provide independent validationand verification of all the safety-critical control functions.
• Develop financial partnership and deployment plans for the selected route(s) in theU.S.

13-1
13 References
[1] “Report on Economic Feasibility Study of Magnetic Levitation Linear Motor Carfor Urban Transportation”, Japan Transportation Economics Research Center, AichiPrefecture, March 1993
[2] “Report No. 1 Performance and Technical Characteristics of Chubu-HSSTSystems”, Maglev Urban System Associates, FTA Report No. FTA-MD-26-7029-01-1, December 2001
[3] “Report No. 2 Comparison Chubu HSST System Performance Characteristics withU.S. Performance Requirements”, (Revised), FTA Report No. FTA-MD-26-7029-01-2, February 2002
[4] “Report No. 3 Technology Review and Demonstration Trip to Nagoya, Japan,March FTA Report No. FTA-MD-26-7029-02-3, April 2002.
[5] Kokkins, S.J., Purple, A., and Samavedam, G., “Thermal Effects and Related SafetyIssues of Typical Maglev Steel Guideways”, DOT/FRA/ORD-94/10 Report,Federal Railroad Administration, Office of Research and Development, 1994.
[6] Matsumoto, A., Fujii, M., Sato, Y., Mizuma, T., Fujino, M., and Ooishi, A.,“Vehicle Dynamics and Ride Quality of a Maglev-Type Urban TransportationSystem CHSST-100”, Proceedings of the International Conference on SpeedupTechnology for Railway and Maglev Vehicle”, held at Yokohama, Japan, Vol. 1,Nov 22-26, 1993.
[7] Fujino, M., “Outline of HSST-100 System and Test Line in Nagoya,” 13th
International Conference on Magnetically Levitated Systems and Linear Drives,May 19-21, 1993, Argonne National Labs, pp. 16-21
[8] D’Arrigo, A. and Rufer, A., “Integrated Electromagnetic Levitation and GuidanceSystem for the SWISSMETRO Project”, Maglev 2000: International Conference onMagnetically Levitated Systems and Linear Drives, June 7-10, 2000, Rio deJaneiro, Brazil.
[9] Iwaya , M., “Rail Irregularity and Module Response in HSST-100 System,” 13th
International Conference on Magnetically Levitated Systems and Linear Drives,May 19-21, 1993, Argonne National Labs, pp. 233-237
[10] Nonaka S. and Higuchi T. “Approximate Equations for Calculation ofCharacteristics of Single-Sided Linear Induction Motors”, Electrical Engineering inJapan, 1982, 102, pp 18-25.

13-2
[11] Nonaka S. and Higuchi T. “Design of Single-Sided LIMs for Urban Transit”,International Conference for Maglev and Linear Drives, Vancouver 1986, pp141-148.
[12] Nonaka S. and Higuchi T. “Design Strategy of Single-Sided Linear InductionMotors for Propulsion of Vehicles”, International Conference for Maglev andLinear Drives, Las Vegas 1987, pp 1-5.
[13] Nonaka S. and Higuchi T. “Reduction of Vertical Forces of Single-Sided LinearInduction Motor for Urban Transit”, International Conference on Maglev Systems,Hamburg 1988.
[14] Nonaka S. et al., “Examination With Test Facility on Dynamic Characteristics ofLIM for Urban Transit”, International Conference ICEM’88, Pisa 1988, 2, pp127-132.
[15] Nonaka S. and Higuchi T. “On the Reduction of Energy Consumption of LinearInduction Motors in Urban Transit”, International Conference on Maglev’89,Yokohama 1989, pp 333-338.
[16] Hashimoto, F., “Signaling System of Maglev type HSST,” 13th InternationalConference on Magnetically Levitated Systems and Linear Drives, May 19-21,1993, Argonne National Labs.