assessment of clean energy measures for california ports · assessment of clean energy measures for...
TRANSCRIPT
E n e r g y R e s e a r c h a n d D e v e l o p m e n t D i v i s i o n F I N A L P R O J E C T R E P O R T
ASSESSMENT OF CLEAN ENERGY MEASURES FOR CALIFORNIA PORTS
SEPTE MBE R 2016 CE C-500-2016-060
Prepared for: California Energy Commission Prepared by: DNV GL
PREPARED BY: Primary Author’s: Dr. Farnaz Farzan Dr. Niloufar Mirhosseini James Leahy Doug Kot Celia King-Scott Dr. Emily Fertig Victoria Carey Nellie Tong Dr. Olof Bystrom DNV GL 155 Grand Avenue, Suite 500 Oakland CA 94612 Phone: +1 510 891 0446 http://www.dnvgl.com Contract Number: KEMA-11-020 Prepared for: California Energy Commission Reynaldo Gonzalez Contract Manager Aleecia Gutierrez Office Manager Energy Generation Research Office Laurie ten Hope Deputy Director ENERGY RESEARCH AND DEVELOPMENT DIVISION Robert P. Oglesby Executive Director
DISCLAIMER This report was prepared as the result of work sponsored by the California Energy Commission. It does not necessarily represent the views of the Energy Commission, its employees or the State of California. The Energy Commission, the State of California, its employees, contractors and subcontractors make no warranty, express or implied, and assume no legal liability for the information in this report; nor does any party represent that the uses of this information will not infringe upon privately owned rights. This report has not been approved or disapproved by the California Energy Commission nor has the California Energy Commission passed upon the accuracy or adequacy of the information in this report.
i
ACKNOWLEDGEMENTS
DNV GL would like to thank the following individuals who took the time to provide insight into the strategic objectives and operations at their ports, as well as provide additional supporting documentation for reference in the development of this report.
Port of Hueneme: Christina Birdsey
Port of Long Beach: Christine Houston
Port of Los Angeles: Vahik Haddadian and Carter Atkins
Port of Oakland: Nicolas Procos
DNV GL would like to extend additional thanks to the port which was selected for the deep-dive assessment, whose representatives provided not only insight and documentation, but also time and support during the on-site survey of the port facilities.
Port of San Diego: Robert Alcala, Kellie Carlson, Christie Coast, Pete Cruz, Philip Gibbons, Aimee Hein, Michelle White, and Renee Yarmy
ii
PREFACE
The California Energy Commission Energy Research and Development Division supports public interest energy research and development that will help improve the quality of life in California by bringing environmentally safe, affordable, and reliable energy services and products to the marketplace.
The Energy Research and Development Division conducts public interest research, development, and demonstration (RD&D) projects to benefit California.
The Energy Research and Development Division strives to conduct the most promising public interest energy research by partnering with RD&D entities, including individuals, businesses, utilities, and public or private research institutions.
Energy Research and Development Division funding efforts are focused on the following RD&D program areas:
• Buildings End-Use Energy Efficiency
• Energy Innovations Small Grants
• Energy-Related Environmental Research
• Energy Systems Integration
• Environmentally Preferred Advanced Generation
• Industrial/Agricultural/Water End-Use Energy Efficiency
• Renewable Energy Technologies
• Transportation
Assessment of Clean Energy Measures for California Ports is the final report for the Energy Efficiency and Microgrids at California Ports project (contract number 500-11-029, work authorization number KEMA-11-020, KEMA Inc.) conducted by KEMA Inc. The information from this project contributes to Energy Research and Development Division’s Public Interest Energy Research Program.
When the source of a table, figure or photo is not otherwise credited, it is the work of the author of the report.
For more information about the Energy Research and Development Division, please visit the Energy Commission’s website at www.energy.ca.gov/research/ or contact the Energy Commission at 916-327-1551.
iii
ABSTRACT
Researchers from DNV GL sought to develop recommendations for California port owners and tenants to adopt increased clean energy measures that are appropriate for current industry and regulatory trends. DNV GL researched five major California ports—Hueneme, Oakland, Long Beach, Los Angeles, and San Diego—to identify the incentives and barriers surrounding energy investment decisions. Using this data, researchers developed a comprehensive framework for port owners and tenants to assess the environmental benefits, resiliency, and financial implications of different clean energy technologies based on business priorities.
Researchers used this framework to assess selected facilities in Port of San Diego as proof of concept. The assessment results revealed several opportunities to improve energy performance with short pay-back periods, mostly involving upgrades for HVAC controls and equipment maintenance policies. However, there were limited benefits in using on-site photovoltaics and energy storage to reduce electricity bills or to support resiliency. Assessment of these systems confirmed that operational circumstances and economics determine the value of on-site generation, storage, and microgrids at different sites.
To ensure that appropriate measures are pursued, port business, industry trends, local utilities, and state and local regulations must cooperate to pursue increased clean energy adoption. In the competitive and increasingly regulated port industry, ports must pursue innovate financing solutions. If assessed properly, adoption of clean energy measures at California ports can provide significant environmental, economic, and security advantages to all those affected by their operations.
Keywords: ports, energy efficiency, clean energy measures, shore power, sustainability, resiliency, on-site generation, energy storage, investment evaluation
Please use the following citation for this report:
Farzan, Farnaz; Niloufar Mirhosseini; James Leahy; Doug Kot; Celia King-Scott; Emily Fertig; Victoria Carey; Nellie Tong; Olof Bystrom. (DNV GL). 2016. Assessment of Clean Energy Measures for California Ports. California Energy Commission. Publication number: CEC-500-2016-060
iv
TABLE OF CONTENTS
Acknowledgements ................................................................................................................................... i
PREFACE ................................................................................................................................................... ii
ABSTRACT .............................................................................................................................................. iii
TABLE OF CONTENTS ......................................................................................................................... iv
LIST OF FIGURES ................................................................................................................................. vii
LIST OF TABLES ..................................................................................................................................... ix
EXECUTIVE SUMMARY ........................................................................................................................ 1
Introduction ........................................................................................................................................ 1
Project Purpose ................................................................................................................................... 1
Project Results ..................................................................................................................................... 1
Project Benefits ................................................................................................................................... 2
CHAPTER 1: Needs Assessment ........................................................................................................... 5
1.1 Port Objectives ............................................................................................................................ 5
1.1.1 Strategic Goals and Considerations ................................................................................. 5
1.1.2 Regulatory Requirements and External Mandates ....................................................... 6
1.2 Port Operations and Management Structure ......................................................................... 8
1.3 Energy-Related Initiatives: Existing and Planned ............................................................... 10
1.3.1 Port of Hueneme .............................................................................................................. 11
1.3.2 Port of Long Beach ........................................................................................................... 12
1.3.3 Port of Los Angeles .......................................................................................................... 13
1.3.4 Port of Oakland ................................................................................................................ 14
1.3.5 Port of San Diego .............................................................................................................. 14
1.4 Funding Opportunities ........................................................................................................... 15
1.5 Implementation Drivers and Barriers ................................................................................... 17
CHAPTER 2: Site and Measure Screening and Selection ............................................................... 19
2.1 Summary of Data Collection .................................................................................................. 19
2.2 Site Selection ............................................................................................................................. 21

v
CHAPTER 3: Opportunity Assessment Framework ....................................................................... 23
3.1 Framework Overview ............................................................................................................. 23
3.2 Feasibility Assessment ............................................................................................................ 25
3.2.1 Site Segmentation ............................................................................................................. 25
3.2.2 First Pass Filtration; Functions and Ownership........................................................... 26
3.2.3 Second Pass Filtration and Matching; Technical and Operational Feasibility ........ 26
3.3 Priority Assessment ................................................................................................................. 28
CHAPTER 4: In-Depth Assessment; Port of San Diego ................................................................. 34
4.1 Data Collection ......................................................................................................................... 34
4.1.1 Independent Research ..................................................................................................... 34
4.1.2 Data Provided by Port of San Diego ............................................................................. 34
4.1.3 Field Survey ...................................................................................................................... 35
4.2 Feasibility Assessment ............................................................................................................ 35
4.2.1 Site Segmentation ............................................................................................................. 36
4.2.2 Facilities Selected for Assessment .................................................................................. 38
4.2.3 Assessed Clean Energy Measures .................................................................................. 38
4.2.4 Technical and Operational Feasibility ........................................................................... 39
4.3 Priority Assessment ................................................................................................................. 41
4.3.1 Energy Efficiency and O&M Upgrade Projects ........................................................... 41
4.3.2 On-Site Generation and Storage Projects ...................................................................... 42
4.4 Studied Facilities ...................................................................................................................... 43
4.4.1 Cruise Ship Terminal ....................................................................................................... 45
4.4.2 10th Ave Marine Terminal .............................................................................................. 53
4.4.3 Don L. Navy Port Administration Building ................................................................. 55
4.4.5 General Services Building ............................................................................................... 72
CHAPTER 5: Recommendations ......................................................................................................... 80
5.1 Economic Benefits .................................................................................................................... 80
5.2 Environmental Benefits ........................................................................................................... 80

vi
5.3 Resiliency Benefits ................................................................................................................... 81
5.4 Alignment of Policy, Port Operations and Industry Trends .............................................. 81
5.5 Active Communication ........................................................................................................... 82
5.6 Close Interaction with Utilities............................................................................................... 82
5.7 Innovative Financing Solutions and Revenue Models ....................................................... 83
5.8 Systematic Approach for Clean Energy Measures Assessment ........................................ 84
GLOSSARY .............................................................................................................................................. 86
REFERENCES .......................................................................................................................................... 88
APPENDIX A: Request for Information ........................................................................................... A-1
APPENDIX B: List of Documents from Port of San Diego ........................................................... B-1
APPENDIX C: Funding Sources Reference Material ..................................................................... C-1
C.1 Load Programs ....................................................................................................................... C-1
C.2 Grants ....................................................................................................................................... C-2
C.3 State Incentive Programs ...................................................................................................... C-2
C.3.1 SGIP .................................................................................................................................. C-2
C.3.2 Cap and Trade ................................................................................................................ C-3
APPENDIX D: MicroGrid Optimizer (MGO) Overview ............................................................. D-1
D.1 Operational Optimization and Simulation Coupled with Investment Analysis: ......... D-1
D.2 Sensitivity Analysis ................................................................................................................ D-3
D.3 Demand Response Simulation ............................................................................................. D-4
D.3 Reliability Simulation ............................................................................................................ D-4
APPENDIX E: Extended Information on Port of San Diego Facilities ....................................... E-1
E.1 Cruise Ship Terminal ............................................................................................................. E-1
E.2 The Don L. Navy Port Administration Building ............................................................... E-2
E.3 Harbor Police Headquarters Building ................................................................................ E-2
E.4 General Services Building ..................................................................................................... E-3
APPENDIX F: Sample Hourly Operation of PV and Storage ....................................................... F-1
F.1 Cruise Ship Terminal ............................................................................................................. F-1
vii
F.1.1 Cruise Ship Terminal Building ..................................................................................... F-1
F.1.2 Cruise Ship Terminal Shore Power Facility................................................................ F-2
F.2 10th Avenue Marine Terminal Shore Power Facility ......................................................... F-4
F.3 Administration Building ....................................................................................................... F-6
F.3 Harbor Police Headquarters ................................................................................................. F-7
F.4 General Services Building ..................................................................................................... F-8
LIST OF FIGURES Figure 1: Energy-Related Measures Undertaken at Ports .................................................................. 10
Figure 2: Overview of Opportunity Assessment Framework ........................................................... 23
Figure 3: Illustrative Ranking of Objectives ......................................................................................... 30
Figure 4: Illustrative Alternative Ranking ............................................................................................ 31
Figure 5: Illustrative Pareto Fronts ........................................................................................................ 32
Figure 6: Typical Generation Facility Metering Layout (with Loads Not Related to Generation) .................................................................................................................................................................... 40
Figure 7: Forklift and Pallet Jack Charging Station ............................................................................. 45
Figure 8: Monthly Energy Usage and Cost by Billing Category—CST Building............................ 46
Figure 9: Portable Stand-By Power in CST ........................................................................................... 47
Figure 10: Monthly Energy Usage and Cost by Billing Category for Administration Building ... 56
Figure 11: Photograph of EMS Interface at Port Administration Building ...................................... 57
Figure 12: View of PV Array on the Adjacent Annex Building (Array Serves Port Admin Building) .................................................................................................................................................... 61
Figure 13: Harbor Police Department Headquarters Site Plan Highlighting the Main Building and .............................................................................................................................................................. 65
the Additional Structures Added to the Site ........................................................................................ 65
Figure 14: Monthly Energy Usage and Cost by Billing Category for Harbor Police Headquarters .................................................................................................................................................................... 66
Figure 15: Harbor Police Out Buildings with Independent Heating and Cooling Equipment .... 68
Figure 16: Harbor Police Headquarters Main Building Uninsulated Roof Duct Showing Damage and Inadequate Air Sealing .................................................................................................................... 68
viii
Figure 17: Monthly Energy Usage and Cost by Billing Category—General Services Building ........ .................................................................................................................................................................... 73
Figure 18: Back-Up Generation at General Services Building ........................................................... 75
Figure 19: MGO Simulation and Valuation Overview ..................................................................... D-1
Figure 20: CHP Operation in Thermal Following Mode and Total Thermal Energy Transactions .................................................................................................................................................................. D-2
Figure 21: CHP Optimal Operation for Energy Bill Management .................................................. D-2
Figure 22: Evaluation of Multiple Scenarios for Multi-Building Educational Campus ............... D-4
Figure 23: CHP and Storage Dispatch During a Multi-Day Grid Outage ..................................... D-5
Figure 24 Hourly Electric Energy Transactions PV + Small Storage at CST Building (October 6, 2015) ......................................................................................................................................................... F-1
Figure 25: Cruise Ship Terminal Building Energy and Demand Charges—October 6, 2015 ...... F-2
Figure 26: Cruise Ship Terminal Shore Power Hourly Electric Energy Transactions—Oct 2, 2015 .................................................................................................................................................................. F-3
Figure 27: Cruise Ship Terminal Shore Power Energy and Demand Charges—October 2, 2015 ....
.................................................................................................................................................................. F-3
Figure 28: Marine Terminal Hourly Electric Energy Transactions, Config # 3—September 8, 2015 .................................................................................................................................................................. F-4
Figure 29: Marine Terminal Energy and Demand Charge, Config # 3—September 8, 2015 ....... F-5
Figure 30: Marine Terminal Hourly Electric Energy Transactions, Config # 5—September 8, 2015 .................................................................................................................................................................. F-5
Figure 31: Marine Terminal Energy and Demand Charges, Config # 5—September 8, 2015 ..... F-6
Figure 32: Administration Building Hourly Electric Energy Transactions—September 8, 2015
.................................................................................................................................................................. F-7
Figure 33: Administration Building Energy and Demand Charges—September 8, 2015............ F-7
Figure 34: Harbor Police Headquarters Building Hourly Electric Energy Transactions – October 6, 2015 ...................................................................................................................................................... F-8
Figure 35: Harbor Police Headquarters Building Energy and Demand Charges—October 6, 2015 .................................................................................................................................................................. F-8
Figure 36: General Services Building Hourly Electric Energy Transactions—September 27, 2015 .................................................................................................................................................................. F-9
ix
Figure 37: General Services Building Energy and Demand Charges—September 28, 2015 ....... F-9
LIST OF TABLES Table 1: Shore Power Schedule and Requirements ............................................................................... 7
Table 2: San Pedro Bay Requirements ..................................................................................................... 7
Table 3: Ports Size and Operations .......................................................................................................... 8
Table 4: Documentation Reviewed for Each Port ................................................................................ 20
Table 5: Illustrative Pair-Comparison for Strategic Goals .................................................................. 29
Table 6: Illustrative Alternative Priority Assessment ......................................................................... 31
Table 7: Energy Efficiency and O&M Measures .................................................................................. 39
Table 8: Financial Input Assumptions .................................................................................................. 42
Table 9: Sustained Outage Duration Assumptions ............................................................................. 43
Table 10: Proposed energy efficiency projects for the Cruise Ship Terminal. ................................. 48
Table 11: Energy Savings, Cost Savings, Index Values, and Ranking of Energy Efficiency and O&M Upgrade Project at Cruise Ship Terminal Building .................................................................. 49
Table 12: Cruise Ship Terminal Shore Power and Building Measure Configurations ................... 50
Table 13: Simulation Inputs for Cruise Ship Terminal Building ....................................................... 50
Table 14: Simulation Inputs for Cruise Ship Terminal Shore Power ................................................ 51
Table 15: Prioritization Scores and Ranking for Cruise Ship Terminal Building............................ 51
Table 16: Prioritization Scores and Ranking for Cruise Ship Terminal Shore Power .................... 52
Table 17: Configuration Measures Resiliency Index—Cruise Ship Terminal Building and Shore Power ......................................................................................................................................................... 52
Table 18: Marine Terminal Measure Configurations .......................................................................... 53
Table 19: Marine Terminal Simulation Inputs ..................................................................................... 53
Table 20: Prioritization Scores and Ranking for Marine Terminal .................................................... 54
Table 21: Configuration Measures Resiliency Index—Marine Terminal ......................................... 54
Table 22: Project Descriptions for Port Administration Building ..................................................... 59
Table 23: Energy Savings, Cost Savings, Indices and Ranks of Projects for Port Administration Building ..................................................................................................................................................... 62
Table 24: Administration Building Measure Configurations ............................................................ 63
x
Table 25: Administration Building Simulation Inputs ........................................................................ 63
Table 26: Prioritization Scores and Ranking for Administration Building ...................................... 64
Table 27: Configuration Measures Resiliency Index—Administration Building ........................... 64
Table 28: Project Descriptions for Harbor Police Headquarters Building ....................................... 68
Table 29: Energy Savings, Cost Savings, Indices and Ranks of Projects for Harbor Police Headquarters Building ............................................................................................................................ 70
Table 30 presents the technologies and installed capacities of the measure configurations, for .. 71
Harbor Police Headquarters Building. ................................................................................................. 71
Table 31: Harbor Police Headquarters Building Simulation Inputs ................................................. 71
Table 32: Prioritization Scores and Ranking for Harbor Police Headquarters Building ............... 72
Table 33: Configuration Measures Resiliency Index—Harbor Police Headquarter Building....... 72
Table 34: Energy Efficiency and O&M Upgrade Project Descriptions for the General Services Building ..................................................................................................................................................... 75
Table 35: Energy Savings, Cost Savings, Indices and Ranks of Projects for General Services Building ..................................................................................................................................................... 77
Table 36: General Services Building Measure Configurations .......................................................... 77
Table 37: General Services Building Simulation Inputs ..................................................................... 78
Table 38: Prioritization Scores and Ranking for General Services Building .................................... 78
Table 39: Configuration Measures Resiliency Index—General Services Building ......................... 79
Table 40 Financial and Investment Evaluation Results for CHP With Two Applications .......... D-3
Table 41: Reliability Statistics With Different DER Configurations ................................................ D-6
Table 42: Operating Schedule for CST Building ................................................................................ E-1
Table 43: Meter and Tariff Information for CST building ................................................................ E-1
Table 44: Operational Schedule for Admin Building ........................................................................ E-2
Table 45: Meter and Tariff Information for Admin Building ........................................................... E-2
Table 46: Operational Schedule for Harbor Police Headquarters ................................................... E-2
Table 47: Meter and Tariff Information for Harbor Police Headquarters ...................................... E-3
Table 48: Meter and Tariff Information for General Services Building .......................................... E-3
1
EXECUTIVE SUMMARY
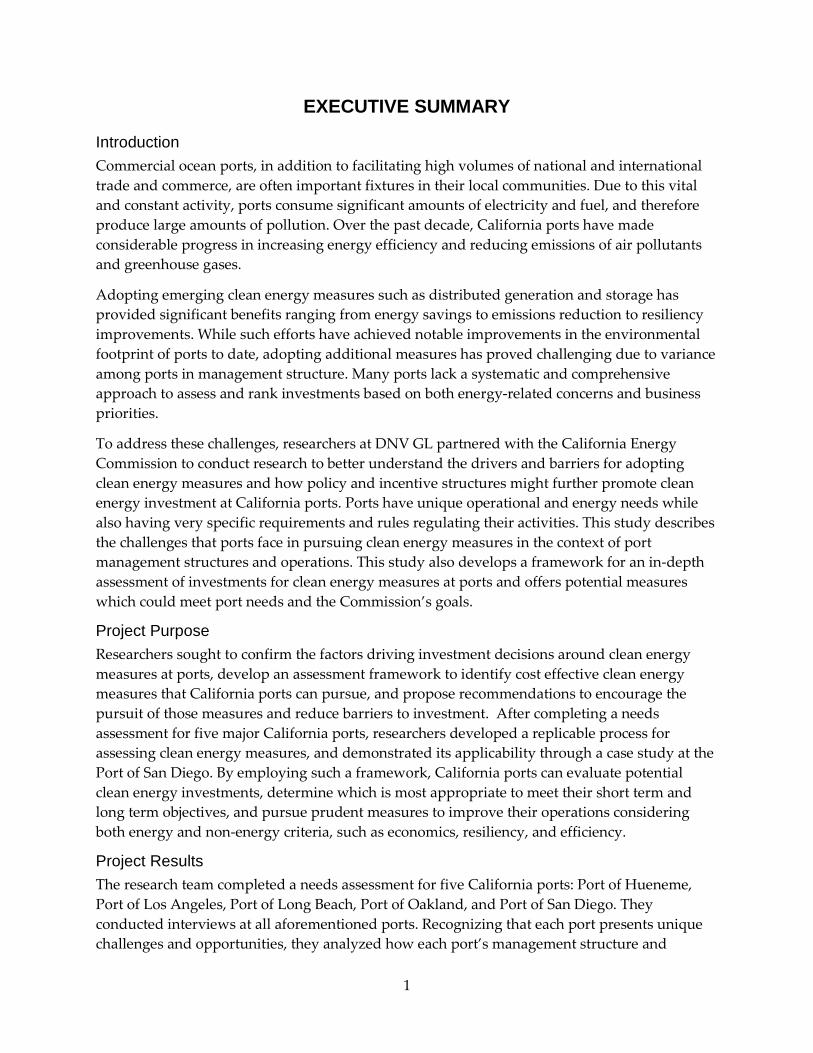
Introduction Commercial ocean ports, in addition to facilitating high volumes of national and international trade and commerce, are often important fixtures in their local communities. Due to this vital and constant activity, ports consume significant amounts of electricity and fuel, and therefore produce large amounts of pollution. Over the past decade, California ports have made considerable progress in increasing energy efficiency and reducing emissions of air pollutants and greenhouse gases.
Adopting emerging clean energy measures such as distributed generation and storage has provided significant benefits ranging from energy savings to emissions reduction to resiliency improvements. While such efforts have achieved notable improvements in the environmental footprint of ports to date, adopting additional measures has proved challenging due to variance among ports in management structure. Many ports lack a systematic and comprehensive approach to assess and rank investments based on both energy-related concerns and business priorities.
To address these challenges, researchers at DNV GL partnered with the California Energy Commission to conduct research to better understand the drivers and barriers for adopting clean energy measures and how policy and incentive structures might further promote clean energy investment at California ports. Ports have unique operational and energy needs while also having very specific requirements and rules regulating their activities. This study describes the challenges that ports face in pursuing clean energy measures in the context of port management structures and operations. This study also develops a framework for an in-depth assessment of investments for clean energy measures at ports and offers potential measures which could meet port needs and the Commission’s goals.
Project Purpose Researchers sought to confirm the factors driving investment decisions around clean energy measures at ports, develop an assessment framework to identify cost effective clean energy measures that California ports can pursue, and propose recommendations to encourage the pursuit of those measures and reduce barriers to investment. After completing a needs assessment for five major California ports, researchers developed a replicable process for assessing clean energy measures, and demonstrated its applicability through a case study at the Port of San Diego. By employing such a framework, California ports can evaluate potential clean energy investments, determine which is most appropriate to meet their short term and long term objectives, and pursue prudent measures to improve their operations considering both energy and non-energy criteria, such as economics, resiliency, and efficiency.
Project Results The research team completed a needs assessment for five California ports: Port of Hueneme, Port of Los Angeles, Port of Long Beach, Port of Oakland, and Port of San Diego. They conducted interviews at all aforementioned ports. Recognizing that each port presents unique challenges and opportunities, they analyzed how each port’s management structure and
2
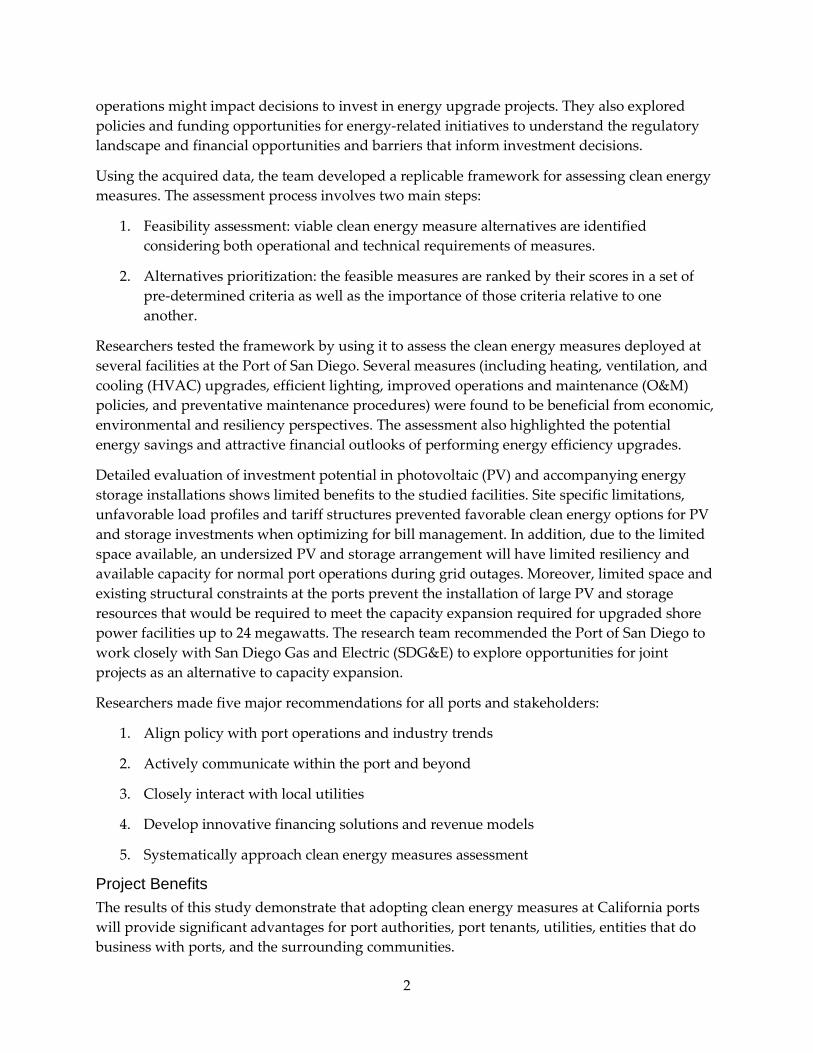
operations might impact decisions to invest in energy upgrade projects. They also explored policies and funding opportunities for energy-related initiatives to understand the regulatory landscape and financial opportunities and barriers that inform investment decisions.
Using the acquired data, the team developed a replicable framework for assessing clean energy measures. The assessment process involves two main steps:
1. Feasibility assessment: viable clean energy measure alternatives are identified considering both operational and technical requirements of measures.
2. Alternatives prioritization: the feasible measures are ranked by their scores in a set of pre-determined criteria as well as the importance of those criteria relative to one another.
Researchers tested the framework by using it to assess the clean energy measures deployed at several facilities at the Port of San Diego. Several measures (including heating, ventilation, and cooling (HVAC) upgrades, efficient lighting, improved operations and maintenance (O&M) policies, and preventative maintenance procedures) were found to be beneficial from economic, environmental and resiliency perspectives. The assessment also highlighted the potential energy savings and attractive financial outlooks of performing energy efficiency upgrades.
Detailed evaluation of investment potential in photovoltaic (PV) and accompanying energy storage installations shows limited benefits to the studied facilities. Site specific limitations, unfavorable load profiles and tariff structures prevented favorable clean energy options for PV and storage investments when optimizing for bill management. In addition, due to the limited space available, an undersized PV and storage arrangement will have limited resiliency and available capacity for normal port operations during grid outages. Moreover, limited space and existing structural constraints at the ports prevent the installation of large PV and storage resources that would be required to meet the capacity expansion required for upgraded shore power facilities up to 24 megawatts. The research team recommended the Port of San Diego to work closely with San Diego Gas and Electric (SDG&E) to explore opportunities for joint projects as an alternative to capacity expansion.
Researchers made five major recommendations for all ports and stakeholders:
1. Align policy with port operations and industry trends
2. Actively communicate within the port and beyond
3. Closely interact with local utilities
4. Develop innovative financing solutions and revenue models
5. Systematically approach clean energy measures assessment
Project Benefits The results of this study demonstrate that adopting clean energy measures at California ports will provide significant advantages for port authorities, port tenants, utilities, entities that do business with ports, and the surrounding communities.

3
Specifically, introducing energy generation and storage technologies that can offset energy purchases from the grid can provide economic savings for both port authorities and tenants when optimized for site specifications. Utility companies can also gain reliability and economic advantages when ports and their tenants invest in technologies that relieve stress on the utility’s system and therefore help defer required capacity upgrade investments.
Furthermore, clean energy measures can reduce environmental impacts of ports by improving air and water quality, reducing electricity consumption, and supporting waste management. Deploying energy efficiency upgrades, renewable generation, and electricity storage can reduce grid dependency and greenhouse gas emissions.

4
5
CHAPTER 1: Needs Assessment This chapter explores the factors driving investment decisions around clean energy measures at ports. Therefore, this effort included both independent research and interviews with representatives of five California ports—Port of Hueneme, Port of Los Angeles, Port of Long Beach, Port of Oakland, and Port of San Diego.
The DNV GL team conducted research to provide a better understanding of how California ports adopt clean energy measures and how their management structure and operations might impact their decision in investing in energy upgrade projects. In addition, policies and funding opportunities around energy-related initiatives were explored to understand the regulatory landscape and financial opportunities/barriers that help formulate the investment in these initiatives.
The summary of findings is laid out in the following sections:
• Section 1.1 describes the operational objectives of ports and regulation requirements they have to comply with
• Section 1.2 summarizes ports operations and management structure
• Section 1.3 illustrates existing and future energy-related initiatives undertaken by each of above mentioned ports in California
• Section 1.4 lists the funding opportunities for energy-related initiatives
• Section 1.5 presents a summary of implementation drivers and barriers around energy-related initiatives
1.1 Port Objectives 1.1.1 Strategic Goals and Considerations The overall high-level goals of the ports are consistent across the five surveyed, despite differing sizes and operations. The main themes of each port’s strategy were to remain competitive, self-sufficient, and relevant for their customers and communities can be summarized as follows:
Environmental Stewardship: Ports are conscious of the significant effects they have on their surrounding environment. As such, they have mandates and initiatives aiming to improve air quality, waste management, land use management, bunkering, dredging, etc.
Safety and Security: Ports are continuously improving the existing measures and implementing new measures to ensure safety and security as their own operations/facilities and surrounding communities are concerned. The areas of special attention are emergency preparedness, search, salvage and rescue capabilities, communications and cyber security, hazardous cargo, etc.
6
Economic Development: Ports have to continue to be relevant and cost effective for their tenants (mainly shipping lines and terminal operators). As such, they need to stay financially strong to provide sustainable infrastructure that facilitates the efficient flow of commerce at their ports. As the ports focus on continuously improving the value and service they provide to tenants, they have to keep costs at competitive levels by taking necessary actions such as improving financial performance of ports assets, deferring maintenance, and seeking funding sources that relieve part of their capitalization burdens (e.g., grants and public private partnerships), etc.
Stakeholder Engagement: Ports promote strong engagements with different stakeholders including their customers, entities that do business with them, and their local communities. They invest in programs to implement processes for increased transparency and ease of access to information by public, customer satisfaction surveys, outreach and education, etc.
1.1.2 Regulatory Requirements and External Mandates This section summarizes regulatory requirements and mandates that have impact on electric energy consumption and infrastructure for stationary measures:
California Air Resources Board (ARB): One of the main regulatory requirements applied to ports in those set by ARB. ARB has a set of regulatory activities to reduce diesel particulate matter (PM), oxides of nitrogen (NOx), and sulfur oxides (SOx) emissions from commercial marine vessels. Most of these activities pertain to non-energy related measures (e.g., activities around harbor craft, fuel consumption of ocean-going vessels, incineration onboard ocean-going vessels, and vessel speed reduction), in this section, we focus on energy-related regulations:
Shore Power for Ocean-Going Vessels: In December 2007, the Air Resources Board (ARB) approved the "Airborne Toxic Control Measure for Auxiliary Diesel Engines Operated on Ocean-Going Vessels At-Berth in a California Port" Regulation, commonly referred to as the At-Berth Regulation. The At-Berth Regulation provides vessel fleet operators visiting these ports with two options to reduce at-berth emissions from auxiliary engines: 1) turn off auxiliary engines and connect the vessel to some other source of power, most likely grid-based shore power; or 2) use alternative control technique(s) that achieve equivalent emission reductions. Container, refrigerated-cargo, and passenger vessel fleets are required to uphold the At-Berth Regulation.
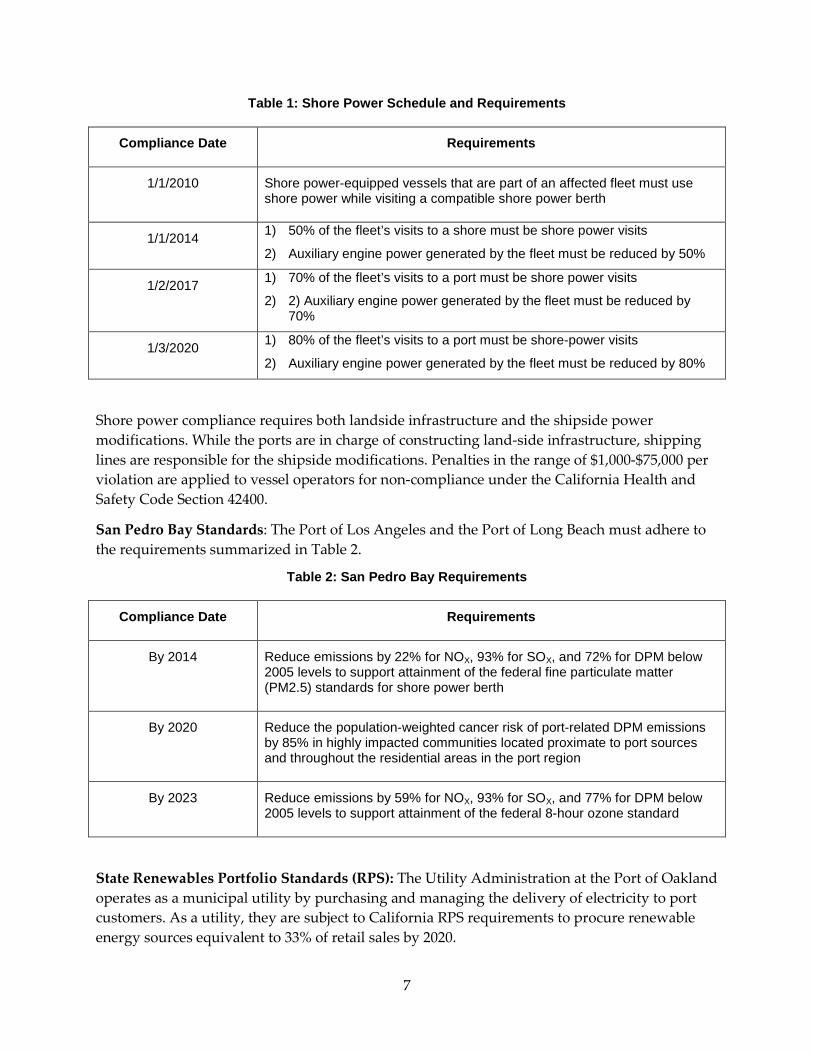
The regulation requires an affected fleet operator to reduce at-berth emissions from their vessels’ auxiliary engines while docked at the California ports specified in the regulation. The regulation ultimately requires a fleet operator to reduce at-berth oxides of nitrogen (NOx) and particulate matter (PM) emissions from its vessels’ auxiliary engines at the port by at least 80 percent by 2020. Table 1 lists the compliance schedule for affected fleets.
7
Table 1: Shore Power Schedule and Requirements
Compliance Date Requirements
1/1/2010 Shore power-equipped vessels that are part of an affected fleet must use shore power while visiting a compatible shore power berth
1/1/2014 1) 50% of the fleet’s visits to a shore must be shore power visits
2) Auxiliary engine power generated by the fleet must be reduced by 50%
1/2/2017 1) 70% of the fleet’s visits to a port must be shore power visits
2) 2) Auxiliary engine power generated by the fleet must be reduced by 70%
1/3/2020 1) 80% of the fleet’s visits to a port must be shore-power visits
2) Auxiliary engine power generated by the fleet must be reduced by 80%
Shore power compliance requires both landside infrastructure and the shipside power modifications. While the ports are in charge of constructing land-side infrastructure, shipping lines are responsible for the shipside modifications. Penalties in the range of $1,000-$75,000 per violation are applied to vessel operators for non-compliance under the California Health and Safety Code Section 42400.
San Pedro Bay Standards: The Port of Los Angeles and the Port of Long Beach must adhere to the requirements summarized in Table 2.
Table 2: San Pedro Bay Requirements
Compliance Date Requirements
By 2014 Reduce emissions by 22% for NOX, 93% for SOX, and 72% for DPM below 2005 levels to support attainment of the federal fine particulate matter (PM2.5) standards for shore power berth
By 2020 Reduce the population-weighted cancer risk of port-related DPM emissions by 85% in highly impacted communities located proximate to port sources and throughout the residential areas in the port region
By 2023 Reduce emissions by 59% for NOX, 93% for SOX, and 77% for DPM below 2005 levels to support attainment of the federal 8-hour ozone standard
State Renewables Portfolio Standards (RPS): The Utility Administration at the Port of Oakland operates as a municipal utility by purchasing and managing the delivery of electricity to port customers. As a utility, they are subject to California RPS requirements to procure renewable energy sources equivalent to 33% of retail sales by 2020.
8
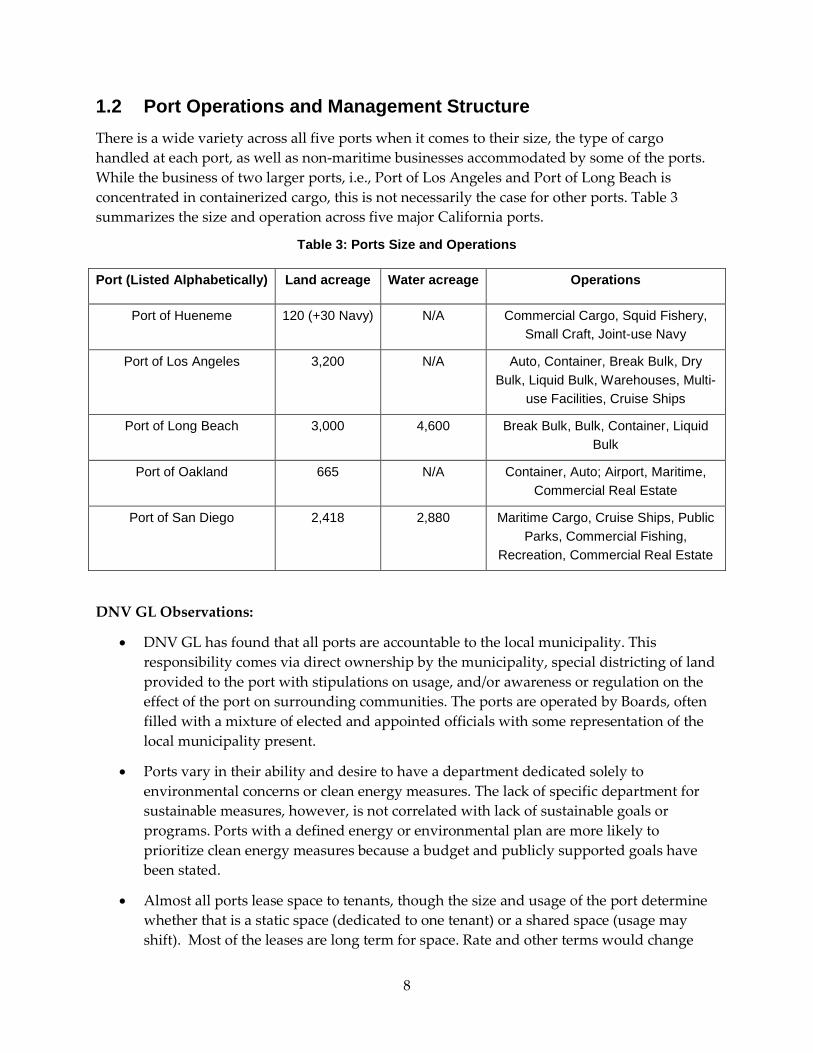
1.2 Port Operations and Management Structure There is a wide variety across all five ports when it comes to their size, the type of cargo handled at each port, as well as non-maritime businesses accommodated by some of the ports. While the business of two larger ports, i.e., Port of Los Angeles and Port of Long Beach is concentrated in containerized cargo, this is not necessarily the case for other ports. Table 3 summarizes the size and operation across five major California ports.
Table 3: Ports Size and Operations
Port (Listed Alphabetically) Land acreage Water acreage Operations
Port of Hueneme 120 (+30 Navy) N/A Commercial Cargo, Squid Fishery, Small Craft, Joint-use Navy
Port of Los Angeles 3,200 N/A Auto, Container, Break Bulk, Dry Bulk, Liquid Bulk, Warehouses, Multi-
use Facilities, Cruise Ships
Port of Long Beach 3,000 4,600 Break Bulk, Bulk, Container, Liquid Bulk
Port of Oakland 665 N/A Container, Auto; Airport, Maritime, Commercial Real Estate
Port of San Diego 2,418 2,880 Maritime Cargo, Cruise Ships, Public Parks, Commercial Fishing,
Recreation, Commercial Real Estate
DNV GL Observations:
• DNV GL has found that all ports are accountable to the local municipality. This responsibility comes via direct ownership by the municipality, special districting of land provided to the port with stipulations on usage, and/or awareness or regulation on the effect of the port on surrounding communities. The ports are operated by Boards, often filled with a mixture of elected and appointed officials with some representation of the local municipality present.
• Ports vary in their ability and desire to have a department dedicated solely to environmental concerns or clean energy measures. The lack of specific department for sustainable measures, however, is not correlated with lack of sustainable goals or programs. Ports with a defined energy or environmental plan are more likely to prioritize clean energy measures because a budget and publicly supported goals have been stated.
• Almost all ports lease space to tenants, though the size and usage of the port determine whether that is a static space (dedicated to one tenant) or a shared space (usage may shift). Most of the leases are long term for space. Rate and other terms would change
9
upon renewal. This structure has several implications with respect to investment decision for clean energy measures.
• For areas dedicated to leased space, tenants have to have a desire to pursue those measures based on their operational needs (e.g., energy security and resiliency) or for cost savings purposes. Since the port is the owner of the land and is ultimately responsible for most of stationary infrastructure, tenant’s plans for deploying any technology that interacts with port’s infrastructure need to be reviewed and approved by the respective department within each port’s authority. Each port has a standard procedure in place to review such plans and ensure their compliance with engineering, safety, security and other relevant codes and standards. Besides obtaining approval for the project and/or providing consultancy once requested, port’s authority is not involved in tenant’s decision making process with regards to clean energy measures (since tenant’s operation is managed completely independently).
Details of each port’s management structure are described below:
Port of Hueneme is a special district governed by harbors/navigation code compromised of Port of Hueneme, The City of Oxnard, and some unincorporated beach communities. Several entities manage different aspects of the port: Harbor masters coordinate logistics of arriving and departing vessels, and the location of goods to be stored. However, harbor masters are not involved in day-to-day operations of tenants. The Board of commissioners oversees overall operation and planning for the port. The Port also shares space and revenue with the Navy to secure additional wharf space. Tenants, although leasing space, generally do not have a dedicated space restricted to their use. This measure allows flexibility in the movement and storage of goods in limited space.
Port of Los Angeles is a department of the city of Los Angeles. The Port’s Board of Harbor Commissioners directs and guides all ports transactional matters. The Port leases each terminal to a shipping line, which in turn, brings in their own operating companies to run the daily operations of the terminal.
Port of Long Beach is referred to as the City of Long Beach’s Harbor Department. The Port is governed by a Board of Harbor Commissioners, who are appointed by the Mayor and confirmed by the City Council. Since the City Charter in Long Beach allows the public to appeal any decision of an appointed body in Long Beach, the Port has a unique layer of potential public involvement with any of the decisions they make. The Port is a landlord, and leases terminals and other facilities to private entities.
Note: Port of Los Angeles and Port of Long Beach share the same harbor and they coordinate together on major environmental initiatives, namely, the Clean Energy Action Plan and Water Resources Action Plan. The two ports also work closely together when either of them plans to undertake a project that might impact the throughput and traffic of the other because there are cumulative impacts even though they are separate entities. Therefore, the two ports have programs that are jointly operated through supply chain optimizations.
10
Port of Oakland is owned by city of Oakland but is an independent department. The Port Board is in charge of daily operations and maintaining certain facilities. They have operators on long-term leases that are assigned to different terminals. Operators in turn get into contracts with various shipping lines to use the terminal based on the contract terms.
Port of San Diego was created by the state in 1962 to manage San Diego bay and surrounding waterfront land through five member cities. It is governed by a 7-member Board of Port Commissioners, including one representative from each member city, and three appointed members by San Diego City Council. The Port leases space to tenants, who operate their own facilities with a variety of operations from maritime to commercial businesses (e.g., San Diego convention center and several hotels and restaurants in bay front areas). In one of their terminals, the 10th Avenue Marine Terminal, they have a hybrid model in which some space and facilities are leased out to tenants with their independent operations while the Port is in charge of managing the utilization of the remaining open space within the terminal that is shared for the movement of bulk cargo. The Port also manages 20 public parks within its footprint.
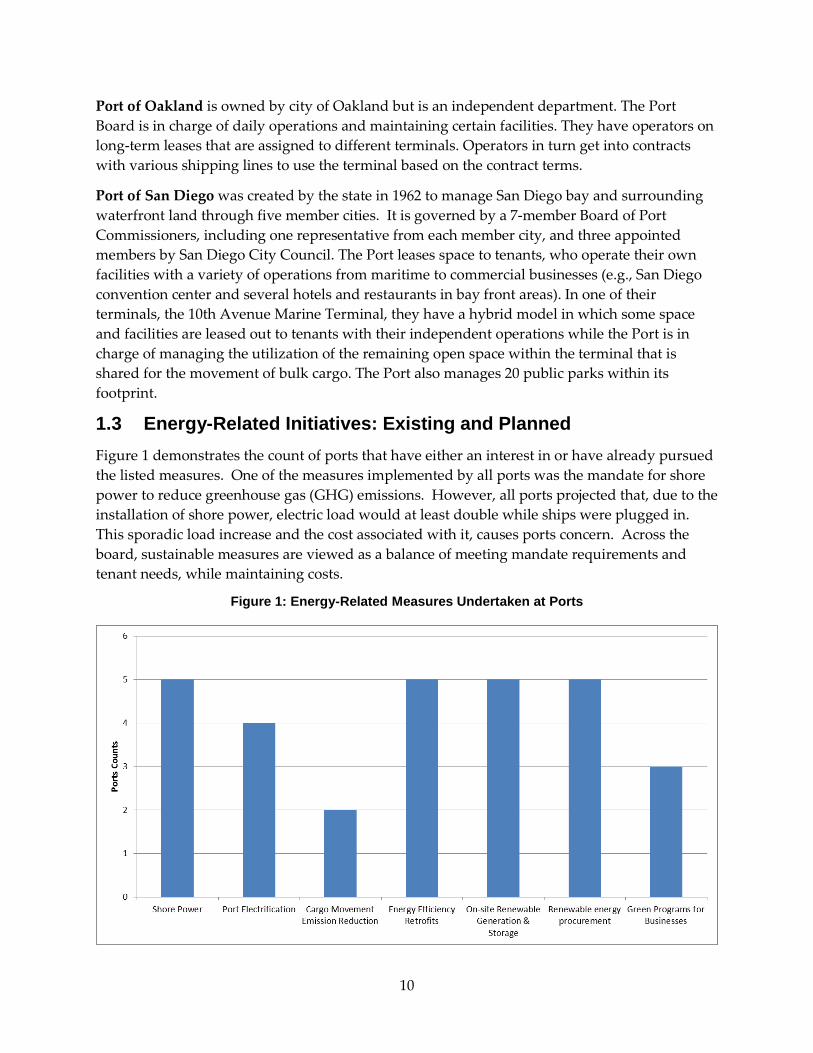
1.3 Energy-Related Initiatives: Existing and Planned Figure 1 demonstrates the count of ports that have either an interest in or have already pursued the listed measures. One of the measures implemented by all ports was the mandate for shore power to reduce greenhouse gas (GHG) emissions. However, all ports projected that, due to the installation of shore power, electric load would at least double while ships were plugged in. This sporadic load increase and the cost associated with it, causes ports concern. Across the board, sustainable measures are viewed as a balance of meeting mandate requirements and tenant needs, while maintaining costs.
Figure 1: Energy-Related Measures Undertaken at Ports
11
The following sections summarize existing and planned energy initiatives that are undertaken in each port. Each individual initiative touches one or more of the energy-related measures displayed in Figure 1.
1.3.1 Port of Hueneme Green Marine
The Port joined the national Green Marine program, an environmental program makes it possible for ports, terminal operators and shipping lines to voluntarily reduce their environmental footprint through a comprehensive program that addresses key environmental issues and criteria using 11 performance indicators including air emissions, community impacts, environmental leadership and much more.
Shore Power Program
The Port stays compliant with the requirements and is involved in the design and construction of high voltage electrical infrastructure, allowing ships to plug into the electric grid while docked and thus reduce emissions. The five deep-water berths are equipped with shore-side power capacity for vessels to plug in.
Navy Smart Micro-grid Project
The Port, with sponsorship from the California Energy Commission (CEC), will demonstrate a microgrid system that consists of 150kW of solar PV capacity and 100kW/400kWh of energy storage.
Tesla Installation
The Port is looking into the installation of Tesla energy storage systems to support back up power in case of outages, as well as cost saving due to peak shaving. The Port is further considering the installation of PV.
Port-wide Energy Audit actions
The Port, after the completion of an energy audit in 2009, began to pursue energy improvement projects, including lighting overhaul, HVAC upgrades, and chilling system upgrades.
12
1.3.2 Port of Long Beach Green Port Policy
The Green Port Policy ensures that the Port operates under the following five guiding principles:
• Protect the community from harmful environmental impacts of Port operations;
• Distinguish the Port as a leader in environmental stewardship and compliance;
• Promote sustainability;
• Employ best available technology to avoid or reduce environmental impact;
• Engage and educate the community.
Shore Power Program
Port of Long Beach stays ahead of the curve equipping several of their terminals with shore power capabilities. Even before CARB adopted its final rule in 2008, International Transportation Service and K Line teamed with the Port and successfully plugged in at Pier G. In 2009, tankers began plugging into shore power at berth at Pier T. The terminal formerly operated by BP and now by Tesoro made history as the first and only place in the world where oil tankers can run on electricity at berth. In 2011, SSA Terminals and Matson followed suit at the Pier C container terminal.
Outreach to tenants and shipping lines has been as intensive as readying the infrastructure. Staff from the Port’s engineering, construction, environmental, trade and communications divisions have worked closely with CARB officials to ensure terminal operators and shipping lines have as much information as possible to comply with the regulation.
In addition, Port of Long Beach, due to the mandate for shore power regulation increasing power requirements in 2017-2018, has been testing innovated alternative technologies that would install barge like structures that would fit into the deck of a ship to provide direct power.
Zero Emissions Container Movement
The Port aims to reduce overall GHG emissions, pursuing not only a shore power program, but also initiatives to reduce emissions from land activities. To further this, the Port is implementing the incremental electrification of cargo-handling equipment for which they received funding under EPA’s DERA.
Energy Island Initiative
The Port is working to transition to renewable power sources and self-generation systems. They envision a network of connected microgrids to reduce the port’s carbon footprint. Along with creating the ability for the Port to operate independently from the grid in times of emergency or other needs, the initiative’s main objectives are stabilizing power costs for terminal operations,
13
further reducing the port’s carbon footprint, and increasing the competitive advantages of doing business at Long Beach.
1.3.3 Port of Los Angeles Shore Power Program
At the Port of Los Angeles, ships equipped to connect to shore-side power can now do so at all eight marine container terminals and the Port’s World Cruise Center. Approximately $180 million has been invested over the last decade to equip 25 container and cruise berths with Alternative Maritime Power™ shore-side power infrastructure.
Electrified Port Program
The Port has plans to automate and electrify terminal machinery including yard hustlers, fork lifts, automatic stacking cranes, electric rail cranes behind the dock rail stations. They are currently having discussions to standardize the electrical connections to electrical trucks envisioning in near future to have e-trucks that move between port area and nearest distance within 15 to 30 miles radius.
Lighting Retrofit
The Port has begun to convert high pressure sodium lights to LED lights for exterior lighting systems. They adopted a policy requiring all the lights are going to be converted to LED for any area requiring re-modification or new design. The policy specifically targets high mass lighting, which is around 1/3 of each terminal’s load. The retrofit takes place very strategically and cautiously because it is expensive but the Port also realizes the benefits of it. Eventually, the LED program will convert all the mass lighting that are on 100 foot long poles on container terminals and cargo yards totaling 7000 fixtures. Upon completion, the port will reduce 8-10 MW of their demand which accounts for 1/6 of total footprint’s demand. The budget for full conversion is estimated at $15 million over 1-1.5 years that take to complete. So far, the port has converted less that 5-10% of the lighting system as part of other modifications that impact the light poles.
Solar PV Generation
The Port partnered with the local utility, Los Angeles Department of Water and Power (LADWP) to install 10 MW of solar capacity. This project mutually benefits the port and the utility to fulfill their mandates to offset shore power consumption by local renewable generation and to add renewable generation to their portfolio for state’s RPS standards, respectively.
Green Energy Procurement Program
As part of this program, the port aims to have 25-30% of internal meters fed by green energy, and they purchase green power from their utility provider, LADWP.
14
1.3.4 Port of Oakland Shore Power Program
In compliance with At-Berth Regulations, the port has shore power available at the following marine terminals/berths: Berths 24, 25/26 at Ports America Outer Harbor, Berths 30 and 32 at TraPac, Berths 35 and 37 at Ben E. Nutter (Evergreen), Berths 55 and 59 at Oakland International Container Terminal (OICT), Berths 61 and 62 at Matson, and Berth 68 at Charles P. Howard.
The Port of Oakland adopted utility rates for shore power usage. These rates and charges include a rate of $267 per hour (plus applicable taxes) and a vessel commissioning charge of $3,600. These rates are further outlined by Port Ordinance. Infrastructure at Berths 60-63, and 68 is not owned or managed by the Port and information on those berths is housed by terminal operator.
Dark Skies Program
Port and tenants shall comply with prescribed exterior lighting measures to prevent light pollution and reduce energy consumption.
GHG Reduction
The Port of Oakland is aiming to purchase 75% of energy via GHG-free sources. The strategy involves a partnership with the East Bay Municipal Utilities District (EBMUD). The Port currently purchases renewable energy from EBMUD’s biogas facility at the foot of the Bay Bridge and then resells it to port’s tenants with no cost increase. All of the energy purchased from EBMUD is renewable and reduces the output of greenhouse gases from traditional fuel sources. Together with the port’s purchase of renewable energy from SunEdison and EBMUD, as well as hydroelectric purchases, the total power portfolio provided to port’s tenants is projected to increase from 50% greenhouse gas-free in 2014 to 75% by 2018.
Green Business Program
This is a voluntary program which certifies businesses as green based on prove reductions in waste and pollution, and conservation of energy and water.
Port Energy Rebate Program
The Port provides rebates to tenants who pursue energy efficient upgrades, including PV installation, lighting retrofits, and other energy saving equipment retrofits. Port acts as a municipal utility and has a 2.85% surcharge on their tenants’ electric bills, to fund their incentive program.
1.3.5 Port of San Diego Climate Action Plan
The port aims to reduce GHG emissions by 10% by 2020 and 25% by 2035, relative to 2006 levels. The Port is pursuing this goal via facility upgrades, data tracking, education, installation of renewable generation facilities, and conversion of fleet to alternative fuels.
15
Shore Power Program
Both Cruise Ship Terminal and 10th Avenue Marine Terminal are equipped by shore power facilities for passenger ships and reefers, respectively. The port is involved in planning and design discussions to prepare for compliance once the regulation bumps up in 2017.
Clean Truck Program
The Port developed and launched a program to reduce emissions from port related land-side vehicles, replacing older truck engines with new, less pollutant-generating models. Vehicles that do not comply with the drayage Clean Truck Program are not permitted to operate at the port.
Green Business Network
The Port provides a voluntary program for tenants, supporting these businesses in pursuing energy efficiency and sustainability. The port provides at no cost to members: energy audits, education workshops, marketing support for sustainable programs, and networking events.
1.4 Funding Opportunities For most part, ports self-fund many of the initiatives they undertake to improve their energy-related infrastructure. They capitalize these projects through low interest loans (e.g., bonds) and recoup the cost through lease and tariff charges for the cargo that comes across their terminals.
Furthermore, ports actively seek opportunities from a variety of sources that can fund clean energy projects outside their internal budgets without having to increase fees for their tenants. Funding sources are detailed further in Appendix C. Examples of these sources include:
Loan Programs:
• Loan Programs Office (LPO) – Provides loans to accepted applicants for energy related projects though Renewable Energy Efficient Energy (REEE) Project, Advanced Fossil Energy Projects, and Distributed Energy Projects, with the aim to “create economic opportunity, strengthen energy security, and reduce GHG emissions”.
Grants: Several grants are offered by different programs such as:
• EPIC Grant: Run by the CEC, a portion of this grant program will provide funding for applied research and development, technology demonstration and deployment, and market facilitation for clean energy technologies.
• ARFVTP: Run by the CEC, provides grants for development and deployment of low-carbon alternative fuels, fueling infrastructure, and advanced vehicle technologies.
• Natural Gas R&D: Run by the CEC, provides grants that seeks to achieves long-term benefits to natural gas ratepayers by developing technologies and products that provide clean, diverse, and environmentally sound energy systems.
16
• DERA: An EPA program, Diesel Emission Reduction Act, providing grants to switch diesel engines to less pollutant-generating engines.
• ARB: Grants are provided for a variety of emission reduction technologies.
• Prop 1B: Goods Movement Emission Reduction Program
• SCAQMD Carl Moyer Program: Provides funding to encourage the owners of diesel engines to go beyond regulatory requirements by retrofitting, repowering, or replacing their engines with newer and cleaner ones.
• Department of Energy: DOE offers several grants and initiatives that are applicable to energy-related investments at ports:
o Zero Emission Cargo Transport Grant
o Smart Grid Investment Grant (SGIG)
o Energy Storage Program
State Incentive Programs:
• Self-Generation Incentive Program (SGIP): Provides financial incentives for the installation of clean and efficient distributed generation technologies.
• ARB:
o Clean Vehicle Rebate Project provides financial incentives for the upgrade of standard vehicle fleets to cleaner alternatives.
o Cap-and-trade is a market based regulation that is designed to reduce greenhouse gases (GHGs) from multiple sources. The cap will decline approximately 3 percent each year beginning in 2013. Trading creates incentives to reduce GHGs below allowable levels through investments in clean technologies. With a carbon market, a price on carbon is established for GHGs. Market forces spur technological innovation and investments in clean energy.
o Hybrid and Zero-Emission Truck and Bus Voucher Incentive Project (HVIP) provides vouchers to help California fleets purchase advanced technology trucks and buses.
• Automated Demand Response (ADR): Run by several utilities and provides incentives and technical assistance for customers investing in energy management technologies that also enable them to perform demand response.
• CPUC Energy Efficiency Funding: Offers, via local utilities, a variety of ratepayer-funded energy efficiency programs and incentives.
Third Party Financing: Third Party companies (such as SunEdison, SolarCity, and Ameresco) are specialized in developing financing schemes for clean energy investments through a wide
17
range of mechanisms to raise capital through public markets such as asset backed securities, investment pools, real estate investment trusts, power purchase agreements, and the sale of renewable energy credits.
1.5 Implementation Drivers and Barriers All ports share the same goal—to run a sustainable and profitable business. To achieve this major tenet, the ports desire to be good stewards to the community, including a focus on environmental stewardship, and thus, clean energy measures. This balance is a challenge within the competitive shipping market.
Ports consider several criteria to evaluate energy-related investments. The common themes among all ports can be summarized as follows:
• Proposed project/technologies should fulfill the environmental objectives that the port has set forward such as zero-emissions, energy conservation metrics, etc.
• Technologies that are considered should be suited for integration into port-related operations and preferably offers flexibility and/or scalability to accommodate future investments.
• Projects should be economically viable and have reasonable pay-back periods and return on investments by considering applicable funding opportunities.
Justification for implementation across all ports is mostly driven by mandates and internal goals to improve energy efficiency and security at their footprints. While all ports have sustainable operation as a goal, the concern that any additional expenses could make them less competitive bars implementation. Mandates, however, level the playing field by requiring all ports to adhere to the same metrics, and thus, impose the same costs across the board upon tenants. In addition to mandates, spaces that have been deemed “protected” drive the operations of the port in a more sustainable direction, mostly related to reducing emissions to both water and air.
Ports face several barriers to invest in technologies that improve their energy profile. These barriers range from budgetary issues, to operational limitations, to social impacts.
Competitiveness Considerations: The competitiveness of the ports is largely dependent on keeping costs low. Clean energy projects are often cost intensive, and the biggest source of funding is internal. If a port has to increase leases to fund projects, it will detrimentally affect its competitiveness. The ports share a concern that lessees who feel that rate changes (increased to defray the cost of more expensive infrastructure or clean energy procurement) are excessive, may leave the lease for a more competitively priced port. Some ports’ representatives noted that for grant funding to be effective, it needs to be more focused on measures that can be installed immediately. Several ports believe that innovative measures that are not yet field-tested and are still prohibitively expensive, regardless of grant funding, cannot be successfully implemented in the highly competitive ports.
Operational Considerations: Energy is not the core business of the ports. While many ports are progressive in adopting more innovative technologies for conservation and resiliency purposes,

18
ports must still prioritize activities within the structure of their core business. In addition, all ports, but especially smaller ports, are challenged by space constraints, preventing them from installing generation equipment that would take up significant space (such as solar arrays).
Social Consideration: Ports need to carefully consider the effects of their initiatives (such as terminal electrification and automation) on their workforce structure (logistics operations, warehousing, trucking, etc.) and need to work closely with labor unions and other stakeholders to ensure alignment.
19
CHAPTER 2: Site and Measure Screening and Selection 2.1 Summary of Data Collection DNV GL gathered existing data, facts, and research in order to provide a starting point for the analysis. Main sources of data were the ports’ websites and affiliated sites, publicly available reports on energy management plans, energy policy roadmaps, and assessment studies performed by or on behalf of the ports.
Following this initial data collection phase, DNV GL conducted interviews with representatives from each port. As summarized in Chapter 1, these interviews provided insight into daily operational challenges, future development concerns, and financial barriers, as well as the ports’ own ideas on potential energy efficiency measures to assess in this study. The interviews also led to more targeted data collection efforts. Additional information specifically referenced in interviews and not available to the public was provided by the ports, as possible.
Each port provided budgetary or financial information, environmentally focused action plans, programs, and policies, and reports on findings from local environmental studies. When available, the ports also provided their Port Master Plan. These Plans describe the overarching goals of the port, specifying locations, timelines, and approximate budgets for planned work. Exact energy usage or PV production data were not generally available. Many ports operate as landlords, such that the tenants pay their bills directly to the utility.
Due to current regulations, much of the ports’ current energy efficiency activity is motivated by GHG reduction. Many of the documents reviewed by DNV GL reflected that focus. Finally, as many environmental initiatives are in early stages (e.g., studies on installing a microgrid), or are part of standard practice (e.g., replacing exterior fixtures with LEDs during standard maintenance), much of the information about those projects was conveyed via interview.
20
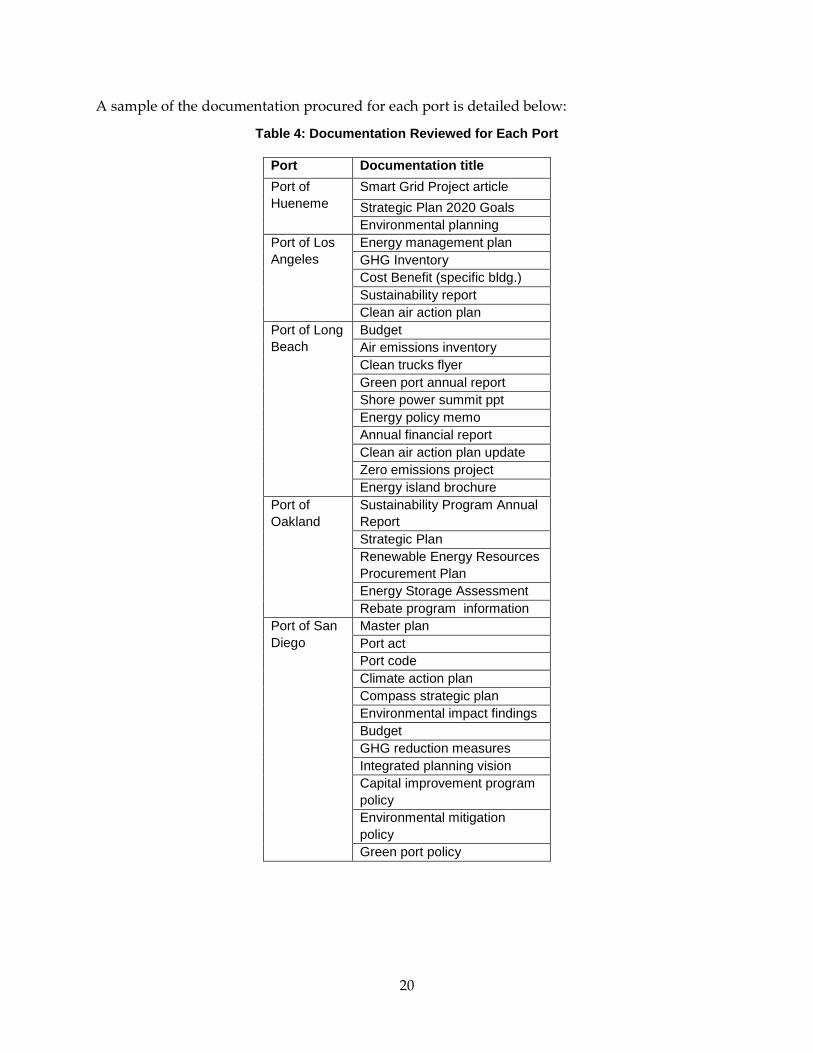
A sample of the documentation procured for each port is detailed below:
Table 4: Documentation Reviewed for Each Port
Port Documentation title Port of Hueneme
Smart Grid Project article Strategic Plan 2020 Goals Environmental planning
Port of Los Angeles
Energy management plan GHG Inventory Cost Benefit (specific bldg.) Sustainability report Clean air action plan
Port of Long Beach
Budget Air emissions inventory Clean trucks flyer Green port annual report Shore power summit ppt Energy policy memo Annual financial report Clean air action plan update Zero emissions project Energy island brochure
Port of Oakland
Sustainability Program Annual Report Strategic Plan Renewable Energy Resources Procurement Plan Energy Storage Assessment Rebate program information
Port of San Diego
Master plan Port act Port code Climate action plan Compass strategic plan Environmental impact findings Budget GHG reduction measures Integrated planning vision Capital improvement program policy Environmental mitigation policy Green port policy
21
2.2 Site Selection This section describes the factors considered in selecting a site among California ports to perform the deep-dive assessment. One of the major objectives of this assessment was to implement a clean energy framework that supports screening of clean energy measures at ports in California. DNV GL’s intent was to select a study site with a diverse set of functions and users, such that the findings and insights from the study could be extended to other ports. The three factors considered were:
1. The port’s management structure and relationship with tenants and operators: The port authority’s relationship with tenants and operators was prioritized, based on interviews and demonstrated programming, since it would have a significant impact on the decision-making process for clean energy investments. In addition, close tenant relationships help increase data accessibility, which is vital for testing the framework.
2. Size and operations diversity: The sizes of the ports were compared according to available dry land space, with the goal of identifying the port with closest to the median amount of space. This port would have availability for new infrastructure but also represent the constraints of a smaller-sized port. DNV GL tallied the diversity of each port’s operations, with the goal of representing a broad range of marine operations applicable to most ports.
3. Clean energy measures diversity: The port’s current clean energy measure diversity, both in implemented projects and in potential future measures, was assessed in order to select a candidate with a diverse set of energy-related measures for in the deep-dive assessment.
Based on these criteria, DNV GL proposed the Port of San Diego for the deep-dive on-site assessment of clean energy measures. The Port of San Diego is one of the top 30 US containership ports and has an annual energy consumption of over 6.5 gigawatt-hours (GWh) (as of 2014).
The Port has a history of engagement with tenants to promote sustainability and clean energy practices, and thus fulfills the first criterion listed above. Joint initiatives with tenants include Green Port, Green Business Network, and Utility Data Ordinance.
The Port of San Diego fits the second criterion as well, with diverse maritime and commercial operations including cargo, cruise ship and container terminals, as well as recreational businesses.
Like the other four California ports surveyed, the Port of San Diego is committed to environmental stewardship and has undertaken several initiatives under their Climate Act Plan, fulfilling the third criterion listed above. The initiatives include equipping recreational and cargo marine terminals with shore power, offering no-cost energy audits to tenants, and retrofitting interior and exterior lighting. Phase II of the exterior lighting retrofit project was completed in February 2015, replacing 296 street, parking, and walkway lights with LEDs, reducing energy consumption by 270,000 kilowatt-hours (kWh) annually. In the near future,
22
regulations may require expansion of shore power facilities. The Port faces constraints on shore power expansion both in electric capacity (total of up to 36 MW capacity needed for full shore power deployment) and real estate. These limitations, combined with high electricity prices, motivate the adoption of more innovative energy technologies such as demand side management or on-site generation and storage.
While the Port of San Diego has multiple opportunities for clean energy adoption, it faces barriers to investment in clean energy measures including aging infrastructure, core operations considerations, and lack of state funding. These barriers are also relevant to other CA ports. Exploring a diverse set of energy measures and a wide range of limiting factors through the detailed assessment of the Port of San Diego would create a robust assessment framework applicable for all California ports.
Finally, like most California ports, the Port of San Diego is served by an investor-owned utility (San Diego Gas & Electric, SDG&E). The potential for collaboration with the utility on energy efficiency and sustainability measures is generalizable to other ports in IOU service areas.
The initial site selection for the deep dive assessment was based on publicly available data and information that DNV GL was able to obtain directly from the ports. The selection is not intended to reflect the full potential for measures within the State or at a given port. In parallel with the deep dive assessment of the Port of San Diego, DNV GL continued to gather information about other ports to support the development of the assessment framework.
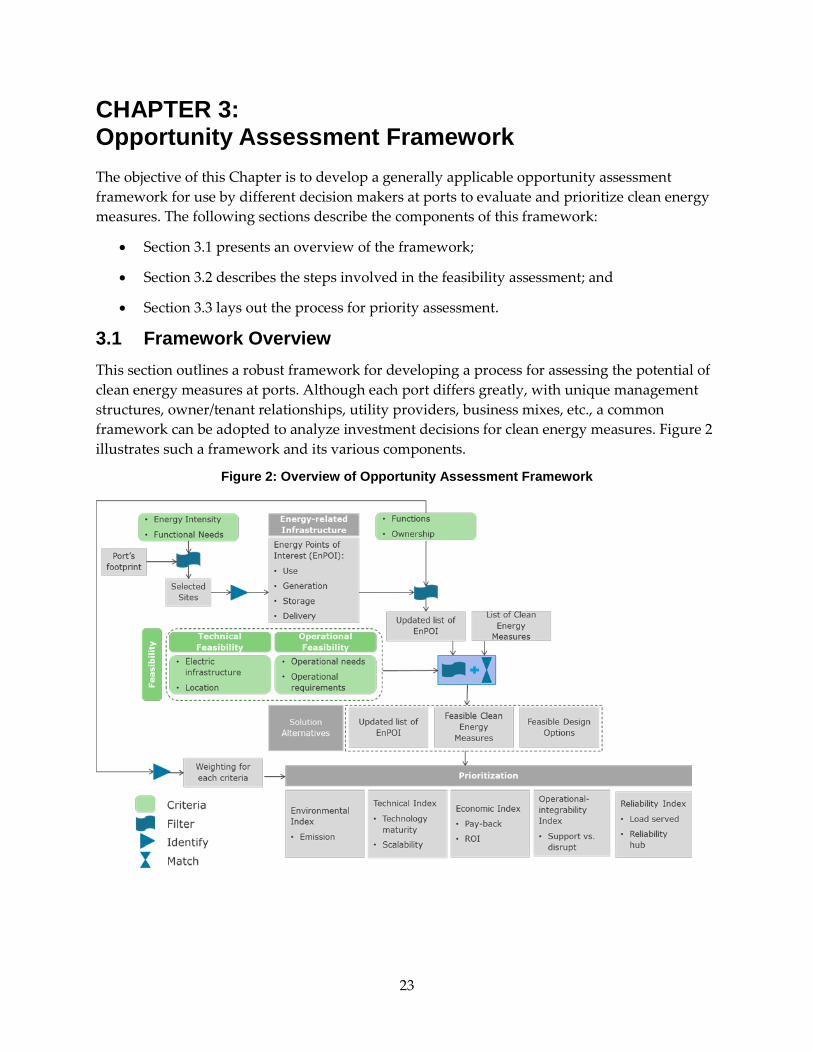
23
CHAPTER 3: Opportunity Assessment Framework The objective of this Chapter is to develop a generally applicable opportunity assessment framework for use by different decision makers at ports to evaluate and prioritize clean energy measures. The following sections describe the components of this framework:
• Section 3.1 presents an overview of the framework;
• Section 3.2 describes the steps involved in the feasibility assessment; and
• Section 3.3 lays out the process for priority assessment.
3.1 Framework Overview This section outlines a robust framework for developing a process for assessing the potential of clean energy measures at ports. Although each port differs greatly, with unique management structures, owner/tenant relationships, utility providers, business mixes, etc., a common framework can be adopted to analyze investment decisions for clean energy measures. Figure 2 illustrates such a framework and its various components.
Figure 2: Overview of Opportunity Assessment Framework
24
The process is comprised of two main steps:
1. Feasibility Assessment in which viable alternative solutions are identified through several stages:
a. Site segmentation, to initially screen locations as potential candidates for energy upgrades.
b. Identification of energy points of interest (EnPOI) within selected site segments. EnPOI include:
i. Usage nodes, such as administrative buildings, cold storage facilities, and the port’s electrified equipment, that consumes energy.
ii. Generation nodes, including any on-site generation such as solar or back-up diesel generation.
iii. Storage nodes, such as battery and thermal storage.
iv. Delivery, including electric infrastructure that connects usage, generation and storage nodes.
c. First pass filtration to narrow down the existing list of EnPOI by overlaying ownership and functions characteristics of each node. For the points that pass through the filter, ownership and functions characteristics are identified and carried over to the feasibility assessment and prioritization.
d. Identification of possible clean energy measures for further assessment.
e. Second pass filtration and EnPOI/energy measures mapping based on technical and operational feasibility.
f. Creation of feasible alternative solution packages that identify clean energy measures that are feasible for each EnPOI along with feasible design options.
2. Alternatives Prioritization, in which the solutions identified in the Feasibility Assessment are ranked according to performance.
a. Decision-makers choose numerical weights corresponding to the importance of each criterion.
b. The performance of each solution is evaluated against each criterion and assigned a numeric score, based either on calculations or qualitative judgment. The performance of each solution can now be compared for different criteria.
c. For each solution, the criteria scores are weighted according to (a) and summed. Solution alternatives are ranked by the weighted sums to evaluate their overall relative performance.
25
This method ensures a consistent and concise ranking among several objectives and enables the decision maker to prioritize investment options based on preferred objectives across different dimensions. The following subsections describe the method in detail with illustrative examples.
3.2 Feasibility Assessment 3.2.1 Site Segmentation Following the framework laid out above, the first step in the assessment process is to classify different sites in the port’s footprint by their functional needs and energy intensity, in order to identify the sites that show potential for energy upgrades. The classification is based on a combination of certain functional needs, such as improvement in resiliency, security, power quality, or energy intensity, which drives the demand for more generation or supply capacity.
As an example, the At-Berth Regulation requires container ships, passenger ships, and refrigerated-cargo ships to reduce emissions while in port by running their auxiliary engines on shore power. Since the regulation took effect in December 2007, several terminals in California ports have provided vessel fleet operators with grid-based shore power. This has driven up electricity demand at those terminals. The shore power facilities have low load factors, requiring relatively high capacity, and do not have continuous power consumption patterns. These conditions make the shore power facilities good candidates for local energy upgrade investments. Upgrades would aim at reducing the necessary capacity while helping manage costs with peak shaving if applicable.
Energy security and resiliency are also factors that drive the adoption of the types of clean energy solutions that can serve as back-up resources during emergency events. Improved resiliency benefits critical facilities, including security and police operations buildings. For instance, a potential microgrid solution for the Joint Command and Control Center in the Port of Long Beach would have multiple benefits, including both improved resiliency and more environmentally sustainable operations.
A port can serve as a resiliency hub, vital to assisting the surrounding community during extended outage events due to natural disasters. The Port of San Diego, for example, is not only situated close to dense urban communities, but also hosts a Cruise Ship Terminal (with a building that is used to facilitate passengers’ visits) and is the landlord for several non-maritime businesses including hotels, restaurants, and a convention center. These facilities, if equipped with islanding capabilities, could not only sustain power for critical port operations during an outage, but also serve as emergency shelters for the community. Although the ability to maintain power is not the only consideration in designing and operating emergency shelters, the support of a steady power supply would be key for offering such facilities.
26
Within each site, the portfolio of energy-related infrastructure should be identified, characterized, and then assigned to the following categories:
• Usage: Buildings and equipment that are considered consumers of electric energy.
• Generation: Resources such as back-up diesel-electric generators, roof-top PV, etc. that generate electricity in each port’s segment.
• Storage: Electric batteries or thermal energy storage devices.
• Delivery: Electric infrastructure for power distribution from source to supply such as circuits feeding the facilities, utility metering points, etc.
3.2.2 First Pass Filtration; Functions and Ownership The energy investment decision makers have to screen projects in order to narrow the focus and determine the feasibility of the proposed energy upgrades. The first screening step identifies which EnPOI can be included in the assessment, based on functional needs as well as ownership and the resulting operational rights and responsibilities. Management structure and landlord-tenant relationships can create unique situations in ports for making energy-related investment decisions, potentially prohibiting certain projects due to lack/change of ownership and/or operational rights. For example, a tenant-operated building might have sufficient space and sun exposure for a PV installation, but the port may not have access or control over that rooftop according to the lease agreement. In such cases, the tenant could undertake the investment, the port could modify the lease if possible, or the port must delay implementation until the lease term is over. In general, if existing agreements prohibit the port from accessing certain facilities or operating the necessary assets, the facility should be eliminated as a site of interest.
The operation of clean energy projects – in particular, renewable generation, storage and advanced dynamic demand side management technologies – has strong implications for the economics of the investment. When the investor and the operator of an asset are two different entities, the effects of the asset’s operation and maintenance on the investor’s financials must be considered.
Joint projects with multiple investors may complicate the situation further. In these cases, the functional needs of each party and how the needs will be met by operations arrangements should be taken into account when considering a project for further assessment.
3.2.3 Second Pass Filtration and Matching; Technical and Operational Feasibility After the firstpass filtration is completed, the EnPOI that remain must be screened for technically and operationally feasible solutions. This section describes the overall methodology used to identify and recommend energy improvements.
First, an energy usage baseline is established, including consumption of electricity, natural gas, fuel oil, and other fuels. The consumption baseline generally consists of monthly energy use data for the selected baseline year. To generate energy consumption trends for the facilities, a minimum of 3 consecutive years of billing data should be collected.
27
The energy-usage baseline enables comparison among similar facilities. Comparison allows the decision makers to determine whether energy consumption of facilities is higher or lower than expected, and which facilities have the greatest potential for reducing energy usage and costs.
Specifically:
• Consumption and demand data is used to develop a baseline daily profile for each facility, including peak electrical, steam, or natural gas demand (if applicable).
• Utility rate structures and pricing break points for demand are analyzed to determine their effects, if any, on utility costs.
• Existing sub-metering and the potential for sub-metering installation at the facilities are assessed for future measurement and verification of energy savings.
When making baseline comparisons among similar facilities, it is important that climate, type and size of the facility, and occupancy patterns are taken into account as well.
The next step in the screening process is conducting an on-site assessment of the facilities of interest. Prior to conducting the field visit, the staff should review any existing plans or reports on the buildings in order to understand the nature of the facility and on-site focus areas. Field data collection should be efficient yet comprehensive; leveraging either paper or electronic data collection instruments as well as photography to clearly document findings. The field team should also bring or confirm on-site availability of additional equipment including flashlights, measurement devices, safety gear, and possibly a ladder to access rooftops or ceiling panels.
After data collection is completed, the feasibility assessment focuses on the clean energy options’ technical requirements and constraints to identify options appropriate for the port. Additionally, operational requirements at each facility are benchmarked against the identified measures to determine the impact of clean energy technologies on the operations. This assessment includes the review of:
1. Locational Requirements and Potential:
a. Review utility rules on distributed generation/renewable generation interconnection that are applicable to the clean energy options that the facility may implement.
b. Review the available space and constraints on-site for implementing clean energy measures.
c. Review the available space and constraints off-site for implementing clean energy measures. For example, a renewable generation facility may be installed close to feed-in substations, for ease of interconnection with the utility.
28
2. Port Electric Capacity Assessment:
a. Review the port electric circuit one-line diagram, identifying the transmission of power from the feeding points to the port’s major load areas, such as shore power plug-in points.
b. Review the capacity of feeds, transformers, and other equipment to identify the thermal limit margin and if additional capacity is needed.
c. Review energy service agreements between the port and tenant / visiting vessel.
d. Review back-up generation and distributed generation/renewable generation sources, both existing and planned.
3. Operational Feasibility Assessment:
a. Determine the clean energy technology’s impact on port operations, categorized as disruptive or supportive/non-disruptive. This must take into account both physical impacts and energy impacts, as port operations are highly optimized for both cargo movement and space utilization. For example:
i. Physical constraints – The National City Marine Terminal in the Port of San Diego, a vehicle import/export facility operated by Pasha Automotive Services, consists of a large parking area. This space would provide good opportunity for solar PV installations given the location and sun exposure. However, the main operational goal in this facility is to move cargo as quickly and efficiently as possible. As such, vertical structures in PV installations would seriously jeopardize the required functionality of the facility.
ii. Energy requirements – Electrified cargo handling equipment requires higher power quality than standardly utilized in other port operations. Therefore, evaluating different technologies should consider power electronics that can support the high-quality power needs of such equipment.
Finally, based on the screening and assessment, the information from the facilities review and data analysis is compiled and analyzed to identify clean energy upgrades at each facility. Using this data, facilities engineers develop and assess a list of potential improvements. These may range from upgrades to building envelopes, lighting, HVAC systems, controls, and process equipment, to the integration of on-site renewables and energy storage.
3.3 Priority Assessment DNV GL recognizes that each port has individual priorities and constraints. Thus, while general recommendations for energy efficiency upgrades may apply across multiple ports, it is understood that each port may need approach these recommendations from a unique perspective. A prioritization matrix is a useful tool to address these differences. This matrix helps create a weighting scheme for criteria which, when combined with the individual criteria evaluations, will rank the appropriateness of alternative solutions for the port.
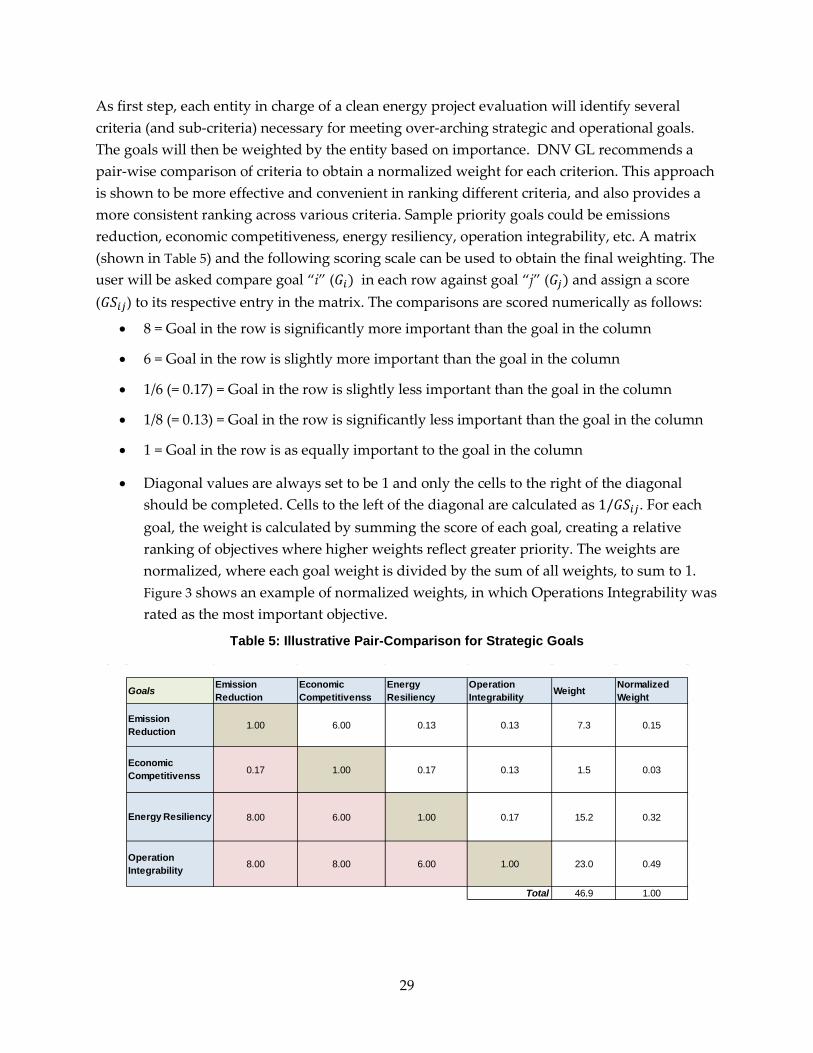
29
As first step, each entity in charge of a clean energy project evaluation will identify several criteria (and sub-criteria) necessary for meeting over-arching strategic and operational goals. The goals will then be weighted by the entity based on importance. DNV GL recommends a pair-wise comparison of criteria to obtain a normalized weight for each criterion. This approach is shown to be more effective and convenient in ranking different criteria, and also provides a more consistent ranking across various criteria. Sample priority goals could be emissions reduction, economic competitiveness, energy resiliency, operation integrability, etc. A matrix (shown in Table 5) and the following scoring scale can be used to obtain the final weighting. The user will be asked compare goal “i” (𝐺𝐺𝑖𝑖) in each row against goal “j” (𝐺𝐺𝑗𝑗) and assign a score (𝐺𝐺𝐺𝐺𝑖𝑖𝑗𝑗) to its respective entry in the matrix. The comparisons are scored numerically as follows:
• 8 = Goal in the row is significantly more important than the goal in the column
• 6 = Goal in the row is slightly more important than the goal in the column
• 1/6 (= 0.17) = Goal in the row is slightly less important than the goal in the column
• 1/8 (= 0.13) = Goal in the row is significantly less important than the goal in the column
• 1 = Goal in the row is as equally important to the goal in the column
• Diagonal values are always set to be 1 and only the cells to the right of the diagonal should be completed. Cells to the left of the diagonal are calculated as 1/𝐺𝐺𝐺𝐺𝑖𝑖𝑗𝑗. For each goal, the weight is calculated by summing the score of each goal, creating a relative ranking of objectives where higher weights reflect greater priority. The weights are normalized, where each goal weight is divided by the sum of all weights, to sum to 1. Figure 3 shows an example of normalized weights, in which Operations Integrability was rated as the most important objective.
Table 5: Illustrative Pair-Comparison for Strategic Goals
Goals Emission Reduction
Economic Competitivenss
Energy Resiliency
Operation Integrability Weight Normalized
Weight
Emission Reduction 1.00 6.00 0.13 0.13 7.3 0.15
Economic Competitivenss 0.17 1.00 0.17 0.13 1.5 0.03
Energy Resiliency 8.00 6.00 1.00 0.17 15.2 0.32
Operation Integrability 8.00 8.00 6.00 1.00 23.0 0.49
Total 46.9 1.00
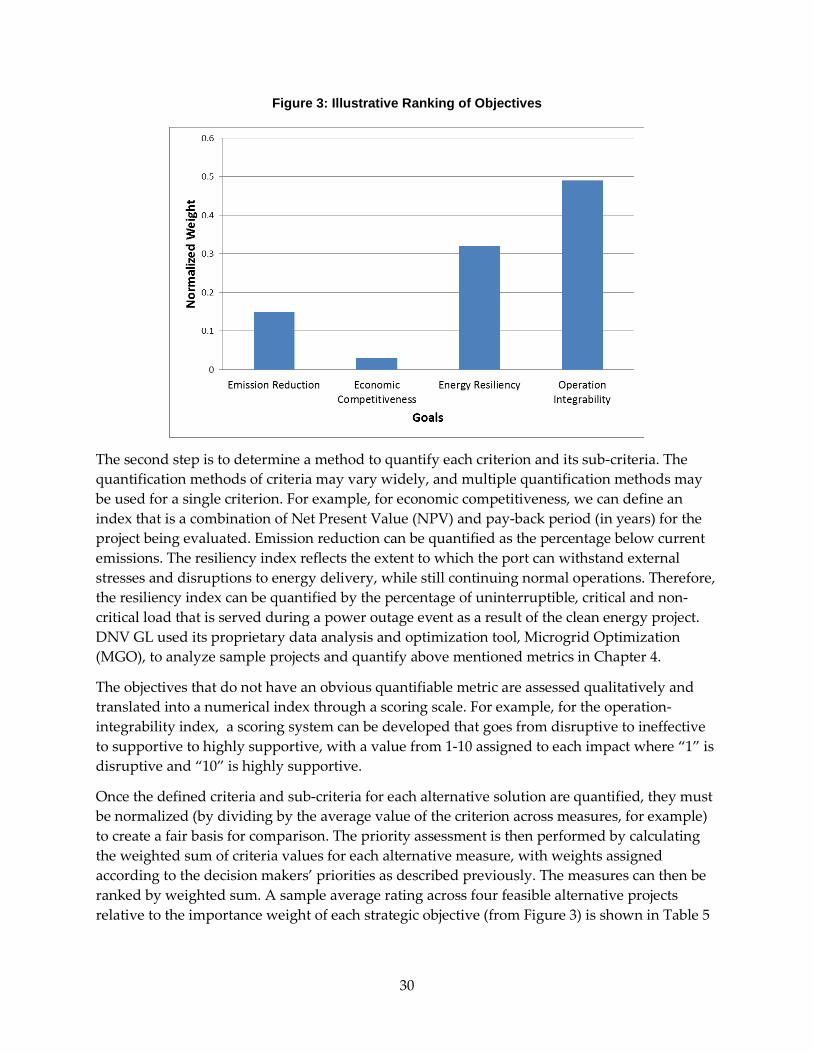
30
Figure 3: Illustrative Ranking of Objectives
The second step is to determine a method to quantify each criterion and its sub-criteria. The quantification methods of criteria may vary widely, and multiple quantification methods may be used for a single criterion. For example, for economic competitiveness, we can define an index that is a combination of Net Present Value (NPV) and pay-back period (in years) for the project being evaluated. Emission reduction can be quantified as the percentage below current emissions. The resiliency index reflects the extent to which the port can withstand external stresses and disruptions to energy delivery, while still continuing normal operations. Therefore, the resiliency index can be quantified by the percentage of uninterruptible, critical and non-critical load that is served during a power outage event as a result of the clean energy project. DNV GL used its proprietary data analysis and optimization tool, Microgrid Optimization (MGO), to analyze sample projects and quantify above mentioned metrics in Chapter 4.
The objectives that do not have an obvious quantifiable metric are assessed qualitatively and translated into a numerical index through a scoring scale. For example, for the operation-integrability index, a scoring system can be developed that goes from disruptive to ineffective to supportive to highly supportive, with a value from 1-10 assigned to each impact where “1” is disruptive and “10” is highly supportive.
Once the defined criteria and sub-criteria for each alternative solution are quantified, they must be normalized (by dividing by the average value of the criterion across measures, for example) to create a fair basis for comparison. The priority assessment is then performed by calculating the weighted sum of criteria values for each alternative measure, with weights assigned according to the decision makers’ priorities as described previously. The measures can then be ranked by weighted sum. A sample average rating across four feasible alternative projects relative to the importance weight of each strategic objective (from Figure 3) is shown in Table 5
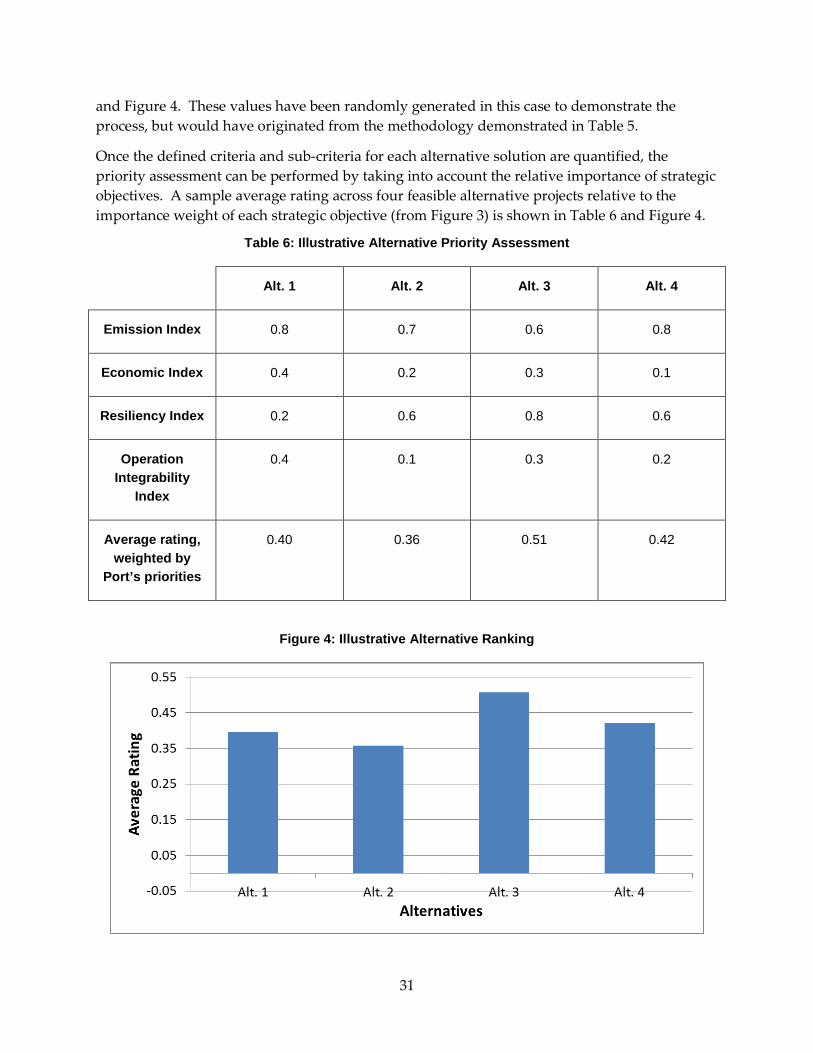
31
and Figure 4. These values have been randomly generated in this case to demonstrate the process, but would have originated from the methodology demonstrated in Table 5.
Once the defined criteria and sub-criteria for each alternative solution are quantified, the priority assessment can be performed by taking into account the relative importance of strategic objectives. A sample average rating across four feasible alternative projects relative to the importance weight of each strategic objective (from Figure 3) is shown in Table 6 and Figure 4.
Table 6: Illustrative Alternative Priority Assessment
Alt. 1 Alt. 2 Alt. 3 Alt. 4
Emission Index 0.8 0.7 0.6 0.8
Economic Index 0.4 0.2 0.3 0.1
Resiliency Index 0.2 0.6 0.8 0.6
Operation Integrability
Index
0.4 0.1 0.3 0.2
Average rating, weighted by
Port’s priorities
0.40 0.36 0.51 0.42
Figure 4: Illustrative Alternative Ranking
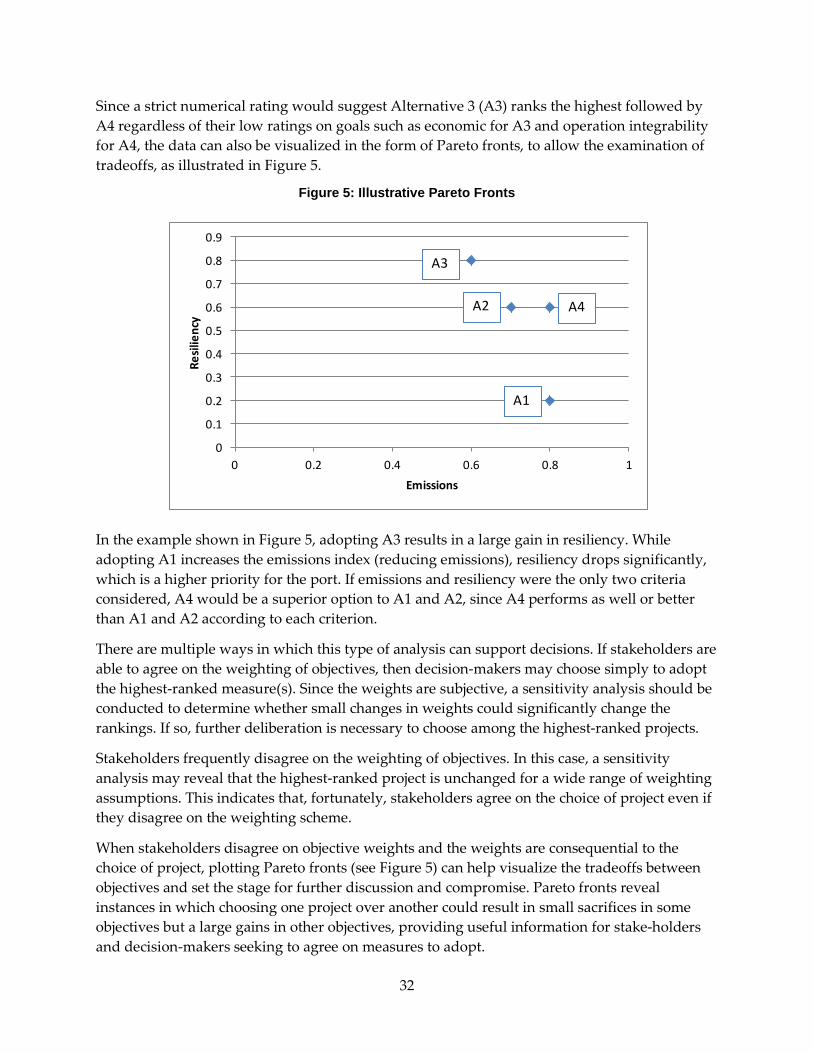
32
Since a strict numerical rating would suggest Alternative 3 (A3) ranks the highest followed by A4 regardless of their low ratings on goals such as economic for A3 and operation integrability for A4, the data can also be visualized in the form of Pareto fronts, to allow the examination of tradeoffs, as illustrated in Figure 5.
Figure 5: Illustrative Pareto Fronts
In the example shown in Figure 5, adopting A3 results in a large gain in resiliency. While adopting A1 increases the emissions index (reducing emissions), resiliency drops significantly, which is a higher priority for the port. If emissions and resiliency were the only two criteria considered, A4 would be a superior option to A1 and A2, since A4 performs as well or better than A1 and A2 according to each criterion.
There are multiple ways in which this type of analysis can support decisions. If stakeholders are able to agree on the weighting of objectives, then decision-makers may choose simply to adopt the highest-ranked measure(s). Since the weights are subjective, a sensitivity analysis should be conducted to determine whether small changes in weights could significantly change the rankings. If so, further deliberation is necessary to choose among the highest-ranked projects.
Stakeholders frequently disagree on the weighting of objectives. In this case, a sensitivity analysis may reveal that the highest-ranked project is unchanged for a wide range of weighting assumptions. This indicates that, fortunately, stakeholders agree on the choice of project even if they disagree on the weighting scheme.
When stakeholders disagree on objective weights and the weights are consequential to the choice of project, plotting Pareto fronts (see Figure 5) can help visualize the tradeoffs between objectives and set the stage for further discussion and compromise. Pareto fronts reveal instances in which choosing one project over another could result in small sacrifices in some objectives but a large gains in other objectives, providing useful information for stake-holders and decision-makers seeking to agree on measures to adopt.
0
0.1
0.2
0.3
0.4
0.5
0.6
0.7
0.8
0.9
0 0.2 0.4 0.6 0.8 1
Resil
ienc
y
Emissions
A3
A4A2
A1

33
The criteria assessments alone may be useful as well. For example, decision-makers may agree to rule out measures that fail to perform above a certain threshold, such as a 10% emissions reduction or a strict cost limit. The individual criteria assessments may be used to immediately eliminate any projects that do not clear the threshold.
Structuring the decision as proposed has the more general, qualitative benefit of helping identify and clarify points of debate among stakeholders. The assessment process develops clearly-defined measures and objectives, providing a starting point of common understanding from which the decision-making process can move forward.

34
CHAPTER 4: In-Depth Assessment; Port of San Diego 4.1 Data Collection DNV GL initiated data collection for the Port of San Diego simultaneously with the other California ports, during the site measure screening and selection. After the Port of San Diego was selected for the in-depth assessment, further data collection was initiated via a request for information (RFI). This data collection consisted of three phases: independent research, data provided by the Port of San Diego, and field survey. Sections 4.1.1 through 4.1.3 describe each of these data collection phases.
4.1.1 Independent Research DNV GL conducted independent research, utilizing publicly available data for the Port of San Diego. The Port’s website contained information pertaining to their vision, goals, and plans, budgets, financial reports, and scheduled expenses, and current and planned environmental initiatives. DNV GL reviewed this documentation to tease out data pertinent to the in-depth assessment, addressing the information needs of the RFI. Documentation and findings included:
• Port Master Plan
• Port Act
• Port Code
• Port Climate Action Plan 2013
• Compass Strategic Plan 2012 - 2017
• Environmental Impact Findings for the Chula Vista Bayfront Master Plan (CVBMP)
• Final Budget FY 2015-2016
• GHG Reduction Measures
• Integrated Planning Vision 2014
• Policy - Capital Improvement Program
• Policy - Environmental Mitigation
• Policy - Green Port
4.1.2 Data Provided by Port of San Diego DNV GL reviewed and processed various operational data from selected facilities provided by Port of San Diego. Data collection began gathering utility billing data, relevant plans, reports (e.g. facility energy audits) and other documents on each of the facilities at the Port. To facilitate data acquisition, a single document, the RFI, was assembled to describe the information that was needed and list useful sources for that information. This document was then distributed to
35
the departments that house the information and used as a tool to track the information that had been provided. In response to the RFI, the Port of San Diego provided sufficient data for DNV GL to complete an off-site assessment and data analysis. This documentation included details on completed or in-progress energy efficiency programs, plans for future energy efficiency programs, studies and site assessments, energy audit reports, maps and building information, and GHG reduction programs. A list of the provided and reviewed documentation can be found in Appendix B.
DNV GL also conducted in-person meetings and focus group discussions with Port staff who understood existing and planned energy-related projects in their facilities, as well as new projects that should be investigated. The meetings focused on:
• Collecting feedback on projects that are of high interest, including potential challenges and successes of past efforts
• Understanding available data sources
• Discussing port operations and specific building systems, equipment, needs, function, and occupancy of different areas of each installation
• Identifying operational conflicts or environmental impacts to be considered when assessing energy improvement opportunities
4.1.3 Field Survey Following the desktop review of the files provided by the Port, DNV GL performed a field assessment of the Port Administration Building, the Harbor Police Department Headquarters facility, the B-Street Cruise Ship Terminal, and the General Services Building. The intent of the field assessment was to verify building conditions and identify additional potential energy efficiency improvement opportunities. The DNV GL team explored:
• The potential for additional energy efficiency measures
• The energy management systems
• Metering and procurement procedures
• The potential for additional renewable energy generation
The four facilities assessed are primarily standalone buildings (or a cluster of standalone buildings), and are in separate locations. Each is profiled below with the results of our review and assessment described in further detail.
4.2 Feasibility Assessment As described in Sections 3.1 and 3.2, the following sections will explain how DNV GL team conducted the feasibility assessment for clean energy measures in selected facilities of the Port of San Diego.
36
4.2.1 Site Segmentation The Port of San Diego is a unified district encompassing five member cities surrounding San Diego Bay. A public agency, the Port of San Diego is charged by the State of California with developing the tidelands and commercial business as stewards of the public-trust tidelands along 34 miles of the San Diego Bay. The Port maintains a portfolio of commercial real estate, maritime and public use facilities.
Many non-maritime facilities such as hotels and the San Diego Convention Center are identified as energy intensive sites. The DNV GL team was able to conduct meetings with one of the bay front area hotels as well as the Convention Center, and we learned about several energy initiatives these facilities have undertaken.
Based on conversations with Port of San Diego staff from different departments, including Planning and Green Port, Maritime, and General Services, the following sites were identified as potential areas for energy upgrades due to their energy intensity and supply capacity constraints:
B-Street Cruise Ship Terminal (CST): There are several cruise lines with different ships that visit the Port of San Diego annually. Each of the vessels docks at either the north or south side of Pier B, unless there are more than two vessels visiting at one time resulting in the use of the adjacent Broadway Pier. CST has seasonal operation so the distribution of visits is not necessarily uniform throughout the year. At this terminal, 3 berths have shore power ability at 12 MW (usual power draw is 7.5-10 MW); however, only one ship at a time can be plugged in.
In 2017, the shore power regulation will increase, which may require more shore power capacity at the terminal. At the same time, passenger ships are being built larger, which may require more shore power capacity to power their engines. For the Port to be able to enhance the shore power facility at this terminal, it will need more utility capacity to support this facility. The Port is working closely with SDG&E to ensure there is sufficient capacity for the future. Besides the cost burden on the Port, the location of the Cruise Ship Terminal in a congested urban area imposes other spatial-related constraints for additional utility capacity upgrades.
One solution to support higher power demand, up to 24 MW, is to trench from an existing sub-station but it is located further away. If the Port has to make more upgrades to get to 36 MW, it may require an upgrade closer to the terminal.
Tenth Avenue Marine Terminal: One of the Port’s primary maritime businesses is the Tenth Avenue Marine Terminal (TAMT), with a diverse cargo mix including Break Bulk, Refrigerated Container, and Dry Bulk. Dry bulk goods are distributed at multiple storage facilities throughout the terminal. The distribution dry bulk uses an old conveyor system and diesel powered cargo handling equipment including clam-shell grabs and diesel trucks to transport bulk cargo. Another part of operations in TAMT is where Dole berths its ships that contain agricultural products such as bananas, pineapples, mangos, etc. packed in refrigerated cargo containers termed reefers. The reefers are off-loaded from the vessels by gantry cranes that are installed on the deck of the vessels. Occasionally, when the vessel is not equipped with those cranes, a terminal is utilized for off-loading.
37
The cargo containers require constant electrical power to maintain refrigeration. Therefore, when the vessels arrive at the dock, they need power for both the ship’s operations and refrigeration of the cargo until it is offloaded. The cargo is divided into two tiers based on the delivery timeline: 1) quick delivery to local distributors within 2–10 hours (reefers are stored at the terminal and the power is provided by 512 power poles) and 2) longer delivery within 1–2 days (the products are transferred and stored in cold facilities at the terminal). This terminal is also equipped with a shore power facility that can power one vessel at a time during the off-loading period.
The power demand of reefers during these operations is significant. In May 2013, the Port initiated a market-driven redevelopment plan in multiple phases for TAMT to align infrastructure investments to market conditions through 2035. Phase I of the plan is to demolish two underutilized sheds to improve intra-terminal operations. The Port recently received a $10 million TIGER grant from the U.S. Department of Transportation that can partially fund this phase. Phase II of the plan is to consolidate dry bulk operations. The proposed Redevelopment Plan is currently undergoing environmental review (CEQA and NEPA Analyses) and is expected to be complete and ready for certification in mid-2016. One of the most important components of this redevelopment is to increase efficiency and reduce greenhouse gas emissions. As such, the Port is evaluating opportunities for energy efficiency upgrades, renewable energy generation, and applicable sustainable freight options. This initiative is especially important since TAMT is located adjacent to Barrio Logan, which is recognized as a Disadvantaged Community.
Port-operated Buildings: Buildings that are operated by the Port throughout its footprint provide opportunities for investment in building-related energy upgrade measures as well as renewable energy generation and storage technologies. Since the Port has full control over these buildings, the decision making process for investment will be more straightforward. Moreover, these energy-related projects can serve as pilots to test and verify the benefits of such investments and set precedence that can be adopted by other tenants that operate similar buildings.
Although the Port operates many buildings, the three main facilities are the Don L. Navy Port Administration Building, the Harbor Police Building, and the General Services Building. The Administration building operates both as an office as well as a storage facility. It also has an annex building that is occupied by a tenant, on their own meter. The Admin building provides a potential good opportunity for PV with rooftop space, and could also benefit from low hanging energy efficiency upgrades. The Harbor Police Building operates as an office and base of operations for Port security, and is in use 24/7. The Harbor Building’s age and heavy usage makes it a good candidate for energy efficiency measures. The building also provides rooftop space, which could have potential for PV. Finally, the General Services building operates with a variety of uses. These uses include offices, storage, shops, and manufacturing. The facility operates intermittently, based on shop work load, making it a good candidate for schedule-based energy efficiency upgrades.
38
4.2.2 Facilities Selected for Assessment Cruise Ship Terminal:
• Port-operated building that is used primarily to facilitate passengers’ matters.
• Shore power facility
Tenth Ave Marine Terminal:
• Shore power facility
• Cold storage facilities and plug-in poles at TAMT are excluded from the study even though their energy consumption is significant and they would have opportunities for adopting clean energy technologies. The reason was that these facilities are operated and managed by tenants. The Port does not have access to operational data required for assessment of clean energy measure investments nor is it involved in the decision making process at this point. This provides an example where a firstpass screening would eliminate some of the facilities from the assessment.
Harbor Police Department facility
• Port-operated building that is used primarily as a base to run the 24/7 security of the Port
Administration Building
• Port-operated building that is used primarily as an office for Port operations
General Services Building
• Port-operated building that is used primarily to perform shop and manufacturing work
Further information about these facilities is discussed in their detailed studies, in Section 4.4.
4.2.3 Assessed Clean Energy Measures A wide range of clean energy measures are identified and assessed for the port-operated buildings that are listed in the previous section. Table 7 lists these measures. The assessment results presented in Section 4.4 leverage comprehensive energy audits and studies of the buildings conducted in May 2015 by EFM Solutions, which included a review of equipment information, lighting counts, and energy efficient projects that had been implemented previously. The facility audit reports identified the most cost effective energy efficiency measures that the Port could implement to reduce operating costs according to FEM’s estimates. DNV GL evaluated the previous recommendations, and developed a list of projects we believe will further improve the performance of the buildings.
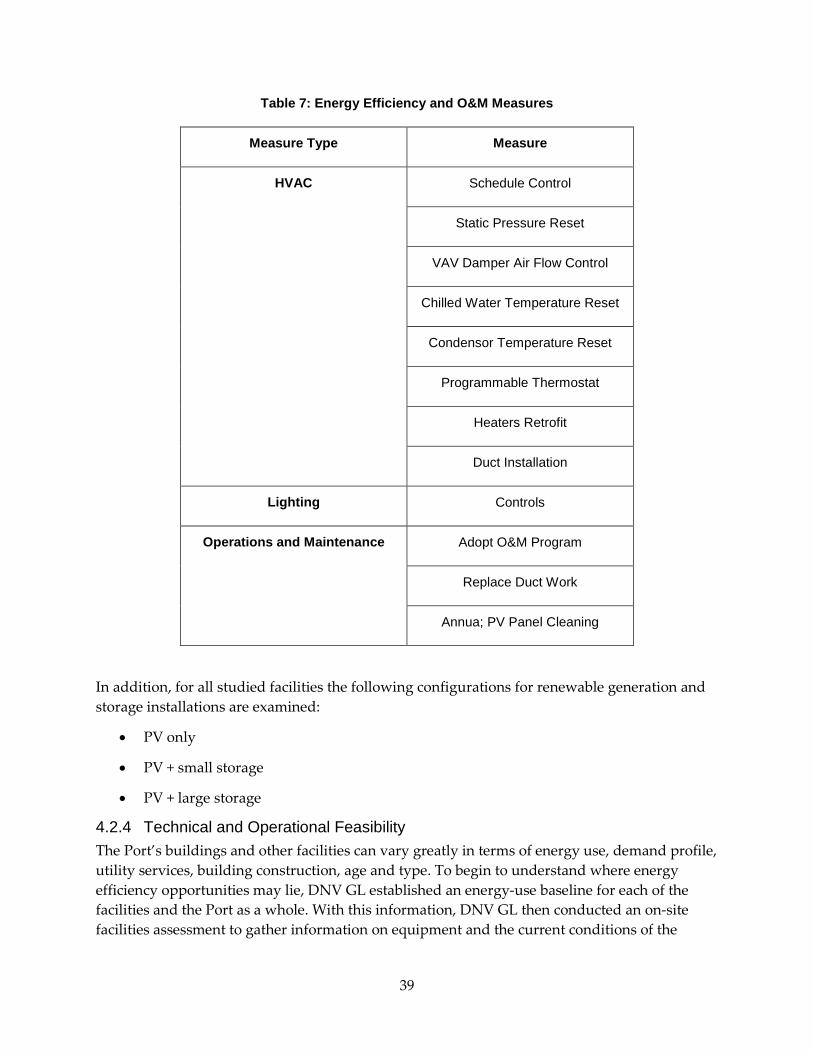
39
Table 7: Energy Efficiency and O&M Measures
Measure Type Measure
HVAC Schedule Control
Static Pressure Reset
VAV Damper Air Flow Control
Chilled Water Temperature Reset
Condensor Temperature Reset
Programmable Thermostat
Heaters Retrofit
Duct Installation
Lighting Controls
Operations and Maintenance Adopt O&M Program
Replace Duct Work
Annua; PV Panel Cleaning
In addition, for all studied facilities the following configurations for renewable generation and storage installations are examined:
• PV only
• PV + small storage
• PV + large storage
4.2.4 Technical and Operational Feasibility The Port’s buildings and other facilities can vary greatly in terms of energy use, demand profile, utility services, building construction, age and type. To begin to understand where energy efficiency opportunities may lie, DNV GL established an energy-use baseline for each of the facilities and the Port as a whole. With this information, DNV GL then conducted an on-site facilities assessment to gather information on equipment and the current conditions of the
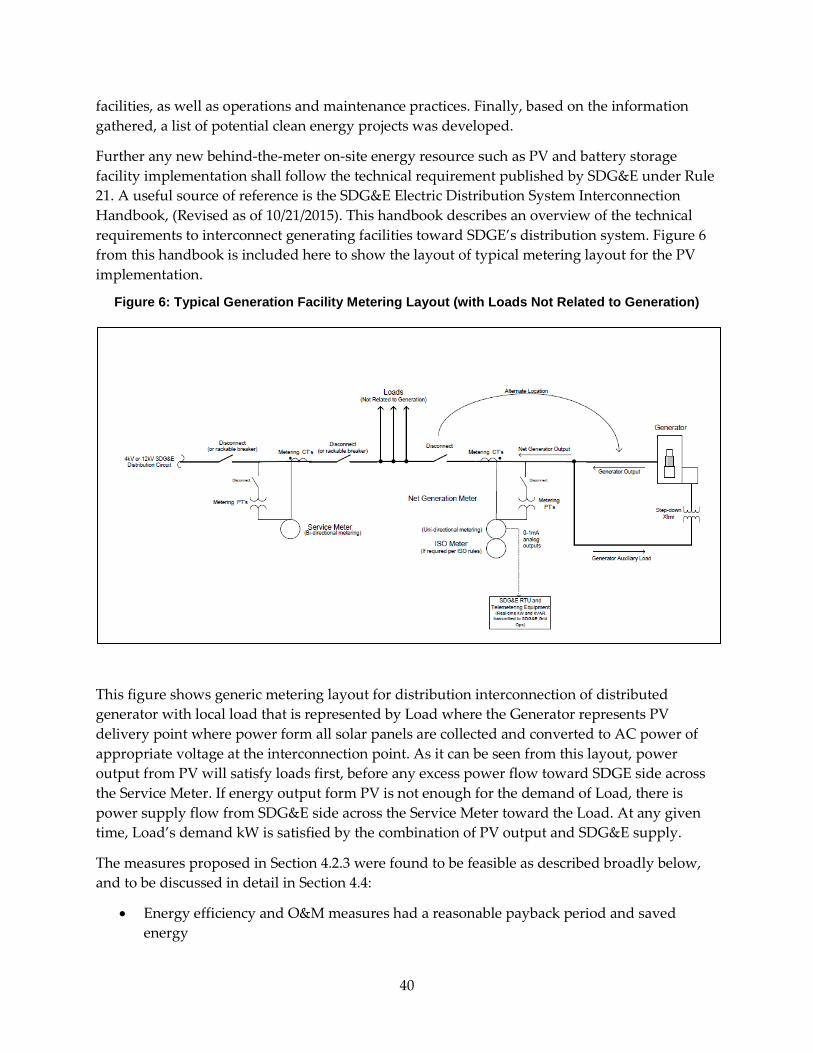
40
facilities, as well as operations and maintenance practices. Finally, based on the information gathered, a list of potential clean energy projects was developed.
Further any new behind-the-meter on-site energy resource such as PV and battery storage facility implementation shall follow the technical requirement published by SDG&E under Rule 21. A useful source of reference is the SDG&E Electric Distribution System Interconnection Handbook, (Revised as of 10/21/2015). This handbook describes an overview of the technical requirements to interconnect generating facilities toward SDGE’s distribution system. Figure 6 from this handbook is included here to show the layout of typical metering layout for the PV implementation.
Figure 6: Typical Generation Facility Metering Layout (with Loads Not Related to Generation)
This figure shows generic metering layout for distribution interconnection of distributed generator with local load that is represented by Load where the Generator represents PV delivery point where power form all solar panels are collected and converted to AC power of appropriate voltage at the interconnection point. As it can be seen from this layout, power output from PV will satisfy loads first, before any excess power flow toward SDGE side across the Service Meter. If energy output form PV is not enough for the demand of Load, there is power supply flow from SDG&E side across the Service Meter toward the Load. At any given time, Load’s demand kW is satisfied by the combination of PV output and SDG&E supply.
The measures proposed in Section 4.2.3 were found to be feasible as described broadly below, and to be discussed in detail in Section 4.4:
• Energy efficiency and O&M measures had a reasonable payback period and saved energy
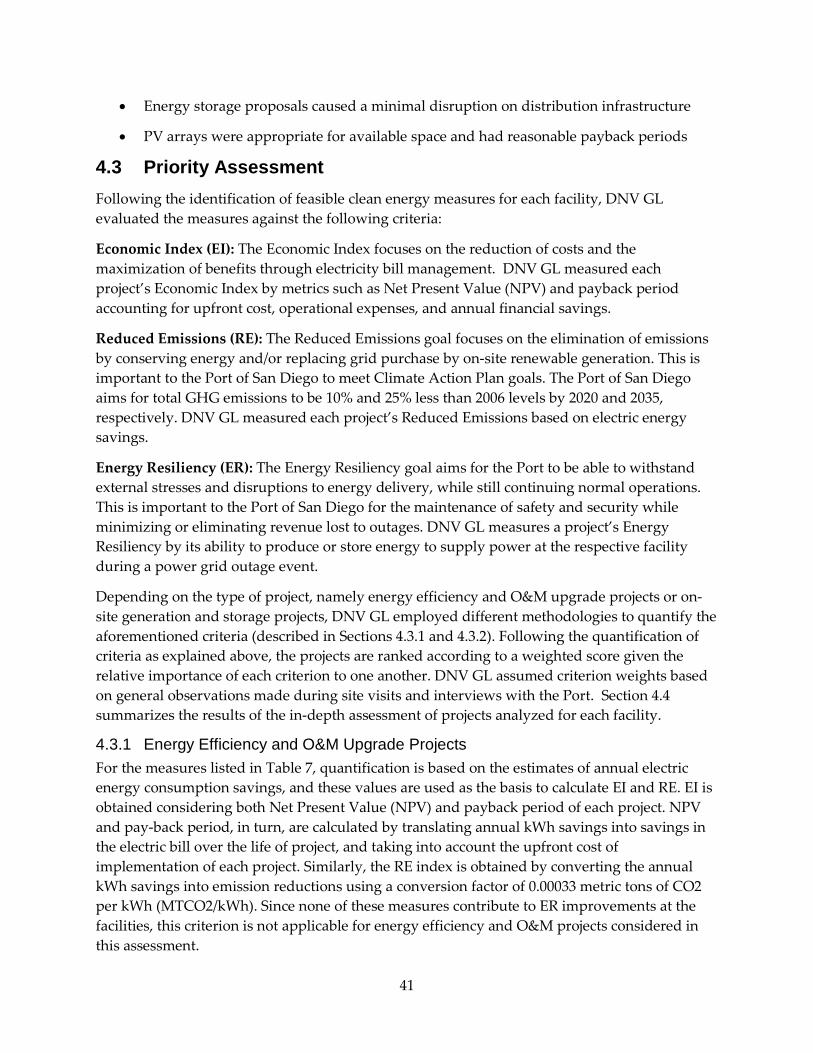
41
• Energy storage proposals caused a minimal disruption on distribution infrastructure
• PV arrays were appropriate for available space and had reasonable payback periods
4.3 Priority Assessment Following the identification of feasible clean energy measures for each facility, DNV GL evaluated the measures against the following criteria:
Economic Index (EI): The Economic Index focuses on the reduction of costs and the maximization of benefits through electricity bill management. DNV GL measured each project’s Economic Index by metrics such as Net Present Value (NPV) and payback period accounting for upfront cost, operational expenses, and annual financial savings.
Reduced Emissions (RE): The Reduced Emissions goal focuses on the elimination of emissions by conserving energy and/or replacing grid purchase by on-site renewable generation. This is important to the Port of San Diego to meet Climate Action Plan goals. The Port of San Diego aims for total GHG emissions to be 10% and 25% less than 2006 levels by 2020 and 2035, respectively. DNV GL measured each project’s Reduced Emissions based on electric energy savings.
Energy Resiliency (ER): The Energy Resiliency goal aims for the Port to be able to withstand external stresses and disruptions to energy delivery, while still continuing normal operations. This is important to the Port of San Diego for the maintenance of safety and security while minimizing or eliminating revenue lost to outages. DNV GL measures a project’s Energy Resiliency by its ability to produce or store energy to supply power at the respective facility during a power grid outage event.
Depending on the type of project, namely energy efficiency and O&M upgrade projects or on-site generation and storage projects, DNV GL employed different methodologies to quantify the aforementioned criteria (described in Sections 4.3.1 and 4.3.2). Following the quantification of criteria as explained above, the projects are ranked according to a weighted score given the relative importance of each criterion to one another. DNV GL assumed criterion weights based on general observations made during site visits and interviews with the Port. Section 4.4 summarizes the results of the in-depth assessment of projects analyzed for each facility.
4.3.1 Energy Efficiency and O&M Upgrade Projects For the measures listed in Table 7, quantification is based on the estimates of annual electric energy consumption savings, and these values are used as the basis to calculate EI and RE. EI is obtained considering both Net Present Value (NPV) and payback period of each project. NPV and pay-back period, in turn, are calculated by translating annual kWh savings into savings in the electric bill over the life of project, and taking into account the upfront cost of implementation of each project. Similarly, the RE index is obtained by converting the annual kWh savings into emission reductions using a conversion factor of 0.00033 metric tons of CO2 per kWh (MTCO2/kWh). Since none of these measures contribute to ER improvements at the facilities, this criterion is not applicable for energy efficiency and O&M projects considered in this assessment.
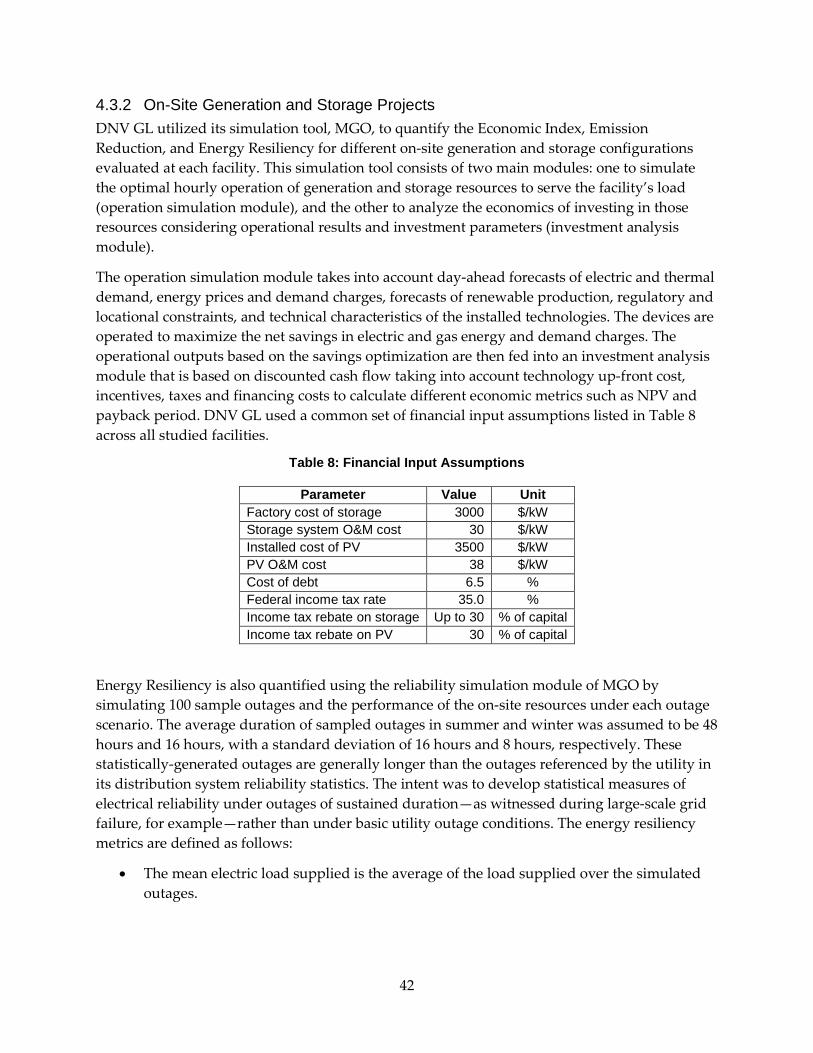
42
4.3.2 On-Site Generation and Storage Projects DNV GL utilized its simulation tool, MGO, to quantify the Economic Index, Emission Reduction, and Energy Resiliency for different on-site generation and storage configurations evaluated at each facility. This simulation tool consists of two main modules: one to simulate the optimal hourly operation of generation and storage resources to serve the facility’s load (operation simulation module), and the other to analyze the economics of investing in those resources considering operational results and investment parameters (investment analysis module).
The operation simulation module takes into account day-ahead forecasts of electric and thermal demand, energy prices and demand charges, forecasts of renewable production, regulatory and locational constraints, and technical characteristics of the installed technologies. The devices are operated to maximize the net savings in electric and gas energy and demand charges. The operational outputs based on the savings optimization are then fed into an investment analysis module that is based on discounted cash flow taking into account technology up-front cost, incentives, taxes and financing costs to calculate different economic metrics such as NPV and payback period. DNV GL used a common set of financial input assumptions listed in Table 8 across all studied facilities.
Table 8: Financial Input Assumptions
Parameter Value Unit Factory cost of storage 3000 $/kW Storage system O&M cost 30 $/kW Installed cost of PV 3500 $/kW PV O&M cost 38 $/kW Cost of debt 6.5 % Federal income tax rate 35.0 % Income tax rebate on storage Up to 30 % of capital Income tax rebate on PV 30 % of capital
Energy Resiliency is also quantified using the reliability simulation module of MGO by simulating 100 sample outages and the performance of the on-site resources under each outage scenario. The average duration of sampled outages in summer and winter was assumed to be 48 hours and 16 hours, with a standard deviation of 16 hours and 8 hours, respectively. These statistically-generated outages are generally longer than the outages referenced by the utility in its distribution system reliability statistics. The intent was to develop statistical measures of electrical reliability under outages of sustained duration—as witnessed during large-scale grid failure, for example—rather than under basic utility outage conditions. The energy resiliency metrics are defined as follows:
• The mean electric load supplied is the average of the load supplied over the simulated outages.
43
• The standard deviation of electric load supplied is derived from the percentage of load supplied over the simulated outages. A low standard deviation is desirable and implies a higher guarantee in the expected servicing of load over any outage.
• The maximum electric load supplied is the maximum percentage of load calculated to be supplied over the simulated outages.
• The minimum electric load supplied is the minimum percentage of load calculated to be supplied over the simulated outages.
Table 9 assumptions are made for sustained outage duration during summer and winter.
Table 9: Sustained Outage Duration Assumptions
Parameter Summer Winter Sustained outage duration mean 18 6
Sustained outage duration standard deviation 48 16
4.4 Studied Facilities Five facilities are discussed individually as follows:
1. Cruise Ship Terminal
2. 10th Ave. Marine Terminal
3. Don L. Navy Port Administration Building
4. Harbor Police Department Headquarters Building
5. General Services Building
For each facility, a brief introduction is provided to describe general characteristics such as its location and operation, followed by assessment of energy efficiency and O&M upgrade projects, and lastly the assessment of on-site generation and storage projects.
Key takeaways of the findings:
Energy Efficiency and O&M Upgrade Measures:
• Based on our review of the documents provided by the Port and the field assessment DNV GL identified several additional opportunities that exist for the port to improve the energy performance of each building. The purpose of our recommendations is to facilitate and overall reduction in energy consumption in each of the four buildings as well as extend the installed equipment’s life.
• Energy efficiency measures recommended for the Administration and General Services focus around advanced HVAC controls as both buildings are monitored on a building management system and could benefit from more refined control on set point and setback temperatures and fan static pressure. Rebalancing of the VAV terminal units
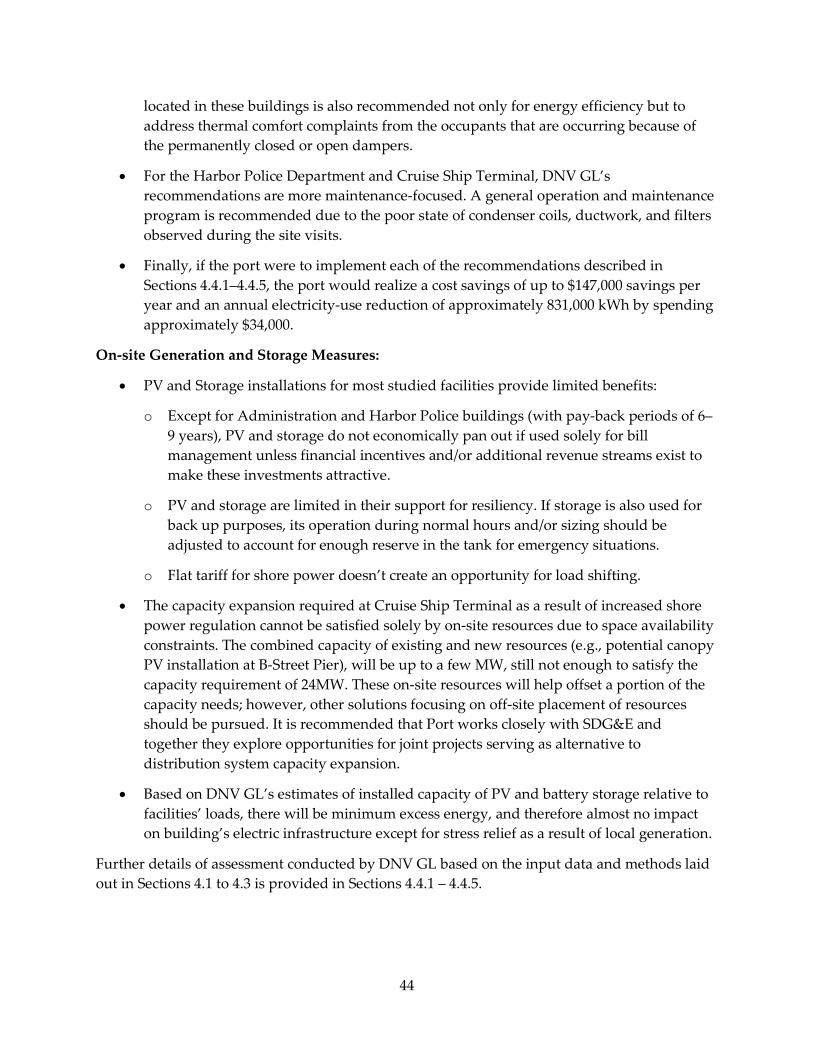
44
located in these buildings is also recommended not only for energy efficiency but to address thermal comfort complaints from the occupants that are occurring because of the permanently closed or open dampers.
• For the Harbor Police Department and Cruise Ship Terminal, DNV GL’s recommendations are more maintenance-focused. A general operation and maintenance program is recommended due to the poor state of condenser coils, ductwork, and filters observed during the site visits.
• Finally, if the port were to implement each of the recommendations described in Sections 4.4.1– 4.4.5, the port would realize a cost savings of up to $147,000 savings per year and an annual electricity-use reduction of approximately 831,000 kWh by spending approximately $34,000.
On-site Generation and Storage Measures:
• PV and Storage installations for most studied facilities provide limited benefits:
o Except for Administration and Harbor Police buildings (with pay-back periods of 6–9 years), PV and storage do not economically pan out if used solely for bill management unless financial incentives and/or additional revenue streams exist to make these investments attractive.
o PV and storage are limited in their support for resiliency. If storage is also used for back up purposes, its operation during normal hours and/or sizing should be adjusted to account for enough reserve in the tank for emergency situations.
o Flat tariff for shore power doesn’t create an opportunity for load shifting.
• The capacity expansion required at Cruise Ship Terminal as a result of increased shore power regulation cannot be satisfied solely by on-site resources due to space availability constraints. The combined capacity of existing and new resources (e.g., potential canopy PV installation at B-Street Pier), will be up to a few MW, still not enough to satisfy the capacity requirement of 24MW. These on-site resources will help offset a portion of the capacity needs; however, other solutions focusing on off-site placement of resources should be pursued. It is recommended that Port works closely with SDG&E and together they explore opportunities for joint projects serving as alternative to distribution system capacity expansion.
• Based on DNV GL’s estimates of installed capacity of PV and battery storage relative to facilities’ loads, there will be minimum excess energy, and therefore almost no impact on building’s electric infrastructure except for stress relief as a result of local generation.
Further details of assessment conducted by DNV GL based on the input data and methods laid out in Sections 4.1 to 4.3 is provided in Sections 4.4.1 – 4.4.5.
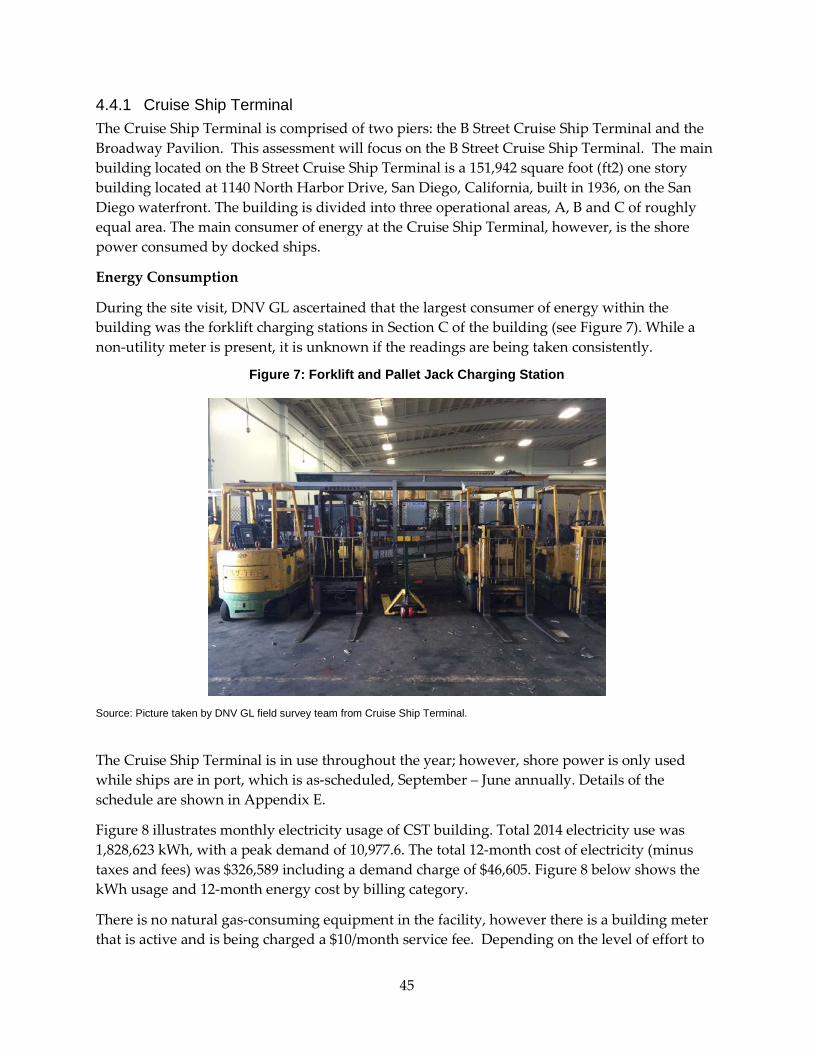
45
4.4.1 Cruise Ship Terminal The Cruise Ship Terminal is comprised of two piers: the B Street Cruise Ship Terminal and the Broadway Pavilion. This assessment will focus on the B Street Cruise Ship Terminal. The main building located on the B Street Cruise Ship Terminal is a 151,942 square foot (ft2) one story building located at 1140 North Harbor Drive, San Diego, California, built in 1936, on the San Diego waterfront. The building is divided into three operational areas, A, B and C of roughly equal area. The main consumer of energy at the Cruise Ship Terminal, however, is the shore power consumed by docked ships.
Energy Consumption
During the site visit, DNV GL ascertained that the largest consumer of energy within the building was the forklift charging stations in Section C of the building (see Figure 7). While a non-utility meter is present, it is unknown if the readings are being taken consistently.
Figure 7: Forklift and Pallet Jack Charging Station
Source: Picture taken by DNV GL field survey team from Cruise Ship Terminal.
The Cruise Ship Terminal is in use throughout the year; however, shore power is only used while ships are in port, which is as-scheduled, September – June annually. Details of the schedule are shown in Appendix E.
Figure 8 illustrates monthly electricity usage of CST building. Total 2014 electricity use was 1,828,623 kWh, with a peak demand of 10,977.6. The total 12-month cost of electricity (minus taxes and fees) was $326,589 including a demand charge of $46,605. Figure 8 below shows the kWh usage and 12-month energy cost by billing category.
There is no natural gas-consuming equipment in the facility, however there is a building meter that is active and is being charged a $10/month service fee. Depending on the level of effort to
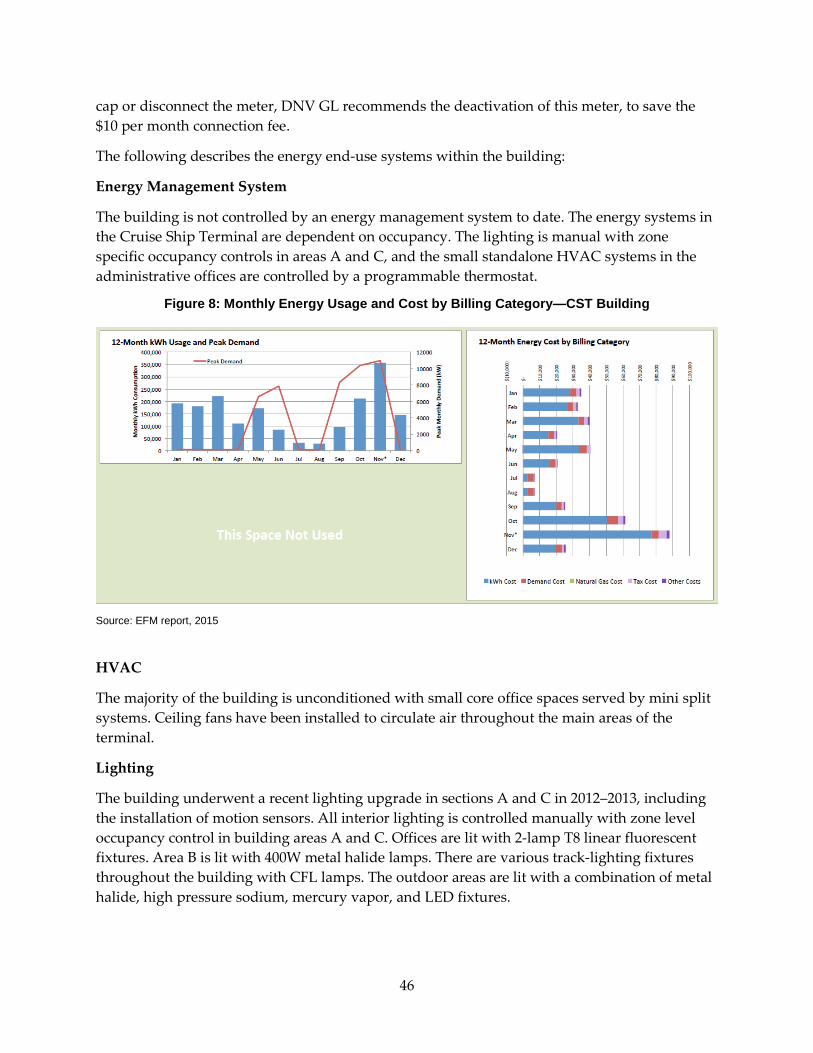
46
cap or disconnect the meter, DNV GL recommends the deactivation of this meter, to save the $10 per month connection fee.
The following describes the energy end-use systems within the building:
Energy Management System
The building is not controlled by an energy management system to date. The energy systems in the Cruise Ship Terminal are dependent on occupancy. The lighting is manual with zone specific occupancy controls in areas A and C, and the small standalone HVAC systems in the administrative offices are controlled by a programmable thermostat.
Figure 8: Monthly Energy Usage and Cost by Billing Category—CST Building
Source: EFM report, 2015
HVAC
The majority of the building is unconditioned with small core office spaces served by mini split systems. Ceiling fans have been installed to circulate air throughout the main areas of the terminal.
Lighting
The building underwent a recent lighting upgrade in sections A and C in 2012–2013, including the installation of motion sensors. All interior lighting is controlled manually with zone level occupancy control in building areas A and C. Offices are lit with 2-lamp T8 linear fluorescent fixtures. Area B is lit with 400W metal halide lamps. There are various track-lighting fixtures throughout the building with CFL lamps. The outdoor areas are lit with a combination of metal halide, high pressure sodium, mercury vapor, and LED fixtures.
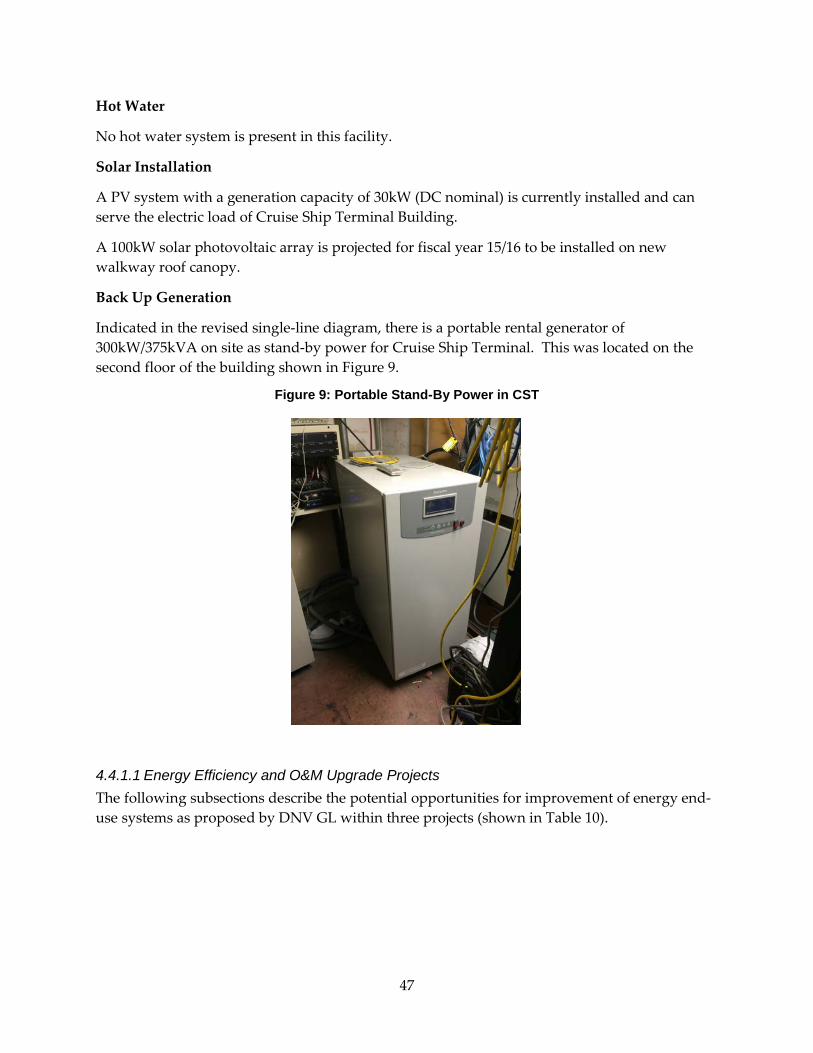
47
Hot Water
No hot water system is present in this facility.
Solar Installation
A PV system with a generation capacity of 30kW (DC nominal) is currently installed and can serve the electric load of Cruise Ship Terminal Building.
A 100kW solar photovoltaic array is projected for fiscal year 15/16 to be installed on new walkway roof canopy.
Back Up Generation
Indicated in the revised single-line diagram, there is a portable rental generator of 300kW/375kVA on site as stand-by power for Cruise Ship Terminal. This was located on the second floor of the building shown in Figure 9.
Figure 9: Portable Stand-By Power in CST
4.4.1.1 Energy Efficiency and O&M Upgrade Projects The following subsections describe the potential opportunities for improvement of energy end-use systems as proposed by DNV GL within three projects (shown in Table 10).
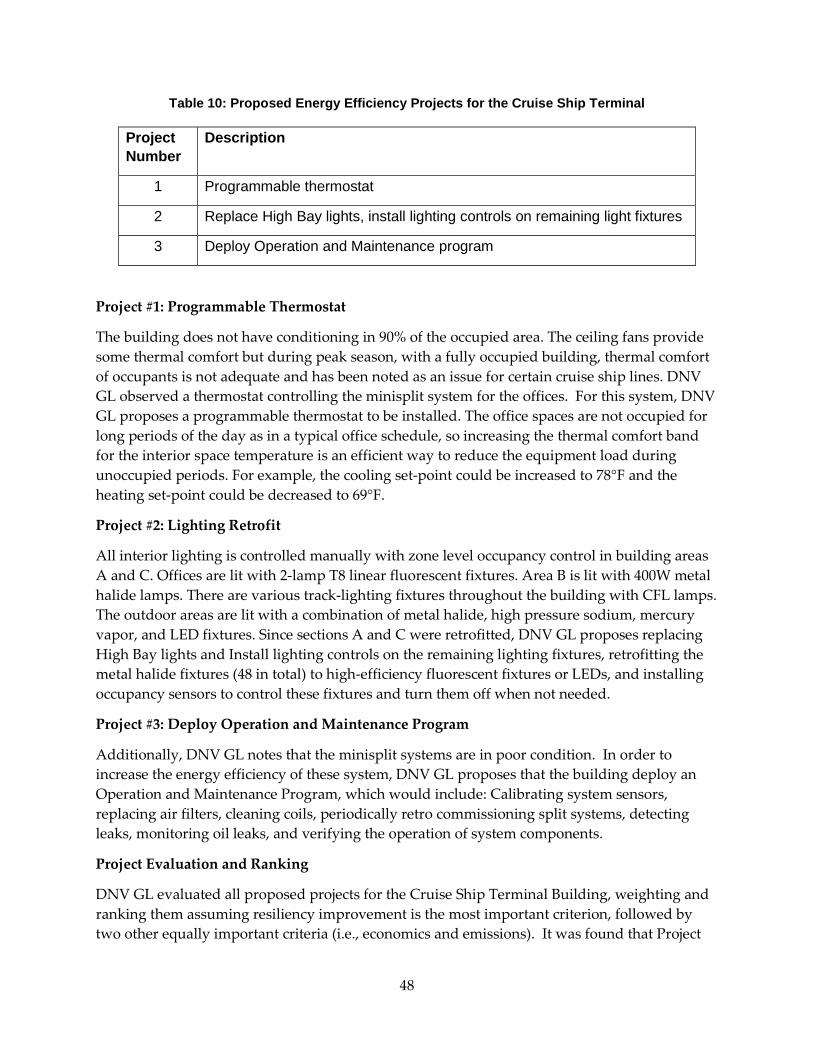
48
Table 10: Proposed Energy Efficiency Projects for the Cruise Ship Terminal
Project Number
Description
1 Programmable thermostat
2 Replace High Bay lights, install lighting controls on remaining light fixtures
3 Deploy Operation and Maintenance program
Project #1: Programmable Thermostat
The building does not have conditioning in 90% of the occupied area. The ceiling fans provide some thermal comfort but during peak season, with a fully occupied building, thermal comfort of occupants is not adequate and has been noted as an issue for certain cruise ship lines. DNV GL observed a thermostat controlling the minisplit system for the offices. For this system, DNV GL proposes a programmable thermostat to be installed. The office spaces are not occupied for long periods of the day as in a typical office schedule, so increasing the thermal comfort band for the interior space temperature is an efficient way to reduce the equipment load during unoccupied periods. For example, the cooling set-point could be increased to 78°F and the heating set-point could be decreased to 69°F.
Project #2: Lighting Retrofit
All interior lighting is controlled manually with zone level occupancy control in building areas A and C. Offices are lit with 2-lamp T8 linear fluorescent fixtures. Area B is lit with 400W metal halide lamps. There are various track-lighting fixtures throughout the building with CFL lamps. The outdoor areas are lit with a combination of metal halide, high pressure sodium, mercury vapor, and LED fixtures. Since sections A and C were retrofitted, DNV GL proposes replacing High Bay lights and Install lighting controls on the remaining lighting fixtures, retrofitting the metal halide fixtures (48 in total) to high-efficiency fluorescent fixtures or LEDs, and installing occupancy sensors to control these fixtures and turn them off when not needed.
Project #3: Deploy Operation and Maintenance Program
Additionally, DNV GL notes that the minisplit systems are in poor condition. In order to increase the energy efficiency of these system, DNV GL proposes that the building deploy an Operation and Maintenance Program, which would include: Calibrating system sensors, replacing air filters, cleaning coils, periodically retro commissioning split systems, detecting leaks, monitoring oil leaks, and verifying the operation of system components.
Project Evaluation and Ranking
DNV GL evaluated all proposed projects for the Cruise Ship Terminal Building, weighting and ranking them assuming resiliency improvement is the most important criterion, followed by two other equally important criteria (i.e., economics and emissions). It was found that Project
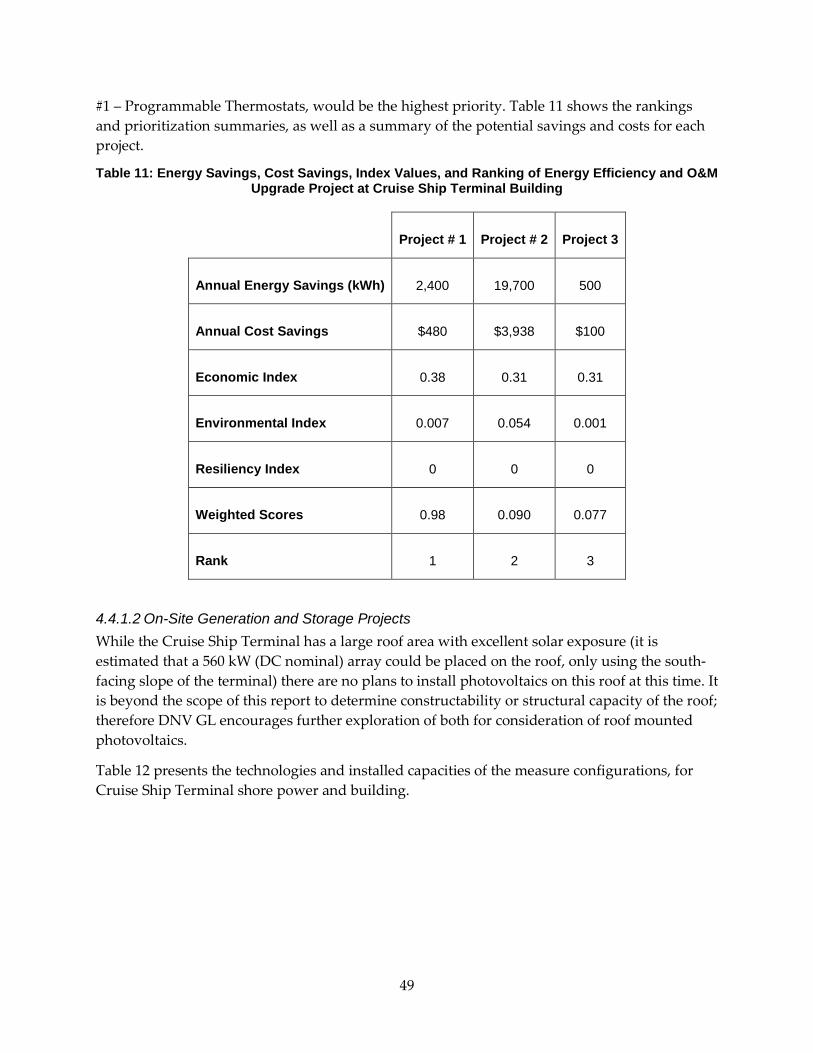
49
#1 – Programmable Thermostats, would be the highest priority. Table 11 shows the rankings and prioritization summaries, as well as a summary of the potential savings and costs for each project.
Table 11: Energy Savings, Cost Savings, Index Values, and Ranking of Energy Efficiency and O&M Upgrade Project at Cruise Ship Terminal Building
Project # 1 Project # 2 Project 3
Annual Energy Savings (kWh) 2,400 19,700 500
Annual Cost Savings $480 $3,938 $100
Economic Index 0.38 0.31 0.31
Environmental Index 0.007 0.054 0.001
Resiliency Index 0 0 0
Weighted Scores 0.98 0.090 0.077
Rank 1 2 3
4.4.1.2 On-Site Generation and Storage Projects While the Cruise Ship Terminal has a large roof area with excellent solar exposure (it is estimated that a 560 kW (DC nominal) array could be placed on the roof, only using the south-facing slope of the terminal) there are no plans to install photovoltaics on this roof at this time. It is beyond the scope of this report to determine constructability or structural capacity of the roof; therefore DNV GL encourages further exploration of both for consideration of roof mounted photovoltaics.
Table 12 presents the technologies and installed capacities of the measure configurations, for Cruise Ship Terminal shore power and building.
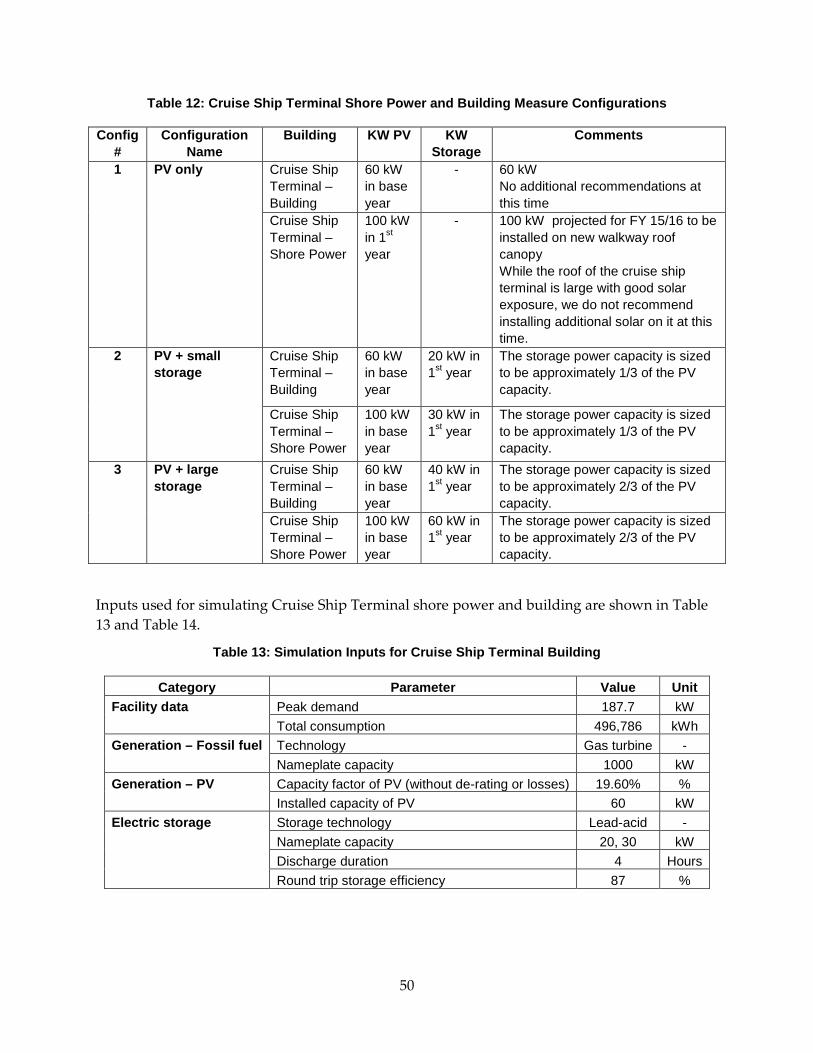
50
Table 12: Cruise Ship Terminal Shore Power and Building Measure Configurations
Config #
Configuration Name
Building KW PV KW Storage
Comments
1 PV only Cruise Ship Terminal – Building
60 kW in base year
- 60 kW No additional recommendations at this time
Cruise Ship Terminal – Shore Power
100 kW in 1st year
- 100 kW projected for FY 15/16 to be installed on new walkway roof canopy While the roof of the cruise ship terminal is large with good solar exposure, we do not recommend installing additional solar on it at this time.
2 PV + small storage
Cruise Ship Terminal – Building
60 kW in base year
20 kW in 1st year
The storage power capacity is sized to be approximately 1/3 of the PV capacity.
Cruise Ship Terminal – Shore Power
100 kW in base year
30 kW in 1st year
The storage power capacity is sized to be approximately 1/3 of the PV capacity.
3 PV + large storage
Cruise Ship Terminal – Building
60 kW in base year
40 kW in 1st year
The storage power capacity is sized to be approximately 2/3 of the PV capacity.
Cruise Ship Terminal – Shore Power
100 kW in base year
60 kW in 1st year
The storage power capacity is sized to be approximately 2/3 of the PV capacity.
Inputs used for simulating Cruise Ship Terminal shore power and building are shown in Table 13 and Table 14.
Table 13: Simulation Inputs for Cruise Ship Terminal Building
Category Parameter Value Unit Facility data Peak demand 187.7 kW
Total consumption 496,786 kWh Generation – Fossil fuel Technology Gas turbine -
Nameplate capacity 1000 kW Generation – PV Capacity factor of PV (without de-rating or losses) 19.60% %
Installed capacity of PV 60 kW Electric storage Storage technology Lead-acid -
Nameplate capacity 20, 30 kW Discharge duration 4 Hours Round trip storage efficiency 87 %
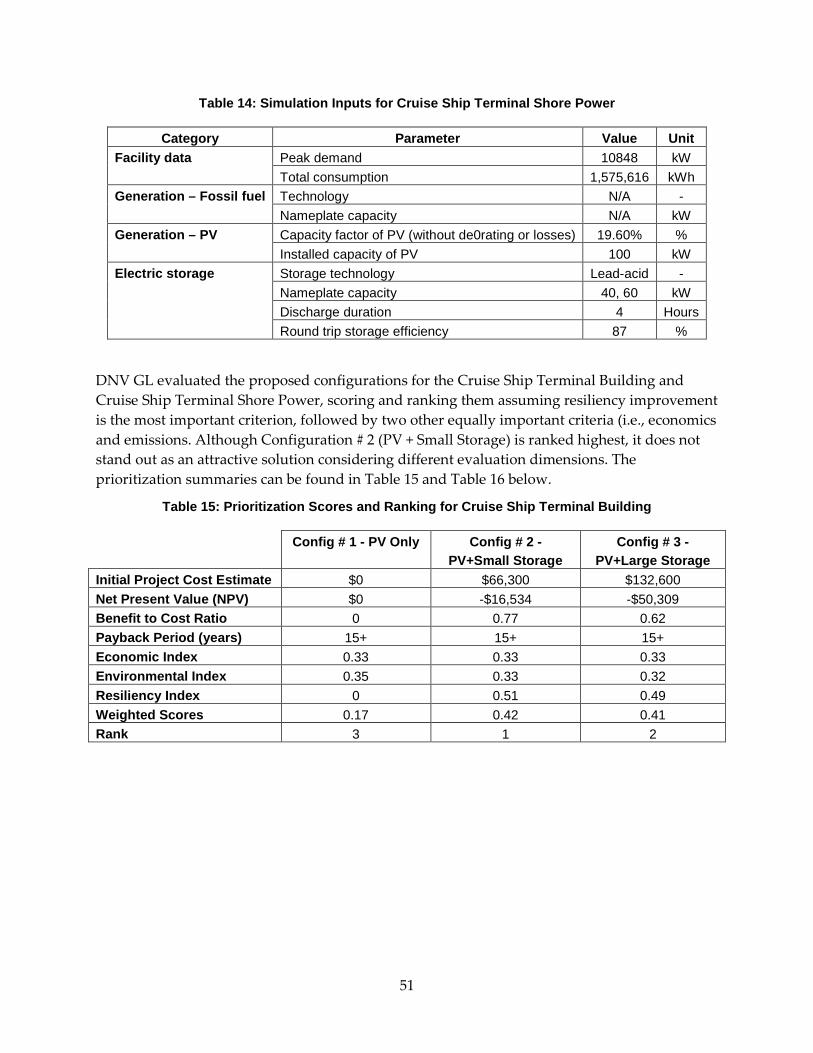
51
Table 14: Simulation Inputs for Cruise Ship Terminal Shore Power
Category Parameter Value Unit Facility data Peak demand 10848 kW
Total consumption 1,575,616 kWh Generation – Fossil fuel Technology N/A -
Nameplate capacity N/A kW Generation – PV Capacity factor of PV (without de0rating or losses) 19.60% %
Installed capacity of PV 100 kW Electric storage Storage technology Lead-acid -
Nameplate capacity 40, 60 kW Discharge duration 4 Hours Round trip storage efficiency 87 %
DNV GL evaluated the proposed configurations for the Cruise Ship Terminal Building and Cruise Ship Terminal Shore Power, scoring and ranking them assuming resiliency improvement is the most important criterion, followed by two other equally important criteria (i.e., economics and emissions. Although Configuration # 2 (PV + Small Storage) is ranked highest, it does not stand out as an attractive solution considering different evaluation dimensions. The prioritization summaries can be found in Table 15 and Table 16 below.
Table 15: Prioritization Scores and Ranking for Cruise Ship Terminal Building
Config # 1 - PV Only Config # 2 - PV+Small Storage
Config # 3 - PV+Large Storage
Initial Project Cost Estimate $0 $66,300 $132,600 Net Present Value (NPV) $0 -$16,534 -$50,309 Benefit to Cost Ratio 0 0.77 0.62 Payback Period (years) 15+ 15+ 15+ Economic Index 0.33 0.33 0.33 Environmental Index 0.35 0.33 0.32 Resiliency Index 0 0.51 0.49 Weighted Scores 0.17 0.42 0.41 Rank 3 1 2
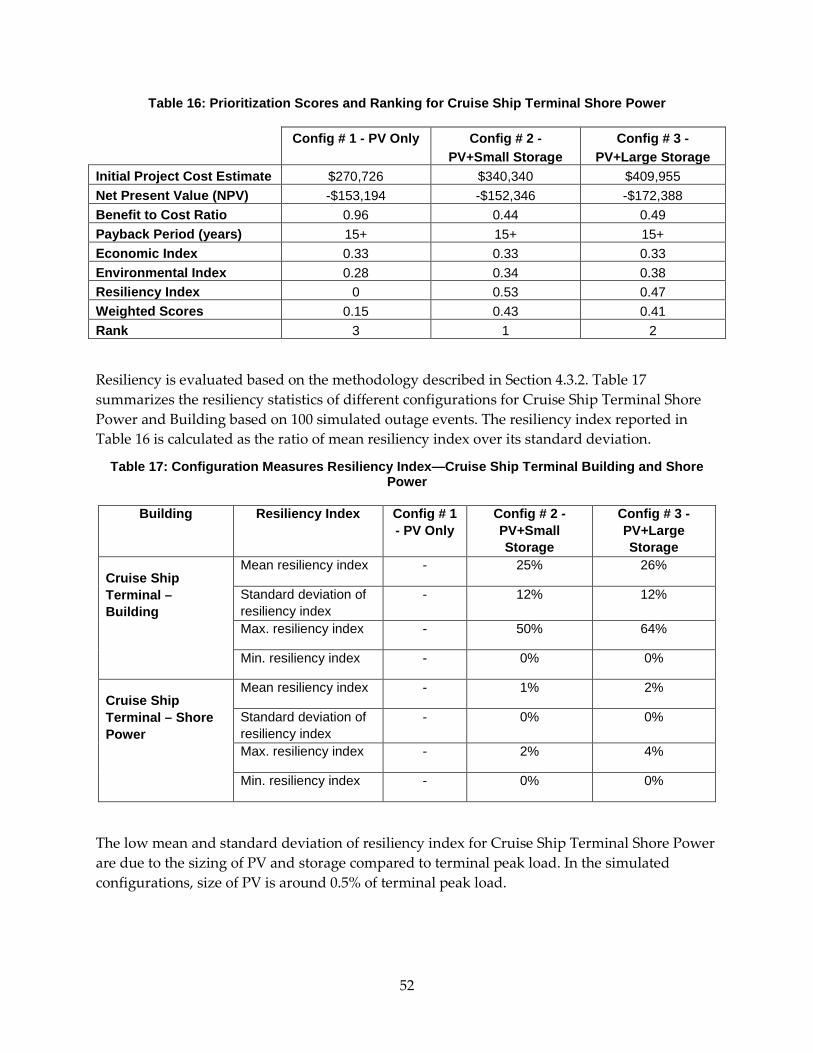
52
Table 16: Prioritization Scores and Ranking for Cruise Ship Terminal Shore Power
Config # 1 - PV Only Config # 2 - PV+Small Storage
Config # 3 - PV+Large Storage
Initial Project Cost Estimate $270,726 $340,340 $409,955 Net Present Value (NPV) -$153,194 -$152,346 -$172,388 Benefit to Cost Ratio 0.96 0.44 0.49 Payback Period (years) 15+ 15+ 15+ Economic Index 0.33 0.33 0.33 Environmental Index 0.28 0.34 0.38 Resiliency Index 0 0.53 0.47 Weighted Scores 0.15 0.43 0.41 Rank 3 1 2
Resiliency is evaluated based on the methodology described in Section 4.3.2. Table 17 summarizes the resiliency statistics of different configurations for Cruise Ship Terminal Shore Power and Building based on 100 simulated outage events. The resiliency index reported in Table 16 is calculated as the ratio of mean resiliency index over its standard deviation.
Table 17: Configuration Measures Resiliency Index—Cruise Ship Terminal Building and Shore Power
Building Resiliency Index Config # 1 - PV Only
Config # 2 - PV+Small Storage
Config # 3 - PV+Large Storage
Cruise Ship Terminal – Building
Mean resiliency index - 25% 26%
Standard deviation of resiliency index
- 12% 12%
Max. resiliency index - 50% 64%
Min. resiliency index - 0% 0%
Cruise Ship Terminal – Shore Power
Mean resiliency index - 1% 2%
Standard deviation of resiliency index
- 0% 0%
Max. resiliency index - 2% 4%
Min. resiliency index - 0% 0%
The low mean and standard deviation of resiliency index for Cruise Ship Terminal Shore Power are due to the sizing of PV and storage compared to terminal peak load. In the simulated configurations, size of PV is around 0.5% of terminal peak load.
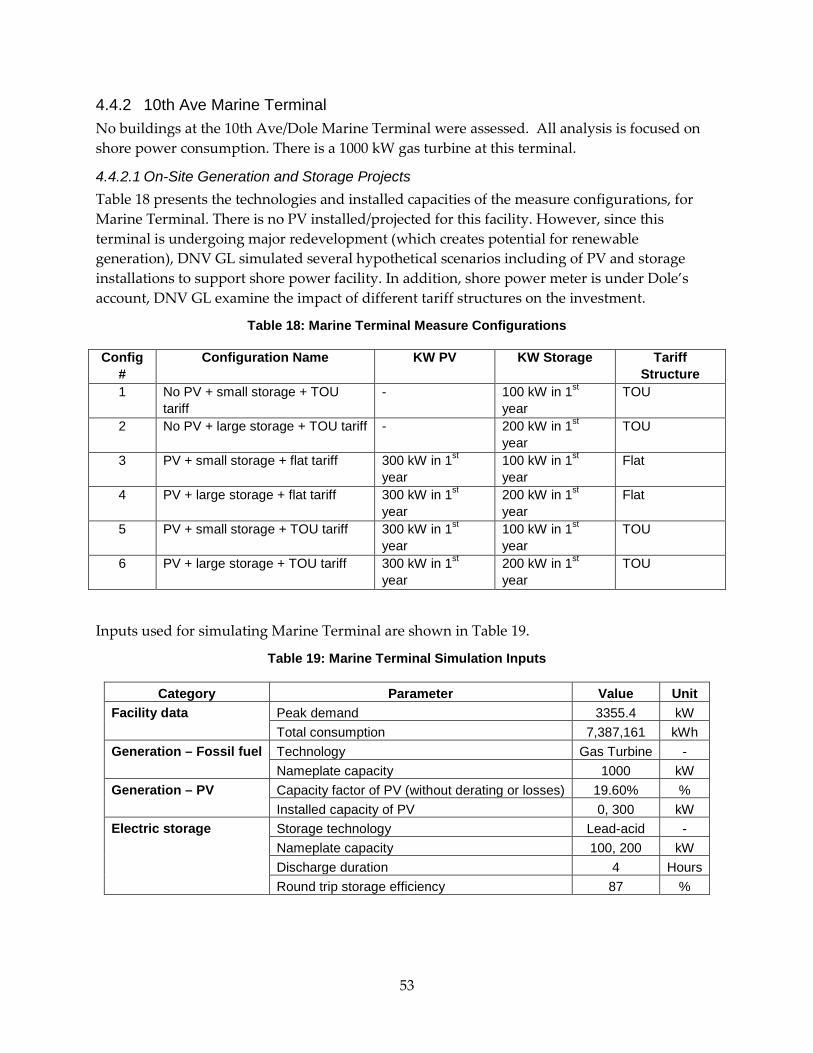
53
4.4.2 10th Ave Marine Terminal No buildings at the 10th Ave/Dole Marine Terminal were assessed. All analysis is focused on shore power consumption. There is a 1000 kW gas turbine at this terminal.
4.4.2.1 On-Site Generation and Storage Projects Table 18 presents the technologies and installed capacities of the measure configurations, for Marine Terminal. There is no PV installed/projected for this facility. However, since this terminal is undergoing major redevelopment (which creates potential for renewable generation), DNV GL simulated several hypothetical scenarios including of PV and storage installations to support shore power facility. In addition, shore power meter is under Dole’s account, DNV GL examine the impact of different tariff structures on the investment.
Table 18: Marine Terminal Measure Configurations
Config #
Configuration Name KW PV KW Storage Tariff Structure
1 No PV + small storage + TOU tariff
- 100 kW in 1st year
TOU
2 No PV + large storage + TOU tariff - 200 kW in 1st year
TOU
3 PV + small storage + flat tariff 300 kW in 1st year
100 kW in 1st year
Flat
4 PV + large storage + flat tariff 300 kW in 1st year
200 kW in 1st year
Flat
5 PV + small storage + TOU tariff 300 kW in 1st year
100 kW in 1st year
TOU
6 PV + large storage + TOU tariff 300 kW in 1st year
200 kW in 1st year
TOU
Inputs used for simulating Marine Terminal are shown in Table 19.
Table 19: Marine Terminal Simulation Inputs
Category Parameter Value Unit Facility data Peak demand 3355.4 kW
Total consumption 7,387,161 kWh Generation – Fossil fuel Technology Gas Turbine -
Nameplate capacity 1000 kW Generation – PV Capacity factor of PV (without derating or losses) 19.60% %
Installed capacity of PV 0, 300 kW Electric storage Storage technology Lead-acid -
Nameplate capacity 100, 200 kW Discharge duration 4 Hours Round trip storage efficiency 87 %
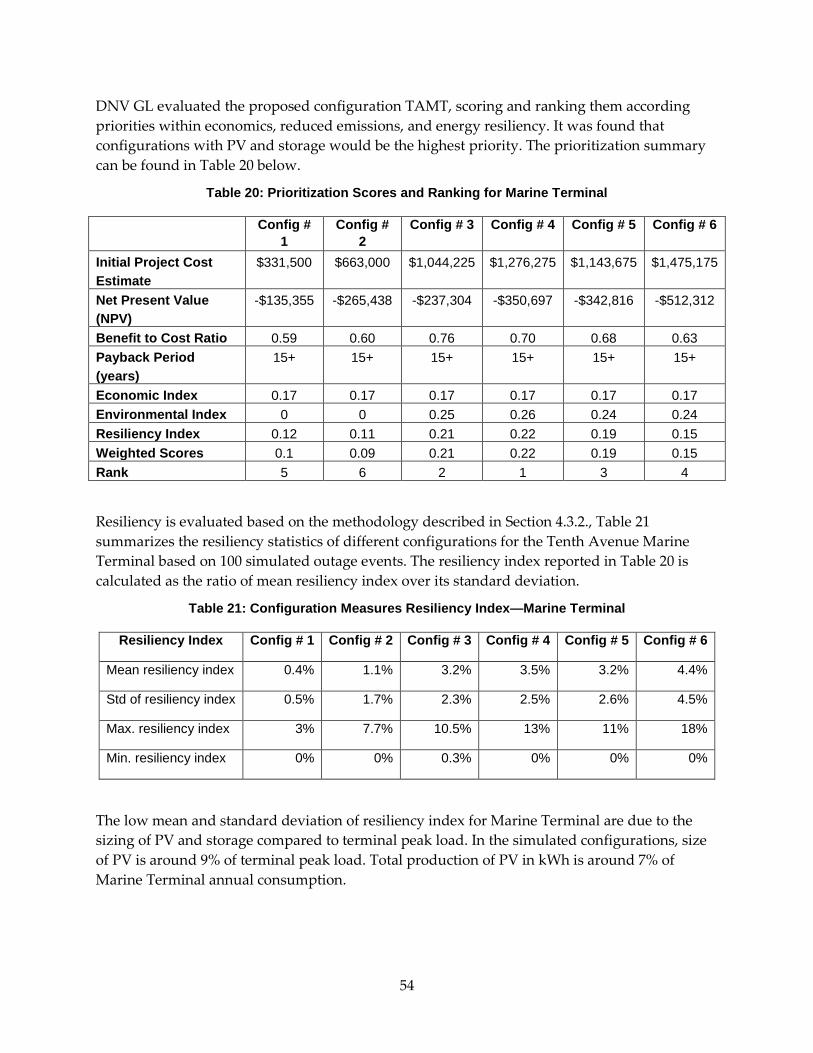
54
DNV GL evaluated the proposed configuration TAMT, scoring and ranking them according priorities within economics, reduced emissions, and energy resiliency. It was found that configurations with PV and storage would be the highest priority. The prioritization summary can be found in Table 20 below.
Table 20: Prioritization Scores and Ranking for Marine Terminal
Config # 1
Config # 2
Config # 3 Config # 4 Config # 5 Config # 6
Initial Project Cost Estimate
$331,500 $663,000 $1,044,225 $1,276,275 $1,143,675 $1,475,175
Net Present Value (NPV)
-$135,355 -$265,438 -$237,304 -$350,697 -$342,816 -$512,312
Benefit to Cost Ratio 0.59 0.60 0.76 0.70 0.68 0.63 Payback Period (years)
15+ 15+ 15+ 15+ 15+ 15+
Economic Index 0.17 0.17 0.17 0.17 0.17 0.17 Environmental Index 0 0 0.25 0.26 0.24 0.24 Resiliency Index 0.12 0.11 0.21 0.22 0.19 0.15 Weighted Scores 0.1 0.09 0.21 0.22 0.19 0.15 Rank 5 6 2 1 3 4
Resiliency is evaluated based on the methodology described in Section 4.3.2., Table 21 summarizes the resiliency statistics of different configurations for the Tenth Avenue Marine Terminal based on 100 simulated outage events. The resiliency index reported in Table 20 is calculated as the ratio of mean resiliency index over its standard deviation.
Table 21: Configuration Measures Resiliency Index—Marine Terminal
Resiliency Index Config # 1 Config # 2 Config # 3 Config # 4 Config # 5 Config # 6
Mean resiliency index 0.4% 1.1% 3.2% 3.5% 3.2% 4.4%
Std of resiliency index 0.5% 1.7% 2.3% 2.5% 2.6% 4.5%
Max. resiliency index 3% 7.7% 10.5% 13% 11% 18%
Min. resiliency index 0% 0% 0.3% 0% 0% 0%
The low mean and standard deviation of resiliency index for Marine Terminal are due to the sizing of PV and storage compared to terminal peak load. In the simulated configurations, size of PV is around 9% of terminal peak load. Total production of PV in kWh is around 7% of Marine Terminal annual consumption.
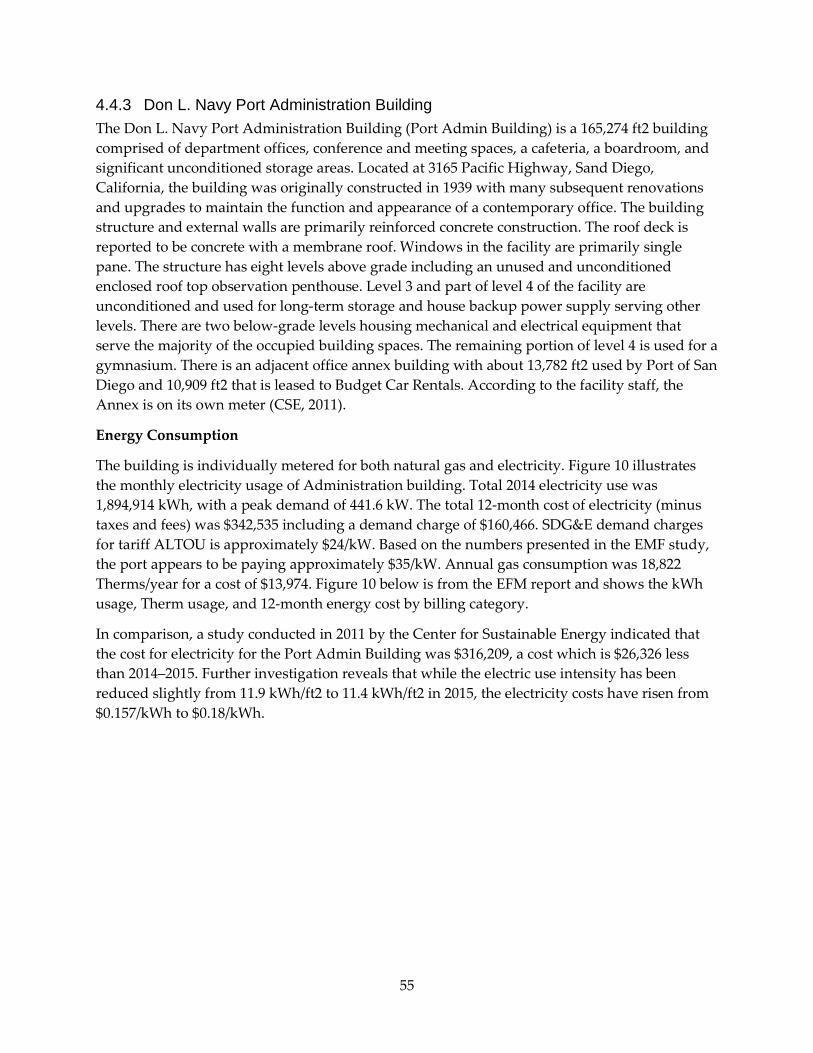
55
4.4.3 Don L. Navy Port Administration Building The Don L. Navy Port Administration Building (Port Admin Building) is a 165,274 ft2 building comprised of department offices, conference and meeting spaces, a cafeteria, a boardroom, and significant unconditioned storage areas. Located at 3165 Pacific Highway, Sand Diego, California, the building was originally constructed in 1939 with many subsequent renovations and upgrades to maintain the function and appearance of a contemporary office. The building structure and external walls are primarily reinforced concrete construction. The roof deck is reported to be concrete with a membrane roof. Windows in the facility are primarily single pane. The structure has eight levels above grade including an unused and unconditioned enclosed roof top observation penthouse. Level 3 and part of level 4 of the facility are unconditioned and used for long-term storage and house backup power supply serving other levels. There are two below-grade levels housing mechanical and electrical equipment that serve the majority of the occupied building spaces. The remaining portion of level 4 is used for a gymnasium. There is an adjacent office annex building with about 13,782 ft2 used by Port of San Diego and 10,909 ft2 that is leased to Budget Car Rentals. According to the facility staff, the Annex is on its own meter (CSE, 2011).
Energy Consumption
The building is individually metered for both natural gas and electricity. Figure 10 illustrates the monthly electricity usage of Administration building. Total 2014 electricity use was 1,894,914 kWh, with a peak demand of 441.6 kW. The total 12-month cost of electricity (minus taxes and fees) was $342,535 including a demand charge of $160,466. SDG&E demand charges for tariff ALTOU is approximately $24/kW. Based on the numbers presented in the EMF study, the port appears to be paying approximately $35/kW. Annual gas consumption was 18,822 Therms/year for a cost of $13,974. Figure 10 below is from the EFM report and shows the kWh usage, Therm usage, and 12-month energy cost by billing category.
In comparison, a study conducted in 2011 by the Center for Sustainable Energy indicated that the cost for electricity for the Port Admin Building was $316,209, a cost which is $26,326 less than 2014–2015. Further investigation reveals that while the electric use intensity has been reduced slightly from 11.9 kWh/ft2 to 11.4 kWh/ft2 in 2015, the electricity costs have risen from $0.157/kWh to $0.18/kWh.
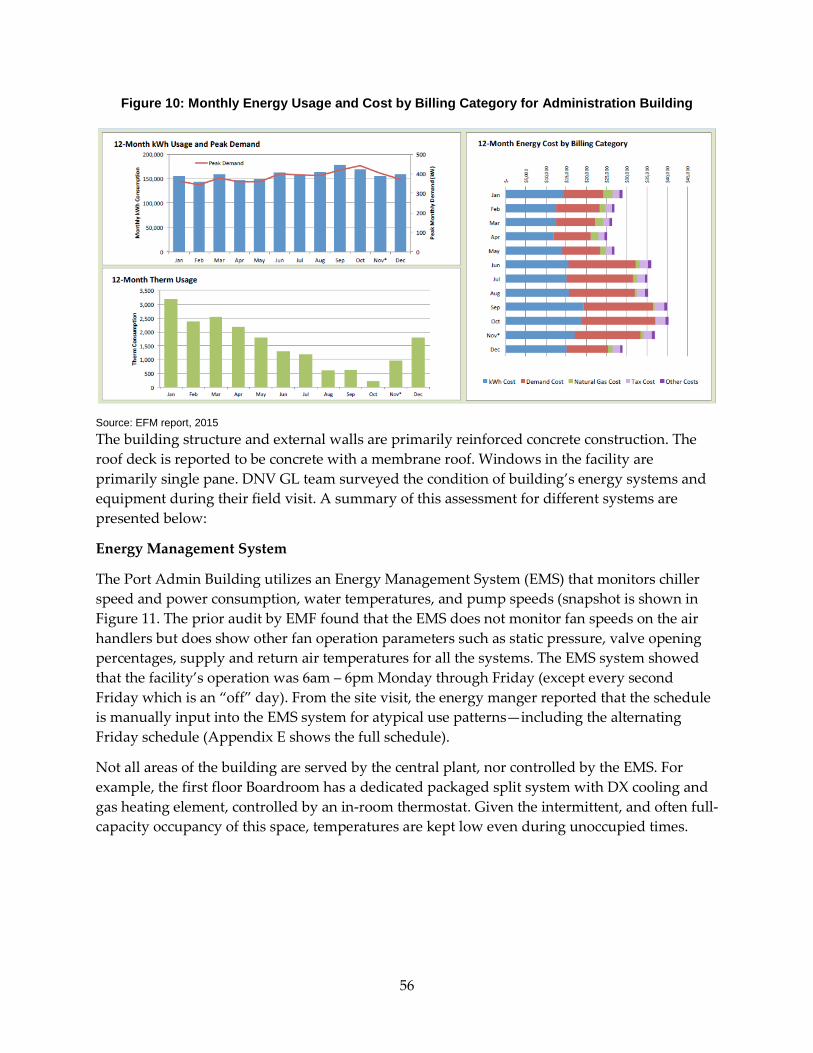
56
Figure 10: Monthly Energy Usage and Cost by Billing Category for Administration Building
Source: EFM report, 2015 The building structure and external walls are primarily reinforced concrete construction. The roof deck is reported to be concrete with a membrane roof. Windows in the facility are primarily single pane. DNV GL team surveyed the condition of building’s energy systems and equipment during their field visit. A summary of this assessment for different systems are presented below:
Energy Management System
The Port Admin Building utilizes an Energy Management System (EMS) that monitors chiller speed and power consumption, water temperatures, and pump speeds (snapshot is shown in Figure 11. The prior audit by EMF found that the EMS does not monitor fan speeds on the air handlers but does show other fan operation parameters such as static pressure, valve opening percentages, supply and return air temperatures for all the systems. The EMS system showed that the facility’s operation was 6am – 6pm Monday through Friday (except every second Friday which is an “off” day). From the site visit, the energy manger reported that the schedule is manually input into the EMS system for atypical use patterns—including the alternating Friday schedule (Appendix E shows the full schedule).
Not all areas of the building are served by the central plant, nor controlled by the EMS. For example, the first floor Boardroom has a dedicated packaged split system with DX cooling and gas heating element, controlled by an in-room thermostat. Given the intermittent, and often full-capacity occupancy of this space, temperatures are kept low even during unoccupied times.
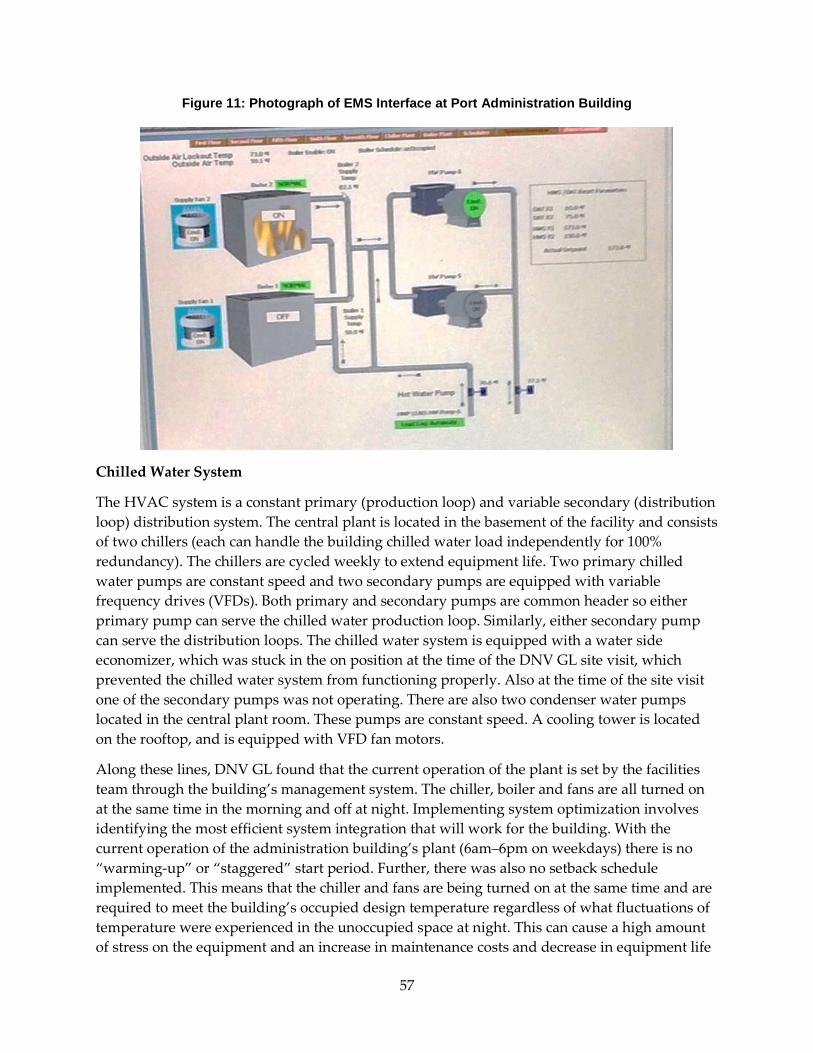
57
Figure 11: Photograph of EMS Interface at Port Administration Building
Chilled Water System
The HVAC system is a constant primary (production loop) and variable secondary (distribution loop) distribution system. The central plant is located in the basement of the facility and consists of two chillers (each can handle the building chilled water load independently for 100% redundancy). The chillers are cycled weekly to extend equipment life. Two primary chilled water pumps are constant speed and two secondary pumps are equipped with variable frequency drives (VFDs). Both primary and secondary pumps are common header so either primary pump can serve the chilled water production loop. Similarly, either secondary pump can serve the distribution loops. The chilled water system is equipped with a water side economizer, which was stuck in the on position at the time of the DNV GL site visit, which prevented the chilled water system from functioning properly. Also at the time of the site visit one of the secondary pumps was not operating. There are also two condenser water pumps located in the central plant room. These pumps are constant speed. A cooling tower is located on the rooftop, and is equipped with VFD fan motors.
Along these lines, DNV GL found that the current operation of the plant is set by the facilities team through the building’s management system. The chiller, boiler and fans are all turned on at the same time in the morning and off at night. Implementing system optimization involves identifying the most efficient system integration that will work for the building. With the current operation of the administration building’s plant (6am–6pm on weekdays) there is no “warming-up” or “staggered” start period. Further, there was also no setback schedule implemented. This means that the chiller and fans are being turned on at the same time and are required to meet the building’s occupied design temperature regardless of what fluctuations of temperature were experienced in the unoccupied space at night. This can cause a high amount of stress on the equipment and an increase in maintenance costs and decrease in equipment life
58
as a result. This was already evident by the chilled water supply temperatures not meeting design requirements at time of visit.
Air Distribution System
There are six AHUs in the facility serving the first, second, fifth, sixth and seventh floors and board conference room. The third and fourth floors are unconditioned and mostly unoccupied. Each AHU is controlled by CFD on static pressure sensors, and economizers are controlled by the central EMS. The fresh air shaft is pressurized with outside air, and uses a VFD supply fan motor. There are about 22 variable air volume (VAV) boxes per occupied floor. Chilled and hot water is supplied to the cooling and heating coils from the chilled water and hot water systems.
HVAC System
Current operating conditions for the HVAC system serving the administration building are 6 a.m. to 6 p.m. on weekdays and not running on weekends.
Further, DNV GL found that there were a number of “too hot” and “too cold” concerns occurring in the building which usually is the direct result of incorrect VAV box zoning in a building. It was also determined from the building’s EMS system the correct amount of outdoor air was not being delivered to all the occupied spaces. To help with providing adequate airflow to the conditioned spaces retro-commissioning of the building systems with the intention of “rebalancing” the systems and resetting AHU and VAV boxes valves to design conditions is recommended. Further, verifying correct placement of the room thermostat and linked VAV box with occupant layout will also help in addressing thermal comfort needs. This could be part of the long term plan to re-design the air system recommended in the CSE energy audit report.
Lighting
Interior lighting in office spaces is primarily 1x4 and 2x4 three lamp F28-T8 fixtures. The majority of the fixtures are prismatic lenses with some parabolic fixtures that were installed in different renovation phases (CSE, 2011). The lighting controls use multi-level manual switches with the exception of a few office spaces and common areas that are equipped with motion sensors. A daylighting control system is in place in the perimeter offices of the sixth and seventh floors where there is sufficient natural light. The CSE report from 2011 indicates that the daylight control system did not seem to work properly; the site visit confirms that these are not providing energy savings at this time. The lobby and meeting rooms are lit using compact fluorescent lamps (CFL). The third and fourth floors are unconditioned spaces used for storage and are lit with 4’ industrial strip lights with manual lighting control.
Exterior Lighting is controlled by photocells. The parking lot pole lighting has been upgraded with LED fixtures. The building exterior entry consists of (5) 70–100W HPS down lights. The Walkway/Bridge consists of (7) 70–150W poles (CSE, 2011).
Hot Water System
Two natural gas boilers located in the basement boiler room serve most of the space heating requirements of the building. Two constant speed hot water pumps distribute hot water to the
59
air handling units in a primary loop Each boiler has a capacity of 1260 MBH and an efficiency of 80%. At the time of the DNV GL site visit only one boiler was operating and the thermometer on the outlet demonstrated it was supplying a hot water temperature of 173°F. The facilities manager stated that hot water is usually supplied at 185°F.
Solar Installation
A photovoltaic (PV) system was installed on the roof of the adjacent Port Admin Building Annex in 2009 (see Figure 12). The system has a generation capacity of 30kW (DC nominal) and has produced an average of 51.4 MWh annually over its first 5 years of operating. The panels are tilted to face west and produce energy later in the afternoon.
4.4.3.1 Energy Efficiency and O&M Upgrade Measures The following describes the potential opportunities for improvements in energy end-use systems within the building as proposed by DNV GL team. Seven projects including 2 projects for chilled water system, 2 for air distribution system, 2 for HVAC system and one O&M improvement project are assessed as shown in Table 22.
Table 22: Project Descriptions for Port Administration Building
Project Number Description
1 Chilled Water Temperature Reset
2 Condenser Water Temperature Reset
3 Shortened HVAC schedules
4 Setback Schedule
5 Static Pressure Reset
6 Reduce/Lower VAV Damper minimum air flow rates
7 PV Cleaning
Project #1: Chilled Water Temperature Reset
To ensure that the two chillers are running at a more efficient part load ratio, DNV GL recommends Chilled Water Temperature Reset, wherein the chilled water set points for each be increased by 0.5°F when all the valves are less than 90% open or that the chilled water set point
60
decreased by 0.5°F when any valves are more than 90% open. This measure adjusts the chilled water set point temperature at the chilled water loop between 44°F and 50°F.
Project #2: Condensed Water Temperature Reset
Similar to Project #5, in this project, DNV GL proposes resetting the constant condensing loop supply temperature from 80°F to a more dynamic range of 70–80°F based on the outdoor air wet bulb temperature. When the outdoor wet bulb temperature is below 60°F reset the condensing loop set point to 70°F. When the outdoor air wet bulb temp is above 70°F, reset to 80°F.
Project #3: Shortened HVAC Schedule
Current operating conditions for the HVAC system serving the administration building are 6 a.m. to 6 p.m. on weekdays and not running on weekends. DNV GL proposed shortened HVAC schedules, implementing a setback temperature mode where the HVAC system shifts into setback conditions two hours earlier in the evening on weekdays. There is only a small amount of load on the HVAC system during the last two hours of the day so enabling the building’s interior temperatures to coast towards its unoccupied state (seasonal setback temperature) while it is still partially occupied will not sacrifice thermal comfort or unmet loads. This mode of operation can always be overridden if there are any events or when the building manager deems necessary.
Project #4: Setback Schedule
For all HVAC systems that serve non 24/7 areas, it is recommended that, nighttime setback controls to be implemented. For the San Diego climate, a cooling setback temperature in summer of 78°F and 65°F setback temperature in winter is recommended. For the IT and server rooms that have acceptable temperature limits, make sure that unoccupied set points are not outside the acceptable limits of the equipment in the space. In addition, an optimum start/stop sequence can be customized and implemented through the building automation system.
Project #5: Static Pressure Reset
Resetting static pressure for six air handlers installed in the building and having their supply air temperature set point automatically adjusted to load conditions, will allow the supply fan to operate more efficiently. The variable frequency drive (VFD) of the supply fan should be modulated to maintain a dynamically reset static pressure set point. The fan is then able to deliver the same amount of air with less power.
Implementing this type of reset control will decrease the static pressure set point until the temperature achieves the low operational limit (30% of original value set for design conditions). This will reduce the running time of the supply fans but still allow the air to be supplied at the required temperatures.
Project #6: VAV Damper Control
Lowering the damper located in the VAV terminal box from the current set point of 46% to 30% of its maximum value will reduce the electrical consumption of the system. Most of the savings
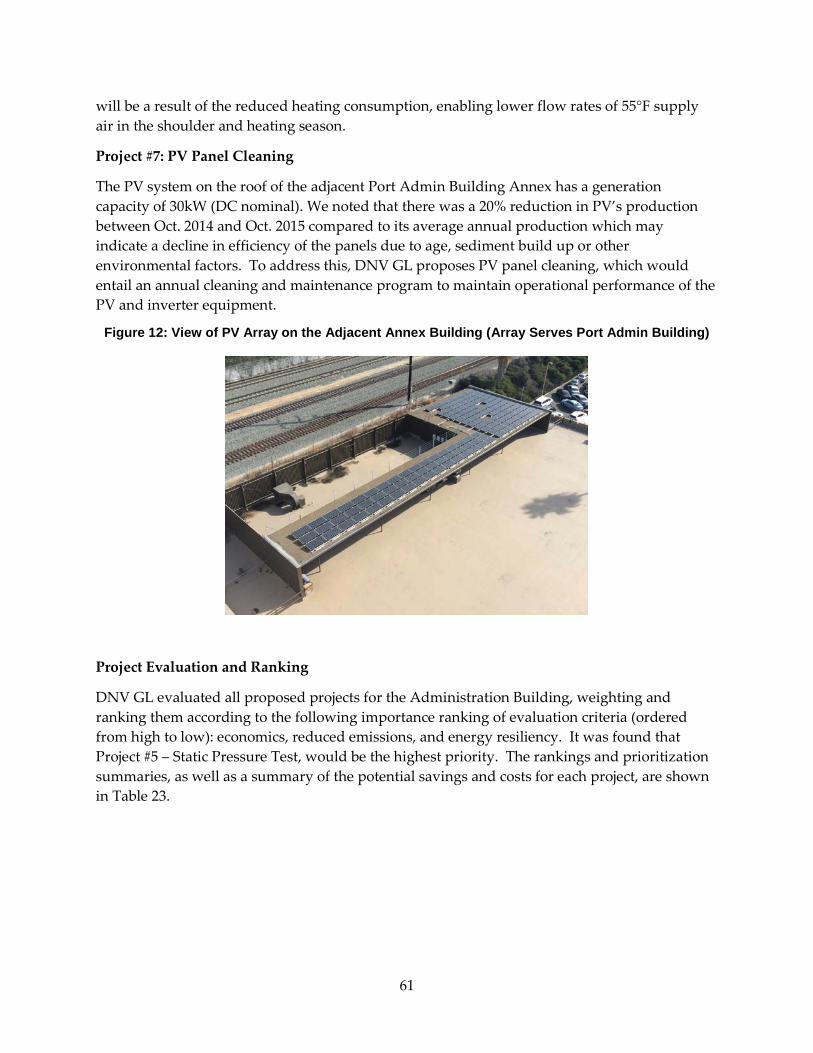
61
will be a result of the reduced heating consumption, enabling lower flow rates of 55°F supply air in the shoulder and heating season.
Project #7: PV Panel Cleaning
The PV system on the roof of the adjacent Port Admin Building Annex has a generation capacity of 30kW (DC nominal). We noted that there was a 20% reduction in PV’s production between Oct. 2014 and Oct. 2015 compared to its average annual production which may indicate a decline in efficiency of the panels due to age, sediment build up or other environmental factors. To address this, DNV GL proposes PV panel cleaning, which would entail an annual cleaning and maintenance program to maintain operational performance of the PV and inverter equipment.
Figure 12: View of PV Array on the Adjacent Annex Building (Array Serves Port Admin Building)
Project Evaluation and Ranking
DNV GL evaluated all proposed projects for the Administration Building, weighting and ranking them according to the following importance ranking of evaluation criteria (ordered from high to low): economics, reduced emissions, and energy resiliency. It was found that Project #5 – Static Pressure Test, would be the highest priority. The rankings and prioritization summaries, as well as a summary of the potential savings and costs for each project, are shown in Table 23.

62
Table 23: Energy Savings, Cost Savings, Indices, and Ranks of Projects for Port Administration Building
Project 1
Project 2 Project 3 Project 4 Project 5 Project 6 Project 7
Annual Energy Savings (kWh)
15,700 10,200 125,900 94,400 275,400 118,000 1,200
Annual Cost Savings
$2,833 $1,841 $22,660 $16,995 $49,570 $21,244 $216
Economic Index 0.15 0.15 0.15 0.15 0.15 0.15 0.12
Environmental Index
0.008 0.005 0.066 0.050 0.145 0.062 0.001
Resiliency Index 0 0 0 0 0 0 0
Weighted Scores
0.065 0.064 0.083 0.078 0.108 0.082 0.050
Rank 5 6 2 4 1 3 7
4.4.3.2 On-Site Generation and Storage Projects An additional PV system with a generation capacity of 130 kW (DC nominal) could be installed on a canopy structure adjacent the existing solar array.
Two levels of storage capacity were simulation in order to measure the impact of energy storage coupled with existing and future PV installations.
Table 24 presents the technologies and installed capacities of the measure configurations, for Administration Building.
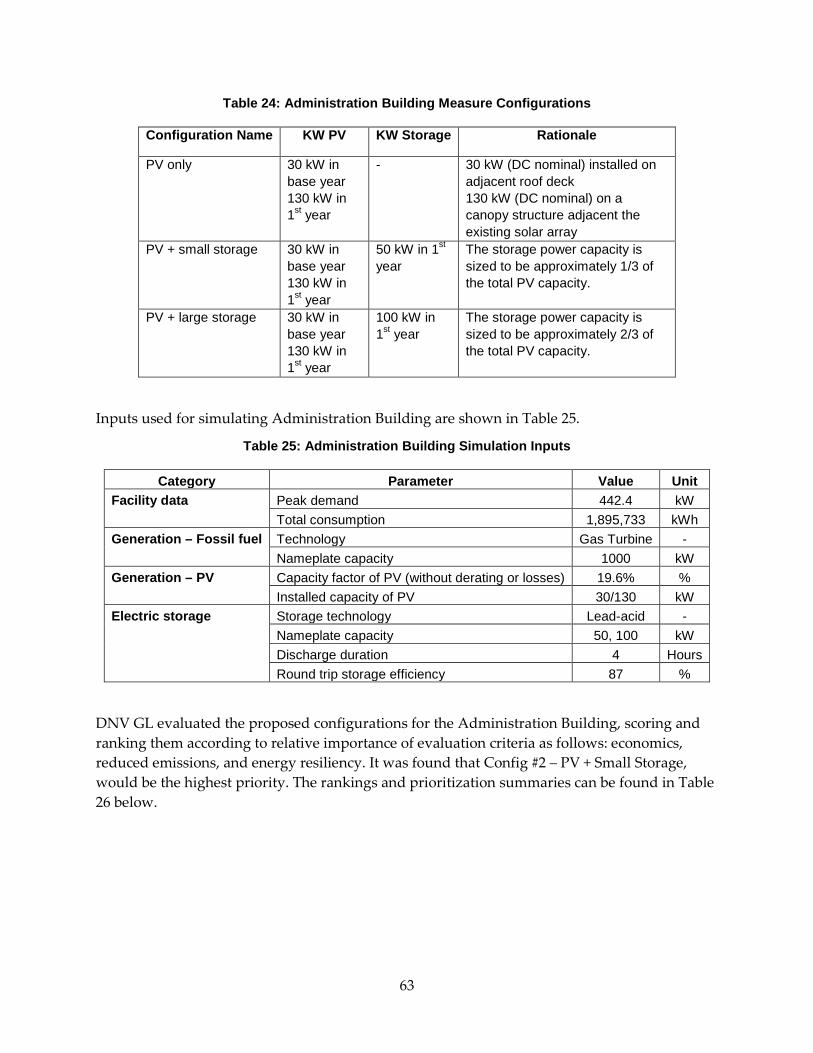
63
Table 24: Administration Building Measure Configurations
Configuration Name KW PV KW Storage Rationale
PV only 30 kW in base year 130 kW in 1st year
- 30 kW (DC nominal) installed on adjacent roof deck 130 kW (DC nominal) on a canopy structure adjacent the existing solar array
PV + small storage 30 kW in base year 130 kW in 1st year
50 kW in 1st year
The storage power capacity is sized to be approximately 1/3 of the total PV capacity.
PV + large storage 30 kW in base year 130 kW in 1st year
100 kW in 1st year
The storage power capacity is sized to be approximately 2/3 of the total PV capacity.
Inputs used for simulating Administration Building are shown in Table 25.
Table 25: Administration Building Simulation Inputs
Category Parameter Value Unit Facility data Peak demand 442.4 kW
Total consumption 1,895,733 kWh Generation – Fossil fuel Technology Gas Turbine -
Nameplate capacity 1000 kW Generation – PV Capacity factor of PV (without derating or losses) 19.6% %
Installed capacity of PV 30/130 kW Electric storage Storage technology Lead-acid -
Nameplate capacity 50, 100 kW Discharge duration 4 Hours Round trip storage efficiency 87 %
DNV GL evaluated the proposed configurations for the Administration Building, scoring and ranking them according to relative importance of evaluation criteria as follows: economics, reduced emissions, and energy resiliency. It was found that Config #2 – PV + Small Storage, would be the highest priority. The rankings and prioritization summaries can be found in Table 26 below.
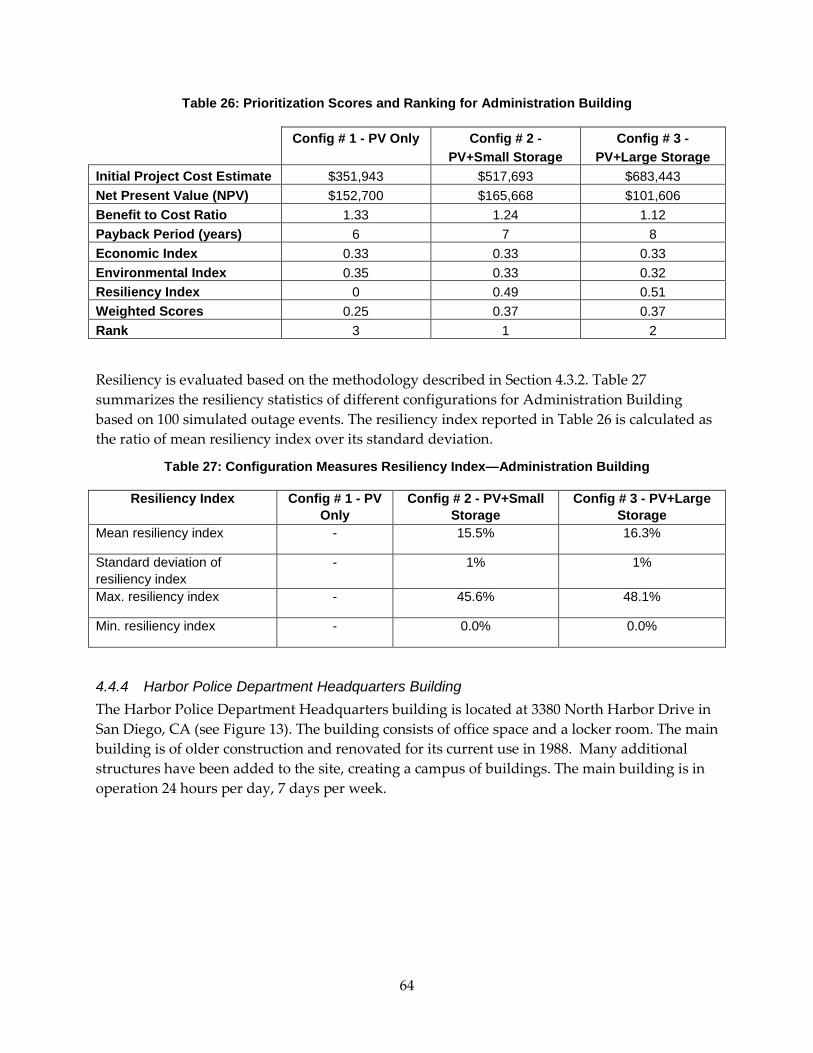
64
Table 26: Prioritization Scores and Ranking for Administration Building
Config # 1 - PV Only Config # 2 - PV+Small Storage
Config # 3 - PV+Large Storage
Initial Project Cost Estimate $351,943 $517,693 $683,443 Net Present Value (NPV) $152,700 $165,668 $101,606 Benefit to Cost Ratio 1.33 1.24 1.12 Payback Period (years) 6 7 8 Economic Index 0.33 0.33 0.33 Environmental Index 0.35 0.33 0.32 Resiliency Index 0 0.49 0.51 Weighted Scores 0.25 0.37 0.37 Rank 3 1 2
Resiliency is evaluated based on the methodology described in Section 4.3.2. Table 27 summarizes the resiliency statistics of different configurations for Administration Building based on 100 simulated outage events. The resiliency index reported in Table 26 is calculated as the ratio of mean resiliency index over its standard deviation.
Table 27: Configuration Measures Resiliency Index—Administration Building
Resiliency Index Config # 1 - PV Only
Config # 2 - PV+Small Storage
Config # 3 - PV+Large Storage
Mean resiliency index - 15.5% 16.3%
Standard deviation of resiliency index
- 1% 1%
Max. resiliency index - 45.6% 48.1%
Min. resiliency index - 0.0% 0.0%
4.4.4 Harbor Police Department Headquarters Building The Harbor Police Department Headquarters building is located at 3380 North Harbor Drive in San Diego, CA (see Figure 13). The building consists of office space and a locker room. The main building is of older construction and renovated for its current use in 1988. Many additional structures have been added to the site, creating a campus of buildings. The main building is in operation 24 hours per day, 7 days per week.
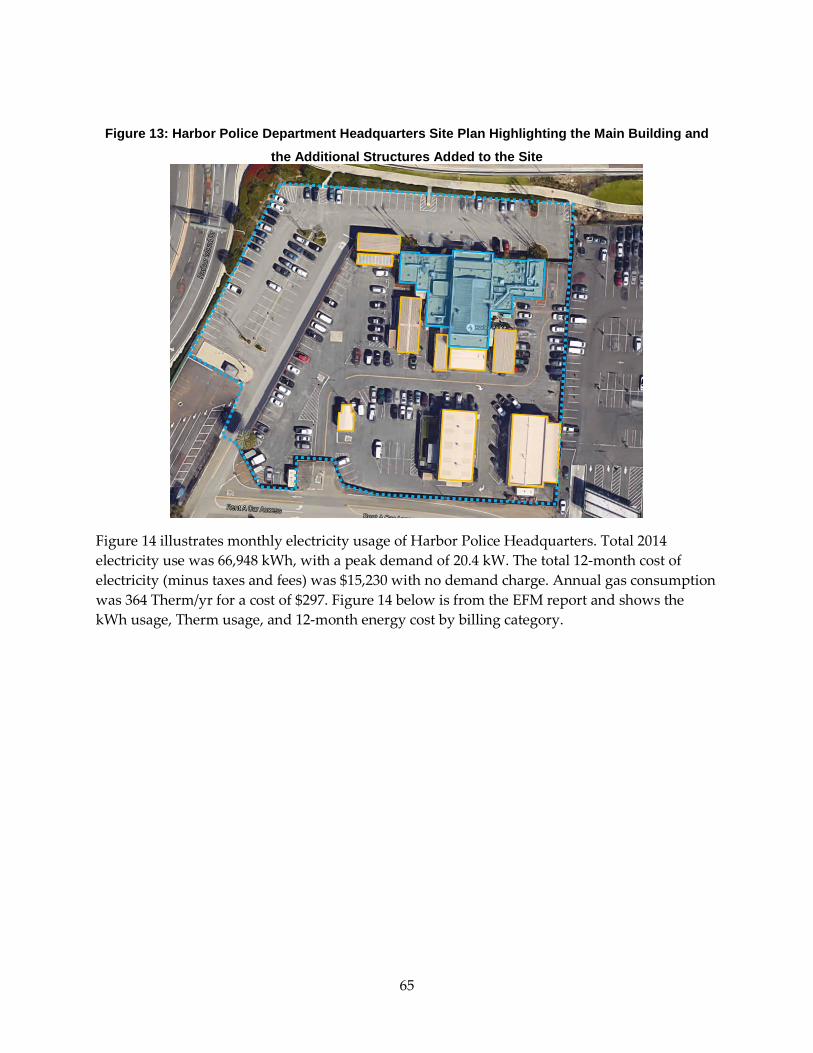
65
Figure 13: Harbor Police Department Headquarters Site Plan Highlighting the Main Building and
the Additional Structures Added to the Site
Figure 14 illustrates monthly electricity usage of Harbor Police Headquarters. Total 2014 electricity use was 66,948 kWh, with a peak demand of 20.4 kW. The total 12-month cost of electricity (minus taxes and fees) was $15,230 with no demand charge. Annual gas consumption was 364 Therm/yr for a cost of $297. Figure 14 below is from the EFM report and shows the kWh usage, Therm usage, and 12-month energy cost by billing category.
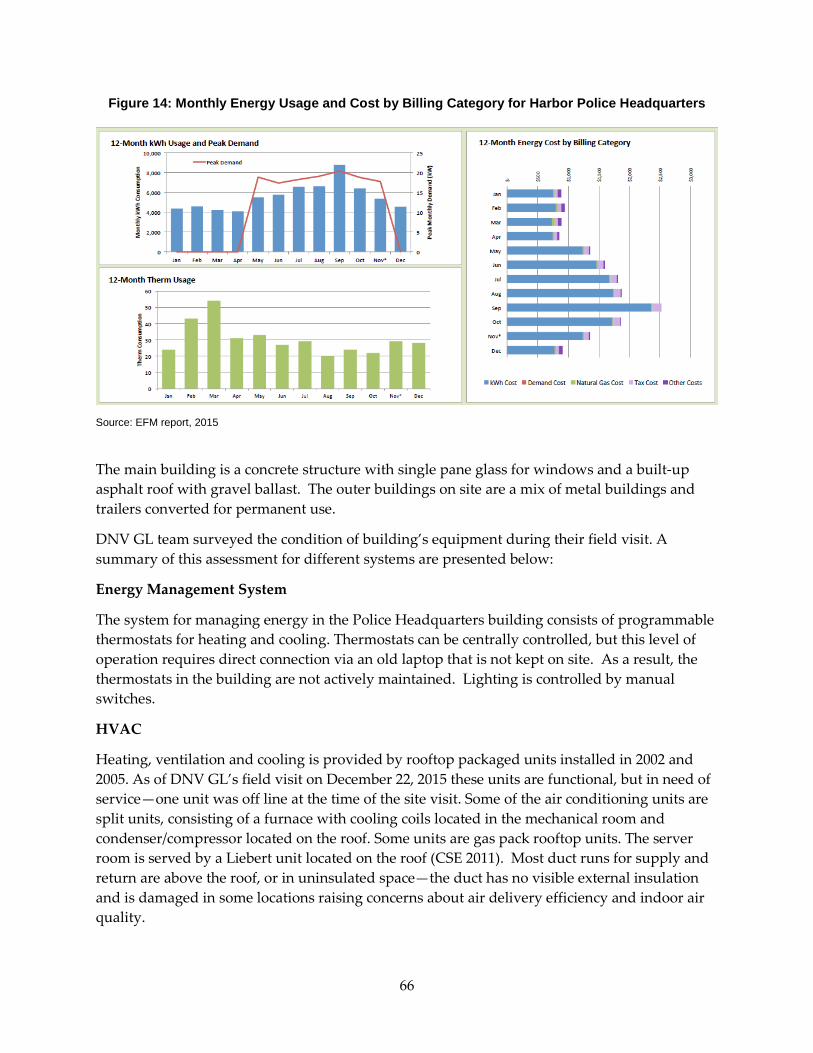
66
Figure 14: Monthly Energy Usage and Cost by Billing Category for Harbor Police Headquarters
Source: EFM report, 2015
The main building is a concrete structure with single pane glass for windows and a built-up asphalt roof with gravel ballast. The outer buildings on site are a mix of metal buildings and trailers converted for permanent use.
DNV GL team surveyed the condition of building’s equipment during their field visit. A summary of this assessment for different systems are presented below:
Energy Management System
The system for managing energy in the Police Headquarters building consists of programmable thermostats for heating and cooling. Thermostats can be centrally controlled, but this level of operation requires direct connection via an old laptop that is not kept on site. As a result, the thermostats in the building are not actively maintained. Lighting is controlled by manual switches.
HVAC
Heating, ventilation and cooling is provided by rooftop packaged units installed in 2002 and 2005. As of DNV GL’s field visit on December 22, 2015 these units are functional, but in need of service—one unit was off line at the time of the site visit. Some of the air conditioning units are split units, consisting of a furnace with cooling coils located in the mechanical room and condenser/compressor located on the roof. Some units are gas pack rooftop units. The server room is served by a Liebert unit located on the roof (CSE 2011). Most duct runs for supply and return are above the roof, or in uninsulated space—the duct has no visible external insulation and is damaged in some locations raising concerns about air delivery efficiency and indoor air quality.
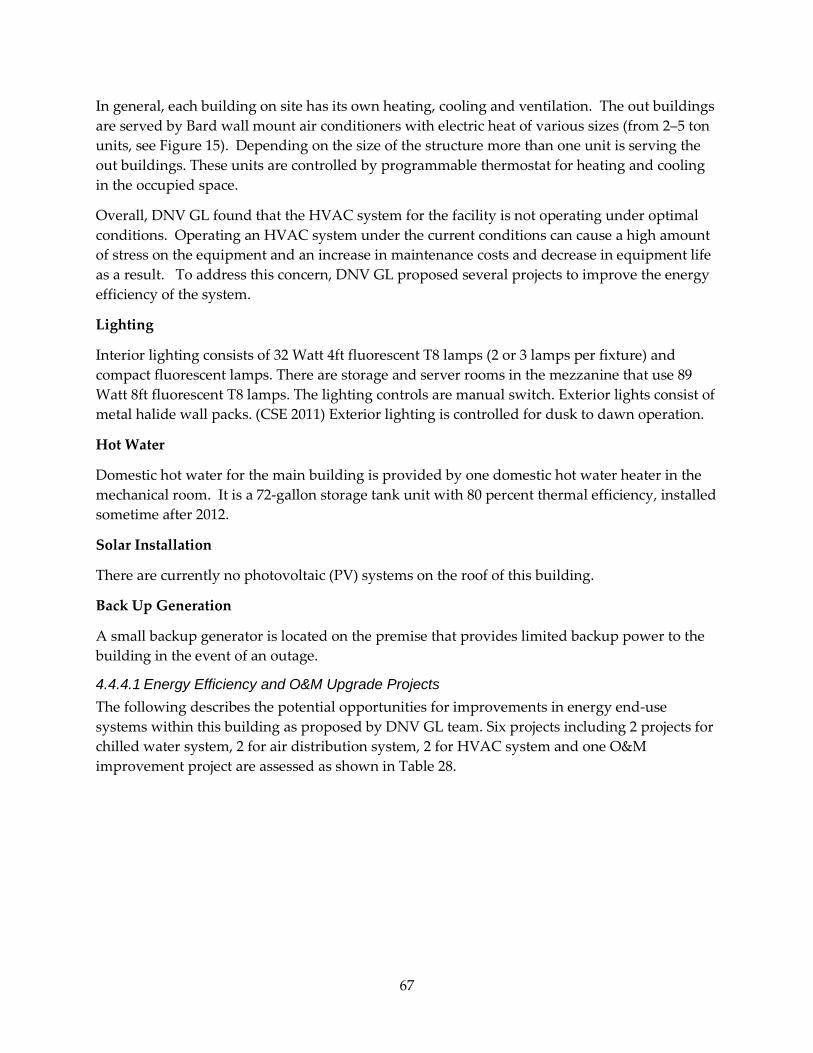
67
In general, each building on site has its own heating, cooling and ventilation. The out buildings are served by Bard wall mount air conditioners with electric heat of various sizes (from 2–5 ton units, see Figure 15). Depending on the size of the structure more than one unit is serving the out buildings. These units are controlled by programmable thermostat for heating and cooling in the occupied space.
Overall, DNV GL found that the HVAC system for the facility is not operating under optimal conditions. Operating an HVAC system under the current conditions can cause a high amount of stress on the equipment and an increase in maintenance costs and decrease in equipment life as a result. To address this concern, DNV GL proposed several projects to improve the energy efficiency of the system.
Lighting
Interior lighting consists of 32 Watt 4ft fluorescent T8 lamps (2 or 3 lamps per fixture) and compact fluorescent lamps. There are storage and server rooms in the mezzanine that use 89 Watt 8ft fluorescent T8 lamps. The lighting controls are manual switch. Exterior lights consist of metal halide wall packs. (CSE 2011) Exterior lighting is controlled for dusk to dawn operation.
Hot Water
Domestic hot water for the main building is provided by one domestic hot water heater in the mechanical room. It is a 72-gallon storage tank unit with 80 percent thermal efficiency, installed sometime after 2012.
Solar Installation
There are currently no photovoltaic (PV) systems on the roof of this building.
Back Up Generation
A small backup generator is located on the premise that provides limited backup power to the building in the event of an outage.
4.4.4.1 Energy Efficiency and O&M Upgrade Projects The following describes the potential opportunities for improvements in energy end-use systems within this building as proposed by DNV GL team. Six projects including 2 projects for chilled water system, 2 for air distribution system, 2 for HVAC system and one O&M improvement project are assessed as shown in Table 28.
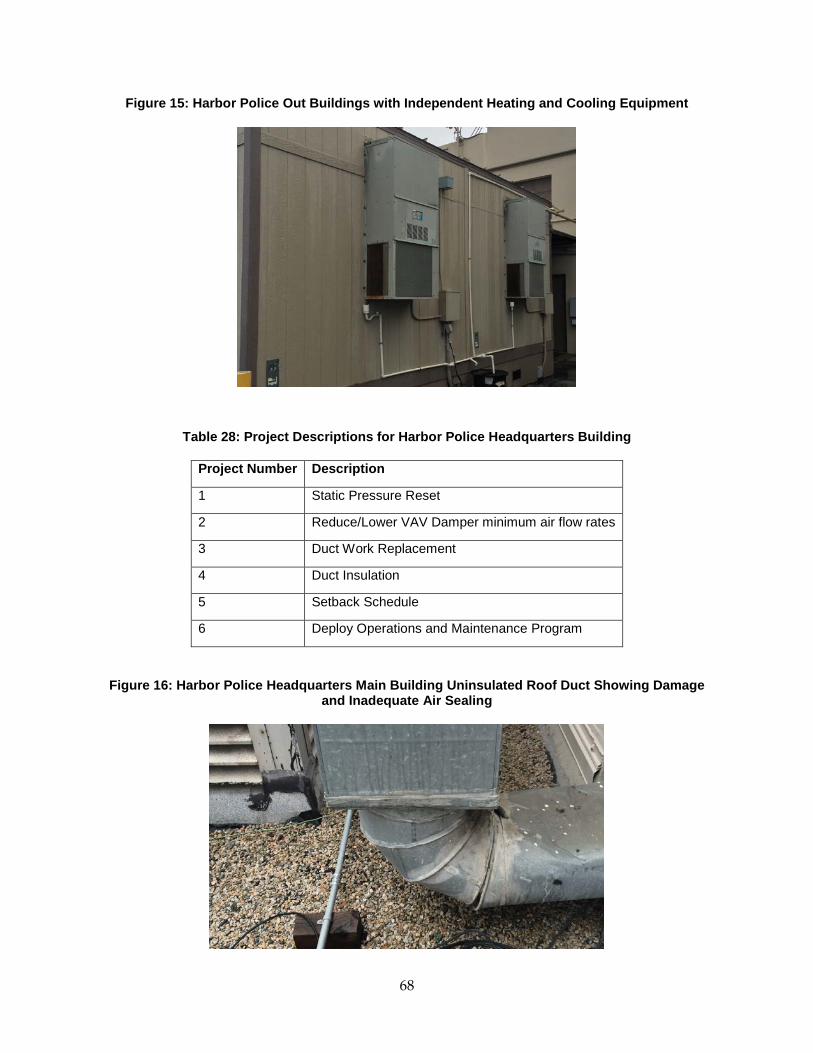
68
Figure 15: Harbor Police Out Buildings with Independent Heating and Cooling Equipment
Table 28: Project Descriptions for Harbor Police Headquarters Building
Project Number Description
1 Static Pressure Reset
2 Reduce/Lower VAV Damper minimum air flow rates
3 Duct Work Replacement
4 Duct Insulation
5 Setback Schedule
6 Deploy Operations and Maintenance Program
Figure 16: Harbor Police Headquarters Main Building Uninsulated Roof Duct Showing Damage and Inadequate Air Sealing
69
Project #1: Static Pressure Reset
This project would decrease the static pressure set point until the temperature achieves the low operational limit, 30% of the original value set for design conditions. This will reduce the running time of the supply fans but still allow the air to be supplied at the required temperatures.
Project #2: Damper Air Flow Control
Reducing the minimum air flow rate of the damper located in the VAV terminal box to 30% of its maximum value will reduce the electrical consumption of the system. Most of the savings will be a result of the reduced heating consumption, enabling lower flow rates of 55°F supply air in the shoulder and heating season.
Project #3: Duct Work Replacement
DNV GL found leaks in forced air duct systems, which are recognized as a major source of energy waste. Duct leakage can prevent heating and cooling systems from doing their job properly, resulting in hot or cold spaces and humidity problems—all of which are present in this facility. This proposed project would involve conducting a duct performance test to identify leaks in the system, and the replacement and sealing of all ducts to minimize system loss.
Project #4: Duct Insulation
DNV GL found uninsulated duct work on the roof of the building (see Figure 16). Adding insulation to these ducts will have a substantial impact on energy consumption.
Project #5: Setback Schedule
For all HVAC systems that serve non 24/7 areas, this project would implement night setback controls. For the San Diego climate, a setback temperature of 78°F in summer and 65°F in winter is recommended. For the IT and server rooms that have acceptable temperature limits, it should be confirmed that unoccupied set points are not outside the acceptable limits of the equipment in the space. In addition, an optimum start/stop sequence can be customized and implemented through the building automation system.
Project #6: Deploy Operations and Maintenance Program
Finally, DNV GL proposes that the building deploy an O&M program that would help maintain the quality of the HVAC system and reduce energy loss. Low hanging fruit maintenance includes: calibrating system sensors, replacing air filters, cleaning coils, periodically retro commissioning split systems, detecting air leaks, monitoring oil leaks, and verifying the operation of system components.
Project Evaluation and Ranking
DNV GL evaluated all proposed projects for the Harbor Police Headquarters Building, weighting and ranking them according to the following relative importance of criteria: resiliency, economics, and reduced emissions. It was found that Project #1 – Static Pressure
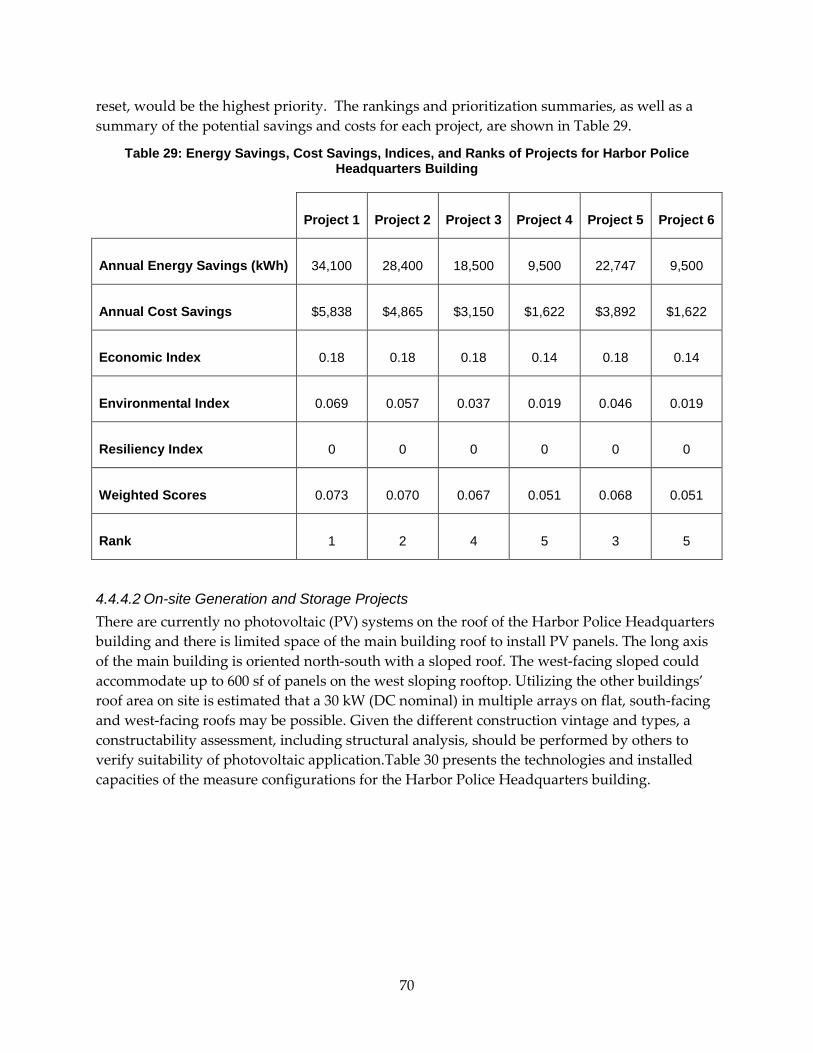
70
reset, would be the highest priority. The rankings and prioritization summaries, as well as a summary of the potential savings and costs for each project, are shown in Table 29.
Table 29: Energy Savings, Cost Savings, Indices, and Ranks of Projects for Harbor Police Headquarters Building
Project 1 Project 2 Project 3 Project 4 Project 5 Project 6
Annual Energy Savings (kWh) 34,100 28,400 18,500 9,500 22,747 9,500
Annual Cost Savings $5,838 $4,865 $3,150 $1,622 $3,892 $1,622
Economic Index 0.18 0.18 0.18 0.14 0.18 0.14
Environmental Index 0.069 0.057 0.037 0.019 0.046 0.019
Resiliency Index 0 0 0 0 0 0
Weighted Scores 0.073 0.070 0.067 0.051 0.068 0.051
Rank 1 2 4 5 3 5
4.4.4.2 On-site Generation and Storage Projects There are currently no photovoltaic (PV) systems on the roof of the Harbor Police Headquarters building and there is limited space of the main building roof to install PV panels. The long axis of the main building is oriented north-south with a sloped roof. The west-facing sloped could accommodate up to 600 sf of panels on the west sloping rooftop. Utilizing the other buildings’ roof area on site is estimated that a 30 kW (DC nominal) in multiple arrays on flat, south-facing and west-facing roofs may be possible. Given the different construction vintage and types, a constructability assessment, including structural analysis, should be performed by others to verify suitability of photovoltaic application.Table 30 presents the technologies and installed capacities of the measure configurations for the Harbor Police Headquarters building.
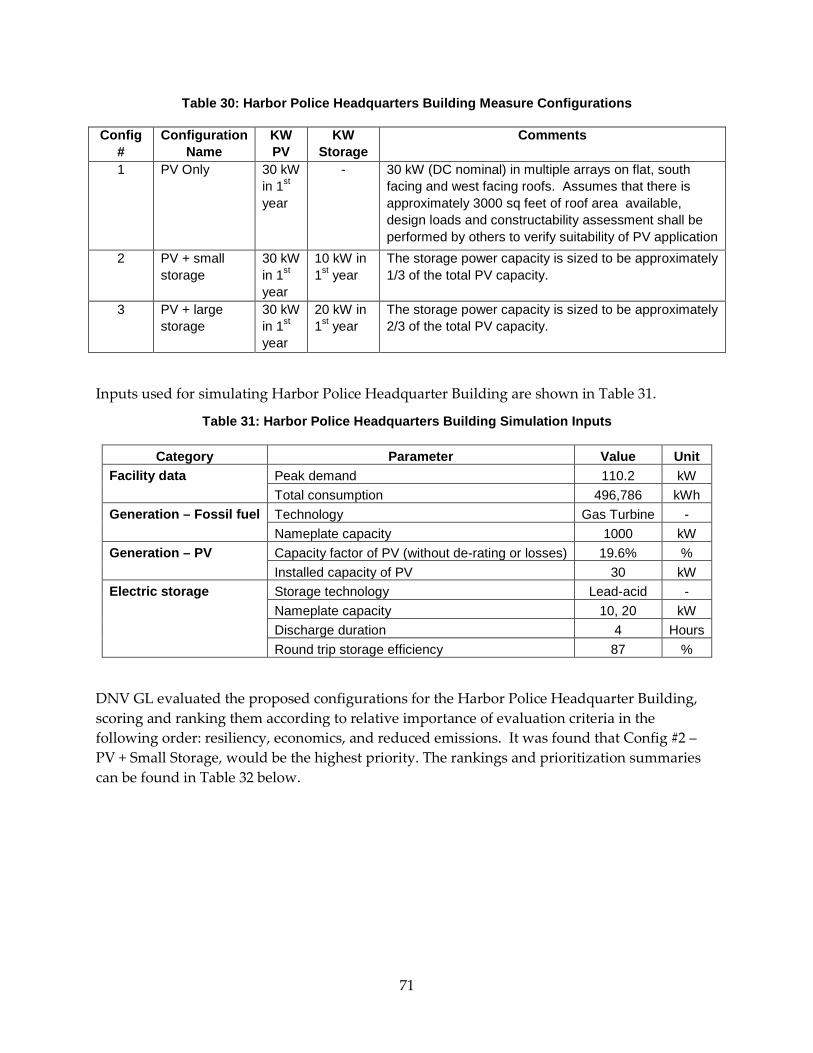
71
Table 30: Harbor Police Headquarters Building Measure Configurations
Config #
Configuration Name
KW PV
KW Storage
Comments
1 PV Only 30 kW in 1st year
- 30 kW (DC nominal) in multiple arrays on flat, south facing and west facing roofs. Assumes that there is approximately 3000 sq feet of roof area available, design loads and constructability assessment shall be performed by others to verify suitability of PV application
2 PV + small storage
30 kW in 1st year
10 kW in 1st year
The storage power capacity is sized to be approximately 1/3 of the total PV capacity.
3 PV + large storage
30 kW in 1st year
20 kW in 1st year
The storage power capacity is sized to be approximately 2/3 of the total PV capacity.
Inputs used for simulating Harbor Police Headquarter Building are shown in Table 31.
Table 31: Harbor Police Headquarters Building Simulation Inputs
Category Parameter Value Unit Facility data Peak demand 110.2 kW
Total consumption 496,786 kWh Generation – Fossil fuel Technology Gas Turbine -
Nameplate capacity 1000 kW Generation – PV Capacity factor of PV (without de-rating or losses) 19.6% %
Installed capacity of PV 30 kW Electric storage Storage technology Lead-acid -
Nameplate capacity 10, 20 kW Discharge duration 4 Hours Round trip storage efficiency 87 %
DNV GL evaluated the proposed configurations for the Harbor Police Headquarter Building, scoring and ranking them according to relative importance of evaluation criteria in the following order: resiliency, economics, and reduced emissions. It was found that Config #2 – PV + Small Storage, would be the highest priority. The rankings and prioritization summaries can be found in Table 32 below.
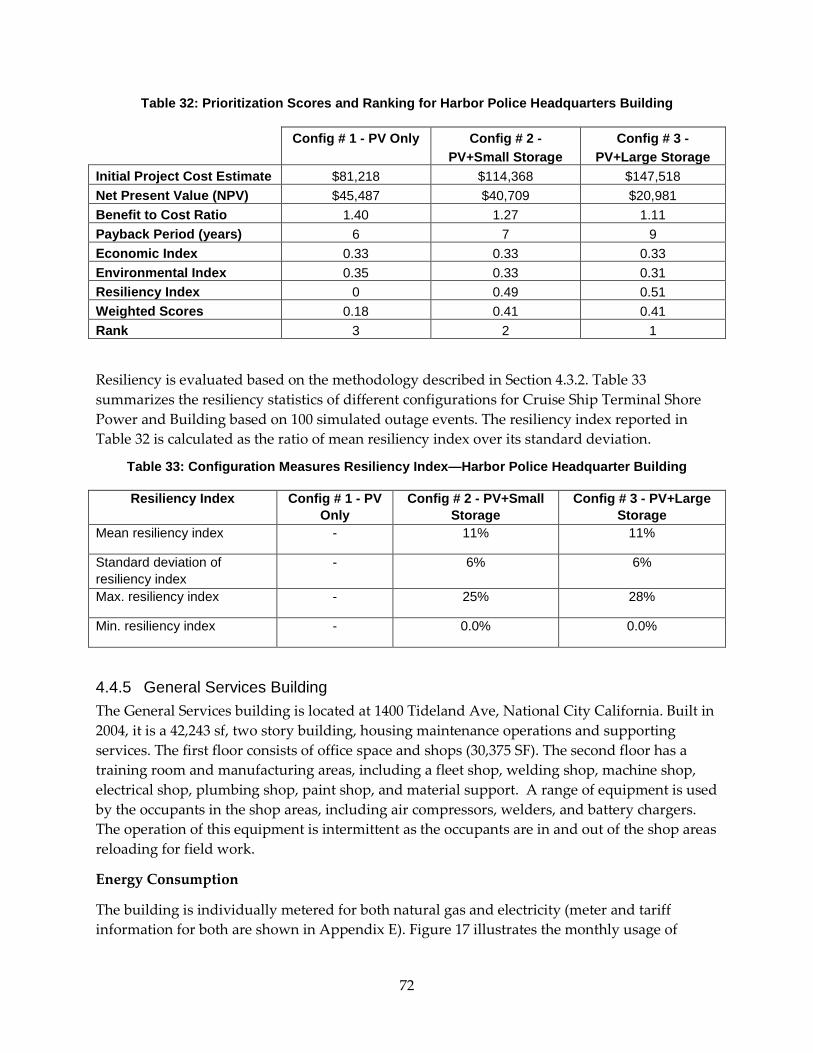
72
Table 32: Prioritization Scores and Ranking for Harbor Police Headquarters Building
Config # 1 - PV Only Config # 2 - PV+Small Storage
Config # 3 - PV+Large Storage
Initial Project Cost Estimate $81,218 $114,368 $147,518 Net Present Value (NPV) $45,487 $40,709 $20,981 Benefit to Cost Ratio 1.40 1.27 1.11 Payback Period (years) 6 7 9 Economic Index 0.33 0.33 0.33 Environmental Index 0.35 0.33 0.31 Resiliency Index 0 0.49 0.51 Weighted Scores 0.18 0.41 0.41 Rank 3 2 1
Resiliency is evaluated based on the methodology described in Section 4.3.2. Table 33 summarizes the resiliency statistics of different configurations for Cruise Ship Terminal Shore Power and Building based on 100 simulated outage events. The resiliency index reported in Table 32 is calculated as the ratio of mean resiliency index over its standard deviation.
Table 33: Configuration Measures Resiliency Index—Harbor Police Headquarter Building
Resiliency Index Config # 1 - PV Only
Config # 2 - PV+Small Storage
Config # 3 - PV+Large Storage
Mean resiliency index - 11% 11%
Standard deviation of resiliency index
- 6% 6%
Max. resiliency index - 25% 28%
Min. resiliency index - 0.0% 0.0%
4.4.5 General Services Building The General Services building is located at 1400 Tideland Ave, National City California. Built in 2004, it is a 42,243 sf, two story building, housing maintenance operations and supporting services. The first floor consists of office space and shops (30,375 SF). The second floor has a training room and manufacturing areas, including a fleet shop, welding shop, machine shop, electrical shop, plumbing shop, paint shop, and material support. A range of equipment is used by the occupants in the shop areas, including air compressors, welders, and battery chargers. The operation of this equipment is intermittent as the occupants are in and out of the shop areas reloading for field work.
Energy Consumption
The building is individually metered for both natural gas and electricity (meter and tariff information for both are shown in Appendix E). Figure 17 illustrates the monthly usage of
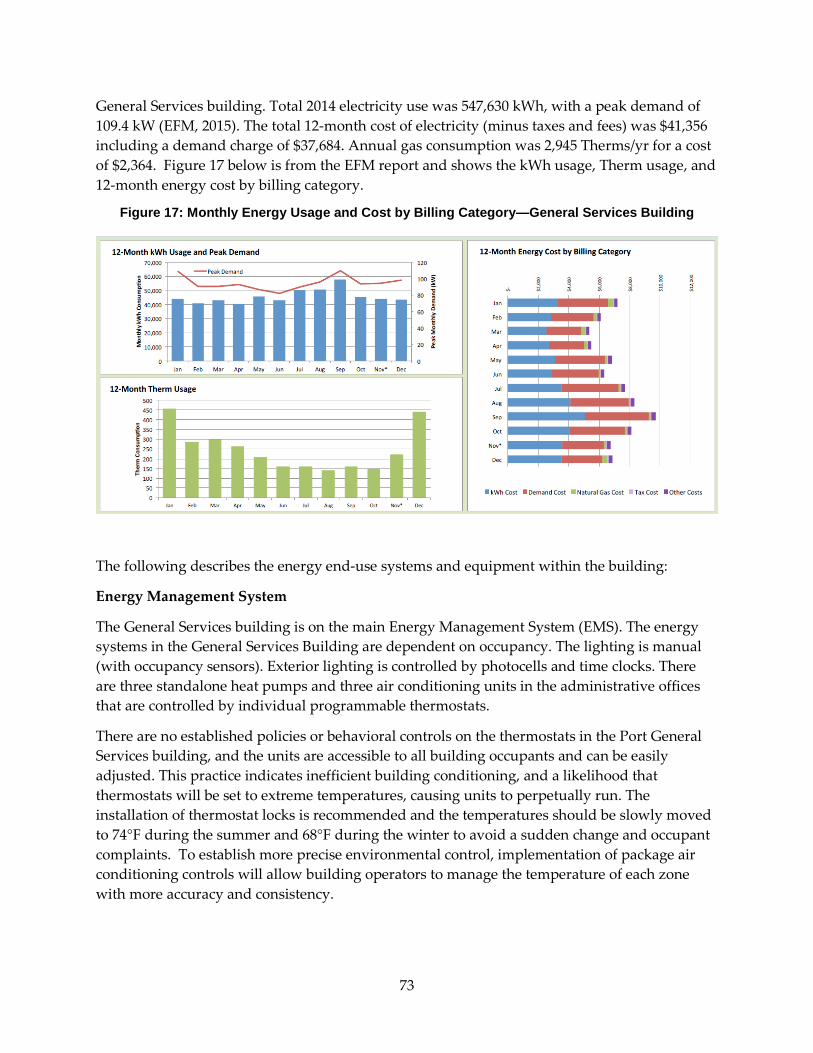
73
General Services building. Total 2014 electricity use was 547,630 kWh, with a peak demand of 109.4 kW (EFM, 2015). The total 12-month cost of electricity (minus taxes and fees) was $41,356 including a demand charge of $37,684. Annual gas consumption was 2,945 Therms/yr for a cost of $2,364. Figure 17 below is from the EFM report and shows the kWh usage, Therm usage, and 12-month energy cost by billing category.
Figure 17: Monthly Energy Usage and Cost by Billing Category—General Services Building
The following describes the energy end-use systems and equipment within the building:
Energy Management System
The General Services building is on the main Energy Management System (EMS). The energy systems in the General Services Building are dependent on occupancy. The lighting is manual (with occupancy sensors). Exterior lighting is controlled by photocells and time clocks. There are three standalone heat pumps and three air conditioning units in the administrative offices that are controlled by individual programmable thermostats.
There are no established policies or behavioral controls on the thermostats in the Port General Services building, and the units are accessible to all building occupants and can be easily adjusted. This practice indicates inefficient building conditioning, and a likelihood that thermostats will be set to extreme temperatures, causing units to perpetually run. The installation of thermostat locks is recommended and the temperatures should be slowly moved to 74°F during the summer and 68°F during the winter to avoid a sudden change and occupant complaints. To establish more precise environmental control, implementation of package air conditioning controls will allow building operators to manage the temperature of each zone with more accuracy and consistency.
74
HVAC/Air Distribution System
There are three standalone heat pumps and three air conditioning units in the administrative offices that are controlled by individual programmable thermostats.
The individual heat pumps and air conditioners provide local air distribution. Shop areas utilize eight gas-fired unit heaters on an as-needed basis.
A heat pump VAV system is primarily used for office space conditioning. There are three rooftop heat pumps: one serves the office areas on the first floor, the second serves the office areas on the second floor and the third serves the training room on the first floor.
Similar to the other buildings, there were “too hot” and “too cold” area of the building which usually is the direct result of incorrect VAV box zoning in a building. It was also determined from the building’s EMS system that the appropriate amount of outdoor air is not being delivered to all the occupied spaces. To help with providing adequate airflow to the conditioned spaces, DNV GL recommends retro-commissioning of the building systems with the intention of “rebalancing” the systems and resetting AHU and VAV boxes valves to design conditions. Further, verifying correct placement of the room thermostat and linked VAV box with occupant layout will also help in addressing thermal comfort needs.
Lighting
The building is primarily lit with T8 linear fluorescent lamps and CFL can lights. The exterior lighting uses metal halide bulbs consisting of 400W parking lot floodlights and 175W wall packs. The lighting is manual, with occupancy sensors. Exterior lighting is controlled by photocells and time clocks.
Hot Water
A single 715MBTU boiler serves all sinks and showers, with an approximate count of 10 showers per day.
Solar Installation
A 90 kW (DC nominal) solar photovoltaic array is installed on roof. Regular cleaning is recommended for these systems to maintain performance.
Back Up Generation
There is a 135 kW backup generator (shown in Figure 18) at the facility. The generator is located in the south parking area of the General Services building.
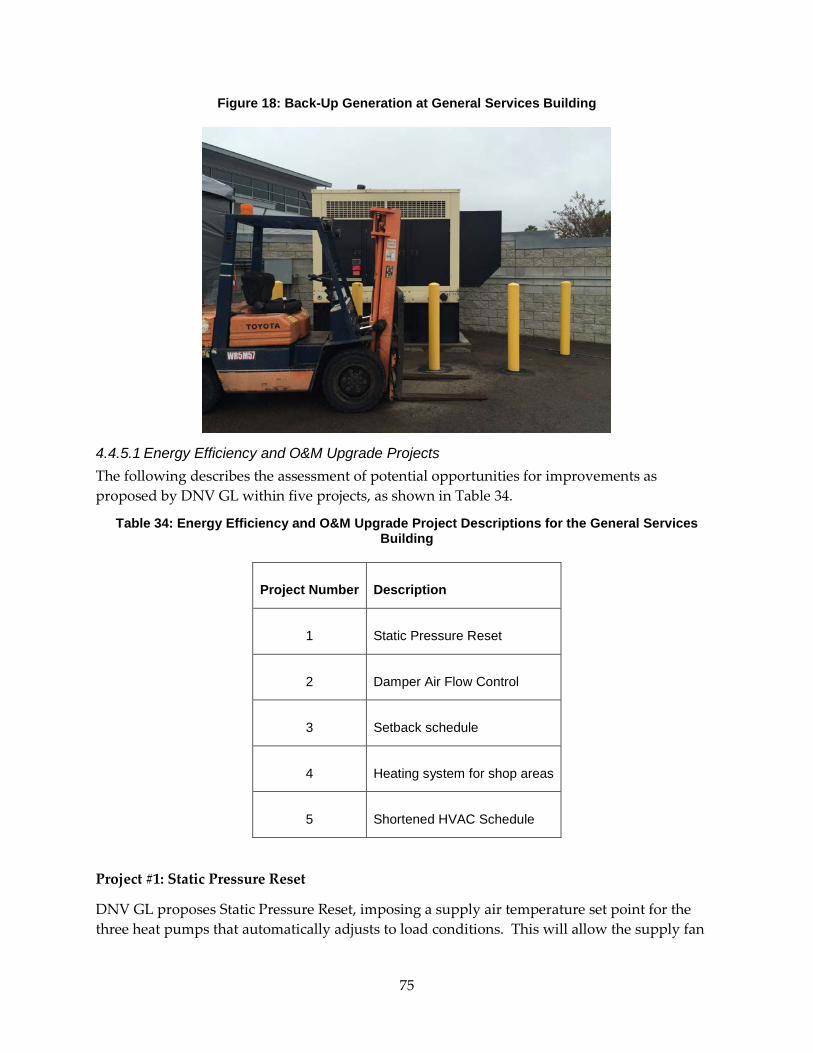
75
Figure 18: Back-Up Generation at General Services Building
4.4.5.1 Energy Efficiency and O&M Upgrade Projects The following describes the assessment of potential opportunities for improvements as proposed by DNV GL within five projects, as shown in Table 34.
Table 34: Energy Efficiency and O&M Upgrade Project Descriptions for the General Services Building
Project Number Description
1 Static Pressure Reset
2 Damper Air Flow Control
3 Setback schedule
4 Heating system for shop areas
5 Shortened HVAC Schedule
Project #1: Static Pressure Reset
DNV GL proposes Static Pressure Reset, imposing a supply air temperature set point for the three heat pumps that automatically adjusts to load conditions. This will allow the supply fan
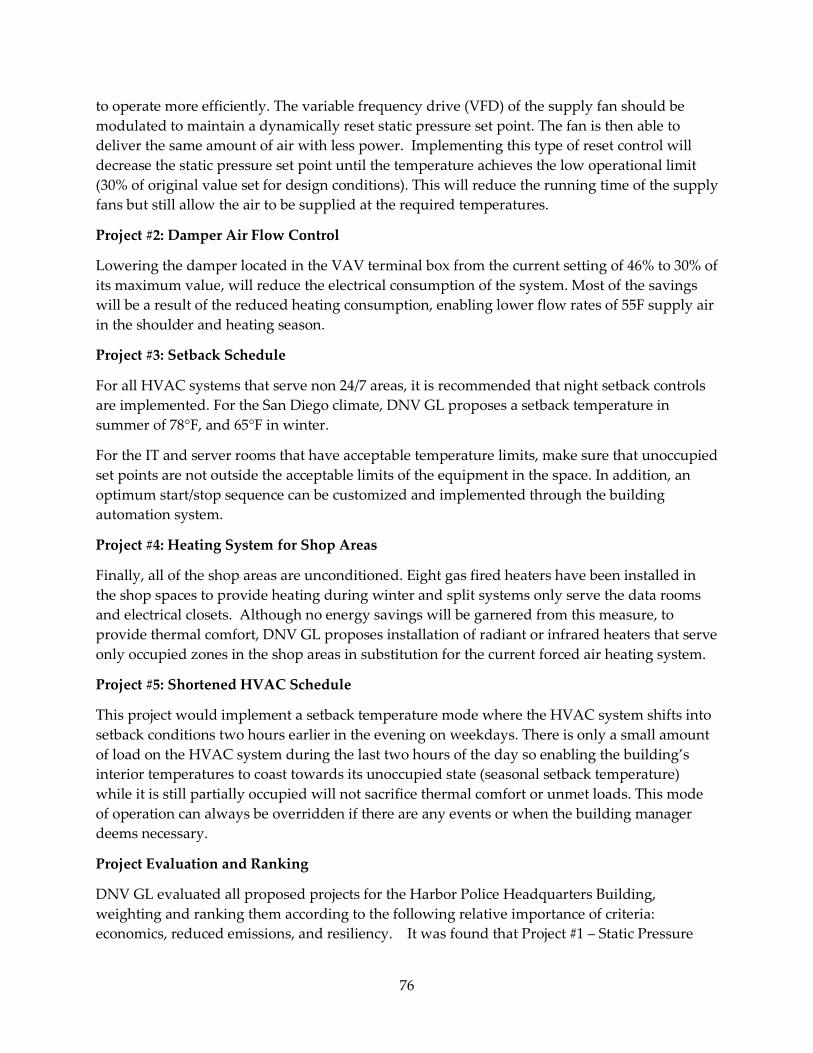
76
to operate more efficiently. The variable frequency drive (VFD) of the supply fan should be modulated to maintain a dynamically reset static pressure set point. The fan is then able to deliver the same amount of air with less power. Implementing this type of reset control will decrease the static pressure set point until the temperature achieves the low operational limit (30% of original value set for design conditions). This will reduce the running time of the supply fans but still allow the air to be supplied at the required temperatures.
Project #2: Damper Air Flow Control
Lowering the damper located in the VAV terminal box from the current setting of 46% to 30% of its maximum value, will reduce the electrical consumption of the system. Most of the savings will be a result of the reduced heating consumption, enabling lower flow rates of 55F supply air in the shoulder and heating season.
Project #3: Setback Schedule
For all HVAC systems that serve non 24/7 areas, it is recommended that night setback controls are implemented. For the San Diego climate, DNV GL proposes a setback temperature in summer of 78°F, and 65°F in winter.
For the IT and server rooms that have acceptable temperature limits, make sure that unoccupied set points are not outside the acceptable limits of the equipment in the space. In addition, an optimum start/stop sequence can be customized and implemented through the building automation system.
Project #4: Heating System for Shop Areas
Finally, all of the shop areas are unconditioned. Eight gas fired heaters have been installed in the shop spaces to provide heating during winter and split systems only serve the data rooms and electrical closets. Although no energy savings will be garnered from this measure, to provide thermal comfort, DNV GL proposes installation of radiant or infrared heaters that serve only occupied zones in the shop areas in substitution for the current forced air heating system.
Project #5: Shortened HVAC Schedule
This project would implement a setback temperature mode where the HVAC system shifts into setback conditions two hours earlier in the evening on weekdays. There is only a small amount of load on the HVAC system during the last two hours of the day so enabling the building’s interior temperatures to coast towards its unoccupied state (seasonal setback temperature) while it is still partially occupied will not sacrifice thermal comfort or unmet loads. This mode of operation can always be overridden if there are any events or when the building manager deems necessary.
Project Evaluation and Ranking
DNV GL evaluated all proposed projects for the Harbor Police Headquarters Building, weighting and ranking them according to the following relative importance of criteria: economics, reduced emissions, and resiliency. It was found that Project #1 – Static Pressure
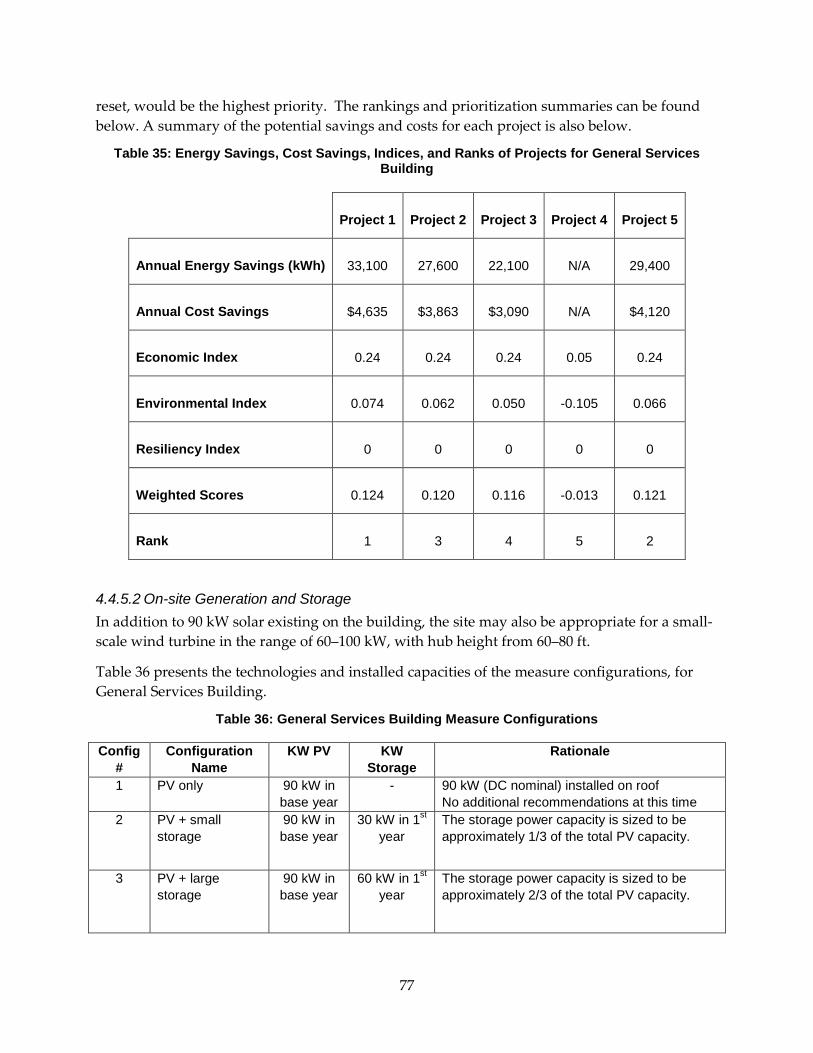
77
reset, would be the highest priority. The rankings and prioritization summaries can be found below. A summary of the potential savings and costs for each project is also below.
Table 35: Energy Savings, Cost Savings, Indices, and Ranks of Projects for General Services Building
Project 1 Project 2 Project 3 Project 4 Project 5
Annual Energy Savings (kWh) 33,100 27,600 22,100 N/A 29,400
Annual Cost Savings $4,635 $3,863 $3,090 N/A $4,120
Economic Index 0.24 0.24 0.24 0.05 0.24
Environmental Index 0.074 0.062 0.050 -0.105 0.066
Resiliency Index 0 0 0 0 0
Weighted Scores 0.124 0.120 0.116 -0.013 0.121
Rank 1 3 4 5 2
4.4.5.2 On-site Generation and Storage In addition to 90 kW solar existing on the building, the site may also be appropriate for a small-scale wind turbine in the range of 60–100 kW, with hub height from 60–80 ft.
Table 36 presents the technologies and installed capacities of the measure configurations, for General Services Building.
Table 36: General Services Building Measure Configurations
Config #
Configuration Name
KW PV KW Storage
Rationale
1 PV only 90 kW in base year
- 90 kW (DC nominal) installed on roof No additional recommendations at this time
2 PV + small storage
90 kW in base year
30 kW in 1st year
The storage power capacity is sized to be approximately 1/3 of the total PV capacity.
3 PV + large storage
90 kW in base year
60 kW in 1st year
The storage power capacity is sized to be approximately 2/3 of the total PV capacity.
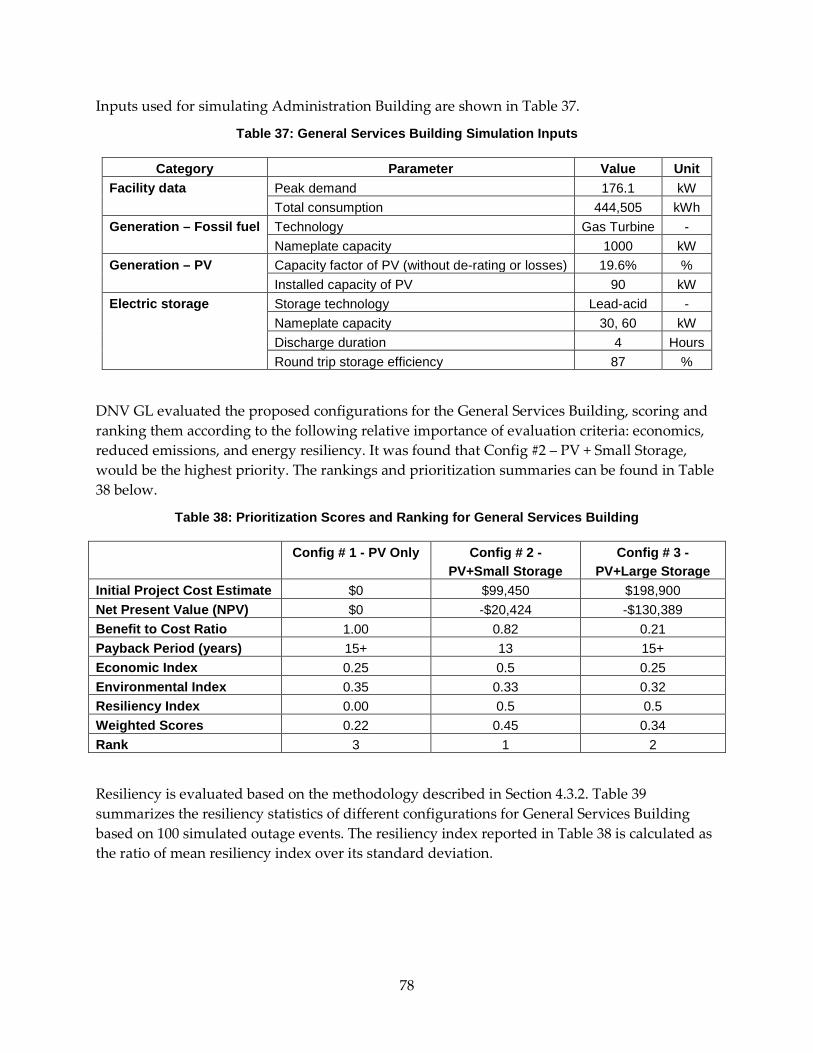
78
Inputs used for simulating Administration Building are shown in Table 37.
Table 37: General Services Building Simulation Inputs
Category Parameter Value Unit Facility data Peak demand 176.1 kW
Total consumption 444,505 kWh Generation – Fossil fuel Technology Gas Turbine -
Nameplate capacity 1000 kW Generation – PV Capacity factor of PV (without de-rating or losses) 19.6% %
Installed capacity of PV 90 kW Electric storage Storage technology Lead-acid -
Nameplate capacity 30, 60 kW Discharge duration 4 Hours Round trip storage efficiency 87 %
DNV GL evaluated the proposed configurations for the General Services Building, scoring and ranking them according to the following relative importance of evaluation criteria: economics, reduced emissions, and energy resiliency. It was found that Config #2 – PV + Small Storage, would be the highest priority. The rankings and prioritization summaries can be found in Table 38 below.
Table 38: Prioritization Scores and Ranking for General Services Building
Config # 1 - PV Only Config # 2 - PV+Small Storage
Config # 3 - PV+Large Storage
Initial Project Cost Estimate $0 $99,450 $198,900 Net Present Value (NPV) $0 -$20,424 -$130,389 Benefit to Cost Ratio 1.00 0.82 0.21 Payback Period (years) 15+ 13 15+ Economic Index 0.25 0.5 0.25 Environmental Index 0.35 0.33 0.32 Resiliency Index 0.00 0.5 0.5 Weighted Scores 0.22 0.45 0.34 Rank 3 1 2
Resiliency is evaluated based on the methodology described in Section 4.3.2. Table 39 summarizes the resiliency statistics of different configurations for General Services Building based on 100 simulated outage events. The resiliency index reported in Table 38 is calculated as the ratio of mean resiliency index over its standard deviation.
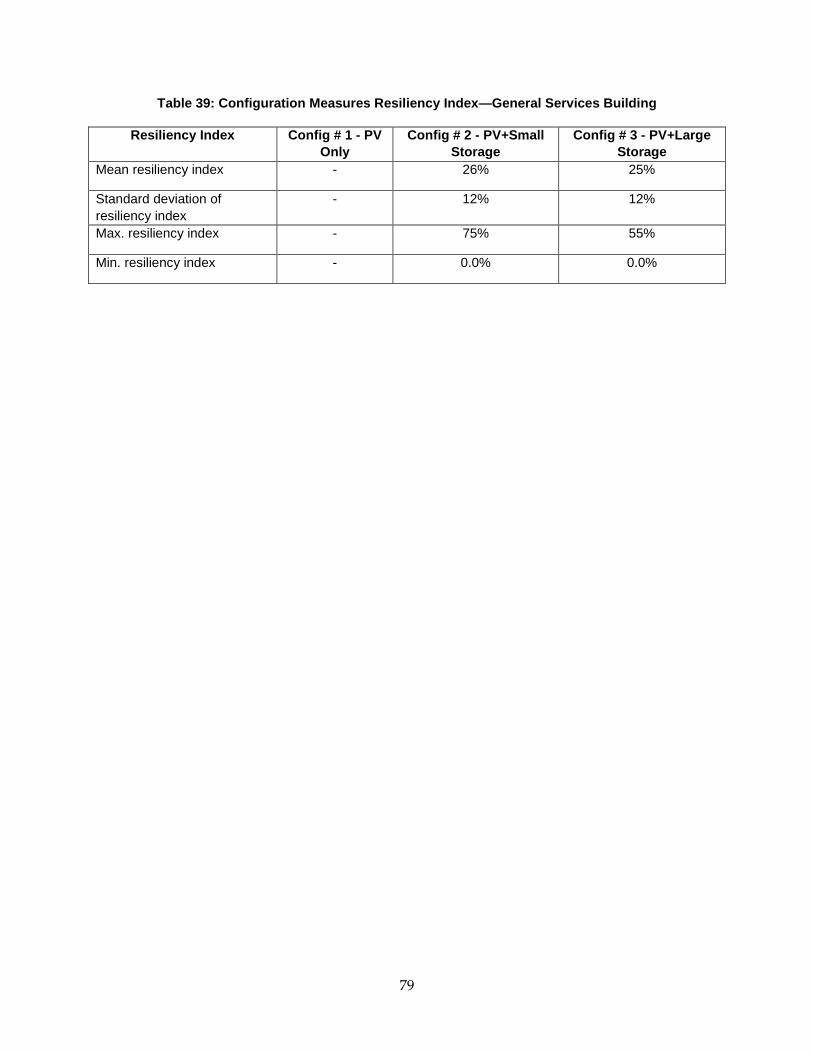
79
Table 39: Configuration Measures Resiliency Index—General Services Building
Resiliency Index Config # 1 - PV Only
Config # 2 - PV+Small Storage
Config # 3 - PV+Large Storage
Mean resiliency index - 26% 25%
Standard deviation of resiliency index
- 12% 12%
Max. resiliency index - 75% 55%
Min. resiliency index - 0.0% 0.0%
80
CHAPTER 5: Recommendations Adoption of clean energy measures at California ports would provide significant advantages that span across multiple players including port authorities, port tenants, utilities, entities that do business with ports, and their surrounding communities. These benefits can be summarized as follows:
5.1 Economic Benefits Deploying measures that help reduce energy consumption, as well as generation and storage technologies that can offset energy purchase from the grid, would provide economic savings for both the port authority and the tenants. These savings will vary across different facilities depending on the energy and delivery charge structures they have. In addition, on-site generation and storage can reduce capacity upgrade expenditures that Port authorities have to undertake to supply increased electric demand at the terminals due to electrification and shore power installations. Since the portion of costs that is not funded through government grants will generally be passed on to the tenants as part of their lease agreement, these savings also translate into a benefit for the tenants.
Utility companies can also gain economic advantage when ports and their tenants invest in certain clean energy technologies that can relieve the stress on the utility’s system and therefore help defer required capacity upgrade investments. This is especially notable for customers located in the most congested circuits. Moreover, certain technologies such as storage can support the utility’s operations by providing resource adequacy capacity and Volt/VAR control, if joint projects can be implemented that mutually benefit both utilities and their customers (ports and their tenants in this case). Procuring such services at lower cost and at lower levels will translate into financial benefits for utility providers.
5.2 Environmental Benefits As California ports are located in sensitive environmental settings—for example, close to dense urban communities—their operations and actions can result in a range of environmental impacts on their surroundings. Clean energy measures can improve some of these impacts by improving, for example, air quality and waste management. Deploying energy efficiency upgrades, renewable generation, and electricity storage can reduce the grid off-take and reduce GHG emissions accordingly. All California ports have targets for GHG emissions. While port authorities have been launching a wide variety of initiatives to achieve these targets, investment in clean energy measures is part of the solution portfolio they should pursue. Some energy efficiency upgrades such as implementation of building energy management systems, HVAC retrofits, O&M programs, and lighting retrofits can not only help ports achieve significant emission reduction at relatively low cost but also help promote more efficient port operations.
81
5.3 Resiliency Benefits On-site generation and storage with islanding capabilities can improve energy resiliency at ports. An energy resilient system would help ports cope with external stress and sustain their critical operations related to their security and business continuity when the power grid is down. In addition, certain facilities—mostly port-operated administrative and service buildings, and occasionally some tenant-operated facilities—in ports can provide shelter for the surrounding communities during emergency events and serve as a resiliency hub for the community.
DNV GL recommends several activities for consideration by ports and their stakeholders to promote the adoption of clean energy measures at California ports. These recommendations are summarized as follows:
5.4 Alignment of Policy, Port Operations and Industry Trends One of the challenges that most ports face is the lack of alignment among policies/state programs, ports’ core business and operations, and industry trends. The core business of ports focuses on providing infrastructure and services for handling different types of cargo in the most efficient manner. While ports are committed to pursuing clean energy initiatives to improve their environmental impact footprint, keeping these initiatives in line with their core business obligations is challenging. The following recommendations can help reduce/remove some of the challenges to ports and their customers:
1. Mandates should be developed and enforced considering the core operational needs of ports and their customers. As such, technologies that can support the mandates should be field tested and supportive of the port’s operations.
2. Regulations and their enforcement schedules should align with industry trends. For example, to comply with at-berth regulations, both terminal and shipping lines have to make investments to be equipped with plug-in capabilities. Many passenger vessels are getting larger, requiring a larger shore power facility; however, not many vessels are equipped with plug-in capabilities. Therefore, ports can end up in situations where they have paid for capital intensive upgrades and yet vessels cannot plug in at berth. Inconsistency in regulation and industry trends creates inefficiency which in turn jeopardizes a port’s business retention and competitiveness.
3. Incentive and grant programs should target technologies that are field tested and will not adversely impact the efficiency of cargo handling at ports.
4. Funding assistance programs should be aligned with technology trends. For example, loans will throw off the economics of investment for fast moving technologies and therefore they are not good financial solutions to incentivize ports or their tenants to pursue less mature technologies.
82
5.5 Active Communication Ports’ supply chains involve a diverse set of heterogeneous operations, and many entities are involved in these processes. All the way from various regulatory and state agencies to the port authority, to the port’s tenants and clients, to entities who do business with ports to surrounding communities, various players are engaged in setting policies and regulations governing different aspects of ports’ business and operation, as wells as managing, operating, and accepting services from different facilities at the port. Therefore, improvement in the supply chain is a complicated task and having an interactive network bringing together different stakeholders and promoting communication among them is both critical and challenging at the same time. Since port authorities in California have an overarching administrative role, own the real estate, and in some cases run maritime operations, they are in the right position to act as the organizers and facilitators of such a clean energy network.
Although some ports have already implemented initiatives to develop variations of these networks, they can benefit from several improvements. As part of these networks, ports should establish communication channels to share information, to facilitate outreach and education, and to track records in a centralized manner. Communication channels, while being transparent, have to take into account sufficient security and access privilege restrictions to protect the sensitive information of various entities.
These communication networks can be replicated at state level to promote more information exchange and sharing of lessons learned among different ports in California.
5.6 Close Interaction with Utilities When it comes to investment in clean energy measures, the utility provider of each port is a critical entity to interact with for two reasons:
1. The utility company owns and operates the electric infrastructure that delivers power to various port facilities. Therefore, the utility is responsible for any infrastructure upgrades required if power demand in one or more facilities increases. These upgrades are capital intensive and investment owned utilities (IOUs) will not rate base these investments if the upgrade does not impact a larger portion of their customers besides the port.
2. There are clean energy projects that can be mutually beneficial to both the port and the utility provider. This provides opportunities for the two parties to collaborate on joint projects, which will result in a more efficient electric system as a whole at lower cost. There is legislation that encourages such engagements. For example, Assembly Bill No. 628 has specific guidelines for energy management plans for several port districts (including the Port of Hueneme, Port of Los Angles, Port of Long Beach, Port of Oakland, Port of San Diego, and others). As such, IOUs, community choice aggregators, and publicly owned utilities are encouraged to engage in joint projects with ports and harbor districts to provide and administer energy-related service alternatives and programs that may promote economic development and retention in those districts.
83
The nature of the dynamics between a port and its utility provider, and how ports should strategize their relationship with their providers, vary across the 5 ports examined in this study. While the Port of Hueneme, Port of Long Beach, Port of San Diego and a portion of the Port of Oakland are served by IOUs, the Port of Los Angeles is served by LADWP (a municipal utility), another department of City of Los Angeles and Port’s sister agency. The Port of Oakland also has a utility service operation and acts as a municipal utility servicing the airport and some of the marine terminals.
The Port of Los Angeles can greatly benefit from strategic collaboration with LADWP, and together they can undertake projects that can fulfill their obligations to supply power to customers and/or comply with regulations. An example of such a project is the existing 1 MW solar PV installation at the Port’s World Cruise Center that is owned and operated by LADWP. The generation counts towards LADWP’s RPS and it also supports the Port’s larger goals under the San Pedro Bay Ports Clean Air Action Plan.
The Port of Oakland can benefit from reconfiguration of its electric system, in how different portions of the Port will be served by PG&E verses the Port’s utility service. For example, consolidating electric service under the Port’s own electric utility provides certain advantages and will position the Port to pursue options identified in this report. While investigating the reconfiguration options, other energy solutions should be considered, such as installing microgrids to increase the reliability of the utility service, renewable generation plants that can count towards RPS requirements, and other technologies that can support utility operations (e.g., Fuel Cell and battery storage for capacity, micro-turbines and battery storage for voltage control and renewable intermittency mitigation). Further, redevelopment plans for the old army base should consider the potential for investment in clean energy measures.
Other ports under IOU service territories can collaborate with their respective IOU to identify and plan for potential joint projects. For example, given capacity limitations the Port of San Diego faces at CST in case of an upgrade in the shore power facility, it can pursue joint projects with SDG&E to install technologies such as batteries and demand side management technologies to shift load on circuits feeding CST and free up capacity to allow for future higher power demand on that terminal.
5.7 Innovative Financing Solutions and Revenue Models Investment in clean energy measures is capital intensive, and financial assistance programs cannot fully fund these investments. Further, regulatory requirements such as shore power, while they cut local emissions, will eventually create a very large increase in demand, and thus, a more expensive energy purchasing proposition. This puts financial constraints on the ports. Therefore, it is critical for ports and their tenants to pursue innovative financing solutions and to implement mechanisms that provide them with new revenue streams. The following presents some examples of such solutions:
1. Team up with clean energy developers and share revenue with their installation partners and aggregators. An example is the 10 MW solar PV installations at the Port of Los Angeles that will be built and operated by Hecate across 12 different site locations.
84
The Port will receive approximately 7 percent of Hecate’s gross annual revenue from the sale of its electricity to LADWP. The Port’s income is projected to total more than $2.8 million over the life of the operating agreement. No costs to the Port are anticipated outside of expedited roofing maintenance.
2. Share ownership and operations through joint projects (e.g., with utilities or port tenants) and split the burden of capital expenditure and O&M costs, and share the realized revenues and other benefits with their partners.
3. Financing through third party entities with a focus on designing innovative and customized financing contracts for clean energy investments. Renewable energy can be developed so that the power generated is sold through a long-term power purchase agreement (PPA), or the equipment is leased to an entity that hosts the system and uses the generated power.
4. Various revenue streams should be exploited as appropriate to make the investments financially attractive and sustainable in the long run. Examples of such revenue streams are: sale of renewable energy (RE) credits or environmental benefits as part of the PPA or through a separate agreement, demand response payments through utility administered programs, participation in energy and ancillary service markets of CAISO, etc.
5.8 Systematic Approach for Clean Energy Measures Assessment To ensure that adoption of clean energy measures at ports’ facilities fulfills its objectives, it is critical for ports to utilize a systematic methodology to assess the potential solutions. The assessment approach has to be able to account for the fact that the benefits of clean energy solutions are closely linked to the way the underlying technologies are operated. This becomes particularly significant for more sophisticated technologies such as battery storage. As such, the assessment methodology should be able to accurately estimate the operation of technologies under the prevailing circumstances. The following summarizes various steps/components of a systematic approach:
1. Identify potential facilities by considering their functional needs.
2. Obtain a baseline for each facility.
3. Assess technical and operational feasibility of selected clean energy solutions for each facility.
4. Identify feasible solutions for further prioritization assessment.
5. Identify and rank evaluation criteria according to preference of the decision maker.
6. Assign scores to feasible solutions for each criterion using an appropriate quantification method (see Chapter 4 for sample quantification).
7. Prioritize feasible solutions with respect to importance of evaluation criteria.

85
In summary, California ports can capitalize on several benefits that clean energy measures can offer ranging from economic to environmental to energy security. At the same time, challenges exist in implementing those measures due to budgetary, operational and space constraints. However, there are activities that ports can take in collaboration with other stakeholders to make the adoption of emerging technologies a success story. Working closely with utilities, port’s tenants, and third party developers to pursue strategic collaborations and to partner up in joint projects, as well as seeking innovative financing mechanisms and revenue models can position ports to economically adopt clean energy projects in their footprint. Further, given the complexity of port’s supply chain, ports’ authorities can become the center piece in convening a wide range of stakeholders and facilitate active interactions. This would promote coordination among different entities which ultimately means more effective and consistent decisions to be made throughout the value chain from regulators/policy makers, to port’s authority, to port’s tenants and business partners, to communities.
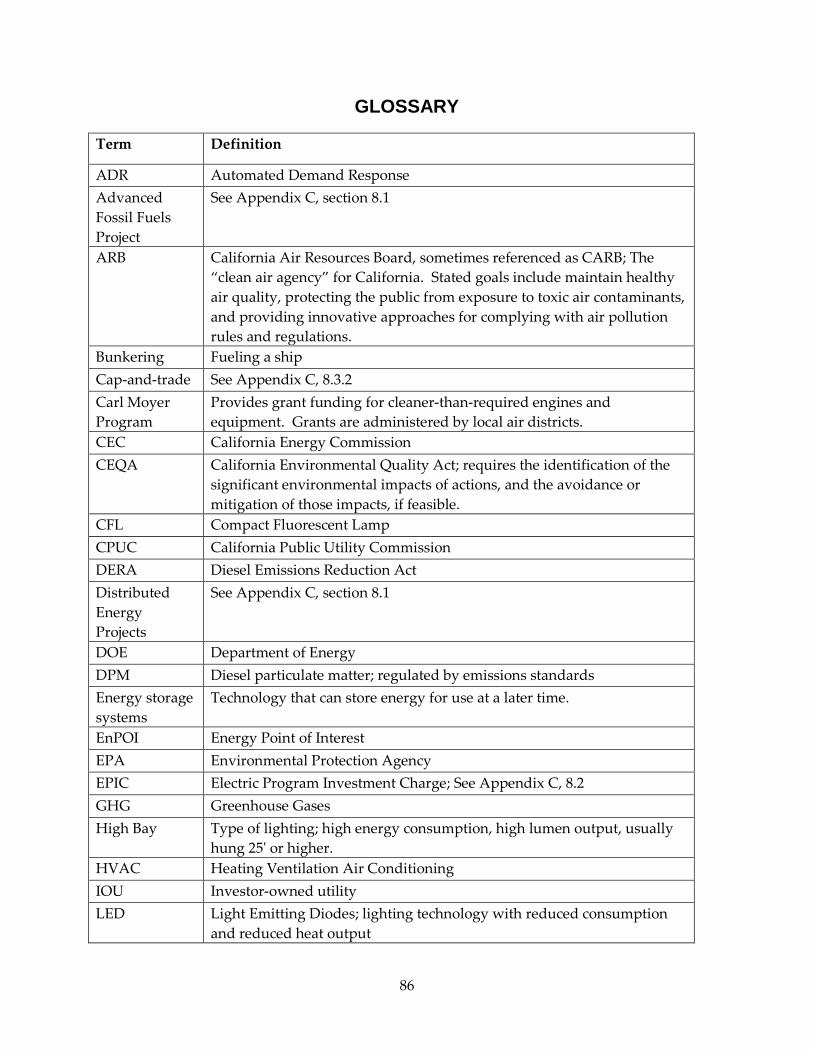
86
GLOSSARY
Term Definition
ADR Automated Demand Response Advanced Fossil Fuels Project
See Appendix C, section 8.1
ARB California Air Resources Board, sometimes referenced as CARB; The “clean air agency” for California. Stated goals include maintain healthy air quality, protecting the public from exposure to toxic air contaminants, and providing innovative approaches for complying with air pollution rules and regulations.
Bunkering Fueling a ship Cap-and-trade See Appendix C, 8.3.2 Carl Moyer Program
Provides grant funding for cleaner-than-required engines and equipment. Grants are administered by local air districts.
CEC California Energy Commission CEQA California Environmental Quality Act; requires the identification of the
significant environmental impacts of actions, and the avoidance or mitigation of those impacts, if feasible.
CFL Compact Fluorescent Lamp CPUC California Public Utility Commission DERA Diesel Emissions Reduction Act Distributed Energy Projects
See Appendix C, section 8.1
DOE Department of Energy DPM Diesel particulate matter; regulated by emissions standards Energy storage systems
Technology that can store energy for use at a later time.
EnPOI Energy Point of Interest EPA Environmental Protection Agency EPIC Electric Program Investment Charge; See Appendix C, 8.2 GHG Greenhouse Gases High Bay Type of lighting; high energy consumption, high lumen output, usually
hung 25' or higher. HVAC Heating Ventilation Air Conditioning IOU Investor-owned utility LED Light Emitting Diodes; lighting technology with reduced consumption
and reduced heat output
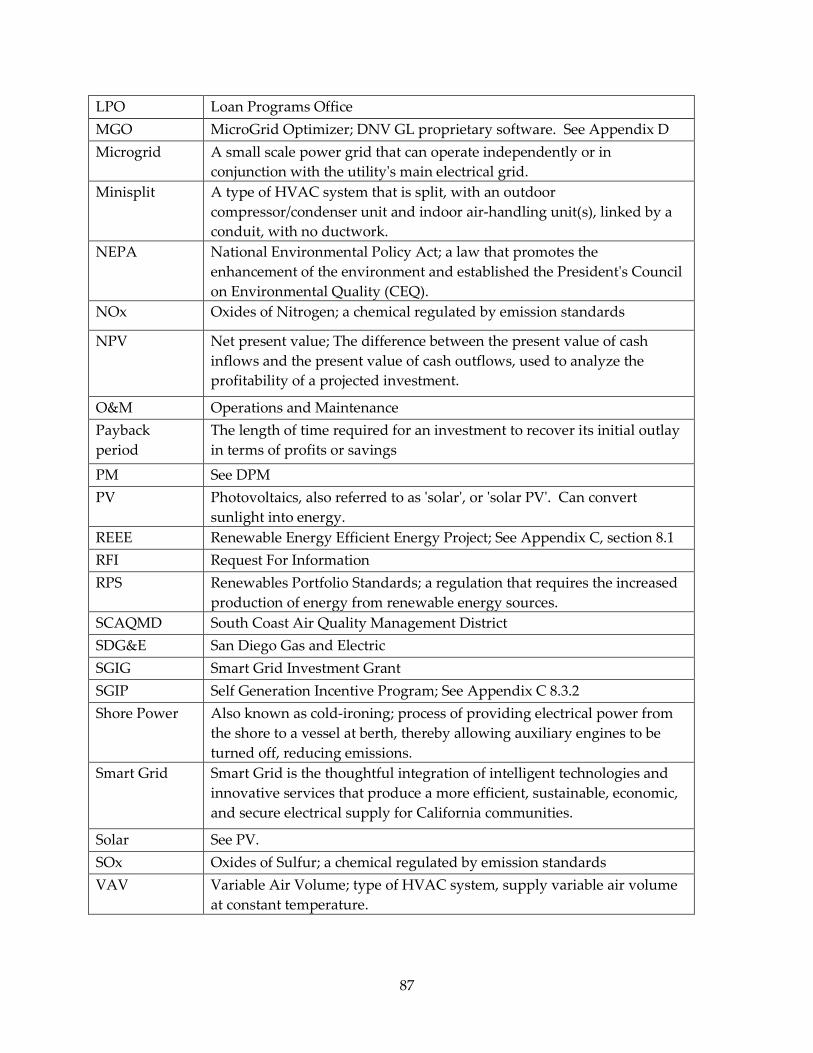
87
LPO Loan Programs Office MGO MicroGrid Optimizer; DNV GL proprietary software. See Appendix D Microgrid A small scale power grid that can operate independently or in
conjunction with the utility's main electrical grid. Minisplit A type of HVAC system that is split, with an outdoor
compressor/condenser unit and indoor air-handling unit(s), linked by a conduit, with no ductwork.
NEPA National Environmental Policy Act; a law that promotes the enhancement of the environment and established the President's Council on Environmental Quality (CEQ).
NOx Oxides of Nitrogen; a chemical regulated by emission standards
NPV Net present value; The difference between the present value of cash inflows and the present value of cash outflows, used to analyze the profitability of a projected investment.
O&M Operations and Maintenance Payback period
The length of time required for an investment to recover its initial outlay in terms of profits or savings
PM See DPM PV Photovoltaics, also referred to as 'solar', or 'solar PV'. Can convert
sunlight into energy. REEE Renewable Energy Efficient Energy Project; See Appendix C, section 8.1 RFI Request For Information RPS Renewables Portfolio Standards; a regulation that requires the increased
production of energy from renewable energy sources. SCAQMD South Coast Air Quality Management District SDG&E San Diego Gas and Electric SGIG Smart Grid Investment Grant SGIP Self Generation Incentive Program; See Appendix C 8.3.2 Shore Power Also known as cold-ironing; process of providing electrical power from
the shore to a vessel at berth, thereby allowing auxiliary engines to be turned off, reducing emissions.
Smart Grid Smart Grid is the thoughtful integration of intelligent technologies and innovative services that produce a more efficient, sustainable, economic, and secure electrical supply for California communities.
Solar See PV. SOx Oxides of Sulfur; a chemical regulated by emission standards VAV Variable Air Volume; type of HVAC system, supply variable air volume
at constant temperature.
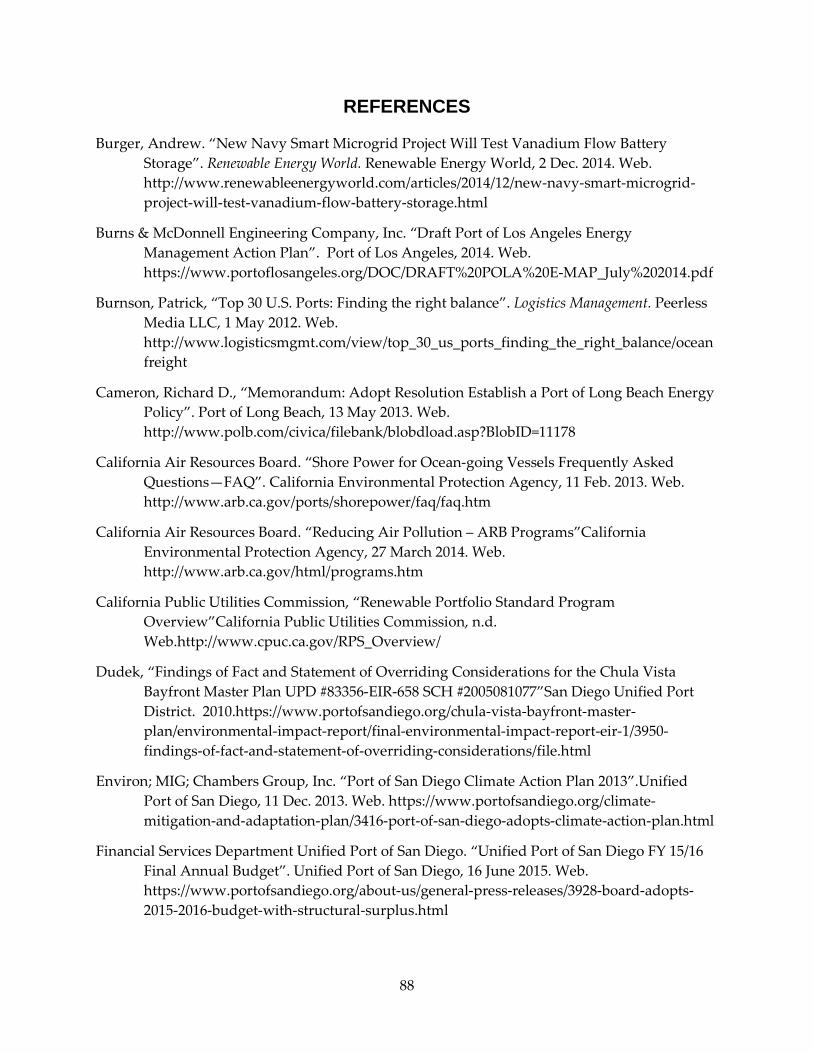
88
REFERENCES
Burger, Andrew. “New Navy Smart Microgrid Project Will Test Vanadium Flow Battery Storage”. Renewable Energy World. Renewable Energy World, 2 Dec. 2014. Web. http://www.renewableenergyworld.com/articles/2014/12/new-navy-smart-microgrid-project-will-test-vanadium-flow-battery-storage.html
Burns & McDonnell Engineering Company, Inc. “Draft Port of Los Angeles Energy Management Action Plan”. Port of Los Angeles, 2014. Web. https://www.portoflosangeles.org/DOC/DRAFT%20POLA%20E-MAP_July%202014.pdf
Burnson, Patrick, “Top 30 U.S. Ports: Finding the right balance”. Logistics Management. Peerless Media LLC, 1 May 2012. Web. http://www.logisticsmgmt.com/view/top_30_us_ports_finding_the_right_balance/oceanfreight
Cameron, Richard D., “Memorandum: Adopt Resolution Establish a Port of Long Beach Energy Policy”. Port of Long Beach, 13 May 2013. Web. http://www.polb.com/civica/filebank/blobdload.asp?BlobID=11178
California Air Resources Board. “Shore Power for Ocean-going Vessels Frequently Asked Questions—FAQ”. California Environmental Protection Agency, 11 Feb. 2013. Web. http://www.arb.ca.gov/ports/shorepower/faq/faq.htm
California Air Resources Board. “Reducing Air Pollution – ARB Programs”California Environmental Protection Agency, 27 March 2014. Web. http://www.arb.ca.gov/html/programs.htm
California Public Utilities Commission, “Renewable Portfolio Standard Program Overview”California Public Utilities Commission, n.d. Web.http://www.cpuc.ca.gov/RPS_Overview/
Dudek, “Findings of Fact and Statement of Overriding Considerations for the Chula Vista Bayfront Master Plan UPD #83356-EIR-658 SCH #2005081077”San Diego Unified Port District. 2010.https://www.portofsandiego.org/chula-vista-bayfront-master-plan/environmental-impact-report/final-environmental-impact-report-eir-1/3950-findings-of-fact-and-statement-of-overriding-considerations/file.html
Environ; MIG; Chambers Group, Inc. “Port of San Diego Climate Action Plan 2013”.Unified Port of San Diego, 11 Dec. 2013. Web. https://www.portofsandiego.org/climate-mitigation-and-adaptation-plan/3416-port-of-san-diego-adopts-climate-action-plan.html
Financial Services Department Unified Port of San Diego. “Unified Port of San Diego FY 15/16 Final Annual Budget”. Unified Port of San Diego, 16 June 2015. Web. https://www.portofsandiego.org/about-us/general-press-releases/3928-board-adopts-2015-2016-budget-with-structural-surplus.html
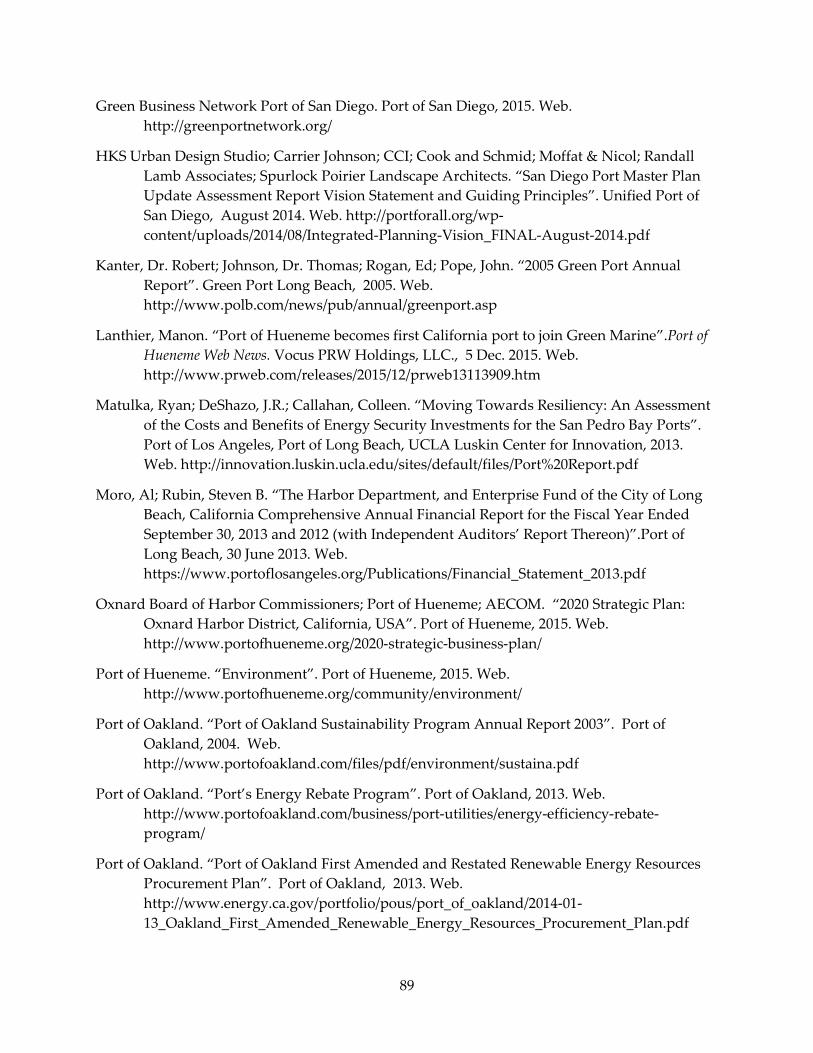
89
Green Business Network Port of San Diego. Port of San Diego, 2015. Web. http://greenportnetwork.org/
HKS Urban Design Studio; Carrier Johnson; CCI; Cook and Schmid; Moffat & Nicol; Randall Lamb Associates; Spurlock Poirier Landscape Architects. “San Diego Port Master Plan Update Assessment Report Vision Statement and Guiding Principles”. Unified Port of San Diego, August 2014. Web. http://portforall.org/wp-content/uploads/2014/08/Integrated-Planning-Vision_FINAL-August-2014.pdf
Kanter, Dr. Robert; Johnson, Dr. Thomas; Rogan, Ed; Pope, John. “2005 Green Port Annual Report”. Green Port Long Beach, 2005. Web. http://www.polb.com/news/pub/annual/greenport.asp
Lanthier, Manon. “Port of Hueneme becomes first California port to join Green Marine”.Port of Hueneme Web News. Vocus PRW Holdings, LLC., 5 Dec. 2015. Web. http://www.prweb.com/releases/2015/12/prweb13113909.htm
Matulka, Ryan; DeShazo, J.R.; Callahan, Colleen. “Moving Towards Resiliency: An Assessment of the Costs and Benefits of Energy Security Investments for the San Pedro Bay Ports”. Port of Los Angeles, Port of Long Beach, UCLA Luskin Center for Innovation, 2013. Web. http://innovation.luskin.ucla.edu/sites/default/files/Port%20Report.pdf
Moro, Al; Rubin, Steven B. “The Harbor Department, and Enterprise Fund of the City of Long Beach, California Comprehensive Annual Financial Report for the Fiscal Year Ended September 30, 2013 and 2012 (with Independent Auditors’ Report Thereon)”.Port of Long Beach, 30 June 2013. Web. https://www.portoflosangeles.org/Publications/Financial_Statement_2013.pdf
Oxnard Board of Harbor Commissioners; Port of Hueneme; AECOM. “2020 Strategic Plan: Oxnard Harbor District, California, USA”. Port of Hueneme, 2015. Web. http://www.portofhueneme.org/2020-strategic-business-plan/
Port of Hueneme. “Environment”. Port of Hueneme, 2015. Web. http://www.portofhueneme.org/community/environment/
Port of Oakland. “Port of Oakland Sustainability Program Annual Report 2003”. Port of Oakland, 2004. Web. http://www.portofoakland.com/files/pdf/environment/sustaina.pdf
Port of Oakland. “Port’s Energy Rebate Program”. Port of Oakland, 2013. Web. http://www.portofoakland.com/business/port-utilities/energy-efficiency-rebate-program/
Port of Oakland. “Port of Oakland First Amended and Restated Renewable Energy Resources Procurement Plan”. Port of Oakland, 2013. Web. http://www.energy.ca.gov/portfolio/pous/port_of_oakland/2014-01-13_Oakland_First_Amended_Renewable_Energy_Resources_Procurement_Plan.pdf
90
Port of Long Beach. “Port of Long Beach Clean Trucks Program”. Port of Long Beach, 2009. Web. http://www.polb.com/environment/cleantrucks/
Port of Long Beach; Southern California Edison; PMSA Ship; Matson. “Shore Power Summit”.Long Beach Board of Harbor Commissioners, 6 May 2013. Web. http://www.polb.com/civica/filebank/blobdload.asp?BlobID=11149
Port of Long Beach. “City of Long Beach Harbor Department, Adopted Budget for Fiscal Year 2014”. Port of Long Beach, 2014. Web. http://www.polb.com/civica/filebank/blobdload.asp?BlobID=11770
Port of Long Beach. “Energy Island: The Port’s Power Plan”.
Port of Long Beach, 25 June 2015. Web. http://www.polb.com/news/displaynews.asp?NewsID=1464
Port of Long Beach. “Program Overview Port of Long Beach Energy Island Initiative”
Port of Long Beach. 2015, Web. http://www.polb.com/civica/filebank/blobdload.asp?BlobID=13097
Port of Los Angeles, Port of Long Beach. “Roadmap for Moving Forward with Zero Emission Technologies at the Ports of Long Beach and Los Angeles”.
Port of Long Beach, 22 August 2011. Web. http://www.cleanairactionplan.org/documents/zero-emissions-roadmap-technical-report.pdf
Port of Los Angeles, Port of Long Beach. “San Pedro Bay Ports Clean Air Action Plan, 2010 Update”. Port of Los Angeles, Port of Long Beach, 21 Sept. 2010. Web. http://www.cleanairactionplan.org/documents/2010-clean-air-action-plan-update-fact-sheet.pdf
Port of Los Angeles; Clean Agency, Inc. “Port of Los Angeles Sustainability Report, July 2011-June 2013”. Port of Los Angeles, 2013. Web. https://www.portoflosangeles.org/Publications/Sustainability_Report_2013.pdf
San Diego Unified Port District. “BPC Policy No. 735, Environmental Mitigation Property”. San Diego Unified Port District, 28 Aug, 2008. Web. https://www.portofsandiego.org/bpc-policies/1417-bpc-policy-no-735-environmental-mitigation-property/file.html
San Diego Unified Port District. “BPC Policy No. 736, Green Port Policy”. San Diego Unified Port District, 26 Sept. 2008. Web. https://www.portofsandiego.org/bpc-policies/1418-bpc-policy-no-736-green-port-policy/file.html
San Diego Unified Port District. “San Diego Unified Port District Act, Doc No. 54186”. San Diego Unified Port District, 20 Nov. 2008. Web. https://www.portofsandiego.org/commercial-fisheries/documents/about-port-of-san-diego-documents/721-port-act/file.html
91
San Diego Unified Port District. “San Diego Unified Port District Code, Published Pursuant to Ordinance 19”. Diego Unified Port District, 2014. Web. https://www.portofsandiego.org/document/about-port-of-san-diego-documents/6023-sdupd-port-code/file.html
San Diego Unified Port District. “BPC Policy No. 750, Guidelines for Implementing Greenhouse Gas (GHG) Reduction Measures”. San Diego Unified Port District, 10 Jan. 2014. Web. https://www.portofsandiego.org/bpc-policies/5598-bpc-policy-no-750-guidelines-for-implementing-greenhouse-gas-ghg-reduction-measures/file.html
San Diego Unified Port District. “BPC Policy No. 120, Capital Improvement Program (CIP)”.San Diego Unified Port District, 10 Nov. 2015. Web. https://www.portofsandiego.org/bpc-policies/1431-bpc-policy-no-120-capital-improvement-program-cip/file.html
Sanfield, Phillip. “Port of Los Angeles Advances Clean-Energy Solar Power Projects”.Port of Los Angeles, 15 Oct. 2015. Web. https://www.portoflosangeles.org/newsroom/2015_releases/news_101515_solar_power_projects.asp
Starcrest Consulting Group, LLC. “The Port of Los Angeles 2010 Expanded Greenhouse Gas Inventory”. Port of Los Angeles, 1 Dec. 2011. Web. https://www.portoflosangeles.org/DOC/REPORT_GHG_Inventory_2010.pdf
Starcrest Consulting Group, LLC. “Port of Long Beach Air Emissions Inventory – 2013”.Port of Long Beach, July 2013. Web.http://www.polb.com/civica/filebank/blobdload.asp?BlobID=12240
Strategic Plan Task Force, et al. “Port of Oakland Strategic Plan Fiscal Years 2011 – 2015”.Port of Oakland, 5 Oct. 2010. Web. http://www.portofoakland.com/wp-content/uploads/2016/03/strategicPlan2011-2015.pdf
Unified Port of San Diego, “Compass Strategic Plan 2012 – 2017. Port Master Plan.Unified Port of San Diego, July 2015. Web. https://www.portofsandiego.org/document/environment/land-use-planning/4729-port-master-plan-1/file.html.
Unified Port of San Diego, “Unified Port of San Diego Port Master Plan”Unified Port of San Diego, July 2015. Web. https://www.portofsandiego.org/environment/land-use/port-master-plan.html
WSP Built Ecology, “Port of Oakland AB 2514 Energy Storage Assessment”California Energy Commission, March 2014. Web. http://www.energy.ca.gov/assessments/ab2514_reports/Port_of_Oakland/2014_Port_of_Oakland_report.pdf
Zampa, Mike; Marilyn Sandifur. “Port of Oakland reaffirms long-term renewable energy strategy”. Port of Oakland . Port of Oakland, 28 Oct. 2015. Web. http://www.portofoakland.com/press-releases/press-release-465/
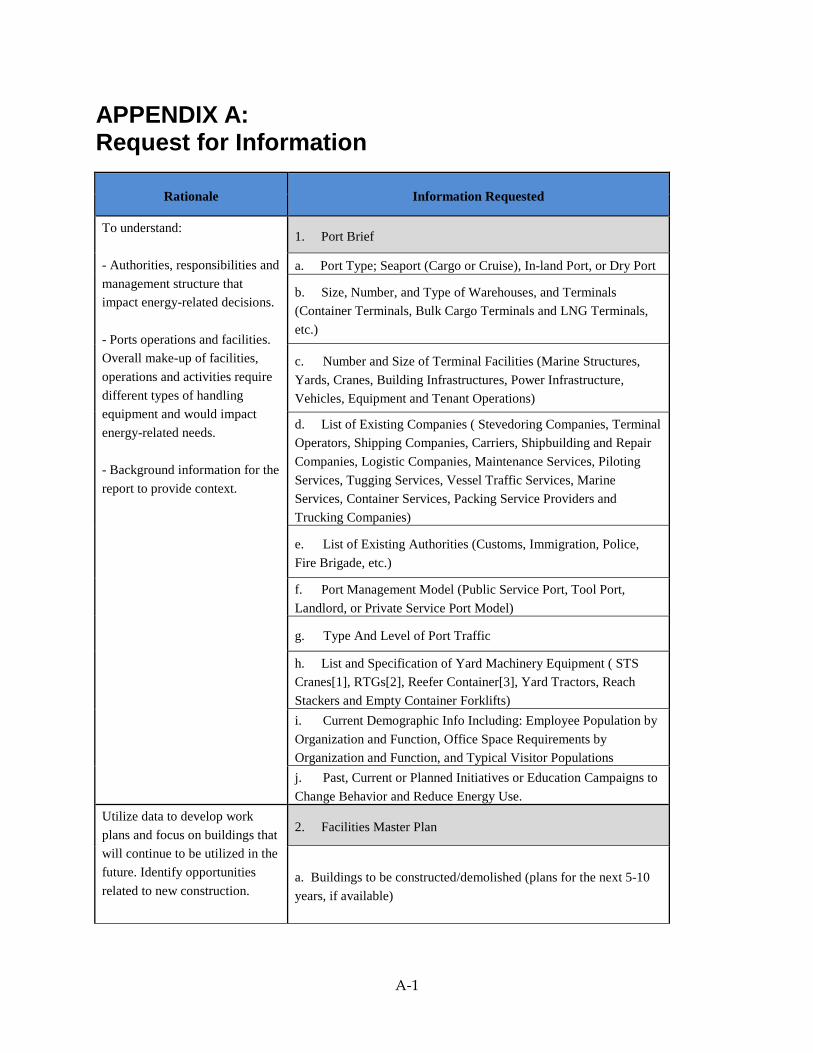
A-1
APPENDIX A: Request for Information
Rationale Information Requested
To understand: - Authorities, responsibilities and management structure that impact energy-related decisions. - Ports operations and facilities. Overall make-up of facilities, operations and activities require different types of handling equipment and would impact energy-related needs. - Background information for the report to provide context.
1. Port Brief
a. Port Type; Seaport (Cargo or Cruise), In-land Port, or Dry Port
b. Size, Number, and Type of Warehouses, and Terminals (Container Terminals, Bulk Cargo Terminals and LNG Terminals, etc.)
c. Number and Size of Terminal Facilities (Marine Structures, Yards, Cranes, Building Infrastructures, Power Infrastructure, Vehicles, Equipment and Tenant Operations)
d. List of Existing Companies ( Stevedoring Companies, Terminal Operators, Shipping Companies, Carriers, Shipbuilding and Repair Companies, Logistic Companies, Maintenance Services, Piloting Services, Tugging Services, Vessel Traffic Services, Marine Services, Container Services, Packing Service Providers and Trucking Companies)
e. List of Existing Authorities (Customs, Immigration, Police, Fire Brigade, etc.)
f. Port Management Model (Public Service Port, Tool Port, Landlord, or Private Service Port Model)
g. Type And Level of Port Traffic
h. List and Specification of Yard Machinery Equipment ( STS Cranes[1], RTGs[2], Reefer Container[3], Yard Tractors, Reach Stackers and Empty Container Forklifts) i. Current Demographic Info Including: Employee Population by Organization and Function, Office Space Requirements by Organization and Function, and Typical Visitor Populations j. Past, Current or Planned Initiatives or Education Campaigns to Change Behavior and Reduce Energy Use.
Utilize data to develop work plans and focus on buildings that will continue to be utilized in the future. Identify opportunities related to new construction.
2. Facilities Master Plan
a. Buildings to be constructed/demolished (plans for the next 5-10 years, if available)
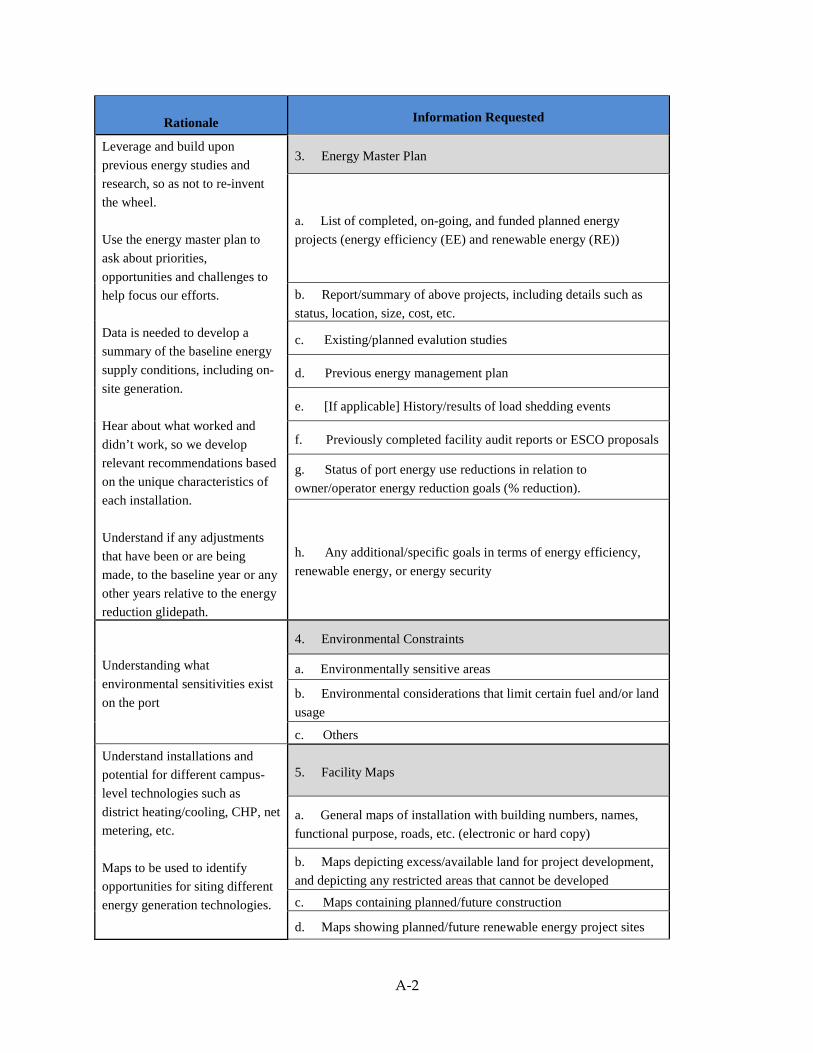
A-2
Rationale Information Requested
Leverage and build upon previous energy studies and research, so as not to re-invent the wheel. Use the energy master plan to ask about priorities, opportunities and challenges to help focus our efforts. Data is needed to develop a summary of the baseline energy supply conditions, including on-site generation. Hear about what worked and didn’t work, so we develop relevant recommendations based on the unique characteristics of each installation. Understand if any adjustments that have been or are being made, to the baseline year or any other years relative to the energy reduction glidepath.
3. Energy Master Plan
a. List of completed, on-going, and funded planned energy projects (energy efficiency (EE) and renewable energy (RE))
b. Report/summary of above projects, including details such as status, location, size, cost, etc.
c. Existing/planned evalution studies
d. Previous energy management plan
e. [If applicable] History/results of load shedding events
f. Previously completed facility audit reports or ESCO proposals
g. Status of port energy use reductions in relation to owner/operator energy reduction goals (% reduction).
h. Any additional/specific goals in terms of energy efficiency, renewable energy, or energy security
Understanding what environmental sensitivities exist on the port
4. Environmental Constraints
a. Environmentally sensitive areas
b. Environmental considerations that limit certain fuel and/or land usage
c. Others Understand installations and potential for different campus-level technologies such as district heating/cooling, CHP, net metering, etc. Maps to be used to identify opportunities for siting different energy generation technologies.
5. Facility Maps
a. General maps of installation with building numbers, names, functional purpose, roads, etc. (electronic or hard copy)
b. Maps depicting excess/available land for project development, and depicting any restricted areas that cannot be developed
c. Maps containing planned/future construction
d. Maps showing planned/future renewable energy project sites
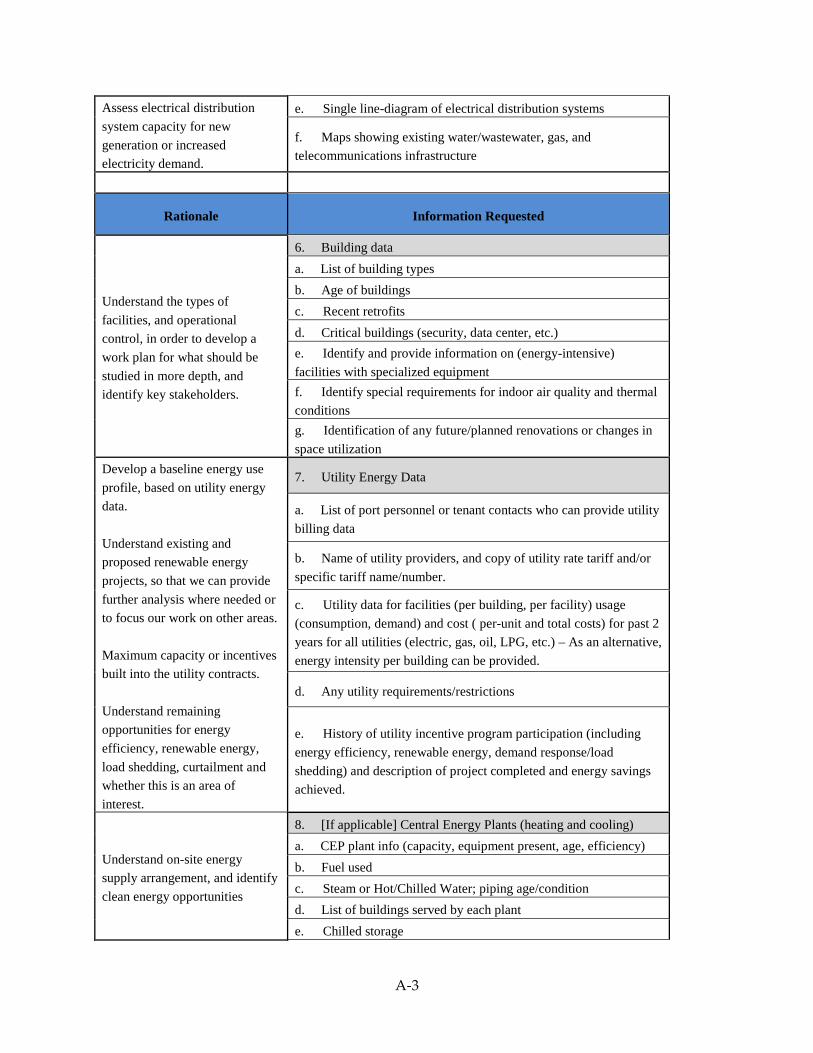
A-3
Assess electrical distribution system capacity for new generation or increased electricity demand.
e. Single line-diagram of electrical distribution systems
f. Maps showing existing water/wastewater, gas, and telecommunications infrastructure
Rationale Information Requested
Understand the types of facilities, and operational control, in order to develop a work plan for what should be studied in more depth, and identify key stakeholders.
6. Building data a. List of building types b. Age of buildings c. Recent retrofits d. Critical buildings (security, data center, etc.) e. Identify and provide information on (energy-intensive) facilities with specialized equipment f. Identify special requirements for indoor air quality and thermal conditions g. Identification of any future/planned renovations or changes in space utilization
Develop a baseline energy use profile, based on utility energy data. Understand existing and proposed renewable energy projects, so that we can provide further analysis where needed or to focus our work on other areas. Maximum capacity or incentives built into the utility contracts. Understand remaining opportunities for energy efficiency, renewable energy, load shedding, curtailment and whether this is an area of interest.
7. Utility Energy Data
a. List of port personnel or tenant contacts who can provide utility billing data
b. Name of utility providers, and copy of utility rate tariff and/or specific tariff name/number.
c. Utility data for facilities (per building, per facility) usage (consumption, demand) and cost ( per-unit and total costs) for past 2 years for all utilities (electric, gas, oil, LPG, etc.) – As an alternative, energy intensity per building can be provided.
d. Any utility requirements/restrictions
e. History of utility incentive program participation (including energy efficiency, renewable energy, demand response/load shedding) and description of project completed and energy savings achieved.
Understand on-site energy supply arrangement, and identify clean energy opportunities
8. [If applicable] Central Energy Plants (heating and cooling) a. CEP plant info (capacity, equipment present, age, efficiency) b. Fuel used c. Steam or Hot/Chilled Water; piping age/condition d. List of buildings served by each plant e. Chilled storage
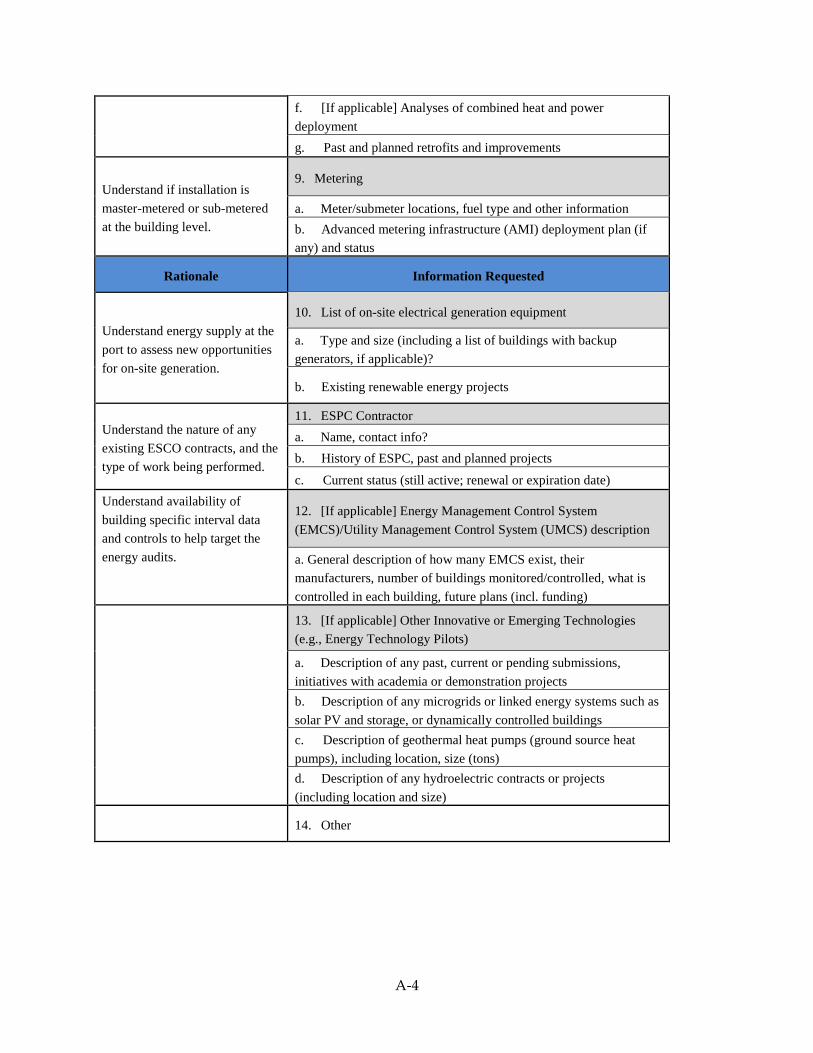
A-4
f. [If applicable] Analyses of combined heat and power deployment g. Past and planned retrofits and improvements
Understand if installation is master-metered or sub-metered at the building level.
9. Metering
a. Meter/submeter locations, fuel type and other information b. Advanced metering infrastructure (AMI) deployment plan (if any) and status
Rationale Information Requested
Understand energy supply at the port to assess new opportunities for on-site generation.
10. List of on-site electrical generation equipment
a. Type and size (including a list of buildings with backup generators, if applicable)?
b. Existing renewable energy projects
Understand the nature of any existing ESCO contracts, and the type of work being performed.
11. ESPC Contractor a. Name, contact info? b. History of ESPC, past and planned projects
c. Current status (still active; renewal or expiration date) Understand availability of building specific interval data and controls to help target the energy audits.
12. [If applicable] Energy Management Control System (EMCS)/Utility Management Control System (UMCS) description
a. General description of how many EMCS exist, their manufacturers, number of buildings monitored/controlled, what is controlled in each building, future plans (incl. funding)
13. [If applicable] Other Innovative or Emerging Technologies (e.g., Energy Technology Pilots)
a. Description of any past, current or pending submissions, initiatives with academia or demonstration projects b. Description of any microgrids or linked energy systems such as solar PV and storage, or dynamically controlled buildings c. Description of geothermal heat pumps (ground source heat pumps), including location, size (tons) d. Description of any hydroelectric contracts or projects (including location and size)
14. Other
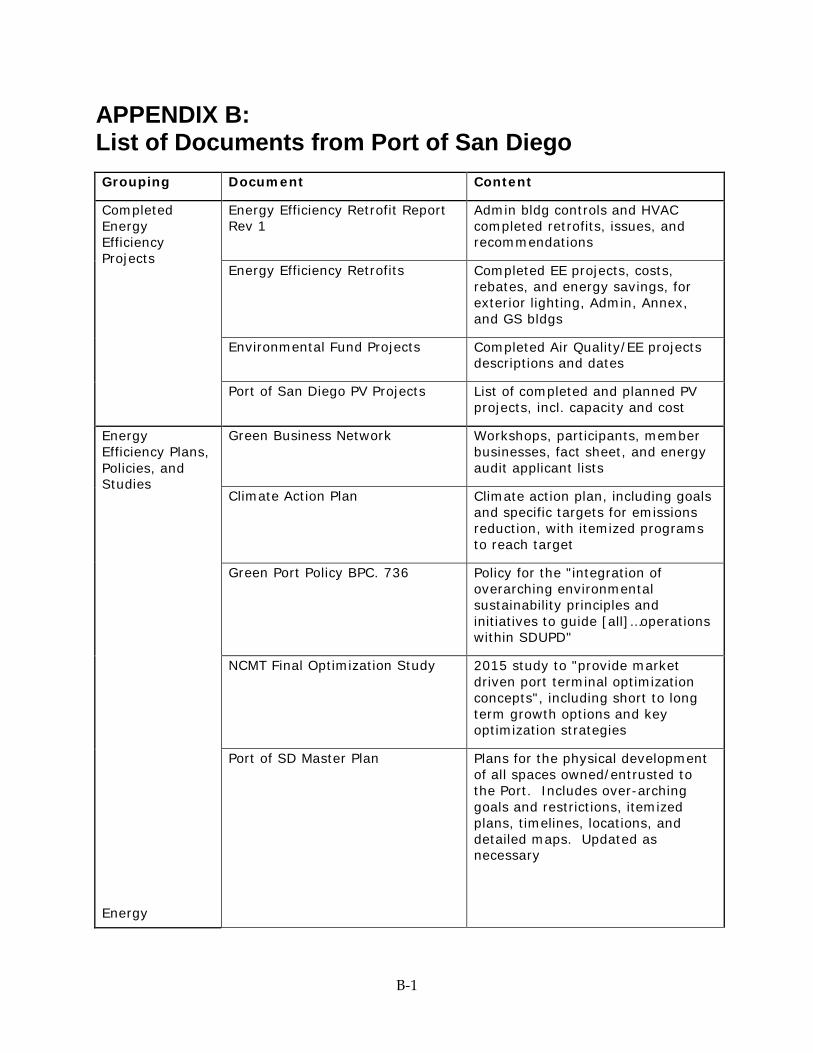
B-1
APPENDIX B: List of Documents from Port of San Diego Grouping Document Content
Completed Energy Efficiency Projects
Energy Efficiency Retrofit Report Rev 1
Admin bldg controls and HVAC completed retrofits, issues, and recommendations
Energy Efficiency Retrofits Completed EE projects, costs, rebates, and energy savings, for exterior lighting, Admin, Annex, and GS bldgs
Environmental Fund Projects Completed Air Quality/EE projects descriptions and dates
Port of San Diego PV Projects List of completed and planned PV projects, incl. capacity and cost
Energy Efficiency Plans, Policies, and Studies
Energy
Green Business Network Workshops, participants, member businesses, fact sheet, and energy audit applicant lists
Climate Action Plan Climate action plan, including goals and specific targets for emissions reduction, with itemized programs to reach target
Green Port Policy BPC. 736 Policy for the "integration of overarching environmental sustainability principles and initiatives to guide [all]…operations within SDUPD"
NCMT Final Optimization Study 2015 study to "provide market driven port terminal optimization concepts", including short to long term growth options and key optimization strategies
Port of SD Master Plan Plans for the physical development of all spaces owned/entrusted to the Port. Includes over-arching goals and restrictions, itemized plans, timelines, locations, and detailed maps. Updated as necessary
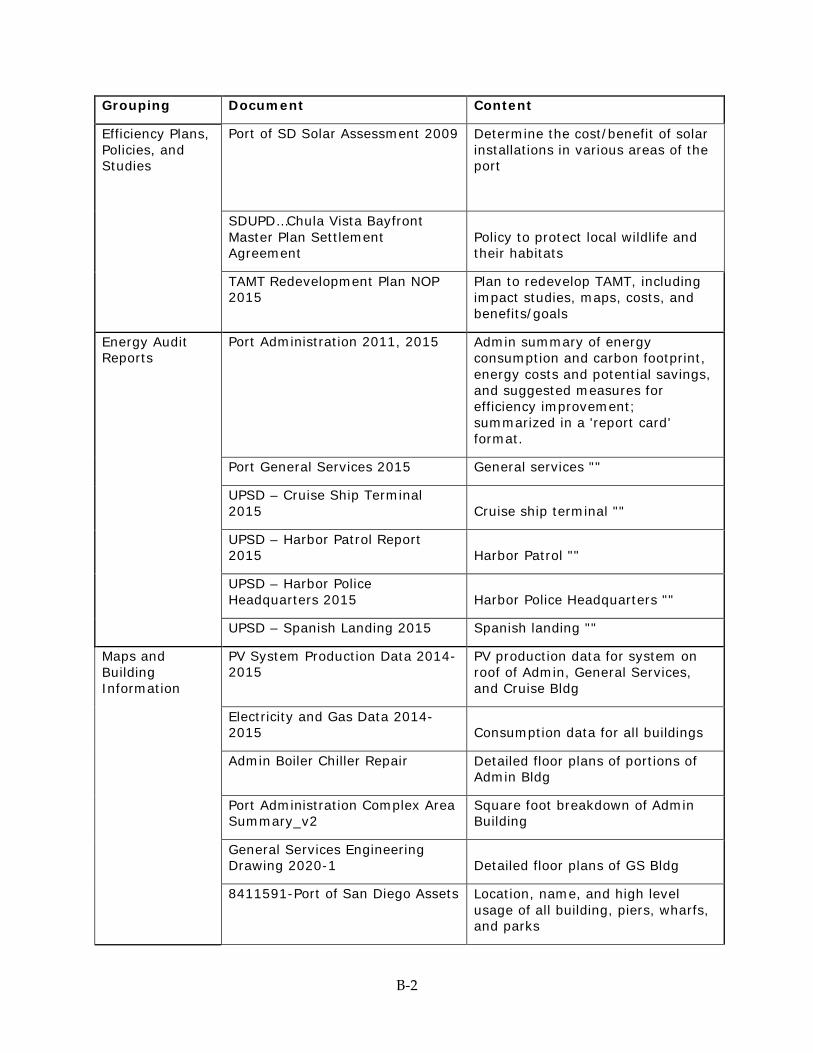
B-2
Grouping Document Content
Efficiency Plans, Policies, and Studies
Port of SD Solar Assessment 2009 Determine the cost/benefit of solar installations in various areas of the port
SDUPD…Chula Vista Bayfront Master Plan Settlement Agreement
Policy to protect local wildlife and their habitats
TAMT Redevelopment Plan NOP 2015
Plan to redevelop TAMT, including impact studies, maps, costs, and benefits/goals
Energy Audit Reports
Port Administration 2011, 2015 Admin summary of energy consumption and carbon footprint, energy costs and potential savings, and suggested measures for efficiency improvement; summarized in a 'report card' format.
Port General Services 2015 General services ""
UPSD – Cruise Ship Terminal 2015 Cruise ship terminal ""
UPSD – Harbor Patrol Report 2015 Harbor Patrol ""
UPSD – Harbor Police Headquarters 2015 Harbor Police Headquarters ""
UPSD – Spanish Landing 2015 Spanish landing ""
Maps and Building Information
PV System Production Data 2014-2015
PV production data for system on roof of Admin, General Services, and Cruise Bldg
Electricity and Gas Data 2014-2015 Consumption data for all buildings
Admin Boiler Chiller Repair Detailed floor plans of portions of Admin Bldg
Port Administration Complex Area Summary_v2
Square foot breakdown of Admin Building
General Services Engineering Drawing 2020-1 Detailed floor plans of GS Bldg
8411591-Port of San Diego Assets Location, name, and high level usage of all building, piers, wharfs, and parks
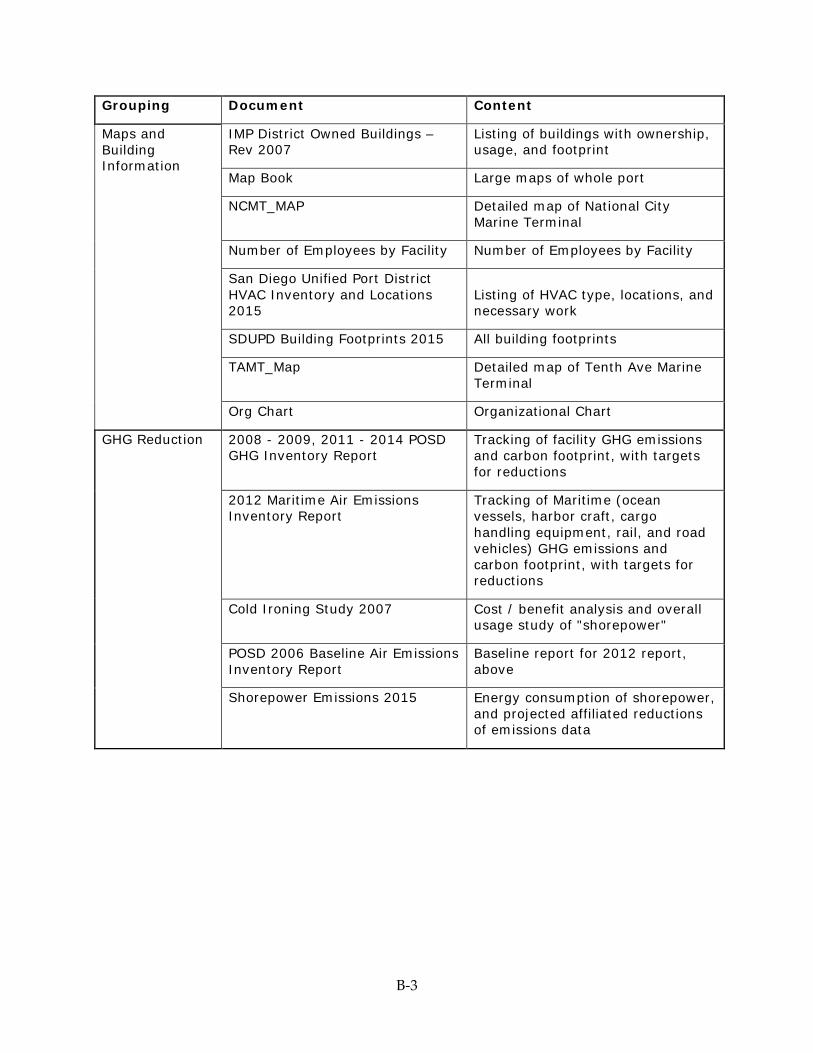
B-3
Grouping Document Content
Maps and Building Information
IMP District Owned Buildings – Rev 2007
Listing of buildings with ownership, usage, and footprint
Map Book Large maps of whole port
NCMT_MAP Detailed map of National City Marine Terminal
Number of Employees by Facility Number of Employees by Facility
San Diego Unified Port District HVAC Inventory and Locations 2015
Listing of HVAC type, locations, and necessary work
SDUPD Building Footprints 2015 All building footprints
TAMT_Map Detailed map of Tenth Ave Marine Terminal
Org Chart Organizational Chart
GHG Reduction 2008 - 2009, 2011 - 2014 POSD GHG Inventory Report
Tracking of facility GHG emissions and carbon footprint, with targets for reductions
2012 Maritime Air Emissions Inventory Report
Tracking of Maritime (ocean vessels, harbor craft, cargo handling equipment, rail, and road vehicles) GHG emissions and carbon footprint, with targets for reductions
Cold Ironing Study 2007 Cost / benefit analysis and overall usage study of "shorepower"
POSD 2006 Baseline Air Emissions Inventory Report
Baseline report for 2012 report, above
Shorepower Emissions 2015 Energy consumption of shorepower, and projected affiliated reductions of emissions data
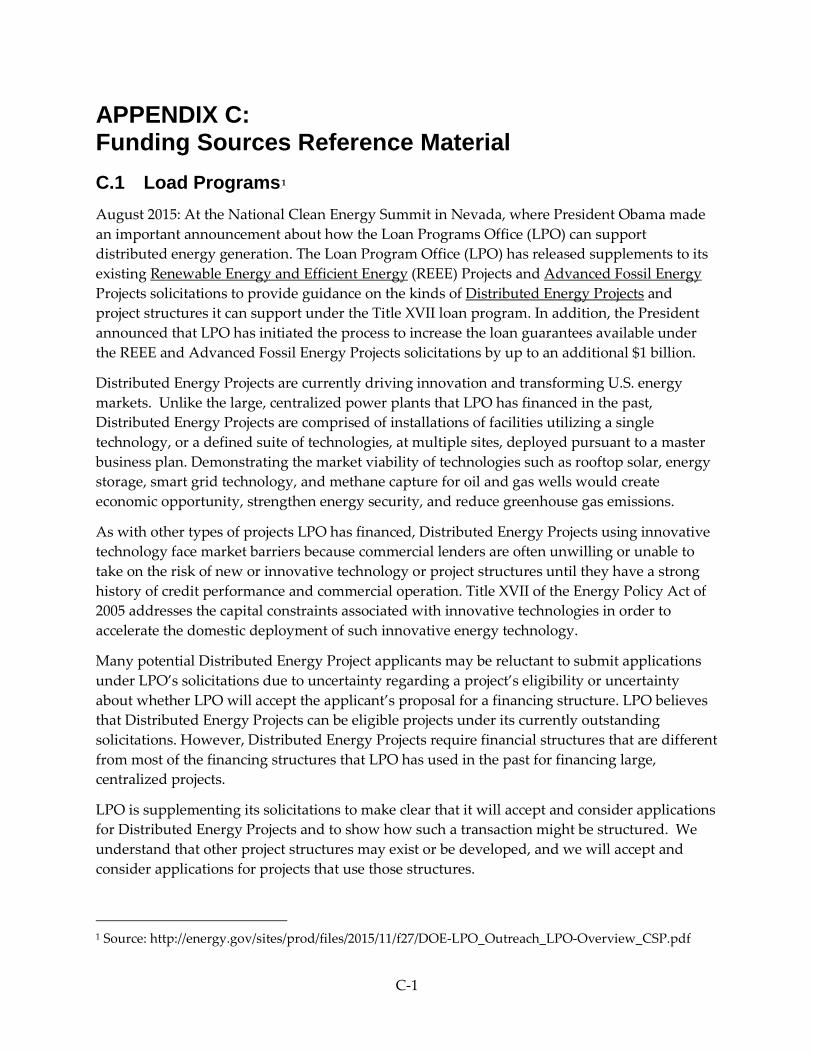
C-1
APPENDIX C: Funding Sources Reference Material C.1 Load Programs0F
1 August 2015: At the National Clean Energy Summit in Nevada, where President Obama made an important announcement about how the Loan Programs Office (LPO) can support distributed energy generation. The Loan Program Office (LPO) has released supplements to its existing Renewable Energy and Efficient Energy (REEE) Projects and Advanced Fossil Energy Projects solicitations to provide guidance on the kinds of Distributed Energy Projects and project structures it can support under the Title XVII loan program. In addition, the President announced that LPO has initiated the process to increase the loan guarantees available under the REEE and Advanced Fossil Energy Projects solicitations by up to an additional $1 billion.
Distributed Energy Projects are currently driving innovation and transforming U.S. energy markets. Unlike the large, centralized power plants that LPO has financed in the past, Distributed Energy Projects are comprised of installations of facilities utilizing a single technology, or a defined suite of technologies, at multiple sites, deployed pursuant to a master business plan. Demonstrating the market viability of technologies such as rooftop solar, energy storage, smart grid technology, and methane capture for oil and gas wells would create economic opportunity, strengthen energy security, and reduce greenhouse gas emissions.
As with other types of projects LPO has financed, Distributed Energy Projects using innovative technology face market barriers because commercial lenders are often unwilling or unable to take on the risk of new or innovative technology or project structures until they have a strong history of credit performance and commercial operation. Title XVII of the Energy Policy Act of 2005 addresses the capital constraints associated with innovative technologies in order to accelerate the domestic deployment of such innovative energy technology.
Many potential Distributed Energy Project applicants may be reluctant to submit applications under LPO’s solicitations due to uncertainty regarding a project’s eligibility or uncertainty about whether LPO will accept the applicant’s proposal for a financing structure. LPO believes that Distributed Energy Projects can be eligible projects under its currently outstanding solicitations. However, Distributed Energy Projects require financial structures that are different from most of the financing structures that LPO has used in the past for financing large, centralized projects.
LPO is supplementing its solicitations to make clear that it will accept and consider applications for Distributed Energy Projects and to show how such a transaction might be structured. We understand that other project structures may exist or be developed, and we will accept and consider applications for projects that use those structures.
1 Source: http://energy.gov/sites/prod/files/2015/11/f27/DOE-LPO_Outreach_LPO-Overview_CSP.pdf
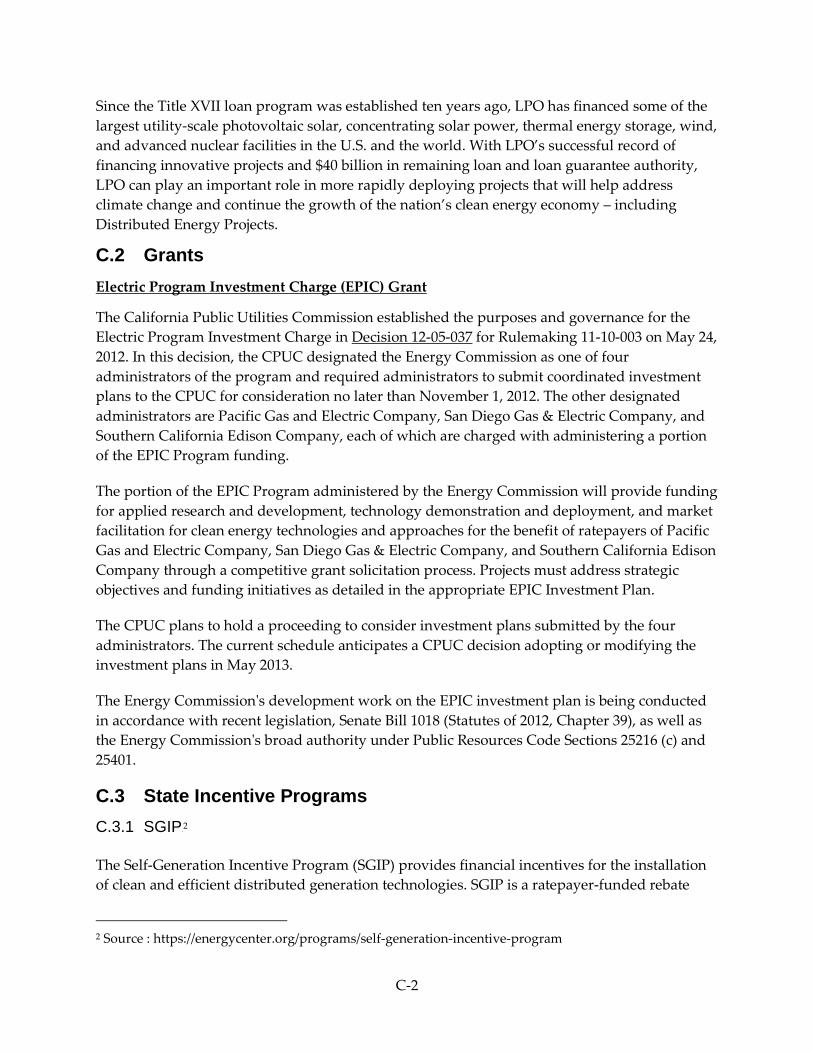
C-2
Since the Title XVII loan program was established ten years ago, LPO has financed some of the largest utility-scale photovoltaic solar, concentrating solar power, thermal energy storage, wind, and advanced nuclear facilities in the U.S. and the world. With LPO’s successful record of financing innovative projects and $40 billion in remaining loan and loan guarantee authority, LPO can play an important role in more rapidly deploying projects that will help address climate change and continue the growth of the nation’s clean energy economy – including Distributed Energy Projects.
C.2 Grants Electric Program Investment Charge (EPIC) Grant
The California Public Utilities Commission established the purposes and governance for the Electric Program Investment Charge in Decision 12-05-037 for Rulemaking 11-10-003 on May 24, 2012. In this decision, the CPUC designated the Energy Commission as one of four administrators of the program and required administrators to submit coordinated investment plans to the CPUC for consideration no later than November 1, 2012. The other designated administrators are Pacific Gas and Electric Company, San Diego Gas & Electric Company, and Southern California Edison Company, each of which are charged with administering a portion of the EPIC Program funding.
The portion of the EPIC Program administered by the Energy Commission will provide funding for applied research and development, technology demonstration and deployment, and market facilitation for clean energy technologies and approaches for the benefit of ratepayers of Pacific Gas and Electric Company, San Diego Gas & Electric Company, and Southern California Edison Company through a competitive grant solicitation process. Projects must address strategic objectives and funding initiatives as detailed in the appropriate EPIC Investment Plan.
The CPUC plans to hold a proceeding to consider investment plans submitted by the four administrators. The current schedule anticipates a CPUC decision adopting or modifying the investment plans in May 2013.
The Energy Commission's development work on the EPIC investment plan is being conducted in accordance with recent legislation, Senate Bill 1018 (Statutes of 2012, Chapter 39), as well as the Energy Commission's broad authority under Public Resources Code Sections 25216 (c) and 25401.
C.3 State Incentive Programs C.3.1 SGIP1F
2
The Self-Generation Incentive Program (SGIP) provides financial incentives for the installation of clean and efficient distributed generation technologies. SGIP is a ratepayer-funded rebate
2 Source : https://energycenter.org/programs/self-generation-incentive-program
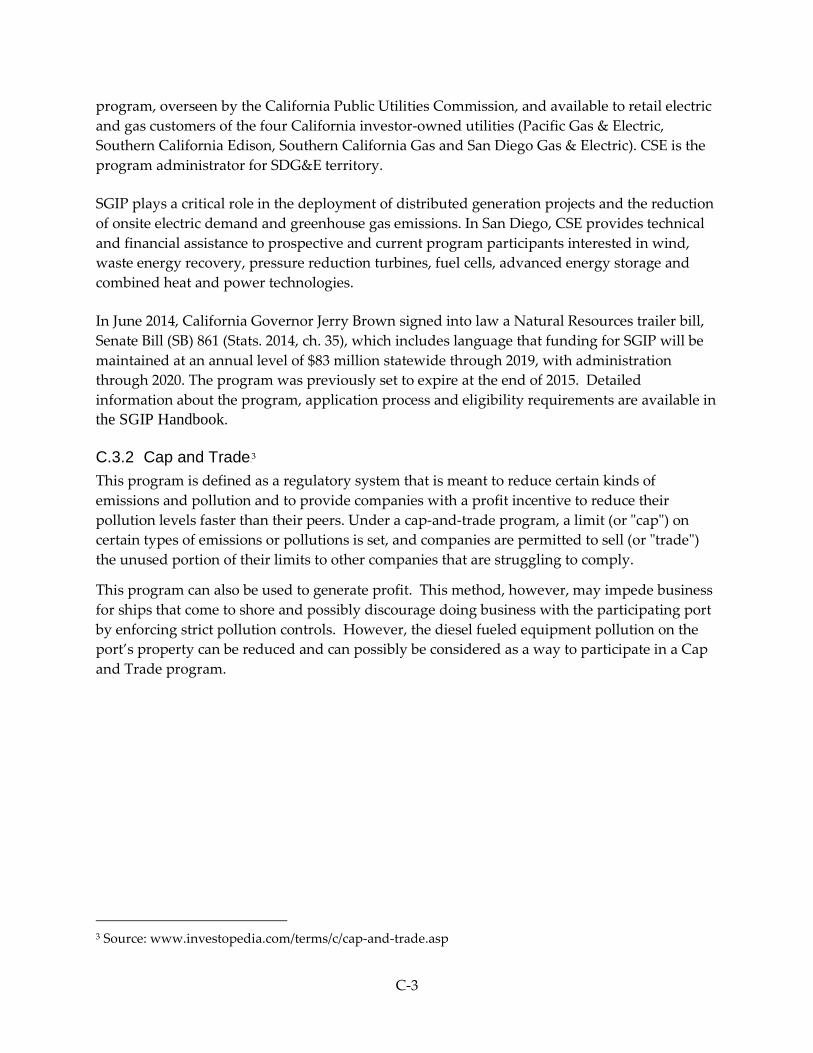
C-3
program, overseen by the California Public Utilities Commission, and available to retail electric and gas customers of the four California investor-owned utilities (Pacific Gas & Electric, Southern California Edison, Southern California Gas and San Diego Gas & Electric). CSE is the program administrator for SDG&E territory.
SGIP plays a critical role in the deployment of distributed generation projects and the reduction of onsite electric demand and greenhouse gas emissions. In San Diego, CSE provides technical and financial assistance to prospective and current program participants interested in wind, waste energy recovery, pressure reduction turbines, fuel cells, advanced energy storage and combined heat and power technologies.
In June 2014, California Governor Jerry Brown signed into law a Natural Resources trailer bill, Senate Bill (SB) 861 (Stats. 2014, ch. 35), which includes language that funding for SGIP will be maintained at an annual level of $83 million statewide through 2019, with administration through 2020. The program was previously set to expire at the end of 2015. Detailed information about the program, application process and eligibility requirements are available in the SGIP Handbook.
C.3.2 Cap and Trade2F
3 This program is defined as a regulatory system that is meant to reduce certain kinds of emissions and pollution and to provide companies with a profit incentive to reduce their pollution levels faster than their peers. Under a cap-and-trade program, a limit (or "cap") on certain types of emissions or pollutions is set, and companies are permitted to sell (or "trade") the unused portion of their limits to other companies that are struggling to comply.
This program can also be used to generate profit. This method, however, may impede business for ships that come to shore and possibly discourage doing business with the participating port by enforcing strict pollution controls. However, the diesel fueled equipment pollution on the port’s property can be reduced and can possibly be considered as a way to participate in a Cap and Trade program.
3 Source: www.investopedia.com/terms/c/cap-and-trade.asp
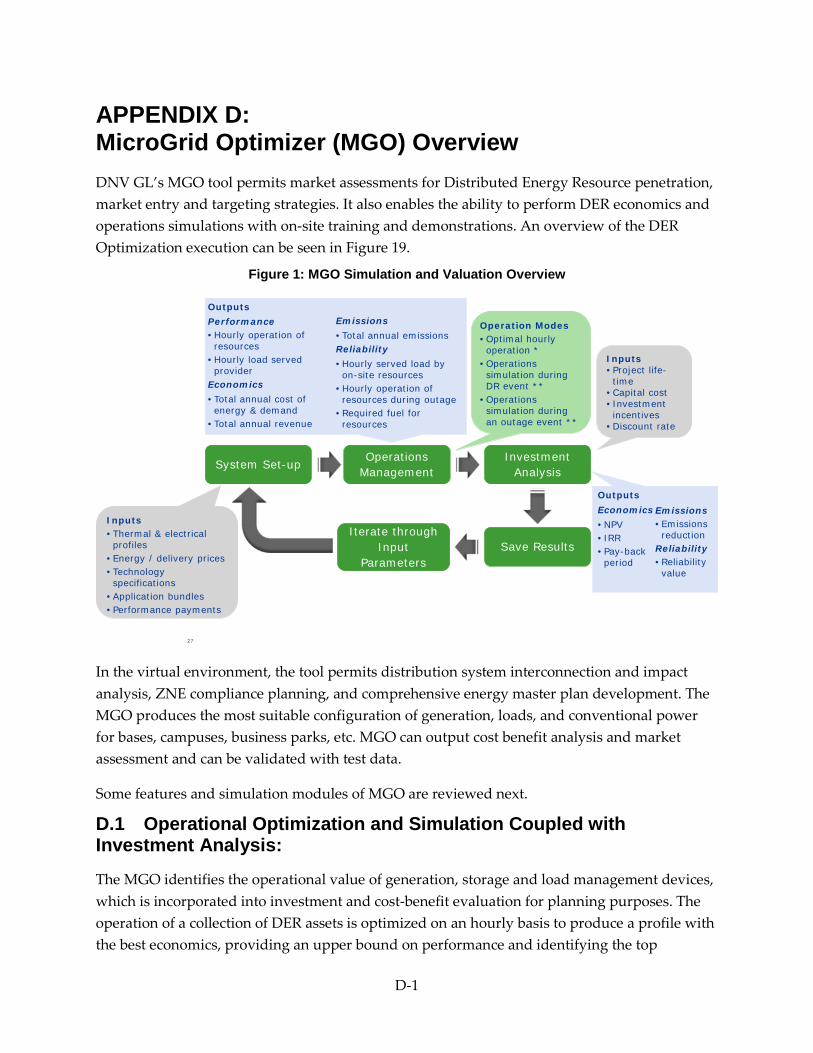
D-1
APPENDIX D: MicroGrid Optimizer (MGO) Overview DNV GL’s MGO tool permits market assessments for Distributed Energy Resource penetration, market entry and targeting strategies. It also enables the ability to perform DER economics and operations simulations with on-site training and demonstrations. An overview of the DER Optimization execution can be seen in Figure 19.
Figure 1: MGO Simulation and Valuation Overview
In the virtual environment, the tool permits distribution system interconnection and impact analysis, ZNE compliance planning, and comprehensive energy master plan development. The MGO produces the most suitable configuration of generation, loads, and conventional power for bases, campuses, business parks, etc. MGO can output cost benefit analysis and market assessment and can be validated with test data.
Some features and simulation modules of MGO are reviewed next.
D.1 Operational Optimization and Simulation Coupled with Investment Analysis:
The MGO identifies the operational value of generation, storage and load management devices, which is incorporated into investment and cost-benefit evaluation for planning purposes. The operation of a collection of DER assets is optimized on an hourly basis to produce a profile with the best economics, providing an upper bound on performance and identifying the top
Inputs• Thermal & electrical profiles
• Energy / delivery prices• Technology specifications
• Application bundles• Performance payments
27
Operations ManagementSystem Set-up
Operation Modes• Optimal hourly operation *
• Operations simulation during DR event **
• Operations simulation during an outage event **
OutputsPerformance• Hourly operation of resources
• Hourly load served provider
Economics• Total annual cost of energy & demand
• Total annual revenue
Emissions• Total annual emissions Reliability• Hourly served load by on-site resources
• Hourly operation of resources during outage
• Required fuel for resources
Investment Analysis
Inputs• Project life-time
• Capital cost• Investment incentives
• Discount rate
OutputsEconomics• NPV• IRR• Pay-back period
Emissions• Emissions reduction
Reliability• Reliability value
Save ResultsIterate through
Input Parameters
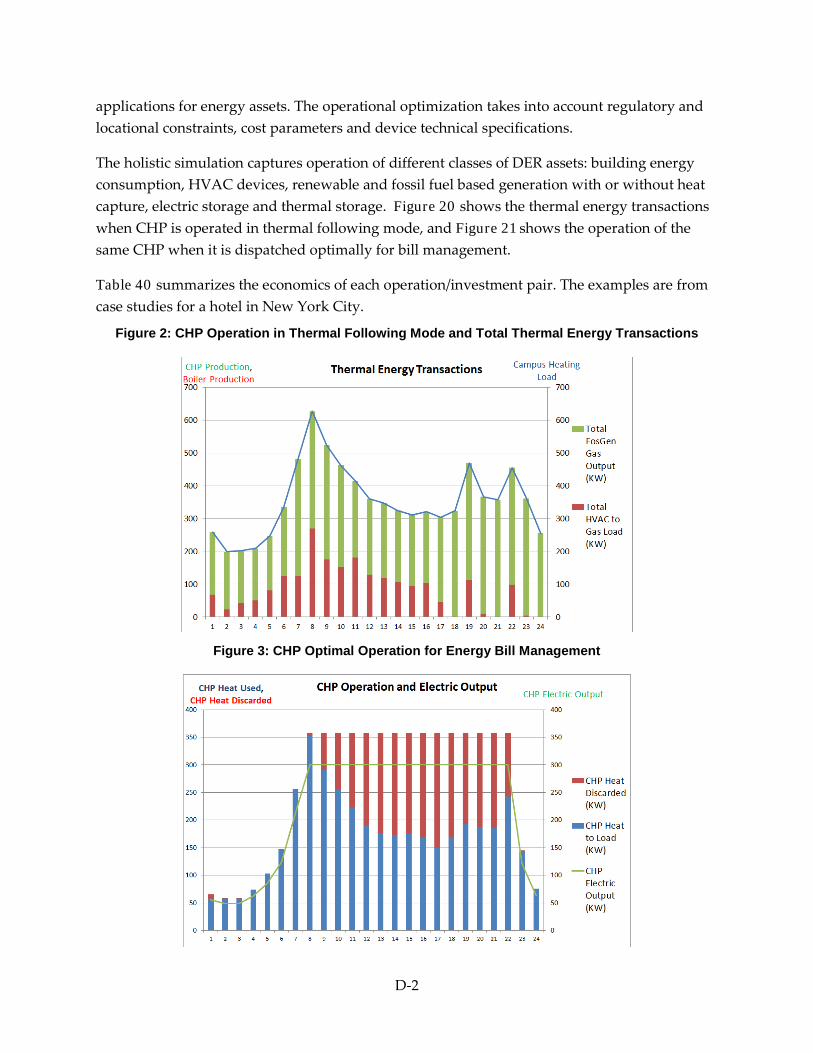
D-2
applications for energy assets. The operational optimization takes into account regulatory and locational constraints, cost parameters and device technical specifications.
The holistic simulation captures operation of different classes of DER assets: building energy consumption, HVAC devices, renewable and fossil fuel based generation with or without heat capture, electric storage and thermal storage. Figure 20 shows the thermal energy transactions when CHP is operated in thermal following mode, and Figure 21 shows the operation of the same CHP when it is dispatched optimally for bill management.
Table 40 summarizes the economics of each operation/investment pair. The examples are from case studies for a hotel in New York City.
Figure 2: CHP Operation in Thermal Following Mode and Total Thermal Energy Transactions
Figure 3: CHP Optimal Operation for Energy Bill Management
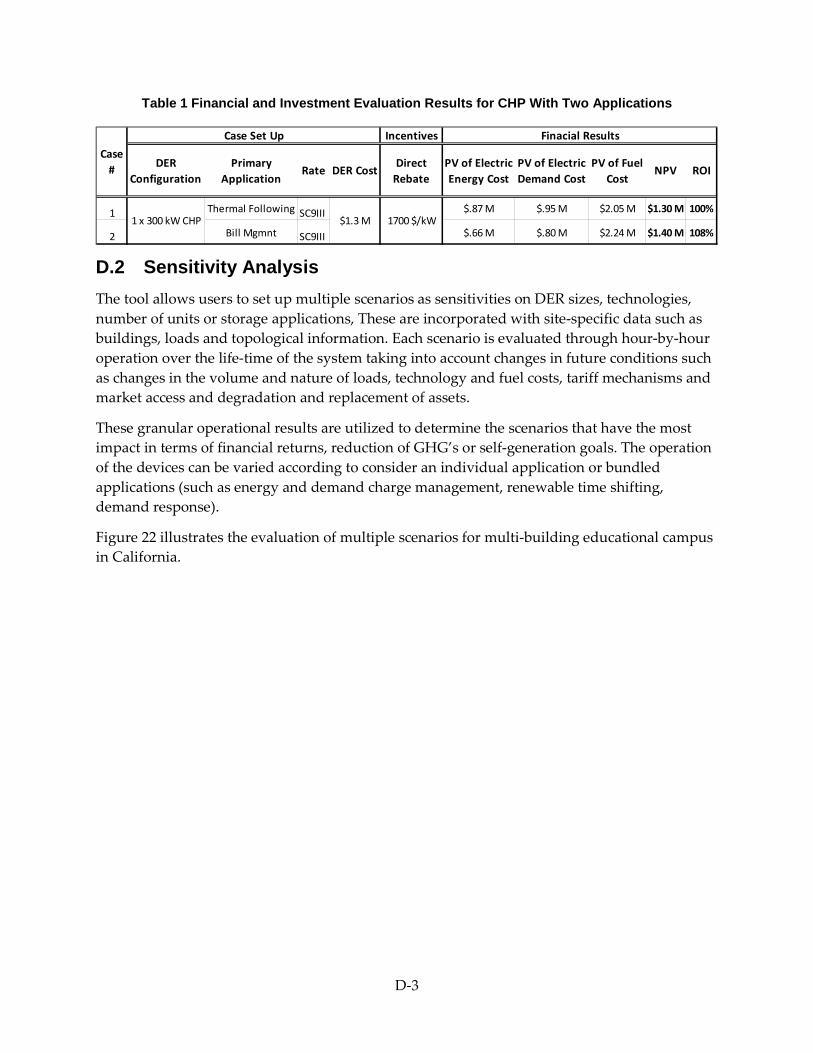
D-3
Table 1 Financial and Investment Evaluation Results for CHP With Two Applications
D.2 Sensitivity Analysis The tool allows users to set up multiple scenarios as sensitivities on DER sizes, technologies, number of units or storage applications, These are incorporated with site-specific data such as buildings, loads and topological information. Each scenario is evaluated through hour-by-hour operation over the life-time of the system taking into account changes in future conditions such as changes in the volume and nature of loads, technology and fuel costs, tariff mechanisms and market access and degradation and replacement of assets.
These granular operational results are utilized to determine the scenarios that have the most impact in terms of financial returns, reduction of GHG’s or self-generation goals. The operation of the devices can be varied according to consider an individual application or bundled applications (such as energy and demand charge management, renewable time shifting, demand response).
Figure 22 illustrates the evaluation of multiple scenarios for multi-building educational campus in California.
Incentives
DER Configuration
Primary Application
Rate DER Cost Direct Rebate
PV of Electric Energy Cost
PV of Electric Demand Cost
PV of Fuel Cost
NPV ROI
1 SC9III $.87 M $.95 M $2.05 M $1.30 M 100%
2 Bill Mgmnt SC9III $.66 M $.80 M $2.24 M $1.40 M 108%
Finacial ResultsCase Set UpCase
#
1 x 300 kW CHP 1700 $/kW$1.3 MThermal Following
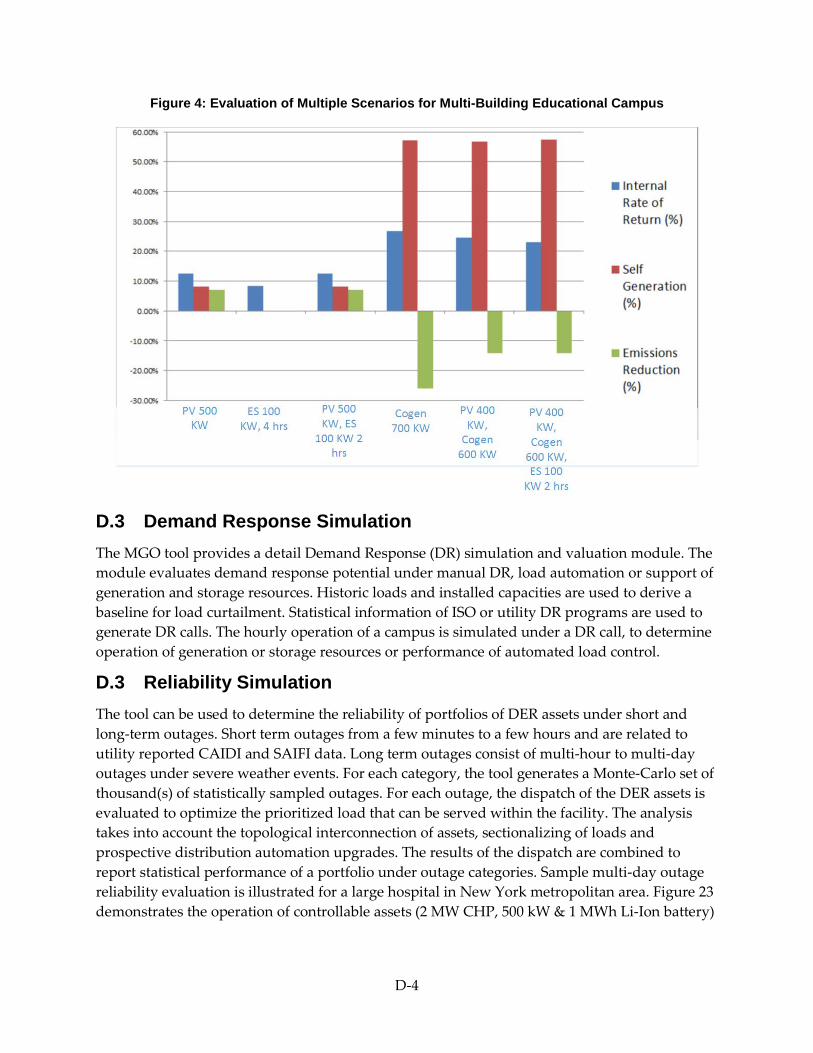
D-4
Figure 4: Evaluation of Multiple Scenarios for Multi-Building Educational Campus
D.3 Demand Response Simulation The MGO tool provides a detail Demand Response (DR) simulation and valuation module. The module evaluates demand response potential under manual DR, load automation or support of generation and storage resources. Historic loads and installed capacities are used to derive a baseline for load curtailment. Statistical information of ISO or utility DR programs are used to generate DR calls. The hourly operation of a campus is simulated under a DR call, to determine operation of generation or storage resources or performance of automated load control.
D.3 Reliability Simulation The tool can be used to determine the reliability of portfolios of DER assets under short and long-term outages. Short term outages from a few minutes to a few hours and are related to utility reported CAIDI and SAIFI data. Long term outages consist of multi-hour to multi-day outages under severe weather events. For each category, the tool generates a Monte-Carlo set of thousand(s) of statistically sampled outages. For each outage, the dispatch of the DER assets is evaluated to optimize the prioritized load that can be served within the facility. The analysis takes into account the topological interconnection of assets, sectionalizing of loads and prospective distribution automation upgrades. The results of the dispatch are combined to report statistical performance of a portfolio under outage categories. Sample multi-day outage reliability evaluation is illustrated for a large hospital in New York metropolitan area. Figure 23 demonstrates the operation of controllable assets (2 MW CHP, 500 kW & 1 MWh Li-Ion battery)
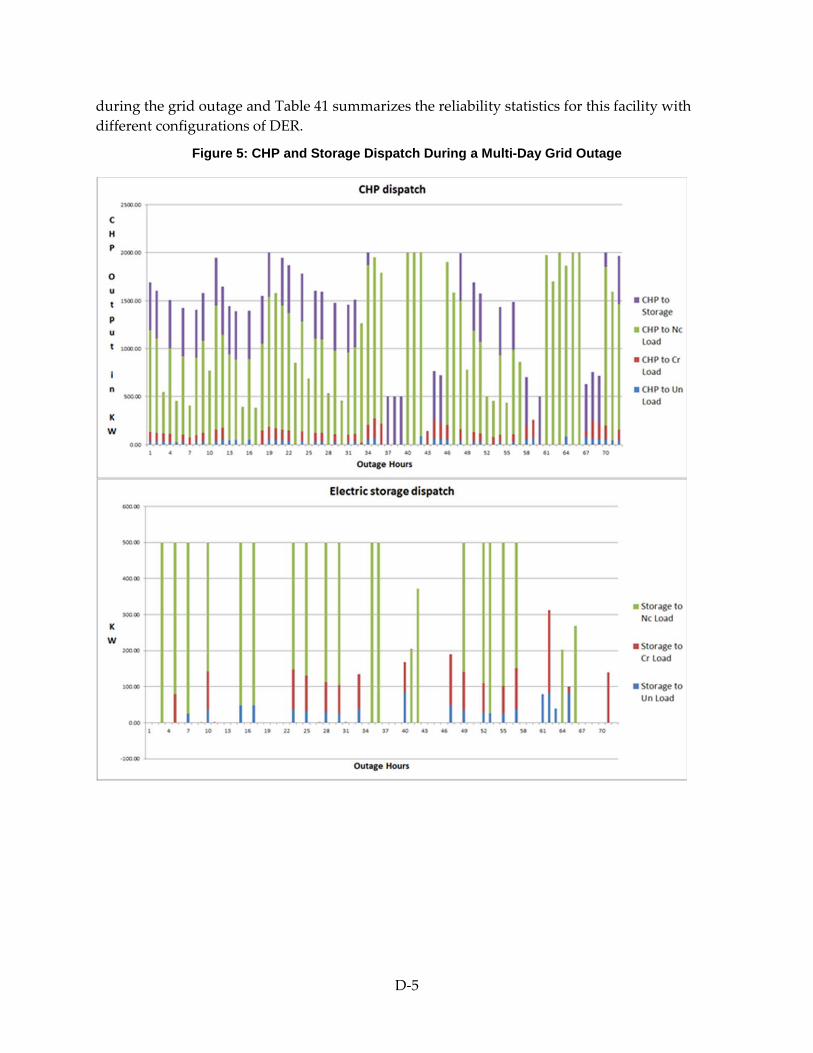
D-5
during the grid outage and Table 41 summarizes the reliability statistics for this facility with different configurations of DER.
Figure 5: CHP and Storage Dispatch During a Multi-Day Grid Outage
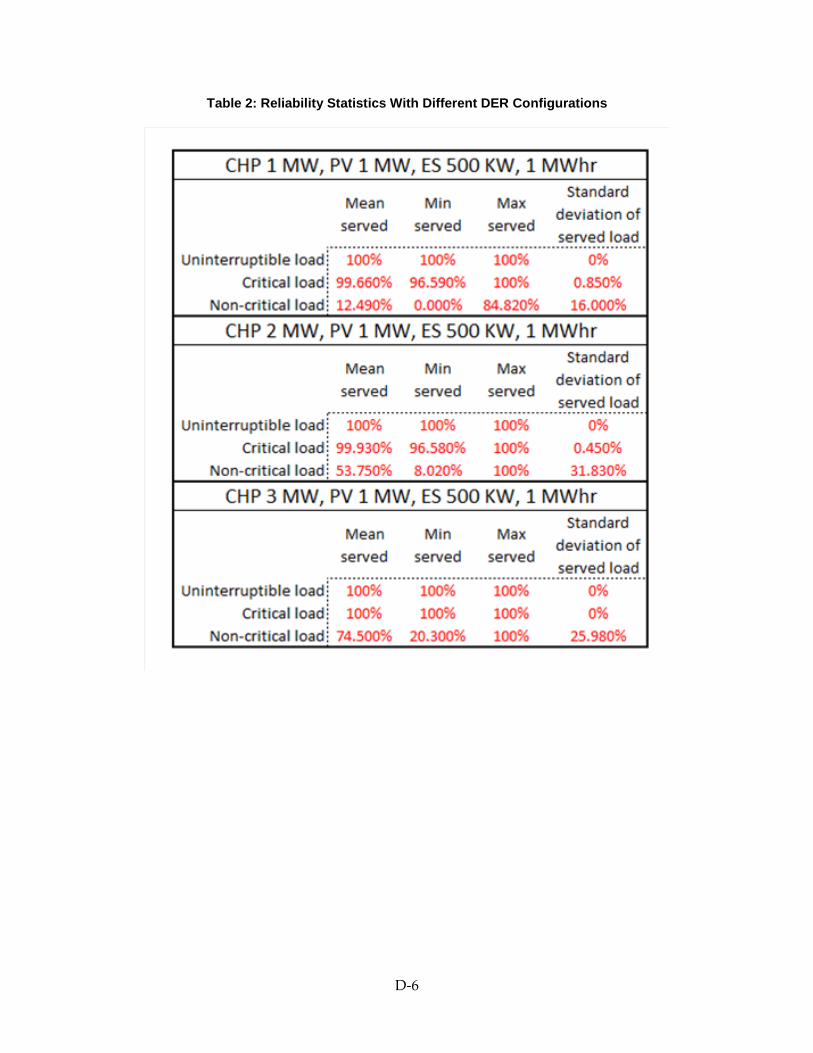
D-6
Table 2: Reliability Statistics With Different DER Configurations
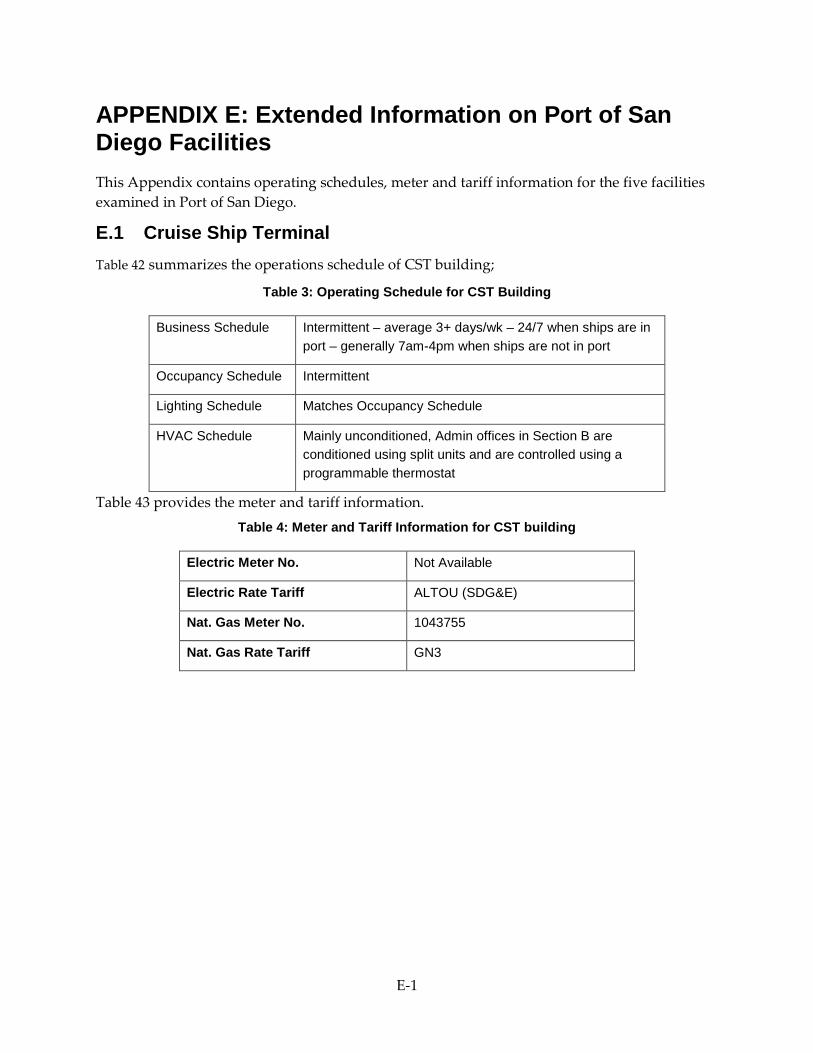
E-1
APPENDIX E: Extended Information on Port of San Diego Facilities This Appendix contains operating schedules, meter and tariff information for the five facilities examined in Port of San Diego.
E.1 Cruise Ship Terminal Table 42 summarizes the operations schedule of CST building;
Table 3: Operating Schedule for CST Building
Business Schedule Intermittent – average 3+ days/wk – 24/7 when ships are in port – generally 7am-4pm when ships are not in port
Occupancy Schedule Intermittent
Lighting Schedule Matches Occupancy Schedule
HVAC Schedule Mainly unconditioned, Admin offices in Section B are conditioned using split units and are controlled using a programmable thermostat
Table 43 provides the meter and tariff information. Table 4: Meter and Tariff Information for CST building
Electric Meter No. Not Available
Electric Rate Tariff ALTOU (SDG&E)
Nat. Gas Meter No. 1043755
Nat. Gas Rate Tariff GN3
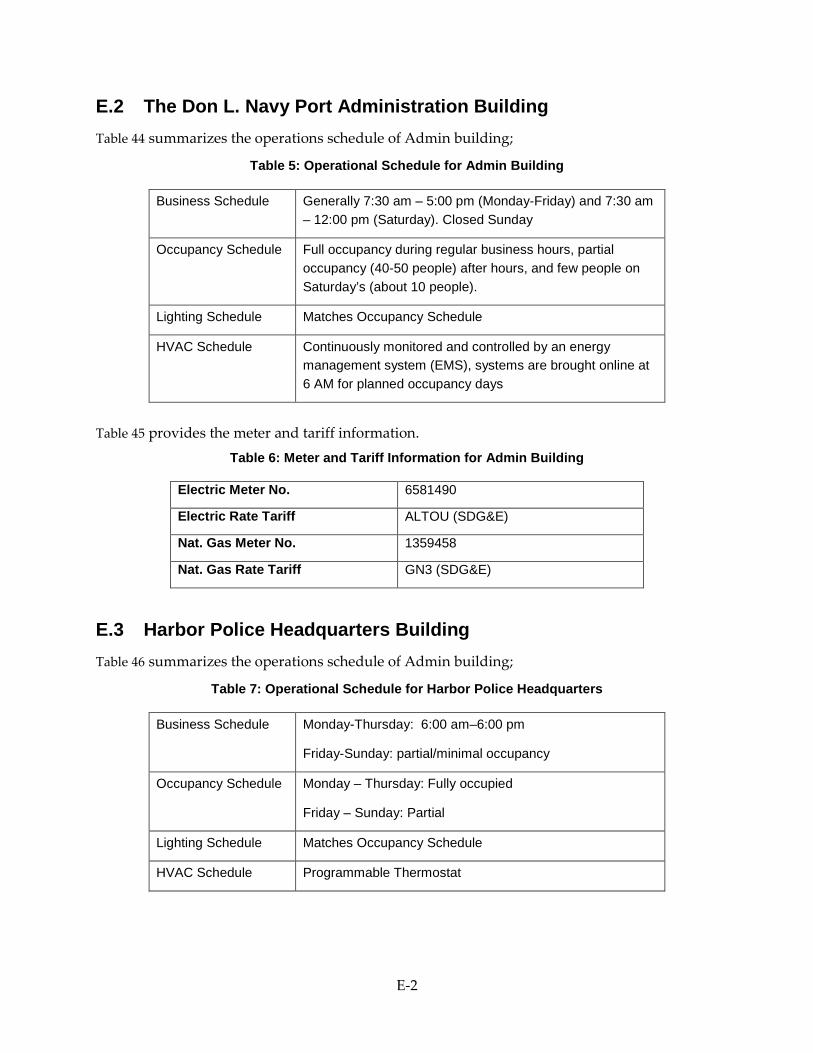
E-2
E.2 The Don L. Navy Port Administration Building Table 44 summarizes the operations schedule of Admin building;
Table 5: Operational Schedule for Admin Building
Business Schedule Generally 7:30 am – 5:00 pm (Monday-Friday) and 7:30 am – 12:00 pm (Saturday). Closed Sunday
Occupancy Schedule Full occupancy during regular business hours, partial occupancy (40-50 people) after hours, and few people on Saturday’s (about 10 people).
Lighting Schedule Matches Occupancy Schedule
HVAC Schedule Continuously monitored and controlled by an energy management system (EMS), systems are brought online at 6 AM for planned occupancy days
Table 45 provides the meter and tariff information.
Table 6: Meter and Tariff Information for Admin Building
Electric Meter No. 6581490
Electric Rate Tariff ALTOU (SDG&E)
Nat. Gas Meter No. 1359458
Nat. Gas Rate Tariff GN3 (SDG&E)
E.3 Harbor Police Headquarters Building Table 46 summarizes the operations schedule of Admin building;
Table 7: Operational Schedule for Harbor Police Headquarters
Business Schedule Monday-Thursday: 6:00 am–6:00 pm
Friday-Sunday: partial/minimal occupancy
Occupancy Schedule Monday – Thursday: Fully occupied
Friday – Sunday: Partial
Lighting Schedule Matches Occupancy Schedule
HVAC Schedule Programmable Thermostat
E-3
Table 45 provides the meter and tariff information. Table 8: Meter and Tariff Information for Harbor Police Headquarters
Electric Meter No. Combined
Electric Rate Tariff A
Nat. Gas Meter No. Combined
Nat. Gas Rate Tariff GN3
E.4 General Services Building Table 48 provides the meter and tariff information.
Table 9: Meter and Tariff Information for General Services Building
Electric Meter No. 6583102
Electric Rate Tariff ALTOU (SDG&E)
Nat. Gas Meter No. 929875
Nat. Gas Rate Tariff GN3 (SDG&E)
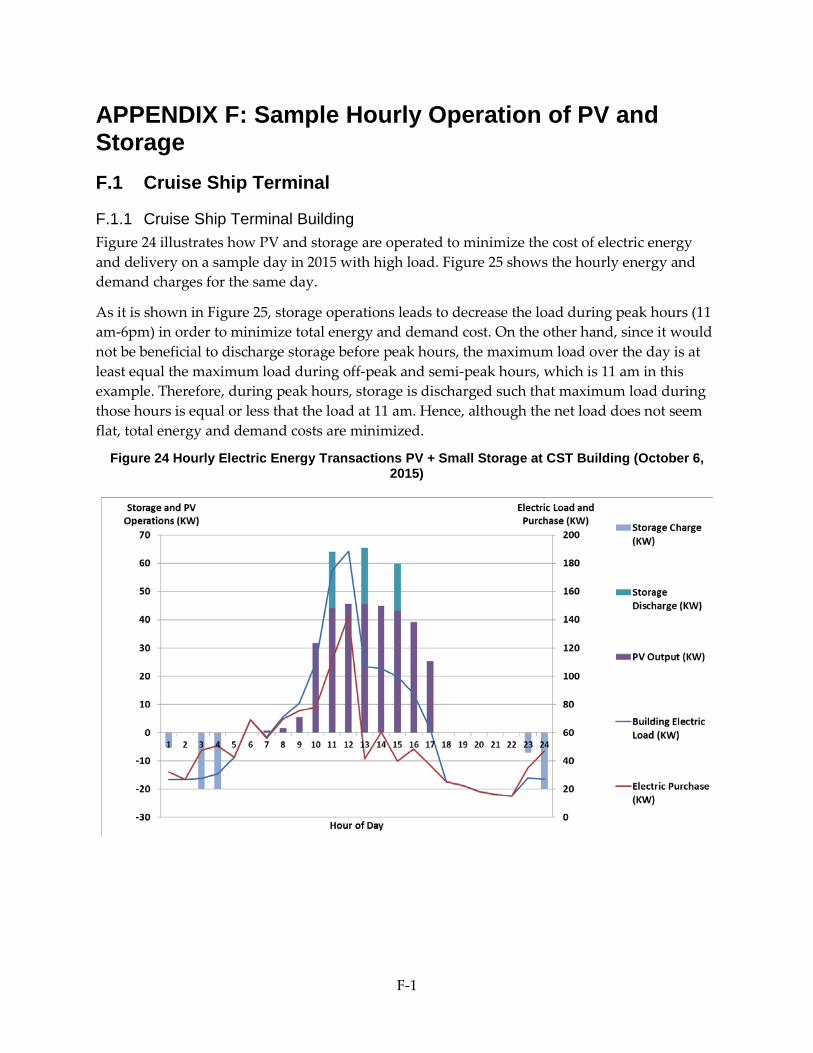
F-1
APPENDIX F: Sample Hourly Operation of PV and Storage F.1 Cruise Ship Terminal
F.1.1 Cruise Ship Terminal Building Figure 24 illustrates how PV and storage are operated to minimize the cost of electric energy and delivery on a sample day in 2015 with high load. Figure 25 shows the hourly energy and demand charges for the same day.
As it is shown in Figure 25, storage operations leads to decrease the load during peak hours (11 am-6pm) in order to minimize total energy and demand cost. On the other hand, since it would not be beneficial to discharge storage before peak hours, the maximum load over the day is at least equal the maximum load during off-peak and semi-peak hours, which is 11 am in this example. Therefore, during peak hours, storage is discharged such that maximum load during those hours is equal or less that the load at 11 am. Hence, although the net load does not seem flat, total energy and demand costs are minimized.
Figure 24 Hourly Electric Energy Transactions PV + Small Storage at CST Building (October 6, 2015)
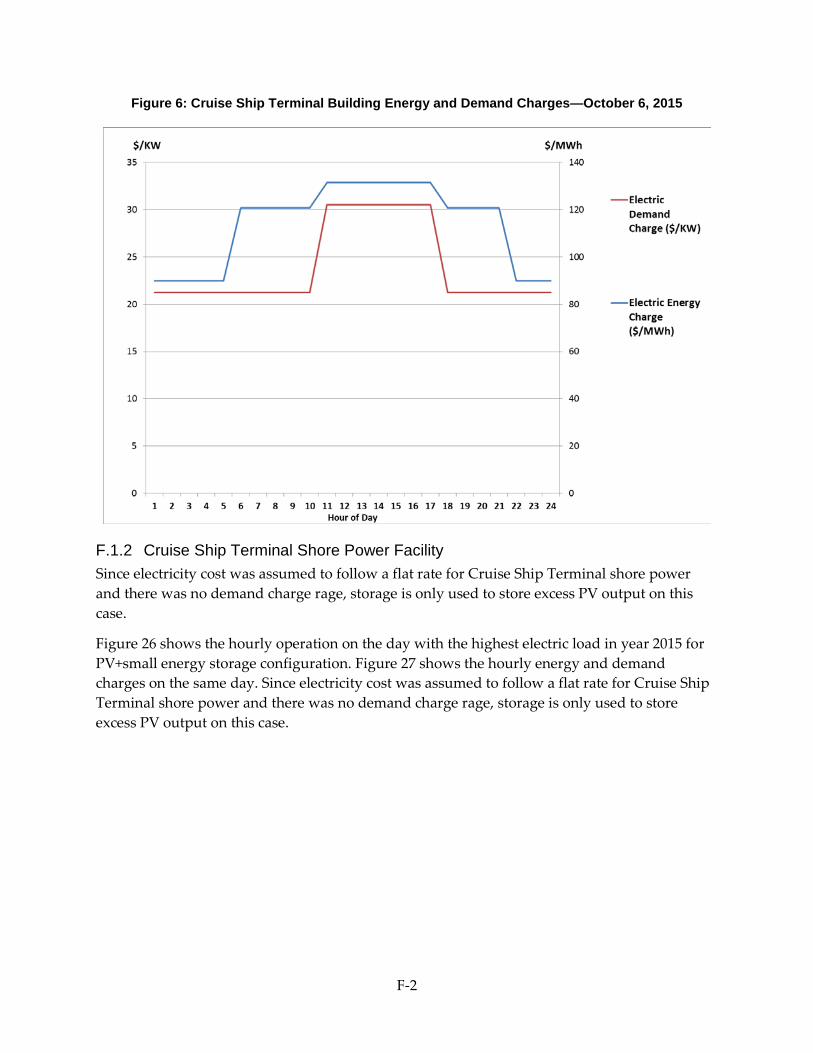
F-2
Figure 6: Cruise Ship Terminal Building Energy and Demand Charges—October 6, 2015
F.1.2 Cruise Ship Terminal Shore Power Facility Since electricity cost was assumed to follow a flat rate for Cruise Ship Terminal shore power and there was no demand charge rage, storage is only used to store excess PV output on this case.
Figure 26 shows the hourly operation on the day with the highest electric load in year 2015 for PV+small energy storage configuration. Figure 27 shows the hourly energy and demand charges on the same day. Since electricity cost was assumed to follow a flat rate for Cruise Ship Terminal shore power and there was no demand charge rage, storage is only used to store excess PV output on this case.
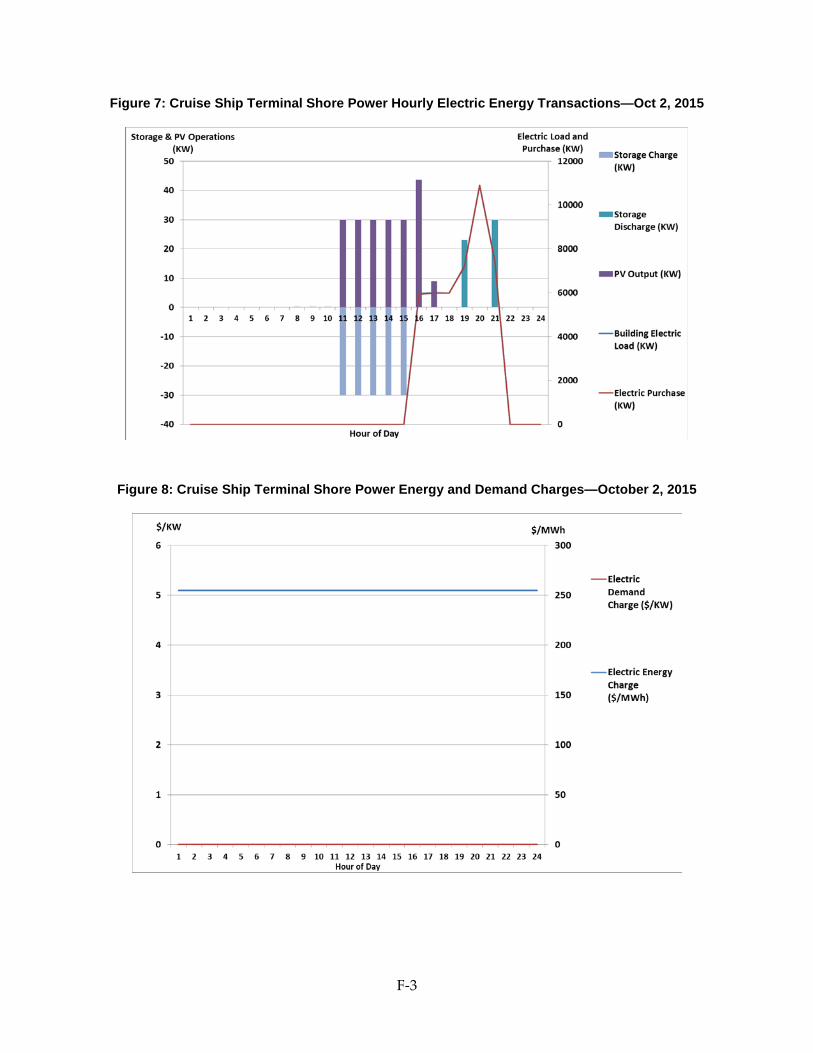
F-3
Figure 7: Cruise Ship Terminal Shore Power Hourly Electric Energy Transactions—Oct 2, 2015
Figure 8: Cruise Ship Terminal Shore Power Energy and Demand Charges—October 2, 2015
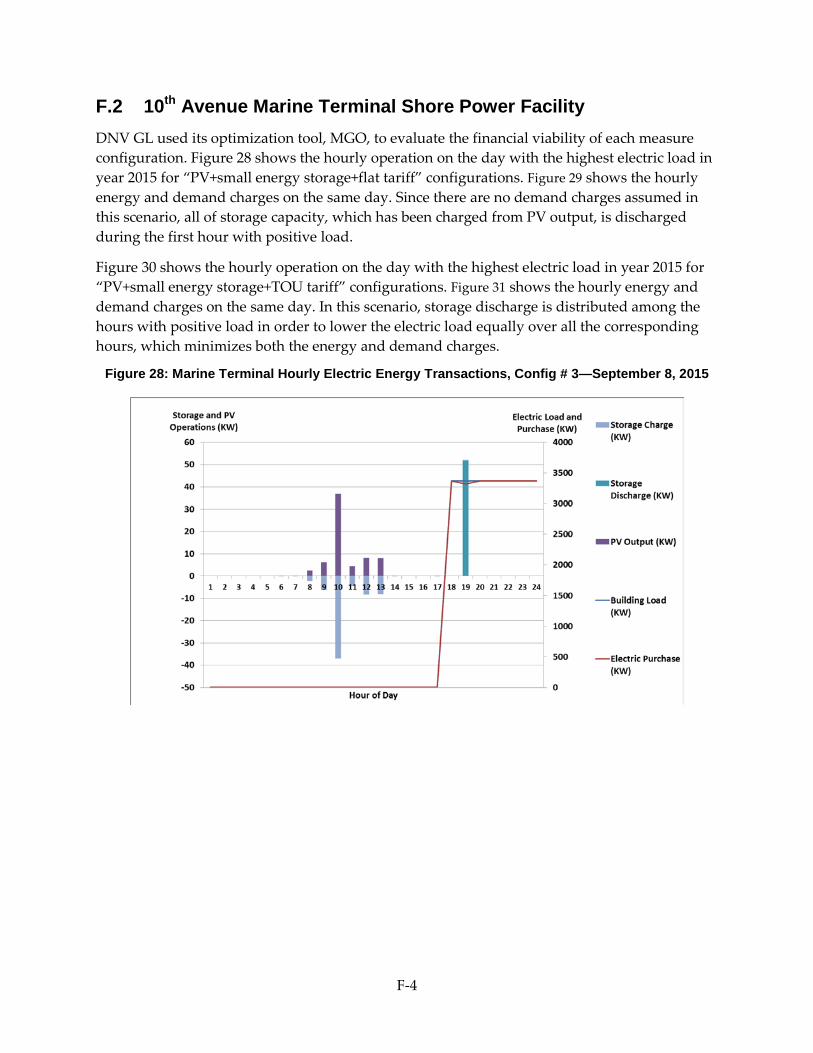
F-4
F.2 10th Avenue Marine Terminal Shore Power Facility DNV GL used its optimization tool, MGO, to evaluate the financial viability of each measure configuration. Figure 28 shows the hourly operation on the day with the highest electric load in year 2015 for “PV+small energy storage+flat tariff” configurations. Figure 29 shows the hourly energy and demand charges on the same day. Since there are no demand charges assumed in this scenario, all of storage capacity, which has been charged from PV output, is discharged during the first hour with positive load.
Figure 30 shows the hourly operation on the day with the highest electric load in year 2015 for “PV+small energy storage+TOU tariff” configurations. Figure 31 shows the hourly energy and demand charges on the same day. In this scenario, storage discharge is distributed among the hours with positive load in order to lower the electric load equally over all the corresponding hours, which minimizes both the energy and demand charges.
Figure 28: Marine Terminal Hourly Electric Energy Transactions, Config # 3—September 8, 2015
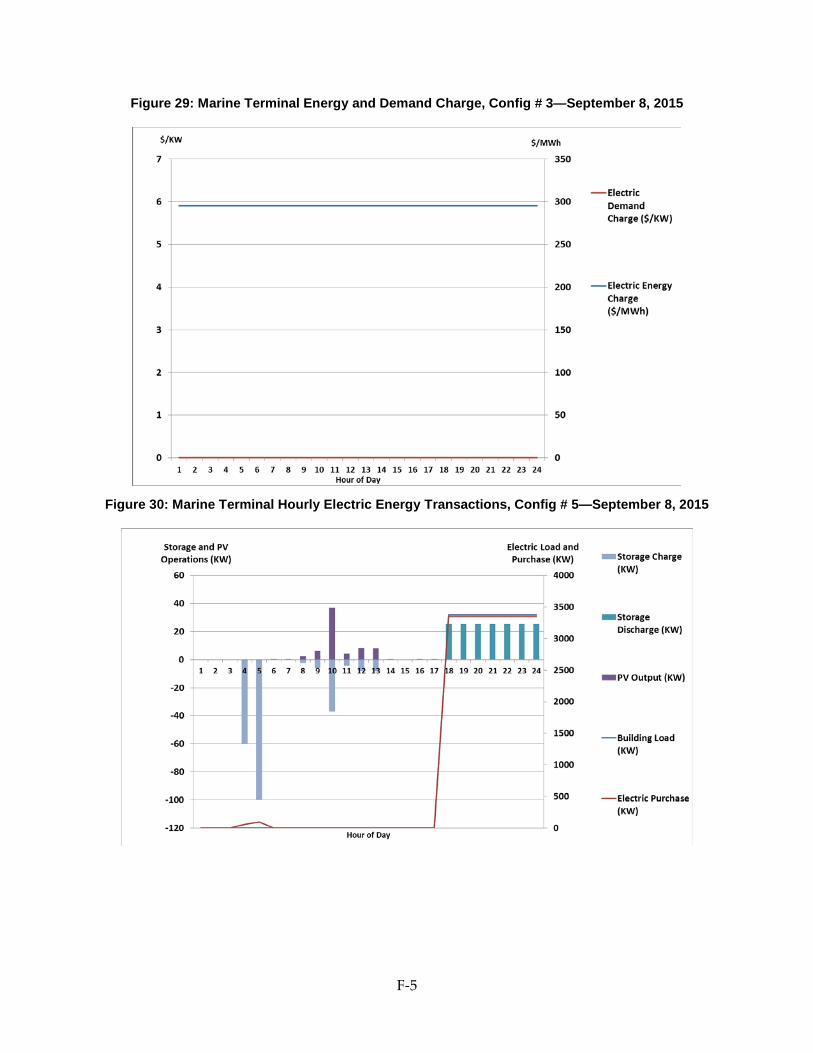
F-5
Figure 29: Marine Terminal Energy and Demand Charge, Config # 3—September 8, 2015
Figure 30: Marine Terminal Hourly Electric Energy Transactions, Config # 5—September 8, 2015
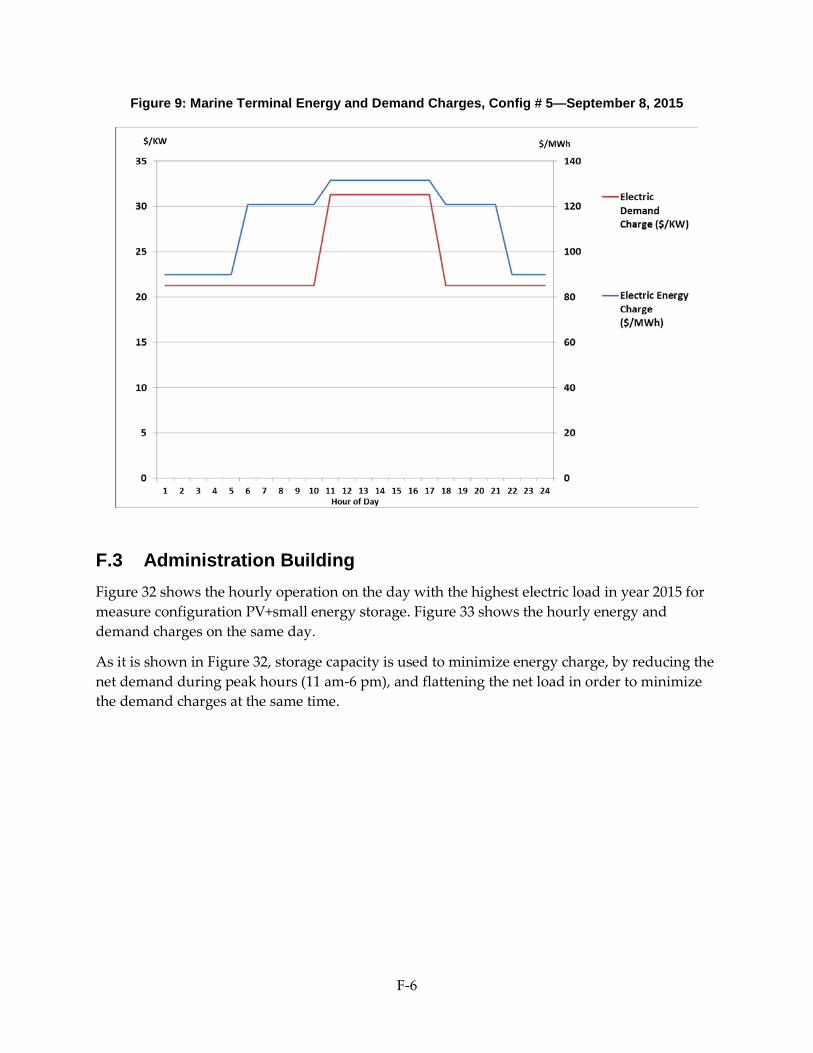
F-6
Figure 9: Marine Terminal Energy and Demand Charges, Config # 5—September 8, 2015
F.3 Administration Building Figure 32 shows the hourly operation on the day with the highest electric load in year 2015 for measure configuration PV+small energy storage. Figure 33 shows the hourly energy and demand charges on the same day.
As it is shown in Figure 32, storage capacity is used to minimize energy charge, by reducing the net demand during peak hours (11 am-6 pm), and flattening the net load in order to minimize the demand charges at the same time.
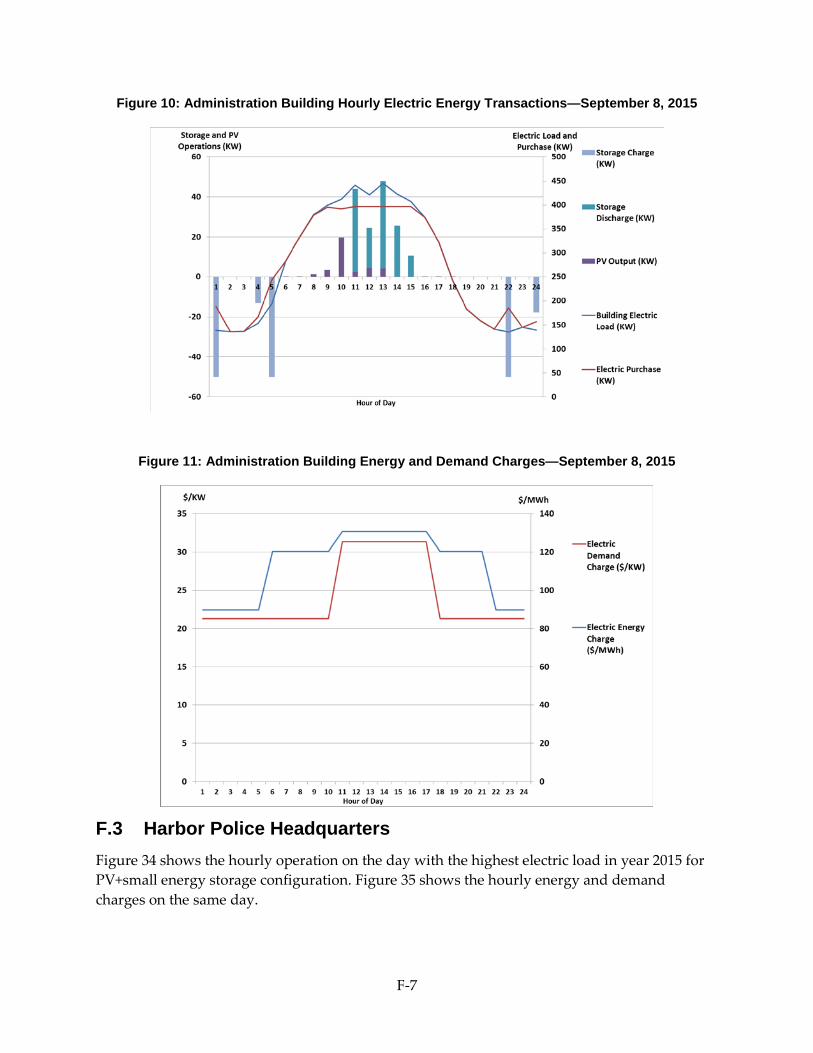
F-7
Figure 10: Administration Building Hourly Electric Energy Transactions—September 8, 2015
Figure 11: Administration Building Energy and Demand Charges—September 8, 2015
F.3 Harbor Police Headquarters Figure 34 shows the hourly operation on the day with the highest electric load in year 2015 for PV+small energy storage configuration. Figure 35 shows the hourly energy and demand charges on the same day.
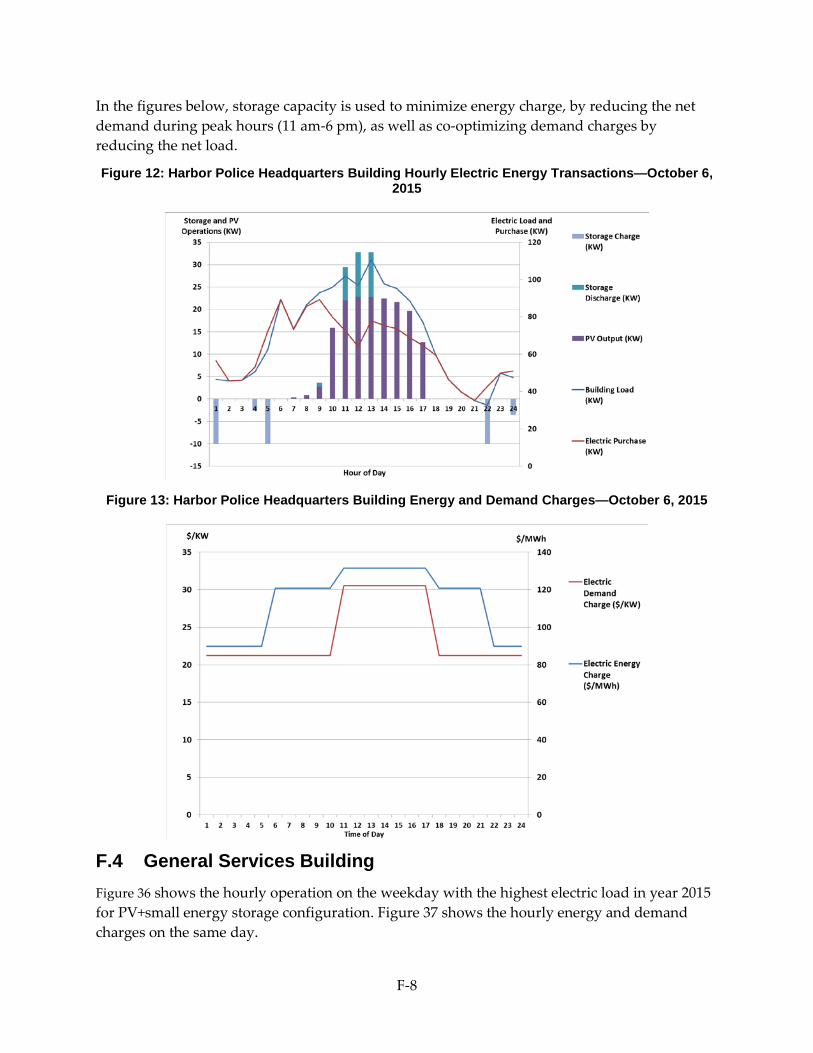
F-8
In the figures below, storage capacity is used to minimize energy charge, by reducing the net demand during peak hours (11 am-6 pm), as well as co-optimizing demand charges by reducing the net load.
Figure 12: Harbor Police Headquarters Building Hourly Electric Energy Transactions—October 6, 2015
Figure 13: Harbor Police Headquarters Building Energy and Demand Charges—October 6, 2015
F.4 General Services Building Figure 36 shows the hourly operation on the weekday with the highest electric load in year 2015 for PV+small energy storage configuration. Figure 37 shows the hourly energy and demand charges on the same day.
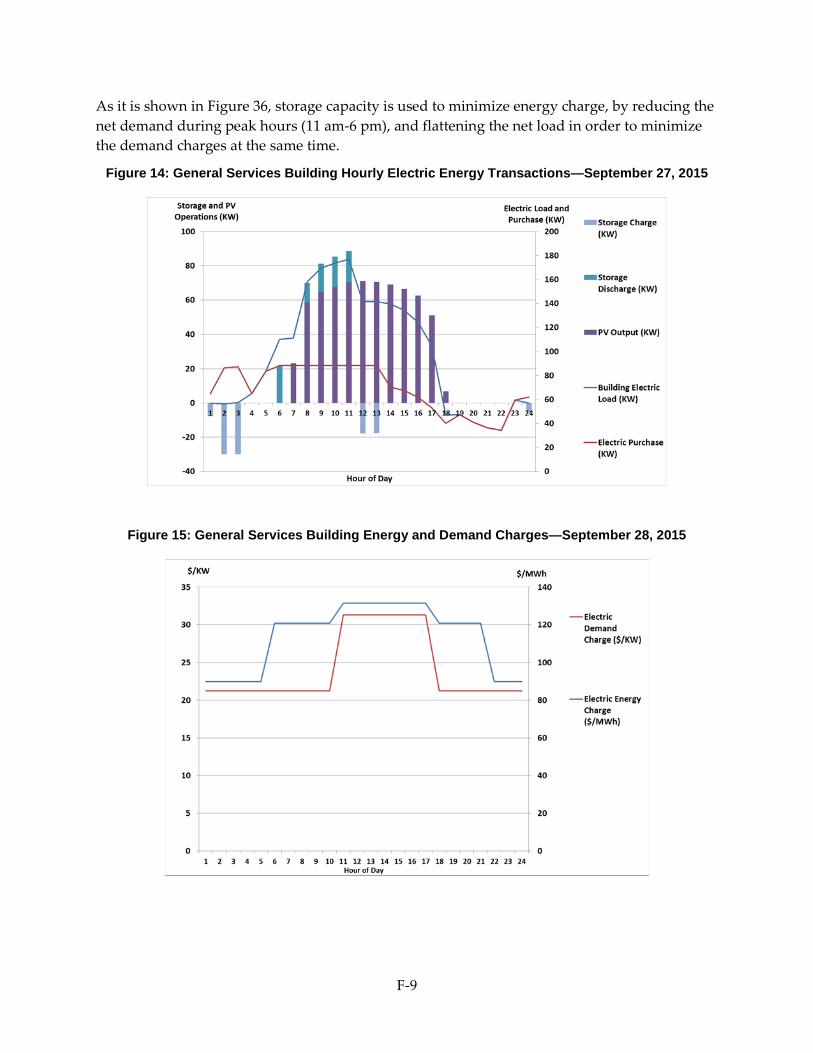
F-9
As it is shown in Figure 36, storage capacity is used to minimize energy charge, by reducing the net demand during peak hours (11 am-6 pm), and flattening the net load in order to minimize the demand charges at the same time.
Figure 14: General Services Building Hourly Electric Energy Transactions—September 27, 2015
Figure 15: General Services Building Energy and Demand Charges—September 28, 2015