assessment of climate extremes in the eastern mediterranean
TRANSCRIPT

Meteorol Atmos Phys 89, 69–85 (2005)DOI 10.1007/s00703-005-0122-2
Climatic Research Unit, University of East Anglia, UK
Assessment of climate extremesin the Eastern Mediterranean
E. Kostopoulou� and P. D. Jones
With 11 Figures
Received August 6, 2004; revised October 24, 2004; accepted November 15, 2004Published online: June 20, 2005 # Springer-Verlag 2005
Summary
Several seasonal and annual climate extreme indices havebeen calculated and their trends (over 1958 to 2000)analysed to identify possible changes in temperature- andprecipitation-related climate extremes over the easternMediterranean region. The most significant temperaturetrends were revealed for summer, where both minimum andmaximum temperature extremes show statistically signifi-cant warming trends. Increasing trends were also identifiedfor an index of heatwave duration. Negative trends werefound for the frequency of cold nights in winter andespecially in summer. Precipitation indices highlightedmore regional contrasts. The western part of the studyregion, which comprises the central Mediterranean and isrepresented by Italian stations, shows significant positivetrends towards intense rainfall events and greater amountsof precipitation. In contrast, the eastern half showednegative trends in all precipitation indices indicating drierconditions in recent times. Significant positive trends wererevealed for the index of maximum number of consecutivedry days, especially for stations in southern regions,particularly on the islands.
1. Introduction
Changes in climate can lead to significantimpacts on natural, social, and economic sectors.Water resources, agriculture, ecosystems, for-estry, health, insurance and industry are some
of the most studied sectors (Parry, 2000). Climateextremes associated with temperature and precip-itation can also affect energy consumption,human comfort and tourism (Henderson andMuller, 1997; WISE, 1999; Subak et al, 2000).Increased economic losses due to extremeweather and, especially, increases in losses oflives have been regularly (in newspapers) attrib-uted to such events and this has raised the interestof the scientific community in studies of extremeweather phenomena (Karl and Easterling, 1999).Although, changes in average climate have beenmonitored and well studied (Plummer et al,1999), until recently, only a few studies havefocused on extreme weather and climate events(Karl et al, 1999; Manton et al, 2001). The majorissues that have concerned researchers relate todata availability, access and quality. Monthlydata series enable researchers to detect possiblechanges in monthly and seasonal climate ex-tremes (Jones et al, 1999), but, the climatic com-munity agrees that high-quality daily climatedata, available over long periods, are requiredto monitor, understand and eventually predict cli-mate extremes (Karl et al, 1999; Nicholls andMurray, 1999).
With respect to changes in climatic ex-tremes, the 3rd Assessment Report of IPCC(IPCC, 2001a), noted the increased probability
� Current affiliation: National Observatory of Athens, Athens,
Greece.

of extreme warm days, a decrease in the fre-quency of cold nights, increasing chance ofdrought in mid-continental areas during summer,and more intense precipitation events over manyareas. In individual studies, Osborn et al (2000)have found that precipitation totals in the UKhave increased in winter and they attributed thisevent mainly to an increase in the amount ofprecipitation on wet days rather than an increasein the number of wet days. Heino et al (1999)analyzed climatic extremes in northern andcentral Europe and reported that both maximumand minimum daily temperatures have increased,but the minimum temperature is rising faster thanthe maximum causing a reduction in the diurnaltemperature range. Additionally, they detected adecrease in the number of frost days. For anotherregion, Plummer et al (1999) studied climateextremes in Australia and New Zealand duringthe 20th century and found increases inheavy precipitation events, enhanced frequencyof extreme warm days and nights, whilst extremecool days and nights and drought events haddecreased. Similar results were produced byManton et al (2001) in a study over southeastAsia and the South Pacific islands includingAustralia and New Zealand.
The increases in mean daily temperature areprimarily caused by increases in night-time tem-peratures (Heino et al, 1999; Jones et al, 1999;IPCC, 2001a). However, it has been shown thatnot all regions have responded in the sameway to the rise of global-mean temperature. Forexample, the Mediterranean basin, where a non-uniform and discontinuous warming has beenidentified, a marked east–west differentiation intemperature trends has been documented. Pre-vious studies in the region have shown that theair temperature in the western Mediterraneanshows a positive trend over the period 1950–1990, while the eastern Mediterranean indi-cates a decreasing trend (Sahsamanoglou andMakrogiannis, 1992; Hasanean, 2001; Xoplaki,2002). Recent studies report that the situationhas begun to change at the beginning of the1990s, because the cooling trends in mean andmaximum temperatures have weakened (T€uurkes�et al, 2002). Brunetti et al (2000) showed positivetrends for both maximum and minimum dailytemperature over the period 1865–1996 in Italy,
and they pointed out that the trends are greatestin the south of the country, while Moonen et al(2002) demonstrated decreases in extreme coldevents in central Italy. With regard to precipita-tion in the Mediterranean region, drying trendshave been reported (IPCC, 2001a, b) and occur-rences of long dry spells especially duringsummer in the southern areas have been found(Martin-Vide and Gomez, 1999). The easternMediterranean especially, shows a tendencytowards drier conditions (Kutiel et al, 1996;T€uurkes� , 1998) while the western and centralareas, although showing negative trends in thenumber of wet days and=or the total rainfallamounts, indicate an increase in intense preci-pitation events over the period 1951–1996(Brunetti et al, 2001; Alpert et al, 2002).
This study attempts to compile a daily datasetfor the eastern Mediterranean region and subse-quently to analyse changes in climate extremesby calculating a number of climate indices, andexploring trends in climatic extremes empha-sising precipitation and temperature indices.Difficulties in putting together the datasets arediscussed by Kostopoulou (2003), which alsodiscusses circulation classification schemes forthe eastern Mediterranean. According to Brandtand Thornes (1996) large moisture deficits anddesertification processes have been triggeredespecially in the semi-arid southernmost partsof the Mediterranean region. Thus the region isnot just responding to larger-scale forcing due toincreases in atmospheric gases, but is also vul-nerable to local issues related to changes in landuse and over-exploitation of resources. The dry-ing trends in southern Europe are highlighted inthe Third Assessment Report (IPCC, 2001a) withareas experiencing decreases in precipitationamounts and drastic decreases in the number ofdays with precipitation (Romero et al, 1999;Brunetti et al, 2001; IPCC, 2001b). Another char-acteristic related to the vulnerability of the cli-mate of the Mediterranean region is associatedwith an increase of very hot summer tempera-tures, while prolonged heatwaves appear to oc-curing more frequent in the area (Parry, 2000;IPCC, 2001b). Extreme temperatures have animportant impact on tourism which, along withagriculture, comprises the principal economicsectors for the region. However, the worst impact
70 E. Kostopoulou and P. D. Jones

relates to the increased losses of lives during sev-eral of the recent heatwaves, the effects of whichare exacerbated in the cities.
2. Study region and data
The eastern half of the Mediterranean regioncomprises the domain of interest in this workwhich focuses over a broader study windowextending from 5�–40� E and 30�–50� N. Thestation network utilised in this study consists ofa number of meteorological sites originatingfrom 10 countries covering the European sideof the eastern Mediterranean Sea. Daily tempera-ture and precipitation data were collected forthe period 1958–2000 and five series of dailyclimatic elements were produced: daily mean(Tmean), maximum (Tmax) and minimum tem-perature (Tmin), diurnal temperature range(DTR) and daily total precipitation.
Although a large number of stations were ini-tially available, essential data quality control wascarried out for all stations based on basic stan-dards recommended by WMO (1986). Availablemetadata for the stations were analysed espe-cially regarding relocation, closure or mal-opera-tion of a station. Missing data and outliers wereidentified, misprints were corrected (consultingnearby values) and scattered missing temperaturedata were filled using linear interpolation. As faras the precipitation data are concerned, onlyobvious misprints were corrected while all othermissing records were treated as missing values.
The basic assessment of station homogeneitywas performed by visually examining the seriesof annual mean temperature anomalies and pre-cipitation totals and by comparing with thosefrom neighbouring stations to confirm that thetrends were not due to inhomogeneities. Stationswith less than 30 years of daily data or whichfailed the tests and revealed poor quality werediscarded from the analysis. The quality controltests reduced the number of overall stations to 94with reliable time series of Tmean and Tmin, 92stations for Tmax and DTR and 84 stations forprecipitation. The locations of the stations withnear-continuous daily records which were uti-lised in the study are shown on a topographicmap of the area in Fig. 1. All the later maps oftrends relate to the 1958 to 2000 period. Not all
stations have all years, but the trends relate to the43-year period.
3. Methodology and indices presented
Various approaches have been taken in studiesthat deal with potential changes of extremeevents. Studies have assessed the interannualvariability of seasonal temperature (Parker et al,1994; Jones et al, 1999), the number of days withextreme high temperature (Gruza et al, 1999), thenumber of days with frost (Heino et al, 1999) orthe duration of the growing season (Frich et al,2002). Generally, climatologists have suggested anumber of indices of climate extremes which canbe easily calculated and can be applied in differ-ent parts of the world (Frich et al, 2002). Theworldwide use of accepted diagnostic tools (i.e.,climatic indices and indicators) allows compari-sons with associated information from variousnational scale studies and provides evidence ofchanges in extreme weather and climate events.This has been achieved in a number of recentstudies through the Expert Team on ClimateChange Detection, Monitoring and Indices(ETCCDMI). ETCCDMI is co-ordinated jointlyby the World Meteorological Organization’s(WMO) Commission on Climatology (CCL)and CLIVAR (see http:==cccma.seos.uvic.ca=ETCCDMI=). Under ETCCDMI, workshopshave been held in a number of continentalregions and an example of the results for Africais given by Easterling et al (2003).
There are two main categories of extremesindices: those based on either absolute thresholdsor percentiles. The first category refers to countsof days crossing a specified absolute value(e.g., the frost day index counts days with Tmin
<0 �C), whereas the second category of indicesare based upon the statistics of a climate variable(i.e., percentiles). To monitor extreme events,the tails of the statistical distribution are exam-ined and days exceeding (not exceeding) a givenhigh (low) percentile are counted. Percentilesare generally preferable to absolute thresholdsbecause they can be extended globally and acrossareas with varying elevation, although abso-lute thresholds (e.g., 0 �C) can be particularlyhelpful in some applications (Folland et al,1999).
Assessment of climate extremes in the Eastern Mediterranean 71

The determination of the percentiles requiresranking the data in ascending order (Wilks,1995), so that the data are presented in orderfrom the smallest to the largest value. Hence, the50th percentile (median) corresponds to the mid-dle value if the dataset contains an odd number ofvalues, or the average of the two middle values inthe case of a dataset with an even number ofvalues. The 25th and 75th percentiles (quartiles)are located at the centre between the median andthe first and last value respectively (Wilks, 1995).Similarly, any other desirable percentiles can becalculated.
In this study, a number of climate extremeindices were calculated using diagnostic soft-ware provided by the EU-funded Statistical andRegional Dynamical Downscaling of Extremes(STARDEX, http:==www.cru.uea.ac.uk=stardex)project. The complete list of the STARDEXindices provides a comprehensive total of 52temperature and precipitation indices. This paper
concentrates on indices which investigate charac-teristics of Mediterranean climate with respect,particularly, to intense events and changes in dailytemperature. Assessment of trends in frost daysand the occurrences of heatwaves are also ana-lysed and presented in the paper. To assess theimpact of extreme temperature and precipitationover the eastern Mediterranean, seven tempera-ture and eight precipitation indices are calculatedand analysed. A list of the indices is shown inTable 1. Descriptions of these indices and theirrespective equations are given in Appendix A.The period 1961–1990 was set as the base periodfor determining the frequency distribution foreach index. A recent study by Zhang et al (2005)shows that the use of percentile-based thresholdscan lead to erroneous trends for temperatureindices when combining counts from the baseperiod and counts outside the base period. Sinceour base period is 30 of the 43 years of availabledata, and most missing data are outside the base
Fig. 1. Geographical distribution of the stations in the eastern Mediterranean which passed the quality control tests and wereutilized in the analysis of climate extremes
72 E. Kostopoulou and P. D. Jones

period, we have not incorporated the adjustmentsto the calculation of the thresholds recommendedby Zhang et al (2005). If we had undertaken thisadjustment any warming-related trends wouldhave likely been enhanced, so our results maybe a little conservative.
Linear regression analysis was then used tocalculate possible trends of the indices, with aKendall-tau test used to estimate the statisticalsignificance of these trends. Trend maps wereconstructed for each index with circles indicatingthe locations of the stations used. The size of thecircles is proportional to the size of the trendsand the colours are indicative of the climatetrends. Black (grey) colour illustrates warming(cooling) trends and rainy (dry) conditions. Filledcircles indicate trends that were found to be sta-tistically significant at the 95% level. Due tospace limitations in this paper only a selectionof the maps are presented. The complete set ofindices is presented in Kostopoulou (2003).
4. Trends in temperature extremes
Seven indices have been calculated to assesschanges in the trends of temperature extremesin the eastern Mediterranean region. The firstcomprises a basic measure of the differencebetween the extreme maximum and minimum
temperature during a certain period of time,while the next three refer to extremes associatedwith cold temperatures and the last three are forwarm temperatures. Seasonal and annual trendmaps are produced with the results discussedseparately for each index.
4.1 Intra-period extreme temperaturerange, ETR
The intra-annual ETR index presents mixedresults over the eastern Mediterranean (notshown). Trends of the order of 0.4 to 0.6 �C perdecade dominate the picture with both positiveand negative trends. Seasonal indices are shownin Fig. 2, which provide clearer results. In winter(DJF), decreased intra-seasonal ETR appears forthe majority of the stations examined. Coastalstations or islands exhibit trends less than0.6 �C=decade, but mostly still significant at the95% level. Most of the stations in the centralBalkans show negative trends, but none are sta-tistically significant. These reductions in ETRcan probably be related to increases in the mini-mum temperature, as has been found in otherregions (Karl et al, 1993; Brazdil et al, 1996;Heino et al, 1999). During spring (MAM), thegreatest trends can be seen in the central Balkanswhere decreases greater than 0.6 �C occur,
Table 1. Climate extreme indices presented and discussed for the eastern Mediterranean region
Index Definition Unit
Temperature indicatorsETR Extreme temperature range (hottest Tmax in
season minus coldest Tmin in season)
�C
Fd Total number of frost days (days with absolute Tmin<0 �C) daysTn 10thP Days with Tmin<10th percentile of daily Tmin of the base period %Tx 10thP Days with Tmax<10th percentile of daily Tmax of the base period %HWDI Heatwave duration index (intervals (>5 days)
with Tmax>5 �C above the daily Tmax normal of the base perioddays
Tn 90thP Days with Tmin>90th percentile of daily Tmin of the base period %Tx 90thP Days with Tmax>90th percentile of daily Tmax of the base period %
Precipitation indicatorsRmean Mean climatological precipitation mm=daySDII Simple daily intensity index (annual total=number of wet days) mm=wet dayCDD Maximum number of consecutive dry days (precipitation <1 mm) daysR10 Number of days with precipitation �10 mm daysR5d Maximum 5-day precipitation total mmR90P 90th percentile of wet day amounts mm=wet dayR90T Percentage of total precipitation from events >90th
percentile of the base period%
R90N Number of events with precipitation >90th percentile of the base period %
Assessment of climate extremes in the Eastern Mediterranean 73

although they are not statistically significant.Over Greece and Italy both increases anddecreases are found. Greece reveals mainlyincreases, while in Italy it seems that positivetrends occur along the eastern coast with nega-tive trends across the western coast. In summer(JJA), a few reductions are seen on the trendmap, but mainly positive trends of ETR are evi-dent, due to increases of daily maximum tem-peratures. An interesting pattern is shown forthe autumn (SON) where large positive trendsare dominant, with almost half of them signifi-cant at the 95% level. These results can be attrib-uted to the extended warm weather (with strongsummer characteristics) over a large part ofSeptember. At the beginning of the season, highdaily maximum temperatures similar to thoseexpected during summer are recorded, howeverby the end of the season Tmin falls to winterlevels, causing an increased ETR.
4.2 Total number of frost days(Tn < 0 �C), Fd
According to Frich et al (2002), a uniformdecrease in the number of frost days has occurredduring the second half of the 20th century. Never-theless, in their study, a few increases are distin-guishable over the Balkan Peninsula. Indices forthe annual and seasonal (DJF, MAM and SON)number of frost days have been calculated. Thelarger and more significant trends were revealedin the annual scale changes (not shown). Thearea around Serbia and Montenegro features sig-nificant positive trends of the order of 4–6 daysper decade. A few positive trends can also befound in western and southern Greece. Con-versely, significant negative trends in the annualoccurrence of frost days are found over Italywhich is consistent with the findings of Frichet al (2002). It is worth emphasising the autumn
Fig. 2. Decadal trends in the intra-seasonal extreme temperature range for the four conventional seasons of the year. Filledcircles reflect trends statistically significant at the 95% level. Black circles indicate reduced ranges, with grey increased ranges
74 E. Kostopoulou and P. D. Jones
situation when increases in the number of frostdays are observed throughout the eastern Medi-terranean. However, most trends are not statisti-cally significant with the exception of some overBulgaria and Romania.
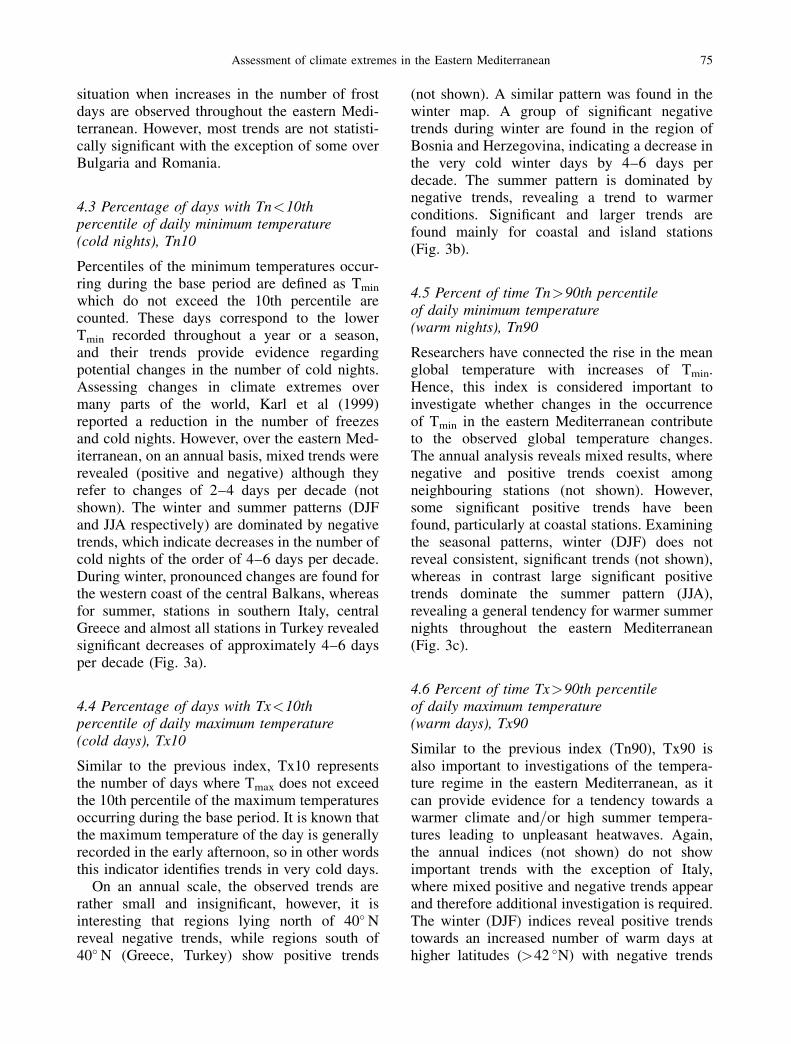
4.3 Percentage of days with Tn<10thpercentile of daily minimum temperature(cold nights), Tn10
Percentiles of the minimum temperatures occur-ring during the base period are defined as Tmin
which do not exceed the 10th percentile arecounted. These days correspond to the lowerTmin recorded throughout a year or a season,and their trends provide evidence regardingpotential changes in the number of cold nights.Assessing changes in climate extremes overmany parts of the world, Karl et al (1999)reported a reduction in the number of freezesand cold nights. However, over the eastern Med-iterranean, on an annual basis, mixed trends wererevealed (positive and negative) although theyrefer to changes of 2–4 days per decade (notshown). The winter and summer patterns (DJFand JJA respectively) are dominated by negativetrends, which indicate decreases in the number ofcold nights of the order of 4–6 days per decade.During winter, pronounced changes are found forthe western coast of the central Balkans, whereasfor summer, stations in southern Italy, centralGreece and almost all stations in Turkey revealedsignificant decreases of approximately 4–6 daysper decade (Fig. 3a).
4.4 Percentage of days with Tx<10thpercentile of daily maximum temperature(cold days), Tx10
Similar to the previous index, Tx10 representsthe number of days where Tmax does not exceedthe 10th percentile of the maximum temperaturesoccurring during the base period. It is known thatthe maximum temperature of the day is generallyrecorded in the early afternoon, so in other wordsthis indicator identifies trends in very cold days.
On an annual scale, the observed trends arerather small and insignificant, however, it isinteresting that regions lying north of 40� Nreveal negative trends, while regions south of40� N (Greece, Turkey) show positive trends
(not shown). A similar pattern was found in thewinter map. A group of significant negativetrends during winter are found in the region ofBosnia and Herzegovina, indicating a decrease inthe very cold winter days by 4–6 days perdecade. The summer pattern is dominated bynegative trends, revealing a trend to warmerconditions. Significant and larger trends arefound mainly for coastal and island stations(Fig. 3b).
4.5 Percent of time Tn>90th percentileof daily minimum temperature(warm nights), Tn90
Researchers have connected the rise in the meanglobal temperature with increases of Tmin.Hence, this index is considered important toinvestigate whether changes in the occurrenceof Tmin in the eastern Mediterranean contributeto the observed global temperature changes.The annual analysis reveals mixed results, wherenegative and positive trends coexist amongneighbouring stations (not shown). However,some significant positive trends have beenfound, particularly at coastal stations. Examiningthe seasonal patterns, winter (DJF) does notreveal consistent, significant trends (not shown),whereas in contrast large significant positivetrends dominate the summer pattern (JJA),revealing a general tendency for warmer summernights throughout the eastern Mediterranean(Fig. 3c).
4.6 Percent of time Tx>90th percentileof daily maximum temperature(warm days), Tx90
Similar to the previous index (Tn90), Tx90 isalso important to investigations of the tempera-ture regime in the eastern Mediterranean, as itcan provide evidence for a tendency towards awarmer climate and=or high summer tempera-tures leading to unpleasant heatwaves. Again,the annual indices (not shown) do not showimportant trends with the exception of Italy,where mixed positive and negative trends appearand therefore additional investigation is required.The winter (DJF) indices reveal positive trendstowards an increased number of warm days athigher latitudes (>42 �N) with negative trends
Assessment of climate extremes in the Eastern Mediterranean 75

for southern latitudes, although only a fewstations show significant negative trends (notshown). Finally, the strongest Tx90 patternwas found for the warm season (JJA, Fig. 3d).Positive trends dominate across the easternMediterranean indicating increases in the numberof very warm days. The results from this indexare consistent with those of Tn90, which revealedan increased number of warm nights over thestudy region during the warm season.
4.7 Heat wave duration index, HWDI
Here, the index is based only on temperature andidentifies changes in the number of days, oversequences of six days or more, where the tem-perature is 5 �C greater than the normal for the1961–1990 period. Both annual and seasonal
(JJA) analyses reveal that positive trends domi-nate the HWDI maps with the exception of smallinsignificant negative trends for coastal andisland stations (Fig. 4). The greater trends arefound in the central Balkan countries and north-ern Italy. Although not all trends are statisticallysignificant, they suggest an increase of 2–3 daysper decade. The 5 �C threshold is found to be toolarge for the coastal stations and possibly theestimation of the HWDI using a percentilemethod is probably more appropriate.
5. Trends in precipitation climate extremes
With respect to precipitation, eight indices havebeen chosen to investigate changes in the trendsof precipitation extremes in the study region. Themain part of rainfall in the Mediterranean region
Fig. 3. Decadal trends in the number of days in summer with (a) Tmin less than the 10th percentile, (b) Tmax less than the 10thpercentile, (c) Tmin greater than the 90th percentile, (d) Tmax greater than the 90th percentile. Filled circles reflect trendsstatistically significant at the 95% level. Black circles indicate warming trends, with grey indicating cooling trends
76 E. Kostopoulou and P. D. Jones

occurs during the cold season of the year (Barryand Chorley, 1999), consequently, as the easternMediterranean is the focus of this study, trendmaps on an annual and winter (DJF) basis willbe mainly discussed.
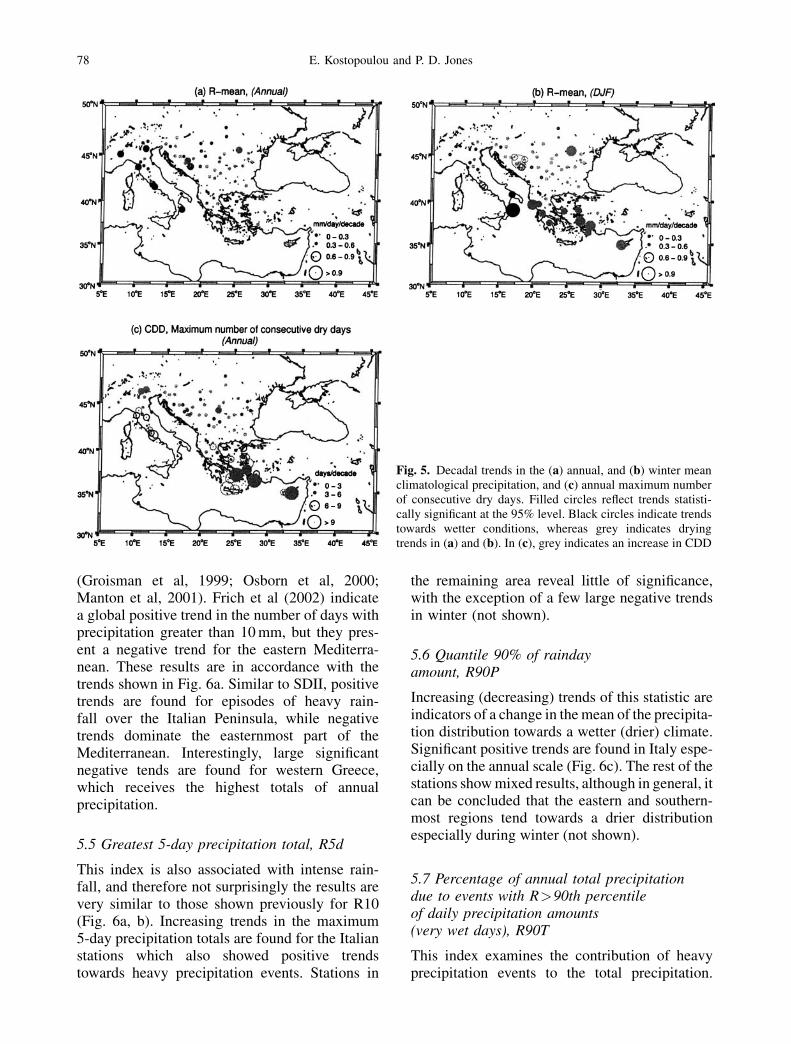
5.1 Mean climatologicalprecipitation, Rmean
The mean climatological precipitation is animportant indicator of change of the normalmoisture availability within a region. It wasreported earlier that this is a sensitive issue forsouthern European regions which are threatenedby desertification (Grove, 1986). The annual andwinter (DJF) trend maps divide the study regioninto two areas. The western part (including Italy)shows tendencies for wetter conditions particu-larly on an annual basis (Fig. 5a), whereas
in the eastern part (Balkan Peninsula, Cyprusand western Turkey) almost all stations showdecreased precipitation which is especially largeand significant during winter in the Greek,Cypriot and Turkish stations (Fig. 5b).
5.2 Simple daily intensity index, SDII
Scenarios, related to a future changed climate,report increases in heavy precipitation events(IPCC, 2001a, b). The SDII is particularly de-fined to examine such tendencies, as it monitorsprecipitation intensity on wet days. Frich et al(2002) stated that SDII has increased in manyparts of the world (e.g., parts of Europe, SouthAfrica, USA and Australia). They show signifi-cant positive trends over Italy but decreases overthe eastern Mediterranean. Similar results wererevealed in this study using a greater number ofstations across the region than the Frich et al(2002) study. Large-positive statistically signifi-cant trends appear in most Italian stations forboth the annual and winter (DJF) analyses (notshown). Conversely, the easternmost part of theMediterranean is dominated by negative trends inSDII but only a few of them are found to bestatistically significant.
5.3 Maximum number of consecutivedry days (R<1mm), CDD
Desertification-related scenarios reveal a ten-dency towards drier climatic conditions in theeastern Mediterranean (Parry, 2000). Indeed,the calculated CDD annual index reflects in-creases in the number of consecutive dry days(Fig. 5c). Especially pronounced positive trendsare found for the islands of the Aegean Sea andfor Cyprus, highlighting the fact that southernMediterranean areas and especially the islandsare threatened by future drought and desertifica-tion (Brandt and Thornes, 1996).
5.4 Number of days with precipitation�10mm, R10
This index is directly related to intense precipita-tion events as it counts the number of dayswith heavy rainfall (�10 mm). Extreme precipi-tation has increased in many parts of the world
Fig. 4. Decadal trends in the annual and summer HWDI.Trend significance, circle sizes and colours as in Fig. 3
Assessment of climate extremes in the Eastern Mediterranean 77
(Groisman et al, 1999; Osborn et al, 2000;Manton et al, 2001). Frich et al (2002) indicatea global positive trend in the number of days withprecipitation greater than 10 mm, but they pres-ent a negative trend for the eastern Mediterra-nean. These results are in accordance with thetrends shown in Fig. 6a. Similar to SDII, positivetrends are found for episodes of heavy rain-fall over the Italian Peninsula, while negativetrends dominate the easternmost part of theMediterranean. Interestingly, large significantnegative tends are found for western Greece,which receives the highest totals of annualprecipitation.
5.5 Greatest 5-day precipitation total, R5d
This index is also associated with intense rain-fall, and therefore not surprisingly the results arevery similar to those shown previously for R10(Fig. 6a, b). Increasing trends in the maximum5-day precipitation totals are found for the Italianstations which also showed positive trendstowards heavy precipitation events. Stations in
the remaining area reveal little of significance,with the exception of a few large negative trendsin winter (not shown).
5.6 Quantile 90% of raindayamount, R90P
Increasing (decreasing) trends of this statistic areindicators of a change in the mean of the precipita-tion distribution towards a wetter (drier) climate.Significant positive trends are found in Italy espe-cially on the annual scale (Fig. 6c). The rest of thestations show mixed results, although in general, itcan be concluded that the eastern and southern-most regions tend towards a drier distributionespecially during winter (not shown).
5.7 Percentage of annual total precipitationdue to events with R>90th percentileof daily precipitation amounts(very wet days), R90T
This index examines the contribution of heavyprecipitation events to the total precipitation.
Fig. 5. Decadal trends in the (a) annual, and (b) winter meanclimatological precipitation, and (c) annual maximum numberof consecutive dry days. Filled circles reflect trends statisti-cally significant at the 95% level. Black circles indicate trendstowards wetter conditions, whereas grey indicates dryingtrends in (a) and (b). In (c), grey indicates an increase in CDD
78 E. Kostopoulou and P. D. Jones

As expected for Italy, large percentages of thetotal precipitation have been attributed to heavyprecipitation events and positive trends appear inthe trend maps (Fig. 6d). The western coast of thecentral Balkans resembles the Italian patternbut with weaker and less significant trends. TheGreek hinterland shows mainly negative trends incontrast to some Greek islands, coastal Turkishand Cypriot stations.
5.8 Number of events with precipitationamount greater than the 90th percentileof daily precipitation amount, R90N
This index complements the findings of the pre-vious indicator (R90T). A large percentage of theannual total precipitation due to extreme eventshas obviously been caused by a large number ofextreme precipitation events (R90N). Also in thispattern, large significant positive trends dominate
the Italian Peninsula, whereas the easternmostpart of the Mediterranean shows negative butmainly insignificant decreases in the number ofextreme precipitation events (not shown).
6. Investigation of trends in time seriesof anomalies of climate extremes indices
An attempt, here, has been made to definewhether significant trends appear in the timeseries of regional standardised anomalies forparticular climate extreme indices. The overallanomalies, over the eastern Mediterranean, werecalculated according to the method recom-mended by Frich et al (2002). Three temperatureand four precipitation related climate extremeindices were selected as the most significanttrends. To create regional-average anomaly timeseries, we standardised individual station seriesusing the climatological average and standard
Fig. 6. Decadal trends in the annual number of days with (a) heavy precipitation (>10 mm), (b) maximum 5-day precipitationtotal, (c) 90th percentile of wet days amounts and (d) precipitation fraction due to very wet days. Trend significance, circlesizes and colours as in Fig. 5a and b
Assessment of climate extremes in the Eastern Mediterranean 79

deviation of the base period (1961–1990). As allstations do not contain complete data, the region-al anomaly of a year or season was calculated byaveraging the anomaly value of the index foreach station divided by the number of the avail-able stations for that year. The time series figureswhich follow include an inset plot showing thenumber of stations available in each year.
For the temperature extreme indices studiedearlier, the most significant trends were identifiedfor both maximum and minimum temperatureexceeding the 90th percentile, especially duringthe warm season of the year. These two indices,along with the index for heatwave duration, areanalysed further to illustrate their evolution dur-ing the 43-yr study period (during the summermonths JJA). Least-squares linear regressionwas applied to determine trends with theStudent’s t-test to estimate their statisticalsignificance.
Figure 7a illustrates the course of the stan-dardised anomalies corresponding to HWDI.Although the study region has high temperatures
during summer, not many prolonged heatwaveswere recorded, according to the definition usedearlier. Negative anomalies tend to occur fromthe beginning of the study period until the endof the 1980s. Interestingly, the 1987 heatwavestands out as the most important feature of thisgraph and is larger than anomalies observed dur-ing the 1990s. A positive trend characterises thetime series, which was found to be statisticallysignificant at the 99% level. Increasing trends arealso shown for the TN90 and TX90 standardisedanomalies (Fig. 7b, c). These indices imply in-creases in the summer night-time and day-timetemperatures respectively, with the beginning ofthis increase starting roughly during the late1980s. Both trends were found to be statisticallysignificant at the 99% level.
Absence of spatial consistency characterisesthe majority of the precipitation indices cal-culated, which roughly divide the easternMediterranean into two halves. The western part(Italian stations) showed positive trends towardsincreased precipitation while the eastern part ofthe study region (Balkan Peninsula, Cyprus andTurkey) is characterised by negative trends indi-cating a trend towards a drier climate. The timeseries of the four precipitation indices were cre-ated and their trends were examined first for theentire study region and then for the two sub-regions. Utilising all the available stations aroundthe eastern Mediterranean a positive trend (sig-nificant at the 95% level) was defined for theSDII standardised anomalies (Fig. 8a). However,when the area is sub-divided into the western andeastern parts, a steep positive trend characterisesthe Italian time series (Fig. 8b) with the start ofthis remarkable increasing trend defined by thebeginning of the 1970s. In contrast, no trend isseen in the time series of the rest of the stations(Fig. 8c).
This contrast between the two Mediterraneanparts also becomes more obvious when examin-ing the intense precipitation index (greater than10 mm per day, R10). Figure 9a displays adecreasing trend over the whole of the easternMediterranean but this trend is not statisticallysignificant and has been partly obtained due tothe smaller number of stations over Italy and thewesternmost part of the study area. When thestudy region is divided into two parts, the differ-ent behaviour appears in the corresponding
Fig. 7. Time series of standardised anomalies of extremeindices of (a) HWDI, (b) TN90, and (c) TX90. Trendsestimated using linear regression. The small inset plotshows the number of available stations in each year. Plussesline corresponds to the 1958–2000 average
80 E. Kostopoulou and P. D. Jones

graphs (Fig. 9b and c). A positive trend domi-nates the Italian stations indicating increases inintense precipitation events. Over the eastern halfof the study region, negative anomalies startingaround the mid-1980s lead to a negative trend inthe R10 time series. Both trends are statisticallysignificant at the 99% level.
Similar characteristics are found in the graphsfor the value of the 90th percentile of wetdays (R90P). Over the entire region, the analysisreveals a positive trend, significant at the 95%level (Fig. 10a). Nevertheless, this trend ismainly caused by the Italian data which presenta sharp increase in intense precipitation eventsand raises the 90th percentile of wet days(Fig. 10b). This trend is significant at a high level(99%). In contrast, no trend can be seen in themost eastern stations of the basin (Fig. 10c).
The last climate extreme index, chosen toexamine the overall tendency along the easternMediterranean, refers to the number of eventswith precipitation greater than the 90th percentile(R90N). In this case also, the western and eastern
Fig. 10. As Fig. 8, except for the 90th percentile of wetdays amounts (R90P)
Fig. 8. Time series of the average standardised anomaliesof SDII for (a) all stations, (b) Italian stations, and (c)stations from the Balkan Peninsula, Turkey and Cyprus.The inset plot shows the number of available stations ineach year. Trend estimated using linear regression. Plussesline corresponds to the 1958–2000 average
Fig. 9. As Fig. 8, except for the number of days with heavyprecipitation (R10)
Assessment of climate extremes in the Eastern Mediterranean 81

parts of the domain of study behave in oppositemodes. Significant at the 99% level, an increasein these events has been found for the Italianregion (Fig. 11b), whereas a decrease in theseevents has been identified for the easternmostportion of the region, although this latter trendis not statistically significant (Fig. 11c).
7. Conclusions
Indications of a changing climate have recentlyled scientists to study weather and climateextremes. Studies performed at a global scale,based on observational (Easterling et al, 1997)or model data (Kattenberg et al, 1996) revealtendencies towards warming, mainly due toincreased Tmin, and hazardous weather events,including heatwaves and increases in intenserainfall able to cause catastrophic floods. Theneed for readily available daily data has beenunanimously agreed by the climate communityso that climate extreme analyses can be con-ducted. Most relevant studies emphasise thenecessity for data exchange and comment uponthe slow progress in many regions due to a lackof high quality daily data (Folland et al, 1999;Nicholls and Murray, 1999; Trenberth and Owen,
1999; Klein Tank et al, 2002; Peterson, 2002). Atthis point it is important to praise the recentefforts of the CCI=CLIVAR ETCCDMI (http:==cccma.seos.uvic.ca=ETCCDMI), where consider-able progress has been achieved in exchanginghigh quality indices in data sparse regions,through a series of regional workshops.
In this study, several climate extremes indiceswere calculated and their trends were presentedin map form. All the trends are based on the1958–2000 period. Longer records exist at themonthly timescale, but the daily data have notbeen digitised. The eastern Mediterranean regionpresents some opposing tendencies when com-pared to the global trends and also contrastingtrends within the region. In many areas of theworld the number of frost days has decreased(Karl et al, 1999), but many areas of the easternMediterranean showed significant increasingtrends in the frost day (Fd) index at the annualscale. The changes in Tmin are consistent with theglobal findings. Negative trends are found forvery cold nights, but the most significant trendswere revealed regarding warm conditions overthe study region. Increases in the HeatwaveDuration Index (HWDI) are found in stationssituated in continental areas and especiallyin the central Balkan countries. Increases wereobserved in the number of very warm nightsand days, which are especially pronounced dur-ing summer.
The extreme rainfall indices are characterisedby less spatial consistency and present a con-trasting trend between the western and theeastern halves of the study region. According tochanges at the global scale, many areas experi-ence increases in heavy precipitation events(Groisman et al, 1999; Frich et al, 2002). Suchresults were presented by Brunetti et al (2001)and Alpert et al (2002) for the central andwestern parts of the Mediterranean basin. Thispaper placed its emphasis on the broad easternMediterranean region, which includes part of thecentral Mediterranean (Italian Peninsula) and east-ern Mediterranean (Balkan Peninsula, westernTurkey and Cyprus). These two areas have con-trasting precipitation trends, with the westernpart showing positive trends towards increasedprecipitation, larger precipitation total amountsand increases in intense rainfall events. In con-trast, the easternmost side reveals generally nega-
Fig. 11. As Fig. 8, except for the number of events withprecipitation greater than the 90th percentile (R90N)
82 E. Kostopoulou and P. D. Jones

tive trends indicating tendencies towards a dryingclimate over time. This was seen especially atthe southern coastal and island stations, whichpresent large positive and significant trends inthe maximum number of consecutive dry days(CDD) index.
Appendix A
Definitions and equations of the indices used
(1) Intra-period extreme temperature range, ETRThe intra-period extreme temperature range is defined bythe difference between the highest absolute maximum andlowest minimum daily temperature of the seasonal=annualperiod. For example, the intra-annual extreme temperaturerange is calculated as the difference between the absolutemaximum summer temperature and the absolute minimumwinter temperature of the same calendar year, according tothe formula:
ETRj ¼ maxðTxijÞ � minðTnijÞ;
where Txij and Tnij are the daily maximum and minimumtemperature respectively, at day i of period j.
(2) Total number of frost days (Tn<0 �C), FdWhen the daily minimum temperature falls below zero, theday is characterized as a frost day. If Tnij is the daily mini-mum temperature on day i of period j, the frost day indexcounts all the days where
Tnij<0 �C:
(3) Percentage of days with Tn<10th percentile of dailyminimum temperature (cold nights), Tn10If Tnij corresponds to the daily minimum temperature for dayi of period j and Tnin10 is the calendar day 10th percentilefor a specified period (over the base period), then the per-centage of time with days not exceeding the 10th percentileis determined where
Tnij<Tnin10:
(4) Percentage of days with Tx<10th percentile of dailymaximum temperature (cold days), Tx10If Txij represents the daily maximum temperature for day i ofperiod j and Txin10 is the calendar day 10th percentile for aspecified period (over the base period), then the percentageof time with days not exceeding the 10th percentile is deter-mined where
Txij<Txin10:
(5) Percent of time Tn>90th percentile of daily minimumtemperature (warm nights), Tn90If Tnij is the daily minimum temperature for day i ofperiod j and Tnin90 the calendar day 90th percentile for aspecified period (over the base period), then the percen-tage of days exceeding the 90th percentile is determinedwhere
Tnij>Tnin90:
(6) Percent of time Tx>90th percentile of daily maximumtemperature (warm days), Tx90If Txij corresponds to the daily maximum temperature forday i of period j and Txin90 the calendar day 90th percentilefor a specified period (base period), then the percentage oftime with days exceeding the 90th percentile is determinedwhere
Txij>Txin90:
(7) Heat wave duration index, HWDIIf Txij represents the daily maximum temperature for day iof period j and Txinorm is the calendar day mean calculatedfor a 5-day window centred on each calendar day in thebase period, then the heatwave duration index counts alldays per period where, in intervals of at least 6 consecutivedays:
Txij>Txinorm þ 5:
(8) Mean climatological precipitation, Rmean
If Rij corresponds to the daily precipitation amount for day iof period j, then the mean climatological precipitation inperiod j is
Rmeanj ¼XI
i¼1
Rij=I
(9) Simple daily intensity index, SDIIIf Rwj represents the daily precipitation amount for a wet dayw (R � 1.0 mm) of period j, then the mean precipitationamount during wet days is
SDIIj ¼XW
w¼1
Rwj=W :
(10) Maximum number of consecutive dry days (R<1mm),CDDIf Rij represents the daily precipitation amount for day i ofperiod j, the index determines the maximum number of con-secutive days where
Rij<1 mm:
(11) Number of days with precipitation � 10mm, R10If Rij is the daily precipitation amount for day i of period j,the index determines the number of days where
Rij � 10 mm:
(12) Greatest 5-day precipitation total, R5dIf Rkj represents the precipitation amount for a five-dayinterval k of period j, where k is defined by the last day, thenthe maximum 5-day values for period j are
Rx5j ¼ maxðRkjÞ:(13) Quantile 90% of rainday amount, R90PThis index calculates the 90th percentile of rainday amountfor a specified base period.
(14) Percentage of annual total precipitation due to eventswith R>90th percentile of daily precipitation amounts (verywet days), R90TIf Rj is the sum of daily precipitation amount for period j andRwj is the daily precipitation amount for a wet day w(R� 1.0 mm) of period j and Rwj90 is the 90th percentile
Assessment of climate extremes in the Eastern Mediterranean 83

of precipitation on wet days in the base period, then R90Tj isdetermined as
R90Tj ¼ 100 �PW
w¼1 Rwj;
Rj
;
where Rwj>Rwj90.
(15) Number of events with precipitation amount greaterthan the 90th percentile of daily precipitation amount, R90NIf Rwj is the daily precipitation amount for wet day w(R � 1.0 mm) of period j and Rwj90 is the 90th percentileof precipitation during wet days in the base period, then thenumber of events is calculated by counting the number ofdays where
Rwj>Rwj90:
Acknowledgments
The authors would like to thank Clare Goodess, coordinatorof the STARDEX, for the provision of software from theproject and all the institutions who provided the station cli-matic data used in this study. Thanks also to the Greek StateScholarship Foundation for funding the E. Kostopouloustudentship.
References
Alpert P, Ben-Gai T, Baharad A, Benjamini Y, Yekutieli D,Colacino M, Diodato L, Ramis C, Homar V, Romero R,Michaelides S, Manes A (2002) The paradoxical increaseof Mediterranean extreme daily rainfall in spite of de-crease in total values. Geophys Res Lett 29: 311–314
Barry RG, Chorley RJ (1999) Atmosphere, weather andclimate. London New York: Routledge, 409 pp
Brandt J, Thornes J (eds) (1996) Mediterranean desertifica-tion and land use. London New York: Wiley, 554 pp
Brazdil R, Budıkova M, Auer I, B€oohm R, Cegnar T, Fa�ssko P,Lapin M, Gaji�cc-�CCapka M, Zaninovi�cc K, Koleva E,Nied�zzwied�zz T, Ustrnul Z, Szalai S, Weber RO (1996)Trends of maximum and minimum daily temperaturesin central and southeastern Europe. Int J Climatol 16:765–782
Brunetti M, Buffoni L, Maugeri M, Nanni T (2000)Trends of minimum and maximum daily temperaturesin Italy from 1865 to 1996. Theor Appl Climatol 66:49–60
Brunetti M, Colacino M, Maugeri M, Nanni T (2001) Trendsin the daily intensity of precipitation in Italy from 1951 to1996. Int J Climatol 21: 299–316
Easterling DR, Horton B, Jones PD, Peterson TC, Karl TR,Parker DE, Salinger MJ, Razuvayev V, Plummer N,Jamason P, Folland CK (1997) Maximum and minimumtemperature trends for the globe. Science 277: 364–367
Easterling DR, Alexander LV, Mokssit A, Detemmerman V(2003) CCL=CLIVAR workshop to develop priority cli-mate indices. Bull Amer Meteorol Soc 84: 1403–1407
Folland CK, Miller C, Bader D, Crowe M, Jones P, PlummerN, Richman M, Parker DE, Rogers J, Scholefield P (1999)
Workshop on indices and indicators for climate extremes,Asheville, NC, USA, 3–6 June 1999: Breakout Group C:Temperature indices for climate extremes. Clim Change42: 31–43
Frich P, Alexander LV, Della-Marta P, Gleason B, HaylockM, Klein Tank AMG, Peterson T (2002) Observed coher-ent changes in climatic extremes during the second half ofthe twentieth century. Clim Res 19: 193–212
Groisman PY, Karl TR, Easterling DR, Knight RW, JamasonPF, Hennessy KJ, Suppiah R, Page CM, Wibig J,Fortuniak K, Razuvaev VN, Douglas A, Forland E, ZhaiPM (1999) Changes in the probability of heavy precipita-tion: Important indicators of climatic change. ClimChange 42: 243–283
Grove AT (1986) Desertification in southern Europe. ClimChange 9: 49–57
Gruza G, Rankova E, Razuvaev V, Bulygina O (1999)Indicators of climate change for the Russian Federation.Clim Change 42: 219–242
Hasanean HM (2001) Fluctuations of surface air temperaturein the Eastern Mediterranean. Theor Appl Climatol 68:75–87
Heino R, Brazdil R, Førland E, Tuomenvirta H,Alexandersson H, Beniston M, Pfister C, Rebetez M,Rosenhagen G, R€oosner S, Wibig J (1999) Progress inthe study of climatic extremes in Northern and CentralEurope. Clim Change 42: 151–181
Henderson KG, Muller RA (1997) Extreme temperaturedays in the south-central United States. Clim Res 8:151–162
IPCC (2001a) Climate Change 2001: The Scientific Basis.In: Contribution of Working Group I to the Third Assess-ment Report of the Intergovernmental Panel on ClimateChange (Houghton JT, Ding Y, Griggs DJ, Noguer M, vander Linden PJ, Dai X, Maskell K, Johnson CA, eds).Cambridge and New York: Cambridge University Press,881 pp
IPCC (2001b) Climate change 2001: Impacts, adaptationand vulnerability. In: Contribution of Working Group IIto the 3rd Assessment Report of the IntergovernmentalPanel on Climate Change (McCarthy JJ, Canziani OF,Leary NA, Dokken DJ, White KS, eds). Cambridgeand New York: Cambridge University Press, 1032 pp
Jones PD, Horton EB, Folland CK, Hulme M, Parker DE,Basnett TA (1999) The use of indices to identify changesin climatic extremes. Clim Change 42: 131–149
Karl TR, Easterling DR (1999) Climate extremes: Selectedreview and future research directions. Clim Change 42:309–325
Karl TR, Jones PD, Knight RW, Kukla G, Plummer N,Razuvayev V, Gallo KP, Lindseay J, Charlson RJ,Peterson TC (1993) A new perspective on recent globalwarming: Asymmetric trends of daily maximum and mini-mum temperatures. Bull Amer Meteor Soc 74: 1007–1023
Karl TR, Nicholls N, Ghazi A (1999) CLIVAR=GCOS=WMO Workshop on indices and indicators for climateextremes. Workshop summary. Clim Change 42: 3–7
Kattenberg A, Giorgi F, Grassl H, Meehl GA, Mitchell JFB,Stouffer RJ, Tokioka T, Weaver AJ, Wigley TML (1996)Climate models – projections of future climate. In:
84 E. Kostopoulou and P. D. Jones
Climate Change (1995) The science of climate change(Houghton JT, Filho LGM, Callander BA, Harris N,Kattenberg A, Maskell K, eds). Cambridge and NewYork: Cambridge University Press, 572 pp
Klein Tank AMG, Wijngaard JB, K€oonnen GP, B€oohm R,Demar�eee G, Gocheva A, Mileta M, Pashiardis S, HejkrlikL, Kern-Hansen C, Heino R, Bessemoulin P, M€uuller-Westermeier G, Tzanakou M, Szalai S, Palsd�oottir T,Fitzgerald D, Rubin S, Capaldo M, Maugeri M, LeitassA, Bukantis A, Aberfeld R, van Engelen AFV, Forland E,Mietus M, Coelho F, Mares C, Razuvaev V, Nieplova E,Cegnar T, L�oopez JA, Dahlstr€oom B, Moberg A, KirchhoferW, Ceylan A, Pachaliuk O, Alexander LV, Petrovic P(2002) Daily dataset of 20th-century surface air tempera-ture and precipitation series for the European ClimateAssessment. Int J Climatol 22: 1441–1453
Kostopoulou E (2003) The relationships between atmo-spheric circulation patterns and surface climatic elementsin the eastern Mediterranean. University of East Anglia,Ph.D. thesis, 407 pp
Kutiel H, Maheras P, Guika S (1996) Circulation andextreme rainfall conditions in the eastern Mediterraneanduring the last century. Int J Climatol 16: 73–92
Manton MJ, Della-Marta PM, Haylock MR, Hennessy KJ,Nicholls N, Chambers LE, Collins DA, Daw G, Finet A,Gunawan D, Inape K, Isobe H, Kestin TS, Lefale P, LeyuCH, Lwin T, Maitrepierre L, Ouprasitwong N, Page CM,Pahalad J, Plummer N, Salinger MJ, Suppiah R, Tran VL,Trewin B, Tibig I, Yee D (2001) Trends in extreme dailyrainfall and temperature in Southeast Asia and the SouthPacific: 1961–1998. Int J Climatol 21: 269–284
Martin-Vide J, Gomez L (1999) Regionalization of penin-sular Spain based on the length of dry spells. Int J Climatol19: 537–555
Moonen AC, Ercoli L, Mariotti M, Masoni A (2002) Climatechange in Italy indicated by agrometeorological indicesover 122 years. Agric Forest Meteor 111: 13–27
Nicholls N, Murray W (1999) Workshop on indices andindicators for climate extremes, Asheville, NC, USA,3–6 June 1999: Breakout Group B: Precipitation. ClimChange 42: 23–29
Osborn TJ, Hulme M, Jones PD, Basnett TA (2000)Observed trends in the daily intensity of United Kingdomprecipitation. Int J Climatol 20: 347–364
Parker DE, Jones PD, Folland CK, Bevan A (1994) Inter-decadal changes of surface temperature since the latenineteenth century. J Geophys Res 99: 14,373–14,399
Parry ML (ed) (2000) Assessment of potential effects andadaptations for climate change in Europe: The EuropeACACIA Project. Norwich: Jackson Environment Insti-tute, University of East Anglia, 320 pp
Peterson TC (2002) Temperature data issues. IPCC work-shop on changes in extreme weather and climateevents. Beijing, China 11–13 June 2002. Workshopreport, 107 pp
Plummer N, Salinger MJ, Nicholls N, Suppiah R, HennessyKJ, Leighton RT, Trewin B, Page CM, Lough JM (1999)Changes in climate extremes over the Australian regionand New Zealand during the twentieth century. ClimChange 42: 183–202
Romero R, Ramis C, Guijarro JA (1999) Daily rainfallpatterns in the Spanish Mediterranean area: An objectiveclassification. Int J Climatol 19: 95–112
Sahsamanoglou H, Makrogiannis T (1992) Temperaturetrends over the Mediterranean region, 1950–88. TheorAppl Climatol 45: 183–192
Subak S, Palutikof JP, Agnew MD, Watson SJ, Bentham CG,Cannell MGR, Hulme M, McNally S, Thornes JE,Waughray D, Woods JC (2000) The impact of the anom-alous weather of 1995 on the UK economy. Clim Change44: 1–26
Trenberth KE, Owen TW (1999) Workshop on indices andindicators for climate extremes, Asheville, NC, USA, 3–6June 1999: Breakout Group A: Storms. Clim Change 42:9–21
T€uurkes� M (1998) Influence of geopotential heights, cyclonefrequency and Southern oscillation on rainfall variationsin Turkey. Int J Climatol 18: 649–680
T€uurkes� M, S€uumer UM, Demır I (2002) Re-evaluation oftrends and changes in mean, maximum and minimumtemperatures of Turkey for the period 1929–1999. Int JClimatol 22: 947–978
Wilks DS (1995) Statistical methods in the atmosphericsciences: An introduction. San Diego, CA: AcademicPress, 467 pp
WISE (1999) Workshop on economic and socialimpacts of climate extremes: Risks and benefits, 14–16October 1999. Overview document ENV4-CT97-0448,Amsterdam, 39 pp
WMO (1986) Guidelines on the quality control of SurfaceClimatological Data (Prepared by Abbott PF, UK asRapporteur in the WMO Commission for Climatology).Technical document no. 111. Series: WCP-85, 72 pp
Xoplaki E (2002) Climate variability over the Mediterra-nean. Universit€aat Bern, Ph.D. thesis, 191 pp
Zhang X, Hegerl G, Zwiers FW, Kenyon J (2005) Avoidinginhomogeneity in percentile-based indices of temperatureextremes. J Climate (in press)
Corresponding author’s address: P. D. Jones, ClimaticResearch Unit, University of East Anglia, UK (E-mail:[email protected])
Assessment of climate extremes in the Eastern Mediterranean 85