assessment of contaminants associated with coal bed ... · assessment of contaminants associated...
TRANSCRIPT

Assessment of Contaminants Associated withCoal Bed Methane-Produced Water and Its Suitability for
Wetland Creation or Enhancement Projects
Contaminant Report Number: R6/721C/05
U.S. FISH & WILDLIFE SERVICEREGION 6
CONTAMINANTS PROGRAM

USFWS - Region 6 - EC Report - R6/721C/05
i
ABSTRACT
Extraction of methane gas from coal seams has become a significant energy source in the PowderRiver Basin of northeastern Wyoming. In Wyoming, coalbed methane (CBM) gas is extracted bydrilling wells into coal seams and removing water to release the gas. Each CBM well produces anaverage of 10 gallons per minute (gpm) of water and a maximum of 100 gpm. Disposal of CBMproduced water is accomplished by direct discharge to surface drainages, and also by a variety ofother treatment and disposal methods. Untreated CBM produced water discharged to surfacedrainages is the primary method of disposal provided that the CBM produced water meets Wyomingwater quality standards. Water failing to meet water quality standards cannot legally be dischargedinto surface drainages and is alternately discharged into closed containment ponds for soil-groundwater infiltration and evaporation. In 2000 and 2001, we collected and analyzed water from CBMdischarges and receiving waters and sediment and biota from CBM produced water impoundments.In 2002, we collected and analyzed water from CBM closed containment impoundments. All thesamples were analyzed for trace elements. The biota included pondweed (Potamogeton vaginatus),aquatic invertebrates, fish, and tiger salamanders (Ambystoma tigrinum). One CBM produced waterdischarge exceeded the chronic criterion for iron and several CBM produced water dischargesexceeded the acute criterion for copper. Terminal sinks receiving CBM produced water have thepotential for the eventual increase in trace element concentrations in water, sediment and wildlifedietary items such as pondweed and aquatic invertebrates. Waterborne copper, iron, lead, andmanganese exceeded chronic criteria in several impoundments receiving CBM produced water.Arsenic, cadmium, nickel, and zinc in sediments from a terminal sink receiving CBM produced waterexceeded the threshold effects concentrations for sediment-dwelling organisms. Cadmium andchromium in aquatic invertebrates and pondweed, respectively, from terminal sink sites wereelevated. Waterborne selenium concentrations in six of the seven closed containment impoundmentsand all seven associated CBM discharges ranged from 2.2 to 8.4 :g/L, exceeding the 2 :g/Lthreshold for bioaccumulation in sensitive species of fish and aquatic birds. Closed containmentponds containing high selenium water may present a risk to aquatic birds using these ponds if theponds provide a dietary route of exposure through submerged aquatic vegetation or aquaticinvertebrates. CBM operators, land managers, and landowners should evaluate the disposal optionsfor CBM produced water on a site by site basis to prevent adverse impacts on soils, groundwater, andsurface water as well as fish and wildlife and their habitats.
Acknowledgments: Thanks are extended to Colleen Cunningham and Brad Rogers for assistancewith field work as well as the numerous CBM operators and landowners for access to the CBMproduction sites. Thanks are also extended to George T. Allen, Brian Cain, Brian T. Kelly, JohnWegrzyn and Everett Wilson of the U.S. Fish and Wildlife for reviewing the manuscript. This studywas funded by the U.S. Fish and Wildlife Service, Environmental Contaminants Program (Project # 00-6-6F43-FC).
USFWS - Region 6 - EC Report - R6/721C/05
ii
TABLE OF CONTENTS
INTRODUCTION . . . . . . . . . . . . . . . . . . . . . . . . . . . . . . . . . . . . . . . . . . . . . . . . . . . . . . . . . . . . . 1
STUDY AREA . . . . . . . . . . . . . . . . . . . . . . . . . . . . . . . . . . . . . . . . . . . . . . . . . . . . . . . . . . . . . . 13
METHODS . . . . . . . . . . . . . . . . . . . . . . . . . . . . . . . . . . . . . . . . . . . . . . . . . . . . . . . . . . . . . . . . . 16
RESULTS . . . . . . . . . . . . . . . . . . . . . . . . . . . . . . . . . . . . . . . . . . . . . . . . . . . . . . . . . . . . . . . . . . 18Water in Wetlands and Associated CBM Discharges . . . . . . . . . . . . . . . . . . . . . . . . . . . 18Water in Closed Containment Impoundments and Associated Discharges . . . . . . . . . . . 18Sediment . . . . . . . . . . . . . . . . . . . . . . . . . . . . . . . . . . . . . . . . . . . . . . . . . . . . . . . . . . . . . . 19Aquatic Vegetation . . . . . . . . . . . . . . . . . . . . . . . . . . . . . . . . . . . . . . . . . . . . . . . . . . . . . . 19Aquatic Invertebrates . . . . . . . . . . . . . . . . . . . . . . . . . . . . . . . . . . . . . . . . . . . . . . . . . . . . 20Fish . . . . . . . . . . . . . . . . . . . . . . . . . . . . . . . . . . . . . . . . . . . . . . . . . . . . . . . . . . . . . . . . . . 20Tiger Salamanders . . . . . . . . . . . . . . . . . . . . . . . . . . . . . . . . . . . . . . . . . . . . . . . . . . . . . . 20
DISCUSSION . . . . . . . . . . . . . . . . . . . . . . . . . . . . . . . . . . . . . . . . . . . . . . . . . . . . . . . . . . . . . . . 23
MANAGEMENT RECOMMENDATIONS . . . . . . . . . . . . . . . . . . . . . . . . . . . . . . . . . . . . . . . . 26
LITERATURE CITED . . . . . . . . . . . . . . . . . . . . . . . . . . . . . . . . . . . . . . . . . . . . . . . . . . . . . . . . 28
APPENDICES . . . . . . . . . . . . . . . . . . . . . . . . . . . . . . . . . . . . . . . . . . . . . . . . . . . . . . . . . . . . . . . 31

USFWS - Region 6 - EC Report - R6/721C/05
iii
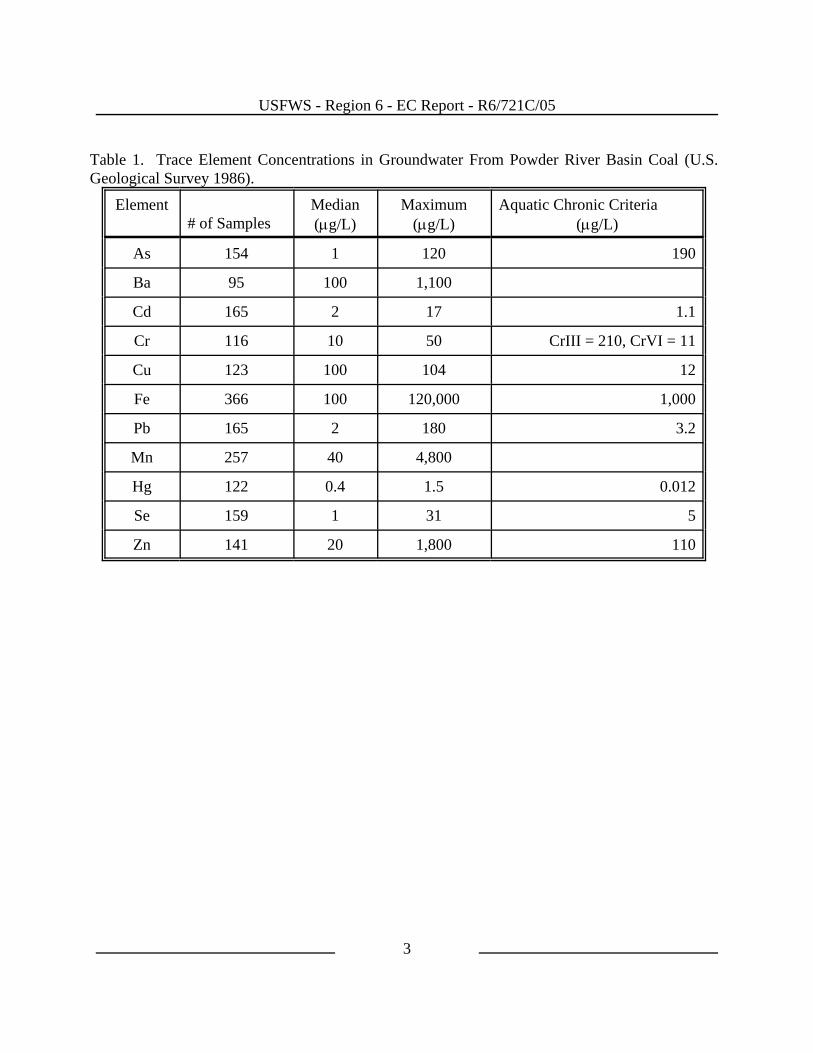
TABLESTable 1. Trace Element Concentrations in Groundwater From Powder River Basin Coal (U.S.
Geological Survey 1986). . . . . . . . . . . . . . . . . . . . . . . . . . . . . . . . . . . . . . . . . . . . . . . . . . . 3Table 2. Sampling locations for the coalbed methane produced water study in the Powder River
Basin, Wyoming. . . . . . . . . . . . . . . . . . . . . . . . . . . . . . . . . . . . . . . . . . . . . . . . . . . . . . . . 14Table 3. Concentrations of copper, iron, lead, and manganese (in :g/L) in water from coalbed
methane produced water discharges and receiving wetlands in Sheridan and Campbellcounties, Wyoming (2000-2001). . . . . . . . . . . . . . . . . . . . . . . . . . . . . . . . . . . . . . . . . . . . 19
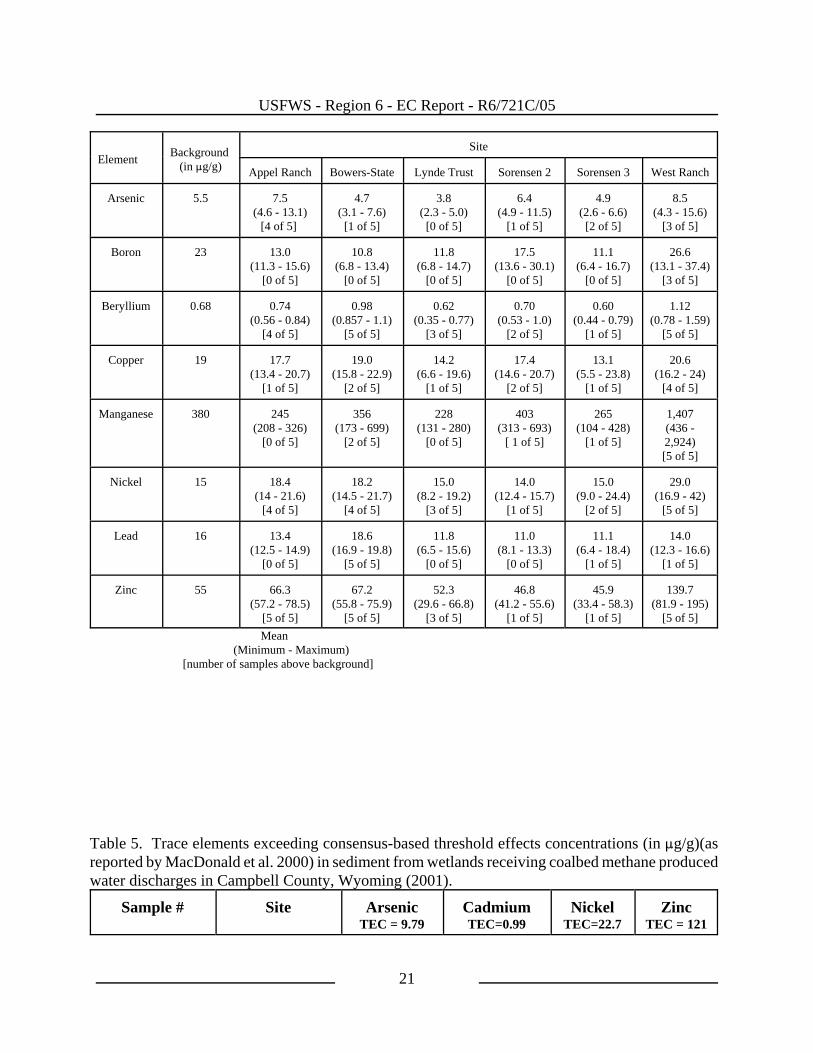
Table 4. Trace element concentrations (mean and range) in :g/g, and the proportions that exceededbackground concentrations (as reported by Shacklette and Boerngen 1984) in sediment fromwetlands receiving coalbed methane produced water discharges in Campbell County,Wyoming (2001). . . . . . . . . . . . . . . . . . . . . . . . . . . . . . . . . . . . . . . . . . . . . . . . . . . . . . . . 21
Table 5. Trace elements exceeding threshold effects concentrations (in :g/g)(as reported by Ingersolland MacDonald 2002) in sediment from wetlands receiving coalbed methane produced waterdischarges in Campbell County, Wyoming (2001). . . . . . . . . . . . . . . . . . . . . . . . . . . . . . 22
Table 6. Boron concentrations (in :g/g) in submerged aquatic vegetation collected from wetlandsreceiving coalbed methane produced water discharges in Campbell County, Wyoming (2001).
. . . . . . . . . . . . . . . . . . . . . . . . . . . . . . . . . . . . . . . . . . . . . . . . . . . . . . . . . . . . . . . . . . . . . 22
APPENDIX A - Trace elements (in :g/L) in water collected in 2000 from coal bed methane (CBM)produced water discharges in the Powder River Basin, Wyoming. . . . . . . . . . . . . . . . . . 32
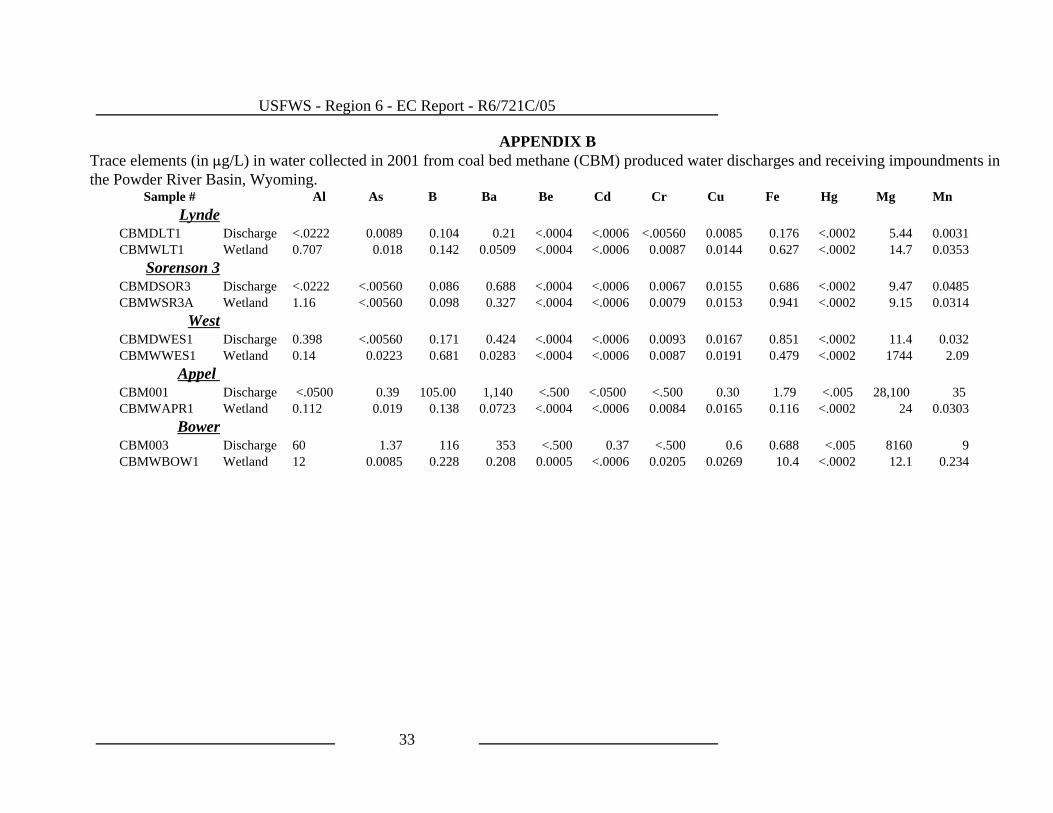
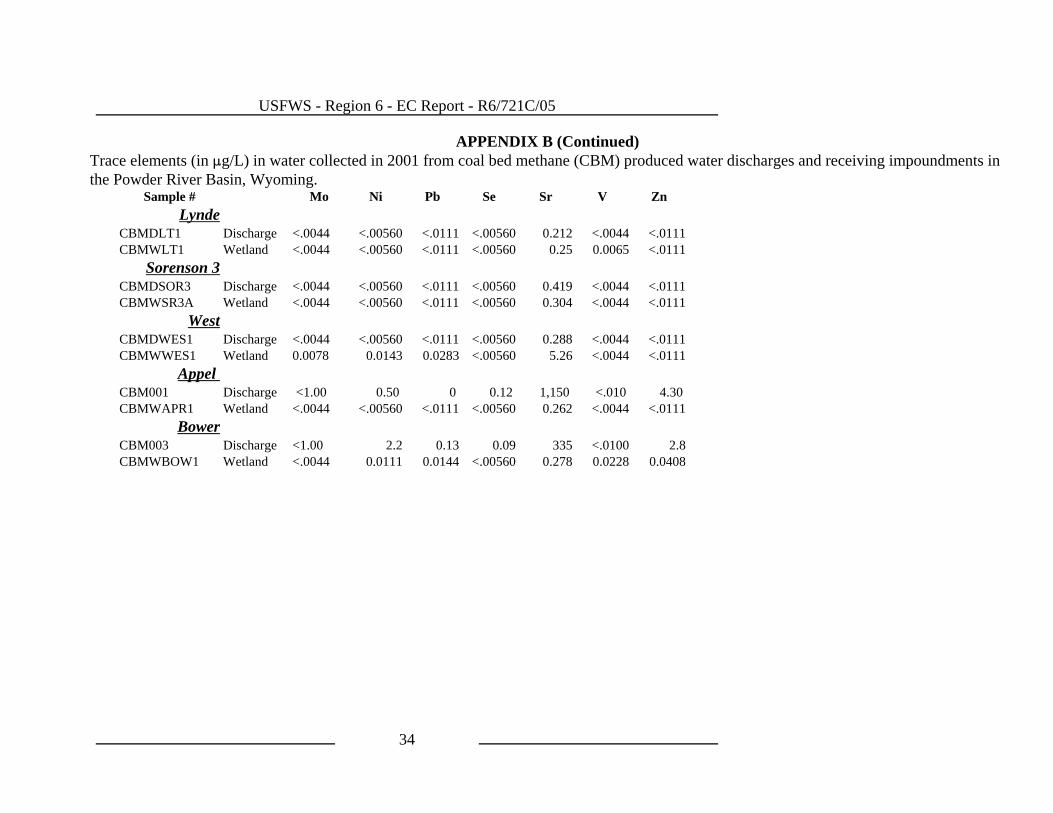
APPENDIX B - Trace elements (in :g/L) in water collected in 2001 from coal bed methane (CBM)produced water discharges and receiving impoundments in the Powder River Basin,Wyoming. . . . . . . . . . . . . . . . . . . . . . . . . . . . . . . . . . . . . . . . . . . . . . . . . . . . . . . . . . . . . . 33
APPENDIX C - Trace elements (in :g/L), electrical conductivity (EC)(in :S/cm), and total dissolvedsolids (TDS) in coal bed methane (CBM) produced water collected from closed containmentreservoirs and associated CBM discharges . . . . . . . . . . . . . . . . . . . . . . . . . . . . . . . . . . . 35
APPENDIX D - Trace elements (in :g/g dry weight) in sediment collected in July 2001 fromimpoundments receiving coal bed methane (CBM) produced water discharges in the PowderRiver Basin, Wyoming. . . . . . . . . . . . . . . . . . . . . . . . . . . . . . . . . . . . . . . . . . . . . . . . . . . 38
APPENDIX E - Trace elements (in :g/g dry weight) in aquatic vegetation collected in July 2001from impoundments receiving coal bed methane (CBM) produced water discharges in thePowder River Basin, Wyoming. . . . . . . . . . . . . . . . . . . . . . . . . . . . . . . . . . . . . . . . . . . . . 41
APPENDIX F - Trace elements (in :g/g dry weight) in aquatic invertebrates collected in July 2001from impoundments receiving coal bed methane (CBM) produced water discharges in thePowder River Basin, Wyoming. . . . . . . . . . . . . . . . . . . . . . . . . . . . . . . . . . . . . . . . . . . . . 43
APPENDIX G - Trace elements (in :g/g dry weight) in tiger salamanders collected in July 2001 fromimpoundments receiving coal bed methane (CBM) produced water discharges in the PowderRiver Basin, Wyoming. . . . . . . . . . . . . . . . . . . . . . . . . . . . . . . . . . . . . . . . . . . . . . . . . . . 44
APPENDIX H - Trace elements (in :g/g dry weight) in whole-body fish collected in July 2001 fromtwo impoundments receiving coal bed methane (CBM) produced water discharges in thePowder River Basin, Wyoming. . . . . . . . . . . . . . . . . . . . . . . . . . . . . . . . . . . . . . . . . . . . . 45

USFWS - Region 6 - EC Report - R6/721C/05
iv
FIGURES
Figure 1. Schematic drawing of a typical coalbed methane well. (Drawing courtesy of the CoalbedMethane Coordination Coalition, Buffalo, WY. ( http://www.cbmcc.vcn.com/) . . . . . . . 1
Figure 2. Coalbed methane produced water discharges in the Powder River Basin, Wyoming. . 4Figure 3. Marine Cretaceous shale formations within the Powder River Basin, Wyoming typically
contain elevated concentrations of selenium. . . . . . . . . . . . . . . . . . . . . . . . . . . . . . . . . . . . 5Figure 4. Electrical conductivity (in :S/cm) in water from coalbed methane wells in the Powder
River Basin, Wyoming (from Cindy Rice, U.S. Geological Survey, Denver, Colorado,personal communications, February 2004. . . . . . . . . . . . . . . . . . . . . . . . . . . . . . . . . . . . . . 9
Figure 5. Sodium (in mg/L) in water from coalbed methane wells in the Powder River Basin,Wyoming (from Cindy Rice, U.S. Geological Survey, Denver, Colorado, personalcommunications, February 2004). . . . . . . . . . . . . . . . . . . . . . . . . . . . . . . . . . . . . . . . . . . 10
Figure 6. Sodium adsorption ratio (SAR) in water from coalbed methane wells in the Powder RiverBasin, Wyoming (from Cindy Rice, U.S. Geological Survey, Denver, Colorado, personalcommunications, February 2004). . . . . . . . . . . . . . . . . . . . . . . . . . . . . . . . . . . . . . . . . . . 11
Figure 7. Total dissolved solids (in mg/L) in water from coalbed methane wells in the Powder RiverBasin, Wyoming. . . . . . . . . . . . . . . . . . . . . . . . . . . . . . . . . . . . . . . . . . . . . . . . . . . . . . . . 12
Figure 8. Location of study area and sample sites in the Powder River Basin, Wyoming. . . . . 13

USFWS - Region 6 - EC Report - R6/721C/05
1
Figure 1. Schematic drawing of a typical coalbed methane well. (Drawing courtesy of the Coalbed Methane Coordination Coalition, Buffalo, WY. ( http://www.cbmcc.vcn.com/)
INTRODUCTION
The extraction of methane gas from coal seams has become a significant energy source in the PowderRiver Basin (PRB) of Northeastern Wyoming. From 1976 to 1996 1,169 coal bed methane (CBM)wells were drilled in the PRB. In 2001 the PRB had 4,000 CBM wells in production (US BLM2003). Over 39,000 CBM wells are scheduled to be drilled in the PRB by 2012 (US BLM 2003).Coal seams can contain up to 6 or 7 times more methane gas than conventional natural gas rockformations (U.S. Geological Survey 1997). In Wyoming, CBM gas is extracted by drilling wells intoa coal seam and removing water to release the gas (Figure 1).

USFWS - Region 6 - EC Report - R6/721C/05
2
CBM wells produce an average of 10 gallons of water per minute (gpm) or 0.02 cubic feet per second(cfs) with a maximum of 100 gpm or 0.2 cfs (US BLM 2003). An annual average of 28,014 acre-feetof CBM produced water is expected to be discharged in the PRB from 2002 to 2017 (US BLM 2003).CBM produced water is disposed of by direct discharge to surface drainages, passive treatment priorto surface discharge, discharge to upland and bottomland infiltration impoundments, discharge tocontainment impoundments, and deep well injection. Untreated discharge to surface drainages is theprimary method of disposal provided that the CBM produced water meets Wyoming water qualitystandards. Each CBM produced water discharge receives water from five wells. Currently,approximately 3,800 CBM produced water discharge outfalls are permitted by the WyomingDepartment of Environmental Quality (WDEQ) through the National Pollutant Discharge EliminationSystem (NPDES) (Figure 2). Water that does not meet water quality standards cannot be dischargedinto surface drainages and is usually discharged into closed containment ponds for infiltration andevaporation. NPDES permitees are required to monitor CBM produced water permitted dischargesfor total petroleum hydrocarbons, specific conductance and pH every 6 months. Radium-226, totaliron, total manganese, total barium, and chloride are monitored annually.
Some private landowners use CBM produced water to maintain adequate water levels in stock ponds(Bureau of Land Management 1997). The Fish and Wildlife Service (FWS) Partners for WildlifeProgram, Bureau of Land Management (BLM), U.S. Forest Service (USFS), and the Wyoming Gameand Fish Department (WGFD) are interested in using CBM produced water for wetland creation andenhancement. An assessment of contaminant risks and impacts from CBM produced water isnecessary to assist land managers with the planning of these wetland projects. We conducted thisstudy from 2000 to 2002 to identify contaminant risks to aquatic organisms and aquatic migratorybirds from the creation/enhancement of wetlands with CBM produced water.
Table 1 lists trace elements detected in coal seams considered for CBM gas development and showswaterborne selenium in groundwater associated with coal seams ranged up to 31 µg/L. Additionally,application of CBM produced water on soils derived from marine Cretaceous shales can mobilizeselenium present in the soil. Selenium contamination and subsequent bioaccumulation in fish andwildlife is likely to occur in areas with: selenium sources, such as seleniferous soils or underlyinggeologic formations; high evaporation rates (> 2.5 x the precipitation rate); and topographicallyclosed drainage basins, such as closed containment reservoirs or playas used for wastewater disposal(Seiler 1995). Marine Cretaceous shales occur primarily in the eastern and western boundaries ofthe PRB (Figure 3).
The WDEQ aquatic life chronic criterion of 5 µg/L (parts per billion) selenium is not adequate forpreventing adverse effects on fish and aquatic birds. Several scientific experts on selenium haverecommended a 2 µg/L criterion because concentrations exceeding 2 µg/L may create abioaccumulation risk for fish and sensitive species of aquatic birds (Hamilton 2002, Skorupa andOhlendorf 1991; Lemly 1993). Discharge of produced water containing selenium greater than 2 µg/Lalso can result in impacts to fish and aquatic birds inhabiting downstream receiving waters.
USFWS - Region 6 - EC Report - R6/721C/05
3
Table 1. Trace Element Concentrations in Groundwater From Powder River Basin Coal (U.S.Geological Survey 1986).
Element# of Samples
Median(µg/L)
Maximum(µg/L)
Aquatic Chronic Criteria(µg/L)
As 154 1 120 190
Ba 95 100 1,100
Cd 165 2 17 1.1
Cr 116 10 50 CrIII = 210, CrVI = 11
Cu 123 100 104 12
Fe 366 100 120,000 1,000
Pb 165 2 180 3.2
Mn 257 40 4,800
Hg 122 0.4 1.5 0.012
Se 159 1 31 5
Zn 141 20 1,800 110

USFWS - Region 6 - EC Report - R6/721C/05
4
Figure 2. Coalbed methane produced water discharges in the Powder River Basin, Wyoming.

USFWS - Region 6 - EC Report - R6/721C/05
5
Figure 3. Marine Cretaceous shale formations within the Powder River Basin, Wyoming typically containelevated concentrations of selenium.

USFWS - Region 6 - EC Report - R6/721C/05
6
Impoundment of streams receiving produced water tends to increase waterborne seleniumconcentrations through evaporative concentration and create a hazard for migratory aquatic birds.Fish also can bioaccumulate selenium directly from the water as well as from their diet. Top levelconsumers in aquatic systems, such as waterfowl can readily accumulate selenium concentrationsleading to low reproduction, embryonic deformities and increased mortality (Ohlendorf et al. 1988).
Selenium bioaccumulates in aquatic vegetation and invertebrates. Fish also can bioaccumulateselenium directly from the water and from their diet. Waterfowl can readily accumulate seleniumconcentrations leading to low reproduction rates, embryonic deformities and increased mortality(Ohlendorf et al. 1988). Selenium can concentrate in the food chain up to 2,000 times over theconcentration in the water (Ohlendorf 1989). For example, at the Kendrick irrigation project, westof Casper, Wyoming, physical deformities and poor reproductive success in American avocets andeared grebes resulted from elevated selenium concentrations. The median concentration of dissolvedselenium in water samples from two closed basin ponds located in the Kendrick irrigation projectwere 38 and 54 :g/L and with bioaccumulation of selenium in food items from these ponds, aquaticbirds suffered from impaired reproduction and embryonic deformities (See et al. 1992).
CBM produced water can also contain a variety of other trace elements including arsenic, barium,and zinc. CBM produced water also often contains high concentrations of dissolved salts, makingit unsuitable for irrigation and toxic to native plants. Soil irrigated with this water accumulates saltswhich destroy soil structure and inhibit adequate water uptake by plants. The sodium absorption ratio(SAR) of produced water typically is 10-12 times the level beyond which soil will maintain structureto support plant productivity. While there is debate over absolute values for acceptable limits forSAR, there is consistent agreement that high SAR water is a source of significant impairment formany soils, particularly irrigated soils and soils located in arid or semi-arid regions (Bauder 2002).Consequently, important wildlife habitat may be severely impacted or eliminated by surfacedischarge of produced water. For example, riparian or stream side areas are the single mostproductive wildlife habitat type in North America. They support a greater variety of wildlife thanany other habitat. Riparian vegetation plays an important role in protecting streams, reducing erosionand sedimentation as well as improving water quality, maintaining the water table, controllingflooding, and providing shade and cover. Impacts to these areas should be avoided wheneverpossible. Additionally, discharging large volumes of produced water into rivers and streams canseverely impact aquatic species and their habitats. Potential impacts include changes in streamtemperature and hydrology, and increased erosion and sedimentation resulting in the destruction offish spawning grounds and compromising fish and aquatic invertebrate growth and survival. The construction of reservoirs and associated facilities for disposal of water produced during thedevelopment of CBM wells can adversely affect groundwater and surface water. Infiltration orpercolation of CBM produced water containing high levels of salts or trace elements can reachgroundwater and eventually seep out and reach surface waters. Additionally, groundwater could seepinto low areas or basins in upland sites and create wetlands which would attract migratory birds andother wildlife.
USFWS - Region 6 - EC Report - R6/721C/05
7
Reservoirs typically increase the level of shallow aquifers and this increased water table level canextend a considerable distance down gradient within the water table (Winter et al. 1998). If siteconditions are suitable, the shallow aquifer can surface downstream of the CBM produced waterreservoir creating pools attractive to wildlife. Additionally, infiltration of CBM produced water fromthe reservoir through the underlying strata can leach naturally-occurring salts and trace elements.CBM produced water with elevated salts and or trace elements would result in greater concentrationsof these contaminants in the groundwater than would otherwise be present if they are leached fromthe strata. Pitt et al. (1994) state that “once contamination with salts begins, the movement of saltsinto the groundwater can be rapid.”
Bartos and Ogle (2002) documented maximums of 4,020 mg/L (parts per million) for total dissolvedsolids (TDS), 4,330 :S/cm for specific conductance, 1,000 mg/L for sodium, and 39 mg/L formagnesium in groundwater from CBM wells in the PRB in Wyoming. The maximum sodium andspecific conductance concentrations found by Bartos and Ogle (2002) were above levels documentedas causing poor growth of mallard ducklings (Mitcham and Wobeser 1988). An increase of sodiumand conductivity to levels above 2,550 mg/L and 20,000 microSiemens per centimeter (:S/cm),respectively, can cause duckling mortality (Mitcham and Wobeser 1988).
CBM produced water often contains high concentrations of dissolved salts, making it toxic to nativeplants. Bartos and Ogle (2002) characterized groundwater samples from coalbed aquifers in the PRBin the medium to very high salinity hazard classes which are not suitable for application on soil.Important wildlife habitat may be severely impacted or eliminated by the impoundment of CBMproduced water in the high and very high salinity hazard class of groundwater aquifers. Seepage ofthis water can alter riparian or stream side vegetation which protects streams, reduces erosion andsedimentation as well as improving water quality, maintains the water table, controls flooding, andprovides shade and cover for wildlife. Additionally, mineral deposits, such as halite (salt) andgypsum, in exposed reservoir sediments could prevent the establishment of vegetation at the reservoirsite after discharge of CBM produced water ceases.
A CBM reservoir placed on or immediately upstream of an intermittent stream reach could result inthe potential contamination of the shallow ground water. This contamination could in turn potentiallyaffect riparian vegetation or make elevated trace elements available to aquatic organisms inhabitingthose stream reaches and ultimately wildlife feeding on those organisms.
Some ephemeral streams contain deep pools that do not dry up except during extreme drought. Poolsin ephemeral draws or streams provide habitat for aquatic life adapted to withstand dry conditionsby forming cysts and burrowing into the substrate. These pools also provide habitat for migratoryaquatic birds. Downstream subsurface migration and eventual emergence of CBM produced watermay substantially impact the water quality of pools in ephemeral draws.

USFWS - Region 6 - EC Report - R6/721C/05
8
Figures 4, 5, 6, and 7 demonstrate the distribution of conductivity, sodium, SAR, and TDS in CBMproduced water in the PRB. The conductivity, sodium, and SAR maps are based on data obtainedfrom Cindy Rice, U.S. Geological Survey, Denver, Colorado (personal communications, February2004) . The TDS map was obtained from the Water Resources Research Institute (1981) in Laramie,Wyoming. In general, the highest concentrations of sodium and SAR and the highest conductivitiesoccur in the Powder River, Tongue River, and Clear Creek watersheds.

USFWS - Region 6 - EC Report - R6/721C/05
9
Figure 4. Electrical conductivity (in :S/cm) in water from coalbed methane wells in thePowder River Basin, Wyoming (from Cindy Rice, U.S. Geological Survey, Denver, Colorado,personal communications, February 2004.

USFWS - Region 6 - EC Report - R6/721C/05
10
Figure 5. Sodium (in mg/L) in water from coalbed methane wells in the Powder River Basin, Wyoming(from Cindy Rice, U.S. Geological Survey, Denver, Colorado, personal communications, February 2004).

USFWS - Region 6 - EC Report - R6/721C/05
11
Figure 6. Sodium adsorption ratio (SAR) in water from coalbed methane wells in the Powder River Basin, Wyoming(from Cindy Rice, U.S. Geological Survey, Denver, Colorado, personal communications, February 2004).

USFWS - Region 6 - EC Report - R6/721C/05
12
Figure 7. Total dissolved solids (in mg/L) in water from coalbed methane wells in the Powder River Basin, Wyoming.

USFWS - Region 6 - EC Report - R6/721C/05
13
Figure 8. Location of study area and sample sites in the Powder River Basin, Wyoming.
STUDY AREAThis study was conducted in the PRB in Campbell, and Sheridan counties, Wyoming (Figure 8) from2000 to 2002. The PRB is semi-arid with average annual precipitation ranging from 12 to 16 inchesand a pan evaporation rate of 60 inches per year. Specific site locations sampled in this study areprovided in Table 2.

USFWS - Region 6 - EC Report - R6/721C/05
14
Table 2. Sampling locations for the coalbed methane produced water study in the Powder RiverBasin, Wyoming.
Site Name NPDES # Latitude Longitude Township Range SectionLPD Pit WY0046574 44.925900 -106.890602 57 N 83 W 9Section 16 - # 2 WY0046531 44.920101 -106.883301 57 N 83 W 16Section 16 - # 1 WY0046531 44.913898 -106.882004 57 N 83 W 16Groves Ranch WY0039004 43.870998 -105.825600 45N 75W 13Rhoades Ranch 1 WY0043770 44.619801 -106.387802 54N 79W 29Rhoades Ranch 2 WY0043770 44.618301 -106.392799 54N 79W 29Rhoades Ranch 3 WY0043770 44.621300 -106.378799 54N 79W 28Appel Ranch WY0037907 44.142300 -105.568100 48N 73W 13K Bar/State Land WY0037435 43.749802 -105.695900 44N 74W 36North Groves WY0038750 43.735199 -105.671204 44N 73W 6SW Carter WY0039578 44.040501 -105.525200 47N 72W 20Redtop Pod WY0035807 44.028900 -105.495102 47N 72W 22Viper Pod WY0046949 43.971699 -105.436096 46N 71W 7Osborne Trust WY0035807 43.972401 -105.465897 46N 72W 11Clark Ranch WY0039063 44.724201 -105.948196 44N 76W 36Bower/State Land WY0037052 43.572498 -105.450302 42N 72W 36Sorenson 4 WY0039641 44.634666 -105.752983 54N 74W 27Sorenson 2 WY0039861 44.750084 -105.762680 55N 74W 16Sorenson 3 WY0039624 44.625252 -105.764214 54N 74W 28Lynde Trust Site WY0035441 44.123981 -105.494766 48N 72W 22Sorenson 1 WY0039861 44.745785 -105.779251 55N 74W 16West WY0041033 44.774284 -105.891136 55N 75W 4
The PRB is bounded in the west by the Bighorn Mountains and on the east by the Black Hills.Waterways that drain the PRB include the Tongue, Powder, Little Powder, Belle Fourche, andCheyenne Rivers which flow into the Missouri River system. The PRB consists of rolling, uplandsthat are typically characterized as short-grass prairie, mixed-grass prairie, and sagebrush (Merrill etal. 1996). Wetlands in the PRB include riverine wetlands, associated with perennial streams, smallponds or playas in topographical depressions, and artificially constructed impoundments rangingfrom small stock ponds to large reservoirs.
Geologic formations in the PRB include the Oligocene White River, the Eocene Wasatch, and thePaleocene Fort Union formations (US BLM 2003). These formations typically consist of sandstoneand shales (Love and Christiansen 1985). Upland soils in the PRB are derived from sandstone, shaleand siltstone and stream alluvium (US BLM 2003). The soils are low in organic matter, are alkaline,

USFWS - Region 6 - EC Report - R6/721C/05
15
and range in texture from clay loams to sandy loams (US BLM 2003).
Groundwater aquifers that occur at or near the land surface in the PRB are associated withunconsolidated Quaternary alluvial deposits along rivers, or in lower Tertiary sandstones and coalbeds (US BLM 2003). Groundwater aquifers include: Quaternary alluvial; Wasatch; Fort Union;Lebo; and Tullock formations (US BLM 2003). Water quality in these aquifers varies; however,groundwater in the Powder River drainage is usually of poorer quality than occurs in other areas ofthe PRB. Groundwater in the Powder River alluvial aquifer is dominated by sodium, calcium andsulfate ions (Ringen and Daddow 1990). Sodium sulfate and sodium bicarbonate are the dominantwater types in the Wasatch aquifer with TDS ranging from 227 to 8,200 mg/L (US BLM 2003). TheFort Union aquifer is primarily a sodium bicarbonate type with TDS ranging from 200 to 3,000 mg/L. Potable freshwater typically contains less than 1,000 mg/L TDS and waters with TDS concentrationsgreater than 1,000 mg/L but less than 35,000 mg/L are considered brackish (Drever 1988). Brackishwaters with TDS concentrations ranging from 1,000 to 3,000 mg/L are suitable for livestockconsumption but can cause temporary and mild diarrhea (Osweiler et al. 1976).
Clearwater et al. (2002) summarized the quality of CBM produced water in the PRB and reported thatconductivity increases from <1,000 :S/cm southeast of the Belle Fourche River to 3,000 :S/cmimmediately east of the confluence of Clear Creek with the Powder River. CBM produced water nearthe Tongue River also has high conductivity ranging from 1,630 to 2,180 :S/cm (Clearwater et al.2002). TDS concentrations also follow the same pattern as conductivity with low concentrationsranging from 400 to 500 mg/L in the southeast to highs ranging from 985 to 2,280 mg/L east of thePowder River (Clearwater et al. 2002).
The SAR of CBM produced water typically is 10-12 times the level beyond which soil will maintainstructure to support plant productivity. Soil irrigated with this water accumulates salts that destroyssoil structure and inhibits water uptake by plants. While there is debate over absolute values foracceptable limits for SAR, there is consistent agreement that high SAR water is a source ofsignificant impairment of many soils, particularly irrigated soils and soils of arid or semi-arid regions(Bauder 2002). Consequently, important wildlife habitat may be severely impacted or eliminated bysurface discharge of produced water characterized by high SAR values.

USFWS - Region 6 - EC Report - R6/721C/05
16
METHODS
We obtained water quality data from existing CBM produced water discharges permitted underNPDES from WDEQ. Locations with discharges exceeding water quality criteria and in the case ofselenium, values above 2 :g/L, were considered possible sampling sites for this study.
During the first phase of the study in 2000 we obtained information on CBM produced waterenhanced wetlands from the U.S. Bureau of Land Management and the WDEQ. We visited thesesites and selected wetlands for additional contaminants evaluation because they had breeding aquaticbirds, or submerged aquatic vegetation, and aquatic invertebrates and were closed basins receivingCBM produced water or were impoundments with minimal flow-through.
In the second phase of the study in 2001, we collected water, sediment, aquatic vegetation, aquaticinvertebrates, and fish or amphibians from wetlands receiving CBM produced water. The initialstudy plan included collecting bird eggs and bird livers. However, since there were few or no nestsor waterfowl broods at some of the wetland sites, we did not attempt to collect bird eggs and livers.
Water SamplesDuring the 2000 season, we collected water from nine CBM produced water discharges andsubmitted these samples for trace element analyses. The nine discharges included the following sites:Appel, Clark, Bower, Yates, North Groves, SW Carter, Redtop Pod, Viper Pod, and Osborne Tract(Table 1). During the 2001 season, we collected water from five CBM produced water dischargesand receiving wetlands (Lynde, Sorenson 3, West, Appel, and Bower sites). Water samples werecollected in 1-liter chemically-clean polyethylene jars with teflon-lined lids. The pH of the watersamples collected for chemical analyses was lowered to approximately 2.0 with laboratory-gradenitric acid.
In 2002, water samples were collected from seven closed containment impoundments designed forthe disposal of CBM produced water with high SARs by infiltration and evaporation. The sevenimpoundments were located at the following sites: LPD Pit, Section 16 # 2; Section 16 #1; RhoadesRanch; and Groves Ranch (Table 1). Water samples were also collected from the CBM dischargesassociated with the closed containment impoundments. These samples will provide baseline data ontrace elements, conductivity and TDS if other investigators wish to determine the effects ofevaporation on the concentrations of these constituents.
Sediment SamplesComposite sediment samples were collected from eight wetland sites receiving CBM produced water:Lynde, Sorenson 1, Sorenson 2, Sorenson 3, Little Thunder Reservoir, West, Appel, and Bower sites.Sediment was collected with an Ekman dredge and a stainless steel spoon rinsed in de-ionized waterand acetone. The sediment was placed in Whirl-pak® bags and frozen.

USFWS - Region 6 - EC Report - R6/721C/05
17
Aquatic Vegetation SamplesWe collected pondweed (Potamogeton spp.) samples from all wetland sites except the Sorensen 2site, because no submerged aquatic vegetation was present, nor from the Appel Ranch wetland wherewe collected water milfoil (Myriophyllum spp.) instead because pondweed was not present. Aquaticvegetation samples were collected by hand, placed in Whirl-pak® bags and immediately frozen.
Aquatic Invertebrate SamplesWe collected waterboatmen (Family Corixidae) from the Lynde Trust and Sorensen 3 wetland sites.Backswimmers (Family Notonectidae) were collected from the Appel Ranch and Bowers-Statewetland sites. Odonates (Order Odonata) were collected from the Appel Ranch wetland site.Vegetation samples were collected by hand. Invertebrate samples were collected using a dip net orlight traps as described by Espinosa and Clark (1972) and placed in 40-ml chemically-clean glassvials and frozen.
Fish and Salamander SamplesWe collected fathead minnows (Pimephales promelas), black bulhead (Ictalurus melas) and tigersalamanders (Ambystoma tigrinum) in minnow traps. Black bulhead were collected from the LittleThunder Reservoir and fathead minnows were collected from the Lynde Trust wetland site. Fishwere not present at the other wetland sites. Tiger salamanders were collected from the Appel Ranch,Bowers-State, and Sorensen 3 wetland sites. Fish and tiger salamander samples were placed inWhirl-pak® bags and immediately frozen after collection.
Laboratory AnalysesWater samples collected from CBM -produced water discharges in 2000 were submitted to the TraceElement Research Laboratory (TERL) at Texas A&M University, in College Station, Texas foranalyses. Water, sediment and biota samples collected during the second phase of the study in 2001were submitted to the Research Triangle Institute Laboratory (RTIL) at Research Triangle Park,North Carolina for analyses. Water samples collected in 2002 were submitted to RTL. TERL andRTIL are under contract with the Service's Analytical Control Facility (ACF) at Shepherdstown, WestVirginia for trace element analyses. Trace element analyses included scans for arsenic, mercury, andselenium using atomic absorption spectroscopy. Inductively Coupled Plasma Emission Spectroscopywas used to scan a variety of elements including barium, boron, copper, lead, vanadium and zinc.Mercury samples were digested under reflux in nitric acid. Other samples were digested under refluxin nitric and perchloric acids. ACF conducted Quality Assurance/Quality Control on all samplesanalyzed by TERL and RTIL. Quality control samples in the form of procedural blanks, matrixspikes, duplicates, and standard reference materials (ARM) were analyzed with each batch of 20 orfewer samples. All analytical data for sediment and biota are reported in dry weight unless otherwisenoted. SYSTAT® statistical software was used to perform paired t-tests on water quality data.
RESULTS
USFWS - Region 6 - EC Report - R6/721C/05
18
Water in Wetlands and Associated CBM DischargesIn general, trace elements were below WDEQ acute and chronic aquatic life criteria with theexception of iron, manganese, lead, and copper (Table 3). Exceedances of WDEQ’s 1,000 :g/Lchronic criterion for iron were documented at the CBM produced water discharge at the Appel Ranchsite (1,790 :g/L) and at closed basin wetland at the Bower/State Land site (10,400 :g/L). Ironconcentrations in all CBM produced water discharges and receiving wetlands sampled exceeded thelowest chronic values (LCVs) reported by Suter and Tsao (1996) for fish, daphnids, and aquaticplants.
Waterborne manganese in a closed basin wetlands at the West and Bower/State Land sites were 2,090and 234 :g/L, respectively, and exceeded the WDEQ chronic criteria, calculated based on hardness.Lead concentrations in water collected from wetlands at the Bower/State Land and West sites were14.4 and 28.3 :g/L, respectively and exceeded the WDEQ chronic criterion which is dependent onhardness. Hardness as CaCO3 for water collected from wetlands at the Bower/State Land and Westsites was 52 and 4,685 mg/L, respectively. The chronic values calculated for lead based on thehardness for these two sites were 1.2 and 11 :g/L.
Copper concentrations in water exceeded the WDEQ acute criterion, calculated based on hardness,for CBM produced water discharges at the Bower/State Land; Lynde Trust; and Sorenson 3 sites.The chronic criterion for copper was exceeded in water collected from wetlands at the Bower/StateLand; Lynde Trust; Sorenson 3; and Appel Ranch sites.
Cadmium concentrations in water collected from the CBM produced water discharges and receivingwetlands at the Sorensen 3 and West Ranch sites ranged from 6.7 to 9.3 :g/L and exceeded the 3:g/L threshold identified by Eisler (2000) as potentially hazardous to freshwater aquatic life.
Results of trace element concentrations in CBM produced water discharge samples are presented inAppendix A and Appendix B.
Water in Closed Containment Impoundments and Associated DischargesWater quality results from CBM produced water collected from closed containment impoundmentsand their associated discharges are presented in Appendix C. Although several trace elements suchas aluminum, boron, chromium, iron, and manganese were generally higher in the closed containmentimpoundments than in the respective discharges, the differences were not statistically significant(paired t-test, p<0.05). Waterborne selenium concentrations in six of the seven closed containmentimpoundments and all seven associated discharges exceeded the 2 :g/L threshold for seleniumbioaccumulation in sensitive species of fish and aquatic birds (Appendix C).
SedimentMean trace element concentrations in bottom sediment collected from wetlands receiving CBM

USFWS - Region 6 - EC Report - R6/721C/05
19
produced water generally were below background values as reported by Shacklette and Boerngen(1984). Trace elements that exceeded background include arsenic, boron, beryllium, copper,manganese, nickel, lead and zinc (Table 4)(Appendix D). Arsenic, cadmium, nickel and zinc inbottom sediment from three wetland sites were above MacDonald et al’s (2000) consensus-basedthreshold effects concentrations (TECs)(Table 5). TECs are defined by MacDonald et al. (2000) asthe concentration of a chemical in sediment “below which adverse effects on sediment-dwellingorganisms are not expected to occur.” Arsenic, cadmium, nickel and zinc did not, however, exceedthe consensus-based probable effect concentration (PEC) which MacDonald et al. (2000) define asthe concentration of a chemical in sediment “above which adverse effects on sediment-dwellingorganisms are likely to be observed.”
Table 3. Concentrations of copper, iron, lead, and manganese (in :g/L) in water from coalbedmethane produced water discharges and receiving wetlands in Sheridan and Campbell counties,Wyoming (2000 - 2001).CBM Produced Water Discharges
Sample ID Site Name Hardness* Cu Fe Mn PbCBM001 Appel 228 0.3 1,790 35 0.08CBM003 Bower 79 0.6 688 9 0.13CBMDLT1 Lynde 44 8.5 176 3.1 BDLCBMDSOR3 Sorenson 3 71 15.5 686 48.5 BDLCBMDWES1 West 304 16.7 851 32 BDL
Wetlands Receiving CBM Produced WaterSample ID Site Name Hardness Cu Fe Mn Pb
CBMWAPR1 Appel 130 16.5 116 30.3 BDLCBMWBOW1 Bower 52 26.9 10,400 234 14.4CBMWLT1 Lynde 110 14.4 627 35.3 BDLCBMWSR3A Sorenson 3 47 15.3 941 31.4 BDLCBMWWES1 West 4,685 19.1 479 2,090 28.3* Hardness as CaCO3 in mg/L
Aquatic VegetationBoron in aquatic vegetation (Table 6, Appendix E) from all sites except Sorensen 3 exceeded the 30:g/g (parts per million) level documented to effect growth in ducklings (Smith and Anders 1989).Mean cadmium concentrations in pondweed from the Bowers-State wetland site and Little ThunderReservoir were 0.145 :g/g and 0.123 :g/g, respectively, slightly above the 0.1 :g/g wet weight levelthat Eisler (2000) recommends should be “viewed with caution” in terms of wildlife dietary levels;but below the 2 :g/g dietary threshold for birds reported by Furness (1996). Mean chromiumconcentrations in pondweed from the Bowers-State and West Ranch wetland sites were 26.12 :g/g

USFWS - Region 6 - EC Report - R6/721C/05
20
and 13.76 :g/g, respectively, and exceeded the wildlife dietary threshold of 10 :g/g recommendedby Eisler (2000).
Aquatic InvertebratesTrace elements in aquatic invertebrates collected from all wetland sites generally were belowconcentrations known to cause adverse effects to fish and birds (Appendix F). Boron concentrationswere elevated in aquatic invertebrates collected from the Appel Ranch, Lynde Trust and Sorensen3 wetland sites. The invertebrate composite samples from the Appel Ranch, and Lynde Trust wetlandsites had boron concentrations of 30.4 :g/g, and 98.6 :g/g, respectively, which exceeded the 30 :g/glevel documented to reduce growth in ducklings (Smith and Anders 1989). The mean boronconcentration in aquatic invertebrates collected from the Sorensen 3 wetland site was 42.2 :g/g.
Mean cadmium concentrations in aquatic invertebrates from the Bowers-State, and Sorensen 3wetland sites were 0.68, and 1.4 :g/g, respectively. The wet weight concentrations for these siteswere 0.43, and 0.197 :g/g for the Bowers-State and Lynde Trust sites, respectively, above the 0.1:g/g wet weight level that Eisler (2000) recommends should be “viewed with caution” in terms ofwildlife dietary levels. One waterboatmen sample collected from the Lynde Trust wetland site hada cadmium concentration of 0.13 :g/g dry weight (0.18 :g/g wet weight).
FishTrace elements in fish collected from Little Thunder Reservoir and the Lynde Trust wetland sitegenerally were below concentrations known to cause adverse effects to fish with the exception ofchromium in fathead minnows from the Lynde Trust wetland site (Appendix G). Chromiumconcentrations in fathead minnows from the Lynde Trust wetland site ranged from 24.4 :g/g to 307:g/g with a mean concentration of 150.7 :g/g, exceeding the 4 :g/g level that Eisler (2000) states“should be viewed as presumptive evidence of chromium contamination.”
Tiger SalamandersTrace element tissue residue thresholds for amphibians are unknown. Mean chromiumconcentrations in tiger salamanders from Appel Ranch, Bowers-State, and Sorensen 3 wetland sitesranged from 18.6 :g/g to 137 :g/g, and were well above Eisler’s (2000) 4 :g/g concern level(Appendix G).
Table 4. Trace element concentrations (mean and range) in :g/g, and the proportions that exceededbackground concentrations (as reported by Shacklette and Boerngen 1984) in sediment from wetlandsreceiving coalbed methane produced water discharges in Campbell County, Wyoming (2001).
USFWS - Region 6 - EC Report - R6/721C/05
21
Element Background (in :g/g)
Site
Appel Ranch Bowers-State Lynde Trust Sorensen 2 Sorensen 3 West Ranch
Arsenic 5.5 7.5(4.6 - 13.1)
[4 of 5]
4.7(3.1 - 7.6)
[1 of 5]
3.8(2.3 - 5.0)
[0 of 5]
6.4(4.9 - 11.5)
[1 of 5]
4.9(2.6 - 6.6)
[2 of 5]
8.5(4.3 - 15.6)
[3 of 5]
Boron 23 13.0(11.3 - 15.6)
[0 of 5]
10.8(6.8 - 13.4)
[0 of 5]
11.8(6.8 - 14.7)
[0 of 5]
17.5(13.6 - 30.1)
[0 of 5]
11.1(6.4 - 16.7)
[0 of 5]
26.6(13.1 - 37.4)
[3 of 5]
Beryllium 0.68 0.74(0.56 - 0.84)
[4 of 5]
0.98(0.857 - 1.1)
[5 of 5]
0.62(0.35 - 0.77)
[3 of 5]
0.70(0.53 - 1.0)
[2 of 5]
0.60(0.44 - 0.79)
[1 of 5]
1.12(0.78 - 1.59)
[5 of 5]
Copper 19 17.7(13.4 - 20.7)
[1 of 5]
19.0(15.8 - 22.9)
[2 of 5]
14.2(6.6 - 19.6)
[1 of 5]
17.4(14.6 - 20.7)
[2 of 5]
13.1(5.5 - 23.8)
[1 of 5]
20.6(16.2 - 24)
[4 of 5]
Manganese 380 245(208 - 326)
[0 of 5]
356(173 - 699)
[2 of 5]
228(131 - 280)
[0 of 5]
403(313 - 693)
[ 1 of 5]
265(104 - 428)
[1 of 5]
1,407(436 -2,924)[5 of 5]
Nickel 15 18.4(14 - 21.6)
[4 of 5]
18.2(14.5 - 21.7)
[4 of 5]
15.0(8.2 - 19.2)
[3 of 5]
14.0(12.4 - 15.7)
[1 of 5]
15.0(9.0 - 24.4)
[2 of 5]
29.0(16.9 - 42)
[5 of 5]
Lead 16 13.4(12.5 - 14.9)
[0 of 5]
18.6(16.9 - 19.8)
[5 of 5]
11.8(6.5 - 15.6)
[0 of 5]
11.0(8.1 - 13.3)
[0 of 5]
11.1(6.4 - 18.4)
[1 of 5]
14.0(12.3 - 16.6)
[1 of 5]
Zinc 55 66.3(57.2 - 78.5)
[5 of 5]
67.2(55.8 - 75.9)
[5 of 5]
52.3(29.6 - 66.8)
[3 of 5]
46.8(41.2 - 55.6)
[1 of 5]
45.9(33.4 - 58.3)
[1 of 5]
139.7(81.9 - 195)
[5 of 5] Mean
(Minimum - Maximum) [number of samples above background]
Table 5. Trace elements exceeding consensus-based threshold effects concentrations (in :g/g)(asreported by MacDonald et al. 2000) in sediment from wetlands receiving coalbed methane producedwater discharges in Campbell County, Wyoming (2001).
Sample # Site ArsenicTEC = 9.79
CadmiumTEC=0.99
NickelTEC=22.7
ZincTEC = 121

USFWS - Region 6 - EC Report - R6/721C/05
22
CBMAPR3 Appel Ranch 13.1
CBMSSR2D Sorensen 2 11.5 1.59
CBMSSR3E Sorensen 3 24.4
CBMSWES2 West Ranch 15.6 2.19 38.5
CBMSWES3 West Ranch 11.7 2.26 42.0 153
CBMSWES4 West Ranch 1.32 26.9
CBMSWES5 West Ranch 1.28
Table 6. Boron concentrations (in :g/g) in submerged aquatic vegetation collected from wetlandsreceiving coalbed methane produced water discharges in Campbell County, Wyoming (2001).
Site Mean Minimum Maximum
Appel Ranch(Water Milfoil)
37.76 33.1 49.2
Bowers-State(Pondweed)
300 221 362
Lynde Trust(Pondweed)
109 41.3 207
Sorensen 3(Pondweed)
19.6 18.2 21.5
West Ranch(Pondweed)
172 155 208
Little Thunder Reservoir(Pondweed)
324 251 396
Number of samples from each site (n) = 5

USFWS - Region 6 - EC Report - R6/721C/05
23
DISCUSSION
The Bowers/State and West Ranch wetland sites are terminal sinks that receive CBM produced water.The Sorensen 3 site is a closed containment pond constructed to dispose of CBM produced waterthrough infiltration and evaporation. Three of the wetland sites (Appel Ranch, Lynde Trust, andSorensen 2) are small impoundments designed to control the flow of CBM produced water intoephemeral streams. The Little Thunder Reservoir is in the Thunder Basin National Grasslands andexisted prior to CBM produced water discharge. Exceedance of trace element backgroundconcentrations in sediment did not appear related to the site type (flow-through versus terminal sink)as several trace elements were above background in both site types. Arsenic, cadmium, nickel, andzinc in sediments from the West Ranch site (a terminal sink) exceeded the TECs as defined byMacDonald et al. (2000) as the concentration of a chemical in sediment “below which adverse effectson sediment-dwelling organisms are not expected to occur.”
Aquatic vegetation was collected from all sites except the Sorensen 2 site where it was not present.Boron concentrations in aquatic vegetation collected from sites where it was present exceeded the30 :g/g level documented to effect growth in ducklings (Smith and Anders 1989). Cadmiumconcentrations in aquatic vegetation from the Bowers/State wetland site and the Little ThunderReservoir were slightly above the 0.1 :g/g wet weight level that Eisler (2000) recommends shouldbe “viewed with caution” in terms of wildlife dietary levels. Chromium concentrations in pondweedfrom the Bowers/State and the West Ranch sites exceeded the wildlife dietary threshold of 10 :g/grecommended by Eisler (2000).
Cadmium concentrations in aquatic invertebrates from the Bowers/State, Lynde Trust, and Sorensen3 sites exceeded the 0.1 :g/g wet weight level that Eisler (2000) recommends should be “viewed withcaution” in terms of wildlife dietary levels. Chromium concentrations in tiger salamanders from theAppel Ranch, Bowers/State, and Sorensen 3 sites ranged from 18.6 to 137 :g/g and exceeded the 4:g/g level that Eisler (2000) states “should be viewed as presumptive evidence of chromiumcontamination.” Chromium concentrations in fathead minnows from the Lynde Trust site exceededthe 4 :g/g threshold and ranged from 24.4 to 307 :g/g.
Selenium concentrations in water, sediment, and biota were below threshold levels known to causeadverse effects to sensitive species of fish and aquatic birds, with the exception of CBM producedwater discharges and CBM closed containment impoundments. Waterborne selenium concentrationsin six of the seven closed containment impoundments and all seven associated discharges rangedfrom 2.2 to 8.4 :g/L, exceeding the 2 :g/L threshold for bioaccumulation in sensitive species of fishand aquatic birds. Closed containment ponds containing high selenium water may present a risk toaquatic birds using these ponds if the ponds provide a dietary route of exposure through submergedaquatic vegetation or aquatic invertebrates. Since sediment or soil quality data from the wetland sites prior to the discharge of CBM producedwater is not available it is not possible to determine if trace element exceedances are naturallyoccurring. Exceedances of thresholds for the protection of fish and wildlife in dietary itemsconsumed by aquatic migratory birds indicate that site specific monitoring of water, sediment and
USFWS - Region 6 - EC Report - R6/721C/05
24
biota in wetlands receiving CBM produced water, especially terminal sinks, should be undertakento conclusively determine ecological risk and prospective injury to biota. Trace elements in terminalsinks are expected to increase over time due to evaporative concentration. Additionally, researchconducted by McBeth et al. (2003a) shows that increases in pH in CBM produced waterimpoundments can increase the solubility and mobility of aluminum, iron, arsenic, selenium, andfluoride. McBeth et al. (2003b) also showed significant increases in specific conductance, TDS,alkalinity, sodium, potassium and SAR “moving north from the Cheyenne River basin to the LittlePowder River basin.

USFWS - Region 6 - EC Report - R6/721C/05
25
A summary of trace elements exceeding the benchmarks for water, sediment and biota in wetlandsreceiving CBM produced water are shown below.

USFWS - Region 6 - EC Report - R6/721C/05
26
MANAGEMENT RECOMMENDATIONS
Currently, CBM produced water that meets Wyoming water quality standards is discharged into smallimpoundments creating habitat for aquatic migratory birds and other water-dependent wildlife.However, because ecological threats from contaminated water and sediment can vary from site to sitein the PRB, private landowners, public land management agencies and wildlife management agenciesshould base decisions on whether or not to use CBM produced water for wetland creation andenhancement on site-specific water and sediment quality data.
CBM operators, land managers and landowners should consider the following recommendations tominimize or prevent adverse impacts to fish and wildlife and their habitats from CBM produced waterdischarges.
• Avoid discharging CBM produced water with selenium >2 µg/L into closed containment pitsor ponds for disposal by evaporation.
• Avoid irrigating seleniferous soils with CBM produced water to prevent the leaching ofselenium from these soils and mobilization of selenium to downstream wetlands used by fishand aquatic-dependent wildlife.
• Avoid discharge of high SAR CBM produced water to prevent impacts to soils and riparianvegetation.
• Avoid disposal of high TDS/SAR CBM produced water into unlined evaporation ponds toprevent groundwater contamination.
• Avoid disposal of high TDS/SAR CBM produced water into evaporation ponds to preventpotential salt toxicity to aquatic migratory birds using those ponds.
• When disposal of CBM produced water into evaporation ponds cannot be avoided, predictivemodeling should be used to determine if sodium, selenium, and or metal concentrations in thewater will increase over time and pose a risk to wildlife.
• Consider the soil types and the underlying geology prior to siting CBM produced waterimpoundments to adequately assess the risk of groundwater contamination.
CBM produced water with elevated selenium: Regulators and CBM operators should not allowthe discharge of CBM produced water with selenium concentrations >2 µg/L into closed containmentpits or ponds to minimize or prevent eventual increases in selenium concentrations throughevaporative concentration. Closed containment ponds characterized by high selenium water maypresent a risk to aquatic birds using these ponds where a food source in the form of submergedaquatic vegetation or aquatic invertebrates is present.

USFWS - Region 6 - EC Report - R6/721C/05
27
Irrigation of seleniferous soils: Land owners/managers should avoid irrigating seleniferous soilswith CBM produced water to prevent leaching of selenium and its mobilization to downstreamwetlands used by fish and aquatic-dependent wildlife.
CBM produced water with elevated SAR: CBM operators should dispose of CBM produced waterwith elevated SAR in a manner that prevents contamination of groundwater, and downstream riparianand upland soils. Disposal of CBM produced water into closed containment reservoirs can result ingroundwater contamination by high levels of salts or trace elements that can eventually seep out andreach surface waters. Additionally, groundwater can seep into low areas or basins in upland sitescreating wetlands that attract migratory birds and other wildlife.
An increase of sodium and conductivity to levels above 2,550 mg/L and 20,000 µS/cm, respectively,can cause duckling mortality, especially if an abrupt change from freshwater to saline water occurs(Mitcham and Wobeser 1988). Salt toxicosis occurs when high levels of the sodium ion are ingestedwithout drinking enough freshwater to flush the salt accumulation from the body (Osweiler et al.1976). Windingstad, et al. (1987) documented salt toxicosis in adult waterfowl in a North Dakotalake with sodium concentrations over 17,000 mg/L. Salt toxicity in wild aquatic birds occurs whenthey are forced to use saline water during drought conditions or during the winter when freshwateris frozen. The scarcity of freshwater in semi-arid environments aggravates the risk of salt toxicityto aquatic birds using impoundments characterized by saline and especially hypersaline conditionsas the affected birds cannot easily move to fresher water to mitigate their ingestion of hypersalinewater.
Aquatic birds using hypersaline ponds are susceptible to mortality from salt encrustation. Sodiumin the hypersaline water can crystalize on the feathers of birds landing in these waterbodies. Thesodium crystals destroy the feathers' thermoregulatory and buoyancy functions causing the bird todrown or die of hypothermia. Salt encrustation on birds has been documented in industrialwastewater ponds with TDS > 200,000 mg/L (Meteyer et al. 1997). Soil irrigated with CBMproduced water with elevated SAR accumulates salts that destroys soil structure and inhibits wateruptake by plants. High SAR water is a source of significant impairment of many soils, particularlyirrigated soils and soils of arid or semi-arid regions (Bauder 2002). Consequently, important wildlifehabitats can be severely impacted or eliminated by surface discharges of high SAR produced water.

USFWS - Region 6 - EC Report - R6/721C/05
28
LITERATURE CITED
Bartos, T.T. and K.M. Ogle. 2002. Water quality and environmental isotopic analyses of ground-water samples collected from the Wasatch and Fort Union formations in areas of coalbedmethane development - implications to recharge and groundwater flow, Eastern Powder RiverBasin, Wyoming. Water-Resources Investigations Report 02-4045. U.S. Geol. Survey,Cheyenne, WY. 88 pp.
Bauder, J. 2002. Quality and Characteristics of Saline and Sodic Water Affect Irrigation Suitability.Montana State University, Department of Land Resources and Environmental Sciences.Water Quality and Irrigation Management Internet website publication.[http://waterquality.montana.edu/docs/methane/irrigation_suitability.shtml]
Clearwater, S.J., B.A. Morris, and J.S. Meyer. 2002. A comparison of coalbed methane productwater quality versus surface water quality in the Powder River Basin of Wyoming, and anassessment of the use of standard aquatic toxicity testing organisms for evaluating thepotential effects of coalbed methane product waters. Dept. of Zool. And Physiol., Univ.Wyoming, Laramie, WY. 131 pp.
Drever, J.I. 1988. The geochemistry of natural waters. Prentice Hall, Englewood Cliffs, NJ. 437pp.
Eisler R 2000. Handbook of Chemical Risk Assessment: Health Hazards to Humans, Plants, andAnimals. CRC Press. Lewis Publishers. Boca Raton, FL. 2416 pp.
Espinosa, L.R., and W.E. Clark. 1972. A polypropylene light trap for aquatic invertebrates.California Fish and Game 58:149-152.
Furness, R.W. 1996. Cadmium in birds. Pages 389-404 in Beyer et al. (eds). Environmentalcontaminants in wildlife: interpreting tissue concentrations. CRC Press, Boca Raton, FL
Hamilton, S. J. 2002. Rationale for a tissue-based selenium criterion for aquatic life. AquaticToxicology 57:85-100.
Lemly, A.D. 1993. Guidelines for evaluating selenium data from aquatic monitoring and assessmentstudies. Environmental Monitoring Assessment 28:83-100.
Love, J.D., and A.C. Christiansen. 1985. Geologic Map of Wyoming. U.S. Geological Survey,Reston, Virginia.
MacDonald, D.D., C.G. Ingersoll, and T.A. Berger. 2000. Development and evaluation ofconsensus-based sediment quality guidelines for freshwater ecosystems. Arch. Environ.Contam. Toxicol. 39:20-31.

USFWS - Region 6 - EC Report - R6/721C/05
29
McBeth, I., K.J. Reddy, and Q.D. Skinner. 2003a. Chemistry of trace elements in coalbed methaneproduct water. Water Research 37:884-890.
McBeth, I., K.J. Reddy, and Q.D. Skinner. 2003b. Coalbed methane product water chemistry in threeWyoming watersheds. Jour. Am. Water Res. Assoc. 39(3):575-585.
Merrill, E.H., T.W. Kohley, M.E. Herdendorf, W.A. Reiners, K.L. Driese, R.W. Marrs, and S.H.Anderson. 1996. The Wyoming GAP analysis project - final report. Wyoming Coop. Fishand Wildl. Res. Unit, Univ. WY, Laramie, WY. 109 pp.
Meteyer, C.U.; R.R. Dubielzig; F.J. Dein; L.A. Baeten; M.K. Moore; J.R. Jehl, Jr.; and K.Wesenberg. 1997. Sodium toxicity and pathology associated with exposure of waterfowl tohypersaline playa lakes of southeast New Mexico. J. Vet. Diagn. Invet. 9:269-280.
Mitcham, S.A. and G. Wobeser. 1988. Effects of sodium and magnesium sulfate in drinking wateron mallard ducklings. J. Wildl. Diseases 24:30-44.
Ohlendorf, H.M., A.W. Kilness, J.L. Simmons, R.K. Stroud, D.J. Hoffman, and J.F. Moore. 1988.Selenium toxicosis in wild aquatic birds. Journal of Toxicology Environment and Health24:67-92.
Ohlendorf, H.M. 1989. Bioaccumulation and effects of selenium in wildlife. In: Selenium inAgriculture and the Environment. Soil Science Society of America and American Societyof Agronomy. SSSA Special Publication No. 23. Madison, Wisconsin. Pages 133-177.
Osweiler, G.D.; T.L. Carson; W.B. Buck; and G.A. Van Gelder. 1976. Clinical and diagnosticveterinary toxicology. Kendall/Hunt Publishing Co. Dubuque, Iowa. p. 172.
Pitt, R.; S. Clark and K. Parmer. 1994. Potential groundwater contamination from intentional andnonintentional stormwater infiltration. EPA/600/SR-94/051 May, U.S. EnvironmentalProtection Agency, Cincinnati, OH. 7 pp.
Ringen, B.H. and P.B. Daddow. 1990. Hydrology of the Powder River Alluvium between Sussex,Wyoming and Moorhead, Montana. U.S. Geological Survey Water-Resources InvestigationsReport 89-4002. 47 pp.
See, R.B., D.L. Naftz, D.A. Peterson, J.G. Crock, J.A. Erdman, R.C. Severson, P. Ramirez, Jr., andJ.A. Armstrong. 1992. Detailed study of selenium in soil, representative plants, water,bottom sediment, and biota in the Kendrick Reclamation Project Area, Wyoming, 1988-90.U.S. Geological Survey Water Resources Investigations Report 91-4131. 142 pp.
Seiler, R.L. 1995. Prediction of areas where irrigation drainage may induce selenium contaminationof water. Journal of Environmental Quality 25(5):973-979.
Shacklette, H.T.,and Boerngen, J.G., 1984, Element Concentrations in Soils and Other Surficial

USFWS - Region 6 - EC Report - R6/721C/05
30
Materials of the Conterminous United States: U.S. Geological Survey Professional Paper1270. 105 pp.
Skorupa, J.P., and H.M. Ohlendorf. 1991. Contaminants in drainage water and avian risk thresholds.In: A. Dinar and D. Zilberman, eds., The Economics and Management of Water andDrainage in Agriculture. Kluwer Academic Publishers. Norwell, Massachusetts. Pages 345-368.
Smith, G.J. and V.P. Anders. 1989. Toxic effects of boron on mallard reproduction. EvironmentalToxicology and Chemistry. 8:943-950.
Suter G.W., and C.L. Tsao. 1996. Toxicological benchmarks for screening potential contaminantsof concern for effects on aquatic biota: 1996 revision. Risk Assessment Program, HealthSciences Res. Div., Oak Ridge National Laboratory, Oak Ridge, TN. 151 pp.
U.S. Bureau of Land Management. 1997. Gillette South Coal Bed Methane Project EnvironmentalImpact Statement. DEIS 97-8. Buffalo Res. Area, Casper District Office, Wyoming. March.
U.S. Bureau of Land Management. 2003. Final Environmental Impact Statement and proposed planamendment for the Powder River Basin oil and gas project. WY-070-02-065. Buffalo FieldOffice, Wyoming. January.
U.S. Geological Survey. 1986. Hydrology of Area 50, Northern Great Plains and Rocky MountainCoal Provinces, Wyoming and Montana. Water Resources Investigations Open-file Report85-545. Wyoming District Office, Cheyenne, Wyoming.
U.S. Geological Survey. 1997. Coalbed Methane - An Untapped Energy Resource and an
Environmental Concern. USGS Fact Sheet FS-019-97. 3 pp.
Water Resources Res. Institute. 1981. Dissolved Solids Map of Wasatch/Fort Union Aquifer SystemWater, Powder River Basin, Wyoming from Volume I-B, Occurrence and Characteristics ofGround Water in the Powder River Basin, Wyoming,, Univ. Wyoming, Laramie, WY.[http://deq.state.wy.us/wqd/cbm.asp]
Windingstad, R.M.: F.X. Kartch; R.K. Stroud; and M.R. Smith. 1987. Salt toxicosis in waterfowlin North Dakota. Jour. Wildlife Diseases 23(3):443-446.
Winter, T.C.; J.W. Harvey; O.L. Franke; and W.M. Alley. 1998. Ground water and surface water -a single resource. U.S. Geol. Surv. Circular 1139. U.S. Geological Survey, Denver, CO. 79pp.

USFWS - Region 6 - EC Report - R6/721C/05
31
APPENDICES

USFWS - Region 6 - EC Report - R6/721C/05
32
APPENDIX ATrace elements (in :g/L) in water collected in 2000 from coal bed methane (CBM) produced water discharges in the Powder River Basin,Wyoming.
Sample # Site Ag Al As B Ba Be Ca Cd Co Cr Cu Fe HgCBM001 Appel BDL BDL 0.39 105 1,140 BDL 54,100 BDL 2.67 BDL 0.30 1,790 BDL CBM002 Clark 0.16 281 2.07 152 970 BDL 28,300 BDL 6.36 0.70 1.60 707 BDL CBM003 Bower BDL 60 1.37 116 353 BDL 17,300 0.37 9.84 BDL 0.60 688 BDL CBM004 Yates 0.08 BDL 0.26 90 582 BDL 40,200 0.53 0.13 BDL 0.40 561 BDL CBM005 North Groves BDL BDL 0.19 70 1,130 BDL 73,200 0.55 0.14 BDL 0.80 1,110 BDL CBM006 SW Carter BDL BDL 0.13 70 659 BDL 32,200 0.38 0.06 BDL 2.20 225 BDL CBM007 Redtop Pod BDL BDL 0.53 80 622 BDL 27,100 0.48 0.06 BDL 0.70 336 BDL CBM008 Viper Pod BDL BDL 0.09 80 541 BDL 28,000 0.35 0.06 BDL 0.80 444 BDL CBM009 Osborne Tract BDL 217 0.16 70 507 BDL 26,600 0.69 0.19 BDL 1.60 3,390 BDL
Sample # Site K Mg Mn Mo Na Ni Pb Se Sr Tl V Zn TiCBM001 Appel 14,700 28,100 35 BDL 246,000 0.50 0.08 0.12 1,150 BDL BDL 4.30 BDL CBM002 Clark 17,900 37,000 24 BDL 603,000 2.00 2.01 0.16 1,140 BDL BDL 2.60 BDL CBM003 Bower 5,900 8,160 9 BDL 125,000 2.20 0.13 0.09 335 BDL BDL 2.80 BDL CBM004 Yates 6,630 10,100 46 BDL 220,000 0.70 0.13 0.29 1,040 BDL BDL 0.90 BDL CBM005 North Groves 7,080 14,100 71 BDL 297,000 BDL BDL 0.47 1,720 BDL BDL 0.40 BDL CBM006 SW Carter 11,000 14,300 4 BDL 171,000 BDL 0.07 0.34 611 BDL BDL 0.40 BDL CBM007 Redtop Pod 9,650 11,100 5 BDL 153,000 BDL 0.09 0.32 540 BDL BDL 0.90 BDL CBM008 Viper Pod 8,820 11,600 4 BDL 177,000 BDL 0.08 0.09 542 BDL BDL 0.60 BDL CBM009 Osborne Tract 8,680 11,400 35 BDL 175,000 BDL 0.83 0.10 586 BDL BDL 1.30 BDL
Sample # Site Si LiCBM001 Appel 4,700 68 CBM002 Clark 3,800 127 CBM003 Bower 5,400 31 CBM004 Yates 4,200 29 CBM005 North Groves 4,100 36 CBM006 SW Carter 4,400 48 CBM007 Redtop Pod 4,500 42 CBM008 Viper Pod 3,800 51 CBM009 Osborne Tract 4,200 49
USFWS - Region 6 - EC Report - R6/721C/05
33
APPENDIX BTrace elements (in :g/L) in water collected in 2001 from coal bed methane (CBM) produced water discharges and receiving impoundments inthe Powder River Basin, Wyoming.
Sample # Al As B Ba Be Cd Cr Cu Fe Hg Mg MnLynde
CBMDLT1 Discharge <.0222 0.0089 0.104 0.21 <.0004 <.0006 <.00560 0.0085 0.176 <.0002 5.44 0.0031CBMWLT1 Wetland 0.707 0.018 0.142 0.0509 <.0004 <.0006 0.0087 0.0144 0.627 <.0002 14.7 0.0353
Sorenson 3CBMDSOR3 Discharge <.0222 <.00560 0.086 0.688 <.0004 <.0006 0.0067 0.0155 0.686 <.0002 9.47 0.0485CBMWSR3A Wetland 1.16 <.00560 0.098 0.327 <.0004 <.0006 0.0079 0.0153 0.941 <.0002 9.15 0.0314
WestCBMDWES1 Discharge 0.398 <.00560 0.171 0.424 <.0004 <.0006 0.0093 0.0167 0.851 <.0002 11.4 0.032CBMWWES1 Wetland 0.14 0.0223 0.681 0.0283 <.0004 <.0006 0.0087 0.0191 0.479 <.0002 1744 2.09
Appel CBM001 Discharge <.0500 0.39 105.00 1,140 <.500 <.0500 <.500 0.30 1.79 <.005 28,100 35 CBMWAPR1 Wetland 0.112 0.019 0.138 0.0723 <.0004 <.0006 0.0084 0.0165 0.116 <.0002 24 0.0303
BowerCBM003 Discharge 60 1.37 116 353 <.500 0.37 <.500 0.6 0.688 <.005 8160 9CBMWBOW1 Wetland 12 0.0085 0.228 0.208 0.0005 <.0006 0.0205 0.0269 10.4 <.0002 12.1 0.234
USFWS - Region 6 - EC Report - R6/721C/05
34
APPENDIX B (Continued)Trace elements (in :g/L) in water collected in 2001 from coal bed methane (CBM) produced water discharges and receiving impoundments inthe Powder River Basin, Wyoming.
Sample # Mo Ni Pb Se Sr V ZnLynde
CBMDLT1 Discharge <.0044 <.00560 <.0111 <.00560 0.212 <.0044 <.0111CBMWLT1 Wetland <.0044 <.00560 <.0111 <.00560 0.25 0.0065 <.0111
Sorenson 3CBMDSOR3 Discharge <.0044 <.00560 <.0111 <.00560 0.419 <.0044 <.0111CBMWSR3A Wetland <.0044 <.00560 <.0111 <.00560 0.304 <.0044 <.0111
WestCBMDWES1 Discharge <.0044 <.00560 <.0111 <.00560 0.288 <.0044 <.0111CBMWWES1 Wetland 0.0078 0.0143 0.0283 <.00560 5.26 <.0044 <.0111
Appel CBM001 Discharge <1.00 0.50 0 0.12 1,150 <.010 4.30 CBMWAPR1 Wetland <.0044 <.00560 <.0111 <.00560 0.262 <.0044 <.0111
BowerCBM003 Discharge <1.00 2.2 0.13 0.09 335 <.0100 2.8CBMWBOW1 Wetland <.0044 0.0111 0.0144 <.00560 0.278 0.0228 0.0408

USFWS - Region 6 - EC Report - R6/721C/05
35
APPENDIX CTrace elements (in :g/L), electrical conductivity (EC)(in :S/cm), and total dissolved solids (TDS) in coal bed methane (CBM) produced watercollected from closed containment reservoirs and associated CBM discharges [DD-Lat = decimal degrees latitude][DD-Long = decimaldegrees longitude].
Sheridan County/Tongue WatershedSample # Site DD-Lat DD-Long Al As B Ba Be Ca Cd Cr Cu Fe Hg
CBMCCR01 Reservoir 44.92594444 -106.8905556 1530 7.3 374 181 <0.5 33700 1.5 31.8 5.2 1160 <0CBMCCRD1 Discharge 44.92594444 -106.8905556 847 3.3 182 322 <0.5 4130 1.4 4.9 4.3 875 <0
CBMCCR02 Reservoir 44.92013889 -106.8833056 3180 5.6 212 125 <0.5 7130 1.7 9.9 5.8 3070 <0CBMCCRD2 Discharge 44.92013889 -106.8833056 1430 3 204 381 <0.5 4590 1.4 4.7 4.7 806 <0
CBMCCR03 Reservoir 44.91388889 -106.8820000 5300 7 217 155 <0.5 7570 2.2 13 7.7 4120 <0CBMCCRD3 Discharge 44.91388889 -106.8820000 69.3 4.8 180 343 <0.5 4480 1.2 3 1.5 298 <0
Campbell County/Powder River WatershedCBMCCR04 Reservoir 43.87100000 -105.8255556 1610 5.9 115 193 <0.5 14800 1.4 16.9 4.4 1350 <0CBMCCRD4 Discharge 43.87100000 -105.8255556 8.2 2.8 98.6 687 <0.5 37500 1.1 15.7 2.3 376 <0
Sheridan County/Clear Creek WatershedCBMCCR07 Reservoir 44.61983333 -106.3878333 451 2.3 208 204 <0.5 10400 1.2 9.5 2 507 <0CBMCCRD7 Discharge 44.61983333 -106.3878333 3060 4 208 353 <0.5 11100 1.7 14.2 9.1 2920 <0
CBMCCR08 Reservoir 44.61825000 -106.3927500 495 3.1 266 312 <0.5 12300 1.2 11 1.5 412 <0CBMCCRD8 Discharge 44.61825000 -106.3927500 517 <2 215 331 <0.5 10100 1.3 8.7 1.6 663 <0
CBMCCR09 Reservoir 44.62127778 -106.3788333 494 <2 132 40.8 <0.5 4280 2.5 9.3 4.2 428 <0

USFWS - Region 6 - EC Report - R6/721C/05
36
APPENDIX C (Continued)Trace elements (in :g/L), electrical conductivity (EC)(in :S/cm), and total dissolved solids (TDS) in coal bed methane (CBM) produced watercollected from closed containment reservoirs and associated CBM discharges [DD-Lat = decimal degrees latitude][DD-Long = decimaldegrees longitude].
Sheridan County/Tongue WatershedSample # Site DD-Lat DD-Long Mg Mn Mo Na Ni Pb Se Sr V Zn
CBMCCR01 Reservoir 44.92594444 -106.8905556 30900 74.5 2.2 197000 14.7 <5 6.9 478 3.7 5.9CBMCCRD1 Discharge 44.92594444 -106.8905556 1720 9 1.7 466000 6.4 <5 3.5 187 1.2 4
CBMCCR02 Reservoir 44.92013889 -106.8833056 5060 46.7 <1 535000 7.8 <5 5.3 146 7.9 11.2CBMCCRD2 Discharge 44.92013889 -106.8833056 1800 72.7 1.3 482000 10 <5 3.4 216 1.8 3.6
CBMCCR03 Reservoir 44.91388889 -106.8820000 5140 55.2 1 539000 9.9 <5.1 <2 153 12.9 19.4CBMCCRD3 Discharge 44.91388889 -106.8820000 1800 4.8 <1 451000 3.7 <5.1 2.2 166 <1 4.7
Campbell County/Powder River WatershedSample # Site DD-Lat DD-Long Mg Mn Mo Na Ni Pb Se Sr V Zn
CBMCCR04 Reservoir 43.87100000 -105.8255556 14500 78.4 <1 442000 8.6 <5.1 2.9 614 5 6.2CBMCCRD4 Discharge 43.87100000 -105.8255556 11900 27 <1 380000 8.2 <5.1 3.2 1090 <1 2.6
Sheridan County/Clear Creek WatershedCBMCCR07 Reservoir 44.61983333 -106.3878333 6950 7.6 <1 538000 6.1 <5.1 3.3 263 1.2 7.6CBMCCRD7 Discharge 44.61983333 -106.3878333 7140 27.1 <1 564000 9.7 <5.1 3.9 302 6.1 60.2
CBMCCR08 Reservoir 44.61825000 -106.3927500 8440 7.7 <1 344000 6.1 <5.1 6.6 343 <1 6.3CBMCCRD8 Discharge 44.61825000 -106.3927500 5870 9.8 <1 535000 5.6 <5.1 3.9 287 <1 4.7
CBMCCR09 Reservoir 44.62127778 -106.3788333 8950 7.2 1.5 463000 4.7 <5.1 8.4 139 1.6 5.2

USFWS - Region 6 - EC Report - R6/721C/05
37
APPENDIX C (Continued)Trace elements (in :g/L), electrical conductivity (EC)(in :S/cm), and total dissolved solids (TDS) in coalbed methane (CBM) produced water collected from closed containment reservoirs and associated CBMdischarges [DD-Lat = decimal degrees latitude][DD-Long = decimal degrees longitude].
Sheridan County/Tongue WatershedSample # Site DD-Lat DD-Long EC TDS
CBMCCR01 Reservoir 44.92594444 -106.8905556 1960 980CBMCCRD1 Discharge 44.92594444 -106.8905556 1765 909
CBMCCR02 Reservoir 44.92013889 -106.8833056 1940 985CBMCCRD2 Discharge 44.92013889 -106.8833056 1899 953
CBMCCR03 Reservoir 44.91388889 -106.8820000 1970 1000CBMCCRD3 Discharge 44.91388889 -106.8820000 1735 871
Campbell County/Powder River WatershedSample # Site DD-Lat DD-Long EC TDS
CBMCCR04 Reservoir 43.87100000 -105.8255556 n.d. n.d.CBMCCRD4 Discharge 43.87100000 -105.8255556 n.d. n.d.
Sheridan County/Clear Creek WatershedCBMCCR07 Reservoir 44.61983333 -106.3878333 2100 1050CBMCCRD7 Discharge 44.61983333 -106.3878333 1765 863
CBMCCR08 Reservoir 44.61825000 -106.3927500 2080 1050CBMCCRD8 Discharge 44.61825000 -106.3927500 2100 1070
CBMCCR09 Reservoir 44.62127778 -106.3788333 1881 936n.d. = not determined or not measured

USFWS - Region 6 - EC Report - R6/721C/05
38
APPENDIX DTrace elements (in :g/g dry weight) in sediment collected in July 2001 from impoundments receivingcoal bed methane (CBM) produced water discharges in the Powder River Basin, Wyoming.
Sample # Al As B Ba Be Cd Cr CuAppel
CBMSAPR1 6299 5.81 13.5 155 0.761 0.695 14.7 18.7CBMSAPR2 5227 6.25 11.3 158 0.56 0.6 11.8 13.4CBMSAPR3 7513 13.1 15.6 119 0.864 0.934 16 20.7CBMSAPR4 5427 4.61 11.8 137 0.734 0.789 13.9 17.7CBMSAPR5 8258 7.83 13.1 140 0.795 0.843 15.2 18
BowerCBMSBOW1 14290 7.67 13.4 178 1.13 0.712 21.5 22.9CBMSBOW2 14620 4.01 10.9 207 0.891 0.899 20.7 17.2CBMSBOW3 9730 4.75 6.81 134 0.857 0.412 13.5 15.8CBMSBOW4 8374 4.36 10.9 172 1.02 0.564 19.2 18.8CBMSBOW5 10520 3.14 12.2 203 1.04 0.69 20.4 20.4 Little Thunder Reservoir CBMSLTR1 4109 1.57 12.3 115 0.333 0.303 6.47 7.21CBMSLTR2 6197 2.83 10.5 103 0.459 0.46 9.13 10.3CBMSLTR3 8074 2.42 13.1 128 0.594 0.603 9.46 12.9CBMSLTR4 10280 1.94 12.3 143 0.656 0.607 12.7 13.2CBMSLTR5 6140 2.33 15.5 116 0.462 0.401 8.15 9.3
LyndeCBMSLT1 6825 3.67 13.4 147 0.712 0.731 14.2 17.4CBMSLT2 6934 3.41 10.9 109 0.542 0.527 12.1 10.6CBMSLT3 8083 4.85 13.4 112 0.715 0.694 14.6 17.2CBMSLT4 8485 5.07 14.7 141 0.774 0.839 15.4 19.6CBMSLT5 3032 2.36 6.87 120 0.353 0.315 6.97 6.68
Sorenson 1CBMSSR1A 4080 3.61 11.4 82.4 0.442 0.405 8.07 9.36CBMSSR1B 5744 5.42 12 150 0.438 0.453 8.07 14.3CBMSSR1C 5702 4.08 11.6 96.2 0.555 0.529 9.5 14.9CBMSSR1D 6660 4.94 9.83 65.5 0.398 0.42 9.8 14.3CBMSSR1E 6373 4.73 12.2 52.1 0.506 0.534 9.26 16.3
Sorenson 2CBMSSR2A 10200 5.42 15.8 146 0.702 0.705 14.4 19CBMSSR2B 7622 5.39 14.4 144 0.61 0.607 11.5 16.6CBMSSR2C 7295 4.92 13.6 133 0.533 0.541 10.5 14.6CBMSSR2D 9659 11.5 30.1 141 1.03 1.59 13.6 20.7CBMSSR2E 11350 5.26 13.7 138 0.667 0.702 15 16.4
Sorenson 3CBMSSR3A 5272 2.63 9.12 238 0.577 0.459 11.5 10.7CBMSSR3B 6643 4.59 11.5 380 0.655 0.627 15.5 13.5CBMSSR3C 6341 6.62 16.7 324 0.79 0.82 14 12CBMSSR3D 4917 5.84 6.47 146 0.44 0.266 16 5.59CBMSSR3E 4739 5.25 11.8 250 0.579 0.75 15.6 23.8
WestCBMSWES1 8267 4.32 13.1 333 0.78 0.879 13.9 16.2CBMSWES2 9587 15.6 37.4 137 1.44 2.19 15.9 24CBMSWES3 14210 11.7 31.1 134 1.59 2.26 18.1 22.3CBMSWES4 7670 6.54 31.3 132 0.937 1.32 15.3 21.3CBMSWES5 6792 4.65 20.4 120 0.864 1.28 15.8 19.4

USFWS - Region 6 - EC Report - R6/721C/05
39
APPENDIX D (Continued)Trace elements (in :g/g dry weight) in sediment collected in July 2001 from impoundments receivingcoal bed methane (CBM) produced water discharges in the Powder River Basin, Wyoming.
Sample # Fe Hg Mg Mn Mo Ni Pb SeAppel
CBMSAPR1 15120 <.0183 5106 232 <4.59 19.4 14.9 <.459CBMSAPR2 14340 <.0191 4392 230 <4.77 14 12.5 <.477CBMSAPR3 22220 <.0198 5138 229 <4.95 21.6 13.2 <.495CBMSAPR4 14690 0.0213 5968 208 <4.60 18.1 13.2 <.460CBMSAPR5 19360 <.0189 5798 326 <4.73 19.2 13.2 <.473
BowerCBMSBOW1 23060 0.0225 4616 397 <5.00 18.9 19.6 <.500CBMSBOW2 17470 <.0182 4128 699 <4.55 21.7 18.1 <.455CBMSBOW3 13420 <.0186 3556 173 <4.65 14.5 16.9 <.465CBMSBOW4 12430 <.0197 4366 226 <4.92 16.8 18.6 <.492CBMSBOW5 14680 <.0190 4871 287 <4.74 19.5 19.8 <.474 Little Thunder Reservoir CBMSLTR1 6026 <.0189 1163 103 <4.73 6.27 6.39 <.474CBMSLTR2 8798 <.0191 1899 162 <4.77 9.43 9.18 <.477CBMSLTR3 9730 <.0189 2996 238 <4.73 11.5 12.2 <.473CBMSLTR4 9375 0.0195 2378 180 <4.84 11.4 14.1 <.484CBMSLTR5 7789 <.0192 1688 145 <4.80 7.46 9.01 <.480
LyndeCBMSLT1 14600 <.0199 4269 229 <4.97 17.5 13.3 <.497CBMSLT2 12740 <.0191 4297 280 <4.77 12.6 10.7 <.477CBMSLT3 15010 <.0187 4843 226 <4.67 17.5 12.8 0.61CBMSLT4 16050 <.0196 4944 277 <4.89 19.2 15.6 0.62CBMSLT5 8203 <.0185 2817 131 <4.63 8.27 6.56 <.463
Sorenson 1CBMSSR1A 9384 <.0193 1685 175 <4.83 10.5 7.04 <.483CBMSSR1B 17000 <.0198 10060 446 <4.95 10.2 7.52 <.495CBMSSR1C 13050 0.0194 4736 248 <4.82 12.6 9.61 <.482CBMSSR1D 14030 <.0196 12500 365 <4.90 11 8.8 <.490CBMSSR1E 18230 <.0195 13550 614 <4.87 8.36 7.04 <.487
Sorenson 2CBMSSR2A 16340 0.0236 5036 343 <4.80 14.9 12.7 <.480CBMSSR2B 14030 0.0209 5342 313 <4.73 13.4 10.9 <.474CBMSSR2C 13470 0.0201 5580 339 <4.85 12.4 10.4 <.485CBMSSR2D 47880 0.0208 5649 693 <4.88 15.7 8.12 <.488CBMSSR2E 15410 <.0194 4295 329 <4.85 13.7 13.3 <.485
Sorenson 3CBMSSR3A 9848 <.0191 3651 201 5.99 11.6 10.9 <.478CBMSSR3B 15630 0.0198 4496 289 8.1 16.2 12.2 <.473CBMSSR3C 28220 <.0186 3981 428 5.56 14 6.4 <.466CBMSSR3D 10650 <.0186 3057 104 <4.64 9.06 7.68 <.464CBMSSR3E 16320 0.0227 4478 305 <4.60 24.4 18.4 <.460
WestCBMSWES1 20890 <.0186 3500 821 <4.64 16.9 12.3 0.91CBMSWES2 39500 0.0386 10440 2924 <4.84 38.5 12.7 1.34CBMSWES3 24140 0.041 11530 1506 <4.80 42 16.6 1.68CBMSWES4 24270 0.0339 8613 1349 <4.79 26.9 13.6 1.1CBMSWES5 14680 0.0282 5474 436 <4.60 20.8 15.1 <.460

USFWS - Region 6 - EC Report - R6/721C/05
40
APPENDIX D (Continued)Trace elements (in :g/g dry weight) in sediment collected in July 2001 from impoundments receivingcoal bed methane (CBM) produced water discharges in the Powder River Basin, Wyoming.
Sample # Sr V ZnAppel
CBMSAPR1 78.2 23.8 64CBMSAPR2 61.5 19.4 57.2CBMSAPR3 49.8 26.9 78.5CBMSAPR4 74.3 21.1 64.3CBMSAPR5 66.4 24.7 67.7
BowerCBMSBOW1 75.5 32.3 75.9CBMSBOW2 68 30.9 63.1CBMSBOW3 57.9 15.1 55.8CBMSBOW4 71 31.5 66.2CBMSBOW5 74 32.3 75 Little Thunder Reservoir CBMSLTR1 31.2 13 22.4CBMSLTR2 30.5 19.6 31.3CBMSLTR3 78.8 17.2 43.3CBMSLTR4 53.3 20.9 47.7CBMSLTR5 49.5 16.9 30.4
LyndeCBMSLT1 71.6 24.2 61.3CBMSLT2 65.9 14.9 46.6CBMSLT3 57.9 23 57.1CBMSLT4 70.5 24.6 66.8CBMSLT5 34.2 10.1 29.6
Sorenson 1CBMSSR1A 26.6 13.6 28CBMSSR1B 45.8 13 33.5CBMSSR1C 36.9 15.6 43.5CBMSSR1D 43.8 14.2 33.9CBMSSR1E 64.1 16.1 33.1
Sorenson 2CBMSSR2A 102 20.4 49.5CBMSSR2B 106 18.8 42CBMSSR2C 115 17 41.2CBMSSR2D 89.9 25.6 55.6CBMSSR2E 65.6 24.2 46
Sorenson 3CBMSSR3A 107 17.8 38CBMSSR3B 155 20.4 52.7CBMSSR3C 122 34.7 47.4CBMSSR3D 53.4 13.8 33.4CBMSSR3E 89.6 20.5 58.3
WestCBMSWES1 124 18.1 67.2CBMSWES2 195 32.8 113CBMSWES3 179 31.5 153CBMSWES4 119 29 85.8CBMSWES5 81.9 25.5 78.7
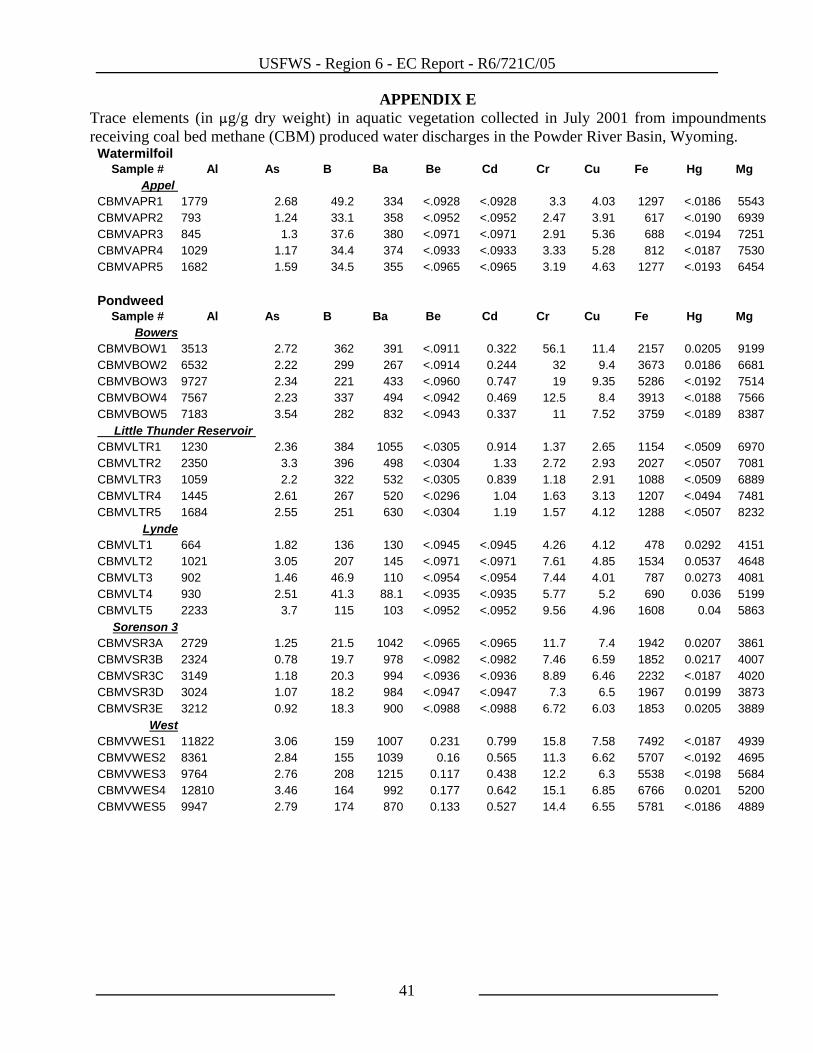
USFWS - Region 6 - EC Report - R6/721C/05
41
APPENDIX ETrace elements (in :g/g dry weight) in aquatic vegetation collected in July 2001 from impoundmentsreceiving coal bed methane (CBM) produced water discharges in the Powder River Basin, Wyoming.
WatermilfoilSample # Al As B Ba Be Cd Cr Cu Fe Hg Mg
Appel CBMVAPR1 1779 2.68 49.2 334 <.0928 <.0928 3.3 4.03 1297 <.0186 5543CBMVAPR2 793 1.24 33.1 358 <.0952 <.0952 2.47 3.91 617 <.0190 6939CBMVAPR3 845 1.3 37.6 380 <.0971 <.0971 2.91 5.36 688 <.0194 7251CBMVAPR4 1029 1.17 34.4 374 <.0933 <.0933 3.33 5.28 812 <.0187 7530CBMVAPR5 1682 1.59 34.5 355 <.0965 <.0965 3.19 4.63 1277 <.0193 6454
PondweedSample # Al As B Ba Be Cd Cr Cu Fe Hg Mg
BowersCBMVBOW1 3513 2.72 362 391 <.0911 0.322 56.1 11.4 2157 0.0205 9199CBMVBOW2 6532 2.22 299 267 <.0914 0.244 32 9.4 3673 0.0186 6681CBMVBOW3 9727 2.34 221 433 <.0960 0.747 19 9.35 5286 <.0192 7514CBMVBOW4 7567 2.23 337 494 <.0942 0.469 12.5 8.4 3913 <.0188 7566CBMVBOW5 7183 3.54 282 832 <.0943 0.337 11 7.52 3759 <.0189 8387 Little Thunder Reservoir CBMVLTR1 1230 2.36 384 1055 <.0305 0.914 1.37 2.65 1154 <.0509 6970CBMVLTR2 2350 3.3 396 498 <.0304 1.33 2.72 2.93 2027 <.0507 7081CBMVLTR3 1059 2.2 322 532 <.0305 0.839 1.18 2.91 1088 <.0509 6889CBMVLTR4 1445 2.61 267 520 <.0296 1.04 1.63 3.13 1207 <.0494 7481CBMVLTR5 1684 2.55 251 630 <.0304 1.19 1.57 4.12 1288 <.0507 8232
LyndeCBMVLT1 664 1.82 136 130 <.0945 <.0945 4.26 4.12 478 0.0292 4151CBMVLT2 1021 3.05 207 145 <.0971 <.0971 7.61 4.85 1534 0.0537 4648CBMVLT3 902 1.46 46.9 110 <.0954 <.0954 7.44 4.01 787 0.0273 4081CBMVLT4 930 2.51 41.3 88.1 <.0935 <.0935 5.77 5.2 690 0.036 5199CBMVLT5 2233 3.7 115 103 <.0952 <.0952 9.56 4.96 1608 0.04 5863
Sorenson 3CBMVSR3A 2729 1.25 21.5 1042 <.0965 <.0965 11.7 7.4 1942 0.0207 3861CBMVSR3B 2324 0.78 19.7 978 <.0982 <.0982 7.46 6.59 1852 0.0217 4007CBMVSR3C 3149 1.18 20.3 994 <.0936 <.0936 8.89 6.46 2232 <.0187 4020CBMVSR3D 3024 1.07 18.2 984 <.0947 <.0947 7.3 6.5 1967 0.0199 3873CBMVSR3E 3212 0.92 18.3 900 <.0988 <.0988 6.72 6.03 1853 0.0205 3889
WestCBMVWES1 11822 3.06 159 1007 0.231 0.799 15.8 7.58 7492 <.0187 4939CBMVWES2 8361 2.84 155 1039 0.16 0.565 11.3 6.62 5707 <.0192 4695CBMVWES3 9764 2.76 208 1215 0.117 0.438 12.2 6.3 5538 <.0198 5684CBMVWES4 12810 3.46 164 992 0.177 0.642 15.1 6.85 6766 0.0201 5200CBMVWES5 9947 2.79 174 870 0.133 0.527 14.4 6.55 5781 <.0186 4889

USFWS - Region 6 - EC Report - R6/721C/05
42
APPENDIX E (Continued)Trace elements (in :g/g dry weight) in aquatic vegetation collected in July 2001 from impoundmentsreceiving coal bed methane (CBM) produced water discharges in the Powder River Basin, Wyoming.
WatermilfoilSample # Mn Mo Ni Pb Se Sr V Zn
Appel CBMVAPR1 374 2.4 4.93 <.928 <.464 416 <.464 21.4CBMVAPR2 165 4.63 4.73 <.952 <.476 397 <.476 20.4CBMVAPR3 201 7.14 4.87 <.971 0.81 470 <.485 26.3CBMVAPR4 186 3.9 4.95 <.933 0.56 437 <.466 26.4CBMVAPR5 192 8.54 5.63 <.965 <.483 425 <.483 20.3
PondweedSample # Mn Mo Ni Pb Se Sr V Zn
BowersCBMVBOW1 132 8.29 16.9 <.911 0.58 646 6.38 72.7CBMVBOW2 207 9.39 14.5 <.914 0.86 375 7.98 115CBMVBOW3 280 4.46 10.8 <.960 0.5 570 12.5 66.5CBMVBOW4 261 12.6 8.67 <.942 0.62 617 8.91 52CBMVBOW5 533 2.88 8.52 <.943 <.472 946 7.63 65.2 Little Thunder Reservoir CBMVLTR1 722 <1.02 3.04 <.509 1.3 407 3.8 17.1CBMVLTR2 668 <1.01 2.79 <.507 1.07 394 7.13 18CBMVLTR3 701 <1.02 1.97 <.509 0.801 333 3.87 17.6CBMVLTR4 1148 <.988 1.95 <.494 2.33 548 5.06 26.7CBMVLTR5 541 <1.01 1.94 <.507 1.86 758 4.98 24.5
LyndeCBMVLT1 213 0.892 6.62 <.945 <.473 189 <.473 42.3CBMVLT2 590 <.485 8.87 <.971 0.57 242 <.485 87.9CBMVLT3 182 1.34 8.75 <.954 0.67 174 <.477 37.8CBMVLT4 160 1.18 7.78 <.935 <.467 175 <.467 51.1CBMVLT5 246 0.481 9.42 <.952 <.476 176 <.476 30.7
Sorenson 3CBMVSR3A 129 1.91 13.9 <.965 <.483 426 2.66 44.3CBMVSR3B 96.8 1.67 12.1 <.982 <.491 417 2.26 40.9CBMVSR3C 115 1.36 11.9 <.936 <.468 409 2.52 36.3CBMVSR3D 103 1.28 10.7 <.947 <.474 414 2.47 42CBMVSR3E 164 1.25 11.9 <.988 0.65 358 2.02 46.8
WestCBMVWES1 906 <.466 11.7 <.933 0.61 541 7.73 51.7CBMVWES2 968 <.480 10.5 <.960 0.52 569 2.39 65.2CBMVWES3 847 <.494 9.66 <.988 <.494 686 3.9 111CBMVWES4 713 <.474 11.1 <.949 <.474 552 8.28 54.6CBMVWES5 603 <.465 11 <.929 <.465 479 6.74 49.9

USFWS - Region 6 - EC Report - R6/721C/05
43
APPENDIX FTrace elements (in :g/g dry weight) in aquatic invertebrates collected in July 2001 from impoundmentsreceiving coal bed methane (CBM) produced water discharges in the Powder River Basin, Wyoming.
OdonatesAppel
Sample # Al As B Ba Be Cd Cr Cu Fe Hg MgCBMIAPR4 162 0.63 7.96 27 <.0917 0.393 <.459 13.5 257 0.193 1390CBMIAPR5 315 0.89 9.8 28.3 <.0917 0.567 <.459 14.7 402 0.237 1656
BackswimmersAppel Al As B Ba Be Cd Cr Cu Fe Hg Mg
CBMIAPR1 41.2 <.740 30.4 10.4 <.148 0.551 <.740 19.2 127 0.206 2388CBMIAPR2 178 <.494 9.07 25 <.0988 0.84 <.494 7.86 296 0.109 1866CBMIAPR3 213 <.483 12.8 33.3 <.0965 1.06 <.483 10.5 332 0.184 2762
BowersCBMIBOW1 246 1.64 24.4 15.1 <.0998 2.15 <.499 20.8 255 0.254 2471CBMIBOW2 647 1.66 13.9 29.7 <.0956 3.26 0.937 29.4 630 0.184 2132CBMIBOW3 302 1.31 8.76 16.9 <.0909 2.26 <.454 21.2 267 0.263 2584CBMIBOW5 170 1 9.93 14.3 <.0960 2.12 <.480 20.5 203 0.261 2568CBMIBOW6 279 1.31 8.7 19.7 <.0960 3.1 <.480 14 437 0.195 2521
WaterboatmenLynde Al As B Ba Be Cd Cr Cu Fe Hg Mg
CBMILT1 301 <1.33 98.6 8.78 <.266 <.266 <1.33 16.1 291 0.282 1335Sorenson 3
CBMISR3A 134 0.82 22 27.8 <.0975 1.45 <.487 25.6 226 0.456 2092CBMISR3B 147 1 28.9 28.9 <.109 1.74 <.544 25.7 216 0.48 2093CBMISR3C 141 <.886 75.7 27.4 <.177 1.3 <.886 26.2 200 0.367 2070
OdonatesAppel Mn Mo Ni Pb Se Sr V Zn
CBMIAPR4 28.1 <.459 1.02 <.917 <.459 23.1 <.459 128CBMIAPR5 30.8 <.459 0.922 <.917 <.459 30.1 0.519 134
BackswimmersAppel Mn Mo Ni Pb Se Sr V Zn
CBMIAPR1 36.3 <.740 <.740 <1.48 <.740 26.4 <.740 144CBMIAPR2 32 <.494 1.07 <.988 <.494 70.7 <.494 105CBMIAPR3 45 <.483 0.809 <.965 <.483 86.5 0.774 149
BowersCBMIBOW1 29.8 <.499 0.669 <.998 <.499 24.3 <.499 159CBMIBOW2 39.3 <.478 1.54 <.956 <.478 38.8 0.928 170CBMIBOW3 31.6 <.454 0.574 <.909 <.454 24.8 <.454 165CBMIBOW5 28.8 <.480 0.568 <.960 <.480 23.9 <.480 168CBMIBOW6 29.9 <.480 0.634 <.960 <.480 32.2 0.67 185
WaterboatmenLynde Mn Mo Ni Pb Se Sr V Zn
CBMILT1 24.1 <1.33 1.87 <2.66 <1.33 13.4 <1.33 174Sorenson 3
CBMISR3A 28.3 <.487 0.743 <.975 2.2 46.7 <.487 190CBMISR3B 26.5 <.544 0.839 <1.09 2.24 43.1 <.544 187CBMISR3C 28.4 <.886 4.38 <1.77 <.886 39 1.95 195

USFWS - Region 6 - EC Report - R6/721C/05
44
APPENDIX GTrace elements (in :g/g dry weight) in tiger salamanders collected in July 2001 from impoundmentsreceiving coal bed methane (CBM) produced water discharges in the Powder River Basin, Wyoming.
Sample # Al As B Ba Be Cd Cr Cu Fe Hg MgAppel
CBMAAPR1 892 <.718 <2.87 33.5 <.144 0.364 25.6 5.89 796 0.0942 1622CBMAAPR2 573 <.729 <2.92 24.6 <.146 0.367 18.6 5.92 519 0.0715 1578CBMAAPR3 1468 <.814 <3.26 34.3 <.163 0.677 36.1 4.57 1104 0.0829 1710CBMAAPR4 652 <.804 <3.22 36.6 <.161 0.443 46.9 6.16 676 0.0805 1774CBMAAPR5 607 <.794 <3.17 30.6 <.159 0.487 64.9 5.25 847 0.0669 1395
BowersCBMABOW1 1086 <.764 <3.06 41.6 <.153 0.541 22.8 5.72 827 0.0796 1609CBMABOW2 2806 2.69 <3.23 41.5 <.161 1.24 24.7 6.03 1658 0.126 1722CBMABOW3 1131 <.751 7.36 49.8 <.150 0.869 104 7.35 1267 0.108 1726CBMABOW4 1588 <1.30 <5.18 57.9 <.259 0.818 19.2 5.56 924 0.103 1656CBMABOW5 1721 <.825 <3.30 44.2 <.165 0.88 59.6 6.09 1135 0.108 1843
Sorenson 3CBMASR3A 1056 <.718 <2.87 120 <.144 0.513 26.6 6.54 987 0.207 1661CBMASR3B 923 <.748 <2.99 138 <.150 0.723 23.8 7.41 1275 0.321 1720CBMASR3C 2918 <.760 <3.04 131 <.152 1.31 36.8 6.8 2243 0.194 1896CBMASR3D 2095 2.21 <2.99 126 <.150 2.84 76.3 4.98 6918 0.186 1502CBMASR3E 3914 <.738 3.1 111 <.148 1.39 137 7.34 3054 0.228 1707
Appel Mn Mo Ni Pb Se Sr V ZnCBMAAPR1 18.1 <.718 9.31 <1.44 <.718 131 1.4 87.7CBMAAPR2 9.82 <.729 8.47 <1.46 <.729 135 <.729 151CBMAAPR3 16.2 <.814 14.2 <1.63 <.814 174 2.32 157CBMAAPR4 19.4 <.804 17.3 <1.61 <.804 164 0.956 201CBMAAPR5 20.8 1.07 21.8 <1.59 <.794 116 1.14 181
BowersCBMABOW1 14.7 <.764 9.61 <1.53 <.764 144 1.26 89.4CBMABOW2 18.5 <.806 11.8 <1.61 <.806 144 3.52 98.7CBMABOW3 35.7 1.7 29 <1.50 <.751 140 1.84 125CBMABOW4 30.7 <1.30 9.64 <2.59 <1.30 186 2.23 122CBMABOW5 26.4 <.825 20.8 <1.65 2.18 172 2.44 102
Sorenson 3CBMASR3A 17.7 1.05 7.98 <1.44 <.718 157 1.51 121CBMASR3B 23.4 <.748 5.98 <1.50 1.95 189 1.48 122CBMASR3C 36.1 1.32 13.1 <1.52 <.760 174 4.92 122CBMASR3D 91.8 1.77 26.3 <1.50 <.748 118 12.7 85CBMASR3E 50.4 2.18 34.8 <1.47 <.738 130 5.82 118

USFWS - Region 6 - EC Report - R6/721C/05
45
APPENDIX HTrace elements (in :g/g dry weight) in whole-body fish collected in July 2001 from two impoundmentsreceiving coal bed methane (CBM) produced water discharges in the Powder River Basin, Wyoming.
Little Thunder Reservoir Black Bulhead
Sample # Al B Ba Cd Cr Cu Fe Hg Mg Mn MoCBMFLTR1 749 2.45 56.9 0.119 0.741 3.05 421 0.119 1851 21.4 <1.00CBMFLTR2 161 1.65 54.6 <.0973 0.331 2.56 160 0.121 1922 21.7 <.973CBMFLTR3 146 0.794 39 <.100 <0.1 2.74 148 0.137 1843 15.4 <1.00CBMFLTR4 193 <0.496 50 <.0992 0.217 3.1 168 0.142 2004 14.3 <.992CBMFLTR5 81.8 <0.514 50.6 <.103 0.136 3.12 127 0.16 2243 17.8 <1.03
LyndeFathead Minnow
Sample # Al B Ba Cd Cr Cu Fe Hg Mg Mn MoCBMFLT1 139 <3.31 28.8 0.883 307 6.71 2173 0.182 1570 32.7 5.47CBMFLT2 182 <3.19 53.5 0.288 98.3 4.76 888 0.194 2168 18 1.72CBMFLT3 843 <3.02 52.4 0.671 213 7.48 1725 0.197 2250 35 4.07CBMFLT4 241 <2.98 36.9 0.151 24.4 4.15 344 0.296 2187 14.5 <0.744CBMFLT5 264 <3.18 55 0.354 111 5.75 845 0.306 2281 24.8 1.74
Little Thunder Reservoir Black Bulhead
Sample # Ni Pb Se Sr V ZnCBMFLTR1 <.100 <.502 3.6 327 0.72 118CBMFLTR2 <.0973 <.486 2.25 342 <.0973 148CBMFLTR3 <.100 <.500 2.61 275 <.100 178CBMFLTR4 <.0992 <.496 4.36 345 <.0992 135CBMFLTR5 <.103 <.514 2.61 334 <.103 167
LyndeFathead Minnow
Sample # Ni Pb Se Sr V ZnCBMFLT1 113 <1.66 3.92 118 2.42 225CBMFLT2 29.9 <1.60 2.28 214 1.26 270CBMFLT3 46.8 36.5 2.59 180 2.7 252CBMFLT4 10.4 <1.49 <0.744 208 0.846 235CBMFLT5 30.9 <1.59 4.36 214 1.23 190