assessment of costs and benefits of biogas and biomethane · ii . assessment of costs and benefits...
TRANSCRIPT

Assessment of Cost and Bene�ts of Biogas and Biomethane in Ireland
Assessment of Cost and Bene�ts of Biogas and Biomethane in Ireland
Assessment of Cost and Bene�ts of Biogas and Biomethane in IrelandReport Summary
Assessment of Costs and Benefits of Biogas and Biomethane
Report prepared for SEAI by:
Ricardo Energy & Environment
Confidentiality, copyright & reproduction:
This report is the Copyright of SEAI. It has been prepared by Ricardo Energy & Environment, a trading name of Ricardo-AEA Ltd, under contract to SEAI dated 05/07/2016. The contents of this report may not be reproduced in whole or in part, nor passed to any organisation or person without the specific prior written permission of SEAI. Ricardo Energy & Environment accepts no liability whatsoever to any third party for any loss or damage arising from any interpretation or use of the information contained in this report, or reliance on any views expressed therein.
June 2017

ii
Assessment of Costs and Benefits of Biogas and Biomethane
Summary
S1 Introduction
Ireland has a long term vision for a low carbon energy system with greenhouse gas emissions from the energy sector reduced by between 80% and 90% compared to 1990 levels by 2050. The recent energy white paper1 recognised that to achieve this ambitious and challenging target, will require a radical transformation of Ireland’s energy system. It will require generating electricity from renewable sources, and moving to lower emissions fuels (e.g. from peat and coal to gas) and ultimately away from fossil fuels altogether. This study looks at the contribution that biogas and biomethane could make to renewable energy production, through electricity and heat generation and the replacement of natural gas. It assesses the economic costs and benefits of increasing the supply of biogas and biomethane, and also looks at the wider benefits of biogas production, such as better management of wastes and wider effects in the economy. As such it fulfils the commitment made in the draft Bioenergy Plan2, and echoed in the energy white paper, to carry out an economic assessment of the potential for the development of biogas.
This study was overseen by a steering group, nominated by Working Group 2 of the draft Bioenergy Plan and comprised of representatives from a range of relevant Government Departments, regulatory bodies and academic experts, and managed by SEAI. The steering group met regularly to discuss progress, provide valuable input, agree key assumptions in the analysis, and review results. The study also carried out a large amount of stakeholder consultation, including holding a workshop in September 2016 in Dublin, which was focussed on identifying potential barriers to further biogas deployment.
At the same time that this study was carried out, the study in support of the planned Renewable Heat Incentive (RHI) (carried out by Element Energy) was also examining the production of heat from biogas and the production of biomethane for the gas grid. Ricardo Energy & Environment and Element Energy worked closely together to ensure that information collected on the costs of biogas and biomethane production in this study were used by Element Energy in the RHI study and that other economic data required for analysis was consistent between the two studies.
S2 The potential for producing biogas and biomethane
Biogas and biomethane can be produced and utilised in a variety of ways. Anaerobic digestion (AD) plants can utilise a wide variety of feedstocks ranging from food wastes, to animal slurries to specifically grown energy crops such as grass silage, breaking them down to produce biogas, a mixture of methane (CH4) and carbon dioxide (CO2), this biogas can be combusted in boilers to produce heat, or in combined heat and power plant (typically) gas engines to provide both heat and electricity. Alternatively, the biogas can undergo further upgrading to remove the CO2, to produce an almost pure stream of biomethane. This biomethane can then be injected into the gas network at appropriate points and be transported along with the natural gas to all gas consumers. Other ways of using this biomethane include storing it on the site, and then transporting it by container to off gas grid users, or dispensing it as a vehicle fuel at an on-site fuelling station. Looking to the future, biomethane could also be produced by other technologies such as gasification or power to gas technologies, where hydrogen produced through electrolysis is combined with the CO2 in biogas to produce biomethane. These future technologies, which could significantly increase the potential for biomethane production, but are not yet fully mature, are discussed further in Section S6.
Ireland has a number of waste feedstocks (e.g., food wastes and cattle and pig manures or slurries) which could be used to produce biogas, that have a zero or low cost. Indeed, in the case of some waste feedstocks, an AD plant might receive a gate fee for accepting the waste. These low cost waste feedstocks could produce up to 126 ktoe (5.3 PJ) of biogas per year, equivalent to just over 3% of natural gas supply in 2015. A much larger resource, albeit at a higher cost is grass silage. Much of the grassland used for grazing is currently under-utilised, and through improved management of livestock and improved grass cultivation, additional land could be freed from grazing and be available for
1 DCENR, 2015. Ireland’s Transition to a Low Carbon Energy Future 2015-2030.2 DCENR, 2014. Draft Bioenergy Plan.

iii
Assessment of Costs and Benefits of Biogas and Biomethane
additional silage production or for other enterprises. If this can be achieved, then it is estimated that grass silage could produce up to 837 ktoe (35 PJ) of biogas, equivalent to 22% of natural gas supply in 2015.
In order to explore the benefits of exploiting this biogas potential could bring, four deployment scenarios were constructed which look at increasing levels of biogas and biomethane production (Table S1).
The first scenario ‘Waste based AD’ makes use of waste streams such as food wastes and slurries as these are the lowest cost feedstocks. However these waste feedstocks form a relatively small proportion of the overall resource that could be used for AD, and so the second scenario ‘Increased biomethane’ begins to make use of the large grass silage resource. This is assumed to be utilised mainly in large AD plants to produce biomethane for injection at the 42 above ground installation points identified by Gas Networks Ireland (GNI) as the most accessible and least cost points of entry into the gas grid3. The third scenario ‘All AD feedstocks’ is an ambitious scenario designed to illustrate the costs and benefits of utilising all of the feedstocks identified as available for AD. This assumes that biomethane would also be injected on the distribution network4. The final ‘Exploratory’ scenario examines the additional costs and benefits which could arise if biomethane production was expanded further in the future (from 2030 onwards) by building large gasification plants to produce biomethane from wood chips or pellets. These wood feedstocks could be supplied domestically from the forestry industry, or through energy crops such as short rotation coppice if appropriate measures were in place to overcome barriers and support widescale production5. Wood chips and pellets could also be imported.
Table S1 Key characteristics of scenarios
Scenario Description
Waste based AD
Maximum use of waste streams (food wastes and slurries) as these are the lowest cost feedstocks and deliver the highest GHG savings
Increased biomethane
This builds on scenario the waste based AD scenario, and begins to make use of the large grass silage resource that Ireland has. The silage is predominantly used in large AD plants to produce biomethane, which it is assumed is injected into the gas grid at the 42 above ground installation points identified by GNI as the most accessible and least cost points of entry into the grid.
All AD feedstocks
Maximum use of grass silage and other resources. This scenario is designed to show the maximum biogas/biomethane production which could be achieved through anaerobic digestion. It assumes that additional biomethane injection points in the gas distribution network are identified.
Exploratory Exploratory scenario designed to show how energy production could be increased by using gasification, a technology which is not yet mature, but could produce large quantities of biomethane from wood chips/pellets and energy crops.
The utilisation of feedstocks for AD in 2050 under the first three scenarios is shown in Figure S1. Utilising all of the waste feedstocks and grass silage feedstock (as in the All AD feedstocks) could require almost 900 AD plants (Figure S2). A mixture of different size plants are assumed to be deployed, ranging from 100kWe to 500kWe for farm based CHP plants to 3000 kWe for waste based CHP plants,
3 O’Shea et al, 2016. Assessing the total theoretical, and financially viable, resource of biomethane for injection to a natural gas network in a region. Applied Energy 188 (2017) 237–256 4 The 42 AGIs assumed to be utilised in the ‘Increased biomethane’ scenario, were identified by GNI as being at locations where there is a sufficient additional gas flow so that there would be no availability constraints even in low summer time flow. It is also possible to locate a large number of biomethane injection facilities on the distribution network. However, this would require a more detailed analysis of gas flow and pressure at each potential site location. It is assumed that under the ‘All AD feedstocks’ scenario, the necessary analysis is carried out and suitable injection points on the distribution network are identified. 5 A full discussion of the potential energy crop and forestry resource, potential costs and barriers which would need to be overcome is given in Ricardo Energy & Environment, 2016. Bioenergy Supply in Ireland 2015 – 2035. A report for SEAI.

iv
Assessment of Costs and Benefits of Biogas and Biomethane
and up to 6,000 kWe for biomethane plants. While there are far fewer biomethane plants than biogas plants, their larger size means that they utilise a large fraction of the feedstocks. The ‘Exploratory’ scenario has the same deployment of AD plants (and use of AD feedstocks) as the ‘All AD feedstocks’ scenario but also includes 3 large gasification plants built between 2030 and 2040. The scenarios implicitly assume that action is taken in the short term to address the challenges (discussed in S4) of achieving large scale deployment of biogas and biomethane plants.

v
Assessment of Costs and Benefits of Biogas and Biomethane
Figure S1 Utilisation of AD feedstocks in each scenario
Figure S2 Number of AD plants in each scenario
0
100
200
300
400
500
600
700
800
900
2030
2050
2030
2050
2030
2050
Waste based AD Increased biomethane All AD feedstocks
No
of p
lant
Boilers CHP Biomethane
0%
5%
10%
15%
20%
25%
0
5
10
15
20
25
30
35
40
45
Waste based AD Increased biomethane All AD feedstocks
Biog
as p
rodu
ctio
n as
% o
f nat
ural
gas
sup
ply
in 2
015
PJ o
f bio
gas
prod
uctio
n
Sewage sludge Food waste Industrial food wasteSlurry/manure Silage
Scenarios

vi
Assessment of Costs and Benefits of Biogas and Biomethane
S3 What can biogas and biomethane contribute to bioenergy production?
Figure S3 shows that AD plants could make a substantial contribution to primary energy supply in Ireland by 2050. Under the ‘All AD feedstocks’ scenario, biogas production could be 1,044 ktoe (43.7 PJ) of primary energy equivalent to almost 28% of current natural gas supply6. Over half of this is assumed to be upgraded to biomethane and injected into the gas grid (534 ktoe), with the rest used to produce electricity (190 ktoe) and heat (108 ktoe) mainly in CHP plants. The additional gasification plants in the exploratory scenario would increase injection of biomethane to the grid by about 40% to 737 ktoe (30.9 PJ). Power to gas technologies (which were not included in the scenarios due to a lack of robust cost data) could increase biogas production even further.
Figure S3 Renewable energy production under each scenario
Biogas and biomethane could deliver substantial carbon savings (Table S2 and Figure S4). For example, under the ‘All AD feedstocks scenario’ national greenhouse gas emissions could be reduced by 2 Mt CO2eq, which is equivalent to 3.7% of total national greenhouse gas emissions in 19907. If carbon savings which occur outside of Ireland (e.g. emissions associated with the production of imported gas) are also included, then savings are increased by about 10%.
Carbon savings do not increase across the scenarios as rapidly as energy produced does. This is because the additional grass silage used to increase biogas production in the ‘Increased biomethane’ and ‘All AD feedstocks’ scenarios does not deliver as high carbon savings per unit of biogas produced as the food wastes and animal wastes which are the predominant feedstocks in the waste based AD scenario.
S3 The costs and benefits of biogas and biomethane deployment
Increasing the use of biogas and biomethane could bring wide ranging benefits to Ireland, but will incur additional costs from building and operating biogas and biomethane plants. The overall economic benefit to society of increased deployment in the four deployment scenarios above was
6 Based on 3761 ktoe of natural gas supply in 2015 from 2015 Energy Balance for Ireland 7 National greenhouse gas emissions in 1990 are estimated to be 56.1 Mt CO2eq. Total national emissions in 2015 were estimated as 59.9 Mt CO2 eq and the 2 Mt CO2 eq saving is equivalent to 3.4% of these 2015 emissions. EPA, 2017. Ireland’s Greenhouse Gas Emissions Data and Charts 2015, accessed at http://www.epa.ie/pubs/reports/air/airemissions/ghgemissions/ on 18th April 2017.
0%
5%
10%
15%
20%
25%
30%
35%
0
5
10
15
20
25
30
35
40
45
50
55
2030
2050
2030
2050
2030
2050
2030
2050
Waste based AD Increased biomethane All AD feedstocks Exploratory
Bio
gas/
met
hane
as
% o
f nat
ural
gas
sup
ply
in 2
015
PJ
of re
new
able
ene
rgy
Electricity supplied Heat supplied Biomethane supplied Total biogas production

vii
Assessment of Costs and Benefits of Biogas and Biomethane
therefore evaluated using a monetary cost benefit analysis (CBA). This was performed according to the guidance given by the Central Expenditure Evaluation Unit (CEEU)8.
Table S2 Carbon savings under each deployment scenario
Basis of savings
Waste based AD
kt CO2 eq/yr
Increased biomethane kt CO2 eq/yr
All AD feedstocks
kt CO2 eq/yr
Exploratory
kt CO2 eq/yr 2030
Within Ireland 477 584 711 711 Global 525 650 787 787 2050
Within Ireland 575 805 2,052 2,456 Global 631 899 2,280 2,771
Note: carbon savings are estimated assuming that biomethane displaces natural gas9, biogas CHP displaces electricity from the grid and heat produced in gas boilers, and biogas boilers displace gas boilers.
Figure S4 Carbon savings from biogas and biomethane
In the CBA, the capital and operating costs of the biogas boilers and CHP plants are compared to the costs of supplying the same quantity of heat using conventional boilers operating on fossil fuels (gas or oil) and using electricity supplied from the grid (‘the counterfactual scenario’). The capital and operating costs of the biomethane plants are compared to the cost of natural gas in the gas grid.
As well as evaluating the costs of supplying energy from biogas or fossil fuels, the CBA also evaluates the greenhouse gas (GHG) emissions and emissions of key pollutants responsible for poor air quality, which arise from supplying energy using biogas or conventional fossil fuels. The additional carbon savings which accrue from using waste feedstocks in AD, rather than having to dispose or otherwise
8 http://publicspendingcode.per.gov.ie/wp-content/uploads/2012/08/D03-Guide-to-economic-appraisal-CBA-16-July.pdf 9 As the biomethane is assumed to be injected into the gas grid and to then form a component of gas supply, the most appropriate fuel for comparison is natural gas.
0%
1%
2%
3%
4%
0
500
1,000
1,500
2,000
2,500
2030 2050 2030 2050 2030 2050 2030 2050
Waste basedAD
Increasedbiomethane
All ADfeedstocks
Exploratory
% o
f nat
iona
l GH
G e
mis
sion
s in
199
0
kt C
O2
e
Energy production and use Avoided slurry storage

viii
Assessment of Costs and Benefits of Biogas and Biomethane
manage the wastes are also calculated. The emissions are then given a monetary value using a shadow price of carbon and marginal damage cost estimates for the air pollutants.
Finally, the costs in each future year (from producing energy and from emissions of carbon and air pollutants) are discounted back to the present year, using the societal (real) discount rate recommended by the CEEU of 5% real. This is done for both the biogas deployment scenario and for the counterfactual scenario where equivalent amounts of energy are supplied from conventional fossil fuels. A comparison of these two sets of discounted costs then determines whether there is a net benefit or cost to society of deploying the biogas and biomethane plants.
As the scenarios extend to 2050, there is inevitably some uncertainty in how a number of key parameters could change, and so as well as a base case, two sensitivity analysis were carried out. Assumptions about key parameters in each case were:
• ‘Base case’: AD feedstock prices have the values established through consultation with stakeholders; gas, oil and electricity prices rise according to a ‘central’ projection of future prices (a rise of 42% by 2030 for gas and electricity and 69% for oil)., and the shadow carbon price is as set out in the CEEU guidance (€20167.9/t CO2 in 2016, rising to €201611/t CO2 in 2020, €201639/t CO2 in 2030 and €2016112/t CO2 in 2050).
• ‘Biogas favourable conditions’: the main AD feedstock, grass silage, can be supplied at a lower price (€25/t instead of €30/t). A wide range appears to exist in the cost of providing silage as a feedstock10, and it is feasible that guidelines could be developed on how to sustainably reduce production costs. Fossil fuel prices were assumed to rise more steeply in the future11, raising the cost of energy in the counterfactual scenario, and shadow price of carbon is 5% higher post 2020 than in the base case12, increasing the value of the carbon savings the biogas deployment scenarios delivered.
• ‘Higher AD feedstock prices’: the development of the market for AD feedstocks leads to increased competition for waste feedstocks and silage, meaning that gate fees for waste are reduced by 20% (e.g. from €50/t to €40/t for food waste) and the price of grass silage increases by 20% (to €36/t).
The ‘Waste based’ scenario delivers net benefits in both 2030 and 2050 (Table S3). This is partly because the gate fees for waste mean that the societal costs of energy from biogas are lower than those from fossil fuels, and partly because of the large GHG savings achieved. Even under an assumption of reduced gate fees, the scenario still has a net benefit. In the ‘Increased biomethane’ scenario, the additional use of silage, which is a higher cost feedstock, increases the costs of producing biogas and reduces GHG savings per unit of biogas production, but overall the scenario still delivers a net benefit to 2050. Maximising use of silage in the ‘All AD feedstocks’ scenario and hence maximising biogas production from AD, leads to no net benefit in the base case as the cost of the silage is much higher than the cost of the waste feedstocks and means that the average costs of energy produced from AD is higher. However under the ‘biogas favourable’ assumptions of higher fossil fuel prices and shadow carbon prices, and lower grass silage costs, the scenario would deliver a net benefit to society.
The exploratory scenario has an even higher net cost than the ‘All AD feedstocks’ scenario due to the high cost of producing biomethane in the three gasification plants included in it. Gasification is not a fully mature technology and currently has a high capital cost. This and the cost of the feedstock for the plant (wood chips/pellets) mean that biomethane produced from them has a high cost.
Figure S5 shows the net benefit or cost to 2050 in each scenario against the quantity of renewable energy produced. The range for each scenario shows the net benefit or cost under the ‘base case assumptions’ the ‘biogas favourable conditions’ assumptions, and the ‘higher AD feedstock costs’ assumptions. It highlights how the additional renewable energy production in the ‘All AD feedstocks’ and ‘Exploratory’ scenarios is achieved at an increasing cost to society. This is principally due to the
10 McEniry J et al, 2013.The effect of feedstock cost on biofuel cost as exemplified by biomethane production from grass silage. Biofuels, Bioproducts and Biorefining, 5: 670-682 11 Under a higher fossil fuel price scenario, by 2030, gas prices are 15% higher and oil prices 5% higher. 12 The shadow carbon price in the CEEU guidance for the period post 2002 are based on a price projection for the ETS in the EU 2030 Climate and Energy Reference Scenario, and rise to €2016112/ t CO2 in 2050. However other modelling work has indicated that the cost of achieving deep cuts in carbon emissions could have as high as about €2016350/t CO2, almost triple the shadow price of carbon in 2050 assumed in the CBA. (See for example, Chiodi A et al, 2013. Modelling the impacts of challenging 2050 European climate mitigation targets on Ireland’s energy system. Energy Policy 53 (2013) 169-189)

ix
Assessment of Costs and Benefits of Biogas and Biomethane
higher cost of the silage which is the main AD feedstock in these scenarios and partly due to the lower carbon savings that use of silage delivers compared to utilisation of waste feedstocks. In the exploratory scenario the high cost of biomethane production from the gasification plants further increases the net cost. However these two scenarios deliver substantially more renewable energy and much greater carbon savings that the increased biomethane scenario, and such higher cost options may be necessary if Ireland is to meet the challenging reduction in greenhouse gas emissions from the energy sector (of 80 to 95% by 2050) that it aspires to.
Table S3 Net cost or benefit of biogas deployment scenarios
Scenario Waste Increased biomethane
All AD feedstocks Exploratory
Base case
Net cost or benefit to 2030 (€M2016)
69 23 (-29)
Net cost or benefit to 2050 (€M2016)
407 173 (-745) (-1410)
Biogas favourable conditions
Net cost or benefit to 2030 (€M2016)
126 95 56
Net cost or benefit to 2050 (€M2016)
581 490 10 (-593)
Higher AD feedstock costs
Net cost or benefit to 2030 (€M2016)
35 (-20) (-77)
Net cost or benefit to 2050 (€M2016)
324 8 (-1119) (-1784)
Note: positive numbers indicate net benefit; negative numbers (in brackets) indicate net costs.
Figure S5 Net cost or benefit of scenario to 2050 versus quantity of renewable energy produced
-1,800-1,600-1,400-1,200-1,000
-800-600-400-200
0200400600800
0 10 20 30 40 50
M€
PJ of renewable energy in 2050
Waste based AD Increased biomethane All AD feedstocks Exploratory
Net
ben
efit
Net
cos
t

x
Assessment of Costs and Benefits of Biogas and Biomethane
In the future, improving the efficiency of the AD process to maximise the yield of biogas, reducing the costs of AD and biogas upgrading systems, and increasing the GHG savings achieved from biomethane plants, by e.g. reducing leakage from AD plants, combusting off-gases from biomethane upgrading and ensuing that feedstocks such as grass silage are produced in as ‘carbon efficient’ way as possible, could all help to improve the net benefit achieved from biogas deployment. Similarly in the longer term, reductions in the cost of gasification technology as it matures, could help to reduce the costs of producing biomethane in this way.
Wider benefits
Increased deployment of biogas and biomethane could also bring wider benefits to Ireland. For example, it is estimated that construction of all the biogas plants assumed to be deployed by 2050 in the ‘All AD feedstocks’ plants could directly lead to over 5,000 jobs, and that operating these plants could create over 3,000 jobs (Table S4). In addition, there will also be beneficial ‘knock-on’ effects in the form of ‘indirect’ jobs created in supply chains of the sectors involved in energy production, and ‘induced’ jobs driven by increased household expenditure associated with the additional income earned by workers employed in plants. The estimates in Table S4 are of the ‘gross’ effect that increased biogas deployment might have on jobs, i.e. they do not take account of any reduction in jobs which might result from the reduced use of fossil fuels under the biogas deployment scenarios, and are subject to relatively high uncertainty and a number of caveats, due to the difficulty of estimating employment effects.
The estimated contribution made to GDP by the biogas and biomethane industry i.e. Gross Value Added13 in the economy, is shown in Table S5. This shows both GVA arising directly from spending on biogas and biomethane plants and GVA arising indirectly, i.e. in sectors involved in the supply chain such as agriculture.
Table S4 Illustrative estimates of jobs created under each deployment scenario
Scenario Waste Increased biomethane
All AD feedstocks
Exploratory
Construction jobs (all installations) 1,330 1,916 5,293 6,869
Operational jobs (in place in 2050) 340 796 3,404 4,301
Note: Based on combining expenditure on biogas plants under the scenarios with estimates of jobs created per € spend.
Table S5 Illustrative estimates of GVA created under each deployment scenario
Scenario Waste
€M
Increased biomethane
€M
All AD feedstocks
€M
Exploratory €M
Total GVA from construction of all biogas and biomethane plants to 2050 (undiscounted)
Direct effects 327 471 1,302 1,690
Indirect effects 191 276 762 989
GVA from operation of biogas and biomethane plants in 2050 (single year estimate)
Direct effects 32 74 317 400
Indirect effects 9 to 16 20 to 37 85 to 157 108 to 199
13 Gross value added is the value of output less the value of intermediate consumption; it is a measure of the contribution to GDP made by an individual producer, industry or sector.

xi
Assessment of Costs and Benefits of Biogas and Biomethane
Other benefits which could results from increased deployment include:
• Reduction in dependence on energy imports and improved energy security: The potentially substantial contribution that biomethane could make to natural gas supply (which currently relies substantially on imports) would help to diversify sources of gas supply thus improving energy security and helping to shield against possible price instability or volatility in international energy markets14.
• Improved nitrogen availability: Digestion of livestock slurry will typically increase availability of the nitrogen in the slurry, improving the value of the material as a fertiliser. This can be particularly beneficial in organic farming where inorganic fertilisers are not used and recycling of nutrients in farm waste materials is therefore at a premium
• Improved waste management: AD presents an opportunity to divert organic wastes away from traditional management methods, such as landfill and composting, and to improve the management of slurries. It can also reduce odours from slurry spreading as the concentration of odour in the air is significantly lower when digestate, instead of untreated slurry, is applied on the fields.
• Improved biodiversity due to the lower pathogen loading in digestate compared to slurry.
S4 Achieving deployment
The CBA discussed above assessed the costs and benefits of deploying biogas and biomethane at a societal level. However, for deployment of biogas and biomethane to actually materialise, then development of the plants must be financially viable. The cost of the heat, electricity or biomethane produced by the plants, must be comparable to the cost of energy produced by alternative, fossil fuelled plants. If it is higher, or if other non-financial barriers exist then some form of direct subsidy or support and other policy measures to address other barriers, will be needed to encourage development.
An assessment of the financial viability of a wide range of biogas and biomethane plants, at different scales and using different feedstocks indicated that almost all produced energy is at a higher cost than the fossil fuel alternative and would need some form of direct subsidy or support to encourage their development. Without such support it is highly unlikely that at current fossil fuel and carbon prices, more than a few AD plants would be developed. Possible mechanisms for support for heat from biogas plants and for biomethane are currently being considered by the Government as part of the proposed Renewable Heat Incentive, and support for electricity from renewables is being considered under a new support scheme, now that the current feed-in-tariff scheme (REFIT3) is closed to new applicants.
The analysis showed that in some cases waste based biogas boilers and CHP plants could deliver heat more cheaply than conventional fossil fuels. The fact that very few such plants are currently being built suggests that there are other, non-financial barriers to their development. Consultation with stakeholders identified a number of such challenges, which could be hindering development. These ranged from issues associated with developing a secure supply of feedstock of appropriate, consistent quality and price, to issues associated with technology and infrastructure and regulatory and financial barriers. A key recurring theme was a general lack of easily available information regarding AD technologies, their operation and the potential impacts and benefits, and this underpinned several of the barriers identified. For example, a lack of information and understanding about AD technology within planning authorities can lead to uneven treatment of the technology between authorities. A lack of understanding in the general public, can lead to them assuming that AD is similar to waste facilities, and lead to objections based on its perceived rather than actual impacts. Particularly at smaller farm scale, a lack of information about the technology for farmers may mean that even where conditions for plant deployment are favourable, it is not considered.
Many of these information related issues are likely to lessen if deployment of biogas and biomethane plants increases and all concerned become more knowledgeable, as more systems pass through the development cycle and public awareness of the technology grows. However, taking action to address them now, could help the industry begin to grow. Some of the challenges identified are specific to Ireland, but many are more generic and will have been faced in other European countries, which have 14 While the new Corrib gas field will greatly enhance Ireland’s security of supply in the short-term, in the medium-to-long-term, post 2020, Ireland is likely to remain largely dependent on imported natural gas to meet demand.

xii
Assessment of Costs and Benefits of Biogas and Biomethane
subsequently had successful development of biogas and biomethane plants. This suggests that they are not insurmountable, and that there are likely to be straightforward actions which can be taken to address them. Actions taken in other countries to address these challenges could provide useful insights into how Ireland could address some of the issues identified.
S5 Sustainability considerations
Ensuring the sustainability of new sources of energy is key to securing the long term sustainability of Ireland’s energy system and to ensuring that long term carbon saving targets can be achieved. Biogas and biomethane plants deliver GHG savings compared to conventional fossil fuels, but the level of savings at individual plants vary, mainly due to the type of feedstocks used. Plants using wastes as a feedstock offer the highest levels of GHG savings, as there are no emissions associated with the production of the feedstock. In the case of plants using grass silage GHG savings are lower, due to the emissions associated with production of the grass silage. These arise e.g. from the production of fertilisers which are applied during cultivation, emissions of nitrous oxide (a greenhouse gas) from the soil when the fertiliser is applied, and from the use of farm machinery and vehicles to cultivate, harvest and transport the grass silage to the AD plant.
The Renewable Energy Directive (RED) requires that from 2017, biofuels produced for transport deliver a 60% saving compared to a fossil fuels comparator set in the Directive, meaning that biofuels must have lifecycle emissions of 33.5 g CO2 eq/MJ or less. AD plants using food waste or slurries would easily meet this criteria, but an initial estimation of emissions for a typical grass silage plant in Ireland suggests that the biomethane produced would only just meet this limit (at 33.5 g CO2). A successor to the RED is currently being discussed and the initial proposal15 is to set more stringent criteria with biofuels produced in all new installations operational from 2021 having to deliver savings of 70%, i.e. they would need to have emission of 28.2 g CO2/MJ16 or less. This could be challenging for a plant digesting only grass silage to meet.
The RED does not set any GHG savings criteria for solid and gaseous biomass used to provide heat and power although Member States may set their own criteria. While Ireland has not yet set any sustainability standards for solid and gaseous biomass, other countries have. So for example the UK has set a sustainability criteria of 34.8 g CO2/MJ for heat and for biomethane, which operators must meet if they are to be eligible for RHI payments for the heat or biomethane. The proposed recast of RED does include GHG criteria for solid and gaseous biomass fuels from 2021, and if these are retained in the final Directive, would need to be adopted within Ireland. The current proposals would mean that electricity produced from biogas or biomethane would need to have lifecycle emission of less than 36.6 g CO2/MJ, and that heat produced would need to have emissions of less than 16 g CO2/MJ.
GHG emissions from AD plants can be reduced. Ensuring a good biogas yield from the feedstocks, minimising leakage from the AD plant and from the biogas upgrading system and closed storage of digestate will help to reduce GHG emissions per unit of biomethane produced. For example, off gases from the upgrading unit can be combusted to ensure that any remaining methane in the off gases is destroyed. For grass silage based plants, co-digesting silage with other waste feedstocks such as slurry or food waste would help to reduce average emissions per unit of biogas or biomethane produced. Maximising the use of digestate from the AD plant in production of the silage, with a corresponding reduction in inputs of inorganic N will also help to reduce emissions. More generally, there will be a trade-off between the application of N to increase yield (which helps to improve GHG emissions per unit of biogas) and the soil related N2O emissions from the N application and for inorganic N fertiliser the emissions associated with fertiliser production (which will increase GHG emissions per unit of biogas). Research to find the optimum levels of N application for silage for use in AD plants could therefore be useful in helping to ensure that silage based AD plant can meet the more stringent future GHG criteria which are being discussed. In the future it is possible that using the power to gas technologies discussed below, which increase the biomethane output of the plant by methanating the CO2 in the biogas could help to reduce GHG emissions per unit of biomethane produced.
15 Proposal For A Directive Of The European Parliament And Of The Council On The Promotion Of The Use Of Energy From Renewable Sources (Recast) COM(2016) 767 final/2 16 It is also proposed to change the fossil fuel comparator from 83.8 g CO2/MJ to 94 g CO2 eq/MJ.

xiii
Assessment of Costs and Benefits of Biogas and Biomethane
S6 Future technology potential
It is possible that the contribution that biomethane could make to future energy supplies could be increased beyond that identified above, as new feedstocks and technologies become available. Technological developments might also allow it to be delivered at a lower cost.
In the case of AD, it is possible to anaerobically digest macro-algae (seaweeds) alongside other feedstocks. There are natural stocks of kelp which could be collected from beaches, but the potential for negative impacts on ecosystems and biodiversity means that the preferred supply option in the future, would be cultivation of seaweed close to salmon farms. It is estimated that the macro-algae resource could produce up to 11 ktoe (0.5 PJ) of biogas, although due to the estimated cost at which macro-algae could be delivered to the AD plant, the biomethane produced would have a higher cost than biogas from other feedstocks or from gasification.
In the costs assessments done for this study, the costs of biomethane produced from gasification were high. This was partly because gasification is not a fully mature technology and partly because the plant was assumed to run on imported wood pellets which had a relatively high price (€176/t). There is considerable interest in Europe and indeed world-wide in gasification technology, and is likely that more R&D and demonstration of this technology at a commercial scale in the future will help to bring the costs of the technology down, and make deployment of such plants more attractive. The costs of operating such plants in Ireland might also fall, if they could be supplied with wood from Irish forestry or energy crops such as SRC grown in Ireland. Previous studies have identified that significant quantities of these could be available within Ireland, and that at least some of this resource could be available at a lower price than that assumed for imported wood pellets17
In renewable power to gas (P2G) technologies, renewably generated electricity can be used to produce biomethane which can be injected into the grid. The electricity is used to produce hydrogen through electrolysis, and this is then combined with CO2 in a methanation step to convert it to biomethane. As biogas typically contains about 40% CO2 which must be removed when it is upgraded to biomethane, P2G technologies can be combined with AD plants, increasing their output of biomethane. Other sources of CO2 which could be utilised include industrial sites such as large distilleries or breweries.
A further advantage of P2G is that it could help to provide a demand for renewable electricity at times when all of the renewable electricity generation cannot be accommodated on to the grid, e.g. when it exceeds demand on the grid, or because of transmission constraints. This could become increasingly important as the share of intermittent renewable sources such as wind and solar in electricity supply increases. In 2015 for example, 348 GWh, equivalent to 5.1% of the total available wind energy could not be accepted on to the grid either because it occurred at times of low demand or because of local transmission constraints18. P2G systems could potentially use this electricity to produce biomethane 19 although the role of P2G would need to be considered alongside other grid management techniques (already being undertaken by EirGrid as part of the DS3 programme) and alternative future energy storage options. As an example if all AD biomethane plants which are installed after 2030 in the ‘All AD feedstocks’ scenario also had a P2G system, then up to an additional 11.6 PJ of biomethane could be produced in 2050, increasing biomethane output from the scenario by 70%. This would require over 5 TWh of renewable electricity, equivalent to 21% of electricity consumption in 201520.
The capital and operating costs of such P2G systems are still relatively uncertain and it has not been possible within the remit of this study to estimate the cost of producing this additional biomethane. It is clear however that they are heavily dependent on the cost of the electricity used in the electrolysis process.
17 Ricardo Energy & Environment, 2016. Bioenergy Supply in Ireland 2015 – 2035. A report for SEAI. 18 EirGrid and SONI, 2016. Annual Renewable Energy Constraint and Curtailment Report 2015. 19 Ahern E et al, 2015. A perspective on the potential role of renewable gas in a smart energy island system. Renewable Energy, 2015. 78: 648-656. 20 Energy Balance 2015. Electricity consumption in 2015 was 25.1 TWh.

xiv
Assessment of Costs and Benefits of Biogas and Biomethane
S7 Conclusions
This study has clearly identified that biogas and biomethane deployment could contribute to future renewable energy production in Ireland and help to achieve the challenging carbon reductions in the energy sector the Ireland aspires too. It is likely that such deployment would also create or safeguard jobs in a number of sectors, and could deliver other environmental benefits.
It highlights that the utilisation of food wastes, waste from food processing and animal wastes in anaerobic digestion would deliver a net benefit to society, but that such plants may require financial support and/or policies put in place to remove non-financial barriers to encourage the development of such plants. A number of other countries (e.g. the UK) have successfully used such support mechanisms to encourage the development of AD, and have also tackled some of the non-financial barriers identified in this report as relevant in Ireland. Their experiences could be useful when considering the most appropriate way to support AD in Ireland.
The use of grass silage for biogas production would substantially increase biogas production beyond that which can be achieved by anaerobic digestion of waste, and is essential if the full potential of AD and the carbon savings it can deliver are to be achieved. However the CBA carried out suggests that production of grass silage needs to be done in as cost-effective a way as possible if there is to be an overall net benefit to society. Care also needs to be taken during the cultivation of grass silage and the design and operation of the AD plants to ensure that the carbon savings are maximised, and that energy produced from AD plants is as sustainable as possible.
In the future, gasification plant, and power to gas technologies offer ways to further increase biomethane supply, although both technologies have yet to be commercially deployed at scale.

xv
Assessment of Costs and Benefits of Biogas and Biomethane
Table of Contents Introduction .................................................................................................................1
Production and utilisation of biogas and biomethane ............................................2 2.1 Overview ........................................................................................................................................................... 2 2.2 Feedstocks for AD plant .............................................................................................................................. 2 2.3 Typical AD plant which could be deployed in Ireland .................................................................... 3
Assessing costs and benefits ......................................................................................5 3.1 Deployment Scenarios ................................................................................................................................ 6 3.2 Analysis of deployment scenarios .......................................................................................................... 9
3.2.1 Key assumptions................................................................................................................................ 9 3.2.2 Energy produced ............................................................................................................................ 10 3.2.3 Carbon savings ................................................................................................................................ 11 3.2.4 Net cost or benefit to society of scenarios ........................................................................... 12 3.2.5 Sensitivity analysis ......................................................................................................................... 15 3.2.6 Wider economic impacts ............................................................................................................ 16
3.3 Other sources of renewable gases ....................................................................................................... 26 3.3.1 Use of macro-algae in AD ........................................................................................................... 26 3.3.2 Bio-LPG ............................................................................................................................................... 27 3.3.3 Renewable power to gas technologies ................................................................................. 27
3.4 Wider benefits.............................................................................................................................................. 29
Supporting biogas and biomethane deployment ................................................. 32 4.1 Financial viability of biogas and biomethane deployment ....................................................... 32
4.1.1 Methodology ................................................................................................................................... 32 4.1.2 Discount rate .................................................................................................................................... 32 4.1.3 LCOE for biogas boilers ................................................................................................................ 34 4.1.4 LCOE for biogas CHP plants ....................................................................................................... 36 4.1.5 LCOE for biomethane plants...................................................................................................... 39 4.1.6 Biomethane as a vehicle fuel ..................................................................................................... 40 4.1.7 BioLPG ................................................................................................................................................ 41
4.2 Support for biogas and biomethane in other countries ............................................................. 41 4.3 Other challenges to deployment ......................................................................................................... 42 4.4 Ensuring sustainability ............................................................................................................................. 46
Appendices
Appendix 1 Steering Group Members
Appendix 2 Costs for typical biogas and biomethane plant
Appendix 3 Methodology and assumptions for economic assessments
Appendix 4 Full results for economic assessment
Appendix 5 Wider benefits of deployment
Appendix 6 Levelised costs of energy assumptions and results
Appendix 7 Support mechanisms in other European countries
Appendix 8 Acknowledgements

1
Assessment of Costs and Benefits of Biogas and Biomethane
Introduction
Ireland has a long term vision for a low carbon energy system with greenhouse gas emissions from the energy sector reduced by between 80% and 90% compared to 1990 levels by 2050. The recent energy white paper21 recognised that to achieve this ambitious and challenging target, will require a radical transformation of Ireland’s energy system. It will require generating electricity from renewable sources, and moving to lower emissions fuels (e.g. from peat and coal to gas) and ultimately away from fossil fuels altogether22. This study looks at the contribution that biogas and biomethane could make to renewable energy production, through electricity and heat generation and the replacement of natural gas. It assesses the economic costs and benefits of increasing the supply of biogas and biomethane, and also looks at the wider benefits of biogas production, such as better management of wastes and wider effects in the economy. As such it fulfils the commitment made in the draft Bioenergy Plan23, and echoed in the energy white paper to carry out an economic assessment of the potential for the development of biogas.
This study was overseen by a steering group, nominated by Working Group 2 of the draft Bioenergy Plan and comprised of representatives from a range of relevant Government Departments, regulatory bodies and academic experts, and managed by SEAI. The steering group met regularly to discuss progress, provide valuable input, agree key assumptions in the analysis, and review results. A full list of steering group members is give in Appendix 1. The study also carried out a large amount of stakeholder consultation, including holding a workshop in September 2016 in Dublin, which was focussed on identifying potential barriers to further biogas deployment. A list of stakeholders contributing views and information to the study can be found in Appendix 8.
At the same time that this study was carried out, the study in support of the planned Renewable Heat Incentive (RHI) (carried out by Element Energy) was also examining the production of heat from biogas and the production of biomethane for the gas grid. The two studies worked closely together to ensure that information collected on the costs of biogas and biomethane production in this study were used in the RHI study and that other economic data required for analysis was consistent between the two studies.
21 DCENR, 2015. Ireland’s Transition to a Low Carbon Energy Future 2015-2030. 22 See for example, Deane P et al, 2013. Low Carbon Energy Roadmap for Ireland. Chiodi et al, 2013. Modelling the impacts of challenging 2050 European climate mitigation targets on Ireland’s Energy System, Energy Policy 53 (2013) 169-189. 23 DCENR, 2014. Draft Bioenergy Plan.

2
Assessment of Costs and Benefits of Biogas and Biomethane
Production and utilisation of biogas and biomethane
2.1 Overview
Biogas and biomethane can be produced and utilised in a variety of ways. Anaerobic digestion (AD) plants can utilise a wide variety of feedstocks ranging from food wastes, to animal slurries to specifically grown energy crops such as grass silage. Within the digester vessel in the AD plant, microorganisms break down the organic matter in the feedstock, to produce biogas, which is typically about 60% methane (CH4) and 40% carbon dioxide (CO2) by volume, although ratios can vary depending on the feedstock. After some clean up, this biogas can be combusted in boilers to produce heat, or in combined heat and power plant (typically) gas engines to provide both heat and electricity. Alternatively, the biogas can undergo further upgrading to remove the CO2, to produce an almost pure stream of biomethane. As methane is the main constituent of natural gas, this biomethane can then be injected into the gas network at appropriate points and be transported along with the natural gas to all gas consumers. Other ways of using this biomethane include storing it on the site, and then transporting it by container to off gas grid users, or dispensing it as a vehicle fuel at an on-site fuelling station. Looking to the future, biomethane could also be produced by other technologies such as gasification or power to gas technologies, where hydrogen produced through electrolysis is combined with the CO2 in biogas to produce biomethane. These technologies would increase the quantities of biomethane which could be produced. Gasification uses different feedstocks to anaerobic digestion – typically wood chips or pellets or solid waste derived fuels, so increases the quantities of feedstocks which can be used and hence the amount of biomethane which can be produced. Power to gas technologies increase the amount of biomethane which can be produced from the feedstocks used in AD plant.
2.2 Feedstocks for AD plant
The quantities of feedstocks within Ireland which could potentially be used to produce biogas in AD plants were previously estimated by the study team for SEAI in the Bioenergy Supply Study24. As can be seen in Table 2.1, there are a number of waste feedstocks (e.g., food wastes and cattle and pig manures or slurries) which have a zero or low cost which could be used to produce biogas. Indeed, in the case of some waste feedstocks, an AD plant might receive a gate fee for accepting the waste (indicated as a negative number in the table). These low cost waste feedstocks could produce up to 126 ktoe (5.3 PJ) of biogas, equivalent to just over 3% of natural gas supply in 2015. The estimates of the biogas which could be produced from cattle and pig manures is lower than some other estimates in the literature, as the estimate of quantities of manure produced have been combined with information on the size distribution of livestock farms to exclude farms where the number of animals and hence amount of manure produced is too low to support even a very small scale AD plant. The relevance of this assumption is discussed further in Section 3.1.
Table 2.1 Potential biogas feedstock resources
Feedstock
Quantity in 2035 Cost Potential biogas
production in 2035
kt €/t ktoe PJ % of 2015
natural gas supply
Food waste 511 -60 to 0 28 1.2 1%
Agri food waste 305 Assumed zero 28 1.2 1%
Sewage sludge 174 Not
estimated 11
0.5 0.3%
Manure (pig and cattle)
5,679 0 to 1.85 59
2.5 2%
Grass silage 10,675 15 to 40 837 35.0 22% 24 Ricardo Energy & Environment, 2016. Bioenergy Supply in Ireland 2015 – 2035. A report for SEAI.
3
Assessment of Costs and Benefits of Biogas and Biomethane
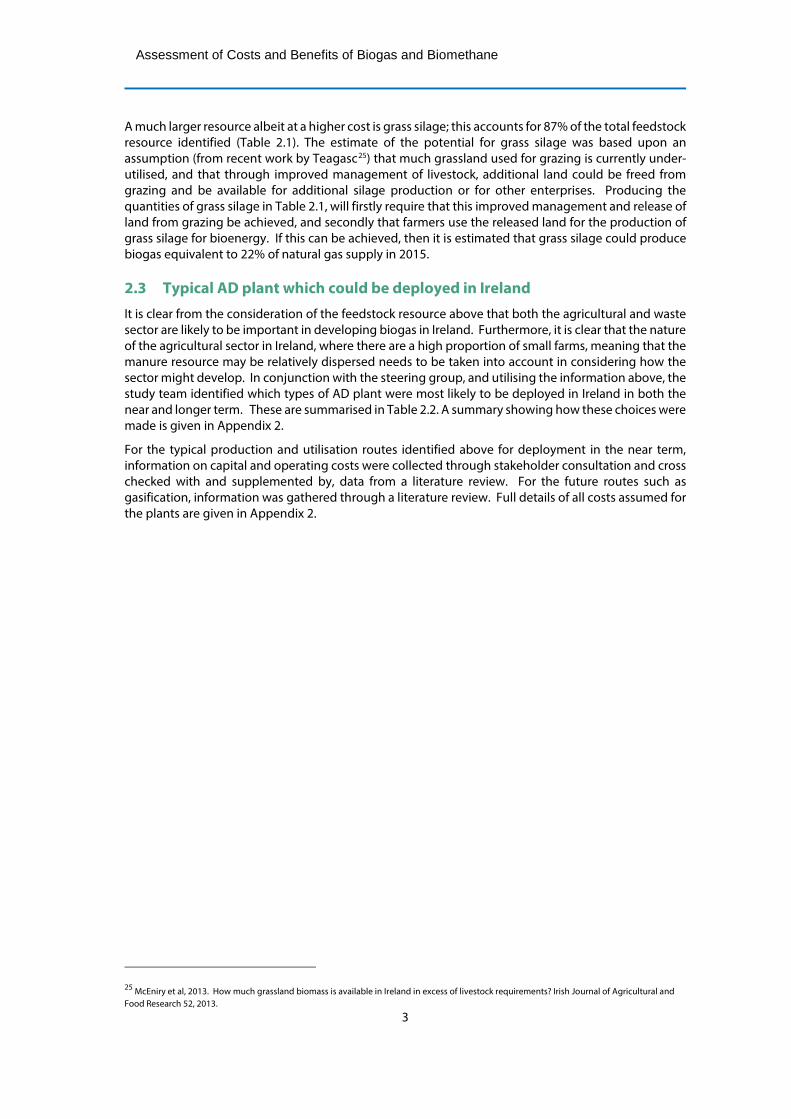
A much larger resource albeit at a higher cost is grass silage; this accounts for 87% of the total feedstock resource identified (Table 2.1). The estimate of the potential for grass silage was based upon an assumption (from recent work by Teagasc25) that much grassland used for grazing is currently under-utilised, and that through improved management of livestock, additional land could be freed from grazing and be available for additional silage production or for other enterprises. Producing the quantities of grass silage in Table 2.1, will firstly require that this improved management and release of land from grazing be achieved, and secondly that farmers use the released land for the production of grass silage for bioenergy. If this can be achieved, then it is estimated that grass silage could produce biogas equivalent to 22% of natural gas supply in 2015.
2.3 Typical AD plant which could be deployed in Ireland
It is clear from the consideration of the feedstock resource above that both the agricultural and waste sector are likely to be important in developing biogas in Ireland. Furthermore, it is clear that the nature of the agricultural sector in Ireland, where there are a high proportion of small farms, meaning that the manure resource may be relatively dispersed needs to be taken into account in considering how the sector might develop. In conjunction with the steering group, and utilising the information above, the study team identified which types of AD plant were most likely to be deployed in Ireland in both the near and longer term. These are summarised in Table 2.2. A summary showing how these choices were made is given in Appendix 2.
For the typical production and utilisation routes identified above for deployment in the near term, information on capital and operating costs were collected through stakeholder consultation and cross checked with and supplemented by, data from a literature review. For the future routes such as gasification, information was gathered through a literature review. Full details of all costs assumed for the plants are given in Appendix 2.
25 McEniry et al, 2013. How much grassland biomass is available in Ireland in excess of livestock requirements? Irish Journal of Agricultural and Food Research 52, 2013.

4
Assessment of Costs and Benefits of Biogas and Biomethane
Table 2.2 Biogas production and utilisation routes chosen for examination
Route Scale of plant Feedstocks Deployment in the near term
Boiler Small Slurry and whey
Medium/large Food waste
CHP
Small Slurry
Slurry and food waste
Medium
Slurry Slurry and silage Food waste and silage Food waste and slurry
Large Food waste
Upgrading to biomethane for injection to grid
Cluster of small/medium scale AD plant with low pressure transport of biogas to central upgrade and injection point
Silage and slurry
Medium with injection to gas grid directly from site Food waste Silage and slurry
Medium with transport of biomethane by road to injection point
Silage and slurry
Large with injection to gas grid directly from site Food waste Silage and slurry Sewage sludge
Upgrading to biomethane and use as vehicle fuel
Medium AD plant with onsite filling station to dispense biomethane
Deployment in the medium to longer term
Upgrading to biomethane for injection to grid
Medium Macro algae
Gasification 100 MW gasification plant * Wood
Power to gas Medium/large - upgrade of CO2 in biogas by addition of hydrogen produced from electrolysis using renewable electricity26
All feedstocks
Note: food waste includes food waste from MSW and wastes from food processing, and on farm vegetable waste
26 There may be times when renewable electricity can be generated but cannot be accepted on to the grid because of transmission congestion or lack of transmission access, but it can occur for a variety of other reasons, such as excess generation during low load periods, voltage, or interconnection issues. The quantity of electricity which is generated but cannot be accepted to the grid may be converted to gas via power to gas technologies.
5
Assessment of Costs and Benefits of Biogas and Biomethane
Assessing costs and benefits
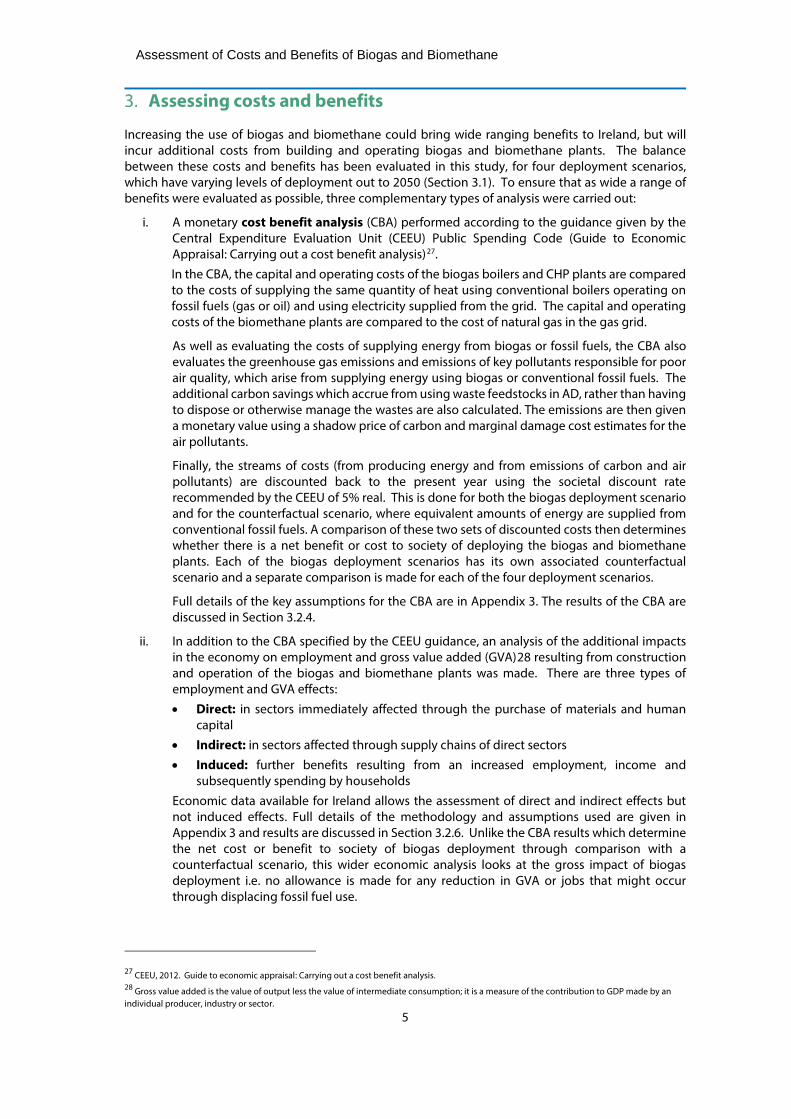
Increasing the use of biogas and biomethane could bring wide ranging benefits to Ireland, but will incur additional costs from building and operating biogas and biomethane plants. The balance between these costs and benefits has been evaluated in this study, for four deployment scenarios, which have varying levels of deployment out to 2050 (Section 3.1). To ensure that as wide a range of benefits were evaluated as possible, three complementary types of analysis were carried out:
i. A monetary cost benefit analysis (CBA) performed according to the guidance given by the Central Expenditure Evaluation Unit (CEEU) Public Spending Code (Guide to Economic Appraisal: Carrying out a cost benefit analysis)27.
In the CBA, the capital and operating costs of the biogas boilers and CHP plants are compared to the costs of supplying the same quantity of heat using conventional boilers operating on fossil fuels (gas or oil) and using electricity supplied from the grid. The capital and operating costs of the biomethane plants are compared to the cost of natural gas in the gas grid.
As well as evaluating the costs of supplying energy from biogas or fossil fuels, the CBA also evaluates the greenhouse gas emissions and emissions of key pollutants responsible for poor air quality, which arise from supplying energy using biogas or conventional fossil fuels. The additional carbon savings which accrue from using waste feedstocks in AD, rather than having to dispose or otherwise manage the wastes are also calculated. The emissions are then given a monetary value using a shadow price of carbon and marginal damage cost estimates for the air pollutants.
Finally, the streams of costs (from producing energy and from emissions of carbon and air pollutants) are discounted back to the present year using the societal discount rate recommended by the CEEU of 5% real. This is done for both the biogas deployment scenario and for the counterfactual scenario, where equivalent amounts of energy are supplied from conventional fossil fuels. A comparison of these two sets of discounted costs then determines whether there is a net benefit or cost to society of deploying the biogas and biomethane plants. Each of the biogas deployment scenarios has its own associated counterfactual scenario and a separate comparison is made for each of the four deployment scenarios.
Full details of the key assumptions for the CBA are in Appendix 3. The results of the CBA are discussed in Section 3.2.4.
ii. In addition to the CBA specified by the CEEU guidance, an analysis of the additional impacts in the economy on employment and gross value added (GVA)28 resulting from construction and operation of the biogas and biomethane plants was made. There are three types of employment and GVA effects:
• Direct: in sectors immediately affected through the purchase of materials and human capital
• Indirect: in sectors affected through supply chains of direct sectors
• Induced: further benefits resulting from an increased employment, income and subsequently spending by households
Economic data available for Ireland allows the assessment of direct and indirect effects but not induced effects. Full details of the methodology and assumptions used are given in Appendix 3 and results are discussed in Section 3.2.6. Unlike the CBA results which determine the net cost or benefit to society of biogas deployment through comparison with a counterfactual scenario, this wider economic analysis looks at the gross impact of biogas deployment i.e. no allowance is made for any reduction in GVA or jobs that might occur through displacing fossil fuel use.
27 CEEU, 2012. Guide to economic appraisal: Carrying out a cost benefit analysis. 28 Gross value added is the value of output less the value of intermediate consumption; it is a measure of the contribution to GDP made by an individual producer, industry or sector.

6
Assessment of Costs and Benefits of Biogas and Biomethane
iii. A qualitative assessment of other wider benefits of biogas and biomethane identified through a literature review and consultation with stakeholders. These additional benefits are summarised in Section 3.4 and Appendix 5.
3.1 Deployment Scenarios
Four scenarios of the possible future deployment of biogas and biomethane plants were developed, and then agreed, in consultation with the steering group (Table 3.1). The scenarios look at increasing levels of biogas and biomethane production.
• The first scenario ‘Waste based AD’: makes use of waste streams such as food wastes and slurries as these are the lowest cost feedstocks. However as discussed in Section 2.2, waste feedstocks form a relatively small proportion of the overall resource that could be used for AD, and so biogas and biomethane production is only a small fraction of the total potential.
• The second scenario ‘Increased biomethane’: begins to make use of the large grass silage resource. This is assumed to be utilised mainly in large AD plant to produce biomethane; the number of biomethane plants is set to the number (42) of above ground installation points identified by GNI as the most accessible and least cost points of entry into the gas grid29.
• The third scenario ‘All AD feedstocks’ is an ambitious scenario designed to illustrate the costs and benefits of utilising all of the feedstocks identified as available for AD in Section 2. This assumes that biomethane would also be injected on the distribution network30.
• The final ‘Exploratory’ scenario examines the additional costs and benefits which could arise if biomethane production was expanded further in the future (from 2030 onwards) by building large gasification plant to produce biomethane from wood chips or pellets. These wood feedstocks could be supplied domestically from the forestry industry, or through energy crops such as short rotation coppice if appropriate measures were in place to overcome barriers and support widescale production31. Wood chips and pellets could also be imported.
Table 3.1 Key characteristics of scenarios
Scenario Description
Waste based AD
Maximum use of waste streams (food wastes and slurries) as these are the lowest cost feedstocks and deliver the highest GHG savings
Increased biomethane
This builds on scenario the waste based AD scenario, and begins to make use of the large grass silage resource that Ireland has. The silage is predominantly used in large AD plants to produce biomethane, which it is assumed is injected into the gas grid at the 42 above ground installation points identified by GNI as the most accessible and least cost points of entry into the grid.
All AD feedstocks
Maximum use of grass silage and other resources. This scenario is designed to show the maximum biogas/biomethane production which could be achieved through anaerobic digestion. It assumes that additional biomethane injection points in the gas distribution network are identified.
29 O’Shea et al, 2016. Assessing the total theoretical, and financially viable, resource of biomethane for injection to a natural gas network in a region. Applied Energy 188 (2017) 237–256. 30 The 42 AGIs assumed to be utilised in the ‘Increased biomethane’ scenario, were identified by GNI as being at locations where there is a sufficient additional gas flow so that there would be no availability constraints even in low summer time flow. It is also possible to locate a large number of biomethane injection facilities on the distribution network. However, this would require a more detailed analysis of gas flow and pressure at each potential site location. It is assumed that under the ‘All AD feedstocks’ scenario, the necessary analysis is carried out and suitable injection points on the distribution network are identified. 31 A full discussion of the potential energy crop and forestry resource, potential costs and barriers which would need to be overcome is given in Ricardo Energy & Environment, 2016. Bioenergy Supply in Ireland 2015 – 2035. A report for SEAI.

7
Assessment of Costs and Benefits of Biogas and Biomethane
Exploratory Exploratory scenario designed to show how energy production could be increased by using gasification, a technology which is not yet mature, but could produce large quantities of biomethane from wood chips/pellets and energy crops.
The utilisation of feedstocks for AD in 2050 under each of the first three scenarios, is shown in Figure 3.1, which also shows the total feedstock resource estimated in the Bioenergy Supply study. The utilisation of slurry is increased in the ‘Increased biomethane’ and ‘All AD feedstocks’ scenarios from the values estimated in the Bioenergy Supply study to allow for fact that co-digestion of slurries with other wastes may increase the number of farms at which it is viable to collect slurries to utilise in AD. The ‘Exploratory’ scenario has the same use of AD feedstocks as the ‘All AD feedstocks’ scenario
The number of AD plants which it is assumed are built under each scenario is shown in Figure 3.2. The exploratory scenario also includes 3 large gasification plants built between 2030 and 2040. Utilising all of the waste feedstocks and grass silage feedstock (as in the All AD feedstocks) could require almost 900 AD plants. A mixture of different size plants are assumed to be deployed, ranging from 100kW to 500kW for farm based CHP plant to 3000 kWe for waste based CHP plant, and up to 6,000 kW for biomethane plant. While there are far fewer biomethane plants, there scale means that they utilise a large fraction of the feedstocks.
In the short to mid-term (i.e. to 2020 and then to 2030), the rate at which plants are built in the scenarios is based on a consideration of how rapidly the industry might be able to expand. This is based partly on views expressed by stakeholders on the number of plants per year which could be built in the period to 2020 and thereafter, and partly on experience from the UK on the rate the industry can expand in response to introduction of support measures (taking account of differences in the likely final size of market in the UK and Ireland). Typically, it will take one to two years to go from initial planning to operation for biogas plants, and possibly longer, two to three years, for biomethane plants which are more complex. While there are believed to be over thirty biogas plants in the planning system in 2016, few are believed to have been granted permission and commenced construction32. Stakeholder views were also that further progress, even for the plants where a planning application had been made, was unlikely until there was greater clarity and certainty over treatment of, and potential levels of support for biogas and biomethane plants in the future, i.e. once details of the proposed RHI and successor to REFIT 3 are announced. The combination of these factors means that estimates of deployment in 2020 (which are the same in all scenarios) are low. Post 2020, it is assumed that the necessary actions are taken in the next few years to make biogas and biomethane plants financially viable and to address other challenges which may hinder deployment (see Section 4), so that the potential renewable energy resource offered by biogas and biomethane can be realised.
In constructing the deployment scenarios, it was necessary to make assumptions about which of the example plants would be built. As discussed previously, the example plants cover a range of feedstocks and scales, and their differing capital and operating costs lead to a substantial range in the cost of energy produced from them (See Section 4.1). For the deployment scenarios, it was assumed that the plants which could produce heat, electricity or biomethane most cost-effectively would be the most likely to be built, and hence predominate in the scenarios. However other plants with higher costs of energy production were not excluded entirely, as plants with the lowest costs of energy production may be suitable for all potential sites. It was assumed that in the first instance, a CHP plant would be built in locations where heat produced by the plant could be used effectively (i.e. a high heat load utilisation could be achieved), but that as deployment increased e.g. in the ‘All AD feedstocks’ scenario, then utilisation of the heat might be lower in some instances.
32 Bioenergy and Biofuels Research Group, University College Cork. Personal communication of 23rd January 2017.

8
Assessment of Costs and Benefits of Biogas and Biomethane
Figure 3.1 Utilisation of AD feedstocks in each scenario
Figure 3.2 Number of AD plants in each scenario
0
100
200
300
400
500
600
700
800
900
2020
2030
2040
2050
2020
2030
2040
2050
2020
2030
2040
2050
Waste based AD Increased biomethane All AD feedstocks
No
of p
lant
Boilers CHP Biomethane

9
Assessment of Costs and Benefits of Biogas and Biomethane
3.2 Analysis of deployment scenarios
3.2.1 Key assumptions
As discussed above the monetary cost benefit analysis (CBA) was performed according to the guidance given by the Central Expenditure Evaluation Unit (CEEU)33. Sources of key data used in the CBA are summarised in Table 3.2. Full details are given in Appendix 3 unless indicated otherwise.
Table 3.2 Key assumptions in CBA
Parameter Notes/source Value (€2016)
Societal discount rate
CEEU guidance. Guide to Economic Appraisal: Carrying out a cost benefit analysis.
5%
Capital and operating costs for AD and gasification plants
Gathered through stakeholder consultation and literature review.
See Appendix 2
Feedstock costs Stakeholder consultation and Ricardo Energy and Environment, 2016. Bioenergy Supply in Ireland 2015 – 2035. A report for SEAI.
See Table 2.1 and Appendix 3
Capital and operating costs for gas and oil fired boilers
Based on cost data provided by Element Energy and as used in the study supporting the RHI consultation Element Energy, 2017 (to be published).
See Appendix 3
Current electricity, gas and oil prices
Without taxes. Current prices are taken from SEAI, 2016. Price Directive 1st Semester (January - June 2016). Current Oil prices taken from ‘Consumer prices of petroleum products net of duties and taxes’ prepared by DG Ener34.
Gas (2016): 2.9 to 4.7 c/kWh Wholesale gas (2016) 2.3 c/kWh
Electricity (2016): 8.3 to 12.0 c/kWh
Heating oil:3.43 c/kWh
Future electricity, gas and oil prices
Future prices estimated by applying price projections for gas and oil made by UK government35. Assumed to be valid for Ireland as the UK national balancing point for gas is a good proxy for Irish wholesale gas prices. Assumed to remain constant after 2030, the last year for which an increase is forecast. Electricity prices assumed to follow trend in gas prices.
Central scenario: gas and electricity prices rise by 42% by 2030 and oil prices by 69%. High fossil fuel prices scenario: gas and electricity prices rise by 63% by 2030, and oil prices by 78%.
Shadow price of carbon
The Public Spending Code: E. Technical References Shadow Price of Carbon. Values converted to €2016
€7.9/t CO2 in 2016, rising to €11.2/t CO2 in 2020, €39/t CO2 in 2030 and €112/t CO2 in 2050.
Damage costs for air pollutants
EnvEcon, 2015. Air Pollutant Marginal Damage Values: Guidebook for Ireland 2015. All Ireland values converted to €2016
NOx: €1,125/t SO2: €5,427/t NMVOC: €984/t PM2.5: €8,436/t
33 Public Spending Code. Guide to Economic Appraisal: Carrying out a cost benefit analysis. Available at http://publicspendingcode.per.gov.ie/wp-content/uploads/2012/08/D03-Guide-to-economic-appraisal-CBA-16-July.pdf 34 Historical data series from DG Ener’s weekly oil bulletin. Available at https://ec.europa.eu/energy/en/data-analysis/weekly-oil-bulletin 35 DECC. 2015. Fossil Fuel Price Assumptions
10
Assessment of Costs and Benefits of Biogas and Biomethane
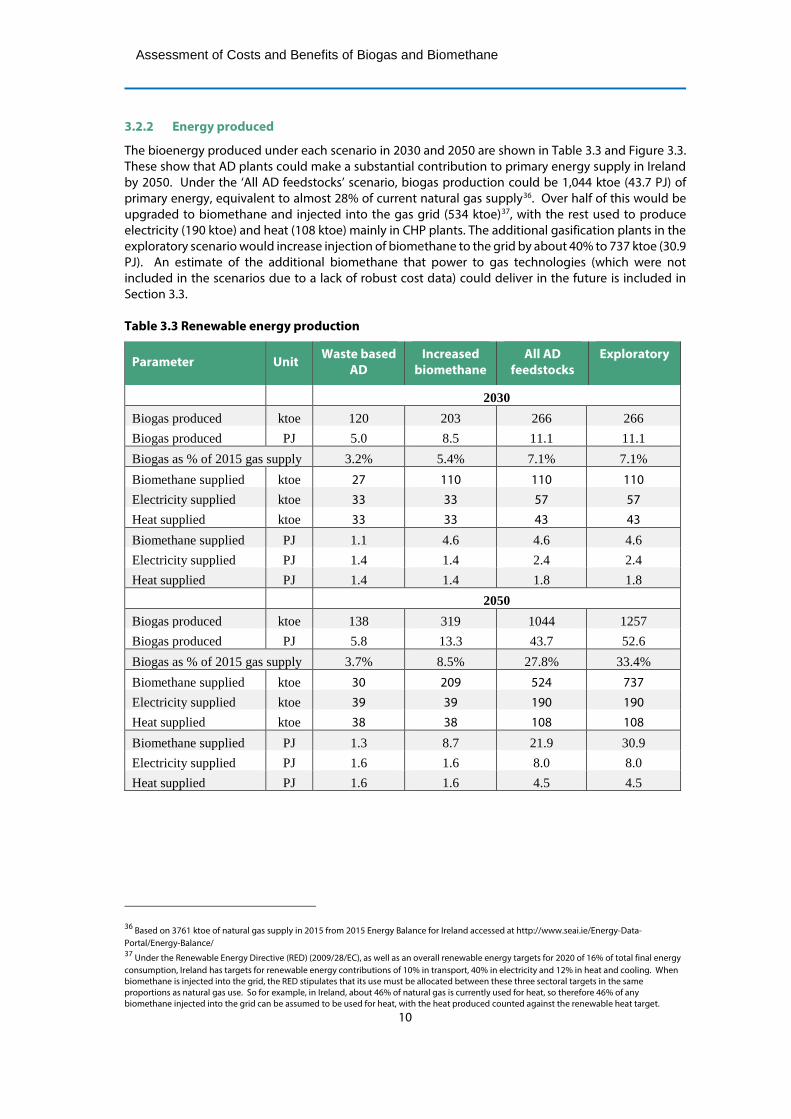
3.2.2 Energy produced
The bioenergy produced under each scenario in 2030 and 2050 are shown in Table 3.3 and Figure 3.3. These show that AD plants could make a substantial contribution to primary energy supply in Ireland by 2050. Under the ‘All AD feedstocks’ scenario, biogas production could be 1,044 ktoe (43.7 PJ) of primary energy, equivalent to almost 28% of current natural gas supply36. Over half of this would be upgraded to biomethane and injected into the gas grid (534 ktoe)37, with the rest used to produce electricity (190 ktoe) and heat (108 ktoe) mainly in CHP plants. The additional gasification plants in the exploratory scenario would increase injection of biomethane to the grid by about 40% to 737 ktoe (30.9 PJ). An estimate of the additional biomethane that power to gas technologies (which were not included in the scenarios due to a lack of robust cost data) could deliver in the future is included in Section 3.3.
Table 3.3 Renewable energy production
Parameter Unit Waste based AD
Increased biomethane
All AD feedstocks
Exploratory
2030 Biogas produced ktoe 120 203 266 266 Biogas produced PJ 5.0 8.5 11.1 11.1 Biogas as % of 2015 gas supply 3.2% 5.4% 7.1% 7.1% Biomethane supplied ktoe 27 110 110 110 Electricity supplied ktoe 33 33 57 57 Heat supplied ktoe 33 33 43 43 Biomethane supplied PJ 1.1 4.6 4.6 4.6 Electricity supplied PJ 1.4 1.4 2.4 2.4 Heat supplied PJ 1.4 1.4 1.8 1.8 2050 Biogas produced ktoe 138 319 1044 1257 Biogas produced PJ 5.8 13.3 43.7 52.6 Biogas as % of 2015 gas supply 3.7% 8.5% 27.8% 33.4% Biomethane supplied ktoe 30 209 524 737 Electricity supplied ktoe 39 39 190 190 Heat supplied ktoe 38 38 108 108 Biomethane supplied PJ 1.3 8.7 21.9 30.9 Electricity supplied PJ 1.6 1.6 8.0 8.0 Heat supplied PJ 1.6 1.6 4.5 4.5
36 Based on 3761 ktoe of natural gas supply in 2015 from 2015 Energy Balance for Ireland accessed at http://www.seai.ie/Energy-Data-Portal/Energy-Balance/ 37 Under the Renewable Energy Directive (RED) (2009/28/EC), as well as an overall renewable energy targets for 2020 of 16% of total final energy consumption, Ireland has targets for renewable energy contributions of 10% in transport, 40% in electricity and 12% in heat and cooling. When biomethane is injected into the grid, the RED stipulates that its use must be allocated between these three sectoral targets in the same proportions as natural gas use. So for example, in Ireland, about 46% of natural gas is currently used for heat, so therefore 46% of any biomethane injected into the grid can be assumed to be used for heat, with the heat produced counted against the renewable heat target.

11
Assessment of Costs and Benefits of Biogas and Biomethane
Figure 3.3 Renewable energy production
3.2.3 Carbon savings
Table 3.4 shows the carbon savings for each of the scenarios. These are calculated for:
• A base case where it is assumed biomethane displaces natural gas, biogas CHP displaces electricity from the grid and heat produced in gas boilers, and biogas boilers displace gas boilers.
• A sensitivity analysis where it is assumed that the heat loads supplied by biogas CHP plants are off the gas grid, and biogas CHP plants therefore displace electricity from the grid and heat produced in oil boilers and biogas boilers displace oil boilers. Biomethane is still assumed to displace natural gas.
• On a global lifecycle basis, and with an estimate of those savings that will arise within Ireland.
The most complete representation of the global carbon savings that each scenario could deliver is achieved by looking at the emissions associated with the production of biogas and biomethane and with the production of heat and electricity from fossil fuels on a life cycle basis. This means they include, in the case of fossil fuels, the emissions associated with the production, processing, transport and supply of the fuel as well as emissions of CO2 released when the fuel is combusted. In the case of biogas and biomethane plants, lifecycle emissions include the emissions associated with production of the feedstock as well as its transport to the AD plant and emissions from the AD plant itself e.g. leakage of methane from the AD plant. For waste feedstocks, no emissions are assumed to be associated with production of the feedstock, but for silage, emissions arise from the production of agrochemical inputs such as fertilisers, emissions of the greenhouse gas N2O arising from application of nitrogenous fertilisers to the soil as well as from fuels used for agricultural machinery.
It is clear that not all of the lifecycle emissions will occur within Ireland, e.g. most of the natural gas supply in Ireland is imported so upstream gas emissions principally occur outside of Ireland, and, in the case of silage feedstocks there is no fertiliser production in Ireland. As the impact that biogas deployment might have on Ireland’s national emissions of greenhouse gases is of key interest, an approximate estimate has been made of the lifecycle emissions which would be likely to occur inside Ireland. For fossil fuel use which is displaced by biogas, emissions associated with combustion were assumed to occur inside Ireland and all upstream emissions associated with production, processing and transport and distribution are assumed to occur outside of Ireland. In the case of emissions associated with biogas production, emissions associated with fertiliser production were excluded.
0%
5%
10%
15%
20%
25%
30%
35%
0
5
10
15
20
25
30
35
40
45
50
55
2020
2030
2040
2050
2020
2030
2040
2050
2020
2030
2040
2050
2020
2030
2040
2050
Waste based AD Increased biomethane All AD feedstocks Exploratory
Bio
gas/
met
hane
as
% o
f nat
ural
gas
sup
ply
in 2
015
PJ
of re
new
able
ene
rgy
Electricity supplied Heat supplied Biomethane supplied Total biogas production

12
Assessment of Costs and Benefits of Biogas and Biomethane
Table 3.4 Carbon savings
Waste based AD
Increased biomethane
All AD feedstocks
Exploratory
2030 Global: base case kt CO2 eq/yr 525 650 787 Global: sensitivity kt CO2 eq/yr 558 683 830 Within Ireland: base case kt CO2 eq/yr 477 584 711 Within Ireland: sensitivity kt CO2 eq/yr 502 609 744 Within Ireland: base case €/t CO2 eq -11 6 9
Within Ireland: sensitivity €/t CO2 eq -19 -2 1
2050
Global: base case kt CO2 eq/yr 631 899 2,280 2,771 Global: sensitivity kt CO2 eq/yr 670 938 2,389 2,880 Within Ireland: base case kt CO2 eq/yr 575 805 2,052 2,456 Within Ireland: sensitivity kt CO2 eq/yr 605 835 2,135 2,539 Within Ireland: base case €/t CO2 eq -6 15 45 59
Within Ireland: sensitivity €/t CO2 eq -10 11 41 55
Figure 3.4 Carbon savings in Ireland for base case
3.2.4 Net cost or benefit to society of scenarios
The net costs or benefits of each of the biogas deployment scenarios when they are compared to the cost of the counterfactual scenario are summarised in Table 3.5. A positive number indicates that the biogas deployment gives a net benefit to society and a negative number that it has a net cost compared to the counterfactual scenario.
0%
1%
2%
3%
4%
0
500
1,000
1,500
2,000
2,500
2030 2050 2030 2050 2030 2050 2030 2050
Waste basedAD
Increasedbiomethane
All ADfeedstocks
Exploratory
% o
f nat
iona
l GH
G e
mis
sion
s in
199
0
kt C
O2
e
Energy production and use Avoided slurry storage

13
Assessment of Costs and Benefits of Biogas and Biomethane
Table 3.5 Net cost or benefit of biogas deployment under baseline economic conditions
Scenario Waste Increased biomethane
All AD feedstocks
Exploratory
Net cost or benefit to 2030 (€M2016)
69 to 101 23 to 55 (-29) to 5
Net cost or benefit to 2050 (€M2016)
407 to 509 173 to 275 (-745 to -583) (-1410 to -1248)
Note: positive numbers indicate net benefit; negative numbers (in brackets) indicate net costs. Range represents base case and sensitivity analysis regarding carbon savings. The ‘Waste based’ scenario and the ‘Increased biomethane’ scenario both deliver net benefits compared to the counterfactual scenarios in both 2030 and 2050. In the waste scenario, this is because firstly the production of biogas from waste feedstocks has a lower cost than energy produced from fossil fuels in the counterfactual scenario (Figure 3.5). Secondly the GHG emissions avoided due to management of the wastes in AD more than offset any emissions from the AD plants, leading to a net benefit from GHG savings. Differences in the costs incurred from the emissions of pollutants associated with air quality (labelled ‘AQ costs’ in the Figure) are not a significant contribution to the net benefit.
Figure 3.5 Breakdown of costs for biogas ‘waste’ scenario and counterfactual
The additional use of silage, which is a higher cost feedstock in the ‘Increased biomethane’, increases the costs of energy production to more than those in the counterfactual scenario (Figure 3.6). However, GHG emissions in the biogas scenario are lower, meaning that overall the biogas scenario is still of net benefit to society.

14
Assessment of Costs and Benefits of Biogas and Biomethane
Figure 3.6 Breakdown of costs for biogas ‘increased biomethane’ scenario and counterfactual
Maximising use of silage in the ‘All AD feedstocks’ scenario and hence maximising biogas production from AD, leads to no net benefit as the cost of the silage is much higher than the cost of the waste feedstocks and means that the average costs of energy produced from AD is higher. The overall cost of energy production is higher than in the counterfactual scenario (Figure 3.7) and while the cost of GHG emissions is lower than in the counterfactual scenario, the saving is not enough to deliver an overall benefit.
Figure 3.7 Breakdown of costs for biogas ‘all AD feedstocks’ scenario and counterfactual
The exploratory scenario has an even higher net cost than the ‘All AD feedstocks’ scenario due to the high cost of producing biomethane in the three gasification plants included in it. Gasification is not a

15
Assessment of Costs and Benefits of Biogas and Biomethane
fully mature technology and currently has a high capital cost. This and the cost of the feedstock for the plant (wood chips/pellets) mean that biomethane produced from them has a high cost.
There is considerable interest in Europe and indeed world-wide in gasification technology, and is likely that more R&D and demonstration of this technology at a commercial scale in the future will help to bring the costs of the technology down, and make deployment of such plant more attractive. The costs of operating such plant in Ireland might also fall, if they could be supplied with wood from Irish forestry or energy crops such as SRC grown in Ireland. Previous studies have identified that significant quantities of these could be available within Ireland, and that at least some of this resource could be available at a lower price than that assumed for imported wood pellets38.
3.2.5 Sensitivity analysis
As the CBA is carried out for the period up to 2050, there is inevitably some uncertainty in how a number of key parameters such as fossil fuel prices, and the shadow price of carbon could change over that time. In addition, the development of the market for AD feedstocks could lead to different prices than those assumed: competition for waste feedstocks could mean that the gate fee that AD plants could charge for accepting them would fall. Conversely, the demand for grass silage for AD could encourage improvements in production and yield, leading to a lower price for the feedstock. Two sensitivity analysis were therefore carried out.
The first considered a case which would be favourable to biogas deployment by making the following changes to assumptions:
• fossil fuel prices were assumed to rise more steeply in the future39, raising the cost of energy in the counterfactual scenario
• the shadow price of carbon was assumed to be 5% higher post 2020, increasing the value of the carbon savings the biogas deployment scenarios delivered
• it was assumed that silage could be supplied at a lower price (€25/t instead of €30/t)
Under these set of assumptions, then the ‘All AD feedstocks’ scenario would have a small net benefit and the net benefit of the ’waste’ and ‘increased biomethane’ scenarios increases. The exploratory scenario still shows a net cost (Table 3.6).
Table 3.6 Net cost or benefit: sensitivity analysis for ‘biogas favourable conditions’
Scenario Waste Increased biomethane
All AD feedstocks
Exploratory
Net cost or benefit to 2030 (€M2016)
126 to 147 95 to 116 56 to 79
Net cost or benefit to 2050 (€M2016)
581 to 661 490 to 570 10 to 136 (-593 to -468)
Note: positive numbers indicate net benefit; negative numbers (in brackets) indicate net costs. Range represents base case and sensitivity analysis regarding carbon savings. The second sensitivity analysis carried out considered a situation where the gate fees received for waste feedstocks are lower, as waste becomes a commodity which is in demand, rather than something which simply requires disposal. A very low or zero gate fee could introduce conflicts with other waste policy objectives such as waste minimisation, and is unlikely to be desirable from a policy perspective. A smaller, 20% reduction is assumed: from €50/t, the typical expected gate fee reported by stakeholders, to €40/t, the weighted average cost of food waste in the Bioenergy Supply curves study.
The price of grass silage was increased by 20% from €30/t to €36/t; this is slightly higher than the average price of delivered silage assumed in other analysis undertaken to look at the financial viability
38 Ricardo Energy & Environment, 2016. Bioenergy Supply in Ireland 2015 – 2035. A report for SEAI 39 Under a higher fossil fuel price scenario, by 2030, gas prices are 15% higher and oil prices 5% higher.

16
Assessment of Costs and Benefits of Biogas and Biomethane
of biomethane from biomethane of €35/t40, but still lower than the maximum cost of silage estimated in the Bioenergy Supply of €40/t. Under these conditions the net benefit from the ‘waste’ based scenario is reduced but still substantial when considered out to 2050. The increased biomethane shows a small net cost in the shorter term, but still shows a net benefit in the long term, as fossil fuel prices and the shadow cost of carbon continue to rise.
Table 3.7 Net cost or benefit: sensitivity analysis for higher AD feedstock prices
Scenario Waste Increased biomethane
All AD feedstocks
Exploratory
Net cost or benefit to 2030 (€M2016)
35 to 67 (-20) to 12 (-77 to -43)
Net cost or benefit to 2050 (€M2016)
324 to 426 8 to 111 (-1119 to -956) (-1784 to -1622)
Note: positive numbers indicate net benefit; negative numbers (in brackets) indicate net costs. Range represents base case and sensitivity analysis regarding carbon savings.
Figure 3.8 shows the net benefit or cost in each scenario against the quantity of renewable energy produced. The range for each scenario shows the net benefit or cost under the ‘base case’ assumptions and the ‘biogas favourable conditions’ assumptions; net benefits are higher (and net costs lower) under the ‘biogas favourable conditions’ assumptions for all scenarios. The figure highlights how the additional renewable energy production in the ‘All AD feedstocks’ and ‘Exploratory’ scenarios is achieved at an increasing cost to society. This is principally due to the higher cost of the silage which is the main AD feedstock in these scenarios and partly due to the lower carbon savings that use of silage delivers compared to utilisation of waste feedstocks. Improving the efficiency of the AD process to maximise the yield of biogas, reducing the costs of AD and biogas upgrading systems, and increasing the GHG savings achieved from biomethane plants, by e.g. reducing leakage from AD plants, combusting off-gases from biomethane upgrading and ensuing that feedstocks such as grass silage are produced in as ‘carbon efficient’ way as possible, could all help to improve the net benefit achieved from biogas deployment.
It should also be considered that it is likely that to achieve the substantial reduction in GHG emissions from the energy system (of 80 to 95%) set out in the Energy White Paper, will require bioenergy to play a substantial role in the energy mix, and that options with high costs of carbon abatement will be required. For example, use of the TIMES energy model for Ireland41 suggests that achieving an 80% reduction in GHG emissions could have a marginal CO2 abatement cost42 of be about €2016350/t CO2, almost triple the shadow price of carbon in 2050 assumed in the CBA. This high cost of carbon reduction strongly indicates that more costly measures may need to be deployed if the reductions are to be achieved.
3.2.6 Wider economic impacts
Table 3.8 summarises estimates the wider effects in the economy, on jobs and GVA, that deployment of biogas plants could have. Unlike the CBA which is based on the difference in costs between supplying energy using biogas or conventional fossil fuels, the estimate of number of jobs created and increase in GVA, reflect only the additional jobs and GVA which biogas deployment could create. It was not possible to look at the reduction in jobs or GVA which might result from the reduced use of fossil fuels under the biogas deployment scenarios.
40 O’Shea et al, 2016. Assessing the total theoretical, and financially viable, resource of biomethane for injection to a natural gas network in a region. Applied Energy 188 (2017) 237–256. 41 Chiodi A et al, 2013. Modelling the impacts of challenging 2050 European climate mitigation targets on Ireland’s energy system. Energy Policy 53 (2013) 169-189. 42 The marginal CO2 abatement cost is the cost of the last measure put in place to reduce GHG emissions to achieve the reductions required, and assuming that measures are implemented in order of their cost-effectiveness.

17
Assessment of Costs and Benefits of Biogas and Biomethane
Figure 3.8 Net cost or benefit of scenario in 2050 versus quantity of renewable energy produced
Note: range indicates the net cost or benefit with higher AD feedstocks price assumptions (lower value), base case assumptions (middle value), and ‘biogas favourable conditions’ assumptions (upper value)
Table 3.8 Wider economic impacts of biogas deployment
Scenario Waste Increased
biomethane All AD
feedstocks Exploratory
Direct effects
Construction job-years
(all installations) 13,304 19,158 52,930 68,693
Construction jobs
(all installations) 1,330 1,916 5,293 6,869
Operational jobs
(in place in 2050) 340 796 3,404 4,301
GVA from construction
€M (all installations) 327 471 1,302 1,690
GVA from operation
(€M in 2050, single year estimate)
32 74 317 400
Indirect effects
Construction job-years
(all installations) 7,786 11,211 30,975 40,199
Construction jobs
(all installations) 779 1,121 3,097 4,020
Operational jobs
(in place in 2050) 92 to 169 215 to 395 918 to 1,691 1,160 to
2,136
GVA from construction
€M (all installations) 191 276 762 989
GVA from operation
(€M in 2050, single year estimate)
9 to 16 20 to 37 85 to 157 108 to 199

18
Assessment of Costs and Benefits of Biogas and Biomethane
3.2.6.1 Direct effects: jobs and GVA
Stakeholder consultation identified range of full and part-time jobs across the development, construction and operational phases, with many of the jobs skilled or semi-skilled. Jobs could be created or safeguarded in a wide range of occupations including43:
Construction workers, engineers, codes and standards developers, and consultants during the construction phase
Fitters, engineers, technicians and plant operators, sales people and operators, administrative positions including accounts, compliance, monitoring etc. during the plant’s operation.
The illustrative estimates in Table 3.8 of the potential jobs that could be created under each deployment scenario have been made by combining the estimates of expenditure on biogas plant under the scenarios with estimates of jobs created per € spend. Construction jobs are estimated based on capital expenditure and permanent, operational jobs are based on operational costs. These estimates of jobs created are then in turn used as a basis to estimate GVA impacts.
Construction jobs presented are associated with all installations under the deployment scenario (i.e. to 2050). Construction job-years represent one job held for one year, and permanent construction jobs are estimated from this assuming a standard 10 job-years to 1 permanent job ratio. Operational jobs represent the total jobs associated with installations operating in 2050: given that each scenario assumes replacement of all assets once they reach the end of their useful lifetime, this is considered to be consistent with construction estimates in terms of jobs created. In terms of GVA, the value for construction represents the total GVA effect associated with all installations (all GVA effects are presented undiscounted) but for operation, this simply presents the effects for a single year (i.e. 2050 when all sites are operational).
It is clear from Table 3.8, that deployment of biogas and biomethane has the potential to deliver positive impacts on both employment and GVA, for example it is estimated that up to 3,400 permanent jobs could be created in the ‘All AD Feedstocks’ scenario.
It is important to note that it is extremely difficult to robustly quantify job and GVA effects. The figures in Table 3.8 are intended as a high-level illustration of the potential size of these effects, under the set of assumptions used in their calculation. Important caveats to consider include:
- As discussed above these are gross estimates of job effects associated only with the costs of biogas and biomethane production technologies. They do not take into account any associated reduction in jobs from the supply of energy by fossil fuels. However as Ireland has a high dependence on imported fossil fuels, which accounted for 85% of total energy use in 2014, impacts in the fossil fuel supply sector are likely to be relatively limited. There could however be impacts in sectors supplying conventional boilers and generating equipment, and in operation of these fossil fuel based plant. Further analysis is needed to explore the extent to which these effects are additional (see Section 3.2.6.3 below).
- The analysis combines information on expenditure over the deployment scenario to 2050 with information on average productivity of labour from a single historical year. In practice, output and GVA per worker are likely to continue to change in real terms going forward. Where productivity continues to improve, the impacts presented here will become an over-estimate of the true effects.
- Estimating numbers of jobs is more uncertain than job years. The former will also depend on a number of other parameters, in particular the profile of deployment. For example, if production capacity is installed over a shorter time period, this would create a larger number of ‘jobs’ as a larger workforce is required to undertake simultaneous installations. If installation takes place over a longer time period, repeat work could be undertaken by the same employees, hence reducing the number of ‘jobs’ created.
- In the deployment scenarios, technical capacity is built up and then replaced when it reaches the end of its useful life. As such the ‘jobs created’ by expenditure to refurbish assets are not
43 See for example article ‘Jobs boost at Selby Renewable Energy Park’ in The Yorkshire Press of 29 July 2009. Accessed at http://www.yorkpress.co.uk/news/4517102.Jobs_boost_at_Selby_Renewable_Energy_Park/ on 21st March 2017.

19
Assessment of Costs and Benefits of Biogas and Biomethane
counted here as additional impacts: a new job is counted only when the new capacity is first installed (and the worker is assumed employed by the plant over the remaining deployment scenario). As a consequence, the construction job estimates are likely to be conservative.
- A ‘job created’ in the results is unlikely to materialise into a single, actual position created in practice. This ‘1 job’ is likely to consist of a range of smaller roles contributing to the construction and operation of the asset. As such ‘1 job’ should be considered more as employment time created equal to 1 full-time equivalent (FTE) for an assumed number of years, which could be split between 1 or more different roles, rather than one person in one position.
Sensitivity analysis
The discussion above highlights some of the key sensitivities associated with estimating job and GVA effects. In addition, there are a range of alternative data inputs which could be used for the calculations, creating additional ambiguity.
The estimation of effects uses two key parameters: output per worker and GVA per worker. The core analysis above presents the effects based on data drawn from CSO’s National Accounts44. However, this data is only available for 2011. More up-to-date data for the construction sector is available from CSO in its ‘Enterprise statistics on construction’ database45 which provides output, employment and GVA data to 2014. Eurostat also provides the same data disaggregated for the construction sector in Ireland, with the latest year 201546. To illustrate the sensitivity to the data selected, the calculations are repeated using these alternative inputs and presented in Table 3.9 for the ‘All AD Feedstocks’ scenario.
Table 3.9 Sensitivity of construction employment and GVA effects to data input
Base case Sensitivity 1 Sensitivity 2
CSO National
Accounts44
CSO ‘Enterprise statistics on
construction’45 Eurostat46
Construction job-years 52,930 22,811 43,889
Construction jobs 5,293 2,281 4,389
GVA from construction phase (€000)
1,302 2,061 2,345
Likewise, variance across data sources also drives sensitivity in the estimation of operational effects. In this case Eurostat also provides productivity data aggregated for all economic sectors and is used for sensitivity analysis. In addition, Eurostat also contains data for different economic sectors. The sensitivity of the results to applying productivity metrics for relevant sectors to different cost categories was therefore examined: feedstock costs were combined with productivity metrics for agriculture and waste sectors, and production costs with metrics for the agriculture, waste and energy supply industries. The range of results are presented in Table 3.10 for the ‘All AD Feedstocks’ scenario.
3.2.6.2 Job and GVA effects – indirect and induced
Beyond the jobs directly provided by the construction and operation of biogas and biomethane production plants, other economic impacts can materialise:
- Indirect effects: where demand is stimulated in the supply chain for intermediate goods that go towards the production of the final output associated with the direct demand
44 Central Statistics Office; see tables OVA04 and ESQ04: http://www.cso.ie/px/pxeirestat/statire/SelectTable/Omrade0.asp?Planguage=0 45 Central Statistics Office; see http://www.cso.ie/px/pxeirestat/Statire/SelectVarVal/Define.asp?maintable=BAA12&PLanguage=0 46 http://ec.europa.eu/eurostat/data/database

20
Assessment of Costs and Benefits of Biogas and Biomethane
- Induced effects: where demand in the rest of the economy is stimulated as a result of increased household incomes from those directly and indirectly employed as a result of increased production.
Table 3.10 - Sensitivity of operational employment and GVA effects to data input
Base case Sensitivity 1 Sensitivity 2
CSO National Accounts Eurostat – all sectors Eurostat – specific
relevant sectors
Operational (permanent) jobs
3,404 2,263 2,240 to 8,079
GVA from operation (€000, per annum)
317 295 (Not estimated)
Indirect effects
Supply chains for a number of typical plants included in the deployment scenarios are shown in the Figures below. These provide an illustration of the range of potential activities and economic sectors which could be involved in the production of biogas and biomethane. It is these activities which will drive increases in demand, and subsequently job and GVA effects, in the supply chains linked to these economic sectors.
Figure 3.9 Example supply chain for farm based AD plant with biogas boiler

21
Assessment of Costs and Benefits of Biogas and Biomethane
Figure 3.10 Example supply chain for farm based AD with CHP plan
Figure 3.11 Example supply chain for waste based biomethane plant

22
Assessment of Costs and Benefits of Biogas and Biomethane
Figure 3.12 Example supply chain for gasification plant
The main stages of the supply chain, each of which will have employment effects are:
• Feedstock production: Jobs in feedstock production and collection can involve: farmers, seasonal workers, mechanical and chemical engineers, harvesting equipment mechanics, equipment production workers, biochemists, agricultural engineers and storage facility operators, truck drivers. Employment effects are likely to be more limited where feedstocks are waste products, but some scenarios (All AD feedstocks and the Exploratory scenarios) make significant use of agricultural crops (grass silage) and wood chips which would be supplied from the forestry sector or agricultural sector if energy crops are used. Even if new jobs are not created, feedstock production may help safeguard existing jobs. Increased production of silage could also have beneficial effects in companies supplying inputs for silage production or machinery for harvesting of silage.
• Feedstock collection and transport: Where the feedstock is food waste, there may be some
additional jobs involved in waste collection, diversion from landfill and sorting and treatment. With regards to commercial food, food wastes arise in varying quantities across a range of businesses. Unlike some industrial producers of food waste, businesses in the commercial sector have traditionally mixed their food and other wastes together. These are usually then collected as mixed waste, typically for landfill disposal. Supply contracts with individual food waste producers or with local authorities for food collection and transport to site may be agreed to deliver waste to the facility. Where the feedstock is agricultural waste, transport costs (and hence job opportunities) are likely to be low where these are production facilities located on site. Again there may be additional opportunities associated with collection and sorting of appropriate wastes. In all cases, biogas and biomethane production operators will aim to minimise transport costs which can be relatively expensive, especially for low energy content livestock slurry from remote sites to the digester. The cost of waste collection and treated material re-distribution, even when using large 20m3 road tankers, can represent 20 to 35% of the AD plant total running cost47. It is therefore important to plan the whole transport system carefully and to minimise travelling distances.
47 Dohanyos, M, Zabranska J, Jenicek P, Fialka P and Kajan M, 2000. Anaerobni cistirenske technologie (Technologies of anaerobic treatment), Noel 2000 ISBN 80-86020-19-3.

23
Assessment of Costs and Benefits of Biogas and Biomethane
• Biogas/biomethane production / conversion process: This is most likely the key point in the
supply chain for employment effects. The production and/or conversion process will create skilled employment positions associated with the operation, maintenance and repair of the biogas and biomethane production assets.
• Transport and end-use: Transporting the output of the process to the end-user is the last link in
the supply chain. The transport of gas can be made through trucks or pipelines. It can support or create jobs in the freight industry, in the construction and operation of pipelines and at fuel stations. The digestate produced by the facility also needs to be distributed. Indeed, a unit produces almost as much digestate material for transport and disposal as it receives as feedstock. Therefore, production needs access to suitable agricultural land within a reasonable transport radius to dispose of the digestate.
It is important to note that many of the direct links in the supply chain for the production of biogas and biomethane presented in the Figures above will have been captured in the assessment of direct economic effects above. This will be the case where the costs of these activities have been captured quantitatively in the cost assessment: (e.g. feedstock price for silage). However, there will still be a range of indirect effects which are not captured: e.g. where biogas / biomethane production uses farm waste, the additional revenues for the agricultural sector could be used for a range of activities which have subsequent supply chain effects, such as purchase of new machinery to increase productivity of the more conventional farming activities.
As noted above, the quantification of direct economic effects is highly uncertain: the quantification of indirect and induced effects is even more so, given this takes the quantified direct effects and adds a further layer of assumptions and caveats. This process is made even more difficult due to the lack of employment and GVA multipliers for Ireland. Output multipliers are available for Ireland and have been used instead to illustrate the size of indirect effects associated with the deployment scenarios as set out in Table 3.8. As with direct effects construction related effects are associated with all installations to 2050; operational effects are those associated with installations present in 2050.
Table 3.11 presents the results of a sensitivity analysis on the estimation of indirect effects, using data for the multiplier from two alternative sources, for the ‘All AD feedstocks’ scenario in 2050. The alternative sources are:
- A study by IGEES48 examined the short-run labour impacts in Ireland of public capital spending across various areas, producing estimates for associated direct and indirect jobs. The study estimated for the construction sector that for every €1m increase in expenditure, direct and indirect employment would increase by approximately 12 job years.
- Type I employment and GVA multipliers for Scotland are produced by the Scottish Government. The relevance of these multipliers to Ireland is debateable and will depend on a number of factors, not least the comparability of the Scottish and Irish economies and the presence and size of different economic activities. These are presented purely for information and as a basis for the discussion of induced effects below.
Induced effects
Induced effects represent a further widening of the consideration of impacts: these capture the knock-on effects of increasing household income which translates into increased consumption. This increasing income is the result of increases in direct (associated with the production of biogas and biomethane) and indirect (knock-on effects to the supply chains of economic sectors involved) activity. For example, jobs in local shops and restaurants used by employees of the biomethane production facilities.
48 Department of Public Expenditure and Reform, Irish Government Economic and Evaluation Service, 2015. Public Capital Programme 2016 to 2021: Labour Intensity of Public Investment

24
Assessment of Costs and Benefits of Biogas and Biomethane
These effects tend to carry a greater level of uncertainty in particular around the additionality of these effects. Further quantifying these effects carries a greater risk of double-counting and they are often smaller.
No Type II multipliers with which these effects can be quantitatively illustrated are readily available for Ireland. In their absence, to provide a sense of the size of these effects, induced effects associated with the deployment scenarios were estimated using Type II multipliers developed for Scotland. This showed that induced effects were likely to be smaller than the direct and indirect effects.
Table 3.11 – Sensitivity analysis around indirect employment and GVA effects
CSO
Output Multiplier
IGEES ‘Labour Intensity of Public
Investment’
Scotland employment and GVA multipliers
Construction job-years 7,786 2,297 7,983
Construction jobs 779 230 798
GVA from construction (€m) 191 56 196
Operational (permanent) jobs 92 to 169 - 101 to 500
GVA from operation (€m, per annum) 9 to 16 - 9 to 46 Note: the range around operational effects for each source is derived by applying multipliers for different (relevant) economic sectors (i.e. for agriculture, waste and energy supply). The range is based on the variance in multipliers associated with these activities. For construction, only the output multiplier for the construction sector is applied, hence deriving a single number. IGEES only produce multipliers for the construction and not operation of assets.
3.2.6.3 Additionality of effects
The analysis of employment and GVA effects presented above focuses on the gross effects. However, a core principle of economic analysis is to focus on those impacts which are additional. This section explores the different components of additionality to explore the likely net effect of deployment on the Irish economy.
Deadweight and substitution
This study focuses on identifying and illustrating the benefits associated with all new deployment of biogas and biomethane production. To do so, the CBA above adopts a stylised counterfactual which assumes no further deployment in order to capture all the effects associated with new facilities. As such, it is a construct of the analytical approach that there is no deadweight (i.e. no biogas or biomethane sites would have been implemented anyway) in the assessment of impacts in this study. This is a consequence of analysing a technical deployment scenario rather than a specific policy scenario. In practice, it is more likely that there will be at least some deadweight: e.g. anecdotal evidence suggests some biogas and biomethane plants are currently being built in Ireland and incentives for production were included under REFIT 3. That said, the levelised cost analysis undertaken as part of this study has suggested that most plant types are not economically feasible in their own right. Further, REFIT 3 has come to an end and there currently exists no set of subsidies for new production (although this could change with the implementation of a potential further round of REFIT or the RHI). In conclusion, it is likely that the stylised counterfactual adopted for this study will be very close to (if not the same as) a counterfactual for assessing policy impacts, however deadweight effects should be considered again in more detail in the context of the specific policy proposed and wider incentive environment.
A further element of deadweight specific to employment impacts is not whether the technology would have been installed anyway, but whether the jobs would have existed anyway. In many cases this could be true: for example, in the case of smaller facilities, investment may have a small or no direct impact on jobs, relying instead on existing staff who may be required to up-skill. So a ‘job created’ may not necessarily transpose into a new role or position to be filled by a new employee into the workforce. However, this merely highlights a further caveat to keep in mind when considering the job effects. As noted above, the job effects should be considered more in terms of an increase in demand for

25
Assessment of Costs and Benefits of Biogas and Biomethane
employment time, rather than a specific role itself. It is true that the expenditure associated with biogas and biomethane capacity will create a demand for employment time, but whether this is taken up by existing persons employed in relevant roles or through the creation of new roles will depend on a range of factors (e.g. spare capacity or the productivity of competing tasks in peoples existing roles).
The same logic applies to substitution (i.e. where a current plant operator takes their plant offline to take advantage of subsidies offered by a new policy). Given this analysis does not consider a specific policy with associated subsidy levels (it only seeks to highlight the benefits of all new deployment), these behavioural responses are not relevant and this effect will not influence the results of the analysis. Again, this effect would need to be considered again where a specific policy is being considered. Over the course of this study, stakeholders have raised the question as to whether existing installations would retrospectively be eligible for support: where this is the case, substitution effects are unlikely to exist. However, it is noted under the UK RHI existing installations were not eligible. Further, given the substantial upfront costs which subsequently become ‘sunken’, the likelihood of such behaviour seems small.
Displacement
Displacement considers the instance where investment in biogas and biomethane facilities displaces similar activity, in this case to produce different types of energy.
This effect is addressed in the CBA through the assessment of effects relative to a counterfactual: biogas and biomethane production displace natural gas and heat and electricity provided through more conventional means. As such, the impact of this effect on the results is already captured by the CBA.
As noted above, the employment and GVA analysis focused on gross effects. To do so it used the gross expenditure (capex and opex) on biogas and biomethane production facilities, not the net expenditure.
It is likely that the expenditure on the counterfactual technologies (i.e. conventional means of producing heat, electricity and transport fuel) will also have associated employment and GVA effects. As such, the results presented in the analysis are likely to over-state the net effect on the Irish economy as this expenditure is lost under the biogas and biomethane deployment scenarios.
However, given the difficulties and uncertainty associated with estimating employment and GVA effects, the analysis has retained a focus on the gross rather than net expenditure. A key element of this is the coarseness of the approach which inherently limits the accuracy of any assessment.
Further, expenditure on different assets will be subject to different levels of leakage (which have only been explored qualitatively here). For example, to the extent that Ireland imports its traditional energy resources, this will increase the level of leakage of the associated employment and GVA effects, at least in the production (and in part the transport) of energy resources. In fact, as highlighted in Section 3.4, the deployment of biogas and biomethane production facilities could reduce the level of energy imports, which alongside improving energy security and the balance of payments, could also ‘bring onshore’ jobs associated with energy production.
Leakage
Leakage will occur where the employment and GVA effects associated with deployment accrue outside of the Irish economy: e.g. where technology, feedstock or labour are imported to support the installation and operation of capacity.
Biogas and biomethane production pathways considered in this study are inherently local in nature: waste feedstocks produced in Ireland are taken and converted into biogas or biomethane, which is then consumed in the country. This suggests that the potential for leakage is low. However, a more detailed consideration suggests the risks are not necessarily insignificant.
The stakeholder consultation undertaken as part of this study provided a range of useful insights. These are summarised as follows against each of the production inputs:
- Equipment: All stakeholders agreed that at least part of the equipment would likely need to be imported, however opinion varied on the extent required. In particular, this will depend on the technology type. Stakeholders noted that the necessary specialised equipment is available

26
Assessment of Costs and Benefits of Biogas and Biomethane
in Ireland, but this is typically imported from manufacturers abroad (e.g. gas storage, digesters, gas upgrading equipment, compressors). However, stakeholders believed that all other non-specialist equipment could be sourced from Irish manufacturers (e.g. supervisory and monitoring equipment, tankage, piping and more generic equipment). Many stakeholders believed that the share of equipment supplied from within Ireland can improve as the market develops, with it capturing a larger amount of the employment and GVA effects (and reducing leakage) over time. However, it was noted that this would depend on the size of the market that develops, and it may need support to get off the ground.
- Feedstock: From the stakeholder responses, the likelihood of needing to import feedstock appeared very low. In fact, most of the technologies considered under this study focus on taking advantage of existing waste streams, underlining the potential low demand for imports. Stakeholders reported no concerns regarding the availability of a range of feedstocks, in particular grass, cattle slurry, sewage and waste water. The only exception may be wood chip to feed gasification, although this was not commented on directly by stakeholders.
- Skills: There was a mixed response as to whether the necessary skills to support deployment already exist in Ireland. Some stakeholders did not believe that the necessary skills were available. Others noted that non-biogas / biomethane specific skills were available (e.g. civil engineering, construction, design, installation and commissioning) but biogas expertise would need to be imported from overseas. A handful highlighted that Irish contractors are already experienced in AD deployment, related academic research projects are ongoing and Irish firms are actively bidding for UK contracts. Those that highlighted deficits in Ireland’s skill base however all agreed that the necessary expertise could be developed domestically to support the industry over time, the feasibility of which again depending on the size of the market.
The CSO output multiplier used to explore indirect employment and GVA effects offers interesting insight into the potential for leakage. CSO breaks the multiplier down into different contributions, including ‘imports of goods and services’. The proportion of indirect effects taken by this category varies between sectors: 51% for agriculture, 28% for electricity supply, 23% for sewerage and waste water services and 48% for construction. These figures provide an illustration of the potential size of leakage which occur as a consequence of expenditure in these sectors. For example, for every €100 of demand for products in the construction sector, €48 would leak out of the Irish economy through imports.
It is more difficult to assess leakage of indirect and induced employment and GVA effects. This will be determined by the much wider range of activities and supply chains associated with these effects. In some cases, there may be a lower risk of leakage, for example where a farm invests in a more traditional agricultural activity using Irish labour and feedstocks and its outputs are bought by Irish consumers. However, in particular for induced effects, the supply chain for some products (e.g. high-end technology goods) may have 100% level of leakage where these are purchased.
3.3 Other sources of renewable gases
The economic analysis is focused on technologies for which feedstocks are currently available in significant quantities and for which robust cost and performance data was available to allow modelling. There are however additional potential sources of feedstocks and technologies which could further increase the contribution that renewable gases could make to Ireland’s energy supply. These include the use of macro-algae as a feedstock for anaerobic digestion, imports of bioLPG and renewable power to gas technologies.
3.3.1 Use of macro-algae in AD
It is possible to anaerobically digest macro-algae (seaweeds) alongside other feedstocks to produce biogas, although some management of the process may be require to make sure that substances in

27
Assessment of Costs and Benefits of Biogas and Biomethane
the seaweed such as salt do not inhibit the process49. There are natural stocks of kelp which could be collected from beaches, but the potential for negative impacts on ecosystems and biodiversity means that the preferred supply option in the future, would be cultivation of seaweed close to salmon farms. At these locations, the seaweed can extract the nutrient-released by the farmed salmon from the water. This can increase the overall yield of seaweed available and can help to ameliorate the negative impacts of salmon farming50. The Bioenergy Supply study estimated that the macro-algae resource could produce up to 11 ktoe (0.5 PJ) of biogas in the future, although estimates of the potential cost of biogas from macro-algae suggest this would be at a higher costs than biogas from other feedstocks or gasification (see Section 4.1).
3.3.2 Bio-LPG
From 2017, Calor will be importing 6,000 tonnes (7.2 ktoe, 0.3 PJ) of bio-LPG into Ireland from Rotterdam, where it is produced as a co-product in Neste’s Hydrotreated Vegetable Oil (HVO) production facility. Feedstocks for HVO production are vegetable and waste oils, meaning that the bioLPG can be considered a renewable fuel51. However as fossil based hydrogen is used in the production plant, and as some of the hydrogen in the bioLPG is derived from water, the fuel cannot be considered wholly renewable. The UK Department for Transport have assessed this issue based on information provided by Calor and ruled that 93.2% of bioLPG can be considered to be of biological and renewable origin52.
3.3.3 Renewable power to gas technologies
In renewable power to gas (P2G) technologies, renewably generated electricity can be used to produce biomethane which can be injected into the grid. The electricity is used to produce hydrogen through electrolysis, and this is subsequently combined with CO2 in a methanation step to convert it to biomethane. As biogas typically contains about 40% CO2 which must be removed when it is upgraded to biomethane, P2G technologies can be combined with AD plants, increasing their output of biomethane. Other sources of CO2 which P2G technologies could utilise include industrial sites such as large distilleries or breweries.
A further advantage of P2G is that it could offer a more flexible electricity grid by helping to provide a demand for renewable electricity at times when all of the renewable electricity generation cannot be accommodated on to the grid, e.g. when it exceeds demand on the grid, or because of transmission constraints. This could become increasingly important as the share of intermittent renewable sources such as wind and solar in electricity supply increases. In 2015 for example, 348 GWh, equivalent to 5.1% of the total available wind energy could not be accepted on to the grid either because it occurred at times of low demand or because of local transmission constraints53. Modelling has suggested that this percentage could rise in the future, with for example one study suggesting that all island curtailment of renewable electricity could be between 7 and 14% in 202054. In the future P2G systems could potentially convert this renewable electricity to biomethane for use as part of the gas supply55, although the role of P2G would need to be considered alongside other grid management techniques (already being undertaken by EirGrid as part of the DS3 programme) and alternative future energy storage options.
The methanation step in P2G technologies of converting hydrogen and CO2 to biomethane can be done either catalytically or biologically (see Box 3.1). P2G systems are at an early stage of development,
49 Sustainable Energy Ireland, 2009. A Review of the Potential of Marine Algae as a Source of Biofuel in Ireland. 50 Murphy, JD, 2015. A bioenergy model for Ireland: greening the gas grid; Engineers Journal; 7 April 2015; (http://www.engineersjournal.ie/2015/04/07/bioenergy-model-ireland-greening-gas-grid/) accessed 14/01/2016. 51 The EU define biofuels as ‘biofuels’ means liquid or gaseous fuel for transport produced from biomass (Directive 2003/30/EC on the promotion of the use of biofuels or other renewable fuels for transport). Under this broad definition bioLPG is a biofuel, and hence can be considered a renewable fuel. While bioLPG is not on the list of fuels that are definitely classed as biofuels in the Renewable Energy Directive, that list included only the most common types of biofuels that were produced or envisaged at the time the Directive was passed, and is not intended to be exclusive. The fact that bioLPG is not on the list does not therefore mean that it would not be considered a biofuel. 52 Copy of letter from UK DfT to Calor of 23 June 2015, provided to Ricardo Energy & Environment by Calor. 53 EirGrid and SONI, 2016. Annual Renewable Energy Constraint and Curtailment Report 2015. 54 Garrigle. E et al, 2013. How much wind energy will be curtailed on the 2020 Irish power system? Renewable Energy 55 (2013) 544-553. 55 Ahern EP, et al, 2015. A perspective on the potential role of renewable gas in a smart energy island system. Renewable Energy, 2015. 78: p. 648-656.

28
Assessment of Costs and Benefits of Biogas and Biomethane
but trials of the approach are ongoing (e.g. in Denmark as part of the Biocat project56) and there are some demonstration plants. For example Audi have a 6MW electrolysis system coupled with a 1000 m3/hour biogas plant operating in Wertle, Germany, which supplies biomethane for use as a vehicle fuel. While there are still technical and economic questions related to electrolysis, methanation processes and the process chain57, early indications are that P2G systems could have significant potential.
Box 3.1 Renewable Power to Gas Technologies
Catalytic methanation of biogas is achieved using a catalyst within a reactor vessel that is separate to the anaerobic digestion process. The process typically operates in the 300 to 800°C temperature range and at pressures up to 20bar. The methanation reaction is exothermic and so, once established, as well as producing biomethane the methanation process can act as a source of high-grade heat (e.g. steam).
Biological ex-situ methanation: the methanation of biogas is achieved within a biological reactor that is separate to the anaerobic digestion process. The principal benefit of having a separate biological reactor is that the conditions can be attuned to optimise the production of hydrogen by methanogenic archaea, which are single celled microorganisms. A number of reactor types have been trialled for this application including; continuously-stirred tank, trickle-bed and hollow-fibre membrane reactors.
Biological in-situ methanation: Here the methanation of biogas is achieved by the direct injection of hydrogen gas into the anaerobic digestion process itself, taking advantage of the existing hydrogenotrophic methanogenesis pathway that takes place within the AD process. The principal benefit of this approach is the elimination of the need for a further reactor vessel for methanation. However, the injection of hydrogen into the AD process needs to be carefully controlled as excessive
56 http://biocat-project.com/ 57 Gotz M, et al. 2016. Renewable Power-to-Gas: A technological and economic review, Renewable Energy, 85, 1371-1390.
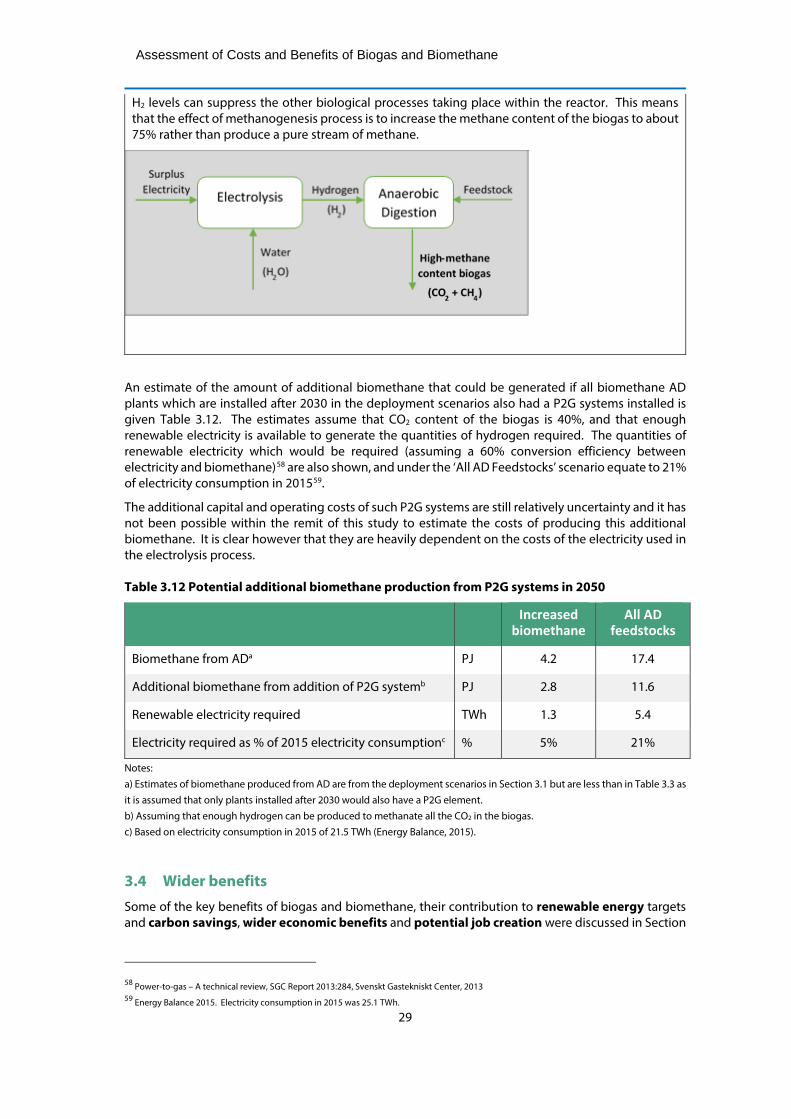
29
Assessment of Costs and Benefits of Biogas and Biomethane
H2 levels can suppress the other biological processes taking place within the reactor. This means that the effect of methanogenesis process is to increase the methane content of the biogas to about 75% rather than produce a pure stream of methane.
An estimate of the amount of additional biomethane that could be generated if all biomethane AD plants which are installed after 2030 in the deployment scenarios also had a P2G systems installed is given Table 3.12. The estimates assume that CO2 content of the biogas is 40%, and that enough renewable electricity is available to generate the quantities of hydrogen required. The quantities of renewable electricity which would be required (assuming a 60% conversion efficiency between electricity and biomethane)58 are also shown, and under the ‘All AD Feedstocks’ scenario equate to 21% of electricity consumption in 201559.
The additional capital and operating costs of such P2G systems are still relatively uncertainty and it has not been possible within the remit of this study to estimate the costs of producing this additional biomethane. It is clear however that they are heavily dependent on the costs of the electricity used in the electrolysis process.
Table 3.12 Potential additional biomethane production from P2G systems in 2050
Increased
biomethane All AD
feedstocks
Biomethane from ADa PJ 4.2 17.4
Additional biomethane from addition of P2G systemb PJ 2.8 11.6
Renewable electricity required TWh 1.3 5.4
Electricity required as % of 2015 electricity consumptionc % 5% 21%
Notes: a) Estimates of biomethane produced from AD are from the deployment scenarios in Section 3.1 but are less than in Table 3.3 as it is assumed that only plants installed after 2030 would also have a P2G element. b) Assuming that enough hydrogen can be produced to methanate all the CO2 in the biogas. c) Based on electricity consumption in 2015 of 21.5 TWh (Energy Balance, 2015).
3.4 Wider benefits
Some of the key benefits of biogas and biomethane, their contribution to renewable energy targets and carbon savings, wider economic benefits and potential job creation were discussed in Section
58 Power-to-gas – A technical review, SGC Report 2013:284, Svenskt Gastekniskt Center, 2013 59 Energy Balance 2015. Electricity consumption in 2015 was 25.1 TWh.

30
Assessment of Costs and Benefits of Biogas and Biomethane
3.2. Three are a number of other potential benefits which could arise from increased biogas and biomethane deployment, and these are discussed below.
Reduction in dependence on energy imports and improved energy security
In 2014, energy imports represented 85% of total energy use in Ireland and had a total value of €5.7 billion. The energy trade deficit expressed in percentage in GDP is above EU average (89% across all fuels in 2013, versus 53% in the EU)60. For natural gas specifically, the reliance on non-indigenous supply was even larger, with 96% of natural gas consumption used being imported61. These statistics are prior to the development of the Corrib gas field which is expected to meet 77% of the Republic of Ireland’s annual gas demand in its first full year of commercial production. However, while Corrib will greatly enhance Ireland’s security of supply in the short-term, in the medium-to-long-term, post 2020, Ireland is likely to remain largely dependent on imported natural gas to meet demand62. The potentially substantial contribution that biomethane could make to natural gas supply (e.g. under the ‘All AD feedstocks’ scenario) would help to diversify sources of gas supply thus improving energy security and helping to shield against possible price instability or volatility in international energy markets.
Improved waste management
AD presents an opportunity to divert organic wastes away from traditional management methods, such as landfill and composting, and to improve the management of slurries. A key benefit of this improved management is a reduction in the greenhouse gas emissions associated with the management of the wastes. These carbon savings were included in the CBA conducted as part of this study, and were a significant addition to the overall estimated carbon saving. For example, additional savings from avoided emissions from slurry storage were estimated as 412 kt CO2 eq in 2050 in the ‘All AD feedstocks’ scenario. Savings from improved management of food wastes are much smaller, as it was considered that the most likely management stream for food waste which had been collected separately was composting, which has relatively low greenhouse gas emissions.
Improved nitrogen availability and nutrient recycling
Digestion of livestock slurry will typically increase availability of the nitrogen in the slurry by around 10%63, although some trials have shown greater increases, particularly when application is through injection rather than trailing shoe. For example, in trials in Denmark, utilisation of N from digestate applied to grass using injection in the spring was 65% compared to 45% for cattle slurry, and 60% for pig slurry64. As with livestock slurries, the amount of nitrogen that will be available to the crop will be less than the total, due to potential losses of nitrogen as ammonia gas or through nitrate leached into groundwater, although following good agricultural practice will help crops take up more.
Digestate from food waste has a high nitrogen availability (of 80%) and its use as a fertiliser helps to reconnect nutrient cycles63.
Benefits for organic food production
Organic farmers can benefit from biogas production through improved nutrient recycling. The conversion of slurry to digestate in the AD process improves the value of the material as a fertiliser, increasing the availability of nitrogen. This is particularly important in organic farming where inorganic fertilisers are not used and recycling of nutrients in farm waste materials is therefore at a premium. Use of digestate as a fertiliser is permitted under the Organic Food and Farming Standards in Ireland65 with
60 European Commission, 2015. State of the Energy Union: Country Factsheet Ireland. Available at http://eur-lex.europa.eu/legal-content/EN/TXT/PDF/?uri=CELEX:52015SC0228&from=en 61 SEAI, 2016. Energy Security in Ireland: A Statistical Overview. 2016 Report 62 SEAI, 2016. Energy Security in Ireland: A Statistical Overview. 2016 Report 63 WRAP, 2012. Using quality anaerobic digestate to benefit crops. 64 Lukehurst C, Frost P and Al Seadi T, 2010. Utilisation of digestate from biogas plants as biofertiliser. A report by IEA Bioenergy Task 37. 65 Organic Food & Farming Standards in Ireland – Amendment Register – Amending Edition 1 - Issue 001 (01.01.2012) Amendment No A49 November 2014. Available at http://iofga.org/wp-content/uploads/Amendments-to-Standards-November-2014.pdf

31
Assessment of Costs and Benefits of Biogas and Biomethane
certain restrictions e.g. slurry must not be of factory farming origin and for digestate produced from source separated food waste, limits are set for the concentration of some trace elements.
Work in the EU project BIOFARM II reports that there are currently 180 organic biogas plants in Germany and 1 to 5 plants in a number of other EU countries66. The project claims that biogas plants on organic farms have improved the yields and quality of crops, and this is supported by a survey of farmers in Germany where yield increases in the range 15% to 30% were reported67. It should be noted that organic farming in Ireland currently accounts for only 2% of production, so the scale of this benefit may be small.
Biodiversity
Digestate has a reduced pathogen loading compared to raw slurry. As discussed above, it can act as a more effective fertiliser than raw slurry, which could lead to farmers being able to reduce mineral fertiliser applications. Digestion of slurry also reduces the number of viable weed seeds, lowering their dispersal by land spreading, which can mean there is less need for herbicides. Both the reduced mineral fertiliser input and the reduced pathogen loading can have benefits for local wildlife68 and so will support biodiversity. In order to fully realise these benefits farmers must characterise the digestate and make appropriate reductions in mineral fertiliser applications.
Odour reduction from slurry spreading
Slurry arising from livestock rearing is usually utilised by spreading to land. In order to comply with EU regulations on good agricultural practice for the protection of waters69 slurry must only be applied to growing crops, so a storage facility is required for when spreading is not allowed. Slurry storage and spreading to land can lead to strong odours, and surveys of farmers have identified that they often receive complaints from people living in the immediate neighbourhood. While low emission techniques such as trailing-shoe or injector, can help to reduce odours, so can the AD process. This is due to the digestate output from the AD process containing a lower concentration of volatile fatty acids than the raw slurry input. Various studies confirm that the concentration of odour in the air is significantly lower when digestate, instead of untreated slurry, is applied on the fields70. The impact of odour reduction will depend on the proximity of neighbours to the storage and slurry spreading locations. It will therefore be of particular interest where the farmland is close to towns/ villages. There is no information on possible monetary benefits of odour reduction, but this aspect may make an AD installation more attractive to the local population.
Other benefits
A variety of other potential benefits were identified by stakeholders, which are already partially covered by the economic analysis (e.g. safeguarding of jobs) or are more loosely linked to the development of the biogas and biomethane than the benefits described above. A description of these of other potential benefits are included in Appendix 5.
66 Small scale organic biogas plants, Bioenergy Farm Small scale biogas conference, Brussels February 2016 67 Sustainable biogas production; a handbook for organic farmers. Sustaingas 2013. http://www.ecofys.com/files/files/ecofys-2014-sustaingas_handbook.pdf 68 Environmental benefits of micro-scale digestion, Bioenergy Farm II, 2016. Available at http://www.bioenergyfarm.eu/en/info-for-policymakers/environment/ 69 Explanatory handbook for good agricultural practice for the protection of waters regulations 2014. DAFM. Available at: https://www.agriculture.gov.ie/media/migration/ruralenvironment/environment/nitrates/NitratesExplanatoryHandbook14Mar2014.pdf 70 Environmental benefits of micro-scale digestion, Bioenergy Farm II, 2016. http://www.bioenergyfarm.eu/en/info-for-policymakers/environment/

32
Assessment of Costs and Benefits of Biogas and Biomethane
Supporting biogas and biomethane deployment
4.1 Financial viability of biogas and biomethane deployment
4.1.1 Methodology
Section 3 of this report assessed the costs and benefits to society of deploying biomethane; this section of the report considers the financial viability of biogas and biomethane plants. For a plant to be economic for the operator or developer of the plant, the cost of the heat, electricity or biomethane produced by the plant must be comparable to the cost of energy produced by alternative, fossil fuelled plant. If it is higher, or if other non-financial barriers exist then some form of direct subsidy or support and other policy measures to address other barriers, will be needed to encourage development. This section of the report calculates the levelised cost of energy (LCOE) for heat produced from biogas boilers and CHP plants and compares it to the LCOE of heat produced in gas and oil boilers and natural gas fired CHP plants. The levelised cost of energy represents the price per unit of energy that must be received for the plant to breakeven over its lifetime, i.e. the income received for the energy produced will cover the cost of capital investment in the plant and its operational and fuel costs.
As discussed in Section 2.3, information on capital and operating costs for current AD pathways were collected through stakeholder consultation and supplemented by literature review. Information for future pathways such as gasification and the use of macro algae in AD plants was obtained by literature review. More details of the process together with the cost data and literature sources used are given in Appendix 2, together with information on the size of the plants and the feedstocks used in each plant. The costs contained in Appendix 2, were also passed on to the study team conducting the analysis for the RHI consultation and were used by them as the basis of the costs of biogas and biomethane AD plants71. Assumptions are required on the costs of conventional technologies and fossil fuel prices used for the LCOE analysis of oil and gas boilers and CHP plants are contained in Appendix 3 and are consistent with those used in the RHI analysis. The technologies which were used for comparisons are summarised in Table 4.1.
Table 4.1 Conventional technologies used for comparison
Technology Main counter factual Sensitivity 1 Sensitivity 2 Biogas Boiler Natural gas boiler Oil boiler LPG boiler
Biogas CHP Gas boiler and electricity from grid
Oil boiler and electricity from grid
Natural gas fired CHP plant
Biomethane Natural gas in grid
Vehicle fuel CNG at filling station Diesel Petrol
4.1.2 Discount rate
The LCOE calculation is done at a discount rate that broadly equates to the rate of return that the operator requires on their plant, which is typically related to the cost of obtaining capital to invest in the plant and associated hurdle rate. In order to retain consistency with the analysis carried out for the RHI consultations, results are presented here for the central discount rate considered in the design options for the RHI of 8%, and for the higher rate considered in the design options of 12%72. While a detailed assessment of the most appropriate discount rate for use in evaluating biogas and biomethane technologies was outside the scope of this study, some further evidence and views were gathered and are summarised in Box 2. This contains views from stakeholders, gathered during the consultation process on the cost of capital when financing biogas and biomethane plant rate, together with other information from a recent study in the UK, which gathered evidence on the cost of capital for biogas CHP plant.
71 There are some small differences as in order to be consistent with the treatment of other technologies in the RHI analysis it was necessary to remove metering costs from the estimates, as this was treated as a separate cost item in the RHI analysis. 72 DCCAE, 2017. Public Consultation on the Design and Implementation of a Renewable Heat Incentive, 26 January 2017.
33
Assessment of Costs and Benefits of Biogas and Biomethane
Box 2 Cost of capital for biogas and biomethane plant
As part of the consultation process accompanying this study, evidence was gathered from stakeholders regarding representative costs of capital. It was apparent from these responses that some stakeholders had already held discussions with financiers regarding the cost of investing in biogas projects. A common theme across the stakeholder responses was that it is currently difficult to accurately anticipate the cost of capital given this will be heavily dependent on the structure and generosity of any support scheme implemented by the Irish Government. For example, one stakeholder highlighted that cost of capital would decrease with the certainty around subsidy received: cost of capital would be lowest where support is provided through a fixed tariff, would be higher under a market price premium and higher still under a ‘green certificate’ type structure. Stakeholders commented that the historical uncertainty over possible future support mechanisms for biogas projects has prevented project owners and financiers from discussing renewable projects in any level of detail and with any certainty.
In addition, there are other variables which will influence cost of capital:
- The technology type: e.g. support for a proven technology (e.g. CHP) would attract lower financing costs than a relatively newer, technology which has yet to be demonstrated in Ireland (e.g. upgrading to biomethane and injection to grid or dispensing as compressed biomethane for vehicles)
- Project scale: larger projects could face higher capital costs given there is more technology and ‘moving parts’, increased feedstock security risk, etc.
Many stakeholders provided a view on the level of weighted average cost of capital which they thought they would face. Almost all estimates fell within the range from 6% to 15% (although one stakeholder noted that they had seen a private broker quite a rate of 26%).
One further barrier to obtaining finance was noted by stakeholders, who suggested that some finance providers may not have an adequate understanding of the technology and hence may be more reluctant to fund projects. Conversely, some financiers expressed the view have noted that some developers do not understand the level of detail about project plans, costs and performance, which must be provided for financiers to accurately assess risk levels and be able to provide capital.
Further evidence on the potential cost of capital is available from a recent study on the hurdle rates for generation technologies prepared by NERA for DECC in the UK73. This study gathered evidence from stakeholder surveys and interviews to assess hurdle rates imposed by investors associated with a range of generating technologies in the UK. For AD (waste), the study recommended a hurdle rate range for 2015 between 9.7-13.6%, with a reference point of 11.7% (pre-tax real). The recommended range for AD CHP was from 11.7% - 15.6%. However, care should be taken when considering these ranges in the context of the present study. Firstly, the report itself, notes that the data gathered for the study was imperfect and subject to considerable uncertainty. Secondly, fundamental differences are likely to exist between the UK and Ireland which affect the individual components of risk underpinning the hurdle rates. Two factors are particularly pertinent:
1. Risk-free rate: The risk free rate is a key component of the hurdle rate and feeds directly into its calculation. In their testing of the evidence gathered, NERA decompose the hurdle rate and apply the yield on long-term UK government bonds to proxy the risk free rate. Applying the same logic here, we observe that the 1-year average yield associated with long-term (10-year) UK Government bonds in 2015 (the year for which hurdle rates were produced) was around 1.8%. In 2016 to date, the average yield on Irish Government long-term bonds has been much lower, around 0.7%. It is therefore expected that hurdle rates in Ireland, if the current low interest rate environment prevails, would be lower than those estimated for the UK.
73 NERA, 2015. Electricity Generation Costs and Hurdle Rates. Lot 1: Hurdle Rates update for Generation Technologies.

34
Assessment of Costs and Benefits of Biogas and Biomethane
Box 2 (continued) Cost of capital for biogas and biomethane plant
2. Allocation and policy risk: A key input into the determination of hurdle rates highlighted by the NERA study is the likelihood of being allocated support through policy mechanisms. The report notes that there has been a significant increase in the perceived ‘allocation risk’ facing new projects in the UK associated with the shift to competitive auctions under the Contract for Differences. This in turn has pushed up hurdle rates. The study suggests the impact of allocation risk on hurdle rates could be as much as 2%. This is particularly the case for AD: 83% of survey respondents considered allocation risk to be relevant for AD, more so than any other risk category (with the exception of technology maturity). Hurdle rates have also been affected by recent adjustments to UK government support for other renewable energy, feeding into changing perceptions around wider ‘policy’ risk. This mirrors the opinion expressed by stakeholders that financing costs will vary depending on the certainty of support received through government policy. Both allocation and policy risk are specific to the local policy environment – for the NERA study, the design and generosity of support under UK policy has a direct effect on the hurdle rates. As such hurdle rates for Ireland are likely to vary from those recommended for the UK.
4.1.3 LCOE for biogas boilers
The LCOEs for heat produced from the example biogas boilers (assuming no support mechanism is in place for biogas) are compared to the costs of heat produced by gas, oil and LPG boilers in Figure 4.1 to Figure 4.3 at the central 8% discount rate for a high (80%) and low (60%) heat load, and at the sensitivity discount rate for a high heat load. These show that the small biogas boiler (Boiler A) could be a cost-effective solution for off-gas grid situations where the alternative is an oil or LPG boiler. However, at a lower heat load it does not compare favourably with the costs of other technologies. The very large waste based biogas boiler could potentially deliver heat more cheaply than all of the conventional solutions due to the income the plant receives for the waste it is taking in, which offsets much of the capital and operating costs. The fact that such plant are not currently being built suggests that there are other non-financial barriers to development, as discussed in Section 4.3. A full set of results is given in Appendix 6.

35
Assessment of Costs and Benefits of Biogas and Biomethane
Figure 4.1 LCOE of heat from biogas boiler: DR 8% and high heat load
Figure 4.2 LCOE of heat from biogas boiler: DR 8% and low heat load
0 2 4 6 8 10 12 14
Farm (slurry and waste) 41kW boiler
Gas Boiler
Oil Boiler
LPG Boiler
Waste (mixture) 1MW boiler
Gas Boiler
Oil Boiler
LPG Boiler
Boi
ler A
Boi
ler B
c/kWh
0 2 4 6 8 10 12 14
Farm (slurry and waste) 41kW boiler
Gas Boiler
Oil Boiler
LPG Boiler
Waste (mixture) 1MW boiler
Gas Boiler
Oil Boiler
LPG Boiler
Boi
ler A
Boi
ler B
c/kWh

36
Assessment of Costs and Benefits of Biogas and Biomethane
Figure 4.3 LCOE of heat from biogas boiler: DR 12% and high heat load
4.1.4 LCOE for biogas CHP plants
In assessing the LCOE of energy produced from the biogas CHP systems, it is necessary to fix the value of one of the energy outputs (heat or power) from the CHP plant in order to estimate the LCOE of the other74. The same approach was taken as in the RHI consultation study, which, as it was examining the cost of heat production gave a value to the electricity produced by the CHP plant. This analysis considered three values for the electricity produced (all consistent with values assumed in the RHI study):
• a representative price (14 c/kWh in 2016) if biogas CHP schemes continued to be supported by feed in tariffs such as the REFIT 3 scheme
• the price that an operator would pay for electricity from the grid (11 c/kWh); this assumes that the biogas plant operator is using electricity produced from the CHP plant themselves and that it is replacing electricity they would have purchased
• the wholesale price of electricity (7 c/kWh in 2016); this is intended to represent the price which might be received by operators exporting electricity to the grid in the absence of any feed in tariff
In addition, the analysis below looks at the LCOE for a range of assumed heat loads as the LCOE is very sensitive to the value assumed. Some heat is always required to heat the digester and in some plant for pasteurisation, but depending on where the CHP plant is located, it may be difficult to find other useful heat loads. A range of heat loads was therefore considered for CHP plants, ranging from a low value (10 to 20%) representing the heat required for the digester and pasteurisation (where applicable) to higher values (60 to 80%) which assume that a suitable additional heat load exists. Full details of heat loads assumed are given in Appendix 2.
The LCOE of heat from biogas CHP systems is shown in the Figures below for the central 8% discount rate, high heat loads and the three different electricity prices discussed above. The LCOEs for heat produced from the CHP plant, vary widely mainly reflecting the costs of feedstocks, with waste fed plants, which can charge a gate fee for wastes used as feedstocks showing a lower cost per unit of heat produced. Where no cost is shown for the waste based plants CHP G, CHP H and CHP J in Figures 4.4 and 4.5, then this indicates that income for the electricity produced is sufficient to cover the costs of the plant, so that no cost needs to be attached to the heat produced. That is if the value of electricity produced is at or above 11 c/kWh (the price for electricity purchased from the grid), then the cost of heat produced from these three waste based plants would be lower than the cost of producing heat from a gas or oil boiler. This is also the case even if the heat load at the plant is lower, and is largely due to the fact that waste feedstocks can be acquired at a zero or negative cost.
74 An alternative approach is to decide the relative values of the heat and electricity output, e.g. electricity will always have a value which is twice that of electricity, and to then calculate the LCOE of both.
0 2 4 6 8 10 12 14
Farm (slurry and waste) 41kW boiler
Gas Boiler
Oil Boiler
LPG Boiler
Waste (mixture) 1MW boiler
Gas Boiler
Oil Boiler
LPG Boiler
Boi
ler A
Boi
ler B
c/kWh

37
Assessment of Costs and Benefits of Biogas and Biomethane
Figure 4.4 LCOE of heat from biogas CHP: electricity valued at REFIT levels

38
Assessment of Costs and Benefits of Biogas and Biomethane
Figure 4.5 LCOE of heat from biogas CHP: electricity valued at commercial user prices

39
Assessment of Costs and Benefits of Biogas and Biomethane
Figure 4.6 LCOE of heat from biogas CHP: electricity valued at wholesale electricity prices
At the higher discount rate of 12%, the picture is less clear cut with only CHP J (a large waste based plant) producing heat more cheaply than a gas or oil boiler at all heat loads; and CHP G and CHP H requiring a medium or high heat load to produce heat more cheaply than a gas or oil boiler. (Results for the 12% discount rate are given in Appendix 6) As discussed earlier the above the fact that there are relatively few of these types of plant built or planned currently, suggests that other non-financial barriers (discussed in Section 4.3 ) may be hindering deployment.
4.1.5 LCOE for biomethane plants
The LCOE for biomethane produced from AD plant is shown below for discount rates of 8% and 12%, and compared to the wholesale price of natural gas (calculated on the same LCOE basis). At an 8% discount rate, the cost of biomethane produced in new AD plant (BM A to G) is 0.9 to 7.0 c/kWh greater than the wholesale price of natural gas. At a higher discount rate of 12% this rises to 1.6 to 9.6 c/kWh. In the case of an existing AD plant at a sewage treatment plant (BM H), where only the cost of upgrading and injecting the biomethane is considered the cost of the biomethane is less than natural gas, suggesting that it would be economic to undertake this conversion. The two future technologies considered, use of macro-algae in AD (BMF A) and gasification to produce syngas (BMF B) have higher LCOEs.

40
Assessment of Costs and Benefits of Biogas and Biomethane
Figure 4.7 LCOE of biomethane (8% discount rate)
Figure 4.8 LCOE of biomethane (12% discount rate)
4.1.6 Biomethane as a vehicle fuel
In the case of biogas upgraded to biomethane and then dispensed as a vehicle fuel at an onsite filling station the cost is about 4.3 c/kWh more than petrol and about 6c/kWh more than diesel and about 6

41
Assessment of Costs and Benefits of Biogas and Biomethane
c/kWh more than natural gas dispensed as CNG. The price differential with diesel is greater than for petrol as quantities of diesel required have been adjusted to reflect the fact that conversion of diesel vehicles to spark ignition engines to run on gas typically results in an efficiency penalty of up to 25%.
Figure 4.9 LCOE of biomethane dispensed as CBM vehicle fuel (8% discount rate)
4.1.7 BioLPG
For existing LPG users, no capital expenditure is required to use BioLPG, but it is likely that Calor, the supplier of BioLPG will offer BioLPG at a higher price than conventional LPG. Calor indicated to the study team that for commercial customers, the price for BioLPG might be about 15% above conventional LPG prices. However it is possible that if BioLPG is recognised as a sustainable renewable fuel, it will qualify for carbon tax exemption, which would reduce this premium (Table 4.2). Calor report that the additional premium on BioLPG is to cover the cost of transportation from Rotterdam, and also the mass balance system they will be putting in place to allow tracking of the bioLPG. As such the study team have assumed that the additional cost will be a flat rate across all consumers.
Table 4.2 Current price for conventional LPG and indicative prices for BioLPG
Conventional LPG75 BioLPG BioLPG if exemption
from carbon tax given €/kWh €/kWh €/kWh Commercial cylinders 0.125 0.1378 0.133
Bulk LPG (0 to 3 tonnes) 0.078 0.0908 0.086
Bulk LPG (3.1 to 40 tonnes) 0.065 0.0784 0.074
4.2 Support for biogas and biomethane in other countries
Several countries have already developed financial mechanisms for supporting the development of biogas and biomethane projects, and in many countries this support has led or is leading to increased deployment of AD plants. Support mechanisms in a selection of these countries (Germany, UK, Austria, Sweden, France, Netherlands and Switzerland) are reviewed in detail in Appendix 7. In summary, the review found that feed in tariffs for electricity from biogas are common, and are typically tiered by size of plant, with some countries having specific bonuses for plants which are predominantly slurry based.
75 SEAI Commercial/Industrial Fuels, Comparison of Energy Costs 1 July 2016

42
Assessment of Costs and Benefits of Biogas and Biomethane
In some countries, while there is no direct support for biomethane production, it is supported indirectly by giving a bonus for upgrading gas to biomethane for use in CHP plant for electricity generation. Three European countries directly support the injection of biomethane to the grid, Netherlands, France and the UK. The UK and Netherlands also support the production of heat from biogas. Countries typically offer support for biomethane as vehicle fuel through the mechanisms in place to support use of all biofuels in vehicles. In Sweden, end user support has been focussed on vehicle fuel applications for biomethane through green car premiums and support for filling stations. Other support measures used by countries include exemptions from carbon and energy taxes for biomethane, priority grid access and transport for biomethane, and the sharing of investment costs for gas grid connections for biomethane plants, and renewable heat quotas for new buildings. Electricity from biogas plants in Ireland has previously been supported via a feed in tariff (REFIT 3) and a successor scheme is currently being considered. Potential support for heat from biogas plants and for injection of biomethane to the grid is currently being considered as part of the analysis and consultation on a potential RHI, and is therefore not discussed further here.
4.3 Other challenges to deployment
As part of the consultation phase of this study, stakeholders were asked about potential barriers they perceived to the further deployment of biogas and biomethane in Ireland. This was done through one to one conversations with stakeholder and through a stakeholder workshop on this theme held in Dublin in September 2016. Key issues which stakeholders identified are summarised in Table 4.3.
A key recurring theme in discussions with stakeholders was a general lack of easily available information regarding AD technologies, their operation and the potential impacts and benefits. This is reflected in several of the barriers identified. For example, a lack of information and understanding about AD technology within planning authorities can lead to uneven treatment of the technology between authorities. A lack of understanding in the general public, can lead to them assuming that AD is similar to waste facilities, and lead to objections based on its perceived rather than actual impacts. Particularly at smaller farm scale, a lack of information about the technology for farmers may mean that even where conditions for plant deployment are favourable, it is not considered. Finally, unfamiliarity of the technology by potential financiers may make obtaining finance more difficult, as the risk associated with the technology may be seen as high. Conversely, a lack of understanding, particularly by developers of smaller scale plants, of the type and level of information that financiers require to assess a project before considering finance may hinder raising finance.
Many of these information related issues are likely to lessen if deployment of biogas and biomethane plants increases and all concerned become more knowledgeable, as more systems pass through the development cycle and public awareness of the technology grows. However, taking action to address them now, could help the industry begin to grow. As discussed earlier, the analysis undertaken indicates that some waste based AD plants could be economic now, without any support. Their non-emergence suggests that that these and the other barriers identified in Section 4.3 could be inhibiting development of such plant.
Some of the challenges identified are specific to Ireland, but many are more generic and will have been faced in other European countries, which have subsequently had successful development of biogas and biomethane plants. This suggests that none are insurmountable, and that there are likely to be straightforward actions which can be taken to address them. Actions taken in other countries to address these challenges could provide useful insights into how Ireland could address some of the issues identified.

43
Assessment of Costs and Benefits of Biogas and Biomethane
Table 4.3 Challenges to biogas and biomethane deployment identified by stakeholders
Challenge Description Feedstock Supply
Competition for food waste feedstocks Alternative measures for the disposal of food waste, such as incineration and exportation of baled municipal waste, may lessen the incentive to separately collect food waste; thus reducing the resource available for biogas/biomethane production.
Securing a long term contractual supply of food waste feedstock
As the waste collection sector is fully privatised, the market for food waste is fragmented. Thus, securing long term contracts for feedstock supply, which can be a prerequisite for project funding, can be difficult and complex for developers.
Uncertainty in the production cost of grass silage
The cost of grass silage feedstock is variable and is a key economic factor in the development of grass AD facilities. Increases in grass production cost can lead to more expensive AD systems, lessening the economic viability of future AD plant development.
Unfamiliarity with different quality requirements for grass silage for AD
Silage quality varies depending on the stage of maturity of the crop at the time of harvest. A learning process is required for farmers to distinguish the most effective silage production methods for AD (as opposed to silage production for livestock).
Possible increased feedstock costs with market maturity
As the number of AD plants increase, the demand for food waste and industrial food wastes would increase. As food waste feedstocks are a by-product or waste from other processes, they are considered a finite resource. This limits how much supply can be increased in relation to increased demand which may lead to price volatility and price increases.
Limitations in the available feedstock resource for AD plants
Some AD feedstocks have a high moisture content which means transporting them is costly, and typically limits the distance over which it is cost-effective to transport them for digestion. AD plants may therefore need to be located in areas where large quantities of feedstock arise within a small geographical area, or need to be of a smaller scale, which may be less cost-effective. These limitations on feedstock transport can restrict the full utilisation of this resource. The need to match locations of high feedstock density with locations suitable for gas grid injection, or with suitable heat loads (for CHP plants) can also restrict deployment.
Technology and Infrastructure
Unavailability of local heat loads for biogas-CHP systems
To provide a high efficiency biogas-CHP system, a local heat demand is required. Unavailability of sufficient local heat loads, e.g. on Irish farms, limits the deployment of high efficiency CHP units.
Undemonstrated future biomethane production technologies
Gasification-methanation and Power-to-Gas systems are acknowledged as future biomethane pathways. Both technologies are currently undemonstrated at scale in Ireland with no commercial application thus far. Proof of concept at scale is required.
Complexities involved in connecting AD plants to the electrical grid
The cost of an electrical grid connection can be high depending on the AD plants proximity to an electric substations and its capacity. The grid connection process is typically designed for considerably sized (large) sites, and are not always fitting for smaller AD-CHP projects. This can lead to periods of uncertainty in connection costs for developers.

44
Assessment of Costs and Benefits of Biogas and Biomethane
Challenge Description Lack of land bank in proximity to AD plant for spreading digestate
A suitable land bank must be available for the application of digestate post-AD. This may be a particular issue to large food waste digesters in urban areas.
Lack of existing infrastructure for biomethane use in transport
The market for the use of gas as a transport fuel in Ireland is in its infancy, albeit, envisaged to grow, specifically in the freight and public transport sectors. The Alternative Fuels Directive requires compressed natural gas (CNG) refuelling stations to be provided by 202576. Gas Networks Ireland have begun the roll-out of this gas transport network. However, this considerable infrastructure construction is initially required to enable the nationwide deployment of biomethane in transport. Since most European car manufacturers are left hand drive, the unavailability of natural gas vehicles (NGVs) may also arise; this may limit the ease of penetration of NGVs in the private vehicle sector, which in turn could limit the penetration of biomethane as a vehicle fuel. The supply of right-hand-drive vehicle models may also introduce premium costs in procurement (or modification) of NGVs.
Regulatory and Financial
Risk of not meeting sustainability requirements
The Renewable Energy Directive requires that biomethane used as a transport fuel must deliver 60% savings in GHG emissions on a lifecycle basis (compared to the fossil transport fuel displaced) to be considered a valid biofuel. Depending on how silage is cultivated, it may be challenging for grass biomethane systems to meet this requirement. This is discussed further in Section 4.4.
Meeting oxygen tolerance levels after biogas upgrading for gas grid injection
For upgrading of biogas and injection of biomethane to the natural gas grid, a specification limit for oxygen at ≤0.2% (molar) at entry point was suggested in the CER consultation paper on biogas injection to the grid (2013). Uncertainty exists on the capability of biogas upgrading units to currently meet this specification. The consultation paper stated however that it may be possible to admit small quantities of biogas with a higher oxygen content into the gas network depending on the injection point, and noted that the specification for oxygen content has been extended to 1% in the UK following a review. The CER is currently finalising the biomethane connection policy for Ireland, so it is not yet known what the final specification for the maximum oxygen content limit will be.
Increased capital and operating costs, and increased heat demand due to need for pasteurisation of slurry imports
To protect the low disease status of the Irish agri-food sector, a key attribute of the industry in accessing export markets, the Animal By-products Regulations (ABPR) require slurry imports in excess of 5,000 tonnes wet weight from other farms to be pasteurised. The pasteurisation step increases the capital and operational costs of the plant and requires additional heat energy; this can act as a disincentive in importing slurry quantities in excess of 5,000 tonnes. This could also impede the development of co-op or community digesters, which due to the structure of the Irish agricultural sector where there are a large number of small farms, may be necessary to access sufficient quantities of feedstock for an AD plant.
No standards to reference for application of digestate
No digestate standards (such as PAS110 in the UK) have been developed in Ireland. This can make it difficult to dispose of the digestate off farm as the end users have no certainty over the quality of the digestate and its value as an organic fertiliser.
76 The Department of Transport, Tourism and Sport is currently transposing the Alternative Fuels Directive and will clarify the appropriate distances between stations, which is recommended to be 150klm in the Directive.

45
Assessment of Costs and Benefits of Biogas and Biomethane
Challenge Description Difficulties in adhering to non-standardised planning requirements
As planning regulations for AD plants are not standardised, the process can vary depending on the county in which the project is being developed. This has led to confusion and complexity in the process.
Lack of clearly defined policy framework and roadmaps for the development of biogas
Policy and incentives for AD to date (e.g. REFIT3) have led to little development of AD plants. A perceived lack of engagement by policy makers in this area and uncertainty over future policy and levels of support has not encouraged further development of the industry.
No certification scheme to account for renewable gaseous energy
Without a gas certification scheme in place for biomethane, companies utilising biomethane may not be able to account for its carbon benefits in relation to their corporate social responsibility.
Insufficient incentivisation for the ETS sector
If the ETS sector is excluded from future support mechanisms for biomethane, there may not be sufficient incentivisation for companies in the ETS to invest in AD developments.
Difficulty in obtaining finance for AD projects
Developers of smaller scale plants may be inexperienced in “selling” AD projects to potential financiers e.g. not understanding the type of information they will be required to provide, or the level of detail required. This can lead to financiers considering the investment as high risk, and being reluctant to provide funding or to have a higher cost of capital.
Behavioural
Unwillingness to produce energy crops long term
Farmers may be unwilling to produce energy crops for AD or gasification long term. Uptake of the energy crop grant scheme has reduced significantly as farmers have lost confidence that a demand exists for their product, due principally to the lack of a market for Miscanthus. Grass silage however is a familiar crop for famers, and may require less change to existing farming practices so there may be less resistance to growing it as an energy crop, providing there is an assured market.
Uncertainty over AD Co-op developments between farmers
Co-ops have been successful in Ireland but it is unknown whether farmers would adapt to AD co-op schemes and hence whether they would see the same success.
Perceived risk of investment for farmers Irish farmers have relatively low debt and high asset values as compared to the EU average for all farms77, suggesting that they may be risk averse. AD can require substantial investment which may seem like a risk to farmers particularly in a ‘new’ market, and may discourage investment.
Public perception of AD may delay development
With low uptake of AD in Ireland, concerns may initially be raised publicly in relation to odour (in using agricultural feedstocks), increased traffic (heavy goods vehicles) in more populated areas, the effect on aesthetics, and health and safety concerns in generating flammable gases. Objections to planning applications can delay the development of AD plants.
77 Teagasc and Bank of Ireland, 2015. A Review of the Financial Status of Irish Farms and Future Investment Requirements.

46
Assessment of Costs and Benefits of Biogas and Biomethane
4.4 Ensuring sustainability
Ensuring the sustainability of new sources of energy is key to ensuring the long term sustainability of Ireland’s energy system and to ensuring that long term carbon targets can be made. All the example biogas and biomethane plants deliver GHG savings compared to conventional fossil fuels, but the level of savings vary as the GHG emissions associated with production of the biogas and biomethane vary by plant depending on the feedstocks used (see Appendix 3 for GHG emissions associated with each plant).
The typical GHG emissions associated with biogas and biomethane plants running on slurry, food waste and silage (from which emissions for plant using more than one feedstock are calculated) are shown in Table 4.4. These typical emissions were calculated using the B2C2 carbon calculator78 supplied by OFGEM in the UK as a tool for calculating lifecycle emissions from biogas and biomethane (and other forms of bioenergy) and showing compliance with the greenhouse gas limits imposed as part of the sustainability criteria under the UKs RHI. While originally developed for the UK, a version of the tool which uses the same methodology, but is restricted to biofuels for transport has also been developed for the Biofuels Obligation Scheme in Ireland79.
The B2C2 calculator allows for all inputs in the GHG calculation to be varied, so that it is possible to customise calculations to reflect the particular circumstances under which feedstock are produced and under which the plant operators. This was done in producing the values shown in Table 4.4, adjusting e.g. the yield of grass silage and inputs of fertilisers and other inputs such as lime to silage production to values which are as far as it was possible to determine within the analysis possible with this study reflective of typical Irish production. However, the values cannot considered to be definitive, not least because production of grass silage for AD may differ from current production for fodder. A further, more detailed assessment would be necessary to understand better what likely emissions are and how they could be minimised in order to ensure that biogas and biomethane plants are as sustainable as possible.
The Renewable Energy Directive (RED) requires that from 2017, biofuels produced for transport deliver a 60% saving compared to a fossil fuels comparator set in the Directive, meaning that biofuels must have lifecycle emissions of 33.5 g CO2 eq/MJ or less. The calculations for a grass silage plant suggest that the biomethane produced would only just meet this limit. A successor to the RED is currently being discussed and the initial proposal from the Commission80 is to set more stringent criteria, proposing that biofuels produced in all new installations operational from 2021 should deliver savings of 70%. This means biofuels would need to have emission of 28.2 g CO2/MJ81 or less, which on the basis of the emissions calculated below, a plant digesting only grass silage would not meet.
The RED does not set any GHG savings criteria for solid and gaseous biomass used to provide heat and power although Member States may set their own criteria. While Ireland has not yet set any sustainability standards for solid and gaseous biomass, other countries have. So for example the UK has set a sustainability criteria of 34.8 g CO2/MJ for heat and for biomethane, which operators must meet if they are to be eligible for RHI payments for the heat or biomethane. The proposed recast of RED does however include GHG criteria for solid and gaseous biomass fuels used for electricity or heat production, proposing that from 2021, electricity and heat produced from these fuels should deliver an 80% reduction compared to a comparator of 183 g CO2eq/MJ electricity, and 80 g CO2eq/MJ heat. This would mean that electricity produced from biogas or biomethane would need to have lifecycle emission of less than 36.6 g CO2/MJ and that heat produced from biogas or biomethane would need to have emissions of less than 16 g CO2/MJ.
GHG emissions from AD plant can be reduced. Ensuring a good biogas yield from the feedstocks, minimising leakage from the AD plant and from the biogas upgrading system and closed storage of
78 https://www.ofgem.gov.uk/publications-and-updates/uk-solid-and-gaseous-biomass-carbon-calculator 79http://www.nora.ie/bos-documentation/online-software-resources.274.html. As this tool does not include silage based AD, it could not be used to provide the data set on GHG emissions from AD for this study. 80 Proposal For A Directive Of The European Parliament And Of The Council On The Promotion Of The Use Of Energy From Renewable Sources (Recast) COM(2016) 767 final/2 81 It is also proposed to change the fossil fuel comparator from 83.8 g CO2/MJ to 94 g CO2 eq/MJ.

47
Assessment of Costs and Benefits of Biogas and Biomethane
digestate will help to reduce GHG emissions per unit of biomethane produced. For example, off gases from the upgrading unit can be combusted to ensure that any remaining methane in the off gases is destroyed.
Table 4.4 Estimated lifecycle emissions from biomethane production and GHG criteria in RED and UK RHI
Feedstock Biogas Biomethane
g CO2/MJ g CO2/MJ Manure 6.6 17.6
Silage 21.8 33.0
Biowaste 10.6 21.6
GHG emissions criteria for biomethane
Used as a vehicle fuel (RED) 33.5
Used as a vehicle fuel (proposed recast of RED) 28.2
Biomethane and heat under the UK RHI 34.8
For grass silage based plants, co-digesting silage with other waste feedstocks such as slurry or food waste would help to reduce average emissions per unit of biogas or biomethane produced82 , and could lead to an overall reduction in GHG emissions if co-digestion helped to improve biogas yield, and is potentially desirable anyway as it helps to provide micronutrients needed for digestion which are not present in the silage. Maximising the use of digestate from the AD plant in production of the silage, with a corresponding reduction in inputs of inorganic N will help to reduce emissions. More generally, there will be a trade-off between the application of N to increase yield (which helps to improve GHG emissions per unit of biogas) and the soil related N2O emissions from the N application and for inorganic N fertiliser the emissions associated with fertiliser production (which will increase GHG emissions per unit of biogas). Research to find the optimum levels of N application for silage for use in AD plants could therefore be useful in helping to ensure that silage based AD plant can meet the more stringent future GHG criteria which are being discussed. In the future it is possible that using the power to gas technologies discussed in Section 3.3.3, which increase the biomethane output of the plant by methanating the CO2 in the biogas could help to reduce GHG emissions per unit of biomethane produced.
GHG emissions associated with production of bioLPG have not been examined in detail in this study, but are reported83 to potentially range from 10 to 50 g CO2eq/MJ, when produced as by-product of hydrotreated vegetable oil (HVO), which is the case for the bioLPG that Calor will be importing. The large range reflects the range in emissions associated with oils used to produce the main product HVO. Emissions will be low when waste oils (e.g. used cooking oils are used) and higher when vegetable oils, are used, with actual emissions being specific to the type of vegetable oil used as a feedstock. During the stakeholder consultation, Calor stated that while they do not have control over the feedstocks used in Neste’s HVO plant at Rotterdam where the bioLPG will be produced, they expect bioLPG provided in 2017 to deliver savings of between 40 and 80% when used to deliver heat. Using a fossil fuel comparator of 77 g CO2/MJ of heat, this would give emissions of between 15 and 46 g CO2/MJ of heat, and emissions of 13 to 39 g CO2/MJ of bioLPG (assuming a typical boiler efficiency of 85%).
82 Under the UK RHI scheme, averaging of emissions between different types of feedstocks e.g. wastes and energy crops is not permitted when assessing whether biomethane meets the sustainability requirements. Biomethane produced from each type of feedstock category (defined as a consignment) must meet the GHG criteria. 83 DECC, 2014. RHI Evidence Report: BioPropane for Grid Injection.

48
Assessment of Costs and Benefits of Biogas and Biomethane
Appendices
Appendix 1 Steering Group Members
Appendix 2 Costs for typical biogas and biomethane plants
Appendix 3 Methodology and assumptions for economic assessments
Appendix 4 Full results for economic assessment
Appendix 5 Wider benefits of deployment
Appendix 6 Levelised costs of energy assumptions and results
Appendix 7 Support mechanisms in other European countries
Appendix 8 Acknowledgements

49
Assessment of Costs and Benefits of Biogas and Biomethane
A.1 Steering Group Members
D Ward CER
Denise Keoghan DTTAS
Faye Carroll DTTAS
Frank Groome DCCAE
J P Corkery NTMA
Jerry Murphy UCC
JJ Lenehan Teagasc
John Muldowney DAFM
Karen Trant CER
Martyn Byrne NTMA
Matthew Clancy SEAI
Padraig O'Kiely Teagasc
S Byrne CER

50
Assessment of Costs and Benefits of Biogas and Biomethane
A.2 Costs for typical biogas and biomethane plants A.2.1 Choice of biogas and biomethane plant for modelling
Table A2.1 and A2.2 shows potential biogas and biomethane production and utilisation routes and those that the steering group identified for further consideration in this study, as being most relevant for Ireland. These are highlighted in yellow.

51
Assessment of Costs and Benefits of Biogas and Biomethane
Table A2.1 Current biogas and biomethane routes
Heat Power Trans-port
Farm Waste
Small (on farm) Boiler only x x 2016 N*
Medium Boiler only x x 2016 Y
Large Boiler only x x x 2016 N
Small CHP engine x x x 2016 Y
Medium CHP engine x x x x 2016 Y
Large CHP engine x x x x 2016 N
Small (on farm) Upgrade Upgrade on site using mobile upgrade plant, transport to central injection point
x x x x 2020 N Concerns a concept considered by Gas Network Ireland whereby biogas is accumulated on site and upgraded and compressed for transport by a mobile plant. Not recommended for short-list on the basis that work still appears to be in its formative stages and there are only limited examples of this concept having been applied at this stage.
Small (on farm) Upgrade Low pressure transport of biogas to central upgrade and injection facility
x x x x 2016 Y Transporting biogas using low pressure pipelines has been done in Denmark and Brazil and could be more cost-effective in some cases than transporting feedstock or biomethane by road.
Small (on farm) Upgrade Upgrade on site, transport to central injection point
x x x x 2016 N
Medium Upgrade Upgrade on site, transport to central injection point
x x x x x 2016 Y
Medium Upgrade Injection to gas grid on site x x x x x 2016 Y
Large Upgrade Injection to gas grid on site x x x x x 2016 Y
Medium Upgrade Injection to gas grid on site + CHP exporting heat and power
x x x x x 2016 N
Large Upgrade Injection to gas grid on site + CHP exporting heat and power
x x x x x 2016 N
Direct use of biomethane by vehicles rather than via injection to grid ensure biomethane could be counted towards 2020 RED transport target
Small Upgrade Transport gas to filling station x x 2020 N
Medium Upgrade Transport gas to filling station x x 2020 N
Medium Upgrade On site filling station x x 2020 Y
Large Upgrade On site filling station x x 2020 N
Large Upgrade Liquefy and transport by road to filling station
x x 2020/2025 N Requires large plant (>14MW gross biogas output). Liquefied biomethane unlikely to be of interest unless transport utilises liquefied natural gas, which LBM can then supplement. LNG terminal (Shannon) considered but not built. However alternative infrastructure directive will require LNG filling stations on the Core TENT network by end of 2025. Not suggested for short-list on account of longer-term deployment timeframe
Available from
Boiler and combined heat and power (CHP) plant
Biomethane for direct use in transport.
On site filling station can either be open to public or (more typically) serve a dedicated fleet. Practically requires that plant is situated close to fleet depot. Can require substantial CBM storage as biogas produced continuously, but vehicle filling may be concentrated in a few hours of the day. Limit to number of pathways that means that only one scale of option can be considered. Steering group considered that medium scale was most likely.
Has advantage that filling station can be located close to users, but requires extra transport step. Small scale systems likely to be less viable due to cost of upgrading. Medium-scale not suggested for short-list as this shares many features of 'biomethane production - upgrading with transport to central injection point', which is shortlisted.
These are demand driven systems which allow the flexibility of producing biomethane when additional renewable electricity is not needed. Although an interesting concept, the cost of such a system will be higher than single technology systems and is only likely to be installed if the subsidy regime rewards this (e.g. by paying a higher price at times when demand for electricity is higher.) Hybrid operating regime would also introduce substantial additional complexity into the economic assessment.
Scale of AD plant Further step Use Comments/discussionSupplies
At present the economics of upgrading favour larger plant, and although gas upgrading systems are available for smaller systems, they will be less economically attractive. Therefore on-site upgrading for small plant is not short-listed.
Feedstocks Short list
Biomethane production
Hybrid system
Biogas CHP deployed used at all scales within most markets with significant biogas potential. Only small and medium scale recommended for short-list as large-scale schemes as these options are most likely to achieve a high level of energy utilisation. Large-scale schemes are less likely to be able to find corresponding heat demand, leading to greater likelihood of heat being rejected.
Many examples of this pathway in markets elsewhere in the world and with good suitability for Ireland. Therefore recommended for short-list. Such medium and large plant could take feedstock from a number of farms (co-operative model) as well as being sited on large farms that are the sole supplier of feedstock. Analysis will over both options
Heat-only systems require year round heat demand - likely to be more limited number of suitable sites than CHP options. May be more suitable for smaller size schemes (for example in UK, only four heat only schemes, all farm based, all relatively small, as larger heat loads supplied by CHP). Steering Group had mixed views; identified that limited number of small scale options would not make a large contribution to biogas use, and medium scale options (which might be suitable for use in agri-food industries) would be better. Agreed to focus on medium scale plant for economic assessment, but that if possible data on small scale plant should also be collected to allow difference in costs with scale to be fed into the RHI study.

52
Assessment of Costs and Benefits of Biogas and Biomethane
Table A2.2 Future biogas and biomethane pathways
Heat Power Transport
Macro algae
Micro algae
Medium Upgrade Transport to central injection point x x x x x 2020/2030 NMedium Upgrade Injection to gas grid on site x x x x x 2020/2030 NLarge Upgrade Injection to gas grid on site x x x x x 2020/2030 N
Medium Upgrade Transport to central injection point x x x x 2020/2030 N
Medium Upgrade Injection to gas grid on site x x x x 2020/2030 Y
Large Upgrade Injection to gas grid on site x x x x 2020/2030 N
Heat Power Transport
Small Upgrade via micro-algae Transport to central injection point x x x 2020/2030 NMedium Upgrade via micro-algae Transport to central injection point x x x 2020/2030 NMedium Upgrade via micro-algae Injection to gas grid on site x x x 2020/2030 NLarge Upgrade via micro-algae Injection to gas grid on site x x x 2020/2030 N
Medium Upgrade via H2 addition Transport to central injection point x x x All All 2030 N
Medium Upgrade via H2 addition Injection to gas grid on site x x x All All 2030 N
Large Upgrade via H2 addition Injection to gas grid on site x x x All All 2030 Y
Heat Power Transport
Willow Imported wood
Small Upgrade syngas Transport to central injection point x x x x 2020/2025 N
Medium Upgrade syngas Injection to gas grid on site x x x x 2020/2025 N
Large Upgrade syngas Injection to gas grid on site x x x x x 2020/2025 Y
All
Available from
Suggested as
Feedstocks
Feedstocks
Feedstocks Available from
Biomethane production from farm, waste, micro and macro algae
Upgrading of biogas provided by addition of hydrogen (sourced from surplus renewable electricity via electrolysis) in a biological methanation process (in-situ or ex-situ) where 4H2 + CO2 -> CH4 + 2H2O. Benefits include storing intermittent renewable electricity (as a gas) that would otherwise have been curtailed, offsetting traditional biogas upgrading unit cost and doubling of CH4 output from a digester. Power to gas most likely to be viable at large scale so this option selected for study. Full cost characterisation may not be possible
Micro-algae cultivation in raceway ponds serves to remove CO2 from biogas stream, thus removing the requirement for a conventional CO2 separation process stage. AD process itself could have various feedstocks including the micro-algae used for biogas upgrading.
Supplies
Scale of AD plant Further step Use Comments/discussion
Biomethane production from macro algae
Future pathways may evolve through the use of novel feedstocks and novel technologies; here 3rd generation feedstocks relate to the digestion of macro-algae (seaweed) and micro-algae which would be practicable for rural, costal digesters in Ireland. As such, gas network grid access may constrain potential.
Biomethane production from macro and micro algae
Gasification of indigenous biomass resources (e.g. from forestry or SRC willow). Larger scale might involve importation of wood chips, although previous work on biomass resources suggests a relatively large indigenous resource could be available. Gasification with upgrading of the syngas to methane is most likely to be economically viable at large scale so this scale included for study.
Power to Gas
Gasification
Macro-algae (seaweed) may be cultivated in an integrated multitrophic aquaculture systems as opposed to using natural seaweed stock. These are systems whereby increased cultivation of seaweed can be achieved through sequestering nutrients from fish farm waste and subsequently used as a feedstock for biogas production. Medium-scale suggested for short-list on grounds of this being the most likely scale for deployment. Unlikely to be significant change in capital costs from systems using other feedstocks, but cost and availability of feedstock will vary.
Comments/discussion
Suggested as
Comments/discussion
Scale of AD plant Further step Use Supplies
Scale of AD plant Further step Use
Supplies Available from
Suggested as

53
Assessment of Costs and Benefits of Biogas and Biomethane
A.2.2 Cost and performance data for biogas and biomethane plants
A.2.2.1 Cost data for current biogas production
For the typical production and utilisation routes identified above which it was considered could be deployed now or in the near term (i.e. those in Table A2.1), information on capital and operating costs were collected through stakeholder consultation and cross checked with and supplemented by data from a literature review.
Data was gathered from stakeholders using a cost template to gather a breakdown of costs and other performance related data. A list of stakeholders contributing data is given in Appendix 8. This stakeholder data was then cross checked with literature data, and outlying values were checked with stakeholders and corrected as necessary. There are legitimate reasons why the costs of AD plants with a similar biogas output may vary, e.g. different feedstocks have different storage and pre-processing requirements. However, there are a number of common elements e.g. CHP engine, which could be expected to have similar costs in all plant. For such aspects, common assumptions were made for all plants, and these are listed below.
A.2.2.2 Assumptions to standardise submitted scheme cost data
The following assumptions were made to submitted scheme cost data so as to offer a reasonable basis for comparison:
• Plant availability was set to 93% for all schemes based on most common value used for submitted schemes. Values for scheme submitted varied between 86% and 99%.
• Technical lifetimes were standardised to the values in the Table A2.3, based on the most common values used for submitted schemes.
Table A2.3 Common assumptions on technical lifetime of plant
Technology Technical Lifetime (Years)
Anaerobic digestion system 15 Biogas boilers 10 Biogas CHP units 12 Biogas upgrading and injection plant 15
• Capital cost for electrical connection for ‘small’ (up to 200kWe) and ‘medium’ (200kWe to 1.2MWe) biogas CHP schemes were found to vary significantly between individual schemes of similar capacities due to site-specific factors (e.g. distance to nearest grid connection location) and so were standardised to the most common values for submitted schemes. These values are presented in the following table:
Table A2.4 Capital cost for electrical connection
Scheme capacity band Electrical connection CAPEX (€)
Small (up to 200kWe) 200,000 Medium (200kWe to 1.2MWe) 250,000
Electrical connection costs for ‘large’ (greater than 1.2MWe) schemes were not standardised due to variation in stated costs with factors such as scheme capacity.
• Cost of gas connection was found not to vary markedly according to scheme capacity. Connection costs for all biomethane injection schemes were standardised to €500,000. Based on the most common value for submitted schemes.

54
Assessment of Costs and Benefits of Biogas and Biomethane
• CAPEX and OPEX for ‘small’ (up to 200kWe) CHP schemes was noted to vary considerably between schemes and so were standardised to a rate of €2,500/kWe, for CAPEX and €27,500/y for OPEX, reflecting the mean averages for submitted cost data.
• The typical costs for feedstocks shown in Table A2.5 were used, to eliminate variations in projected feedstock costs (negative values indicate gate fees for handling feedstocks). The prices for feedstocks (as delivered to the AD plant) were primarily based on stakeholder input, but were cross checked with the cost (at farm gate/roadside) as estimated in the Bioenergy Supply study84 and other relevant academic papers and policy reports.
Table A2.5 Typical costs for feedstocks
Feedstock
Bioenergy supply study:
Cost range
Bioenergy supply study: Weighted average cost
over resource
Price at AD/gasification
plant used in analysis
€/t €/t €/t
Slurries 0 to 1.85 1.8 0
Silage 15 to 40 31 30
Food waste -60 to 0 -40 -50
Agri food waste Unknown so assumed zero -20
Sewage sludge Not estimated 0
Mixed waste Not explicitly examined in bioenergy supply study but would be expected to have similar costs to agri food
waste -30
Biowaste Not explicitly examined in bioenergy supply study
assumed to be zero 0
Macro-algae Not explicitly examined in bioenergy supply study. Costs
sourced from literature 50
On Farm vegetable waste
Not explicitly examined in bioenergy supply study assumed to be zero
0
Wood chips 176
A.2.2.3 Compressed biomethane for vehicle fuel
The biogas for vehicle fuel pathway considers the production of biogas from AD, which is subsequently upgraded to biomethane and compressed for use in road vehicles as compressed biomethane (CBM). The principal differences between the current AD + biomethane pathways and this pathway is the replacement of the grid injection system with compression system and a vehicle filling station. Capital and operating costs for the AD and biogas upgrade systems were determined using cost data provided for current AD pathways and data for the compression system and vehicle filling station were based on cost data from SKM Enviros85. .
84 Ricardo Energy and Environment, 2016. . Bioenergy Supply in Ireland 2015 – 2035. A report for SEAI. 85 SKM Enviros, 2011. Analysis of characteristics and growth assumptions regarding AD biogas combustion for heat, electricity and transport and biomethane production and injection to the grid.

55
Assessment of Costs and Benefits of Biogas and Biomethane
A.2.2.4 AD plant for macro-algae
The macro-algae pathway considers the co-digestion of macro-algae with cattle slurry to produce biogas, which is then upgraded to biomethane and injected into the natural gas network.
Capital and operating costs for the pathway were determined based on cost data provided for current AD pathways, specifically farm-based schemes operating on slurries and grass silage. Specific biogas yield data for macro-algae was taken from provided by Tabassum et al, 201686 while feedstock cost data was based on data compiled for SEAI87.
A.2.2.5 Gasification
Costs for the production of syngas are based on data for a 110 MW gasifier plant88 using wood chips or pellets in a review by the Danish Energy Agency on technology data for advanced bioenergy fuels89.
A.2.2.6 Capital and operating costs
The total capital costs and, operating costs and feedstock costs for all the plants modelled are shown in Table A2.6 for biogas boilers and CHP plant and Table A2.7 for biomethane plant.
86 Tabassum, M.R., Wall, D.M., Murphy, J.D., 2016, M, Biogas production generated through continuous digestion of natural and cultivated seaweeds with dairy slurry, Bioresource Technology 219, 228-238 87 Sustainable Energy Ireland, 2009. Review of the Potential of Marine Algae as a Source of Biofuel in Ireland. 88 One modifying assumption is made: it is assumed that heat generated from the metalation reactions is captured and used to generate electricity, allowing the plant to be self-sufficient in energy generation, 89 Danish Energy Agency, 2013. Technology data for advanced bioenergy fuels.

56
Assessment of Costs and Benefits of Biogas and Biomethane
Table A2.6 Capex, Opex and feedstock costs for boilers and CHP plant
Reference Scheme Description
Capacity (kWth for
boilers and kWe for CHP)
Feedstock (tonnes/year) CAPEX for first plant installed
k€
Capex for replacement
plant k€ OPEX (k€/y) Feedstock
Costs (k€/y)
Boiler A Farm (slurry and waste) 41 Slurry and whey (2,500) 188 188 3.3 0
Boiler B Waste(mixture) 1000 Mixed wastes (17,500) 2,575 2,575 426 -525
CHP A Farm (slurry) 100 Slurry (15,000) 1,250 1,040 222 0
CHP B Farm (slurry + farm waste)
100 Slurry (2,250)
On-farm vegetable waste (2,250)
720 515 52 0
CHP C Farm (slurry) 196 Slurry (26,000) 1,242 1,032 129 0
CHP D Farm (slurry + silage) 512 Slurry (64,700)
Grass silage (3,300) 3,767 3,482 308 101
CHP E Farm (slurry + silage) 500 Grass silage (10,000)
Slurry (5,000) 3,526 3,243 450 300
CHP F Farm (food waste + silage)
527 Grass silage (9,500)
Agri-food residues (7,600) 4,849 3,243 551 133
CHP G Farm (food waste + slurry)
500 Slurry (9,000)
Food waste (14,000) 4,010 3,722 336 -280
CHP H Waste (mixture) 500 Mixed waste (17,500) 3,476 3,194 521 -525
CHP I Farm & waste fed 1,500
Agri-food residues (25,000)
Grass silage (10,000)
Slurry (5,000)
9,263 8,427 1,303 -200
CHP J Waste fed 3,000 Food waste (67,500) 23,275 22,052 2,835 -3,375 Notes: Capex for replacement plant excludes costs of connection to gas or electricity grid

57
Assessment of Costs and Benefits of Biogas and Biomethane
Table A2.6 Capex, Opex and feedstock costs for biomethane plant
Reference Scheme Description
Capacity (kWth for
boilers and kWe for CHP)
Feedstock (tonnes/year) CAPEX for first plant installed
k€
Capex for replacement
plant k€ OPEX (k€/y) Feedstock
Costs (k€/y)
BM A Farm (silage and slurry) and biogas pipeline
1,130 kWth Grass silage (7,500)
Slurry (5,500) 1,923 1,804 336 225
BM B Waste Fed (MSW food waste) medium
2,000 kWth Food waste (25,600) 12,152 11,535 1,299 -1,280
BM C Waste Fed (MSW food waste) large
7,000 kWth Food waste (90,400) 20,047 19,351 3,858 -4,520
BM D Waste Fed (food processing wastes) large
6,328 kWth Biowaste (50,000) 7,645 7,073 1,328 0
BM E Farm (maize and food waste) large
7,154 kWth Maize (49,000)
Agri-food residues (21,000) 18,644 6,253 1,520 1,442
BM F Farm (silage and slurry) large
6,405 kWth Grass silage (50,000)
Slurry (5,000) 6,816 6,253 586 1,500
BM G Farm (silage and slurry) large with road transport of gas
6,405 kWth Grass silage (50,000)
Slurry (5,000) 8,612 8,525 690 1,500
BM H Existing sewage sludge plant
4,430 kWth Liquid waste (50,000) 3,150 2,623 404 0
BMF A Co-digestion of Macro Algae and Slurry
1,130 kW Macro Algae (13,300)
Cattle Slurry (17,000) 3,508 2,978 276 665
BMF B Gasification plant 111 MW Wood chips (270,000) 385,090 381,239 11,422 47,520 Notes: Capex for replacement plant excludes costs of connection to gas or electricity grid

58
Assessment of Costs and Benefits of Biogas and Biomethane
A.3 Methodology and assumptions for economic assessments
A.3.1 Cost benefit methodology and assumptions
The cost benefit analysis in Section 3 was carried out according to the Central Expenditure Evaluation Unit (CEEU) Public Spending Code (Guide to Economic Appraisal: Carrying out a cost benefit analysis)90. In the CBA, the capital and operating costs of the biogas and biomethane plant are compared to the costs of supplying the same quantity of heat and electricity using conventional boilers and CHP plant operating on fossil fuels (gas or oil) and using natural gas rather than biomethane. Costs for the biogas and biomethane plant are given in Appendix 2. Capital and operating costs assumed for gas and oil boilers are given in Appendix 6. The prices of gas, oil and to fuel conventional boilers are shown in Tables A3.1 below, together with the price of electricity. The trends assumed in these fuel prices over time for the central fossil fuel price scenario used in the main analysis for the CBA, together with the high fossil fuel price used in the sensitivity analysis are shown in Table A3.2. As the CBA is evaluating costs to society, all fuel prices used are excluding taxes, which are not regarded as a cost to society, but a transfer within society. All costs in the Tables below are in 2016€.
Table A3.1 Fuel prices in 2016 excluding taxes.
Consumption range (kWh/yr) Price (€2016/kWh)
Gas
0 – 278,000 kWh/yr 0.0474
278,000 – 2,778,000 kWh/yr 0.0356
2,778,000 - 27,778,000 kWh/yr 0.0289
>278,000 kWh/yr 0.023
Wholesale 0.023
Heating oil All 0.0343
Electricity
0 – 20 MWh/y 0.1619
20 – 500 MWh/y 0.1437
500 - 2,000 MWh/y 0.1198
2,000 - 20,000 MWh/y 0.0931
20,000 - 70,000 MWh/y 0.0826
70,000 – 150,000 MWh/y 0.0773 Source: Gas and electricity prices from SEAI, 2016. Price Directive 1st Semester (January - June 2016). Oil prices from ‘Consumer prices of petroleum products net of duties and taxes’ prepared by DG Ener91
As well as evaluating the costs of supplying energy from biogas or fossil fuels, the CBA also evaluates the greenhouse gas (GHG) emissions and emissions of key pollutants responsible for poor air quality, which arise from supplying energy using biogas or conventional fossil fuels. The emissions associated with biogas plant are shown in Table A3.3 and those with electricity, natural gas and fossil fuels used in boilers in Table A3.4. Values for GHG emissions are given for both a lifecycle and ‘In Ireland’ basis. The lifecycle emissions are used within the CBA: The additional carbon savings which accrue from using waste feedstocks in AD rather than having to dispose or otherwise manage them are shown in Table A3.5. The emissions are then given a monetary value using a shadow price of carbon and marginal damage cost estimates for the air pollutants. These are shown in Tables A3.6 and A3.7.
Finally, the costs in each future year (from producing energy and from emissions of carbon and air pollutants) are discounted back to the present year, using the societal discount rate recommended by the CEEU of 5% real. This is done for both the biogas deployment scenario and for the counterfactual scenario where equivalent amounts of energy are supplied from conventional fossil fuels. A
90 Public Spending Code. Guide to Economic Appraisal: Carrying out a cost benefit analysis. Available at http://publicspendingcode.per.gov.ie/wp-content/uploads/2012/08/D03-Guide-to-economic-appraisal-CBA-16-July.pdf 91 Historical data series from DG Ener’s weekly oil bulletin. Available at https://ec.europa.eu/energy/en/data-analysis/weekly-oil-bulletin

59
Assessment of Costs and Benefits of Biogas and Biomethane
comparison of these two sets of discounted costs then determines whether there is a net benefit or cost to society of deploying the biogas and biomethane plants. Each of the biogas deployment scenarios has its own associated counterfactual scenario and a separate comparison is made for each of the four deployment scenarios.

60
Assessment of Costs and Benefits of Biogas and Biomethane
Table A3.2 Trends in fossil fuel prices under central and high fossil fuel price projections (2016=100)
Central price scenario
2016
2017 2018 2019 2020 2021 2022 2023 2024 2025 2026 2027 2028 2029 2030
Gas and electricity 100 102 102 103 109 115 121 127 133 139 142 102 102 103 109
Oil 100 104 107 110 120 130 140 149 159 169 169 104 107 110 120
High price scenario 201
6 2017 2018 2019 2020 2021 2022 2023 2024 2025 2026 2027 2028 2029 2030
Gas and electricity 107 112 117 124 132 140 148 155 163 163 107 112 117 124 132
Oil 112 123 133 137 141 145 149 153 157 161 112 123 133 137 141 Note: Price remains constant post 2030
Source: DECC, 2015. DECC 2015 Fossil Fuel Price Assumptions. Available at https://www.gov.uk/government/publications/fossil-fuel-price-projections-2015

61
Assessment of Costs and Benefits of Biogas and Biomethane
Table A3.3 Air quality and GHG emissions per GWh of biogas and biomethane
NOx
(t/GWh) PM2.5
(t/GWh) SO2
(t/GWh) NMVOC (t/GWh)
CO2 (lifecycle)
(t/GWh )
CO2 (In Ireland)
(t/GWh )
Boiler A 0.1512 0.0007 0.0011 0.0065 24 24
Boiler B 0.2628 0.0016 0.0011 0.0013 38 38
CHP A 0.4860 0.0072 0.0018 0.3204 24 24
CHP B 0.4860 0.0072 0.0018 0.3204 36 36
CHP C 0.4860 0.0072 0.0018 0.3204 24 24
CHP D 0.4860 0.0072 0.0018 0.3204 40 35
CHP E 0.4860 0.0072 0.0018 0.3204 76 59
CHP F 0.4860 0.0072 0.0018 0.3204 79 62
CHP G 0.4860 0.0072 0.0018 0.3204 37 37
CHP H 0.4860 0.0072 0.0018 0.3204 38 38
CHP I 0.4860 0.0072 0.0018 0.3204 53 46
CHP J 0.4860 0.0072 0.0018 0.3204 38 38
BM A Not estimated as emissions at point of use will be identical to those from use of natural gas in the
counterfactual scenario
114 99
BM B 78 78
BM C 78 78
BM D 78 78
BM E 119 102
BM F 118 101
BM G 118 101
BM H 63 63
BMF A 74 74
BMF B 41 41 Sources: Air quality pollutants from: EMEP/EEA air pollutant emission inventory guidebook – 2016 and accompanying online database. Available at http://www.eea.europa.eu/publications/emep-eea-guidebook-2016.
GHG emissions modelled in Solid and Gaseous Biomass Carbon Calculator 2.0 (build36) and UK and Ireland Carbon Calculator 7.0 (build 121) Irish Version

62
Assessment of Costs and Benefits of Biogas and Biomethane
Table A3.4 Air quality and GHG emissions per GWh of fuel consumed in counterfactual plant
NOx (t/GWh)
PM2.5 (t/GWh)
SO2 (t/GWh)
NMVOC (t/GWh)
CO2 (lifecycle) (t/GWh )
CO2 (In Ireland)
(t/GWh )
Values for boiler running on natural gas that replaces heat from:
Boiler A 0.151 0.001 0.001 0.006 239 204
Boiler B 0.263 0.002 0.001 0.001 239 204
CHP A 0.263 0.002 0.001 0.001 239 204
CHP B 0.263 0.002 0.001 0.001 239 204
CHP C 0.263 0.002 0.001 0.001 239 204
CHP D 0.263 0.002 0.001 0.001 239 204
CHP E 0.263 0.002 0.001 0.001 239 204
CHP F 0.263 0.002 0.001 0.001 239 204
CHP G 0.263 0.002 0.001 0.001 239 204
CHP H 0.263 0.002 0.001 0.001 239 204
CHP I 0.144 0.002 0.001 0.007 239 204
CHP J 0.144 0.002 0.001 0.007 239 204
Values for boiler running on natural gas that replaces heat from:
Boiler A 0.248 0.005 0.284 0.001 316 263
Boiler B 0.360 0.011 0.504 0.054 316 263
CHP A 0.360 0.011 0.504 0.054 316 263
CHP B 0.360 0.011 0.504 0.054 316 263
CHP C 0.360 0.011 0.504 0.054 316 263
CHP D 0.360 0.011 0.504 0.054 316 263
CHP E 0.360 0.011 0.504 0.054 316 263
CHP F 0.360 0.011 0.504 0.054 316 263
CHP G 0.360 0.011 0.504 0.054 316 263
CHP H 0.360 0.011 0.504 0.054 316 263
CHP I 0.360 0.011 0.504 0.054 316 263
CHP J 0.360 0.011 0.504 0.054 316 263
Values for
Natural gas
Not estimated as will be identical for biomethane 239 204
Electricity 0.353 0.016 0.359 0.011 531 467 Sources:
Air quality pollutants for boilers and CHP from: EMEP/EEA air pollutant emission inventory guidebook – 2016 and accompanying online database. Available at http://www.eea.europa.eu/publications/emep-eea-guidebook-2016.
Air quality pollutants from electricity production calculated from electricity production as reported in Energy Balance for 2013 and emissions of pollutants reported by Ireland for 2013 by sector under the Convention on Long-Range Transboundary Air Pollution
In Ireland GHG emissions for gas and oil, EPA, 2016. Ireland National Inventory Report 2016.
In Ireland GHG emissions for Electricity from http://www.seai.ie/Energy-Data-Portal/Emission_Factors/.

63
Assessment of Costs and Benefits of Biogas and Biomethane
Upstream GHG emissions for gas and oil based on data from JEC - Joint Research Centre-EUCAR-CONCAWE collaboration, 2014. JEC Well-To Wheels Report v4a. Upstream electricity emissions estimated based on ration of upstream to combustion emissions for natural gas.
Table A3.5 Additional GHG savings from better waste management
Feedstock Additional GHG savings
Manure credit -0.0445 t CO2 eq /t slurry
Waste credit -0.006 t CO2 eq /t food and drink waste
Source: Manure credit based on data in Guintoli et al, 2014. ‘Solid and gaseous bioenergy pathways: input values and GHG emissions’. Waste credit assumes waste would otherwise be composted (as it has been source separate collected) and is based on carbon factor for composting from Zero Waste Scotland: 2013. The Scottish Carbon Metric. A national carbon indicator for waste. 2013 update to the Technical Report.
Table A3.6 Shadow price of carbon
Year 2017 2020 2025 2030 2035 2040 2045 2050
€2016/t CO2 7.9 11.2 15.7 39.2 63.9 87.4 100.9 112.1
Source: The Public Spending Code: E. Technical References Shadow Price of Carbon. Values converted to €2016
Table A3.7 Aggregate national estimate of marginal damage value per tonne of pollutant.
NOx (including.
secondary PM) (€2016/tonne)
SO2 (including.
secondary PM) (€2016/tonne)
NMVOC (including.
secondary PM & O3) (€2016/tonne)
PM2.5 (primary PM only)
(€2016/tonne)
1,125 5,427 984 8,436
Source: EnvEcon, 2015. Air Pollutant Marginal Damage Values: Guidebook for Ireland 2015. All Ireland values converted to €2016
A.3.2 Estimating job and GVA effects
A.3.2.1 Scope
Three types of employment and GVA effects are typically assessed:
• direct benefits (sectors immediately affected through the purchase of materials and human capital)
• indirect benefits (sectors affected through supply chains)
• induced benefits (further benefits resulting from an increased spending by households as a result of the original investment).
These effects can be associated with either the construction of the technology or its ongoing operation.
For each economy-wide deployment scenario, this assessment captures the direct effects of the uptake of technology and the subsequent ripple effects through the economy.

64
Assessment of Costs and Benefits of Biogas and Biomethane
To estimate these effects, we have followed a methodology which has been widely applied. For example, by LECG in the US92 and by Ricardo Energy & Environment in a study assessing the impacts of biofuel uptake in Scotland (unpublished).
A.3.2.2 Methodology
Direct benefits
The total level of expenditure under each economy-wide deployment scenario has been estimated as part of the CBA. This consists of the total upfront investment in the form of capital cost, alongside ongoing expenditure or operating costs.
Using a relationship between this expenditure and jobs an estimates of job effects is derived:
Job effect = Expenditure / Average output per worker
The type of job effect is determined by the type of expenditure included: upfront capital costs are associated with one-off, temporary employment effects whilst the technology is constructed, whereas ongoing operational costs are associated with sustained employment effects over the life of the asset.
Data for output per worker has been taken from CSO93.
Key to this analysis is the selection of the relevant sector for which average output per worker is specified.
For upfront effects, i.e. related to the capital cost of constructing and installing the plant, output per worker for the construction sector has been used:
Construction job effect = capex / average output per construction worker.
For ongoing costs, defining a single relevant sector is more difficult. The production of biogas and biomethane will include activities across a number of economic sectors: waste, agriculture, industry, energy supply, etc. A similar study for Scotland used average output per worker across the whole Scottish economy given the difficulties in isolating a single appropriate sector. Given these difficulties, in the first instance we have adopted the same approach.
Ongoing job effect = opex / average output per worker
As part of sensitivity analysis, we have explored to what extent opex can be split between types and the selection of output per worker refined. We have split opex between that associated with the production of feedstocks and that with the production of renewable fuel (we have not included distribution costs are these are considered the same between the archetype and counterfactual). In this case, we have combined feedstock costs with data for the agriculture or waste sectors, and biomethane production costs with data for the agriculture or waste industries and the energy supply industry to illustrate the possible variance in impacts.
GVA effects have been assessed by combining data on GVA per worker with the estimates of job effects above. Data regarding GVA per worker has also been sourced from CSO94. As with employment effects, this will be split between the GVA effects of the construction and operating phase. Further, estimates of GVA per worker will be adopted for the construction sector and whole economy to estimate the GVA impacts of the construction and operating phases respectively.
Indirect and induced benefits
The direct impact on employment and GVA will lead to secondary effects as the impact of the initial expenditure ripples through the economy. This can take the form of:
- Indirect effects: where demand is stimulated in the supply chain for intermediate goods that go towards the production of the final output associated with the direct demand
92 Urbanchuk, J, 2010. Contribution of the Ethanol Industry to the Economy of the United States. Accessed at: http://energy.gov/sites/prod/files/2014/05/f15/Contribution_of_the_Ethanol_Industry_to_the_Economy_of_the_United_States.pdf 93 National Accounts data for output per sector and Employment statistics for number of workers 94 National Accounts data for value added per sector and Employment statistics for number of workers

65
Assessment of Costs and Benefits of Biogas and Biomethane
- Induced effects: where demand in the rest of the economy is stimulated as a result of increased household incomes from those directly and indirectly employed as a result of increased production.
Indirect and induced effects are typically assessed using ‘multipliers’. Multipliers are measures of the way in which an increase in activity by one firm will lead to an increase in activity by other related firms through supply chains. Multipliers are derived from input-output tables, which show the flows of expenditure which take place between sectors of the economy and allow the impact of a given level of expenditure on income and employment to be calculated.
Type I multipliers can be used to estimate indirect effects, and Type II to estimate induced effects. Multipliers are typically calculated for output, employment and GVA.
However, employment and GVA multipliers (both Type I and Type II) are not publically available for Ireland or calculated by CSO. Our research found that some relevant multipliers may have been calculated by private consultancy PMCA95, but that these are not publically available. As such an alternative approach has been adopted to estimate employment and GVA effects.
CSO produce a Type I multiplier for output. We have used this multiplier to estimate indirect effects. However, given this does not directly assess employment or GVA effects, our approach required further steps and data collection to achieve the desired output. We adopted a methodology as follows:
a) Combine estimates of direct output (i.e. expenditure) with the Type I output multiplier.
b) Subtract direct output from the Type I result (this will isolate indirect effects).
c) Combine indirect output effects with average output per worker to define employment effects.
d) Combine employment effects with GVA per worker to define indirect GVA effects.
The results of this analysis have been sense-checked using alternative sources: e.g. multipliers for Scotland96 and multipliers calculated for Ireland but in a different context for construction only97. Further it is complemented with simple supply-chain maps for each archetype to help visualise the actions which drive the demand for jobs in the supply chain, and which sectors these impacts could fall into.
Given no Type II multipliers are readily available for Ireland, we also needed to adopt an alternative approach to consider induced effects. Instead these effects have been explored qualitatively in the first instance. We have illustrated the potential size and nature of induced effects by assessing the multipliers for Scotland, comparing the Type I and Type II multipliers to understand the potential size of such effects.
Additionality of effects
An important component of economic analysis is to explore to what extent the estimated impacts are ‘additional’ and hence can confidently be assumed to accrue to the Irish economy. There are a number of other factors which affect the additionality of impacts: These include:
• Deadweight – the extent to which economic impacts would have occurred even in the absence of the activity
• Substitution – substitution exists where there is a shift in economic activity to a similar alternative in order to take advantage of public or private sector intervention. This may result in losses arising from the change in behaviour of firms and individuals. For example, a firm may hire a new employee to replace an existing one to take advantage of government funds
• Displacement – the extent to which the impacts of expenditures are offset by reductions in activity elsewhere in the economy, for example where a biogas/biomethane activity discourages investment in another similar project
• Economic Leakage – the extent to which expenditure leaks out of the local economy and therefore benefits other areas outside the target study area.
95 http://www.pmca.ie/2015/02/economic-impact-multipliers-for-the-irish-economy-latest-available/ 96 http://www.gov.scot/Topics/Statistics/Browse/Economy/Input-Output/Mulitipliers 97 http://igees.gov.ie/wp-content/uploads/2016/05/Capital-Review-Labour-Intensity-of-Public-Investment-.pdf

66
Assessment of Costs and Benefits of Biogas and Biomethane
As a result, the net impact of the expenditure on the local economy is likely to differ from the gross effect. The analysis has sought to distinguish between the gross and the net effects of operational expenditures, and to quantify these as far as possible, drawing on guidelines provided by English Partnerships’ Additionality Guide98 and BIS guidance99.
These impacts have been assessed qualitatively given the difficulty of producing quantitative estimates with any certainty. This analysis combines evidence presented in SEAI’s report assessing the Supply Chain Opportunities for sustainable energy in Ireland100, with opinions gathered through stakeholder consultation.
The CSO also produces multipliers for ‘imports of goods and services’ (alongside the Type I output multiplier). We have combined these with the estimates of job and GVA impacts defined above to provide illustrative estimates of the potential size of these effects.
98 https://www.gov.uk/government/uploads/system/uploads/attachment_data/file/191511/Additionality_Guide_0.pdf 99 http://webarchive.nationalarchives.gov.uk/20090609003228/http://www.berr.gov.uk/files/file54063.pdf 100 https://www.seai.ie/Publications/Statistics_Publications/Energy_Modelling_Group_Publications/Ireland%E2%80%99s-Sustainable-Energy-Supply-Chain-Opportunity.pdf

67
Assessment of Costs and Benefits of Biogas and Biomethane
A.4 Full results for economic assessment
Scenario: Waste2020 2025 2030 2035 2040 2045 2050
Energy production GWh GWh GWh GWh GWh GWh GWhBiogas production 247 847 1,395 1,606 1,606 1,606 1,606 Electricity 65 242 389 457 457 457 457 Heat 65 235 379 447 447 447 447 Biomethane 50 167 319 348 348 348 348 Total renewable energy 179 644 1,087 1,252 1,252 1,252 1,252
No of plant 2020 2025 2030 2035 2040 2045 2050No. No. No. No. No. No. No.
Boilers 4 22 33 37 37 37 37 CHP 13 82 158 192 192 192 192 Biomethane 2 6 15 17 17 17 17 Total 19 110 206 246 246 246 246
2020 2030 2050NPV M€ M€ M€Compared to gas CF 1.7 68.8- 407.0- Compared to oil CF 0.3 101.1- 509.3-
Scenario: Increased biomethane2020 2025 2030 2035 2040 2045 2050
Energy production GWh GWh GWh GWh GWh GWh GWhBiogas production 247 939 2,362 3,656 3,708 3,708 3,708 Electricity 65 242 389 457 457 457 457 Heat 65 235 379 447 447 447 447 Biomethane 50 258 1,275 2,377 2,428 2,428 2,428 Total renewable energy 179 735 2,043 3,281 3,332 3,332 3,332
No of plant 2020 2025 2030 2035 2040 2045 2050No. No. No. No. No. No. No.
Boilers 4 22 33 37 37 37 37 CHP 13 82 158 192 192 192 192 Biomethane 2 16 50 81 82 82 82 Total 19 120 241 310 311 311 311
2020 2030 2050NPV M€ M€ M€Compared to gas CF 1.7 22.6- 172.9- Compared to oil CF 0.3 54.9- 275.1-

68
Assessment of Costs and Benefits of Biogas and Biomethane
Scenario: All AD Feedstocks2020 2025 2030 2035 2040 2045 2050
Energy production GWh GWh GWh GWh GWh GWh GWhBiogas production 247 939 3,089 6,990 10,537 11,611 12,144 Electricity 65 242 657 1,190 1,653 2,012 2,209 Heat 65 235 502 788 1,008 1,171 1,260 Biomethane 50 258 1,275 3,720 5,992 6,096 6,096 Total renewable energy 179 735 2,434 5,698 8,654 9,278 9,565
No of plant 2020 2025 2030 2035 2040 2045 2050No. No. No. No. No. No. No.
Boilers 4 22 33 37 37 37 37 CHP 13 82 233 396 525 625 680 Biomethane 2 16 50 107 151 153 153 Total 19 120 316 540 713 815 870
2020 2030 2050NPV M€ M€ M€Compared to gas CF 1.7 28.9 744.7 Compared to oil CF 0.3 5.4- 582.5
Scenario: Exploratory2020 2025 2030 2035 2040 2045 2050
Energy production GWh GWh GWh GWh GWh GWh GWhBiogas production 247 939 3,089 7,815 12,187 14,086 14,619 Electricity 65 242 657 1,190 1,653 2,012 2,209 Heat 65 235 502 788 1,008 1,171 1,260 Biomethane 50 258 1,275 4,545 7,642 8,571 8,571 Total renewable energy 179 735 2,434 6,523 10,304 11,753 12,040
No of plant 2020 2025 2030 2035 2040 2045 2050No. No. No. No. No. No. No.
Boilers 4 22 33 37 37 37 37 CHP 13 82 233 396 525 625 680 Biomethane 2 16 50 108 153 156 156 Total 19 120 316 541 715 818 873
2020 2030 2050NPV M€ M€ M€Compared to gas CF 1.7 39.1 1,409.8 Compared to oil CF 0.3 4.8 1,247.6

69
Assessment of Costs and Benefits of Biogas and Biomethane
Scenario: Waste2020 2025 2030 2035 2040 2045 2050
GHG savings in year kt CO2 kt CO2 kt CO2 kt CO2 kt CO2 kt CO2 kt CO2CF 1 - Natural Gas 50 258 477 575 575 575 575 CF2 - Oil 55 274 502 605 605 605 605 Cumulative GHG savings kt CO2 kt CO2 kt CO2 kt CO2 kt CO2 kt CO2 kt CO2CF 1 - Natural Gas 86 904 2,872 5,638 8,515 11,392 14,269 CF2 - Oil 94 967 3,044 5,953 8,979 12,004 15,030 Difference in energy production costs M€ M€CF 1 - Natural Gas 33- 80- CF2 - Oil 57- 147- Cost of carbon saving €/t CO2 €/t CO2 €/t CO2CF 1 - Natural Gas 11- 6- CF2 - Oil 19- 10-
Scenario: Increased biomethane2020 2025 2030 2035 2040 2045 2050
GHG savings in year kt CO2 kt CO2 kt CO2 kt CO2 kt CO2 kt CO2 kt CO2CF 1 - Natural Gas 50 270 584 800 805 805 805 CF2 - Oil 55 286 609 829 835 835 835 Cumulative GHG savings kt CO2 kt CO2 kt CO2 kt CO2 kt CO2 kt CO2 kt CO2CF 1 - Natural Gas 86 933 3,192 6,901 10,926 14,952 18,977 CF2 - Oil 94 996 3,363 7,216 11,390 15,564 19,738 Difference in energy production costs M€ M€CF 1 - Natural Gas 18 278 CF2 - Oil 6- 212 Cost of carbon saving €/t CO2 €/t CO2 €/t CO2CF 1 - Natural Gas 6 15 CF2 - Oil 2- 11
Scenario: All AD Feedstocks2020 2025 2030 2035 2040 2045 2050
GHG savings in year kt CO2 kt CO2 kt CO2 kt CO2 kt CO2 kt CO2 kt CO2CF 1 - Natural Gas 50 270 711 1,303 1,779 1,959 2,052 CF2 - Oil 55 286 744 1,355 1,845 2,036 2,135 Cumulative GHG savings kt CO2 kt CO2 kt CO2 kt CO2 kt CO2 kt CO2 kt CO2CF 1 - Natural Gas 86 933 3,488 8,796 16,868 26,357 36,474 CF2 - Oil 94 996 3,678 9,211 17,587 27,442 37,963 Difference in energy production costs M€ M€CF 1 - Natural Gas 74 1,656 CF2 - Oil 49 1,562 Cost of carbon saving €/t CO2 €/t CO2 €/t CO2CF 1 - Natural Gas 21 45 CF2 - Oil 13 41
Scenario: Exploratory2020 2025 2030 2035 2040 2045 2050
GHG savings in year kt CO2 kt CO2 kt CO2 kt CO2 kt CO2 kt CO2 kt CO2CF 1 - Natural Gas 50 270 711 1,437 2,048 2,363 2,456 CF2 - Oil 55 286 744 1,489 2,114 2,440 2,539 Cumulative GHG savings kt CO2 kt CO2 kt CO2 kt CO2 kt CO2 kt CO2 kt CO2CF 1 - Natural Gas 86 933 3,488 9,469 18,888 30,398 42,534 CF2 - Oil 94 996 3,678 9,884 19,607 31,483 44,024 Difference in energy production costs M€ M€CF 1 - Natural Gas 84 2,495 CF2 - Oil 59 2,402 Cost of carbon saving €/t CO2 €/t CO2 €/t CO2CF 1 - Natural Gas 24 59 CF2 - Oil 16 55

70
Assessment of Costs and Benefits of Biogas and Biomethane
A.5 Wider benefits of deployment In addition to the wider benefits of deployment of biogas plant, discussed in Section 3.4 of the main report, stakeholders also identified a number of other benefits that deployment could contribute to. These are discussed below.
Younger workers employed in agriculture
AD has the potential to provide new income streams for farmers (e.g. either in the collection and distribution of feedstocks, or in the production of biogas or biomethane on site). If this is the case, it is possible that improved financial prospects in the agriculture sector could help to attract younger people to (and retain them in) farming. This could improve opportunities for people to build sustainable and rewarding careers, helping to improve the viability of the agriculture sector in Ireland over the longer-term.
The extent to which this occurs is dependent on a range of factors, importantly: the overall ambition for producing biomethane, the extent to which feedstocks are drawn from the agriculture sector (relative to other competing technologies) and the ability of farmers to take-up and operate biomethane processing facilities themselves. This will also depend on wider trends facing the agriculture sector and the Irish economy more widely. For example, younger people may not be attracted to jobs in agriculture for lifestyle rather than financial reasons, and therefore a new income associated with farming may have to be significant to overcome such social factors.
Enhancement of environmental credentials of Irish food products
The Origin Green Sustainability Charter developed by Bord Bia is an ongoing voluntary programme that seeks to demonstrate the commitment of Irish food and drink manufacturers, both large and small, to operate in the most sustainable manner possible101. The aim is to enhance the environmental credentials of Irish food production, and so improve the competitiveness of Irish food products in the export market. To date 470 food and drink manufacturers, accounting for almost 95% of Ireland’s food and drink exports, have registered to take part in origin green102.
Biomethane production is relevant to all aspects of the sustainability strategies which companies are asked to develop as part of membership of the scheme, including: material sourcing, manufacturing and social sustainability. Biomethane can contribute by providing improved organic waste management, utilisation of wastes on farm and making ‘green’ gas available for food processing103.
There are already examples of AD plants supporting businesses to meet the objectives of the Origin Green initiative, such as the Dairygold Food plant at Mitchelstown. Due to the high coverage of Irish farms and food and drinks businesses in Origin Green, there is a good opportunity to promote biomethane production to companies through this initiative.
The sustainability impacts associated with biomethane production will be included already in our analysis as part of the impact of individual installations. What is not captured is the potential knock-on impacts on the environmental credentials of Irish food products and any subsequent increase in export success (potentially as part of the overall impact of Origin Green). That said, environmental credentials will be just one of a number of determinants of the success of exports.
Productive use of surplus renewable electricity
As discussed in Section 3.3.3, electricity generated by renewable sources could be used to produce hydrogen via electrolysis, which can then be combined with CO2 in biogas to produce biomethane in a Sabatier process (4H2 + CO2 = CH4 + 2H2O). This production route could therefore provide a valuable ‘storage vector’ for renewable electricity which is generated at times when demand for electricity is low – effectively offering a way to store surplus electricity as a gas.
101 Origin Green Sustainability charter. Bord Bia 2014. http://www.origingreen.ie/about/origin-green-promise/ 102 Origin Green sustainability report 2015. Bord Bia. http://www.origingreen.ie/ 103 Small-scale AD in agro-food companies: potential and barriers. BIOGAS3 2014

71
Assessment of Costs and Benefits of Biogas and Biomethane
Developing skills which will encourage further inward investment
The operation and management of AD plants will require the deployment of a particular set of operational and management skills. The development of a skilled workforce could have consequences on both project and sector scales in attracting Foreign Direct Investment (FDI): A skilled work force provides confidence to investors that technologies can be used effectively and efficiently, maximising the potential return on investment.
Increased levels of FDI will feed through into higher levels of capital available to develop AD projects, sector development and increases in economic activity.
Although this benefit could be associated with biomethane production in theory, any benefit in practice may be very difficult to identify. It is likely that a skilled workforce is only one aspect of the decision to invest in particular project, sector and country along with (for example) exchange rate risks, the tax regime and structure and risk around other incentives, and the particular expertise of the investor. In addition, this will also be affected by competition for FDI from other opportunities elsewhere.
Also there may be a direct trade-off between FDI and community benefits: where the sector attracts FDI, this could crowd out community investment and involvement in AD projects.
Increasing customer choice for green energy
The production of biomethane (and availability of bioLPG) would allow energy consumers a further green energy choice. This could be particularly welcomed by businesses who are gas consumers, as it would offer them a further way to reduce their corporate carbon footprint.
Community cohesion
Biomethane provides an opportunity to develop energy production at the community level. The potential involvement of communities in the development, ownership and/or operation of any AD plant and use of the energy at the local level would promote wider community involvement and cohesion, which in turn could have several positive knock-on effects for the community and its members.
For example, community energy initiatives can promote voluntary activity across all sectors of society104. If can also promote learning of new skills and knowledge and increased awareness of energy and environmental issues, with knock on effects for wider sustainability activities. Community Energy Scotland undertook a survey in 2012 and found that communities reported significant increase in ‘sense of purpose’ and skills105 following involvement in community energy projects.
The extent to which such benefits are realised depends very much on the ownership structure and consultation process associated with the development and operation of AD plants. This in turn will depend on the design of the policy, and whether this allows and incentivises community involvement, and overcomes specific barriers which may prevent this.
There is considerable interest in the benefits that could accrue to communities and appropriate policies that could help to increase the level of community investment in renewable projects are currently being identified and assessed in a study being undertaken for SEAI106.
104 DECC, 2014. Community Energy Strategy: Full Report. Available at: https://www.gov.uk/government/uploads/system/uploads/attachment_data/file/275163/20140126Community_Energy_Strategy.pdf 105 http://www.communityenergyscotland.org.uk/analysing-social-and-economic-impacts.asp 106 Ricardo Energy & Environment, 2017 (to be published). Models for Community Renewables in Ireland.
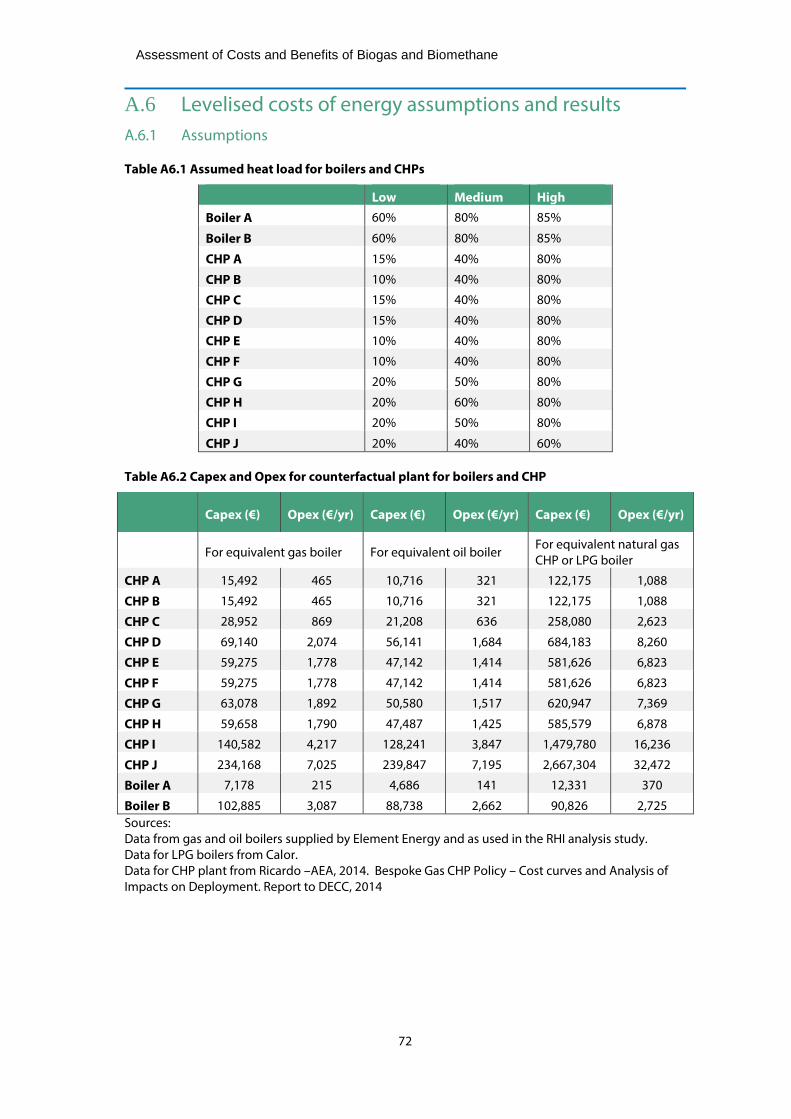
72
Assessment of Costs and Benefits of Biogas and Biomethane
A.6 Levelised costs of energy assumptions and results A.6.1 Assumptions
Table A6.1 Assumed heat load for boilers and CHPs
Low Medium High Boiler A 60% 80% 85%
Boiler B 60% 80% 85%
CHP A 15% 40% 80%
CHP B 10% 40% 80%
CHP C 15% 40% 80%
CHP D 15% 40% 80%
CHP E 10% 40% 80%
CHP F 10% 40% 80%
CHP G 20% 50% 80%
CHP H 20% 60% 80%
CHP I 20% 50% 80%
CHP J 20% 40% 60%
Table A6.2 Capex and Opex for counterfactual plant for boilers and CHP
Capex (€) Opex (€/yr) Capex (€) Opex (€/yr) Capex (€) Opex (€/yr)
For equivalent gas boiler For equivalent oil boiler For equivalent natural gas CHP or LPG boiler
CHP A 15,492 465 10,716 321 122,175 1,088
CHP B 15,492 465 10,716 321 122,175 1,088
CHP C 28,952 869 21,208 636 258,080 2,623
CHP D 69,140 2,074 56,141 1,684 684,183 8,260
CHP E 59,275 1,778 47,142 1,414 581,626 6,823
CHP F 59,275 1,778 47,142 1,414 581,626 6,823
CHP G 63,078 1,892 50,580 1,517 620,947 7,369
CHP H 59,658 1,790 47,487 1,425 585,579 6,878
CHP I 140,582 4,217 128,241 3,847 1,479,780 16,236
CHP J 234,168 7,025 239,847 7,195 2,667,304 32,472
Boiler A 7,178 215 4,686 141 12,331 370
Boiler B 102,885 3,087 88,738 2,662 90,826 2,725 Sources: Data from gas and oil boilers supplied by Element Energy and as used in the RHI analysis study. Data for LPG boilers from Calor. Data for CHP plant from Ricardo –AEA, 2014. Bespoke Gas CHP Policy – Cost curves and Analysis of Impacts on Deployment. Report to DECC, 2014

73
Assessment of Costs and Benefits of Biogas and Biomethane
Table A6.3 Electricity and fuel pricesa
Electricity price (€/kWh) 2017 2018 2019 2020 2021 2022 2023 2024 2025 2026 2027 2028 2029 2030 - 2050
Wholesale electricity price 0.05 0.06 0.06 0.06 0.06 0.07 0.07 0.07 0.08 0.08 0.08 0.08 0.08 0.08
On site use (large user) 0.11 0.11 0.11 0.12 0.12 0.13 0.14 0.14 0.15 0.16 0.16 0.16 0.16 0.16
REFIT 3 Tariff - above 500kWe
0.14 0.14 0.14 0.14 0.14 0.14 0.14 0.14 0.14 0.14 0.14 0.14 0.14 0.14
Gas fossil fuel price (€/kWh)
0 – 278,000 kWh/yr 0.064 0.064 0.065 0.068 0.072 0.076 0.079 0.083 0.087 0.089 0.090 0.090 0.091 0.091
278,000 – 2,778,000 kWh/yr 0.048 0.048 0.049 0.051 0.054 0.057 0.059 0.062 0.065 0.067 0.068 0.068 0.069 0.069
2,778,000 - 27,778,000 kWh/yr
0.041 0.042 0.042 0.044 0.046 0.048 0.051 0.053 0.056 0.058 0.058 0.059 0.059 0.060
>278,000 kWh/yr 0.033 0.033 0.033 0.035 0.037 0.038 0.040 0.042 0.044 0.046 0.046 0.047 0.047 0.048
Wholesale 0.064 0.064 0.065 0.068 0.072 0.076 0.079 0.083 0.087 0.089 0.090 0.090 0.091 0.091
Oil fossil fuel price (€/kWh)
All sizes 0.053 0.054 0.056 0.060 0.065 0.069 0.074 0.079 0.084 0.085 0.085 0.086 0.086 0.087
LPG fuel price
0 – 41,880 kWh/y 0.082 0.090 0.097 0.100 0.103 0.106 0.109 0.112 0.115 0.118 0.121 0.124 0.127 0.130
41,880 – 558,400 kWh/y 0.068 0.074 0.080 0.083 0.085 0.088 0.090 0.093 0.095 0.098 0.100 0.103 0.105 0.108
Diesel Price €/kWh Diesel Price 0.038 0.041 0.043 0.045 0.048 0.052 0.056 0.060 0.064 0.068 0.068 0.068 0.068 0.068
Petrol Price €/kWh
Petrol Price 0.046 0.049 0.052 0.055 0.058 0.063 0.067 0.072 0.077 0.082 0.082 0.082 0.082 0.082 Notes: a) including taxes for all fuels apart from diesel and petrol
Source: 2016 prices for electricity, gas and oil provided by Element Energy: based on SEAI, 2016. Commercial/Industrial Fuels: Comparison of Energy Costs. Future costs projected using fossil fuel price projections as in Appendix 3. Diesel and petrol prices provided by NTMA

74
Assessment of Costs and Benefits of Biogas and Biomethane
Table A6.4 Additional cost of dispensing gas as compressed gas for vehicle refuelling
c/kWh
Additional cost of dispensing natural gas as CNG 1.83
Source: Based on data from Ricardo-AEA, 2014. Waste and Gaseous Fuels in Transport. A report for DfT.

75
Assessment of Costs and Benefits of Biogas and Biomethane
A.6.2 Results
Table A6.5 LCOE of heat from biogas boilers plants and boilers fuelled by gas, oil and LPG
Plant Description Heat Load Discount rate of 8% Discount rate of 12%
Biogas (c/kWh)
Natural gas
(c/kWh)
Oil (c/kWh)
LPG (c/kWh)
Biogas (c/kWh)
Natural gas
(c/kWh)
Oil (c/kWh)
LPG (c/kWh)
Boiler A
Farm (slurry and waste) 41kW boiler
Low 12.76 9.29 9.41 12.55 15.57 9.23 9.26 12.45
Medium 9.57 6.98 9.33 12.32 11.68 6.93 9.16 12.18
High 9.01 6.96 9.31 12.28 10.99 6.90 9.14 12.13
Boiler B Waste (mixture) 1MW
boiler
Low 4.21 5.96 9.33 11.92 5.78 5.92 9.17 11.69
Medium 3.16 5.89 9.27 11.85 4.34 5.82 9.09 11.61
High 2.97 5.87 9.26 11.84 4.08 5.81 9.07 11.59

76
Assessment of Costs and Benefits of Biogas and Biomethane
Table A6.6 LCOE of heat from biogas CHP plants and fossil fuel boilers and gas fired CHP plants at discount rate of 8%
Plant Description Heat Load
Heat from biogas CHP plants assuming income for electricity based on
Heat from gas boiler
Heat from oil boiler
Heat from gas CHP Natural gas (c/kWh) assuming
Wholesale electricity
price (c/kWh)
Large user price
(c/kWh)
REFIT 3 Tariff (c/kWh) (c/kWh) (c/kWh)
Wholesale elect price
(c/kWh)
Large User price
(c/kWh)
CHP A Farm (slurry)
Low 264.77 223.51 221.83 10.62 9.35 32.47 1.30
Medium 99.29 83.82 83.19 7.28 8.54 12.17 0.49
High 49.64 41.91 41.59 6.93 8.30 6.09 0.24
CHP B
Farm (slurry + on farm food waste) 100kW CHP
Low 112.48 50.59 48.07 11.55 9.99 48.70 1.96
Medium 28.12 12.65 12.02 7.28 8.54 12.17 0.49
High 14.06 6.32 6.01 6.93 8.30 6.09 0.24
CHP C Farm (slurry) 196kW CHP
Low 69.74 28.86 27.20 8.24 9.28 29.09 -6.76
Medium 26.15 10.82 10.20 7.21 8.52 10.91 -2.54
High 13.08 5.41 5.10 6.90 8.29 5.45 -1.27
CHP D Farm (slurry + silage) 512kW CHP
Low 81.15 44.34 42.84 7.96 9.17 15.07 -24.01
Medium 30.43 16.63 16.07 7.10 8.48 5.65 -9.00
High 15.22 8.31 8.03 5.91 8.27 2.83 -4.50
CHP E Farm (silage and slurry) 500kW CHP
Low 229.06 167.16 164.65 8.72 9.76 23.08 -35.54
Medium 57.26 41.79 41.16 7.12 8.49 5.77 -8.88
High 28.63 20.90 20.58 5.92 8.27 2.88 -4.44
CHP F
Farm (food waste and silage) 527 kW CHP
Low 94.65 71.16 70.21 7.60 8.89 11.19 -18.11
Medium 37.86 28.47 28.08 6.06 8.39 4.48 -7.24
High 23.66 17.79 17.55 5.91 8.27 2.80 -4.53
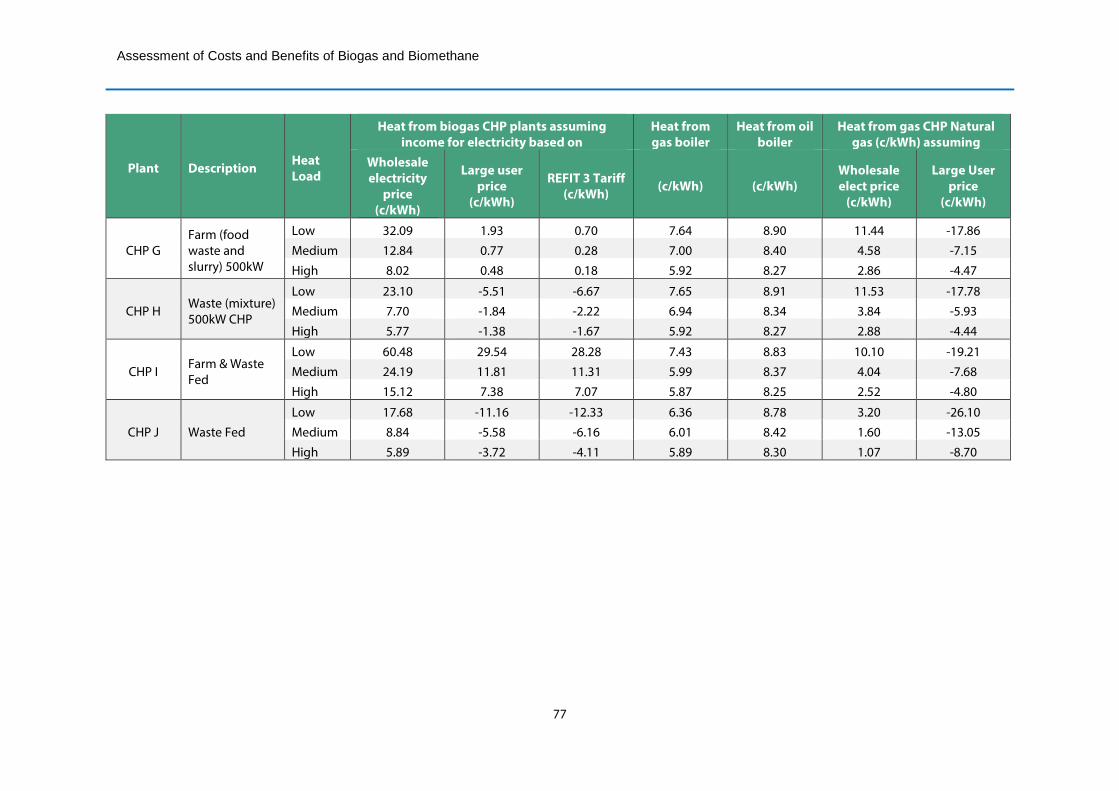
77
Assessment of Costs and Benefits of Biogas and Biomethane
Plant Description Heat Load
Heat from biogas CHP plants assuming income for electricity based on
Heat from gas boiler
Heat from oil boiler
Heat from gas CHP Natural gas (c/kWh) assuming
Wholesale electricity
price (c/kWh)
Large user price
(c/kWh)
REFIT 3 Tariff (c/kWh) (c/kWh) (c/kWh)
Wholesale elect price
(c/kWh)
Large User price
(c/kWh)
CHP G Farm (food waste and slurry) 500kW
Low 32.09 1.93 0.70 7.64 8.90 11.44 -17.86
Medium 12.84 0.77 0.28 7.00 8.40 4.58 -7.15
High 8.02 0.48 0.18 5.92 8.27 2.86 -4.47
CHP H Waste (mixture) 500kW CHP
Low 23.10 -5.51 -6.67 7.65 8.91 11.53 -17.78
Medium 7.70 -1.84 -2.22 6.94 8.34 3.84 -5.93
High 5.77 -1.38 -1.67 5.92 8.27 2.88 -4.44
CHP I Farm & Waste Fed
Low 60.48 29.54 28.28 7.43 8.83 10.10 -19.21
Medium 24.19 11.81 11.31 5.99 8.37 4.04 -7.68
High 15.12 7.38 7.07 5.87 8.25 2.52 -4.80
CHP J Waste Fed
Low 17.68 -11.16 -12.33 6.36 8.78 3.20 -26.10
Medium 8.84 -5.58 -6.16 6.01 8.42 1.60 -13.05
High 5.89 -3.72 -4.11 5.89 8.30 1.07 -8.70

78
Assessment of Costs and Benefits of Biogas and Biomethane
Table A6.7 LCOE of heat from biogas CHP plants and fossil fuel boilers and gas fired CHP plants at discount rate of 12%
Plant Description Heat Load
Heat from biogas CHP plants assuming income for electricity based on
Heat from gas boiler
Heat from oil boiler
Heat from gas CHP Natural gas (c/kWh) assuming
Wholesale electricity
price (c/kWh)
Large user price
(c/kWh)
REFIT 3 Tariff
(c/kWh) (c/kWh) (c/kWh)
Wholesale elect price
(c/kWh)
Large User price
(c/kWh)
CHP A Farm (slurry)
Low 295.79 255.71 252.14 10.84 9.41 35.04 4.77
Medium 110.92 95.89 94.55 7.30 8.44 13.14 1.79
High 55.46 47.95 47.28 6.88 8.15 6.57 0.89
CHP B
Farm (slurry + on farm food waste) 100kW
CHP
Low 139.50 79.38 74.03 11.96 10.19 52.55 7.15
Medium 34.88 19.85 18.51 7.30 8.44 13.14 1.79
High 17.44 9.92 9.25 6.88 8.15 6.57 0.89
CHP C Farm (slurry) 196kW CHP
Low 84.79 45.08 41.54 8.46 9.33 31.75 -3.08
Medium 31.80 16.91 15.58 7.21 8.41 11.91 -1.15
High 15.90 8.45 7.79 6.83 8.14 5.95 -0.58
CHP D Farm (slurry + silage) 512kW
CHP
Low 96.86 61.10 57.92 8.11 9.20 17.72 -20.23
Medium 36.32 22.91 21.72 7.08 8.37 6.64 -7.59
High 18.16 11.46 10.86 5.85 8.11 3.32 -3.79
CHP E Farm (silage and
slurry) 500kW CHP
Low 255.72 195.60 190.24 9.03 9.91 27.17 -29.76
Medium 63.93 48.90 47.56 7.10 8.37 6.79 -7.44
High 31.96 24.45 23.78 5.87 8.12 3.40 -3.72
CHP F
Farm (food waste and
silage) 527 kW CHP
Low 108.40 85.58 83.55 7.67 8.86 13.15 -15.31
Medium 43.36 34.23 33.42 6.03 8.26 5.26 -6.12
High 27.10 21.39 20.89 5.85 8.11 3.29 -3.83

79
Assessment of Costs and Benefits of Biogas and Biomethane
Plant Description Heat Load
Heat from biogas CHP plants assuming income for electricity based on
Heat from gas boiler
Heat from oil boiler
Heat from gas CHP Natural gas (c/kWh) assuming
Wholesale electricity
price (c/kWh)
Large user price
(c/kWh)
REFIT 3 Tariff
(c/kWh) (c/kWh) (c/kWh)
Wholesale elect price
(c/kWh)
Large User price
(c/kWh)
CHP G Farm (food waste and
slurry) 500kW
Low 46.11 16.81 14.20 7.72 8.88 13.47 -15.00
Medium 18.44 6.72 5.68 6.96 8.27 5.39 -6.00
High 11.53 4.20 3.55 5.86 8.12 3.37 -3.75
CHP H Waste (mixture)
500kW CHP
Low 36.10 8.32 5.84 7.74 8.88 13.57 -14.89
Medium 12.03 2.77 1.95 6.88 8.20 4.52 -4.96
High 9.03 2.08 1.46 5.87 8.12 3.39 -3.72
CHP I Farm & Waste
Fed
Low 72.30 42.24 39.56 7.47 8.79 11.82 -16.65
Medium 28.92 16.90 15.82 5.95 8.23 4.73 -6.66
High 18.07 10.56 9.89 5.80 8.09 2.95 -4.16
CHP J Waste Fed
Low 32.37 4.36 1.87 6.39 8.73 4.86 -23.61
Medium 16.19 2.18 0.93 5.97 8.30 2.43 -11.80
High 10.79 1.45 0.62 5.83 8.15 1.62 -7.87

80
Assessment of Costs and Benefits of Biogas and Biomethane
Table A6.8 LCOE for biomethane plants and wholesale price of natural gas
.Plant Description DR rate of 8% DR rate of 12%
Biomethane (c/kWh)
Natural gas (c/kWh)
Biomethane (c/kWh)
Natural gas (c/kWh)
BM A Farm (silage and slurry) and biogas pipeline 8.65 2.89 9.28 2.84
BM B Waste Fed (MSW food waste) medium 9.91 2.89 12.42 2.84
BM C Waste Fed (MSW food waste) large 3.76 2.89 4.52 2.84
BM D Waste Fed (food processing wastes) large 4.36 2.89 4.80 2.84
BM E Farm (maize and food waste) large 9.35 2.89 10.37 2.84
BM F Farm (silage and slurry) large 5.58 2.89 5.98 2.84
BM G Farm (silage and slurry) large with road transport of gas 6.19 2.89 6.69 2.84
BM H Existing sewage sludge plant 2.16 2.89 2.43 2.84
BMF A Co-digestion of Macro Algae and Slurry 15.17 2.89 16.35 2.84
BMF B Wood chip 11.90 2.89 13.39 2.84
Table A6.9 LCOE for vehicles plants compared to petrol, diesel and CNG prices. The values in the table are for discounted rates of 8% and 12% and typical feedstock prices
Plant Description DR rate of 8% DR rate of 12%
Biogas Petrol Diesel CNG Biogas Petrol Diesel CNG
BMV A Waste Fed (MSW food waste) medium + Onsite CBM Filling Station
11.6 7.25 4.47 5.29 14.2 7.21 4.48 5.37

81
Assessment of Costs and Benefits of Biogas and Biomethane
A.7 Support mechanisms in other European countries A.7.1 Support for biogas and biomethane in other countries
Several countries have already developed financial mechanisms for supporting the development of biogas and biomethane projects, and in many this support has led or is leading to increased deployment of plant (Figure A7.1 and Figure A7.2). Support mechanisms in a selection of these countries (Germany, UK, Austria, Sweden, France, Netherlands and Switzerland) are reviewed in detail in this Appendix.
Figure A7.1 Deployment of biogas plant in Europe at end of 2015
Source: European Biogas Association, Statistical Report 2016
1555
717638
554523
444
282277 268
204152 140 139 123 84 71 64 59 36 30 29 28 26 23 18 13 11 11 7 4
0
200
400
600
800
1,000
1,200
1,400
1,600
Num
ber
of p
lant
s
10,846

82
Assessment of Costs and Benefits of Biogas and Biomethane
Figure A7.2 Deployment of biomethane plant in Europe at end of 2015
Source: European Biogas Association, Statistical Report 2016
A.7.2 Germany
Feed-in tariffs are used as the main support mechanism for biogas/biomethane facilities. New amendments are expected for 2017, involving a shift from feed-in tariffs to investment support policies. The existing scheme tariff is summarised in the Table below. The 2012 amendment of the EEG – the Renewable Energy Act was more generous than the 2014 amendment, whose aim was to significantly curb the amount of new biomass installations. Notably, the bonus payment for biogas upgrading was abolished, for which highly efficient CHP plants on the gas grid using biomethane (i.e. buying certificates for biomethane fed into the grid) were eligible.
As an alternative to the fixed feed-in tariff, producers may opt for a ‘market premium’ system. Under this system, renewable electricity producers directly sell their electricity on the market and (in addition to the current electricity market price) are paid the feed-in tariff rate minus the monthly average electricity market price. An extra allowance for management costs is also included in the ‘market premium’. This system incentivises biogas CHP producers to vary electricity generation according to market demand – upping generation when prices are high, and reducing generation when prices are low or negative. With the 2014 amendment of the EEG, the ‘market premium’ system has become mandatory for installations above 500 kW.
Table A7.1 Feed-in tariffs for biomass (including biogas/biomethane) in Germany: comparison of 2012 amendment and 2014 amendment to Renewable Energy Act (EEG)
Electrical output of plant
Electricity from biomass (base rate)
Electricity from non-agricultural
biowaste (base rate)
Bonus for biogas upgrading to biomethane
EEG 2012 EEG 2014 EEG 2012 EEG 2014 EEG 2012 EEG 2014
≤ 75 kW 25 ct/kWh (if > 80wt% manure)
23.73 ct/kWh (if > 80wt% manure)
3 ct/kWh for facilities up to 700 Nm³/h
Abolished
185
80
61
35
21 2013 12 10 8 6 3 2 2 1
0
20
40
60
80
100
120
140
160
180
200N
umbe
r of
pla
nts

83
Assessment of Costs and Benefits of Biogas and Biomethane
≤ 150 kW
Base rate: 14.3 ct/kWh, +6 ct/kWh for energy crops, +8 ct/kWh for agricultural waste
13.66 ct/kWh
16 ct/kWh 15.26 ct/kWh
2 ct/kWh for facilities up to 1,000 Nm³/h
1 ct/kWh for facilities up to 1,400 Nm³/h
≤ 500 kW
Base rate: 12.3 ct/kWh, +6 ct/kWh for energy crops, +8 ct/kWh for agricultural waste
11.78 ct/kWh
16 ct/kWh 15.26 ct/kWh
≤ 5.000 kW
Base rate: 11 ct/kWh, +5/2.5ct/kWh for energy crops, +8/6ct/kWh for agricultural waste
10.55 ct/kWh
14 ct/kWh 13.38 ct/kWh
≤ 20.000 kW
Base rate: 6 ct/kWh, +4/2.5ct/kWh for energy crops, +8/6ct/kWh for agricultural waste
5.85 ct/kWh
14 ct/kWh 13.38 ct/kWh
Notes: all figures in Euro cents per kilowatt hour of electricity fed into the grid. Tariff degression in EEG 2012 was 2% per year. Tariff degression in EEG 2014 is 0.5% per quarter and, if annual capacity expansion exceeds 100 MW, 1.27% per quarter. FiTs are paid over 20 years.
Feed-in tariffs/market premium tariffs are funded through a levy on electricity consumers and are paid by the grid operator to the producer of the electricity. In the case of biomethane upgrading, the operator of the upgrading plant enters into a contract with the operator of a (high-efficiency) CHP plant on the gas grid that annually consumes the same amount of gas as the biomethane plant is feeding into the grid. The CHP operator receives the payment with which he is able to compensate the biomethane producer. In practice, farmers producing feedstocks for biomethane have three options107:
- Sell feedstock to an AD plant with biomethane upgrading
- Sell raw biogas to a biomethane upgrading plant
- Become a co-owner of an AD plant + biomethane upgrading (and possibly trading) company
Costs for installing a gas grid connection for a biomethane upgrading facility are equally shared between the operator of the upgrading facility and the grid operator. However, the grid operator is legally the owner of the grid connection and responsible for operating and maintenance costs. There are no notable nationwide support schemes for other uses of biomethane (heating/vehicles).
A.7.3 Austria
Feed-in tariffs are used as support mechanism for biogas/biomethane facilities, with annual budget caps. The combined cap for liquid and solid biomass and biogas is €10m per year, and is reduced by ~2% per year108.
The launch of consultations for changing the existing legislation (last amended in 2012) are planned for the second half of 2016, involving a shift from feed-in tariffs to investment support policies109. Current FiTs for biogas/biomethane facilities are summarised in the Table below. Analogous to Germany, FiTs are paid to the electricity producer and funded via a levy on electricity consumption.
107 Dotzauer M, 2012. Ökonomischer Ausblick: Direktverstromung oder Gaseinspeisung? Retrieved from Ökonomischer Ausblick Direktverstromung oder Gaseinspeisung? 108 Bundeskanzleramt Österreich, 2016. Gesamte Rechtsvorschrift für Ökostromgesetz 2012, Fassung vom 30.08.2016. Retrieved from https://www.ris.bka.gv.at/GeltendeFassung.wxe?Abfrage=Bundesnormen&Gesetzesnummer=20007386 109 Der Standard. (2016, June 02). Große Reform des Ökostromgesetzes startet im zweiten Halbjahr. Retrieved from http://derstandard.at/2000038073546/Umfassende-Reform-des-Oekostromgesetzes-soll-im-2-Halbjahr-starten

84
Assessment of Costs and Benefits of Biogas and Biomethane
Table A7.2 Feed-in tariffs for biogas/biomethane in Austria110
Electrical output of plant
Electricity from biogas/biomethane
(base rate)
Bonus for biogas upgrading to biomethane
Bonus for high-efficiency CHP111
Tariff for 2016
≤ 250 kW 18.67 ct/kWh
2 ct/kWh 2 ct/kWh
≤ 500 kW 16.15 ct/kWh
≤ 750 kW 12.97 ct/kWh
> 750 kW 12.51 ct/kWh
Notes: all figures in Euro cents per kilowatt hour of electricity fed into the grid. Tariff degression is 1% per year. FiTs are paid over 15 years. Minimum of 30wt% manure input required. Only agricultural feedstocks – if feedstocks of non-agricultural origins are used, FiT rates are reduced by 20%.
There are no notable nationwide support schemes for other uses of biomethane (heating/vehicles).
A.7.4 Sweden
Sweden does not provide feed-in tariffs to support electricity generation from biogas, but offers a range of other support policies.
It is notable that in Sweden almost 60% of all biogas produced is upgraded to biomethane for use in vehicles, driven by investment support for facilities and tax exemptions for biomethane as heating and vehicle fuel112. The majority of biogas produced in Sweden originates from (non-agricultural) biowaste and sewage sludge, each accounting for around 40% of total annual biogas production113.
Table A7.3 Overview over biogas support schemes in Sweden114
Support type Description
Investment support
Investment grants for marketing of new technologies and new solutions around biogas during the period 2010-2016. Maximum 45% or ~€3m of investment cost, ~ €10m per year
Climate-friendly investment support programme. From 2015 to 2018 around €20m-30m per year of funding is available for applications at a local level. Biogas and NGVs have been major beneficiaries in the first round of applications.
Vehicle-specific support
Exemption from CO2 and energy tax up to 2020.
40% reduction of the fringe benefit tax for use of company NGV up to 2019.
Zero vehicle tax for “greener cars” for the first five years
110 Bundesgesetzblatt Österreich., 2015. 459. Verordnung: Ökostrom-Einspeisetarifverordnung 2016 – ÖSET-VO 2016. Retrieved from http://www.oem-ag.at/fileadmin/user_upload/Dokumente/gesetze/2015_12_23_OESET-VO_2016.pdf 111 Defined as: 2/3*heat output/fuel input + electricity output/fuel input ≥ 0,6 112 IEA, 2016. Bioenergy Task 37, Country Reports Summary 2015. Retrieved from http://www.iea-biogas.net/country-reports.html?file=files/daten-redaktion/download/publications/country-reports/Summary/IEA%20Bioerg%2BT37CRS%2B2015%2BFinal.pdf 113 IEA, 2016. Bioenergy Task 37, Country Reports Summary 2015. Retrieved from http://www.iea-biogas.net/country-reports.html?file=files/daten-redaktion/download/publications/country-reports/Summary/IEA%20Bioerg%2BT37CRS%2B2015%2BFinal.pdf 114 Baltic Compact, 2014. How to promote manure-based biogas? Retrieved from http://www.balticcompass.org/Baltic-Compact-Materials/Manure%20based%20biogas%20policy%20recommendations_FINAL_16%2009%2014.pdf

85
Assessment of Costs and Benefits of Biogas and Biomethane
Electricity-specific support
Producers of electricity from biogas can sell certificates within the Norway-Sweden Green Certificate Scheme for renewable electricity. Price span in 2014-2015 was 140-190 SEK/MWh (~15-20 €)
Farm-based support for avoided methane emissions
Since 2014, subsidy of around €0.02/kWhgas for manure-based biogas production; recently doubled to €0.04/kWh115. Total budget of 240 million SEK (around 26 million Euro) over 10 years (2014-2023).
A.7.5 United Kingdom
There are various support scheme options for biogas plants in the UK, which cover renewable electricity generation, renewable heat generation, as well as biogas upgrading for feeding into the gas grid.
Renewable electricity generation from biogas can either be supported through the Feed-In Tariff (FiT) or Renewables Obligation Certificates (ROCs). In contrast to other countries, feed-in tariffs in the UK are also paid for own consumption, with an export bonus added to electricity generation exceeding own consumption and fed into the grid. For installations above 30kW, an export meter is therefore required in order to measure the exact differences between own generation and own consumption.
An alternative support scheme, which is also available to installations with electrical outputs above 5MWe is Renewables Obligation Certificates (ROCs). Anaerobic digestion facilities currently receive 1.8 ROCs per MWh produced. The buyout price, which reflects the maximum amount a producer may be able to sell a ROC at, is currently ~£45 (2016-2017 period).
The Renewable Heat Incentive (RHI) supports heat generation for a range of accepted uses while the supports electricity fed into the grid. Biogas CHP plants are eligible for both FiT payments for electricity generated as well as RHI payments for heat generated116. Eligibility of CHP installations for support for both electricity and heat generation is a distinctive feature of the UK system. However, note that only CHP installations which are not registered for ROCs can claim both FiT and RHI. If an installation claims ROCs, it cannot claim RHI at the same time. Alternatively, the RHI also supports biogas upgrading. This is basically a feed-in tariff for biomethane gas grid injection, analogous to electricity-grid based schemes for renewable electricity.
Table A7.4 Feed-in tariffs for electricity from anaerobic digestion in UK117
Electrical output of plant Base rate Export Tariff bonus
Tariff from July 2016
≤ 250 kW ~9 ct/kWh (7.39p/kWhe)
~6 ct/kWh (4.91p/kWhe) ≤ 500 kW ~8 ct/kWh (6.82 p/kWhe)
≤ 5 MW ~8 ct/kWh (7.03 p/kWhe)
> 5 MW - (eligible for ROCs)
Note: Feed-in tariffs are subject to degression; a review of current FiT levels for biogas is currently underway118. FiTs are paid over 20 years.
115 REGATEC, 2016. Bright future for biogas upgrading in Sweden. Retrieved from http://regatec.org/2016/02/27/bright-future-for-biogas-upgrading-in-sweden/ 116 Wood Energy, undated. FAQs: Can installations claim both the RHI and the FITs? Retrieved from http://www.rhincentive.co.uk/faqs/item/480/ 117 Ofgem, 2016. Feed-in Tariff (FIT) Generation & Export Payment Rate Table. Retrieved from https://www.ofgem.gov.uk/system/files/docs/2016/07/tariff_tables_july_2016.pdf 118 DBEIS, 2016. Review of support for Anaerobic Digestion and micro-Combined Heat and Power under the Feed-in Tariffs scheme. Retrieved from https://www.gov.uk/government/consultations/review-of-support-for-anaerobic-digestion-and-micro-combined-heat-and-power-under-the-feed-in-tariffs-scheme

86
Assessment of Costs and Benefits of Biogas and Biomethane
Table A7.5 Renewable Heat Incentive tariffs for biogas and biomethane injection in UK119
Type of installation Output RHI tariff July to October 2016
Biomethane injection
1st 40 GWh ~5 ct/kWh (4.55 p/kWh)
2nd 40 GWh ~3 ct/kWh (2.67 p/kWh)
> 80 GWh ~2 ct/kWh (2.06 p/kWh)
Heat from biogas
≤ 200 kWth ~7 ct/kWhth (5.90 p/kWhth)
≤ 600 kWth ~6 ct/kWhth (4.63 p/kWhth)
> 600 kWth ~2 ct/kWhth (1.73 p/kWhth) Note: Tariffs are subject to degression, depending on set budgets per technology type. For example, biomethane injection tariffs will be cut by 5% from October 2016 and biogas heat tariffs by 25%. Tariffs are paid over 20 years.
A.7.6 Netherlands
The main instrument for renewable energy support in the Netherlands is SDE+, a feed-in subsidy that is paid by the state on top of market rates, similar to the German ‘market premium’ system. Renewable gas, renewable heat and/or renewable electricity are eligible for support. The producer of renewable energy sells their energy at market rates which are then topped up to the pre-determined subsidy amount via the subsidy. There is a single budget cap (€8bn in 2016) for support to all types of renewable energy and projects are funded on a first-come-first-served basis. Within each funding round (there were two set for 2016) there are several phases. Tariff amounts per kWh increase with each phase, but since there is only one single budget, applicants applying at a later phase risk of being rejected due to a lack of funds. For biogas boilers and CHP, the obtainable rates for the 2nd round of 2016 are summarised in the Table below.
Table A7.6 Summary of 2nd round 2016 SDE+ rates for biogas heat (wholesale market price is deducted from these rates)120
119 DBEIS, 2016a. Quarterly forecasts for the non-domestic RHI scheme as at 31 July 2016. Retrieved from https://www.gov.uk/government/uploads/system/uploads/attachment_data/file/549405/Quarterly_non_domestic_forecast_31_July_2016_v2.xlsx 120 Netherlands Enterprise Agency, 2016. SDE+ 2016 Autumn Brochure. Retrieved from http://english.rvo.nl/sites/default/files/2016/08/Brochure_SDE-plus_autumn_2016.pdf

87
Assessment of Costs and Benefits of Biogas and Biomethane
Notes: for CHP installations, the same subsidy is paid regardless of whether the output is heat or electricity – annual output of heat and electricity are simply added together. However, CHP plants require a minimum electrical efficiency of 10% (reduced from 15% for the autumn 2016 period) in order to be eligible for support. Subsidies are paid for 12 years.
SDE+ also supports biogas upgrading via feed-in subsidies to producers. Rates for the 2nd round of 2016 are summarised in the Table below.
Table A7.6 Summary of 2nd round 2016 SDE+ rates for biomethane (wholesale market price is deducted from these rates)120
Notes: Subsidies are paid for 12 years.
Aside from the premium scheme, investments in renewable energy technologies are supported via loans and various tax benefits121.
A.7.7 France
Feed-in tariffs for biogas plants in France were simplified, and slightly increased, with a legislative amendment in October 2015122. The feed-in tariffs for electricity from biogas are summarised in the Table below. As in Germany and other countries, feed-in tariffs are paid by the grid operator to the producer, and funded through a levy on electricity consumption.
Table A7.8 Feed-in tariffs for biogas in France (MEEM, 2015)
Electrical output of plant
“Feed-in Tariff” scheme (base rate)
Bonus for livestock manure share in feedstock ≥60%
≤ 80 kW 18 ct/kWh 4 ct/kWh
≥ 300 kW 16.5 ct/kWh
Notes: intermediate tariffs for maximum electrical output between 80kW and 300 kW, as well as boni for livestock manure share between 0% and 60%, are determined through linear interpolation. FiTs for biogas are paid over 15 years.
Moreover, there is a set of feed-in tariffs for feeding biomethane into the gas grid, ranging from 4.5 to 12.5 ct/kWh, depending on feedstock and size of installation, with even higher tariffs available for
121 RES-Legal, 2016a. Netherlands: Overall Summary. Retrieved from http://www.res-legal.eu/search-by-country/netherlands/ 122 MEEM, 2015. Arrêté du 30 octobre 2015 modifiant l'arrêté du 19 mai 2011 fixant les conditions d'achat de l'électricité produite par les installations qui valorisent le biogaz. Retrieved from https://www.legifrance.gouv.fr/affichTexte.do;jsessionid=629DE625BE423B34B5F127A754AC178F.tpdila21v_1?cidTexte=JORFTEXT000031402210&dateTexte=&oldAction=rechJO&categorieLien=id&idJO=JORFCONT000031402159

88
Assessment of Costs and Benefits of Biogas and Biomethane
wastewater treatment sludge123. A visual overview is shown below. Analogous to feed-in tariffs for electricity, payments are made to the producer, and funded by levies on gas consumers.
Figure A7.3 Feed-in tariffs for biomethane injection in France
The ‘Act on Energy Transition for green growth’ of August 2015 allows for the introduction of introduction of a tender-based procedure for larger biomethane facilities, where the objectives of injecting biomethane in the gas network are out of line with the trajectory forecast in multi-year energy plans. The criteria applicable to such competitive bidding processes include an emphasis on crowdfunding. 124.
Moreover, investment grants of up to 25% may be available for biogas/biomethane facilities – 15% from the French Environment Agency and another 10% from regional councils and EU funds125.
A.7.8 Switzerland
Switzerland uses a system of feed-in tariffs; a revision of the system towards a market-based support system (similar to Germany’s market premium) is being planned126. Support budgets are capped and there is a long waiting list for applications127. There is no federal support mechanism for biomethane injection. However, the Swiss Gas Association has a fund for biomethane injection, and biomethane as a vehicle fuel is exempt from fuel duties128.
123 MEEM, 2011. Arrêté du 23 novembre 2011 fixant les conditions d'achat du biométhane injecté dans les réseaux de gaz naturel. Retrieved from https://www.legifrance.gouv.fr/affichTexte.do?cidTexte=JORFTEXT000024833895&dateTexte=20160902 124 MEEM, 2016. Energy Transition for Green Growth Act. Retrieved from http://www2.developpement-durable.gouv.fr/IMG/pdf/16172-GB_loi-TE-les-actions_DEF_light.pdf 125 IEA, 2015. France Country report. Retrieved from http://www.iea-biogas.net/country-reports.html?file=files/daten-redaktion/download/publications/country-reports/2015/France_Country_Report_Berlin_10-2015.pdf 126 BKW, 2016. Wann kommt die Direktvermarktung von erneuerbarer Energie in der Schweiz? Retrieved from http://blog.bkw.ch/wann-kommt-die-direktvermarktung-von-erneuerbarer-energie-in-der-schweiz/ 127 Bundesamt für Energie, 2016. Kostendeckende Einspeisevergütung: Informationen für Projektanten von Biomasse-, Windkraft-, Kleinwasserkraftund Geothermieanlagen. Retrieved from http://www.bfe.admin.ch/php/modules/publikationen/stream.php?extlang=de&name=de_513734143.pdf 128 erdgas.ch. (2016). Förderung der Biogas-Einspeisung. Retrieved from http://www.erdgas.ch/biogas/foerderung-der-biogas-einspeisung/

89
Assessment of Costs and Benefits of Biogas and Biomethane
Table A7.9 Summary of feed-in tariffs for electricity from biogas in Switzerland in CHF (EUR 1 ≈ CHF 1.1)129
Notes: FiTs are paid over 20 years. There is no provision for annual degression in current legislation (Schweizerische Bundesrat, 2016).
The gas industry’s fund for biomethane grid injection is worth around €2.5m per year. Prospective producers of biomethane can apply both for investment grants and receive a production-based support payment over three years. Grid operators are also compensated for additional costs over the same three-year time frame. As feedstock, only waste products (not food or energy crops) are eligible.
129 IEA, 2016. Bioenergy Task 37, Country Reports Summary 2015. Retrieved from http://www.iea-biogas.net/country-reports.html?file=files/daten-redaktion/download/publications/country-reports/Summary/IEA%20Bioerg%2BT37CRS%2B2015%2BFinal.pdf

90
Assessment of Costs and Benefits of Biogas and Biomethane
A.8 Acknowledgements We are grateful to the following stakeholders for their inputs during the consultation phase of this study:
• AbbVie Ireland NL B.V
• Calor
• CER
• Cré
• Farmgas
• Fingleton White
• FLI Group
• Gas Networks Ireland
• Green Forty Development Ltd.
• IERC
• IrBea
• NRGE, and
• Ormonde Organics
• Renewable Gas Forum Ireland (RGFI)
• Siemens
• Stream Bioenergy
• TCBB
In addition we would like to thank all those who attended the workshop on barriers to increased production and use of biogas and biomethane held at the Crowne Plaza at Dublin Airport, on 29th September, 2016.

Sustainable Energy Authority of IrelandWilton Park House, Wilton Place, Dublin 2, Ireland, D02 T228
t +353 1 808 2100f +353 1 808 2002
e [email protected] www.seai.ie @seai_ie
Sustainable Energy Authority of IrelandWilton Park House, Wilton Place, Dublin 2, Ireland, D02 T228
t +353 1 808 2100f +353 1 808 2002
e [email protected] www.seai.ie @seai_ie