assessment of dem quality for … · characterizing surface roughness using close ... butler et al....
TRANSCRIPT

PhotogrammetricRecord,16(92): 271–291(October1998)
ASSESSMENTOF DEM QUALITY FORCHARACTERIZING SURFACEROUGHNESS
USING CLOSE RANGE DIGITALPHOTOGRAMMETRY
By J. B. BUTLER, S. N. LANE
Universityof Cambridge
andJ. H. CHANDLER
LoughboroughUniversity
Abstract
This paperpresentsa procedurefor assessingthe quality of a digitalelevationmodel(DEM) which hasbeenappliedto the outputof a normal-ized crosscorrelation basedstereomatchingalgorithm. Using semimetricphotographyof natural gravel river bed surfacesacquired in the field,digital photogrammetrywasusedto extractDEMsautomaticallyfor useincharacterizingsurfaceroughnessproperties.
The procedurefor assessingDEM quality involves examinationof(i) ortho-images,to providea qualitativecheckon stereomatchingperform-ance; (ii) DEM collection statistics which quantify the percentageofcorrectlymatchedpixelsasa functionof thoseinterpolated;and(iii) heightdifferencesbetweencheckpoints,measuredusingindependentfield survey,and correspondingDEM points.The conceptsof precision,accuracyandreliability are defined in the context of DEM quality assessmentand methodsare outlinedwhich can be usedto assessthesevariables.Theassessmentis conductedfor two adjacentstereopairswith similar charac-teristics, consideringthe effectsof both DEM collection parametersanddifferent lensmodelsuponDEM quality.
Resultsshowthat digital photogrammetry,in conjunctionwith inde-pendentfieldsurvey,canbeusedsuccessfullyfor extractinghigh resolution,small scaleDEMs from natural gravel surfaces.Components(i) and (ii) ofthe quality assessmentsuggest the need to optimize DEM collectionparameters,althoughtheeffectsof notusinga properlyspecifiedlensmodelwere minimal at this scale. Method (iii) showed that increasingstereomatchingsuccessdoesnot necessarilylead to more accuratelyesti-mated DEM points. However, the use of method(iii) remaineddifficultbecauseof the scaleof the photogrammetricapplicationbeingused;checkpoint positioningwithin the photogrammetricco-ordinatesystemwasonlypossibleto 1
2 10mmwhich, for a gravel bedsurface,wasassociatedwithelevationvariance of a similar, sometimesgreater, magnitude.The nextstageof this researchwill require the use of higher quality checkdata,possiblyfrom laser profiling.
KEY WORDS: DEM accuracy,gravel bed river, surfaceroughness,closerangephotogrammetry
271PhotogrammetricRecord, 16(92),1998

BUTLER et al. Assessmentof DEM quality for characterizingsurfaceroughness
INTRODUCTION
THE COLLECTION of topographicdata for small terrain areashas traditionally beenaccomplishedusing field surveyingmethods,such as levelling, angularheighting,stadia tacheometryand electronic distancemeasurement(EDM). Although thesemethodsareregardedasflexible andtechnicallyuncomplicated(Kirby, 1991),closerangephotogrammetryis seento havedistinct advantagesover conventionalsurveymethodsmainly in termsof accuracy,speedof applicationandspatialcoverage.
Thusfar, mostapplicationsof closerangephotogrammetry(Kirby, 1991;Laneet al., 1994) havemadeuseof manualdatacollection methods,albeit using auto-matedstereoplotters.With appropriateresearchdesign,thesemethodscan providedataof appropriatequality and densitybut still require time consuminglaboratorydatacollection.Developmentsin automatedstereomatchingmethodsclearly providemuchpotentialfor automatingthis processandpreliminarycloserangeapplicationsareencouraging(Pyleet al., 1997).However,thesemethodsneedcarefulassessmentif they are to be appliedto roughsurfaces,wheresmall changesin camerapositionand lighting intensity and direction may result in major changesin imagequality,imageperspectiveand,possibly,the quality of the DEMs that areacquired.
This paperdevelopsa procedurefor assessingDEM quality and appliesit toDEMs of rough river gravel surfacesgeneratedusing close range digital photo-grammetry.Recentresearchhassuggestedthatbetterspecificationof surfacetopogra-phy is critical for the understandingof both the effects of roughnessupon flowprocesses(Lane, 1998) and of roughnesselementsupon sedimententrainmentandtransport(Hassanand Reid, 1990; Clifford et al., 1992). The work presentedhereformspartof a wider researchprogrammewhich is concernedwith developingcloserange digital photogrammetricmethods to measureand quantify morphologicalchangein gravel bed rivers and coupling this to the developmentof numericalmodelling methods.In this paper, a field basedapplication of the close rangephotogrammetrictechniqueis usedto acquireaccuratebed topographicinformationfrom a naturalgravelbedriver. This applicationis to besupplementedat a laterstageby a smaller scale laboratory basedstudy. This will involve the use of similarequipmentand methodologiesto acquirehigh quality DEMs of a simulatedgravelriver bed.By simultaneouslyacquiringhigh resolutionvelocity informationthrough-out theflow, attemptswill bemadeto link bedroughnesscharacteristicsto turbulentflow processeswhich operateabove and around roughnesselements.Roughnessstatisticswill be derived from the acquiredDEMs to provide boundaryconditioninformationfor theparameterizationof two andthreedimensionalnumericalmodels.The overall quality of the small scaleDEMs is paramountas this will affect (i) thenumerical values of the derived roughnessstatistics; and (ii) the predictions ofthe computationalfluid dynamicscode which is to be coupledwith theseDEMs.
This investigationis concernedwith the quality of thesesmall scaleDEMs. Inthe field basedapplicationpresentedhere,scannedimagesof exposedriver gravelsurfaceswere stereomatchedto acquirehigh resolutionDEMs. TheseDEMs wereassessedusing qualitative interpretationof ortho-images,quantitativeanalysisofDEM collection statisticsand quantitativecomparisonwith independentlyacquiredcheck points. The latter were used (i) to assessthe effects of DEM collectionparameterson DEM quality; (ii) to determineoptimum collection parameters;and(iii) to assessthe effectsof different lensmodelson surfacequality.
THE CONCEPTSOF PRECISION, ACCURACY AND RELIABILITYIN RELATION TO DEM QUALITY ASSESSMENT
The overall “quality” of the elevation data producedusing stereomatchingalgorithmsis of fundamentalimportancein this research,becausethis will directly
272 PhotogrammetricRecord, 16(92),1998

BUTLER et al. Assessmentof DEM quality for characterizingsurfaceroughness
affect any roughnessstatisticscalculatedfrom the DEMs. The quality of a DEM isa function of the accuracy,reliability and precisionof the survey/photogrammetricmeasurementsand the block bundle adjustment itself. In order to construct athorough,systematicdata quality assessmentprocedure,it is necessaryto identifythe different typesof potentialerrorsandtheir sources(TableI) andto quantify theprobability of therebeingerrorsof a specifiedsizeand type.
The precision of survey and photogrammetricmeasurementsis controlledby random errors, which are inherent in the measurementprocess.Repeatedmeasurementsof the same element yield different measuredvalues and theseinconsistenciescannotbe removedby refining the functional model or by applyingcorrections.By regardingsurvey and photogrammetricmeasurementsas randomvariables,a stochasticmodel can be used to assessrandom effects and obtainestimatesof precision(CooperandCross,1988).Local measuresof precisionrequirethe varianceof individual parametersto be computedfrom the covariancematrixof the parameter.Global measuresof precision,suchas the a posteriorivarianceofunit weight (thevariancefactor),canbeusedto quantify theeffectsof randomerrorsin a complete set of co-ordinatesor other derived quantities.The precision ofautomatedimage measurementand stereomatchingis positively related to (i) thenumberof pixels thatareassociatedwith a target(ChandlerandPadfield,1996);and(ii) the signal-to-noiseratio (SNR) of the imagery (Vision International,1995).Higher imageSNRsalsoleadto fewergrosserrors(falsefixes) in thestereomatchedDEMs.
Blundersor mistakeswhich occurduringsurveymeasurement,photogrammetricmeasurementor stereomatchingmay be referredto as gross errors; thesecan beconsideredto determinethe reliability of the DEM (Table I). Cooper and Cross(1988) define reliability as “a measureof the easewith which outliers may bedetected”.In their assessmentof the quality of surveydatasets,Cooperand Cross(1988)alsomakethe distinctionbetweeninternal reliability andexternalreliability.Internal reliability is seenas the size of the marginally detectablegrosserror in ameasurementwhereasexternalreliability is a measureof theeffectof this erroron theparameters(for example,co-ordinates)or on data computedfrom them. The taufactor (ti) can be used to quantify the internal reliability of a particular surveymeasurementand this is simply the ratio of the standarderror of a measurementto that of the correspondingcorrection (Cooper and Cross, 1988). A methodfor evaluating the internal reliability of stereomatchedDEMs basedon (semi-)independentestimatesof surfaceelevationis presentedbelow.Externalreliability isalso an importantconceptin this researchbecausethis will affect the measuresofroughnessderivedfrom thestereomatchedDEMs. In thecontextof experimentaltestson DEM accuracy, Li (1991) has constructeda complementarydefinition ofreliability, which is seenas “the degreeof correctnessto which the DEM accuracyfigures(i.e. RMSE, standarddeviation,mean)havebeenestimated”.
In thecontextof digital photogrammetry,TableI outlinessomephysicaleffectswhich result in the functionalmodel (for example,the collinearity equations)beingan inaccuratedescriptionof the relationshipbetweenderivedsurveyquantities(forexample,photocontrolco-ordinates)andtheactualco-ordinatesof pointsin theobjectspace.In termsof DEM quality, thesephysicaleffectscanresultin systematicerrorsin the control point dataand in the imagemeasurementsusedto definethe photo-co-ordinatesystem.Systematicerrors determinethe accuracy with which photo-grammetricimagemeasurements(andhencestereomatchedDEM points)canbeusedto estimatethe co-ordinatesof a target in the object space.DEM accuracy istraditionally evaluatedand summarizedby computingthe meanand standarddevi-ation/r.m.s.e.of heightdiscrepanciesbetweenthe DEM and independentlyacquiredcheckpoint elevations(Torlegard et al., 1986).
273PhotogrammetricRecord, 16(92),1998

BUTLER et al. Assessmentof DEM quality for characterizingsurfaceroughness
TABLE I. Typesandsourcesof error in conventionalsurveyandcloserangedigital photogrammetry.
Sources/causesof error Methodsof assessment Methodsof correction
RANDOM ERROR(PRECISION)(i) W.r.t. survey measurementsVariation in themeasurement Repeatmeasurementsof thesame Cannotberemoved.process. element.Covariancematrix used
to computelocal andglobalmeasuresof precision.
(ii) W.r.t. digital photogrammetryLow SNR. Precisionestimatecalculatedduring Improveimage
stereomatchingfrom theSNRand quality.thenegativecurvatureof thecorrelationcurve.
GROSSERROR(RELIABILITY)(i) W.r.t. survey measurementsIncorrectmeasuring/recording Assessmentof individual Selectiveremovalofprocedures. measurementresidualsobtained grosserrors.
from leastsquaresestimation.
Internal reliability is themarginally Calculationof the tau factor (ti)detectablegrosserror.External andcomputationof theupperreliability is theeffectof undetected boundon thegrosserror thatcanerroron derivedco-ordinates. bedetectedin the ith measurement
with a givenprobability.
(ii) W.r.t. digital photogrammetryInternal reliability. Incorrectfixes Analysisof DEM collectionresults Blunderediting. Improveduringstereomatchingdueto: andcomparisonof DEM pointswith imagecontrastandpoor imagecontrast/quality; independentelevationdatato identify quality; improvepoor triangulation; individual blunders.Overlapping triangulationbynon-optimalDEM collection DEMs (redundantdata)canalsobe reviewingfunctionalparameters;errorsin groundpoint usedto provide(semi-)independent models;optimizeDEMmeasurementandidentification; estimatesof surfaceelevation. collectionparameterseteffectsof viewing geometry. for specificapplications;
re-measureGCPs.
Externalreliability. Effect of false Analysisof theeffect thatafixeson DEM deriveddata(for marginallydetectableerror in theexample,roughnessparameters). ith measurementhason a
particularparameter.
SYSTEMATIC ERROR(ACCURACY)(i) W.r.t. survey measurementsAtmosphericandotherphysical Extensionof functionalmodelsto Cannotbe fullyeffects.Instrumenterrorsand includesystematicerrors.Systematic eliminatedbut reviewofincorrectpointing. errorswhich canbesuccessfully functionalmodelswhere
estimatedfrom thesurvey necessarycanbeusedtomeasurementscanthenbemodelled. mitigateagainsttheir
effects.
(ii) W.r.t. digital photogrammetryInsufficientlyconvergentimagery. Ensureconvergenceangleof 20° to
40° whenacquiringimagery.
Over-simplificationof the Independentaccuracyassessmentandmeasurementprocess(for example, assessmentof thesignificanceofignoring theeffectsof lensdistortion additional(for example,interiorwhentheseshouldbeconsidered). orientation)parameterswithin thePhysicaleffectsincludecameralens functionalmodels.distortions,atmosphericrefraction,film unflatness.
Modified from CooperandCross(1988).
274 PhotogrammetricRecord, 16(92),1998

BUTLER et al. Assessmentof DEM quality for characterizingsurfaceroughness
METHODOLOGY
ImageData Acquisitionand AutomaticDEM Collection
Fieldwork was undertakenon a reachof the River Affric, Scotland(OrdnanceSurveyNationalGrid referenceNH 128204),to testthefield potentialof closerangephotogrammetryfor acquiring high resolution DEMs of natural, water-workedgravels.TheAffric is a typical upland,coarse-grained,clearwaterriver within whicha numberof large gravel barsbecomeexposedat low flow. Although not reportedhere, researchhas also beencarried out using two media (through water) photo-grammetryto acquireDEMs in submergedzones,and this applicationrequiresanaccessibleclearwaterreach.
For the surfaceroughnesscharacterizationof sub-aerialriver gravels,a largepartially exposedgravel bar was selectedfor study which exhibited a pronounceddownstreamtransition in its grainsizecompositionand hencesurfacetopography.Threetestsites(A, B andC) (Fig. 1(a)) were locatedon the bar, visually identifiedas having different surface roughnesscharacteristicsand distinct morphologicalfeatures.Thesetestsiteswerechosensuchthat the spatialvariability of microtopo-graphyover the surfaceof the bar could alsobe examined.
SitesA, B andC werephotographedusing two semimetric,80mm HasselbladELX 500 cameras.Thesecanbe pinnedat a desiredfocal settingandarefitted with25 crossreseauplates.The cameraswere gantry-mountedto producea camera-to-objectdistanceof approximately2·2m anda base:distanceratio of around1;6. Eachsite was recordedusing a small block of eight stereopairs,arrangedin two parallelstripsof four stereopairseach(Fig. 1(b)). Thecameraswereseparatedby 350mm toallow approximately60 per centforward overlapandstripswerealignedto produceapproximately20 per centsidelap(Fig. 1(b)). The two exposurestationsat the endof eachstrip were offset by 100mm to acquirephotographsof the sameareafromtwo slightly differentpositions.This producedstereopairswith approximately90 percent forward overlap and hence the potential to assessthe reliability of thestereomatchingalgorithmandtheeffectsof camerapositionandviewinggeometryonthe derivedsurfaceelevationvalues.
The resultspresentedin this paperrelateto DEMs extractedfrom two contrast-ing stereopairstaken from site B, within which the spatial variability of surfacetopographywas found to be greatest(possiblydue to the existenceof a transversecut-off channelwhich passesthrough the site) and for which a large number ofcheckpointswereavailable.Photocontroltargetsweregluedontostonesensuringthatat leastfour targetswerevisible in the overlapareaof eachstereopair,aswell as inthe overlapsbetweenadjacentstereopairs.A Leica T1610co-axial total stationwasusedto establishthethreedimensionalco-ordinatesof thesetargetsandbestestimatesof their object spacepositionswere obtainedby a least squaresadjustmentof thesurveydata.
Stereomatchingwas performedusing the OrthoMAX moduleof ErdasImaginesoftwaremountedon a Sunworkstation;this modulecarriesout interior orientation,ground point measurementand, ultimately, automatedDEM extraction using theVision Internationalstereomatchingalgorithm.The matchingprocedureis basedonthe normalizedcross-correlationof orthorectifiedimagepatches,obviating the needfor epipolarresampledstereo-imagery.
The Vision Internationalalgorithmreliesuponsmall scalevariationsin bright-nessandcontrastin eachimage.The bracketingof aperturestopsandshutterspeedswas thus usedin an attemptto obtain optimum exposureswith maximumcontrast.The negativeswere then scannedat 20mm (Fig. 2) with 256 grey levels using theHelava DSW 100 scanningworkstation at City University, London. Each pixelrepresentedan areaof approximately0·630·6mm in the object space.
275PhotogrammetricRecord, 16(92),1998

BUTLER et al. Assessmentof DEM quality for characterizingsurfaceroughness
FIG. 1. (a) Schematicmapof thestudyarea;(b) locationof stereopairsJ1 to J8acquiredfrom siteB.
(a)
276 PhotogrammetricRecord, 16(92),1998

BUTLER et al. Assessmentof DEM quality for characterizingsurfaceroughness
FIG. 2. Exampleof thescannedimageryusedfor stereomatching.
Radiallensdistortionwasmodelledusinga polynomialandthecameraprincipaldistancesat the time of exposurewereestimatedto an acceptablelevel of precisionusinga self calibratingbundleadjustmentwhich includedadditionalsignificantlensparameters(Chandleret al., 1989).The outputfrom this bundleadjustmentandalsothe remaininginterior orientationparameters,photocontrolco-ordinatesand groundpoint measurementswerethensubmittedto the OrthoMAX block bundleadjustment.DEMs weregeneratedfrom the block oncean acceptablephotogrammetricsolutionhadbeenachieved.
Variation of DEM CollectionParameters
DEMs were initially collectedusing the default DEM collection parameters.Theseparameterscontrol various aspectsof the correlation processand may bealteredby theuser(TableII). Thedeterminationof optimizedparametersis explainedsubsequently.
For successfulcorrelations,a user-definedsetof signal-to-noiserangesis usedto“rank” the matchedpoints into three categories:“good”; “fair”; and “poor”. Thethresholdsfor eachcategoryaredefinedon thebasisof theminimumprecision(MP)parametervalue.For example,if MP is setto 0·5pixels,this definestheupperboundof the “poor” category,suchthat the estimatedprecisionof matchesfalling into thiscategorycannotexceed0·5pixels.Although increasingMP hastheeffectof increas-ing the numberof “successfully”matchedpoints,manyof thesematchedpointswillbe inaccurate.For this analysis,the default MP value of 0·5 was usedthroughout,which setsthresholds(in pixels) for the“good” and“fair” categoriesat 0·17and0·33
277PhotogrammetricRecord, 16(92),1998

BUTLER et al. Assessmentof DEM quality for characterizingsurfaceroughness
TABLE II. OrthoMAX DEM collection(strategy)parameters.
Collectionparameter Descriptionof parameter Default Optimized
Minimum threshold Minimum acceptablecorrelationcoefficientusedto 0·6 0·6accepta point
Noisethreshold Minimum acceptablecorrelationcoefficientusedto 0·4 0·4considera point
Maximumparallax Maximumsearchrange(in pixelsof x parallax) 5 5arounda point
Minimum templatesize Thesmallest(initial) templatesize(in pixels)used 7 9by theareacorrelator
Maximumtemplatesize The largest(final) templatesize(in pixels)usedby 9 11theareacorrelator
Minimum precision Minimum acceptableestimatedprecision(in pixels) 0·5 0·5of a point passingtheminimumthresholdtest
Rejectionfactor Smoothingfactor for rejectingspikesandpits during 1·5 2post-processing
Skip factor (Pixel) spacingat which DEM pointsarecollected 2 2for all but theendRRDS
Edgefactor Controlsnon-uniquecorrelationswhich leadto 2·5 3falsefixes
StartRRDS Startingimageresolutionto beused 4 4EndRRDS Final (highest)imageresolution 0 0y parallaxallowance Allows thecorrelatorto movearoundin casesfor 0 0
which the triangulationresultsarepoorResampling Usebilinear interpolation(versusnearestneighbour) Bilinear Nearest
duringorthorectificationof patches neighbourPostprocessing To governwhetherpost-processing(including Yes Yes
blunderediting) is performedaftereachRRDSIgnoreinterpolated (TIN collectionsonly) usedto ignoreinterpolated — —
pointswhenoutputtingelevationsBandselection (Multiband imagesonly) to selectwhich bandis to — —
beusedasthesourcefor correlation
Source:Vision International(1995).
respectively.Thosepixels which cannotbe matchedwith a precisionless than orequalto thevalueof MP areinterpolated,usingannth orderpolynomialbasedon theelevationsand radial distancesof neighbouringpoints.Thus,a point that is “good”hasthe highestprobability of beingcorrectlymatched.
The DEM collectionparameterswerethensystematicallyvaried,usinga rangeof pre-specifiedvalues,andtheDEMs re-collected.This repetitionwascarriedout toassessthe performanceof the stereomatchingalgorithm when using small formatimagery containing complex small scale roughnessfeaturesand to examine theeffectsthat extremeparametervaluesmight haveupon the DEM collection results.BecauseOrthoMAX hasbeendesignedfor usewith largeformat aerialphotographyandsatelliteimagery,therangesoverwhich theparametersweretestedexceededthemanufacturer’ssuggestedranges.
In order to reduceprocessingtime, three small areasubsetsof the full areaDEMs weresubjectedto systematicparameterchange.Two of theareashaddifferentsurfacetexturesandthe third areaincludeda percentageof peripheralpixels so thatstereomatchingsuccessin peripheralareascould be analysed.The resultsof thesecollectionswerethenusedto definean “optimum” parameterset for eachstereopairwhich (i) maximizedthe numberof “good” matches;and(ii) minimizedthe numberof interpolatedpoints.Due to the natureof this closerangeapplication,which aimsto conservesmall scale roughnessfeatures of the terrain, it was felt that themaximizationof goodmatcheswasappropriate.Thesmoothingeffectof interpolation
278 PhotogrammetricRecord, 16(92),1998

BUTLER et al. Assessmentof DEM quality for characterizingsurfaceroughness
would be more appropriatefor modelling more homogeneousterrain areas,suchasparcels of arable land found in large scale aerial photography.Once optimizedparametersetshad beendefined,the full areaDEM was re-collectedusing theseparameters.Small differencesin image texture, quality and contrastbetweenthesub-areasresulted in only slightly different optimum parametersets for eachstereopairandsoa singleoptimumparametersetwasfinally selectedfor thefull areare-collection.
Useof AlternativeLensModels
Uncertaintiesexist in the functional modelsusedby OrthoMAX to relate thecamerainterior orientationparameters,estimatedphotocontrolco-ordinatesandcon-sequentobjectspacepoint estimates.Theaugmentationof thesefunctionalmodelstoincludetheoutputfrom theself calibratingbundleadjustment(thatis, estimatesof theprincipaldistances)wasdonein anattemptto reduceanysystematicerrorsassociatedwith theuseof semimetricphotographyandhenceimprovetheaccuracyof theDEM.
Although fully metric photographyhas traditionally been recommendedforphotogrammetricmeasurement,the use of semimetricimagery has beenshown toprovide a cost effective alternativewhich allows point co-ordinatesto be estimatedwith high levelsof precisionandaccuracy(ChandlerandPadfield,1996).In ordertoassessthe effectsof small, systematicerrorsassociatedwith the useof semimetricphotographyon overall DEM quality, the secondphaseof the analysisinvolved theuse of alternativelens models.Cameraparameters(principal distanceand radialdistortion model) were alteredand the OrthoMAX bundleadjustmentrepeated.TheDEM was then re-collectedusing the optimizedDEM collection parametersand aprincipaldistancevalue(i) estimatedusingtheself calibratingbundleadjustment;and(ii) setat apreviouslycalibratedvalue.By comparingtheDEMs from (i) and(ii) withthe check point elevations,any reduction in DEM accuracyresulting from theincursionof additionalsystematicerror would be observed.
As TableIII shows,LensModel1 wasobtainedfrom theseparateself calibrationof the left and right Hasselbladcamerasat close range.The useof LensModel 2representsthedegradationof thelensmodelwith calibrationdatafrom theleft cameraonly usedto defineboth the left and right camerasand the principal distancesetata previouslycalibratedvalue.LensModel 1 is thusthe morerealisticbecause(i) theleft and right camerasare calibratedseparately;and (ii) calibration data for LensModel 1 were obtainedfrom a self calibratingbundleadjustmentbasedon photo-grammetricmeasurementsmadefrom the closerangeimageryitself.
Assessmentof the Precisionof Surveyand PhotogrammetricMeasurements
Thecofactormatrix producedasa by-productof the leastsquaresadjustmentofsurveyobservationsprovideda measureof theprecisionwith which theco-ordinatesof groundcontrol pointscould be estimated.During groundpoint measurement,theautomaticmatching of correspondingtie and control points in the left and rightimagesprovided estimatesof the precision(in pixel units) with which individualpointswould be stereomatchedin the image.This informationgavean appreciationof the level of precisionwhich could be expectedin DEM elevation.
A standardleast squaresbundleadjustmentis also usedwithin OrthoMAX tocomputetheparametersof exteriororientation.BeforeeachDEM collection,analysisof the “triangulation results” was used to assessestimatedparametersand theirassociatedprecisions.In this case,theaposteriorivarianceof unit weight(or variancefactor) is a measureof the conformity of frame parameterand point residualsandtheir associateda priori standarddeviations.This providesa global measureof the
279PhotogrammetricRecord, 16(92),1998

BUTLER et al. Assessmentof DEM quality for characterizingsurfaceroughness
TABLE III. Alternativelensmodelsusedin the leastsquaresbundleadjustment.
LensModel Usedto define X0 (mm) Y0 (mm) C (mm) K1 K2 K3
LensModel1 Right camera 2 3·6 335·7 90·5795 7·358e-9 1·301e-11 -3·245e-21LensModel1 Left camera 185·3 251·7 91·6721 2 3·911e-9 9·261e-12 4·681e-22LensModel2 Left/right camera 185·3 251·7 81·0209 2·727e-101·150e-11 7·671e-22
X0 andY0 aretheco-ordinatesof theprincipalpoint in thefiducial co-ordinatesystem;C istheprincipaldistanceof thetakingcamera;andK1, K2, andK3 areradialdistortionparameters.
precision of the photogrammetricsolution. Attempts were made to neither underconstrain nor over constrain the photogrammetricsolution so that this valueapproximatedto unity, signifying that parameterresiduals are consistent withrealisticallyspecifiedestimatedprecisions.
Assessmentof DEM Reliability
As TableI shows,grosserrorswhichoccurin thephotogrammetricmeasurementof control pointsandtie pointsin the imagespaceandobjectspaceareidentifiedbyanalysingthe residualsat the block bundle adjustmentstage.The variation of thecollection parameterswas done in an attemptto improve the internal reliability oftheautomaticDEM collectionby reducingtheprobabilityof incorrectfixes.However,because“falsefixes”canoccurfor “good” points,independentaccuracyassessmentwasalsorequiredto (i) identify andeditstereomatchingfailures;and(ii) examinetheeffectthat varyingDEM collectionparametershasuponDEM accuracy.
The DEMs collectedfrom the overlappingstereopairs,which wereacquiredbyoffsettingtheexposurestationby 100mm, wereusedto provide(semi-)independentestimatesof elevation.By comparingfield checkpoint elevationswith correspondingpoints in both DEMs, the internal reliability of stereomatchingwas evaluatedbyanalysingtheheightdiscrepanciesbetweenthe two DEMs.
CheckPoint Acquisitionfor DEM AccuracyAssessment
Independentgroundbasedmeasurementswereusedto assessDEM accuracy.Thefield work involvedusinga level andstaff to acquirea setof checkpointsfrom eachtestsite.A steelbandwaslaid acrossthegravelsurfaceto markoutaprofilewhichwasapproximately2m in length. In order to locate the profile in the object space,measurementsweremadeto thestartandendpointsof thetapeusingthetotal station.A seriesof elevationsadjacentto thetapewasthenobtainedusingthelevel andstaff.The spacingof the height measurementsalong the profile was varied to reflect theroughnessof theterrainsuchthatmorepointswerecollectedif thetapehappenedto restoverclastswith greaterelevationvariability.
RESULTS
AutomaticDEM Collections
Fig. 3 showsa shadedrelief visualizationof a portion of the extractedDEMcollected at 3mm resolution. This portion of the DEM was producedfrom thestereomatchingof stereopairJ4 (seeTable IV). The lighter areasrepresentgreaterelevationvalues.
TheDEM containsmostof thedominantsmallscaleterrainfeaturespresentin theimagery and larger clasts can easily be identified. The stereomatchingalgorithm
280 PhotogrammetricRecord, 16(92),1998

BUTLER et al. Assessmentof DEM quality for characterizingsurfaceroughness
FIG. 3. Planimetricview of aportionof thefull areaDEM. Theregionshownherecorrespondsto theoverlapareaof stereopairJ4.ThisDEM wascollectedusingthemostrealisticlensmodel(LensModel1) andoptimized
collectionparameters.
TABLE IV. Elevationstatisticsfor theDEMs collectedusingdefaultparameters.
Sub-areaDEM Minimum(m) Maximum(m) Mean(m) Standarddeviation(m) Range(m)
J2 98·629 99·169 99·084 0·024 0·540J4 94·947 99·145 98·962 0·170 4·198
J2(sub) 99·043 99·147 99·086 0·015 0·104J4(sub) 98·925 99·062 98·990 0·021 0·137
hasfailed in the darkerregionslocatedtoward the bottom left and bottom right ofFig. 3, which containabnormallylow elevationvaluesrelativeto their surroundings.It is possiblethatexcessiveobliquity dueto perspectivegeometrymayberesponsiblefor this failure.
TableIV showselevationstatisticsfor stereopairsJ2andJ4which wereusedinthe productionof the full areaDEM. Elevationsare recordedin metresaboveanarbitrarydatum.Inspectionof TableIV revealsthe abnormallylow elevationvalueswhicharefoundin theregionsof matchingfailure.Becausethetotal heightdifferencefound on the field surveyed profile was approximately 110mm, the minimumelevationvalue collected from J4 is obviously erroneous.Table IV also includeselevationstatisticsfor thesmallarea,subsettedDEMs alsocollectedfrom stereopairsJ2 andJ4 (J2(sub)andJ4(sub)).TheseDEMs were found not to containregionsofsignificant matching failure and their elevation rangesare seento comparemorerealistically to that observedin the field. The F-statisticproducedfrom a one wayanalysisof variancetest revealedthat the standarddeviationof elevationvaluesin
281PhotogrammetricRecord, 16(92),1998

BUTLER et al. Assessmentof DEM quality for characterizingsurfaceroughness
TABLE V. Effect of parameteroptimizationon collectionresultsfor DEM J4.
Collectionpercentagesby status
Statuscategories Default Optimized
Good 19·1 42·8Fair 30·8 21·7Poor 22·2 13·3Interpolated 26·9 20·9Off-Image 0 1·3
TheDEM wascollectedusingthemostrealisticlensmodel.
J4(sub)wassignificantlygreaterthanthat of J2(sub).This resultwould suggestthatthe former DEM is probably statistically “rougher” than the latter. However, thisinferencecannotnecessarilybedrawnfor thegravelsurfacesthemselves,becausethespreadof elevationvaluesis likely to be influencedby grossDEM errorssuchasanomalousspikesand false fixes. “Blunder editing” is thus requiredprior to thederivationof roughnessstatisticsfrom the extractedDEMs.
Effectsof DEM CollectionParameterson DEM CollectionResults
Table II showsthe default and optimizedDEM collection parametersets,thelatter of which was defined by choosing the value for each parameterwhichmaximizedthe percentageof matchedpoints versusthe percentageof interpolatedpoints.
Variation of individual collection parametersrevealedthat the percentageofsuccessfulmatchescould be increasedby enlarging the maximum and minimumtemplatesizesusedfor cross-correlation.Contrary to expectations,variation of theminimum threshold(MT) andnoisethreshold(NT) parameterscould not be usedtoincreasethe percentageof “good” matcheswithout reducing the proportion ofmatching versus interpolation. The default values of theseparameterswere thusmaintained.Increasesin the rejection factor (RF) and edgefactor (EF) were alsofound to improve matching results, as did the selection of a nearestneighbourresamplingstrategyratherthan the default bilinear method.
TableV showsthechangein thecollectionpercentagesby statuswhich resultedfrom collecting the DEM using (i) the default parameterset; and (ii) the optimizedparameterset.Themostrealisticlensmodelwasusedin bothcases.Theseresultsarefor the DEM extractedfrom stereopairJ4. The use of the optimized collectionparameterset is seento improve the overall quality of the DEM in terms of thesignificant increasein the percentageof “good” matches,and the reduction inthe percentageof “fair”, “poor” and “interpolated”pointswhich areobserved.
Effectsof AlternativeLensModelson DEM CollectionResults
Table VI shows that the degradationof the lens model does not appeartosignificantlyeffect the collectionpercentagesby status.
QualitativeAssessmentof DEM Quality
By removing the effects of image perspectiveand relief, the production ofortho-imagesfrom the stereomatchedDEMs and the source imagery provides ameansof qualitatively assessingDEM quality (Pyle et al., 1997). Poorly matched
282 PhotogrammetricRecord, 16(92),1998

BUTLER et al. Assessmentof DEM quality for characterizingsurfaceroughness
TABLE VI. Effect of lensmodeldegradationon collectionresultsfor DEM J4.
Collectionpercentagesby status
Statuscategories Realisticlensmodel Degradedlensmodel
Good 42·8 42·7Fair 21·7 21·2Poor 13·3 13·1Interpolated 20·9 21·7Off-Image 1·3 1·2
In bothcases,theDEM wascollectedusingoptimizedparameters.
FIG. 4. Visual identificationof DEM quality usingortho-imagesproducedfrom DEMs collected(a) usingdefaultcollectionparametersandmostrealisticlensmodel;(b)usingoptimizedcollectionparametersandmost
realisticlensmodel;and(c) usingoptimizedcollectionparametersanddegradedlensmodel.
areaswould be associatedwith over distortion of the ortho-images(Fig. 4) ascomparedwith the sourceimage (Fig. 2). Fig. 4 suggeststhat the DEM gives areasonablerepresentationof microtopographyfor most of the areabut also showsareaswherestereomatchinghasclearly failed (Fig. 4(a)).Thestraightnessof thetapemeasurein thetop right handcornerconfirmssuccessfulmatching,althoughlocalizedwarpinganddeformationmayagainbetheresultof obliquity or radial lensdistortion.
Qualitativeexaminationof theortho-imagesproducedfrom theDEM which wascollected using optimized parameters(Fig. 4(b)) suggestssome improvementinquality with a reductionin numberandextentof deformations.Contraryto expecta-tions,theortho-imageproducedusingtheDEM collectedusingoptimizedparametersand the degradedlens model (Fig. 4(c)) recordssome improvementin matchingsuccessascomparedwith Fig. 4(b).
Although the use of the optimized DEM collection parameterset resultedin(i) anortho-imagewhich showedan improvementin theoverall quality andsuccess-fully matchedareaof the DEM (Fig. 4(b)); and (ii) an increasein the numberof“good” matches,comparisonof the re-collectedelevationswith the check pointheightsis necessaryto establishwhetheror not theseeffectsareaccompaniedby anoverall improvementin DEM accuracy.
QuantitativeAssessmentof DEM Quality
(i) Estimationof precision.The precisionof the control surveyand the imagematchingprocesscan be usedto provide quantitativemeasuresof resultantDEM
283PhotogrammetricRecord, 16(92),1998

BUTLER et al. Assessmentof DEM quality for characterizingsurfaceroughness
quality.Althoughvery high levelsof precisioncanbeachievedusingimagematchingtechniques,in closerangephotogrammetricapplicationstheabsoluteprecisionof theDEM is constrainedby the relativeprecisionof thecontrol survey.The leastsquaresbundleadjustmentof the surveydatasuggestedthat photocontroltargetco-ordinatescould be estimatedto within 1
2 1mm in X andY and 12 0·5mm in Z. Becauseimage
measurementusing OrthoMAX showedthat the precisionof image matchingwaslikely to bearound0·1pixel (equivalentto 0·06mm in theobjectspace),theprecisionof the control surveyservedas the primary constrainton the precisionof the finalDEM.
(ii) Estimationof DEM internal reliability. Fig. 5 showstheresultsof comparingcorrespondingpointsin thetwo DEMs extractedfrom overlappingstereopairsJ1andJ2. The deviationof points away from the line of equality indicatesdifferencesinelevation betweenthe DEMs at each field check point location. Becausethesestereopairscover the same area but are taken from different camerapositions,these differences can be used to analyse the effects of camera position onstereomatchingandhencethe internal reliability of the DEMs.
The averagevalue of the unsigneddifferencesbetweencorrespondingDEMpoints is not significantlydifferent from zeroat the 95 per cent level. Becausethereis, on average,no significant difference in the elevationvalues betweenthe twoDEMs, this sample of points suggeststhat the effects of camera position arenegligible.Pointsshownto be outlierswould, however,be removedfrom the DEMbeforefurther processingto ensurethe maximizationof externalreliability.
FIG. 5. Analysisof the reliability of automatedDEM extraction.
284 PhotogrammetricRecord, 16(92),1998

BUTLER et al. Assessmentof DEM quality for characterizingsurfaceroughness
FIG. 6. DEM profilesshowingtheeffectof shifting the locationof the transectby 10mm.
(iii) Estimationof the accuracyof restitution and automaticDEM derivation.The a posteriorivarianceof unit weight associatedwith the OrthoMAX block bundleadjustmentwas usedto evaluatethe effectsof using alternativelens modelson theglobalaccuracyof thephotogrammetricsolution.A variancefactorof 0·989resultedfrom the use of the most realistic Lens Model 1. Degradationof the lens modelproduceda valueof 1·053which is not significantlydifferentfrom thepreviousvalueat the 95 per centsignificancelevel. This suggeststhat lensmodeldegradationwasnot accompaniedby a reductionin the global accuracyof restitution.
As Fig. 6 shows,it wasfoundthata 10mm deviationof theprofile takenacrossthestereomatchedDEMs from theactuallocationof theprofile on thegroundwouldleadto significanterror in the resultsof the comparison.In order to compensateforcheckpoint positioningerrors,the elevationrangewithin a 10mm searchradiusofthe nearestDEM point wasusedfor comparisonwith eachcheckpoint.
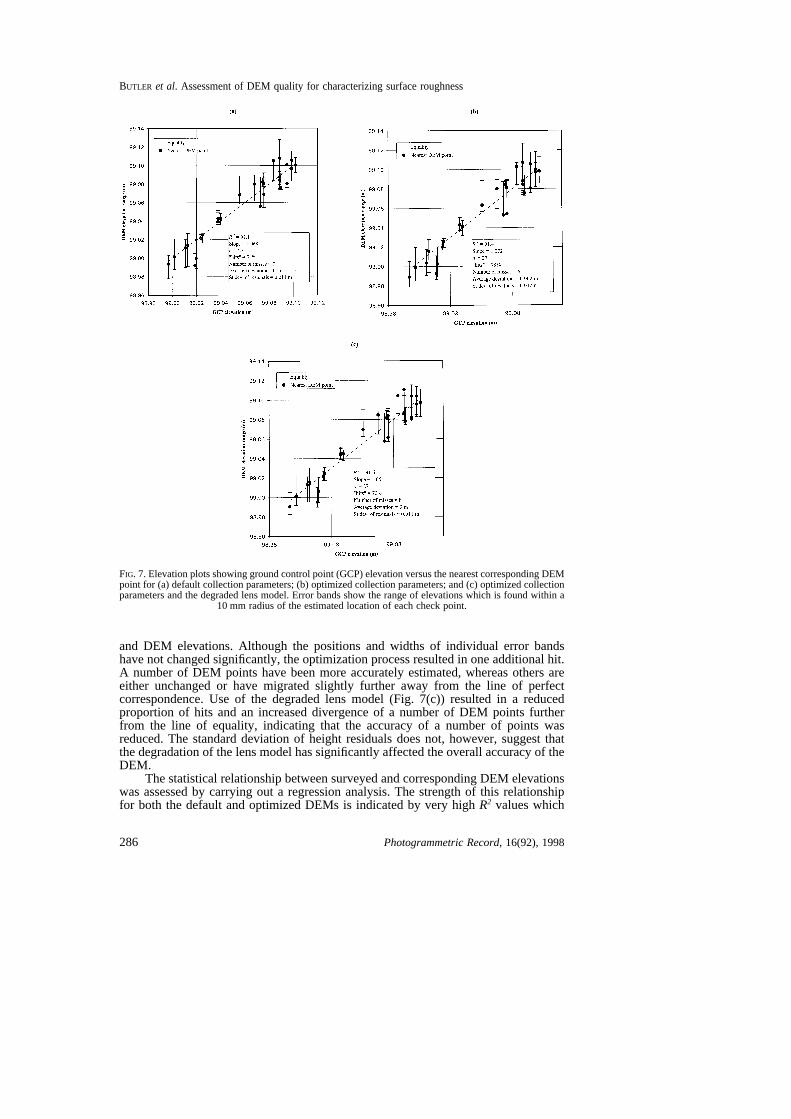
Fig. 7 presentsthe resultsof the comparisonbetweencheck point elevationsobtainedfrom the field profile andthe nearestcorrespondingpoints in the DEM. Inorderto compensatefor possibleshiftsin thepositioningof thefield profile, the“errorbands”at eachpoint reflect the rangeof elevationsfound within a 10mm radiusofthe estimatedlocationof the profile. The percentageof “hits” (that is, pointshavingerrorbandswhich crosstheline of perfectcorrespondence)canthusbeusedto assessquantitativelytheoverallDEM accuracy.Theortho-imageswereusedat this stageofthe analysisto identify checkpoints which were locatedwithin areasof the DEMwhere the stereomatchingalgorithm had failed. These check points were thendiscardedfrom the remainderof the analysis.
Inspectionof Fig. 7 showstheslight improvementin theaccuracyof individualDEM points which is achievedby optimizing collection parameters,in terms ofincreasingthe proportionof “hits”. As Fig. 7(a) shows,the majority (74 per cent)of error bandscross the line of perfect correspondenceand a significant numberof the DEM points themselvesfall very close to this line. A rangeof error bandwidths is present,the largestband widths being frequently associatedwith pointswhich lie on the boundariesof individual clasts.Pointswhich do not crossthe lineof perfectcorrespondence(“misses”)maybedueto falsefixesor poorly interpolatedpoints.
Fig. 7(b) showsa very similar patternof correspondencebetweencheckpoint
285PhotogrammetricRecord, 16(92),1998
BUTLER et al. Assessmentof DEM quality for characterizingsurfaceroughness
FIG. 7. Elevationplotsshowinggroundcontrolpoint (GCP)elevationversusthenearestcorrespondingDEMpoint for (a) defaultcollectionparameters;(b) optimizedcollectionparameters;and(c) optimizedcollectionparametersandthedegradedlensmodel.Error bandsshowtherangeof elevationswhich is foundwithin a
10mm radiusof theestimatedlocationof eachcheckpoint.
and DEM elevations.Although the positionsand widths of individual error bandshavenot changedsignificantly,theoptimizationprocessresultedin oneadditionalhit.A numberof DEM pointshavebeenmoreaccuratelyestimated,whereasothersareeither unchangedor have migratedslightly further away from the line of perfectcorrespondence.Use of the degradedlens model (Fig. 7(c)) resultedin a reducedproportionof hits and an increaseddivergenceof a numberof DEM points furtherfrom the line of equality, indicating that the accuracyof a numberof points wasreduced.The standarddeviationof height residualsdoesnot, however,suggestthatthedegradationof thelensmodelhassignificantlyaffectedtheoverallaccuracyof theDEM.
ThestatisticalrelationshipbetweensurveyedandcorrespondingDEM elevationswasassessedby carryingout a regressionanalysis.The strengthof this relationshipfor both the defaultandoptimizedDEMs is indicatedby very high R2 valueswhich
286 PhotogrammetricRecord, 16(92),1998
BUTLER et al. Assessmentof DEM quality for characterizingsurfaceroughness
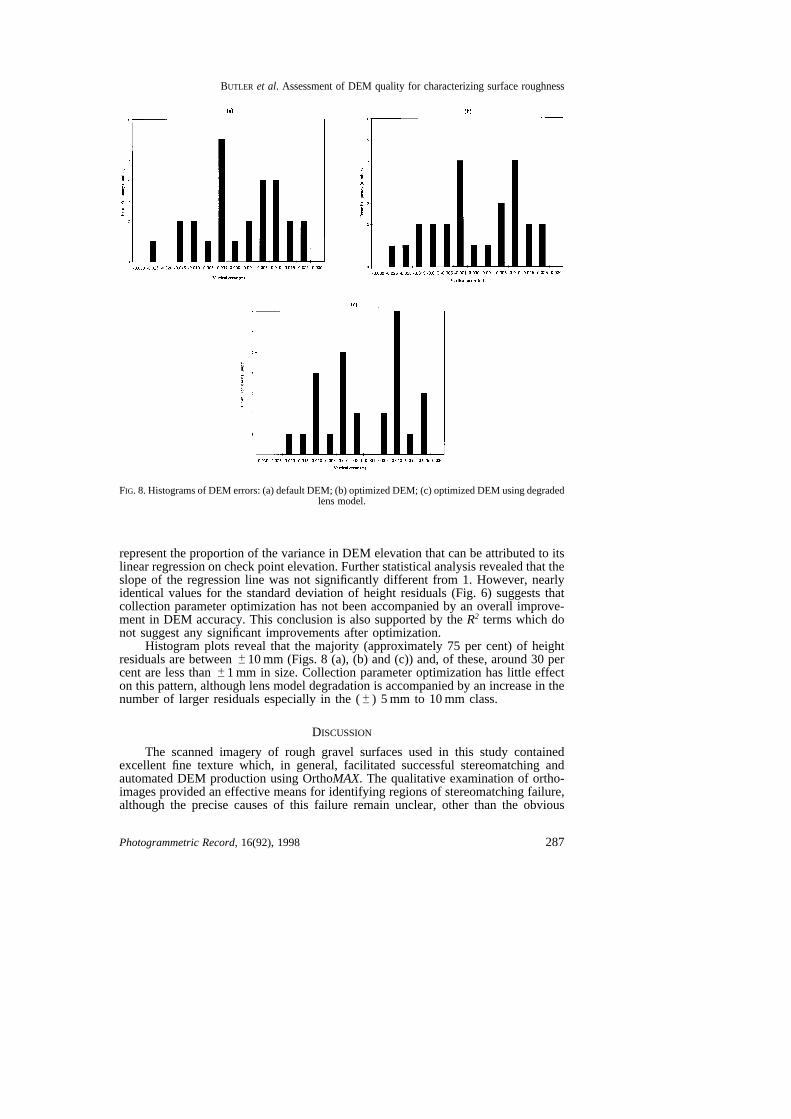
FIG. 8.Histogramsof DEM errors:(a)defaultDEM; (b) optimizedDEM; (c) optimizedDEM usingdegradedlensmodel.
representtheproportionof thevariancein DEM elevationthatcanbeattributedto itslinearregressiononcheckpointelevation.Furtherstatisticalanalysisrevealedthattheslopeof the regressionline was not significantly different from 1. However,nearlyidentical valuesfor the standarddeviationof height residuals(Fig. 6) suggeststhatcollectionparameteroptimizationhasnot beenaccompaniedby an overall improve-ment in DEM accuracy.This conclusionis alsosupportedby the R2 termswhich donot suggestany significantimprovementsafter optimization.
Histogramplots revealthat the majority (approximately75 per cent) of heightresidualsarebetween1
2 10mm (Figs.8 (a), (b) and(c)) and,of these,around30 percentarelessthan 1
2 1mm in size.Collectionparameteroptimizationhaslittle effecton this pattern,althoughlensmodeldegradationis accompaniedby anincreasein thenumberof larger residualsespeciallyin the ( 1
2 ) 5mm to 10mm class.
DISCUSSION
The scannedimagery of rough gravel surfacesused in this study containedexcellent fine texture which, in general,facilitated successfulstereomatchingandautomatedDEM productionusingOrthoMAX. The qualitativeexaminationof ortho-imagesprovidedaneffectivemeansfor identifying regionsof stereomatchingfailure,althoughthe precisecausesof this failure remain unclear,other than the obvious
287PhotogrammetricRecord, 16(92),1998
BUTLER et al. Assessmentof DEM quality for characterizingsurfaceroughness
importanceof edgeeffects,which seemto be particularly dependentupon certainDEM collectionparameters.Furtherresearchis requiredto assessif optimizationmaybe generalizedfor a particular(in this casegravel)surface,or whetheroptimizationis neededfor eachstereopairanalysed.
Theoccurrenceof falsefixeswhich maybeclassifiedas“good” underminestheextentto which DEM collectionstatisticscanbe usedto evaluateDEM quality andmakesindependentaccuracyassessmentcritical. Sensitivity analysisis requiredtoquantify the effectsof individual collection parameterson DEM accuracyand thederivationof analternativeoptimizedsetof parametersbasedon this strategywill becarriedout in subsequentstagesof the research.An automaticmethodfor detectingandcorrectingfalsefixes is alsorequiredto improvethequality of theDEMs, whichwill ensurethat roughnessstatisticscanbe calculatedfrom themwith high levelsofexternalreliability.
The quality of the DEM wasquantifiedon the basisof the precision,accuracyandreliability of thederivedsurveyquantitiesanddigital photogrammetricmeasure-ments.Despitetheuncertaintiesinherentin themeasurementprocess,it waspossibleto determinethe spatial co-ordinatesof photo-controltargetswith sub-millimetreprecision.The precisionof automaticimage matchingwas 0·06mm in the objectspaceandthe internal reliability analysisof the overlappingDEMs showedthat theeffectsof camerapositionon stereomatchingwerenegligible.
Although the quantitativetestsof DEM accuracysuggestedthat the use of adegradedlens model was accompaniedby a slight decreasein the accuracyofindividual DEM points,this wasnot supportedby thequalitativeinterpretationof theortho-images.The effect of not accountingfor minor systematicinaccuraciesduringcameraself calibrationmayexplainthis anomalyandfurtherquantitativemethodsarerequiredto analysethe impactof a changein the functionalmodelon the quality ofthe DEM.
In this application,uncertaintiesin the positioningof checkpoints in the fieldmadeindependentaccuracyassessmentdifficult. Further, the number,density andquality of profile-alignedcheckpoints may not havebeensufficient to pick up thesmallervariationsin DEM valueswhich occurredas a result of altering collectionparametersanddegradingthe lensmodel.In addition,the placementof the surveyedprofile throughthe centralportionsof the imagerymay also havefailed to pick upchangesin elevation occurring towards the DEM edges,which the ortho-imagessuggestseem to be more dependentupon optimization. The analysis of heightdifferencesbetweenfield checkpoints and correspondingDEM points suggestedaDEM accuracyof approximately 1
2 10mm, which would be expectedfrom theplanimetricaccuracyof the field checkpoints.
An understandingof the relationshipswhich exist betweenviewing angle,lighting directionandintensityandtheresultantimagequality/contentis alsorequiredto enabletheselectionof collectionparameterswhich aremorelikely to representtheterrain better.The smoothingeffect which resultsfrom enlargingthe templatesizeand the effect of interpolationmay also lead to the propagationof errors duringautomatedDEM collection and the next stagesof this researchwill endeavourtoquantify theseerrorsusing refinedindependentaccuracyassessmentprocedures.
Despitetheneedfor agreaternumberof higherquality checkpoints,theanalysisshowedthatan improvementin stereomatchingsuccess,asmeasuredby anincreasednumberof “good” matches,is not necessarilyaccompaniedby animprovementin theoverall accuracyof the DEM. This is most likely due to the distribution of checkpoints, which rarely coveredperipheralareasthat were significantly improved byoptimization.A morethoroughassessmentof theeffectsof DEM collectionparame-ters, lens models,image quality/contrast,shadowingand grid resolutionon DEMaccuracywill requirethe useof a densegrid of checkpointswhich canbe reliably
288 PhotogrammetricRecord, 16(92),1998
BUTLER et al. Assessmentof DEM quality for characterizingsurfaceroughness
positionedandco-ordinatedwith the DEM. Hence,it is anticipatedthat subsequentphasesof theresearchwill involve theuseof a high resolutionlaserprofiling device,in a laboratoryflume. Becausethe devicecanbe usedto acquirepoint elevationsat0·5mm spacingoversmall (about3003300mm) areas,a matrix of elevationswouldbe providedwhich could be comparedto photogrammetricallyderivedelevations,ina commondatum.
CONCLUSIONS
Theaim of this researchhasbeento developandapplya non-contactmethodforacquiringhigh quality topographicinformationfrom complex,naturalgravelsurfacesfor usein the roughnessparameterizationof hydraulicmodels.Although the resultspresentedhere are site specific, in that they are basedon scannedphotographyacquiredfrom a singleexposedgravelbar, the closerangephotogrammetricsystemcan equally be applied to any complex topographicsurfacefor which sufficientgroundtruth information is available.Developmentsin two media(throughwater)photogrammetryare also being usedto enablethe comparisonof subaqueousandsubaerialgravelbedsedimentologiesin naturalandsimulatedchannels.
The closerangephotogrammetricsystemusedherecomprisesspecific“off theshelf” hardware,software and semimetriccameras,to acquire and processsmallformat imagery of complex gravel surfaces.Small format, semimetric scannedphotographyhasbeenshownto bea viable, low costprimarydatasourcefor preciseandaccuratesub-pixelimagemeasurementusingdigital photogrammetry(ChandlerandPadfield,1996).However,imagequality (andhencesubsequentstereomatchingsuccess)is dictatedby a wide variety of factorssuchas viewing conditions,imagecontrast,contributionof graininessin theimage,aswell asthephotographicresolvingpowerof specificcamera/lensconfigurations(Thomson,1988).Thequality of DEMsextractedfrom imagery acquiredusing different camerasunder variable lightingconditions is thus likely to be variable and this researchillustrates how, withproprietarysoftware,close attentionshould be given to default parametervalues.
The procedurefor assessingthe quality of the derivedDEMs, basedon ortho-imagesandheightdifferencesbetweencheckpointsandcorrespondingDEM points,could be applied to aerial photographyand stereoscopicsatellite imagery. Whenattemptingto assessthe overall quality of DEMs acquiredfrom imageryat a varietyof spatialscales,comparablemethodsfor assessingprecision,accuracyandreliabilitymust be found for eachapplication.By usingconventionalsurveyto acquirecheckpoints,precisionestimatesfor the control surveycan easily be obtainedusing leastsquaresadjustmentprocedures.For this application,it was felt that thereare feweruncertaintiesin the functional models used to relate survey measurementsandconsequentco-ordinateestimatesthan is the casefor the digital photogrammetry.Further researchis thus required to test the comparability of results obtainedfrom usingalternativehardwareandsoftwareconfigurationsto acquireDEMs fromspecificstereopairs.
ACKNOWLEDGEMENTS
J. B. Butler is in receiptof NERC studentshipGT4/95/55/Fand this researchwassupportedby theRoyalSociety.R. Littleworth andS. Robson*,City University,London, provided accessto and help with image scanningwhich is gratefullyacknowledged.
*Now at University CollegeLondon.
289PhotogrammetricRecord, 16(92),1998

BUTLER et al. Assessmentof DEM quality for characterizingsurfaceroughness
REFERENCES
CHANDLER, J.H. andPADFIELD, C.J.,1996.Automateddigital photogrammetryon a shoestring.Photogram-metric Record, 15(88):545–559.
CHANDLER, J.H., COOPER, M. A. R. andROBSON, S.,1989.Analytical aspectsof small formatsurveysusingobliqueaerialphotographs.Journal of PhotographicScience, 37(7): 235–240.
CLIFFORD, N. J., ROBERT, A. and RICHARDS, K. S., 1992. Estimationof flow resistancein gravel-beddedrivers: a physical explanationof the multiplier of roughnesslength. Earth SurfaceProcessesandLandforms, 17(2): 111–126.
COOPER, M. A. R. andCROSS, P.A., 1988.Statisticalconceptsandtheir applicationin photogrammetryandsurveying.PhotogrammetricRecord, 12(71):637–663.
HASSAN, M. A. andREID, I., 1990.Theinfluenceof microformbedroughnesselementsonflow andsedimenttransportin gravelbedrivers. Earth SurfaceProcessesand Landforms, 15(8): 739–750.
KIRBY, R. P., 1991.Measurementof surfaceroughnessin desertterrain by closerangephotogrammetry.PhotogrammetricRecord, 13(78):855–875.
LANE, S. N., 1998. Hydraulic modelling in hydrology and geomorphology.A review of high resolutionapproaches.Hydrological Processes, 11: 1131–1150.
LANE, S.N., CHANDLER, J.H. andRICHARDS, K. S.,1994.Developmentsin monitoringandmodellingsmallscaleriver bed topography.Earth SurfaceProcessesand Landforms, 19(4): 349–368.
LI, Z., 1991. Effects of check points on the reliability of DTM accuracyestimatesobtained fromexperimentaltests.PhotogrammetricEngineering& RemoteSensing, 57(10):1333–1340.
PYLE, C. J.,RICHARDS, K. S.andCHANDLER, J.H., 1997.Digital photogrammetricmonitoringof river bankerosion.PhotogrammetricRecord, 15(89):753–764.
THOMSON, G.H., 1988.Evaluatingimagequality of small formataerialphotographysystems.Ibid., 12(71):595–603.
TORLEGARD, K., OSTMAN, A. andLINDGREN, R., 1986.A comparativetestof photogrammetricallysampleddigital elevationmodels.Photogrammetria, 41(1): 1–16.
VISION INTERNATIONAL, 1995. IMAGINE Orthomaxuser’sguide. Unpublisheddocument.121 pages.
Resume
On presentedanscet article une methoded’evaluationde la qualited’un modele numerique desaltitudes(MNA) quel’on a appliquee ensortied’un algorithme d’appariementstereoscopiquebase sur une correlationcroisee normalisee. On a utilise des photographiessemi-me´triques dessurfacesnaturellesdu lit d’uneriviere recouvertesdegravier, prisessur leterrain, desquelles on a tire automatiquement des MNA parphotogramme´trie numerique pour determiner les caracteristiques derugositede surface.
Pour evaluer la qualite desMNA, on utilise unemethodecomportanttrois phasesd’examen:(i) examendesortho-imagespour avoir un controlequalitatif des resultats de l’appariement; (ii) examendes statistiquesdesaisie du MNA pour quantifier le pourcentagede pixels correctementapparies par rapport a ceuxqui sont interpoles; et (iii) examendesecartsaux pointsde verification, entre les altitudesdetermines sur le terrain parun leve independantet cellescorrespondantesdu MNA. Dans le cadredecetteevaluationde la qualite du MNA, on definit les notionsde precision,d’exactitudeet defiabilite et l’on donneun apercu desmethodesutilisablespour determinercesparametres.On a menel’evaluationsur deuxcouplesadjacentsde caracteristiquessemblables,en mettanten evidencea la foisles effets des parametres de saisie du MNA et ceux de diversessortesd’objectifs sur la qualite du MNA.
Les resultats montrent que l’on peut utiliser avec succes laphotogramme´trie numerique, associe´e a un leveindependantsur le terrain,pour extrairedessurfacesnaturellesdegraviers,desMNA a petiteechelleet a haute resolution. Les phases(i) et (ii) precedentessuggerent qu’ilfaudrait optimiser les parametres de saisie du MNA, meme si l’on peutconstater l’influence minime a cette echelle d’un type d’objectif auxcaracteristiquesnonconvenablementdeterminees.La phase(iii) precedente
290 PhotogrammetricRecord, 16(92),1998

BUTLER et al. Assessmentof DEM quality for characterizingsurfaceroughness
a montrequ’en accroissantla reussitede l’appariementstereoscopiqueonn’aboutissaitpasobligatoirementa unemeilleureexactitudesur les pointsdu MNA. En fait l’examenlors de la phase(iii) estrestedelicat a causedel’echelle utilisee dans cette application photogramme´trique; on n’a puobtenir qu’une precision de 1
2 10mm sur les determinations photo-grammetriquesdescoordonne´esdespointsde verification, ce qui, pour lasurfacedu lit en graviers,correspondaita peupres a l’ordre de grandeurde la variancedesaltitudes,si ce n’est pasdavantage.On utilisera, dansla poursuitede cetterecherche,desdonnees de verification d’une qualitesuperieure, probablementa l’aide d’un profilageau laser.
Zusammenfassung
Im Artikel wird ein Verfahrenzur QualitatsbewertungeinesdigitalenHohenmodells (DHM) dargestellt, das auf die Ergebnisse einesStereokorrelationsalgorithmus auf der Grundlage normalisierterKreuzkorrelation angewandtwurde. Unter VerwendungsemimetrischerPhotosnaturlicher Kiesbettoberfla¨chenvon Flussenim GelandewurdedieDigitalphotogrammetrie zur automatischen Erzeugung von DHMangewandt,um die Oberflachenrauheitzu beschreiben.
Das Verfahrenzur Bewertungder DHM-Qualitat umfaßtdie Prufung1. von Orthobildern,um einenqualitativenTestzur Leistungsfa¨higkeit derStereokorrelationzuerhalten,2. derStatistikderDHM-Gewinnung,diedenProzentsatzkorrekt korrelierter Pixel als Funktion der interpoliertenquantifiziertund3. derHohendifferenzenzwischenKontrollpunkten,dieausunabhangigen Gelandemessungenund entsprechendenDHM-Punktenermittelt wurden.Die Begriffe Prazision,Genauigkeitund Zuverlassigkeitwerdenim Kontextder DHM-Qualitatsbewertungdefiniert,und eswerdenMethodenskizziert,die zur BewertungdieserVariablenverwendetwerdenkonnen. Die Analyse wird fur 2 benachbarteBildpaare mit ahnlichenCharakteristika, durchgefu¨hrt, wobei sowohl der Einfluß der DHM-Erfassungsparameterals auch unterschiedlicherObjektivmodelleauf dieDHM-Gute betrachtetwerden.
Die Ergebnissezeigen,daßdie Digitalphotogrammetriein Verbindungmit unabhangigen Gelandemessungen erfolgreich zur Erzeugungkleinmaßsta¨biger DHM mit hoher Auflosung von naturlichenKiesoberfla¨chen genutztwerden kann. Die Komponenten1. und 2. derQualitatsbewertungzeigendie Notwendigkeit,die ErfassungsparameterfurDHM zu optimieren,obwohl die Einflusse von nicht passendgewahltenObjektivmodellenbei diesemMaßstab minimal waren. Die Methode 3.zeigte, daß ein erhohter Stereokorrelationserfolgnicht zwangsla¨ufig zugenauergescha¨tzten DHM-Punktenfuhrt. Jedochbleibt die NutzungdesVerfahrens3. wegendesMaßstabsder photogrammetrischenAnwendungschwierig. Die Positionierung von Kontrollpunkten war innerhalb desphotogrammetrischenKoordinatensystemsnur auf 1
2 10 mm moglich, wasfur eine Kiesbettoberfla¨che mit einer Hohenvarianzverbundenwar, dieahnlich aber manchmal auch großer war. Die nachste Stufe dieserForschungen erfordert die Verwendung von besseren Kontrolldaten,moglicherweiseauseiner ProfilbestimmungmittelsLasern.
291PhotogrammetricRecord, 16(92),1998