assessment of ecosystem services provided by urban trees ... · assessment of ecosystem services...
TRANSCRIPT
1
Assessment of Ecosystem Services Provided by Urban Trees:
Public Lands Within the Urban Growth Boundary of Corvallis, Oregon
TECHNICAL REPORT
Prepared by: Don Phillips, Ph.D., Research Biologist, U.S. Environmental Protection Agency, Western Ecology Division, Corvallis, OR In collaboration with: Connie Burdick, Geographer, U.S. Environmental Protection Agency, Western Ecology Division, Corvallis, OR Becky Merja, City Forester, Parks and Recreation Department, City of Corvallis, OR Norm Brown, Arborist, Facilities Services, Oregon State University, Corvallis, OR
2
Executive Summary
Public lands within the Urban Growth Boundary of Corvallis, Oregon contain a diverse
population of about 440,000 trees that include over 300 varieties and have an estimated tree
cover of 31%. While often unrecognized, urban trees provide a variety of “ecosystem services”
or direct environmental benefits for people. This study used computer models developed by the
USDA Forest Service to quantify these ecosystem benefits in both physical and economic terms.
The annual benefits include:
• energy savings and avoided air pollutant emissions due to shading of buildings
• sequestration (storage) of carbon dioxide, the principal atmospheric greenhouse gas
• absorption of air pollutants
• reduction in stormwater runoff and required infrastructure
• increases in private real estate market values
The annual benefits were estimated at $4,000,000, which corresponds to an average of $9 per
tree and $75 per capita. In terms of fixed asset values, the total amount of carbon dioxide stored
was valued at $1.45 million and the total replacement value of the trees was estimated at $450
million. Enumeration of these benefits can raise citizen awareness of the value of their public
tree resources, as well as provide a basis for management to maximize benefits while controlling
costs.
3
Introduction
Trees in urban areas provide a number of benefits to the public. Besides their aesthetic
appeal, they provide a number of tangible environmental benefits that often go unrecognized. In
recent years, there has been increased research on quantification of “ecosystem services”, the
direct benefits that natural system provide to people (Millennium Ecosystem Assessment 2005).
Enumeration of these benefits can raise citizen awareness of the value of their public resources,
such as urban trees on publicly owned lands, as well as provide a basis for management to
maximize benefits while controlling costs.
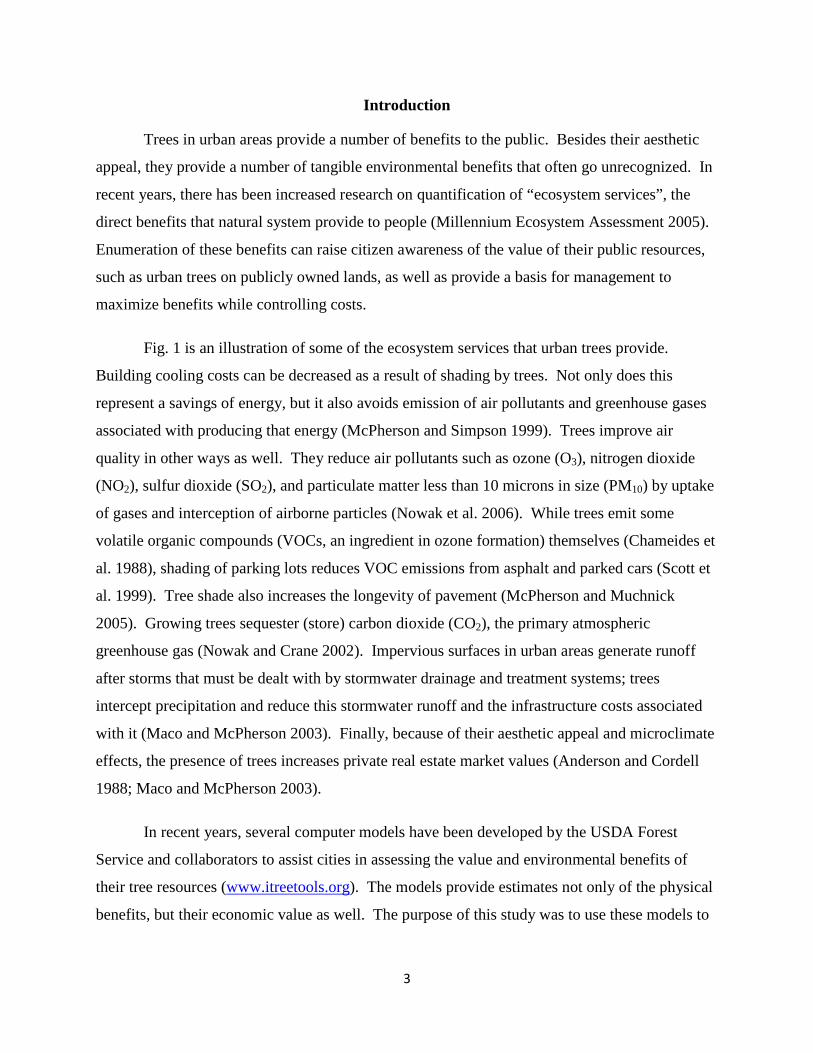
Fig. 1 is an illustration of some of the ecosystem services that urban trees provide.
Building cooling costs can be decreased as a result of shading by trees. Not only does this
represent a savings of energy, but it also avoids emission of air pollutants and greenhouse gases
associated with producing that energy (McPherson and Simpson 1999). Trees improve air
quality in other ways as well. They reduce air pollutants such as ozone (O3), nitrogen dioxide
(NO2), sulfur dioxide (SO2), and particulate matter less than 10 microns in size (PM10) by uptake
of gases and interception of airborne particles (Nowak et al. 2006). While trees emit some
volatile organic compounds (VOCs, an ingredient in ozone formation) themselves (Chameides et
al. 1988), shading of parking lots reduces VOC emissions from asphalt and parked cars (Scott et
al. 1999). Tree shade also increases the longevity of pavement (McPherson and Muchnick
2005). Growing trees sequester (store) carbon dioxide (CO2), the primary atmospheric
greenhouse gas (Nowak and Crane 2002). Impervious surfaces in urban areas generate runoff
after storms that must be dealt with by stormwater drainage and treatment systems; trees
intercept precipitation and reduce this stormwater runoff and the infrastructure costs associated
with it (Maco and McPherson 2003). Finally, because of their aesthetic appeal and microclimate
effects, the presence of trees increases private real estate market values (Anderson and Cordell
1988; Maco and McPherson 2003).
In recent years, several computer models have been developed by the USDA Forest
Service and collaborators to assist cities in assessing the value and environmental benefits of
their tree resources (www.itreetools.org). The models provide estimates not only of the physical
benefits, but their economic value as well. The purpose of this study was to use these models to
4
assess the ecosystem services provided by publicly owned trees in the Corvallis, Oregon urban
area.
Fig. 1 – Illustration of ecosystem services provided by urban trees.
Methods
Study Area
In order to include benefits in the broader urban area, not just the city limits, the study
area was defined by the Urban Growth Boundary (UGB). Due to access limitations for private
property and a desire to focus on public resources, only publicly owned lands within the Urban
Growth Boundary were considered. This includes all lands owned by state (e.g., Oregon State
University, Board of Higher Education, Department of Transportation), county, and city
5
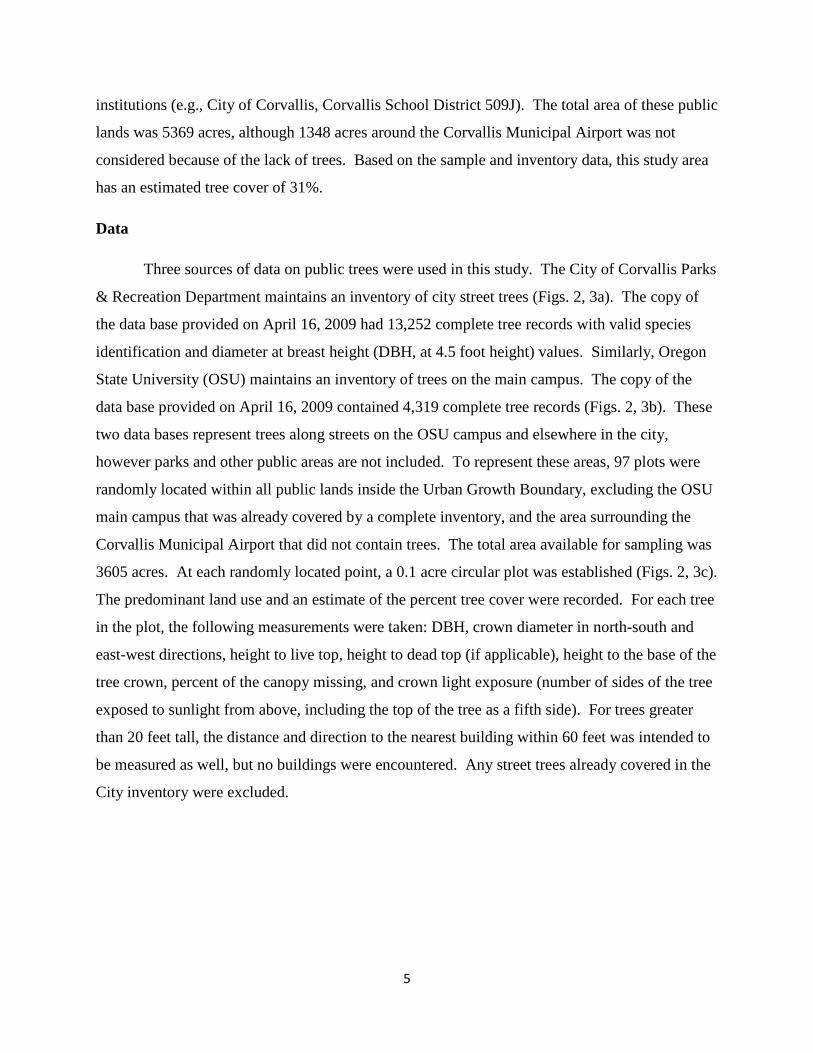
institutions (e.g., City of Corvallis, Corvallis School District 509J). The total area of these public
lands was 5369 acres, although 1348 acres around the Corvallis Municipal Airport was not
considered because of the lack of trees. Based on the sample and inventory data, this study area
has an estimated tree cover of 31%.
Data
Three sources of data on public trees were used in this study. The City of Corvallis Parks
& Recreation Department maintains an inventory of city street trees (Figs. 2, 3a). The copy of
the data base provided on April 16, 2009 had 13,252 complete tree records with valid species
identification and diameter at breast height (DBH, at 4.5 foot height) values. Similarly, Oregon
State University (OSU) maintains an inventory of trees on the main campus. The copy of the
data base provided on April 16, 2009 contained 4,319 complete tree records (Figs. 2, 3b). These
two data bases represent trees along streets on the OSU campus and elsewhere in the city,
however parks and other public areas are not included. To represent these areas, 97 plots were
randomly located within all public lands inside the Urban Growth Boundary, excluding the OSU
main campus that was already covered by a complete inventory, and the area surrounding the
Corvallis Municipal Airport that did not contain trees. The total area available for sampling was
3605 acres. At each randomly located point, a 0.1 acre circular plot was established (Figs. 2, 3c).
The predominant land use and an estimate of the percent tree cover were recorded. For each tree
in the plot, the following measurements were taken: DBH, crown diameter in north-south and
east-west directions, height to live top, height to dead top (if applicable), height to the base of the
tree crown, percent of the canopy missing, and crown light exposure (number of sides of the tree
exposed to sunlight from above, including the top of the tree as a fifth side). For trees greater
than 20 feet tall, the distance and direction to the nearest building within 60 feet was intended to
be measured as well, but no buildings were encountered. Any street trees already covered in the
City inventory were excluded.
6
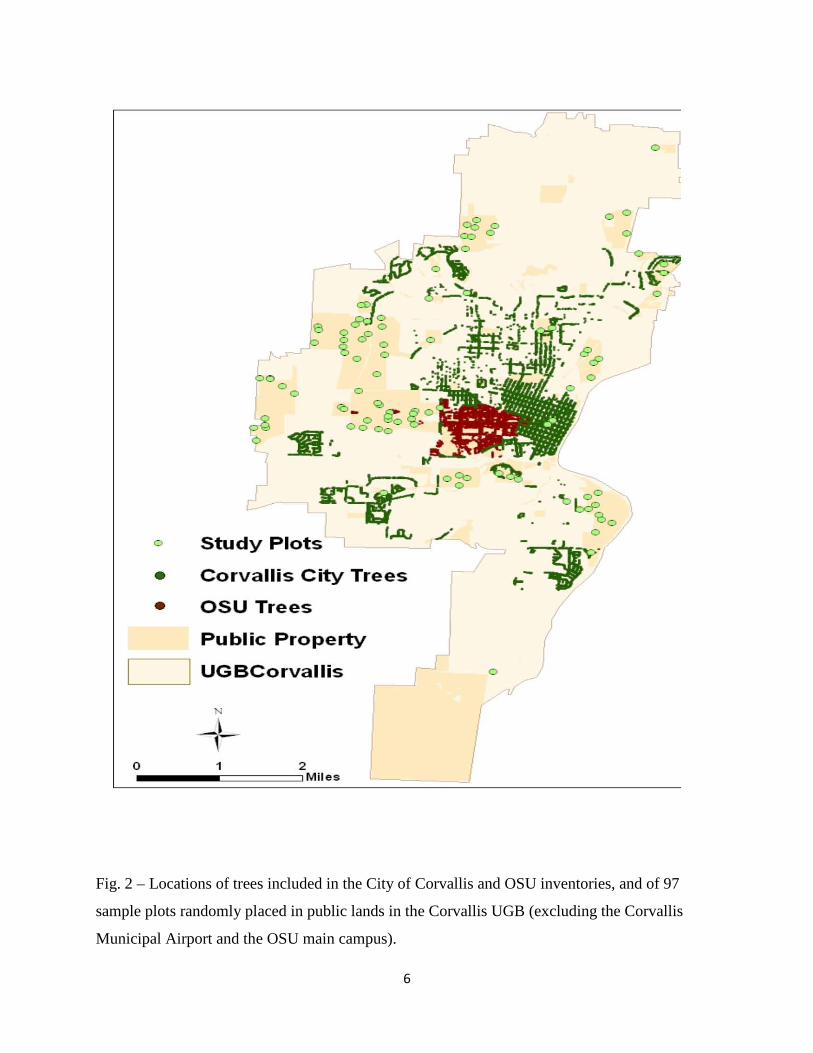
Fig. 2 – Locations of trees included in the City of Corvallis and OSU inventories, and of 97
sample plots randomly placed in public lands in the Corvallis UGB (excluding the Corvallis
Municipal Airport and the OSU main campus).
7
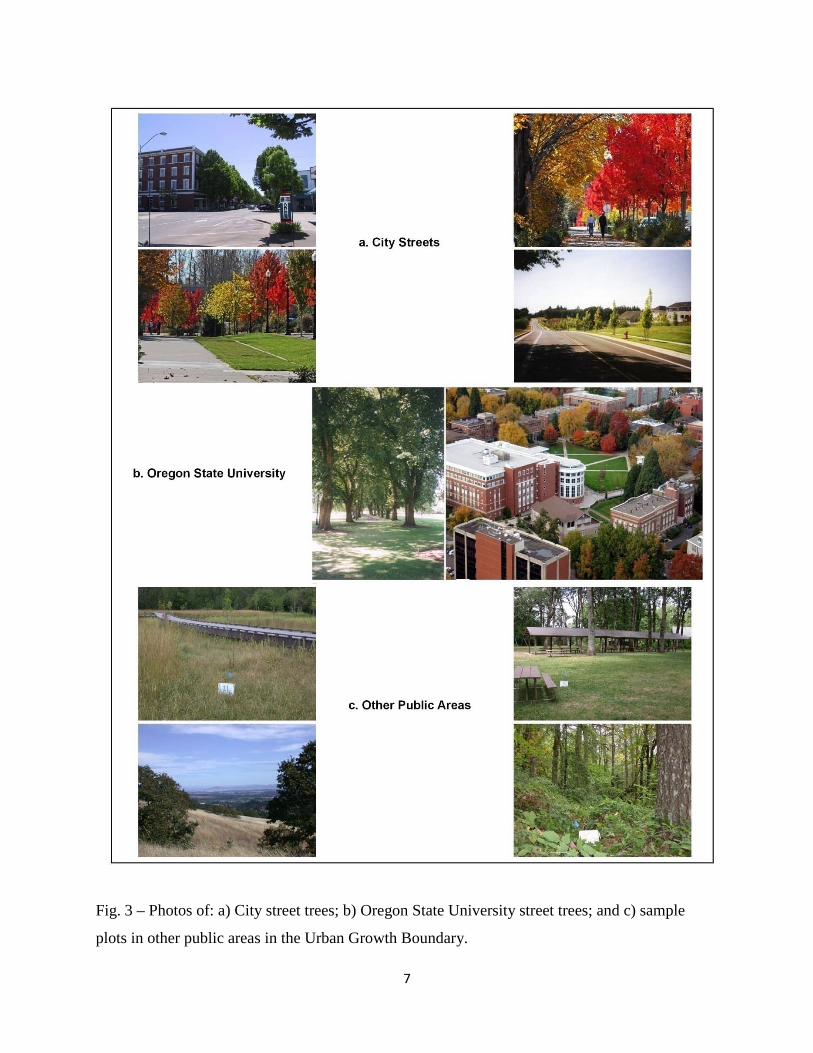
Fig. 3 – Photos of: a) City street trees; b) Oregon State University street trees; and c) sample
plots in other public areas in the Urban Growth Boundary.
8
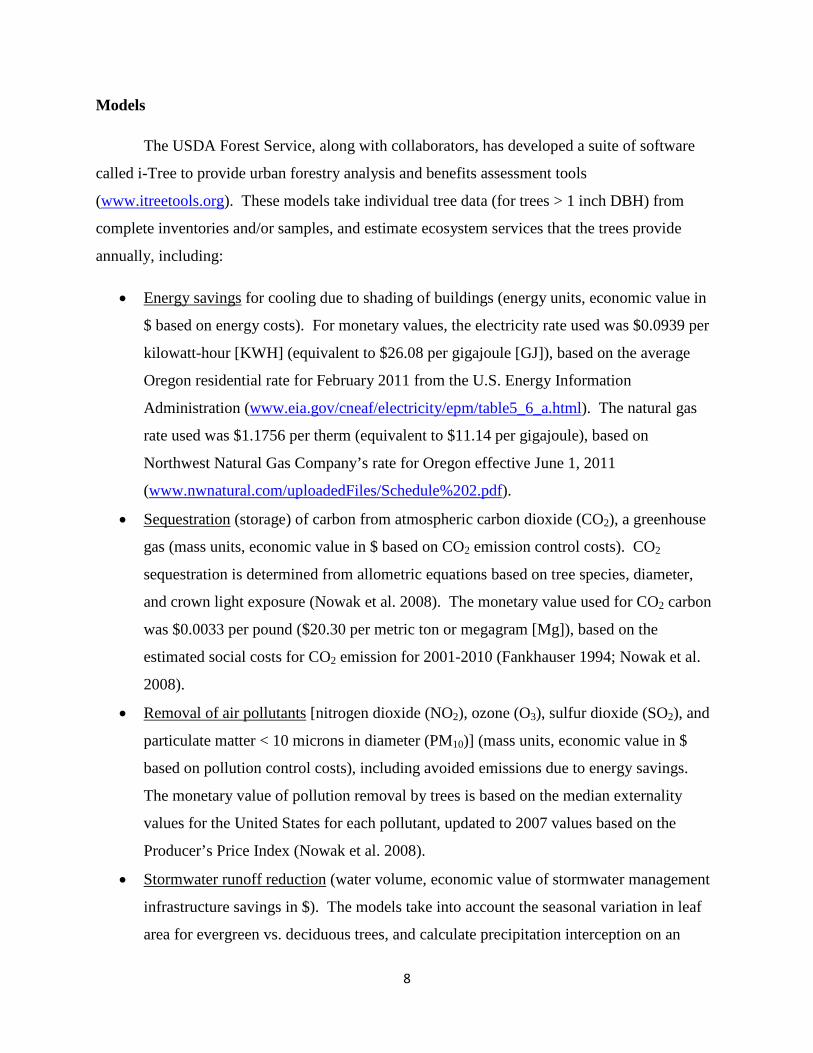
Models
The USDA Forest Service, along with collaborators, has developed a suite of software
called i-Tree to provide urban forestry analysis and benefits assessment tools
(www.itreetools.org). These models take individual tree data (for trees > 1 inch DBH) from
complete inventories and/or samples, and estimate ecosystem services that the trees provide
annually, including:
• Energy savings for cooling due to shading of buildings (energy units, economic value in
$ based on energy costs). For monetary values, the electricity rate used was $0.0939 per
kilowatt-hour [KWH] (equivalent to $26.08 per gigajoule [GJ]), based on the average
Oregon residential rate for February 2011 from the U.S. Energy Information
Administration (www.eia.gov/cneaf/electricity/epm/table5_6_a.html). The natural gas
rate used was $1.1756 per therm (equivalent to $11.14 per gigajoule), based on
Northwest Natural Gas Company’s rate for Oregon effective June 1, 2011
(www.nwnatural.com/uploadedFiles/Schedule%202.pdf).
• Sequestration
Nowak et al. 2008
(storage) of carbon from atmospheric carbon dioxide (CO2), a greenhouse
gas (mass units, economic value in $ based on CO2 emission control costs). CO2
sequestration is determined from allometric equations based on tree species, diameter,
and crown light exposure ( ). The monetary value used for CO2 carbon
was $0.0033 per pound ($20.30 per metric ton or megagram [Mg]), based on the
estimated social costs for CO2 emission for 2001-2010 (Fankhauser 1994; Nowak et al.
2008).
• Removal of air pollutants
Nowak et al. 2008
[nitrogen dioxide (NO2), ozone (O3), sulfur dioxide (SO2), and
particulate matter < 10 microns in diameter (PM10)] (mass units, economic value in $
based on pollution control costs), including avoided emissions due to energy savings.
The monetary value of pollution removal by trees is based on the median externality
values for the United States for each pollutant, updated to 2007 values based on the
Producer’s Price Index ( ).
• Stormwater runoff reduction (water volume, economic value of stormwater management
infrastructure savings in $). The models take into account the seasonal variation in leaf
area for evergreen vs. deciduous trees, and calculate precipitation interception on an
9
hourly basis from local weather records. The monetary value used was $0.02779 per
gallon based on cost studies in western Washington (McPherson et al. 2002).
• Aesthetics (as determined by annual increase in private real estate values based on tree
presence, size, and growth). The median home sales price of $237,000 for Corvallis for
May-July 2011 (www.trulia.com/real_estate/Corvallis-Oregon) was used as the basis for
this monetary value calculation.
In addition to these annual benefits, the models also estimate one-time asset values of:
• total CO2 sequestered (economic value in $ based on CO2 emission control costs)
• replacement value (full cost in $ to replace a tree with a tree of similar species, size, and
condition; based on Council of Tree & Landscape Appraisers Guide for Plant Appraisal)
One of these models, i-Tree Streets, was designed for assessment of ecosystem services
provided by street trees and was used for analyzing the City and OSU tree inventory data sets.
The model is not GIS-based, but works with basic inventory data on tree species and diameter.
The model uses data bases and analyses performed in an intensively studied Reference City
within the same i-Tree Streets Climate Zone
(http://www.itreetools.org/streets/resources/Streets_Reference_Cities_Science_Update_Nov2011
.pdf) for quantifying other aspects of tree structure (e.g., height, crown diameter, tree condition)
and relationships of the tree data to ecosystem services and their economic values. The climate
zone for Corvallis is Pacific Northwest, and the reference city is Longview, WA (McPherson
2010). However, as described above, electricity, gas, and real estate values specific to Corvallis
were used rather than the default values for the reference city. We assumed that the same
proportion of buildings were air-conditioned in Corvallis as in the reference city, and thus that
the calculations for energy savings for cooling due to shading were appropriately scaled. The
model is described in more detail in Maco and McPherson (2003) and the i-Tree Streets User’s
Manual (USDA Forest Service 2011b).
The other model, i-Tree Eco, was designed for assessment of entire forest tree
populations across an urban area rather than linear features like street trees adjacent to roads.
This model was used to analyze the sample plot data, which excluded the areas already covered
by the city and OSU street tree inventories that were assessed using i-Tree Streets. The i-Tree
10
Eco model requires more extensive data collection for each tree as described above for plot
sampling, rather than the basic species and diameter measurements used for i-Tree Streets with
other data derived from a Reference City data base. More detailed descriptions of i-Tree Eco are
available in Nowak et al. (2008) and the i-Tree Eco User’s Manual (USDA Forest Service
2011a).
Collectively, the City and OSU inventories represent street trees on public rights of way
and the OSU main campus, while the random plot samples represent trees in parks and other
public areas within the UGB. Consequently, the ecosystem service assessments from the two i-
Tree Streets model runs for the street tree inventories and the i-Tree Eco model run for the other
public areas (scaled up from the plot data) were summed for a comprehensive assessment for all
public lands in the UGB. The two models estimate the same ecosystem services, although some
were not pertinent to all three data sets:
• Energy savings – This estimate was not used for the sample plot data because no nearby
buildings were encountered that would be shaded by the trees in the plots.
• CO2 sequestration (annual and total) – The two models differed in the prices used to
determine the economic value of carbon sequestered. For consistency, the i-Tree Eco
value of $20.30 per metric ton was applied to the results of all three model runs.
• Removal of air pollutants – For the i-Tree Eco run, this estimate only includes removal
by tree foliage. Because no nearby buildings were encountered in the plot sampling,
avoided pollutant emissions from energy savings were not included.
• Stormwater runoff reduction – The i-Tree Eco model does not estimate stormwater runoff
volume reduction and its infrastructural cost savings as i-Tree Streets does. However, the
City of Portland recently did a similar assessment of public street trees using STRATUM
[i-Tree Streets] and park trees using UFORE [i-Tree Eco] (Portland Parks & Recreation
2007). For stormwater runoff reduction estimates for park trees, they also ran the
CITYgreen model (American Forests 2004) which is similar to i-Tree Eco but does
address stormwater endpoints. Their estimated annual stormwater reduction was 226
gallons per tree (0.856 cubic meters per tree). The DBH distribution of Portland parks
trees (57% < 6” DBH) was similar to that of the Corvallis sample plots (60% < 6” DBH),
the climate is similar (mean annual precipitation of 43.67 inches for Corvallis and 43.11
11
inches for Portland; http://usclimatedata.com), and they have similar topographic settings
along the Willamette River, so this annual rate of stormwater reduction per tree was
applied. A valuation of $7.34 per cubic meter ($0.02779 per gallon) in reduced
infrastructure costs was applied to stormwater runoff reductions from all three data sets,
as this was the value used both in i-Tree Streets and in the CITYgreen analyses done by
the City of Portland (Portland Parks & Recreation 2007).
• Aesthetics – Since this component is based on increases in private real estate value from
the presence of trees, it was only applied to the City street tree inventory because most
OSU and sample plot trees are not adjacent to private property.
All model results are estimates and include uncertainties associated with parameter
values and random variation among samples. Results are rounded to reflect the appropriate
degree of precision in these estimates. The sample size of 97 plots was estimated to give a
standard error of 17% for the i-Tree Eco results on “other public lands” (USDA Forest Service
2011a). As a rule of thumb, results were rounded to decimal units roughly reflecting a precision
of one-third of the standard error. For example, for an estimate of $393,936, one-third of the
standard error would be 1/3 x 0.17 x $393,936 = $22,323. Consequently, the estimate would be
rounded to the nearest $10,000 and presented as $390,000. Because the “other public lands”
component was by far the largest and the most uncertain due to random sampling rather than
complete inventories, this rule of thumb was applied for presenting all individual model results
and totals across model runs.
Results
There was a diverse array of trees among the three data sets including over 300 species
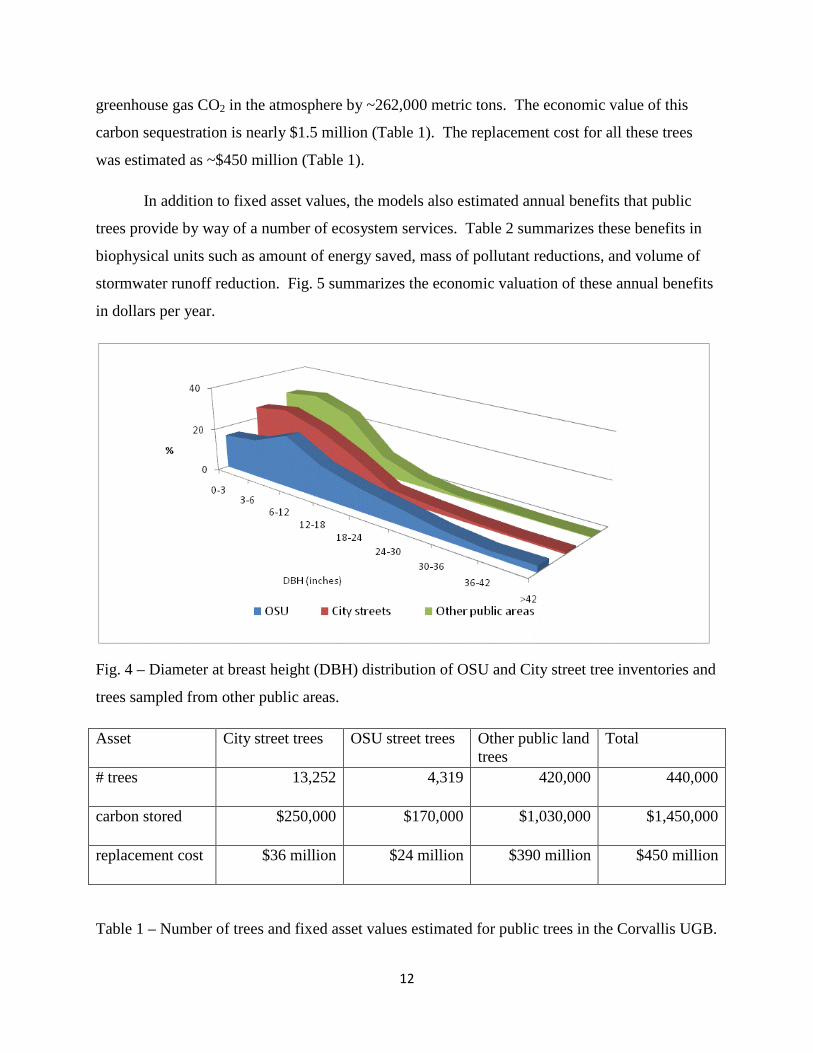
and variety of trees. The most frequent diameter class for the City inventory and sample plots
from other public areas was 3-6” DBH; the OSU trees were larger and more mature, with the
most frequent diameter class being 6-12” DBH (Fig. 4). Based on the sampled plots, there are
approximately 420,000 trees in UGB public lands in addition to the 13,252 and 4,319 in the City
and OSU street tree inventories, for a total of about 440,000 trees (Table 1). Broadleaf
deciduous trees and coniferous evergreen trees represented 82% and 18% of this population,
respectively. These trees store a total of about 71,000 metric tons (1 metric ton = 1000
kilograms = 2205 pounds) of carbon from CO2, which represents the equivalent of decreasing the
12
greenhouse gas CO2 in the atmosphere by ~262,000 metric tons. The economic value of this
carbon sequestration is nearly $1.5 million (Table 1). The replacement cost for all these trees
was estimated as ~$450 million (Table 1).
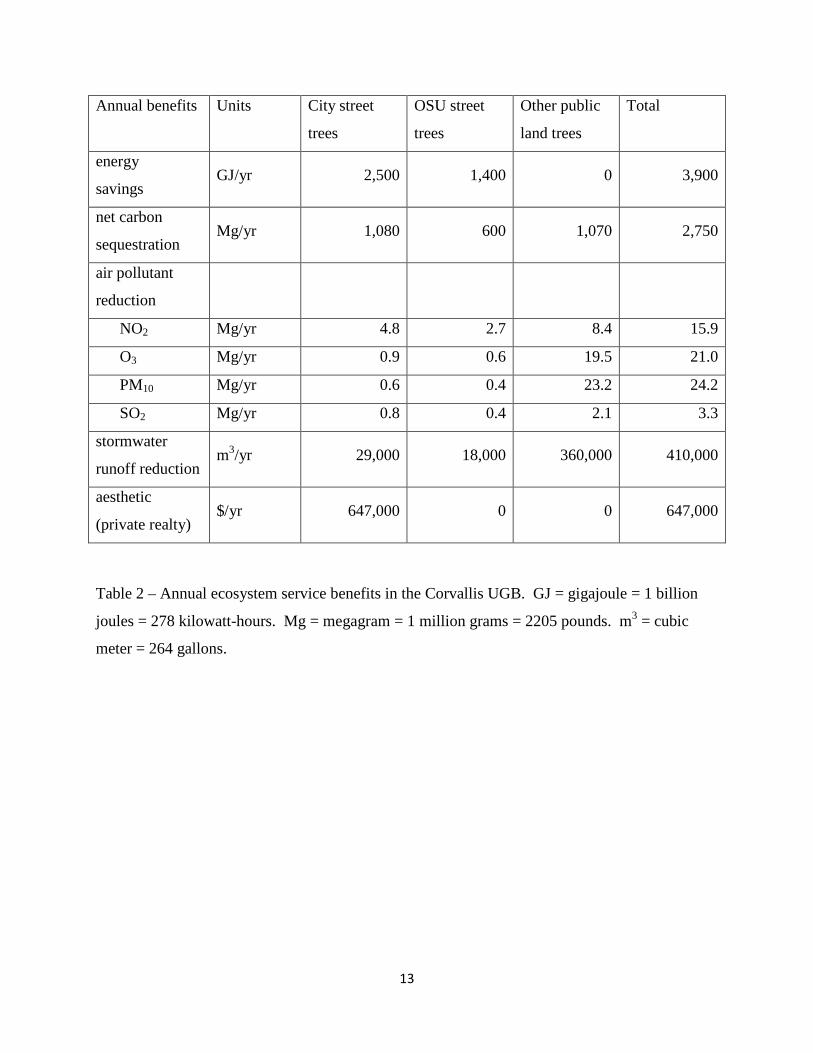
In addition to fixed asset values, the models also estimated annual benefits that public
trees provide by way of a number of ecosystem services. Table 2 summarizes these benefits in
biophysical units such as amount of energy saved, mass of pollutant reductions, and volume of
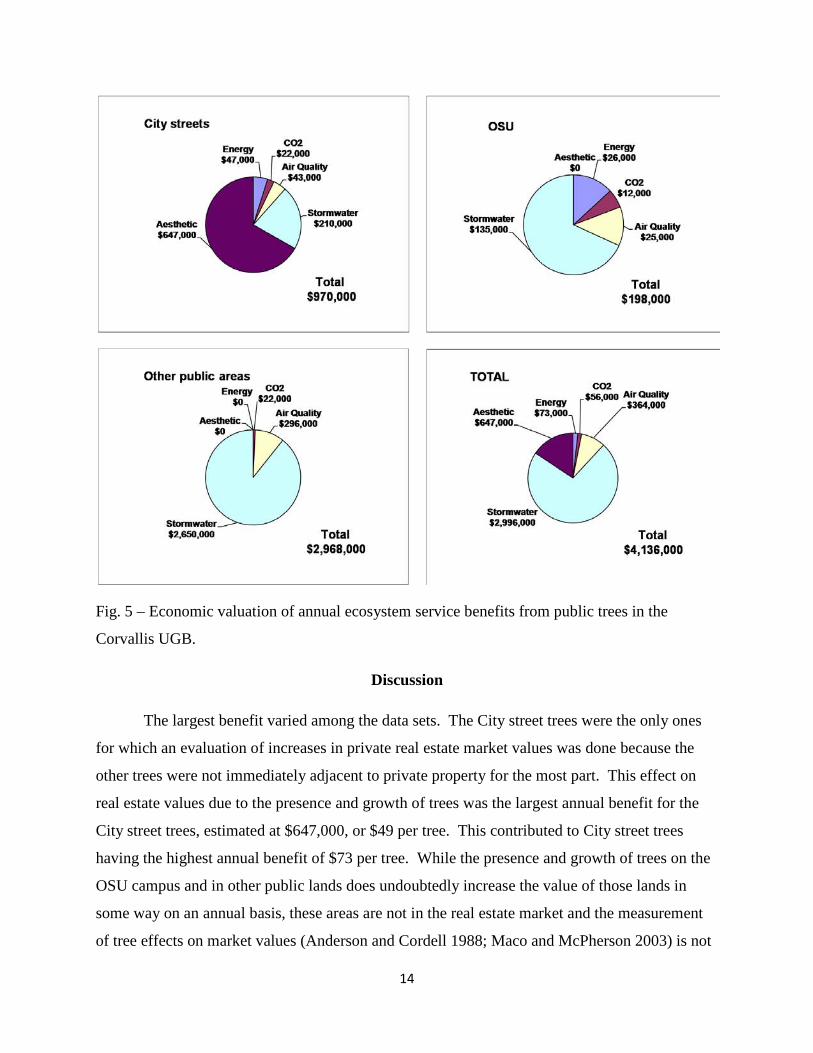
stormwater runoff reduction. Fig. 5 summarizes the economic valuation of these annual benefits
in dollars per year.
Fig. 4 – Diameter at breast height (DBH) distribution of OSU and City street tree inventories and
trees sampled from other public areas.
Asset City street trees OSU street trees Other public land trees
Total
# trees 13,252 4,319 420,000 440,000
carbon stored $250,000 $170,000 $1,030,000 $1,450,000
replacement cost $36 million $24 million $390 million $450 million
Table 1 – Number of trees and fixed asset values estimated for public trees in the Corvallis UGB.
13
Annual benefits Units City street
trees
OSU street
trees
Other public
land trees
Total
energy
savings GJ/yr 2,500 1,400 0 3,900
net carbon
sequestration Mg/yr 1,080 600 1,070 2,750
air pollutant
reduction
NO2 Mg/yr 4.8 2.7 8.4 15.9
O3 Mg/yr 0.9 0.6 19.5 21.0
PM10 Mg/yr 0.6 0.4 23.2 24.2
SO2 Mg/yr 0.8 0.4 2.1 3.3
stormwater
runoff reduction m3/yr 29,000 18,000 360,000 410,000
aesthetic
(private realty) $/yr 647,000 0 0 647,000
Table 2 – Annual ecosystem service benefits in the Corvallis UGB. GJ = gigajoule = 1 billion
joules = 278 kilowatt-hours. Mg = megagram = 1 million grams = 2205 pounds. m3 = cubic
meter = 264 gallons.
14
Fig. 5 – Economic valuation of annual ecosystem service benefits from public trees in the
Corvallis UGB.
Discussion
The largest benefit varied among the data sets. The City street trees were the only ones
for which an evaluation of increases in private real estate market values was done because the
other trees were not immediately adjacent to private property for the most part. This effect on
real estate values due to the presence and growth of trees was the largest annual benefit for the
City street trees, estimated at $647,000, or $49 per tree. This contributed to City street trees
having the highest annual benefit of $73 per tree. While the presence and growth of trees on the
OSU campus and in other public lands does undoubtedly increase the value of those lands in
some way on an annual basis, these areas are not in the real estate market and the measurement
of tree effects on market values (Anderson and Cordell 1988; Maco and McPherson 2003) is not
15
strictly applicable. While these annual incremental values were not quantified for this reason,
the replacement value of trees on the OSU campus and other public lands was still considered in
the evaluation of fixed asset values.
Savings due to infrastructural costs from reduced stormwater runoff was the largest
benefit for the OSU trees and other public land trees. The largest single benefit was a
$2,700,000 estimate for stormwater management cost reductions for other public lands, which
was 90% of the total $3,000,000 stormwater reduction estimate. This is approximately the size
of the capital project and annual operating budget for Corvallis stormwater services
(http://www.ci.corvallis.or.us/downloads/fin/FY%2010-
11/Proposed_FY10_11_Budget_Document/Proposed_FY_10_11_Budget_Document.pdf). This
estimate, which is equivalent to $6 per tree, is based on the City of Portland park trees study and
CITYgreen model analysis (Portland Parks & Recreation 2007). In developed urban areas there
is a large proportion of impervious surfaces (e.g., pavement, rooftops) that prevent infiltration of
precipitation and generate stormwater runoff. For both the Portland and Corvallis study areas,
outlying natural areas within the UGB as well as central urban area were included, thus reducing
the proportion of impervious surfaces. Thus the model estimates may reflect more a comparison
of current runoff with many trees and natural areas compared to a more fully developed urban
area.
Annual ecosystem service benefits ranged from $73 per tree for the 13,000+ City street
trees, to $46 per tree for the 4,000+ trees on the OSU main campus, to $7 per tree for the 420,000
trees on other public lands. Overall, this averaged out to $9 per tree for the approximately
440,000 trees in public areas of the Corvallis UGB. Based on the 2010 census figure of 54,462
for Corvallis, the annual benefits come to $75 per capita.
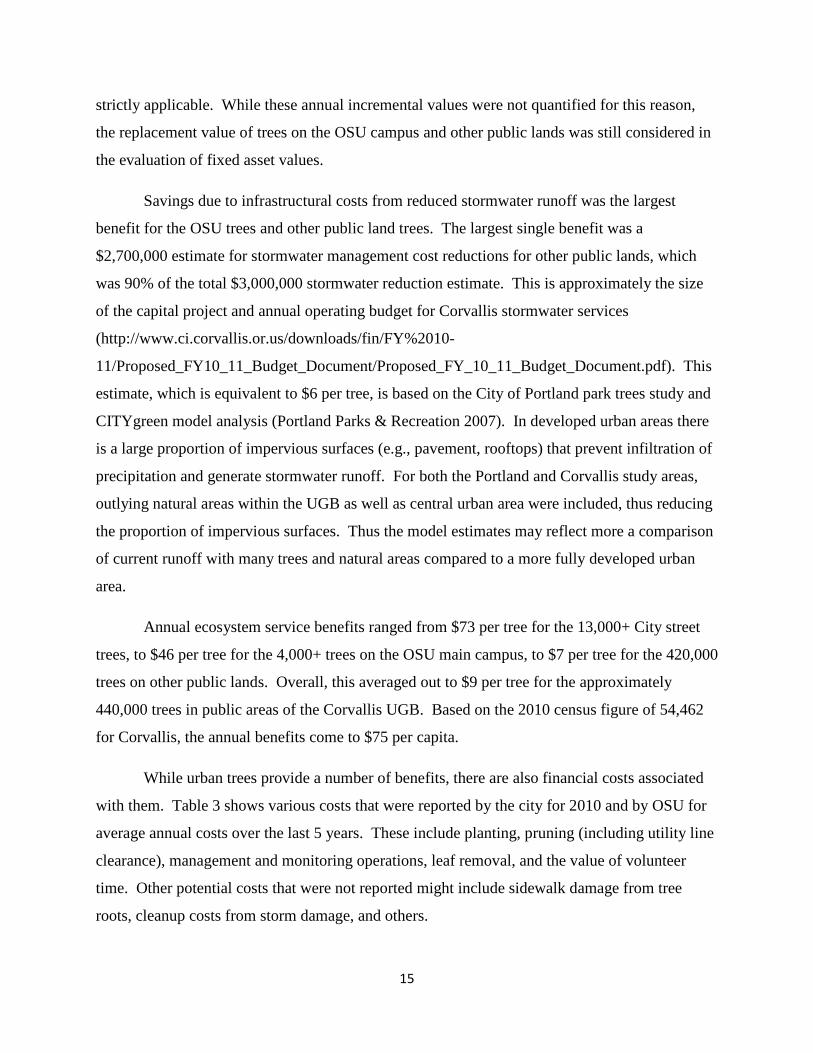
While urban trees provide a number of benefits, there are also financial costs associated
with them. Table 3 shows various costs that were reported by the city for 2010 and by OSU for
average annual costs over the last 5 years. These include planting, pruning (including utility line
clearance), management and monitoring operations, leaf removal, and the value of volunteer
time. Other potential costs that were not reported might include sidewalk damage from tree
roots, cleanup costs from storm damage, and others.
16
Cost category City OSU Total
Planting $18,970 $11,122 $30,092
Urban tree management $159,308 $159,308
Utility line clearance (Pacific Power) $435,700 $435,700
Pruning $36,700 $36,906 $73,606
Removals $44,447 $44,447
Volunteer time $11,609 $11,609
Leaf pickup & disposal $171,860 $19,887 $191,747
Dutch elm disease monitoring & pruning $7,951 $7,951
TOTAL $878,594 $75,866 $954,460
Table 3 – Annual tree-associated costs reported by the city (for 2010) and OSU (average of
previous 5 years).
Conclusion
Corvallis’s urban trees are a diverse and valuable part of the city’s infrastructure.
Although the benefits of urban trees are often unrecognized, they provide a number of valuable
ecosystem services for the public, as enumerated here. Quantifying these services can help
provide a basis for sound urban forest management and minimizing cost to benefit ratios, as well
as providing citizens a better sense of the value of the natural resources where they live.
Acknowledgements
The research described in this report has been funded by the U.S. Environmental Protection
Agency (EPA). It has been subjected to EPA’s peer and administrative review and approved for
publication. Reference herein to any specific commercial products, process, or service by trade
name, trademark, manufacturer, or otherwise, does not necessarily constitute or imply its
endorsement, recommendation, or favoring by the United States Government. The views and
opinions of authors expressed herein do not necessarily state or reflect those of the United States
Government and shall not be used for advertising or product endorsement purposes. We
gratefully acknowledge the assistance of Marjorie Storm and Gail Heine (Dynamac Corp., Inc.
17
under contract EP-D-06-013 with the EPA in collecting the plot data, David Nowak (USDA
Forest Service) for his assistance with designing the sampling for and setting up the i-Tree Eco
model run, as well as Kristin Ramstad (Oregon Dept. of Forestry), Tom Cook (Oregon State
University Horticulture Dept., retired), David Phillips (Corvallis Parks & Recreation Dept.), and
Bob Ozretich (EPA) for constructive reviews of the report.
References
American Forests (2004) CITYgreen for ArcGIS (Arc View for Windows extension). In: www.americanforests.org
Anderson LM, Cordell HK (1988) Influence of trees on residential property values in Athens, Georgia (U.S.A.): a survey of actual sales prices. Landscape and Urban Planning 15:153-164
Chameides WL, Lindsay RW, Richardson J, Kiang CS (1988) The role of biogenic hydrocarbons in urban photochemical smog: Atlanta as a case study. Science 241:1473
Fankhauser S (1994) The social costs of greenhouse gas emissions: an expected value approach. The Energy Journal 15:157-184
Maco SE, McPherson EG (2003) A practical approach to assessing structure, function, and value of street tree populations in small communities. Journal of Arboriculture 29:84-97
McPherson EG (2010) Selecting reference cities for i-Tree Streets. Arboriculture and Urban Forestry 36:230-240
McPherson EG et al. (2002) Western Washington and Oregon Community Tree Guide: Benefits, Costs and Strategic Planning. International Society of Arboriculture - Pacific Northwest Chapter, Silverton, OR. 76 pp.
McPherson EG, Muchnick J (2005) Effects of street tree shade on asphalt concrete pavement performance. Journal of Arboriculture 31:303-310
McPherson EG, Simpson JR (1999) Carbon dioxide reduction through urban forestry: guidelines for professional and volunteer tree planters. Gen. Tech. Rep. PSW-171, USDA Forest Service, Pacific Southwest Research Station, Albany, CA. 237 pp.
Millennium Ecosystem Assessment (2005) Ecosystems and Human Well-Being: Synthesis. Island Press, Washington, D.C.
Nowak DJ, Crane DE (2002) Carbon storage and sequestration by urban trees in the USA. Environmental Pollution 116:381-389
Nowak DJ, Crane DE, Stevens JC (2006) Air pollution removal by urban trees and shrubs in the United States. Urban Forestry & Urban Greening 4:115-123
Nowak DJ, Crane DE, Stevens JC, Hoehn RE, Walton JT, Bond J (2008) A ground-based method of assessing urban forest structure and ecosystem services. Arboriculture and Urban Forestry 34:347-358
Portland Parks & Recreation (2007) Portland's Urban Forest Canopy: Assessment and Public Tree Evaluation. Portland Parks & Recreation, Portland, OR
Scott KI, Simpson JR, McPherson EG (1999) Effects of tree cover on parking lot microclimate and vehicle emissions. Journal of Arboriculture 25:129-142
USDA Forest Service (2011a) i-Tree Eco User's Manual v. 4.1.0. In: http://www.itreetools.org/resources/manuals/i-Tree%20Eco%20Users%20Manual.pdf

18
USDA Forest Service (2011b) i-Tree Streets User's Manual v. 4.0. In: http://www.itreetools.org/resources/reports/Pittsburg%20Municipal%20Forest%20Resource%20Analysis.pdf