assessment of energy consumption in a meat-processing plant—a case study
TRANSCRIPT

ORIGINAL PAPER
Assessment of Energy Consumption in a Meat-ProcessingPlant—a Case Study
Janusz Wojdalski & Bogdan Dróżdż & Józef Grochowicz &
Anna Magryś & Adam Ekielski
Received: 9 March 2012 /Accepted: 29 June 2012# Springer Science+Business Media, LLC 2012
Abstract Meat-processing plants have their specific character-istics due to quantity of raw materials processed, productiontechnology, degree of mechanisation of production and spaceutilization. These characteristics affect variability in consump-tion of energy carriers. This paper presents a case study ofenergy consumption in a small meat processing plant. It isattempting to identify and evaluate key factors which may beuseful in conducting an in-depth analysis of energy consumptionin the meat industry, and so this analysis may be important inselecting the best production techniques available. The results ofthe analysis are of critical importance for the selection of pro-duction technology selection assuming high plant efficiency.
Keywords Meat processing . Energy consumption . Energyefficiency
Abbreviationsa Regression coefficientAc Monthly thermal energy consumption (Ac0BrzQr
w, forQr
w043.1 MJ/kg of fuel)Ae Active electric energy monthly consumption kWh/
monthAt1 Total monthly energy consumption (after conversion
1 kWh012 MJ), in megajoules per monthAt2 Total monthly energy consumption (after conversion
1kWh03,6MJ), in megajoules per monthb Regression coefficient
Bce1 Monthly coal equivalent consumption based on At1,in kilograms CE per month
Bce2 Monthly coal equivalent consumption based on At2,in kilograms CE per month
Brz Monthly real fuel consumption, in kilograms per monthEE Energy efficiency megagrams of product per kilowatt
hour, megagrams of product per gigajoulesn Total number of employees in the plant personP Total capacity of installed electrical equipment, in
kilowattsR2 Determination coefficient (R20r2×100 %) in percentUen Power of installed electrical equipment per employ-
ee, in kilowatts per personQce Calorific value of coal equivalent (29.3076 MJ/kg CE)Qr
w Calorific value of real fuel, in megajoules per kilo-gram of fuel
V1 Volume of the plant production space, in cubic metersV2 Total volume of the plant, in cubic metersWA Aggregate indicator of energy consumption per unit
of physical output (aggregate indicator of specificenergy consumption SECA)
WP Production indicator of energy consumption per unitof physical output (production indicator of specificenergy consumption SECP)
WT Technological indicator of energy consumption perunit of physical output (technological indicator ofspecific energy consumption SECT)
WZ Plant indicator of energy consumption per unit ofphysical output (plant indicator of specific energyconsumption SECZ)
Z Monthly production, in megagrams of product per month
Introduction
Meat processing is one of the branches of the food industry(see Grochowicz and Walczyński 2004; Jekayinfa and
J. Wojdalski : B. Dróżdż :A. Magryś :A. EkielskiDepartment of Production Management and Engineering Facultyof Production Engineering, Warsaw University of Life Sciences,Nowoursynowska 166,02-787 Warsaw, Poland
J. Grochowicz (*)Hotel Management and Catering Technology,Warsaw Academy of Tourism, Food and Hospitality,Chodakowska 50,03-816 Warsaw, Polande-mail: [email protected]
Food Bioprocess TechnolDOI 10.1007/s11947-012-0924-4
Bamgboye 2006; Wang 2008; Klemeš et al. 2008; Neryng etal. 1990; Wilhite 2008) for discussion of some aspects ofenergy consumption in the food industry). The energy con-sumption is one of the key production factors in the industry.It has a great impact on the meat processing plant efficiencyand the natural environment. Consumption of energy car-riers in meat processing plants depends on many factorssuch as, for example, size and structure of output, produc-tion technology used, thermo-physical properties of rawmaterials, mechanisation of production processes and utili-zation of processing capacity (see Cierach et al. 2000; Tkaczet al. 2000;Tkacz and Iwaniak 2001; Markowski et al. 2004;Marcotte et al. 2008; Banach and Żywica 2010; Houska etal. 2003; Li et al. 2010; Campañone et al.2010; Gogate2011; Norton and Sun 2008). Demand for energy carriersis taken into account, among others, in the EU’s IntegratedPollution Prevention and Control Directive which deter-mines a set of rules and requirements for effective protectionof the environment and application of the best availableproduction techniques (WS Atkins Int 1998; EuropeanCommission 2006; Ramirez et al. 2006; IFC—World BankGroup 2007). Moreover, modern methods of energy man-agement in small manufacturing plants require creation ofdatabases which are useful in analysing energy efficiency offood processing and supply of more detailed input data(Swords et al. 2008).
To assess energy efficiency, unit energy consumption indi-cators as well as energy efficiency indicators are most com-monly used. Efficiency is defined as a result of production(industrial) activity and it is expressed as a quotient of theresult obtained to the effort expended. Improvement in energyefficiency may involve a reduction in demand for energycarriers during their transformation, transmission, and finaluse. It may be due to changes in technology which are capableof providing a constant or a higher level of production. Suchimprovements may result in energy conservation, reducingconsumption of natural resources, reducing emissions andlimiting the amount of waste generated at each stage of meatproduction and processing (Ramirez et al. 2006; Pagan et al.2002; Pimentel et al. 2008).
The available sources in literature show that productionenergy consumption is expressed using different units, and thereasons for variation in energy carriers’ consumption in meat-processing plants of various sizes were not fully explained(WS Atkins Int 1998; European Commission 2006; Ramirezet al. 2006; Podfilipski and Żelazny 1985; Singh 1986; Budnyet al. 1987; Fritzson and Berntsson 2006).
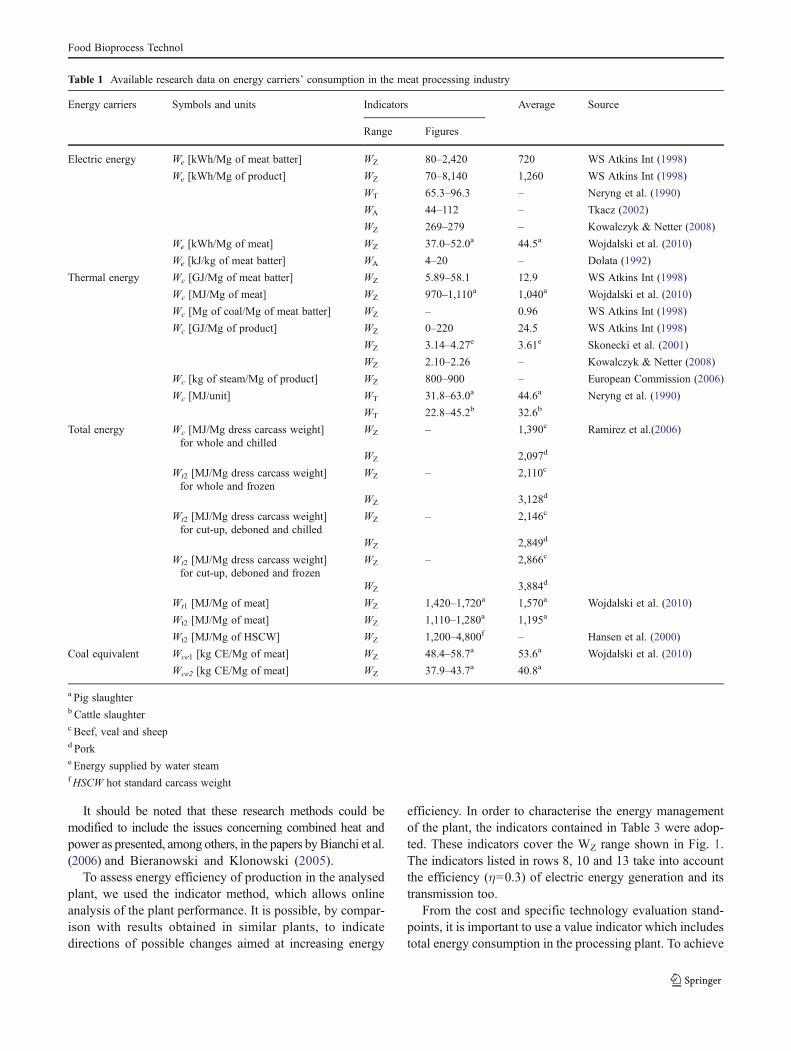
Table 1 presents the figures for energy consumption in themeat processing plants referred to in the literature. Differentranges of unit energy consumption indicators listed in Fig. 1were taken into account. Energy efficiency in meat processingis given by using indicators which are difficult to comparebecause they do not relate to specific conditions found in meat
processing plants. Table 1 does not include data from poultry-processing plants which can be found in Dróżdż (2010);Jekayinfa (2007); Wojdalski et al. (2009).
The aim of this study was to determine the energy con-sumption of a small-sized pork meat processing plant. Thisstudy aims to provide detailed data which could be useful increating models of enterprises of this kind as energy users aswell as for determining the relationship between productionvolume and energy carriers’ consumption which serves toevaluate energy efficiency of production. The aim of thestudy is also correlated with the study (Bunse et al. 2011),where the authors indicate a gap between the needs forresearch reported by manufacturing plants and scientificpublications currently on offer.
Materials and Methods
The research data were collected in a meat processing plant inMazowieckie Voivodship, Poland, employing 73 people intotal, among whom 33 were directly involved in production.
The plant did not slaughter animals. Pre-treated frozencarcasses were purchased from slaughter plants.
Monthly production (Z) during the study period rangedfrom 303 to 699 Mg. The annual plant production profile:meat products 78.4 % and unprocessed meat 21.6 % of totalproduction.
The plant’s production area was 994.28 m2; the totalvolume of the plant was 6,336.6 m3 of which the productionspace accounted for 78.1 %. The combined power of allinstalled electrical equipment in the plant (P) was 180 kW.Breakdown of power by type of electrical equipment in theplant is shown in Table 2.
Table 2 shows that the largest category on the powerbalance sheet was meat cutters and grinders (22 %).
The values of the indicator expressing the degree ofmechanisation of the production operations (Table 4) mea-sured in several 1-month intervals during study ranged from0.257 to 0.594 kW/Mg of processed products. The plantused conventional technologies to produce meat, meat prod-ucts, and raw and melted animal fat.
Meeting the goals of the study required, among others,using a model of the meat processing plant as the end-userof energy carriers (Fig. 1) and applying the plant indicatorsof energy carriers’ consumption, as applied in the study(Wojdalski et al. 2010). These indicators cover all energyreceivers associated with transformation and use of energycarriers in the plant as a whole. The indicators WA, WT andWP are less informative as far as energy consumption of theplant is concerned. A study of these indicators is not withinthe scope this paper. They are included however in Fig. 1because some of them are cited in the literature and reportedin Table 1.
Food Bioprocess Technol
It should be noted that these research methods could bemodified to include the issues concerning combined heat andpower as presented, among others, in the papers by Bianchi et al.(2006) and Bieranowski and Klonowski (2005).
To assess energy efficiency of production in the analysedplant, we used the indicator method, which allows onlineanalysis of the plant performance. It is possible, by compar-ison with results obtained in similar plants, to indicatedirections of possible changes aimed at increasing energy
efficiency. In order to characterise the energy managementof the plant, the indicators contained in Table 3 were adop-ted. These indicators cover the WZ range shown in Fig. 1.The indicators listed in rows 8, 10 and 13 take into accountthe efficiency (η00.3) of electric energy generation and itstransmission too.
From the cost and specific technology evaluation stand-points, it is important to use a value indicator which includestotal energy consumption in the processing plant. To achieve
Table 1 Available research data on energy carriers’ consumption in the meat processing industry
Energy carriers Symbols and units Indicators Average Source
Range Figures
Electric energy We [kWh/Mg of meat batter] WZ 80–2,420 720 WS Atkins Int (1998)
We [kWh/Mg of product] WZ 70–8,140 1,260 WS Atkins Int (1998)
WT 65.3–96.3 – Neryng et al. (1990)
WA 44–112 – Tkacz (2002)
WZ 269–279 – Kowalczyk & Netter (2008)
We [kWh/Mg of meat] WZ 37.0–52.0a 44.5a Wojdalski et al. (2010)
We [kJ/kg of meat batter] WA 4–20 – Dolata (1992)
Thermal energy Wc [GJ/Mg of meat batter] WZ 5.89–58.1 12.9 WS Atkins Int (1998)
Wc [MJ/Mg of meat] WZ 970–1,110a 1,040a Wojdalski et al. (2010)
Wc [Mg of coal/Mg of meat batter] WZ – 0.96 WS Atkins Int (1998)
Wc [GJ/Mg of product] WZ 0–220 24.5 WS Atkins Int (1998)
WZ 3.14–4.27e 3.61e Skonecki et al. (2001)
WZ 2.10–2.26 – Kowalczyk & Netter (2008)
Wc [kg of steam/Mg of product] WZ 800–900 – European Commission (2006)
Wc [MJ/unit] WT 31.8–63.0a 44.6a Neryng et al. (1990)
WT 22.8–45.2b 32.6b
Total energy Wc [MJ/Mg dress carcass weight]for whole and chilled
WZ – 1,390c Ramirez et al.(2006)
WZ 2,097d
Wt2 [MJ/Mg dress carcass weight]for whole and frozen
WZ – 2,110c
WZ 3,128d
Wt2 [MJ/Mg dress carcass weight]for cut-up, deboned and chilled
WZ – 2,146c
WZ 2,849d
Wt2 [MJ/Mg dress carcass weight]for cut-up, deboned and frozen
WZ – 2,866c
WZ 3,884d
Wt1 [MJ/Mg of meat] WZ 1,420–1,720a 1,570a Wojdalski et al. (2010)
Wt2 [MJ/Mg of meat] WZ 1,110–1,280a 1,195a
Wt2 [MJ/Mg of HSCW] WZ 1,200–4,800f – Hansen et al. (2000)
Coal equivalent Wce1 [kg CE/Mg of meat] WZ 48.4–58.7a 53.6a Wojdalski et al. (2010)
Wce2 [kg CE/Mg of meat] WZ 37.9–43.7a 40.8a
a Pig slaughterb Cattle slaughterc Beef, veal and sheepd Porke Energy supplied by water steamfHSCW hot standard carcass weight
Food Bioprocess Technol

this aim, the unit energy consumption indicators were adop-ted (items 6 and 7 in Table 3).
These indicators (Wt1 and Wt2) were converted into unitenergy consumption of coal equivalent based on Eqs. 8 and9 (Table 3).
Indicators of total energy consumption (Wt1 and Wt2)were also converted into energy obtainable from various
alternative sources using the equations given (see items 10and 11 in Table 3). Thus, obtained results are mainly oftheoretical importance, since the change of energy carrier isassociated with the need to modify the energy conversionsystem in the boiler house. To express the energy efficiencyof meat processing, three sample indicators were applied(see items 12–14, Table 3).
Similar research methodology for analysis of the en-ergy consumption in agro-food plants is presented in thecited literature (Wojdalski and Dróżdż 2006; Kaleta andWojdalski 2008).
It is assumed that the monthly production volume (Z)has an impact on demand for energy carriers in theprocessing plant. Previous studies have shown that thisfactor has the greatest relevance because of environmen-tal impact assessment of meat processing plants anddetermination of the best production techniques avail-able (WS Atkins Int 1998; European Commission 2006;IFC—World Bank Group 2007; Wojdalski et al. 2010;Simpson and Kubicki 1998).
Rec
eive
rs c
old
(col
d st
orag
e)E
lect
ric a
pplia
nces
-el
ectr
ic m
otor
s, H
eatin
gR
ecei
vers
, ste
am, h
ot w
ater
, was
hing
, th
erm
al tr
eatm
ent o
f mea
t pro
duct
s
Handling raw
Cutting half-carcasses
Curing (injections)
Improve vividness
Shredding
Stuffing
Steaming and Cooking
Smoking
Cutting products
Packing
Storage devices
Washing machines and
packaging
Meat products for distribution
(Z)
Production of water vapor (steam
generator) and hot water
Preparation of refrigeration
(Ammonia compressor) and flakes ice
Water for process and manufacturing operations and for washing
Replenishment of water losses
water from the
municipal
p
T
Z
A
Fig. 1 Material and energy flows in the analysed plant
Table 2 Breakdown of power by type of electrical equipment
Item Equipment Power installed [kW]
1 Cutters and grinders 40.0
2 Smoke houses, cookers 28.0
3 Cooling machine and ice generator 10.0
4 Electrical boilers 7.0
5 Tumbler 5.5
6 Plant lighting 9.0
7 Other devices up to 5 kW 80.5
8 Total 180.0
Food Bioprocess Technol

In order to determine the impact of meat production (Z)on the actual energy carriers’ consumption (Y), Eq. (1) wasapplied:
Y ¼ bþ aZ ð1Þ
where Y is the energy carriers’ consumption (the dependentvariable, e.g., We, Wt1) and Z is the mass of meat processing(the explanatory variable).
Assumption of border conditions:
aZ ≥ b ð2Þ
and
Z > 0 ð3Þ
using the obtained regression equations with the borderconditions met can partly explain this issue in the analysedmeat-processing plant.
The use of regression equations to characterise energyconsumption in food plants in different seasons is shown indetail in Muller et al. (2007) and Wojdalski and Dróżdż(2006). The methodology for determining energy consump-tion of production processes presented by Jekayinfa andBambgboye (2006) may also be found of use in meat-processing plants.
Results and Discussion
Table 4 shows the ranges of operational and organizationalindicators of the analysed plant.
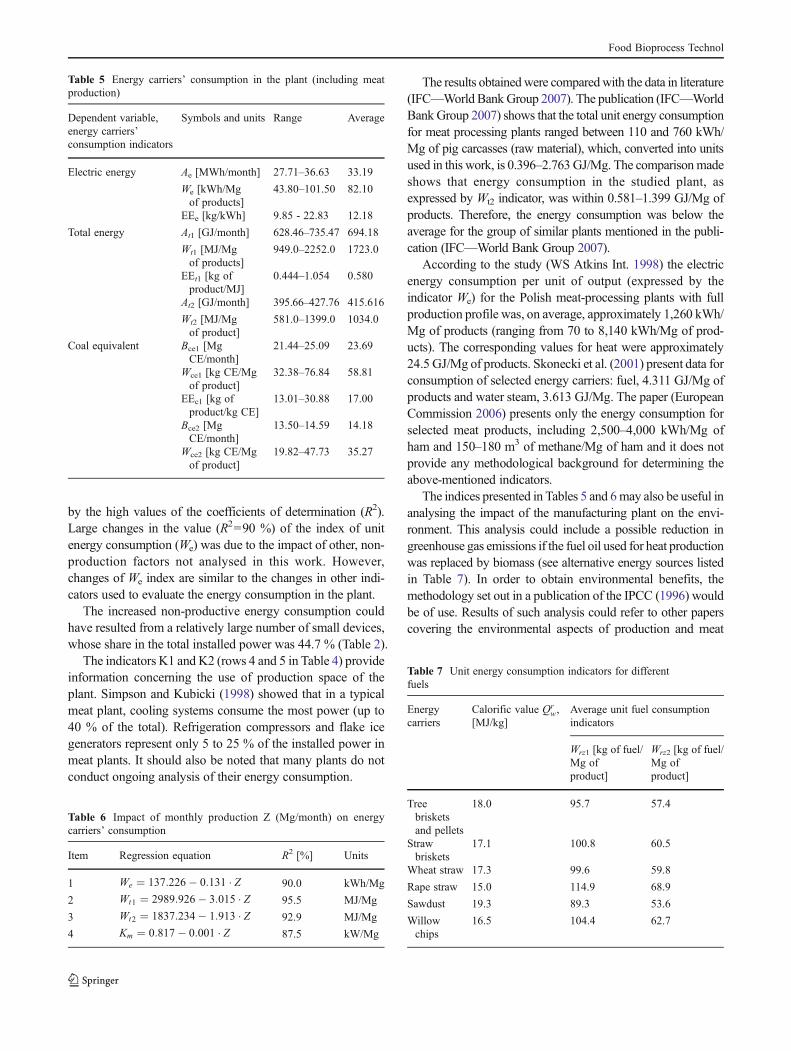
Table 5 shows variability ranges of the plant energyconsumption by type of energy carrier.
Using statistical analysis of the collected data we obtainedlinear regression equations (Table 6) expressing variability inenergy consumption. Calculations were performed using theSTATISTICA Data Miner + QC Polish v. 9.1.
The resulting regression equations (Table 6) describe thefluctuation of the analysed indicators very well, as evidenced
Table 3 Indicators used tocharacterise meat processingplant
Item Description Formula Units
1 Volume of plant production space per 1 Mgof meat products processed in a month
K1 ¼ V1Z m3/Mg
2 Total plant volume per 1 Mg of meatproducts processed in a month
K2 ¼ V2Z m3/Mg
3 Power of installed electrical equipment per 1Mg of processed products for a month period
Km ¼ PZ kW/Mg
4 Monthly production per plant employee Kp ¼ Zn Mg/person
5 Electric energy consumption indicator per 1Mg of meat products
We ¼ AeZ kW h/Mg
6 Total unit energy consumption indicator(conversion 1 kWh012 MJ)
Wt1 ¼ At1Z ¼ 12�AeþBrz�Qr
wZ MJ/Mg of product
7 Total unit energy consumption indicator(conversion 1 kWh03.6 MJ)
Wt2 ¼ At2Z ¼ 3:6�AeþBrz�Qr
wZ MJ/Mg of product
8 Unit energy consumption - coal equivalent(conversion 1 kWh012 MJ)
Wce1 ¼ Wt1Qce
kg CE/Mg of product
9 Unit energy consumption - coal equivalent(conversion 1 kW⋅h03.6 MJ)
Wce2 ¼ Wt2Qce
kg CE/Mg of product
10 Total unit energy consumption - real fuel(conversion 1 kWh012 MJ)
Wrz1 ¼ Wt1Qr
wkg of fuel/Mgof product
11 Total unit energy consumption - real fuel(conversion 1 kW⋅h03.6 MJ)
Wrz2 ¼ Wt2Qr
wkg of fuel/Mgof product
12 Energy efficiency indicator - electricity EEe ¼ ZAe
Mg of product/kWh
13 Energy efficiency indicator - total energy EEt1 ¼ ZAt1
Mg of product/MJ
14 Energy efficiency indicator - coal equivalent EEce1 ¼ ZBce1
Mg of product/kg CE
Table 4 Operational and organizational indicators of the plant
Item Indicator Units Range
Minimum Maximum
1 Uen kW/person 2.46 (average value)
2 Km kW/Mg 0.258 0.629
3 Kp Mg/person 4.15 9.58
4 K1 m3 of volumeof the plant’sproductionspace/Mg
7.08 16.33
5 K2 m3 of totalvolume ofthe plant/Mg
9.06 20.91
Food Bioprocess Technol
by the high values of the coefficients of determination (R2).Large changes in the value (R2090 %) of the index of unitenergy consumption (We) was due to the impact of other, non-production factors not analysed in this work. However,changes of We index are similar to the changes in other indi-cators used to evaluate the energy consumption in the plant.
The increased non-productive energy consumption couldhave resulted from a relatively large number of small devices,whose share in the total installed power was 44.7 % (Table 2).
The indicators K1 and K2 (rows 4 and 5 in Table 4) provideinformation concerning the use of production space of theplant. Simpson and Kubicki (1998) showed that in a typicalmeat plant, cooling systems consume the most power (up to40 % of the total). Refrigeration compressors and flake icegenerators represent only 5 to 25 % of the installed power inmeat plants. It should also be noted that many plants do notconduct ongoing analysis of their energy consumption.
The results obtainedwere comparedwith the data in literature(IFC—World BankGroup 2007). The publication (IFC—WorldBank Group 2007) shows that the total unit energy consumptionfor meat processing plants ranged between 110 and 760 kWh/Mg of pig carcasses (raw material), which, converted into unitsused in this work, is 0.396–2.763GJ/Mg. The comparisonmadeshows that energy consumption in the studied plant, asexpressed by Wt2 indicator, was within 0.581–1.399 GJ/Mg ofproducts. Therefore, the energy consumption was below theaverage for the group of similar plants mentioned in the publi-cation (IFC—World Bank Group 2007).
According to the study (WS Atkins Int. 1998) the electricenergy consumption per unit of output (expressed by theindicator We) for the Polish meat-processing plants with fullproduction profile was, on average, approximately 1,260 kWh/Mg of products (ranging from 70 to 8,140 kWh/Mg of prod-ucts). The corresponding values for heat were approximately24.5 GJ/Mg of products. Skonecki et al. (2001) present data forconsumption of selected energy carriers: fuel, 4.311 GJ/Mg ofproducts and water steam, 3.613 GJ/Mg. The paper (EuropeanCommission 2006) presents only the energy consumption forselected meat products, including 2,500–4,000 kWh/Mg ofham and 150–180 m3 of methane/Mg of ham and it does notprovide any methodological background for determining theabove-mentioned indicators.
The indices presented in Tables 5 and 6may also be useful inanalysing the impact of the manufacturing plant on the envi-ronment. This analysis could include a possible reduction ingreenhouse gas emissions if the fuel oil used for heat productionwas replaced by biomass (see alternative energy sources listedin Table 7). In order to obtain environmental benefits, themethodology set out in a publication of the IPCC (1996) wouldbe of use. Results of such analysis could refer to other paperscovering the environmental aspects of production and meat
Table 5 Energy carriers’ consumption in the plant (including meatproduction)
Dependent variable,energy carriers’consumption indicators
Symbols and units Range Average
Electric energy Ae [MWh/month] 27.71–36.63 33.19
We [kWh/Mgof products]
43.80–101.50 82.10
EEe [kg/kWh] 9.85 - 22.83 12.18
Total energy At1 [GJ/month] 628.46–735.47 694.18
Wt1 [MJ/Mgof products]
949.0–2252.0 1723.0
EEt1 [kg ofproduct/MJ]
0.444–1.054 0.580
At2 [GJ/month] 395.66–427.76 415.616
Wt2 [MJ/Mgof product]
581.0–1399.0 1034.0
Coal equivalent Bce1 [MgCE/month]
21.44–25.09 23.69
Wce1 [kg CE/Mgof product]
32.38–76.84 58.81
EEc1 [kg ofproduct/kg CE]
13.01–30.88 17.00
Bce2 [MgCE/month]
13.50–14.59 14.18
Wce2 [kg CE/Mgof product]
19.82–47.73 35.27
Table 6 Impact of monthly production Z (Mg/month) on energycarriers’ consumption
Item Regression equation R2 [%] Units
1 We ¼ 137:226� 0:131 � Z 90.0 kWh/Mg
2 Wt1 ¼ 2989:926� 3:015 � Z 95.5 MJ/Mg
3 Wt2 ¼ 1837:234� 1:913 � Z 92.9 MJ/Mg
4 Km ¼ 0:817� 0:001 � Z 87.5 kW/Mg
Table 7 Unit energy consumption indicators for differentfuels
Energycarriers
Calorific value Qrw,
[MJ/kg]Average unit fuel consumptionindicators
Wrz1 [kg of fuel/Mg ofproduct]
Wrz2 [kg of fuel/Mg ofproduct]
Treebrisketsand pellets
18.0 95.7 57.4
Strawbriskets
17.1 100.8 60.5
Wheat straw 17.3 99.6 59.8
Rape straw 15.0 114.9 68.9
Sawdust 19.3 89.3 53.6
Willowchips
16.5 104.4 62.7
Food Bioprocess Technol
processing (Alcázar-Ortega et al. 2012; Burke et al. 2009;James and James 2010; Nielsen et al. 2008; Roy et al. 2012).
In Poland, electricity production is mainly based on en-ergy from coal. Therefore, any change in unit energy con-sumption affects the amount of CO2 emissions. Thermalenergy in the analysed plant was obtained from combustionof liquid fuels.
Using the indicators Wt1 and Wt2 and taking into accountthe calorific values of different fuels referred to in literature(Niedziółka and Zuchniarz 2006). Table 7 shows the con-sumption of different energy carriers (real fuel). For thepurpose of calculations, the calorific values, Qr
w areexpressed in megagrams per kilogram of real fuel.
Selected figures contained in Table 7 may be used in theabove-mentioned research opportunity for analysing possi-bilities of replacing fossil fuels by alternative sources.
The Wrz1 index expresses the average unit demand for agiven energy carrier if it fully replaced the primary energyused to produce electric power supplied to the meat plantand heat energy consumed in this plant. The Wrz2 index hasa narrower range and indicates the average unit demand foran energy carrier equivalent only to the energy consumed inthe meat plant At2.
The results presented here may be useful in improvingenergy management by determining the volume of produc-tion at which the indicators We, Wt1 and Wt2 achieve theirlowest values. Moreover, they can be used for comparisonwith those for other meat processing plants in terms of thespecific features arising from production technology, ap-plied research methods and applied technologies such asheat recovery (Fritzson and Berntsson 2006; Kowalczykand Netter 2008; Simpson and Kubicki 1998). Benchmark-ing can be used to draw conclusions about possible changesin unit energy consumption in the plant.
Conclusions
The studied meat processing plant was characterised by lowvalues of unit energy carriers’ consumption indicators whencompared with the literature on plants with a similar profileand processing technology and may be considered as a goodmodel for other similar plants (no slaughter operations,annual production of app. 5,000 Mg of meat products).
The energy consumption of the plants included in Table 1is 1.5–5 times higher than in the analysed plant. It has beenshown in the tested plant that production volume is a fun-damental factor conditioning the thermal and electric energyconsumption. This study shows the usefulness of introduc-ing active monitoring of energy carriers’ consumption asone of the best energy management techniques when used inline with existing volumes of production. The regressionequations obtained allow determining the monthly production
volume at which the specific energy consumption indicatorsare the lowest.
The results contained in the present study may also beuseful for verifying environmental standards. Since theobtained results relate to the specific conditions of produc-tion and the specific level of utilization of installed electricalequipment, they may be of use in estimating productioncosts and air emissions in comparable processing plants. Itwas the aim of this paper to present a methodology which,due to its comprehensiveness, has a potential to be used inbenchmarking procedures allowing for a more detailed com-parison of plants as energo-technological systems.
Further research should lead to answering the questionwhat is the optimal energy consumption for a specific typeof meat plant when taking into account its utilization of theinstalled power, production area and the number of employ-ees. In addition, studies should include the issues of effi-ciency of energy transformation and energy consumption inthe largest groups of production equipment using the WA,WT and WP indices defined in this paper. Research may alsoinclude the importance of water as a heat carrier.
Acknowledgments The authors express their gratitude to Mr. AndrzejKubiszyn for editing and proofreading of this paper. Special thanks go tothe reviewers of this paper. Their input led to improvement in thepresentation of this study and provided some useful guidelines for ourfuture publications.
References
Alcázar-Ortega, M., Álvarez-Bel, C., Escrivá-Escrivá, G., & Domijan,A. (2012). Evaluation and assessment of demand response poten-tial applied to the meat industry. Applied Energy, 92, 84–91.
Banach, J., & Żywica, R. (2010). The effect of electrical stimulationand freezing on electrical conductivity of beef trimmed at varioustimes after slaughter. Journal of Food Engineering, 100, 119–124.
Bianchi, M., Cherubini, F., De Pascale, A., Peretto, A., & Elmegaard,B. (2006). Cogeneration from poultry industry wastes: indirectlyfired gas turbine application. Energy, 31, 1417–1436.
Bieranowski, J., & Klonowski, A. (2005). The model of an associatedenergy source in food processing industry (in Polish: Modelsystemu skojarzonego źródła energii cieplnej w zakładzie prze-mysłu rolno-spożywczego). Inżynieria Rolnicza, 6, 33–40.
Budny, J., Piechocki, J., & Piskunowicz, W. (1987). Power consump-tion during process of cooling pork and beef meat (in Polish:Energochłonność wychładzania półtusz wołowych i wieprzo-wych). Chłodnictwo, 10, 20–22.
Bunse, K., Vodicka, M., Schönsleben, P., Brülhart, M., & Ernst, F. O.(2011). Integrating energy efficiency performance in productionmanagement—gap analysis between industrial needs and scien-tific literature. Journal of Cleaner Production, 19, 667–679.
Burke, M., Oleson, K., McCullough, E., & Gaskell, J. (2009). A globalmodel tracking water, nitrogen, and land inputs and virtual trans-fers from industrialized meat production and trade. EnvironmentalModeling and Assessment, 2(14), 179–193.
Campañone, A., Analía, L., Zaritzky, A., & Noemi, E. (2010). Math-ematical modeling and simulation of microwave thawing of large
Food Bioprocess Technol

solid foods under different operating conditions. Food and Bio-process Technology, 6, 813–825.
Cierach, M., Białobrzewski, I., & Markowski, M. (2000). Investigationof meat products heating and cooling processes (in Polish: Bada-nia procesów ogrzewania i chłodzenia przetworów mięsnych).Inżynieria Rolnicza., 5(16), 39–46.
Dolata, W. (1992). The influence of some technical parameters ofcutter on meat batters and sausages quality and energy consump-tion during comminution (in Polish: Wpływ niektórych parame-trów technicznych kutra na kształtowanie jakości farszów i wędlinoraz energochłonności procesu kutrowania). Roczniki AkademiiRolniczej w Poznaniu, Zeszyt, 225, 65–85.
Dróżdż, B. (2010). Energy and water consumption in poultry plants (inPolish: Zużycie energii i wody w zakładach przetwórstwa dro-biarskiego). Technological Progress in Food Processing (in Pol-ish: Postępy Techniki Przetwórstwa Spożywczego) (1st ed., pp.41–46). Warszawa: Wyższa Szkoła Menedżerska.
European Commission. (2006). Integrated pollution prevention andcontrol. Reference Document on Best Available Techniques inthe Food, Drink and Milk Industries, 149–151, 155.
Fritzson, A., & Berntsson, Th. (2006). Energy efficiency in the slaugh-ter and meat processing industry—opportunities for improve-ments in future energy markets. Journal of Food Engineering,77, 792–802.
Gogate, P. R. (2011). Hydrodynamic cavitation for food and waterprocessing. Food and Bioprocess Technology, 6, 996–1011.
Grochowicz J & Walczyński S (2004): The Effect of Some Techno-logical Factors on the Energy Consumption of Energy at MixingGranular Materials. TEKA Commission of Motorization andPower Industry in Agriculture. Polish Academy of SciencesBranch in Lublin. Lublin, 2004, vol. IV, 70–75.
Hansen, P. I., Christiansen, K., & Hummelmose, B. (2000). Cleanerproduction assessment in meat processing. Denmark: COWI.
Houska, M., Sun, D.-W., Landfeld, A., & Zhang, Z. (2003). Experi-mental study of vacuum cooling of cooked beef in soup. Journalof Food Engineering, 59, 105–110.
IFC—World Bank Group (2007) Environmental, Health, and SafetyGuidelines for Meat Processing, April 30, 7–24
IPCC (1996) Revised 1996 IPCC Guidelines for National GreenhouseGas Inventories.
James, S. J., & James, C. (2010). The food cold-chain and climatechange. Food Research International, 7, 43,1944–43,1956.
Jekayinfa, S. O. (2007). Energetic analysis of poultry processing oper-ations. Leonardo Journal of Sciences, 10, 77–92.
Jekayinfa, S. O., & Bamgboye, A. I. (2006). Estimating energy re-quirement in cashew (Anacardium occidentale L.) nut processingoperations. Energy, 31, 1305–1320.
Kaleta A., Wojdalski J. (ed.). 2008. Food processing. Selected issues—engineering and energy production (in Polish: Przetwórstworolno-spożywcze. Wybrane zagadnienia inżynieryjno – produk-cyjne i energetyczne). Wydawnictwo SGGW. Warszawa, 182-192.
Klemeš J., Smith R., Kim J-K., 2008. Handbook of water and energymanagement in food processing. CRC–Cambridge Woodhead.
Kowalczyk, R., & Netter, J. (2008). A new look at the energetic factorsconsumption in food industry (in Polish: Nowe spojrzenie na zuży-cie czynników energetycznych w zakładzie przemysłu spożywc-zego. Postępy Techniki Przetwórstwa Spożywczego, 1, 45–47.
Li, C. B., Zhou, G. H., & Xu, X. L. (2010). Dynamical changes of beefintramuscular connective tissue and muscle fiber during heatingand their effects on beef shear force. Food and Bioprocess Tech-nology, 3, 521–527.
Marcotte, M., Taherian, A. R., & Karimi, Y. (2008). Thermophysicalproperties of processed meat and poultry products. Journal ofFood Engineering, 88, 315–322.
Markowski, M., Białobrzewski, I., Cierach, M., & Paulo, M. (2004).Determination of thermal diffusivity of Lyoner type sausagesduring water bath cooking and cooling. Journal of Food Engi-neering, 65, 591–598.
Muller, D. C. A., Marechal, F. M. A., Wolewinski, T., & Roux, P. J.(2007). An energy management method for the food industry.Applied Thermal Engineering, 27, 2677–2686.
Neryng A, Wojdalski J, Budny J, Krasowski E (1990) Energy andwater in agro-food industry. WNT, Warszawa, 99-103, 184-189.(in Polish: Energia i woda w przemyśle rolno-spożywczym);
Niedziółka, I., & Zuchniarz, A. (2006). An energetic analysis ofselected plant biomass samples (in Polish: Analiza energetycznawybranych rodzajów biomasy pochodzenia roślinnego) (pp. 232–237). Lublin: MOTROL, Motoryzacja i Energetyka Rolnictwa.Tom 8A.
Nielsen, P. H., Dalgaard, R., Korsbak, A., & Pettersson, D. (2008).Environmental assessment of digestibility improvement factorsapplied in animal production. The International Journal of LifeCycle Assessment, 13, 49–56.
Norton, T., & Sun, D.-W. (2008). Recent advances in the use of highpressure as an effective processing technique in the food industry.Food and Bioprocess Technology, 1(1), 2–34.
Pagan R, Renouf M, Prasad P (2002) Eco-efficiency manual for meatprocessing. Meat and Livestock Australia Ltd.
Pimentel, D., Williamson, S., Alexander, C. E., Gonzalez-Pagan, O.,Kontak, C., & Mulkey, S. E. (2008). Reducing energy inputs inthe US food system. Human Ecology, 36, 459–471.
Podfilipski, J., & Żelazny, J. (1985). Power consumption economyapplied to technology in meat processing factories—selectedproblems (in Polish: Gospodarka energetyczna w procesach tech-nologicznych zakładów mięsnych—wybrane zagadnienia).Chłodnictwo, 5, 14–18.
Ramirez, C. A., Patel, M., & Blok, K. (2006). How much energy toprocess one pound of meat? A comparison of energy use andspecific energy consumption in the meat industry of four Europe-an countries. Energy, 31, 2047–2063.
Roy, P., Orikasa, T., Thammawong, M., Nakamura, N., Xu, Q., &Shiina, T. (2012). Life cycle of meats: an opportunity to abatethe greenhouse gas emission from meat industry in Japan. Journalof Environmental Management, 1(93), 218–224.
Simpson, A., & Kubicki, M. (1998). Environmental protection in themeat industry (in Polish: Ochrona środowiska w przemyśle mięs-nym) (pp. 42–45). Warszawa: FAPA.
Singh R P (ed.) (1986) Energy accounting of food processing oper-ations (in Energy in Food Processing. Elsevier. Amsterdam26).
Skonecki, S., Laskowski, J., & Szymczak, W. (2001). Analysis of theenergy consumption in meat plant (pp. 326–332). Lublin:MOTROL, Motoryzacja i Energetyka Rolnictwa. Tom IV. inPolish: Analiza zużycia energii w zakładzie mięsnym.
Swords, B., Coyle, E., & Norton, B. (2008). An enterprise energy-information system. Applied Energy, 85, 61–69.
Tkacz, K. (2002). Energy consumption in cuttering of meat raw prod-ucts. Technica Agraria, 1(2), 73–79 (in Polish Energochłonnośćkutrowania surowców mięsnych).
Tkacz, K., & Iwaniak, A. (2001). Electric energy consumption bymanufacturing of selected ready to cook food products. InżynieriaRolnicza, 10, 371–378. in Polish: Energochłonność elektrycznaprodukcji wybranych wyrobów garmażeryjnych.
Food Bioprocess Technol

Tkacz, K., Budny, J., & Borowski, J. (2000). Energetic characteristicsof beef steak thermal processing. Inżynieria Rolnicza, 5(16), 241–248. in Polish: Charakterystyka energetyczna obróbki cieplnejmięsa wołowego.
Wang, L. J. (ed) 2008. Energy efficiency and management in food process-ing facilities. CRC Press, Boca Raton, FL, USA. ISBN: 1420063383.
Wilhite, H. (2008). New thinking on the agentive relationship betweenend-use technologies and energy-using practices. Energy Efficien-cy, 2, 121–130.
Wojdalski, J., & Dróżdż, B. (2006). A rudimental analysis of energyconsumption during production at agri-food industry work. (inPolish: Podstawy analizy energochłonności produkcji zakładówprzemysłu rolno-spożywczego) (pp. 294–304). Lublin: MOTROL,Motoryzacja i Energetyka Rolnictwa. Tom 8A.
Wojdalski J, Dróżdż B, Powęzka A (2009) Effectiveness of energyand water consumption in a poultry processing plant. TEKACommission of Motorization and Power Industry in Agriculture.Polish Academy of Sciences Branch in Lublin. Lublin, 2009, vol.IX, 395-402.
Wojdalski J, Dróżdż B, Lipiński P (2010) Energy consumption effi-ciency in a small meat processing plant. Współczesne zagadnieniarozwoju sektora energetycznego i rolniczego. SGGW, 110-121 (inPolish: Efektywność zużycia energii w małym zakładzie przet-wórstwa mięsnego).
WS Atkins Int. (1998). Environmental protection in the agro-foodindustry. Environmental Standards (in Polish: Ochrona środo-wiska w przemyśle rolno-spożywczym. Standardy środowiskowe)(31st ed.). Warszawa: FAPA. 78, 87, 106-107.
Food Bioprocess Technol