assessment of energy production in the deep carbonate
TRANSCRIPT
Research ArticleAssessment of Energy Production in the Deep CarbonateGeothermal Reservoir byWellbore-Reservoir Integrated Fluid andHeat Transport Modeling
Fengyu Li ,1 Tianfu Xu ,1 Shengtao Li,1,2 Bo Feng ,1 Xiaofeng Jia,2 Guanhong Feng,1
Huixing Zhu,1 and Zhenjiao Jiang 1
1Key Laboratory of Groundwater Resources and Environment, Ministry of Education, College of New Energy and Environment,Jilin University, Changchun 130021, China2Center for Hydrogeology and Environmental Geology Survey, China Geological Survey, Baoding 071051, China
Correspondence should be addressed to Bo Feng; [email protected]
Received 25 May 2018; Revised 6 October 2018; Accepted 31 October 2018; Published 7 February 2019
Guest Editor: Philippe Calcagno
Copyright © 2019 Fengyu Li et al. This is an open access article distributed under the Creative Commons AttributionLicense, which permits unrestricted use, distribution, and reproduction in any medium, provided the original work isproperly cited.
Geothermal energy is clean and independent to the weather and seasonal changes. In China, the huge demanding of cleanenergy requires the geothermal energy exploitation in the reservoir with depth larger than 1000m. Before the exploitation, itis necessary to estimate the potential geothermal energy production from deep reservoirs by numerical modeling, whichprovides an efficient tool for testing alternative scenarios of exploitation. We here numerically assess the energy productionin a liquid-dominated middle-temperature geothermal reservoir in the city of Tianjin, China, where the heat and fluidtransport in the heterogeneous reservoir and deep wellbores are calculated. It is concluded that the optimalinjection/production rate of the typical geothermal doublet well system is 450m3/h, with the distance between geothermaldoublet wells of 850m. The outflow temperature and heat extraction rate can reach 112°C and 43.5MW, respectively.Through decreasing injection/production rate lower than 450m3/h and optimizing layout of the injection well andproduction well (avoiding the high permeability zone at the interwell sector), the risk of heat breakthrough can be reduced.If the low permeability zone in the reservoir is around injection well, it usually leads to abnormal high wellhead pressure,which may be solved by stimulation technique to realize stable operation. The methodology employed in this paper can be areference for a double-well exploitation project with similar conditions.
1. Introduction
In China, coal burning contributes 70% of CO2 emissions,80% of SO2 emissions, and 70% of soot emissions [1], whichcaused serious environmental pollution. It is estimated thatin northern China, there are 42.3 days on average every yearsuffering from smog from 1999 to 2013 [2] with mean PM2.5concentration reaching 93μg/m3 [3]. It is of critical impor-tance to increase the use of clean energy and reduce the pro-portion of fossil fuels in total energy consumption. As one ofthe most important renewable and clean energy, geothermal
energy is expected to occupy 3% of total energy utilization inChina by 2030, which will be mainly used for heat supply inwinter and electrical power generation as well [4].
Most of the geothermal resources in China are of middleand low temperature. Among 2700 geothermal wells andthermal springs, only 700 spots have the temperature higherthan 80°C [4]. To obtain the high-temperature geothermalresource, it is desirable to explore and exploit the geothermalenergy in the reservoir with the depth more than 1000m. InTianjin, located in Northern China Plain, the target geother-mal reservoir in the next five years moves to Wumishan
HindawiGeofluidsVolume 2019, Article ID 8573182, 18 pageshttps://doi.org/10.1155/2019/8573182

Formation, which is buried in a depth of 1600–2000m withthe temperature of 96–108°C. Sixteen wells have been drilledinto this geothermal reservoir. Due to the large-scale seriousproblem of groundwater level drop in this region, it isrequired that the geothermal exploitation should be operatedtogether with the water injection, to maintain the water-massbalance [5]. Before the geothermal energy exploitation andcontinuing with further drilling, it is necessary to evaluatethe energy production in this deep geothermal reservoir byfully understanding the coupled processes of fluid and heattransport (HT).
The HT processes relating to the cold water injectioninto the geothermal reservoir environment have been eval-uated by analytical and numerical methods. Gringartenand Sauty [6] developed an analytical model to describethe non-steady-state temperature behavior of productionwells during the reinjection of cold water into aquifer byneglecting the horizontal thermal conduction in the aqui-fer and the confining rocks. The model was then employedto evaluate thermal breakthrough in the geothermal dou-blet system [7] and to describe horizontal conductionand convection in the reservoir and vertical conductionin the confining rock (caprock and bedrock) [8–10]. Non-isothermal heat exchange between fluid in the fracturesand matrix [11] and coupled heat-fluid transport processesin both wellbore and reservoirs were considered as well[12–14]. The analytical solutions offered fast and soundtools to understand the principles of HT processes in thesubsurface. However, most were established based on cer-tain simplifications when compared to the real geothermalsystem, which often has a low accuracy in predicting theheat production from a specific reservoir.
In contrast, the numerical models can address thecomplex conditions in the field, such as irregular bound-ary conditions and heterogeneous distribution of hydrau-lic and thermal parameters. These numerical modelsinclude TOGUH2 and FEFLOW, which can simulatetwo-dimensional [15] and three-dimensional [16] fluidand heat transport in both porous and fractured media.A numerical model developed by Ghassemi and Kumar[17] can simulate HT processes in fractured media, basedon a dual media model, and the finite element methoddeveloped by Aliyu and Chen [18] can simulate HT pro-cesses in the discrete fracture network. For the deep res-ervoirs, the heat and fluid transport processes in the longwellbore significantly affect the prediction of heat produc-tion, which was coupled with the HT processes in thereservoir. Typically, COMSOL can simulate 1D–3Dwellbore-reservoir flow modelling [19], where the fluidflow in the wellbore is described by non-Darcy flow. Fur-thermore, T2WELL was established based on TOUGH2,which can simulate the HT processes in both reservoirand wellbores and considers the heat and fluid exchangebetween wellbore and surrounding rocks [20].
We here employed T2WELL to simulate the HT pro-cesses in a typical geothermal reservoir in Tianjin, wherethe fluid processes in the wellbore are described by 1Dnon-Darcy flow, while in the reservoir 3D fluid and heattransport processes are calculated. We compared the
energy production under 5 scenarios of geothermal exploi-tation in the heterogeneous geothermal reservoir. As aresult, the potential production rate in this geothermalfield is determined.
2. Study Area
2.1. Geological Background. The Shanlingzi GeothermalField in the eastern Tianjin, China, is located in the Panz-huang Uplift, surrounded by the Cangdong Fault, TianjinFault, Hangu Fault, and Haihe Fault (Figure 1(a)). Thereexists, from top to bottom, the Quaternary, Neogene, Qing-baikou, and Jixian Formations (Figure 1(b)). The CangdongFault is a compressional torsional and normal fault dip-ping in South-East direction with an angle of 3° to 48°,which allows the heat transport upward into differentaquifers by advection, forming a series of geothermal res-ervoirs. The Wumishan Formation, in the depth between1665m and 1820m, is the target geothermal reservoir inthis study. The average outflow temperature in the well pen-etrating into this formation can reach 96 to 108°C. The chem-ical analysis for groundwater collected in six wells suggeststhat the groundwater is the type of Cl·HCO3-Na [21].
This geothermal reservoir is composed of carbonaterocks. The downhole logs in well DL-4 and aquifer tests in9 wells yield that the porosity in the reservoir ranges from1.9% to 9.4% and permeability from 1.0× 10⁻¹⁶ m2 to1.25× 10−12 m2 (Table 1). Groundwater flows towards south-west with an average gradient less than 1.9‰.
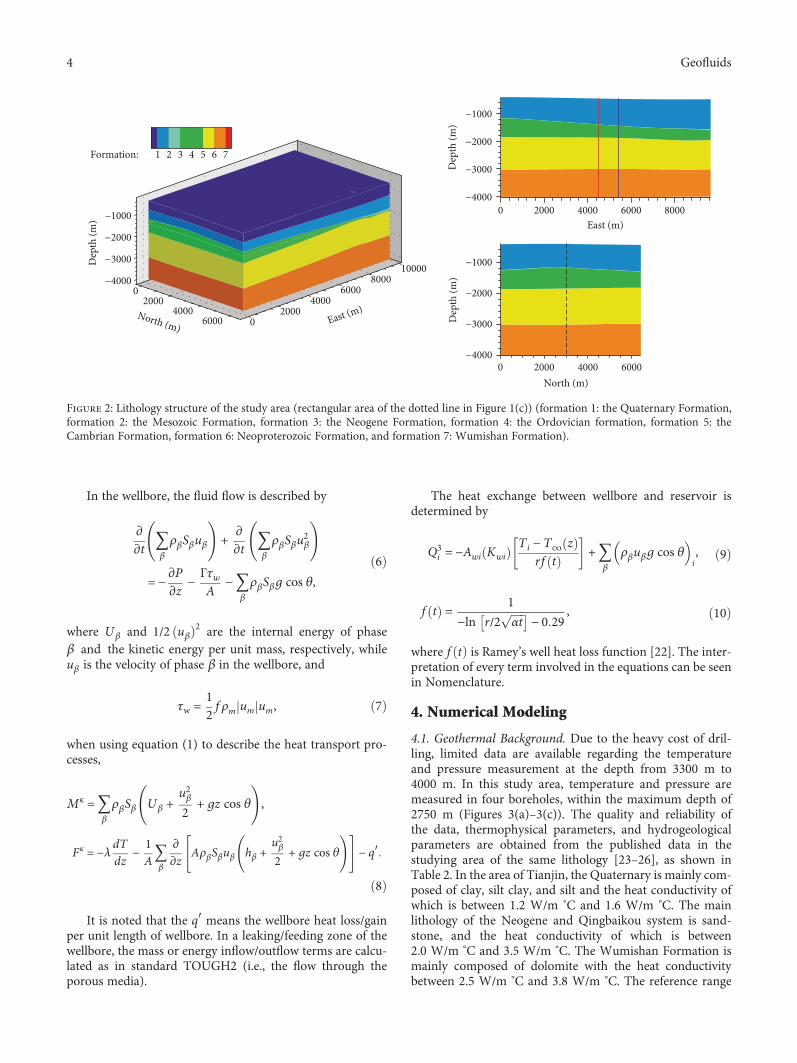
2.2. Model Domain. Following the geological conditions inthe Shanlingzi Geothermal field, we selected an area of48 km2 to investigate the penitential heat production poten-tial based on a double well heat extraction method: one wellfor injection and another for extraction. The maximumdepth of the model reaches 4000 m, corresponding to thebottom of the Wumishan geothermal reservoir. Within thisdepth, there are seven layers of formations and lithology logsin seven deep boreholes (Figures 1(c) and 2) determine theshape of each formation. Each layer is discretized into43456 elements (in the study area of 6418× 9671 m2), andthe area of each element on the X-Y plane is less than100× 100 m2.
3. Governing Equations
TOUGH2-WELL [20] integrated the flow and heat processesin both wellbore and reservoir, which is capable to simulatethe nonisothermal, multiphase, multicomponent flows inthe deep wellbore-reservoir system. In the reservoir, the heatand fluid transport processes are described by a uniform gov-erning equation:
ddt
MκdVn = Fκ ⋅ ndΓn+ qκdVn, 1
where Vn is the element volume bounded by the closed sur-face Γn, Mκ is the mass accumulation term, F denotes massor heat flux, and q denotes sinks and sources.
2 Geofluids

For the fluid flow,
Mκ = φ〠β
ρβSβXκβ, 2
Fκ =〠β
ρβuβXκβ, 3
where uβ in the energy conservation is the Darcy velocity inphase β.
For the heat transport,
Mκ = 1 − φ ρRCRT + φ〠β
ρβSβuβ, 4
Fκ = −λ∇T +〠β
hβρβuβ 5
Table 1: Permeability and porosity measured in 9 wells.
Well number Start buried depth End buried depthThickness of exposedWumishan Formation
Permeability (m2) Porosity (%)
DL-1 1800 2328 528 3.65× 10⁻¹³
5%–6%
DL-2 1798 2100 302 1.0× 10⁻¹²
DL-3 3481 3634 153 2.09× 10⁻¹³
DL-4 — 2122 — 1.25× 10⁻¹²
DL-5 1846 2384 538 4.89× 10⁻¹³
DL-6 — 2533 — 4.88× 10⁻¹³
DL-7 1655 2327 672 3.07× 10⁻¹³
DL-8 — 2373 — 2.77× 10⁻¹³
DL-9 — 2495 — 2.63× 10⁻¹³
DL-4 (well logging data) 1938.7 2314.9 — 1.0× 10⁻¹⁶-4.7× 10⁻¹⁵ 1.9%–9.4%
Jizhong Depression
Hangu FaultFault
Bohai Bay
Cangd
ong F
ault
Cangd
ong F
ault
Huang
hua
Tian
jinTianjinCity
Cangx
ianUpli
ft
Haihe Fault
Depres
sion
Tianjin
Paleogene boundary
Fault
Shanlingzigeothermalfield
Place name
100 20km
0 1 2km
DL-15
DL-1DL-7
TD-01
Zaojiacheng
Beihuaidian
4500 Farm
Shanlingzi
Dongditou
DL-14
DL-13DL-12
DL-10DL-1
DL-16
Chitu village
DL-17DL-18
TD-02
Cangd
ong F
ault
Tianjin
Fault
Yonghe reservoir
Dongli lake
Huang
gang
rese
rvoir
Wumishan geothermal reservoir
Buried fractured structureGeothermal exploration well(uncompleted)Geothermal well(stratigraphic sequence known)Geothermal well(temperature or pressure logging data known)
DL-2DL-3
DL-4DL-6
DL-5
DL-8DL-9
Geothermal well(data of pressure test known)
Domain of 3D geological model
Domain of numerical simulation
Quaternary System (Q)Clay interbeded with siltstoneCenozoic Era
Minghuazhen Formation of Neogene System (Nm)Mainly sandstone interbeded with mudstoneCenozoic Era
Guantao Formation of Neogene System (Ng)Mainly sandstone interbeded with mudstoneCenozoic Era
Qingbaikou system(Qb)Mainly sandstone interbeded with mudstoneNeoproterozoic Era
Wumishan Foramtion of Jixian System (Jxw)Mainly sandstone interbeded with mudstoneMesoproterozoic Era
Silty clay
Clay
Dolomite
Conglomerate
Sandstone
Mudstone
Muddy limestone
520m
1078m
78m114m
2210m2210m
Geothermal field
Inferred fault
(a)
(c)
(b)
Figure 1: (a) Location of the Wumishan geothermal reservoir, Tianjin, China, (b) stratigraphy in the research area, and (c) the position ofexisting boreholes in the model domain.
3Geofluids
In the wellbore, the fluid flow is described by
∂∂t
〠β
ρβSβuβ + ∂∂t
〠β
ρβSβu2β
= −∂P∂z
−ΓτwA
−〠β
ρβSβg cos θ,6
where Uβ and 1/2 uβ2 are the internal energy of phase
β and the kinetic energy per unit mass, respectively, whileuβ is the velocity of phase β in the wellbore, and
τw = 12 f ρm um um, 7
when using equation (1) to describe the heat transport pro-cesses,
Mκ =〠β
ρβSβ Uβ +u2β2 + gz cos θ ,
Fκ = −λdTdz
−1A〠β
∂∂z
AρβSβuβ hβ +u2β2 + gz cos θ − q′
8
It is noted that the q′ means the wellbore heat loss/gainper unit length of wellbore. In a leaking/feeding zone of thewellbore, the mass or energy inflow/outflow terms are calcu-lated as in standard TOUGH2 (i.e., the flow through theporous media).
The heat exchange between wellbore and reservoir isdetermined by
Q3i = −Awi Kwi
Ti − T∞ zrf t
+〠β
ρβuβg cos θi, 9
f t = 1−ln r/2 αt − 0 29
, 10
where f t is Ramey’s well heat loss function [22]. The inter-pretation of every term involved in the equations can be seenin Nomenclature.
4. Numerical Modeling
4.1. Geothermal Background. Due to the heavy cost of dril-ling, limited data are available regarding the temperatureand pressure measurement at the depth from 3300 m to4000 m. In this study area, temperature and pressure aremeasured in four boreholes, within the maximum depth of2750 m (Figures 3(a)–3(c)). The quality and reliability ofthe data, thermophysical parameters, and hydrogeologicalparameters are obtained from the published data in thestudying area of the same lithology [23–26], as shown inTable 2. In the area of Tianjin, the Quaternary is mainly com-posed of clay, silt clay, and silt and the heat conductivity ofwhich is between 1.2 W/m °C and 1.6 W/m °C. The mainlithology of the Neogene and Qingbaikou system is sand-stone, and the heat conductivity of which is between2.0 W/m °C and 3.5 W/m °C. The Wumishan Formation ismainly composed of dolomite with the heat conductivitybetween 2.5 W/m °C and 3.8 W/m °C. The reference range
East (m)
Dep
th (m
)
0 2000 4000 6000 8000−4000
−3000
−2000
−1000
North (m)
02000
40006000 East (m)
02000
40006000
800010000D
epth
(m)
−4000
−3000
−2000
−1000
1 2 3 4 5 6 7Formation:
North (m)
Dep
th (m
)
0 2000 4000 6000−4000
−3000
−2000
−1000
Figure 2: Lithology structure of the study area (rectangular area of the dotted line in Figure 1(c)) (formation 1: the Quaternary Formation,formation 2: the Mesozoic Formation, formation 3: the Neogene Formation, formation 4: the Ordovician formation, formation 5: theCambrian Formation, formation 6: Neoproterozoic Formation, and formation 7: Wumishan Formation).
4 Geofluids

20 40 60 80 100 120Temperature (°C)
−4000
−3500
−3000
−2500
−2000
−1500
−1000
−500
DL-15DL-7DL-4DL-1
Model data(best fitting)Average temperaturedistribution
Dep
th (m
)
(a)
40 60 80 100 120Temperature (°C)
−3500
−3000
−2500
−2000
−1500
−1000
−500
Initial TAverage TN1N2N3
N4N5 (best fitting)N6
Point 1
Point 2
Point 3
Point 4
Point 5
Checkpoint
Dep
th (m
)
(b)
01 02 03 04 0Pressure (MPa)
−4000
−3000
−2000
−1000
Dep
th (m
)
DL-4Model data
(c)
0E + 000 2E + 005 4E + 005 6E + 005 8E + 005 1E + 006Time (year)
120
110
100
90
80
70
60
50
40
Tem
pera
ture
( °C)
Point 1Point 2Point 3
Point 4Point 5
(d)
Figure 3: The temperature (a) and pressure (c) measured in the shallow aquifers extended to the deep geothermal reservoir by a 1D naturalstate model. The steady temperature distribution (b) of cases (N1–N6) with calibrated heat conductivity. Temperature variation with time (d)of 5 points in (b).
5Geofluids

of the above heat conductivity provides the basis for themodel solution.
The rational of using a 1D model to describe the heattransport processes in the natural status is that the geother-mal energy and groundwater in the deep thermal reservoirhave not yet been extensively exploited and the groundwaterflow velocity in the aquifer is extremely low (1–10 m/yr) [27].Thus, it can be assumed that no groundwater flow to drivelateral heat advection in Shanlingzi geothermal field. In addi-tion, according to the downhole temperature logs in fourwells (Figure 3(a)), at the same depth, the temperature in dif-ferent wells is almost the same, which suggest that the tem-perature in the lateral direction reaches a balance, and thereis no heat conduction in the horizontal direction as well.Therefore, only the heat conduction in the vertical directionis simulated here.
The temperature and pressure logging data are collectedabout 1–1.5 months before the exploitation season. Theequilibration time can be at least 6 months, for the heatingperiod in Tianjin is from November 15th to March 15th ofthe following year. The test data can represent the tempera-ture and pressure distribution of the reservoir after thethermal-hydraulic conduction process between water androck matrix is fully balanced under the hydrostatic condition.
4.2. Natural State Model. In order to obtain thermal-physicalparameters of geological layers, a 1D model based on realgeological conditions is established. The cases from N1 toN6 is set up with different heat conductivity, and other prop-erties are the same (summarized in Table 2). The same heatconductivity of 2.5 W/m °C is used in all the layers in themodel of case N1, because it is basically the mean value ofheat conductivity in sandstone and dolomite. In cases N2and N3, the heat conductivity of the Minghuazhen group
and the Quaternary is lowered. The heat conductivity ofWumishan Formation is increased in cases N4, N5, and N6on the basis of case N3. Specific setting of heat conductivityof each case can be seen in Table 3.
The thickness of each layer is given as the average valuesaccording to the downhole logs in seven boreholes(Figure 1(c), Table 2). The temperature at the model top (atthe depth of 140 m) is given a measured mean temperatureof 34.4°C in Tianjin, while the pressure in the model isobtained by the relationship between hydrostatic pressureand depth. The initial temperature distribution follows theaverage temperature gradient of 2.24°C, as shown inFigure 3(b). At the model bottom, a constant heat fluxboundary of 80 mW/m2 [28] is used. The calculation resultsof the model indicate that the temperature of the bottomboundary is basically stable at 120°C. The running time ofthe natural steady-state model must be long enough to makesure that the thermal-physical parameters are stable. In thispaper, the final running time of the natural model is set to106 years.
In the sedimentary basin, the heat transfer speed of thecaprock with low heat conductivity (caprock) is low, whichleads to the high gradient of geothermal temperature. Withthe same heat flux, the bedrock usually has high heat conduc-tivity and high heat transfer speed, which leads to the lowtemperature gradient. When all the layers in the model havethe same heat conductivity, the temperature in the steadystate has changed a little, compared with the initial tempera-ture (Figure 3(b)). When the heat conductivity of the Min-ghuazhen group and the Quaternary decreases, thetemperature gradient of caprock (above 1800 m depth)increases and the temperature gradient of bedrock reduces(cases N2 and N3). When the heat conductivity of theWumishan Formation increases (cases N4, N5, and N6),
Table 2: Key thermal properties of the western thermal reservoir of Cangdong Fault (the solid rectangular zone as shown in Figure 1(c)) (Q:Quaternary caprock; Nm: Minghuazhen group of Neogene; Ng: Guantao group of Neogene; Qn: Qingbaikou system; Jxw: Wumishangroup of Jixian).
Properties Thickness (m) Porosity Permeability (m2) Rock gain density (kg/m3) Specific heat (J/kg °C)
Q 520 0.25 2.37× 10⁻¹⁷ 2232 920
Nm 1078 0.29 4.65× 10⁻¹³ 1930 958
Ng 78 0.32 6.6× 10⁻¹³ 2012 909
Qn 114 0.05 2.09× 10⁻¹³ 2600 909
Jxw 2110 0.05 3.65× 10⁻¹³ 2677 838
Bottom boundary 100 0.05 3.65× 10⁻¹³ 2677 2000
Table 3: Heat conductivity setting of each case (N1–N6) (Q: Quaternary caprock; Nm: Minghuazhen group of Neogene; Ng: Guantao group ofNeogene; Qn: Qingbaikou system; Jxw: Wumishan group of Jixian).
Cases N1 N2 N3 N4 N5 N6
Heat conductivity W/m °C
Q 2.5 2.0 1.48 1.48 1.48 1.48
Nm 2.5 2.0 2.0 2.00 2.00 2.00
Ng 2.5 2.5 2.5 2.50 2.50 2.50
Qn 2.5 2.5 2.5 2.50 2.50 2.50
Jxw 2.5 2.5 2.5 2.85 3.20 3.80
Bottom boundary 2.5 2.5 2.5 2.85 3.20 3.80
6 Geofluids

the temperature gradient of caprock increases obviouslyin the temperature distribution of the steady state(Figure 3(b)) and is closer to measured data than that of caseN3. By the contrastive analysis between the measured aver-age temperature and the calculation results in cases N4, N5,and N6, the temperature distribution of case N5 fits to themeasured data best.
Based on the heat conductivity and hydrogeologicalparameters in case N5 (best fitting), the different specific heatof the Wumishan Formation (808 J/kg °C, 838 J/kg °C (N5),868 J/kg °C, 898 J/kg °C) is set up to determine the influenceon temperature distribution in the steady state. When thenatural state model reaches the steady state, temperature dis-tribution almost does not change with different specific heatof bed rock. At present, the measured data of the specific heatcapacity of the rock is still limited. In the future, the influenceof specific heat of caprock and bedrock on the heat transfermechanism of the steady-state model will be explored.
The 5 spots with different depths (Figure 3(b), points 1–5with red blocks) in the model of case N5 are monitored toverify the stability of the natural state model. As shown inFigure 3(d), the natural state model with the running timeof 1000000 years can reach stable states. As a consequence,the temperature distribution in the geothermal reservoir isobtained, which increases from 33.4°C to 88.8°C in the depthof 1800 m with a gradient of 3.3°C/100 m (caprock) and
increases from 88.8°C to 120°C with a gradient of1.41°C/100 m in the depth from 1800m to 4000m in the bed-rock. The variation of thermal gradient in the vertical direc-tion is mainly induced by the differences of the heatconductivity between caprock and bedrock and specificboundary conditions. The calibrated 1D natural state modelagrees reasonably well with history log data of temperatureand pressure (Figures 3(a) and 3(c)).
4.3. Exploitation Method. The double well geothermal systemis established in theWumishan reservoir. One well is used forheat extraction and another well for fluid injection, to main-tain the water balance. A 3D conceptual model with the
Production Injection
Ground level
3300 m
850 m700 mReservoir
8000 m
NESW
(a)
East (m)
0
2000
4000
6000North (m)
0
2000
4000
6000
8000
Dep
th (m
)
−3500
Production well
Injection well
East (m)
2000
4000North (m)2000
4000
6000
850 m
(b)
Figure 4: (a) Lateral 2D cross section of the model and (b) well placement in the model domain and discretization.
Table 4: Geological and thermophysical parameters of wellbore.
Wellbore parameter
Roughness (mm) 0.046
Diameter (m) 0.15
The distance between wells (m) 850
Range of buried depth (m) 3300–4000
Reinjection temperature 30
Temperature (°C) 111–120°C
Pressure (MPa) 32.6–38.3
7Geofluids
domain size of 6000 m× 8000 m× 700 m is established(Figure 4), including 2 wellbores and a reservoir. Accordingto the data of geological design of TD-01 and TD-02, the dis-tance between 2 wellbores is 850 m and the average thicknessof the reservoir is 700 m. The model is divided into sevenlayers with 134448 elements. An equivalent porous medium(EPM) [29] is performed in the model. The thermophysicalparameters in the Wumishan Formation and wellbores aresummarized in Tables 2 and 4, respectively.
In the model domain, the injection and extraction via twowells interrupt the fluid and heat transport near the wells, butdoes not affect the lateral boundaries that are far enoughfrom the wells, where constant pressure and temperatureboundary conditions are employed. The heat transferbetween wellbore and surrounding rock is calculated by Qi
3
(equation (9)). At the bottom of the exploitation model, a
constant heat flux of 80 mW/m2 is assigned [28], while onthe top of the exploitation model, a semianalytical methodis used for modeling heat exchange with confining beds. Fol-lowing the requirement of heat supply [30, 31], the extractionrate and reinjection are given in the range of 80–380 m3/h.After heat extraction, cool fluid is reinjected into the reser-voir under a constant rate equal to the extraction rate. Theinjection temperature is given at 30°C, following the averagereinjection temperature of geothermal tail water in Tianjin[26]. The sensitivity of heat production to the extraction rateand the permeability in the reservoir are analyzed based onthe scenario in Table 5, where the case with a flow rate of450 m3/h and permeability of 3.65× 10⁻¹³ m2 is used as a ref-erence case simulation (RCS). The heat production and tem-perature distribution in the reservoir are calculated in aperiod of 50 years.
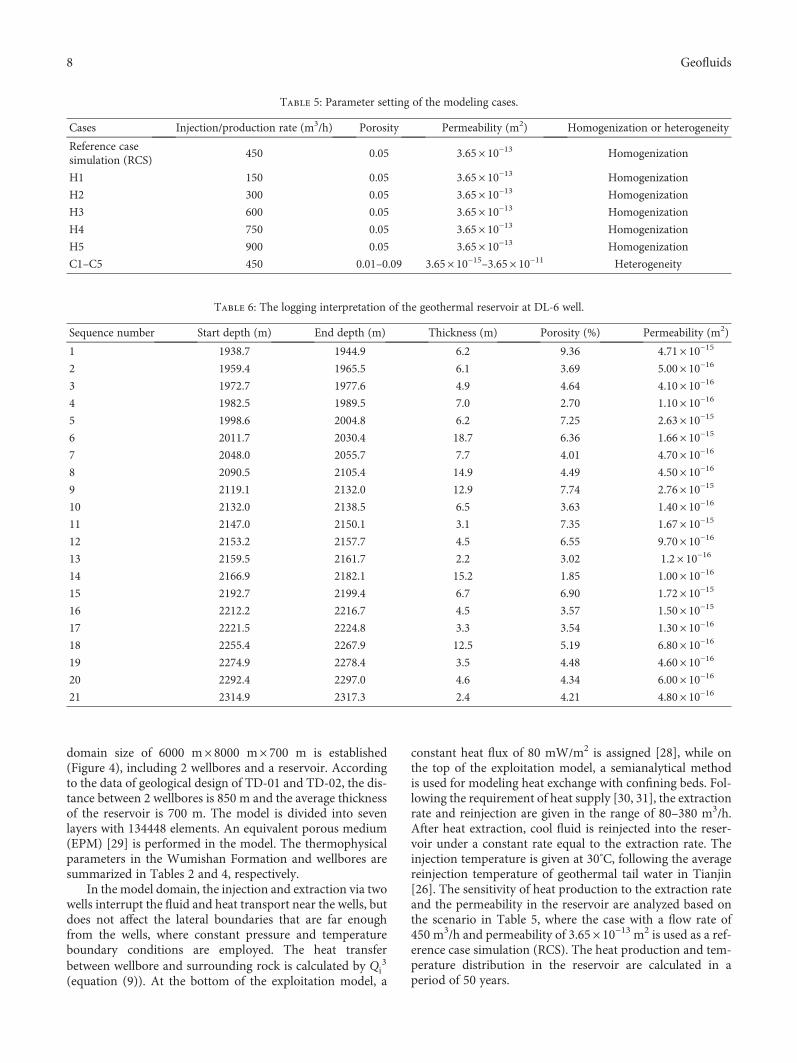
Table 5: Parameter setting of the modeling cases.
Cases Injection/production rate (m3/h) Porosity Permeability (m2) Homogenization or heterogeneity
Reference casesimulation (RCS)
450 0.05 3.65× 10⁻¹³ Homogenization
H1 150 0.05 3.65× 10⁻¹³ Homogenization
H2 300 0.05 3.65× 10⁻¹³ Homogenization
H3 600 0.05 3.65× 10⁻¹³ Homogenization
H4 750 0.05 3.65× 10⁻¹³ Homogenization
H5 900 0.05 3.65× 10⁻¹³ Homogenization
C1–C5 450 0.01–0.09 3.65× 10⁻¹⁵–3.65× 10⁻¹¹ Heterogeneity
Table 6: The logging interpretation of the geothermal reservoir at DL-6 well.
Sequence number Start depth (m) End depth (m) Thickness (m) Porosity (%) Permeability (m2)
1 1938.7 1944.9 6.2 9.36 4.71× 10⁻¹⁵
2 1959.4 1965.5 6.1 3.69 5.00× 10⁻¹⁶
3 1972.7 1977.6 4.9 4.64 4.10× 10⁻¹⁶
4 1982.5 1989.5 7.0 2.70 1.10× 10⁻¹⁶
5 1998.6 2004.8 6.2 7.25 2.63× 10⁻¹⁵
6 2011.7 2030.4 18.7 6.36 1.66× 10⁻¹⁵
7 2048.0 2055.7 7.7 4.01 4.70× 10⁻¹⁶
8 2090.5 2105.4 14.9 4.49 4.50× 10⁻¹⁶
9 2119.1 2132.0 12.9 7.74 2.76× 10⁻¹⁵
10 2132.0 2138.5 6.5 3.63 1.40× 10⁻¹⁶
11 2147.0 2150.1 3.1 7.35 1.67× 10⁻¹⁵
12 2153.2 2157.7 4.5 6.55 9.70× 10⁻¹⁶
13 2159.5 2161.7 2.2 3.02 1.2× 10⁻¹⁶
14 2166.9 2182.1 15.2 1.85 1.00× 10⁻¹⁶
15 2192.7 2199.4 6.7 6.90 1.72× 10⁻¹⁵
16 2212.2 2216.7 4.5 3.57 1.50× 10⁻¹⁵
17 2221.5 2224.8 3.3 3.54 1.30× 10⁻¹⁶
18 2255.4 2267.9 12.5 5.19 6.80× 10⁻¹⁶
19 2274.9 2278.4 3.5 4.48 4.60× 10⁻¹⁶
20 2292.4 2297.0 4.6 4.34 6.00× 10⁻¹⁶
21 2314.9 2317.3 2.4 4.21 4.80× 10⁻¹⁶
8 Geofluids

4.4. Heterogeneity Implementation. There is no such a deepgeothermal well with completion depth more than 4000 mfinished in Dongli District, which brings a difficulty insample gathering, including groundwater samples and rocksamples. In real strata, density, porosity, permeability, heatconductivity, and specific heat can vary a lot from differentrock types. When the fluids flow through the aquifer, itmay give priority to the high porosity and permeability zone.As for the above thermophysical parameters of the reservoir,the permeability and porosity have the largest effect on flowfield and heat extraction [32]. Therefore, permeability andporosity are considered as the main variables to study theheterogeneity effects.
In this paper, 5 scenarios were designed for comparisonin which the permeability and porosity of the subdomainare heterogeneous. There will be a great difference in the dis-tribution of porosity and permeability in the actual reservoir,but the correlation of porosity and permeability has facili-tated the study of the heterogeneity of the reservoir.
Bryant et al. [33], Brant [34], and Neuzil [35] observed alog-linear relationship between permeability and porosity forargillaceous sediments. The log-linear equation can beexpressed by
log k = a ⋅ φ + b, 11
where k is the permeability in m2, φ is porosity, and aand b are fitting parameters. Tian et al. [36] used theempirical relationship between porosity and permeabilityobtained by field data in the Jianghan Basin [37] toexplore impacts of hydrological heterogeneities on caprockmineral alteration.
log k = 21 581 ⋅ ϕ − 18 272, 12
where the coefficient of determination (R2) is equal to0.93.
Compared with clastic rock, different kinds of the rela-tionship between porosity and permeability of carbonatereservoirs are much more complex [38–40]. In this study,we obtained a log-linear equation for porosity-permeabilityby regression analysis of logging interpretation results ofDL-4 (Table 6, Figure 5).
log k = 25 065 ⋅ ϕ − 16 521, 13
where R2 is 0.9054.The permeability is generated randomly following the
log-normal distribution [41, 42] in a subzone defined byfollowing range of coordinates: X =1000~2000 m, Y =2575~4375 m, and Z =3300~4000 m. The porosity limitedby equation (13) obeys a normal distribution. In order todescribe the spatial distribution of reservoir permeabilityand porosity more realistically, we introduced the variationfunction, a geostatistics concept, to determine and limit thespatial distribution of permeability and porosity by assigningvariance and correlation length which strongly depends onthe variation function type and the model scale [43]. Here,a variance of 0.8 and correlation length of 300 m are usedin our model [36]. TOUGH2 family codes provide a featurethat applies permeability modification coefficients for indi-vidual grid blocks according to
kn′ = kn ⋅ ξn, 14
where kn is specified in data block ROCKS for the initialpermeability of grid block, while ξn is the permeabilitymodification coefficient. More details about the generationprocess of permeability modification coefficients and theachievement of heterogeneity can be found in the previousstudy [36].
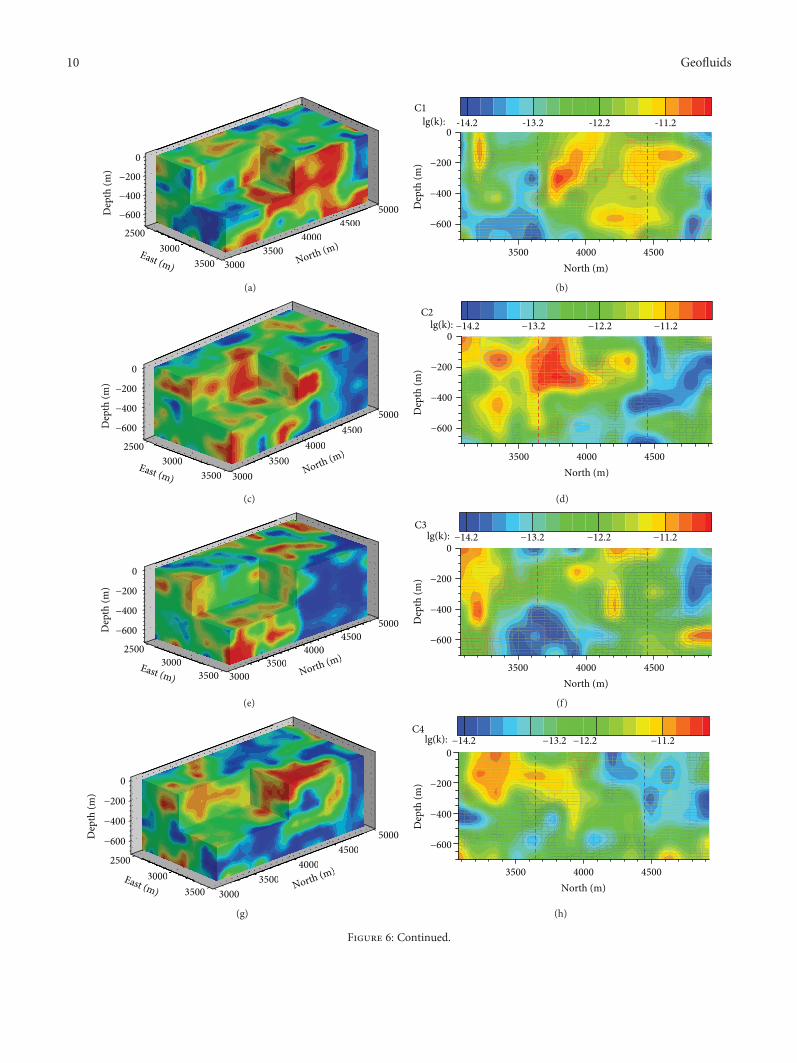
Five representative distributions of permeability andporosity are selected and discussed (Figure 6): (a) high per-meability between the two wells with low permeability atthe bottom of production well (case 1) and injection well(case 2), respectively, (b) the production well is in the lowpermeability zone and the injection well is in the high perme-ability zone (case 3), (c) the injection well is in the low perme-ability zone and the production well is in the highpermeability zone (case 4), and (d) low permeability betweenthe two wells (case 5).
5. Results and Discussion
5.1. Production Rate. The heat production is under a constantrate of 450 m3/h for 50 years, the bottom pressure in injectionwell increases to 38.64 MPa (increased by 1.10% when com-pared to the initial pressure), and the bottom pressure in pro-duction well decreases to 38.11 MPa (reduced by 0.28%)(Figure 7(c)). The injected cold water migrates towards theproduction well, with the minimum influence distance (theisothermal surface of 50 °C) of 268 m at depth of 3300 mand the maximum influence distance of 441 m at depth of4000 m. As a consequence, the outflow temperature
−14
−14.5
−15
−15.5
log 10
(k)
−16
y = 25.065�휑 − 16.521R2 = 0.9054
−16.50 0.02 0.04 0.06
Porosity0.08 0.1
Figure 5: The relationship between permeability and porosity ofdolomite in Wumishan Formation of typical geological conditions.
9Geofluids
East (m)
25003000
3500 North (m)
30003500
40004500
5000Dep
th (m
)
−600
−400
−200
0
3000 th (m)35004000
4500
(a)
North (m)
Dep
th (m
)
3500 4000 4500
−600
−400
−200
0-14.2 -13.2 -12.2 -11.2lg(k):
C1
(b)
East (m)
25003000
3500 North (m)
30003500
40004500
5000
Dep
th (m
)
−600
−400
−200
0
3000 orth (m)35004000
4500
(c)
North (m)
Dep
th (m
)
3500 4000 4500
−600
−400
−200
0−14.2 −13.2 −12.2 −11.2lg(k):
C2
(d)
East (m)
25003000
3500 North (m)
30003500
40004500
5000Dep
th (m
)
−600
−400
−200
0
3000 th (m)35004000
4500
(e)
North (m)
Dep
th (m
)
3500 4000 4500
−600
−400
−200
0−14.2 −13.2 −12.2 −11.2lg(k):
C3
(f)
East (m)
25003000
3500 North (m)
30003500
40004500
5000Dep
th (m
)
−600
−400
−200
0
3000North (m)
35004000
4500
(g)
North (m)
Dep
th (m
)
3500 4000 4500
−600
−400
−200
0−14.2 −13.2 −12.2 −11.2
C4lg(k):
(h)
Figure 6: Continued.
10 Geofluids
decreased by 0.49°C in 50 years (Figure 8(a)). As illustrated inFigure 7(c), the injection/production rate of 450 m3/h doesnot induce significant pressure changes in the reservoir.Whereas the cold plume between the injection well and pro-duction well may cause heat breakthrough, i.e., the cold waterreaches the production well without sufficient heat transfer.In order to figure out the TH coupling process of geothermaldoublets and the exploitable volume within the lifespan over50 years, another five cases with different constant productio-n/injection rates are added.
The wellhead temperature, under the constant rate of150 m3/h and 300 m3/h, increases to about 1.65°C and0.65°C after 50 years, compared with the base case of450 m3/h (Figure 8(a)). Because the minor exploitation rateis not enough to cause heat breakthrough and the cold wateris still dominated by downward movement, more geothermalwater from deep sectors of the reservoir is driven by the coldplume towards the production well. With the further increaseof the production and injection rate (from 600m3/h to900 m3/h), the breakthrough occurs and leads to the rapidreduction of the outflow temperature and heat extraction rateafter 50 years (Figures 8(a) and 8(b)). The influence range ofthe injected cold water increases with the production/injec-tion rate, which leads the decreases of outflow temperature.It is tested that when the injection rate increases to900 m3/h, the influence range of cold water reaches to extrac-tion well extensively (Figure 7(b)), over a volume having anapproximate diameter of 1.5 km, which leads the tempera-ture in the production well to reduce 8.08°C in 50 years.
Fluid temperature, pressure, enthalpy, and operating costshould be considered when evaluating the productivity ofgeothermal extraction engineering. Due to negligible effectof the pressure on energy balance, the heat extraction rate(G) is calculated with the following equation:
G =MF pro × h pro −MF inj × h inj , 15
where MF is the mass flow rate (kg/s) and h is the specificenthalpy (kJ/kg). The subscripts inj and pro stand forthe injection well and production well, respectively.
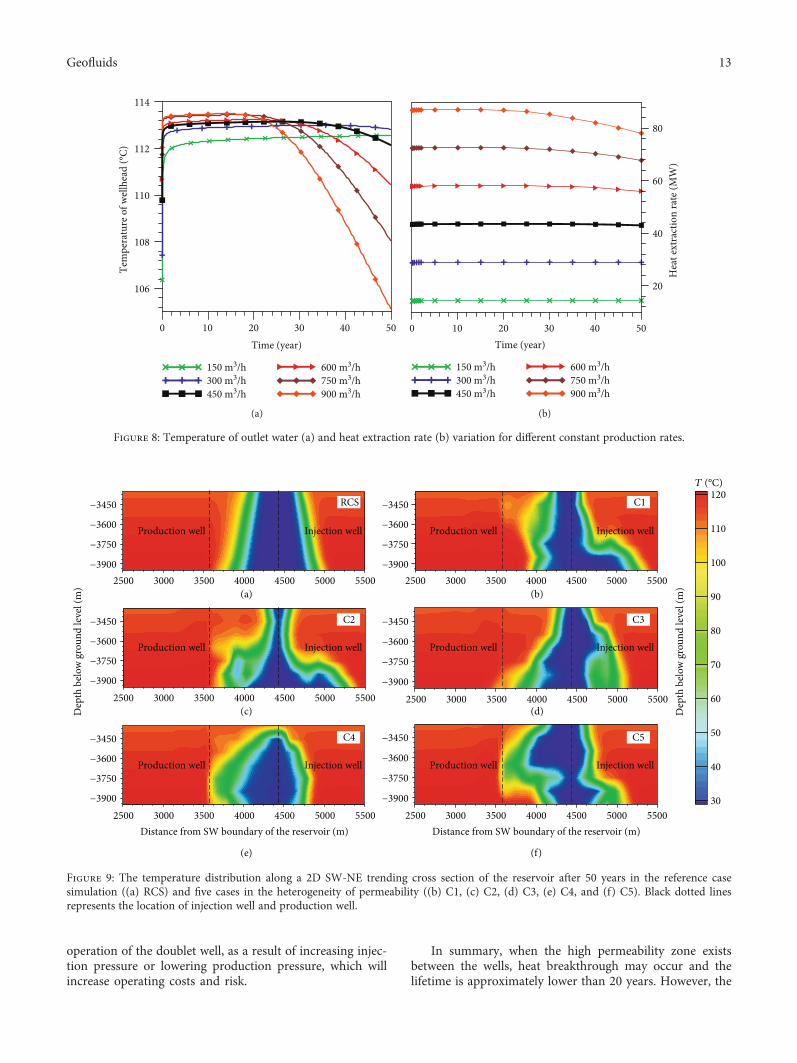
It is illustrated in Figure 8 that under the productionrate of 450 m3/h, the maximum outflow temperature canbasically remain stable of 112°C, with a limited drop of0.49°C in 50 years, and heat extraction rate can reachaverage of 43.5 MW with a decrease of 0.73%. When theinjection/production rate is higher than 450 m3/h, heatbreakthrough occurs, which cause significant decreases ofoutflow temperature over a lifespan of 50 years. Toincrease the heat extraction rate and maintain a high outflowtemperature, a production rate of 450 m3/h can be achieved ifthe reservoir formation is hydrologically homogeneous.
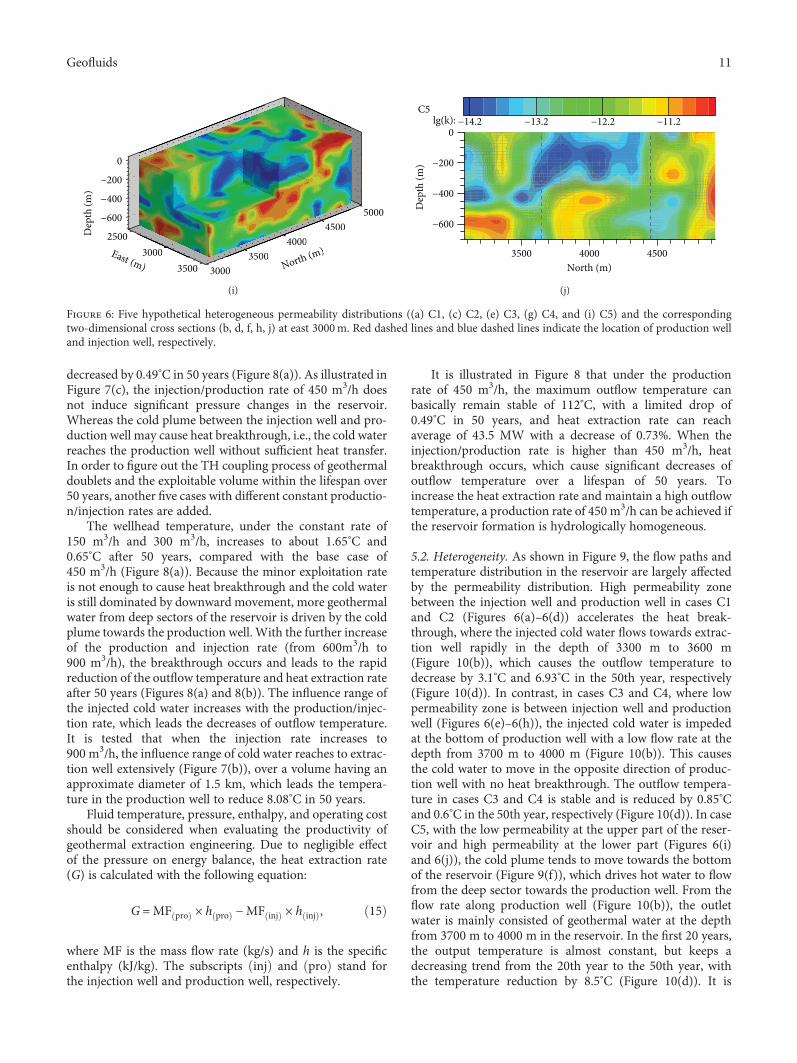
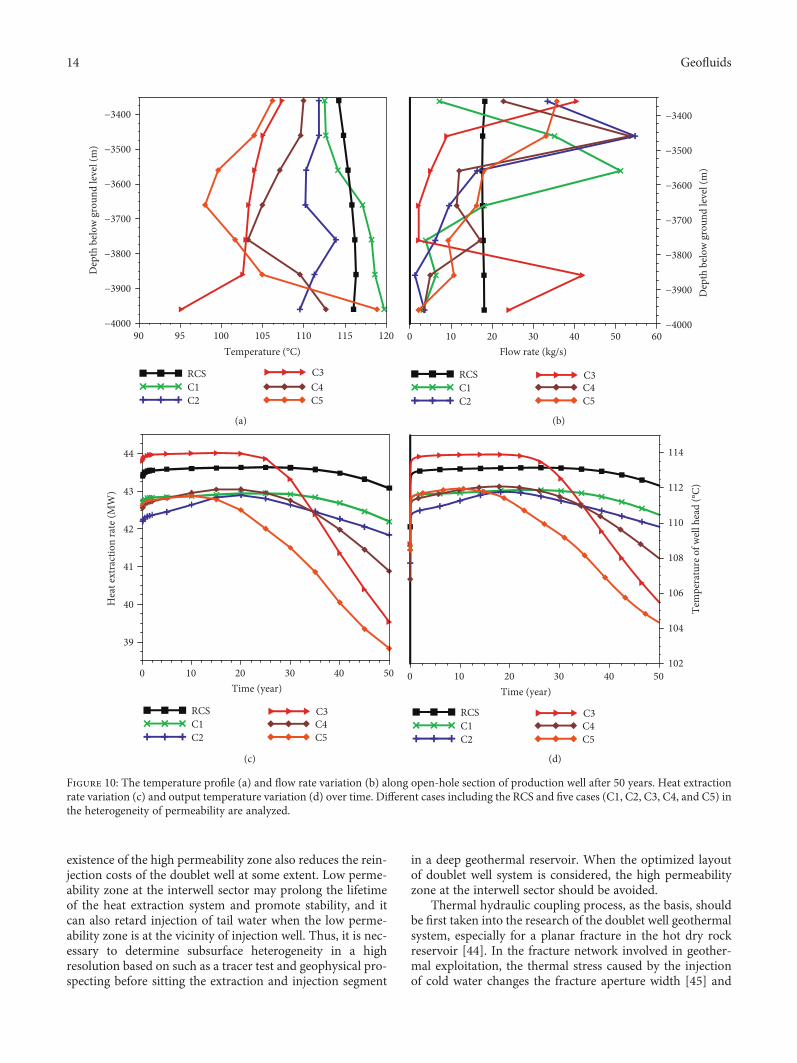
5.2. Heterogeneity. As shown in Figure 9, the flow paths andtemperature distribution in the reservoir are largely affectedby the permeability distribution. High permeability zonebetween the injection well and production well in cases C1and C2 (Figures 6(a)–6(d)) accelerates the heat break-through, where the injected cold water flows towards extrac-tion well rapidly in the depth of 3300 m to 3600 m(Figure 10(b)), which causes the outflow temperature todecrease by 3.1°C and 6.93°C in the 50th year, respectively(Figure 10(d)). In contrast, in cases C3 and C4, where lowpermeability zone is between injection well and productionwell (Figures 6(e)–6(h)), the injected cold water is impededat the bottom of production well with a low flow rate at thedepth from 3700 m to 4000 m (Figure 10(b)). This causesthe cold water to move in the opposite direction of produc-tion well with no heat breakthrough. The outflow tempera-ture in cases C3 and C4 is stable and is reduced by 0.85°Cand 0.6°C in the 50th year, respectively (Figure 10(d)). In caseC5, with the low permeability at the upper part of the reser-voir and high permeability at the lower part (Figures 6(i)and 6(j)), the cold plume tends to move towards the bottomof the reservoir (Figure 9(f)), which drives hot water to flowfrom the deep sector towards the production well. From theflow rate along production well (Figure 10(b)), the outletwater is mainly consisted of geothermal water at the depthfrom 3700 m to 4000 m in the reservoir. In the first 20 years,the output temperature is almost constant, but keeps adecreasing trend from the 20th year to the 50th year, withthe temperature reduction by 8.5°C (Figure 10(d)). It is
East (m)
25003000
3500 North (m)
30003500
40004500
5000
Dep
th (m
)
−600
−400
−200
0
3000th (m)3500
40004500
(i)
North (m)
Dep
th (m
)
3500 4000 4500
−600
−400
−200
0−14.2 −13.2 −12.2 −11.2lg(k):
C5
(j)
Figure 6: Five hypothetical heterogeneous permeability distributions ((a) C1, (c) C2, (e) C3, (g) C4, and (i) C5) and the correspondingtwo-dimensional cross sections (b, d, f, h, j) at east 3000m. Red dashed lines and blue dashed lines indicate the location of production welland injection well, respectively.
11Geofluids

because the primary hot water at bottom of production wellhas been used up and the cold water from injection wellbecomes the main part of output water.
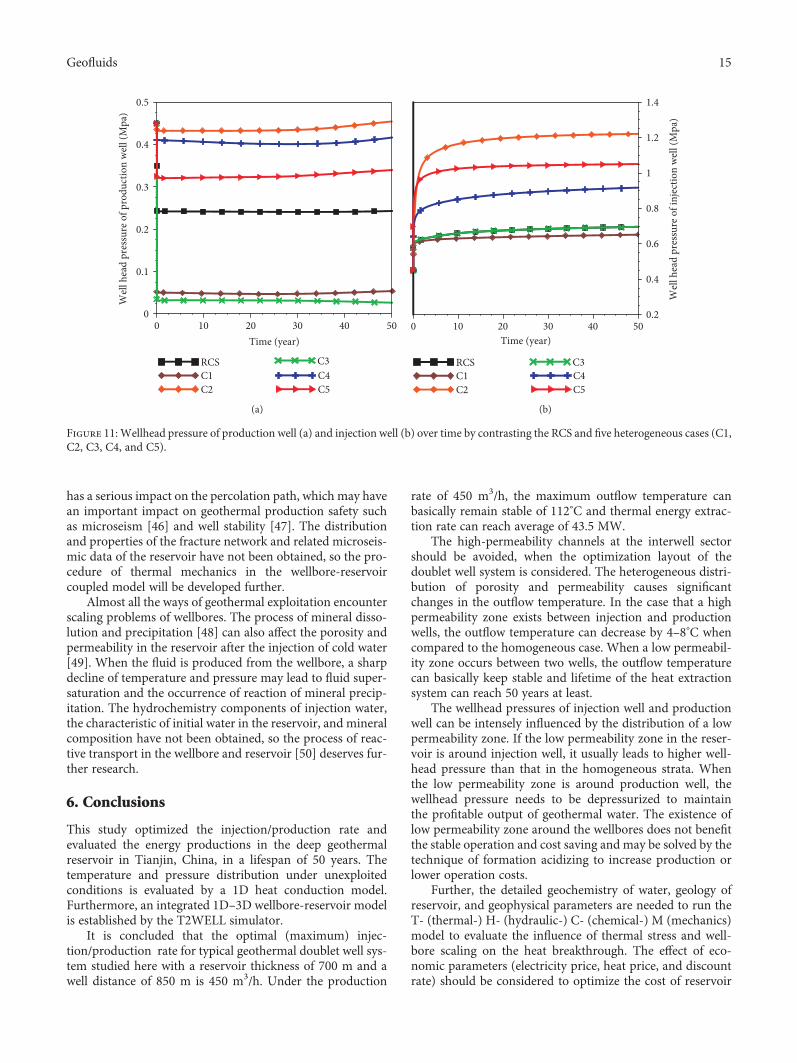
5.3. Wellhead Pressure. In the actual application, theinjection and production rate is controlled by wellheadpressure of both wells. The different geological conditionsand flow rates lead to the variation of wellhead pressure(Figure 11). Accordingly, the wellhead pressure variationwith time based on different cases with heterogeneity ofpermeability needs to be predicted to offer a reference forthe application and safety of geothermal water exploitation.
When the low permeability sector is around injection well,the injected water needs to be driven by high pressuredifference between wellhead and the reservoir, which leadsto the increase of wellhead pressure of injection well. Whilethe high permeability sector is around injection well, thelower wellhead pressure is needed to realize the reinjectionprocess. The production of geothermal water needsdepressurization of wellhead. In the same way, if the lowpermeability exists around production well, the wellheadpressure of production well may decrease. Hence, thereservoir with low permeability sectors around the injectionwell and production well can bring difficulties to stable
Distance from SW boundary of the reservoir (m)D
epth
(m)
1500
Production well Injection well
3000 4500 6000 7500
−3900
−3750
−3600
−3450
T (°C)
110
90
70
50
30
(a)
Distance from SW boundary of the reservoir (m)
Dep
th (m
)
1500 3000 4500 6000 7500
−3900
−3750
−3600
−3450
T (°C)110
90
70
50
30
Production well Injection well
(b)
Distance from the SW boundary of the reservoir (m)
Dep
th (m
)
1500 3000
Production well Injection well
4500 6000 7500
−3900
−3750
−3600
−3450
P (Pa)3.85 × 10+07
3.65 × 10+07
3.45 × 10+07
3.25 × 10+07
(c)
Distance from SW boundary of the reservoir (m)
Dep
th (m
)
1500 3000
Production well Injection well
4500 6000 7500−3900
−3750
−3600
−3450
P (Pa)3.85 + 07
3.65 + 07
3.45 + 07
3.25 + 07
(d)
Figure 7: Temperature (a) and pressure (c) field distributions at the injection/production rate of 450m3/h, and temperature (b) and pressure(d) field distributions at the injection/production rate of 900m3/h along a 2D SW-NE trending cross section of the reservoir (50 years). Blackdotted lines represents the location of injection well and production well.
12 Geofluids
operation of the doublet well, as a result of increasing injec-tion pressure or lowering production pressure, which willincrease operating costs and risk.
In summary, when the high permeability zone existsbetween the wells, heat breakthrough may occur and thelifetime is approximately lower than 20 years. However, the
Time (year)
106
108
110
112
114
Tem
pera
ture
of w
ellh
ead
(°C)
150 m3/h300 m3/h450 m3/h
600 m3/h750 m3/h900 m3/h
0 10 20 30 40 50
(a)
0 10 20 30 40 50Time (year)
150 m3/h300 m3/h450 m3/h
600 m3/h750 m3/h900 m3/h
20
40
60
80
Hea
t ext
ract
ion
rate
(MW
)
(b)
Figure 8: Temperature of outlet water (a) and heat extraction rate (b) variation for different constant production rates.
−3450
−3600
−3750
−39002500 3000
Production well Injection well
Production well Injection well
Production well Injection well
3500 4000 4500 5000 5500
2500 3000 3500 4000 4500 5000 5500
2500 3000 3500 4000Distance from SW boundary of the reservoir (m)
4500 5000 5500
−3450
−3600
Dep
th b
elow
gro
und
leve
l (m
)
−3750
−3900
−3450
−3600
−3750
−3900
−3450
−3600
−3750
−39002500 3000
Production well Injection well
Production well Injection well
Production well Injection well
3500 4000 4500 5000 5500
2500 3000 3500 4000 4500 5000 5500
2500 3000 3500 4000Distance from SW boundary of the reservoir (m)
4500 5000 5500
−3450
−3600
Dep
th b
elow
gro
und
leve
l (m
)−3750
−3900
−3450
−3600
−3750
−3900
C1
C4
C5
RCS
C2
T (°C)120
110
100
90
80
70
60
50
40
30
C4
RCS
C2
C4
C1
C3
C5
(a) (b)
(c) (d)
(e) (f)
Figure 9: The temperature distribution along a 2D SW-NE trending cross section of the reservoir after 50 years in the reference casesimulation ((a) RCS) and five cases in the heterogeneity of permeability ((b) C1, (c) C2, (d) C3, (e) C4, and (f) C5). Black dotted linesrepresents the location of injection well and production well.
13Geofluids
existence of the high permeability zone also reduces the rein-jection costs of the doublet well at some extent. Low perme-ability zone at the interwell sector may prolong the lifetimeof the heat extraction system and promote stability, and itcan also retard injection of tail water when the low perme-ability zone is at the vicinity of injection well. Thus, it is nec-essary to determine subsurface heterogeneity in a highresolution based on such as a tracer test and geophysical pro-specting before sitting the extraction and injection segment
in a deep geothermal reservoir. When the optimized layoutof doublet well system is considered, the high permeabilityzone at the interwell sector should be avoided.
Thermal hydraulic coupling process, as the basis, shouldbe first taken into the research of the doublet well geothermalsystem, especially for a planar fracture in the hot dry rockreservoir [44]. In the fracture network involved in geother-mal exploitation, the thermal stress caused by the injectionof cold water changes the fracture aperture width [45] and
90 95 100 105Temperature (°C)
−4000
−3900
−3800
−3700
−3600
−3500
−3400
Dep
th b
elow
gro
und
leve
l (m
)
RCSC1C2
C3C4C5
110 115 120
(a)
Flow rate (kg/s)
−4000
−3900
−3800
−3700
−3600
−3500
−3400
Dep
th b
elow
gro
und
leve
l (m
)
0 10 20 30 40 50 60
RCSC1C2
C3C4C5
(b)
Time (year)
39
40
41
42
43
44
Hea
t ext
ract
ion
rate
(MW
)
0 10 20 30 40 50
RCSC1C2
C3C4C5
(c)
0 10 20 30 40 50Time (year)
RCSC1C2
C3C4C5
102
104
106
108
110
112
114
Tem
pera
ture
of w
ell h
ead
(°C)
(d)
Figure 10: The temperature profile (a) and flow rate variation (b) along open-hole section of production well after 50 years. Heat extractionrate variation (c) and output temperature variation (d) over time. Different cases including the RCS and five cases (C1, C2, C3, C4, and C5) inthe heterogeneity of permeability are analyzed.
14 Geofluids
has a serious impact on the percolation path, which may havean important impact on geothermal production safety suchas microseism [46] and well stability [47]. The distributionand properties of the fracture network and related microseis-mic data of the reservoir have not been obtained, so the pro-cedure of thermal mechanics in the wellbore-reservoircoupled model will be developed further.
Almost all the ways of geothermal exploitation encounterscaling problems of wellbores. The process of mineral disso-lution and precipitation [48] can also affect the porosity andpermeability in the reservoir after the injection of cold water[49]. When the fluid is produced from the wellbore, a sharpdecline of temperature and pressure may lead to fluid super-saturation and the occurrence of reaction of mineral precip-itation. The hydrochemistry components of injection water,the characteristic of initial water in the reservoir, and mineralcomposition have not been obtained, so the process of reac-tive transport in the wellbore and reservoir [50] deserves fur-ther research.
6. Conclusions
This study optimized the injection/production rate andevaluated the energy productions in the deep geothermalreservoir in Tianjin, China, in a lifespan of 50 years. Thetemperature and pressure distribution under unexploitedconditions is evaluated by a 1D heat conduction model.Furthermore, an integrated 1D–3D wellbore-reservoir modelis established by the T2WELL simulator.
It is concluded that the optimal (maximum) injec-tion/production rate for typical geothermal doublet well sys-tem studied here with a reservoir thickness of 700 m and awell distance of 850 m is 450 m3/h. Under the production
rate of 450 m3/h, the maximum outflow temperature canbasically remain stable of 112°C and thermal energy extrac-tion rate can reach average of 43.5 MW.
The high-permeability channels at the interwell sectorshould be avoided, when the optimization layout of thedoublet well system is considered. The heterogeneous distri-bution of porosity and permeability causes significantchanges in the outflow temperature. In the case that a highpermeability zone exists between injection and productionwells, the outflow temperature can decrease by 4–8°C whencompared to the homogeneous case. When a low permeabil-ity zone occurs between two wells, the outflow temperaturecan basically keep stable and lifetime of the heat extractionsystem can reach 50 years at least.
The wellhead pressures of injection well and productionwell can be intensely influenced by the distribution of a lowpermeability zone. If the low permeability zone in the reser-voir is around injection well, it usually leads to higher well-head pressure than that in the homogeneous strata. Whenthe low permeability zone is around production well, thewellhead pressure needs to be depressurized to maintainthe profitable output of geothermal water. The existence oflow permeability zone around the wellbores does not benefitthe stable operation and cost saving and may be solved by thetechnique of formation acidizing to increase production orlower operation costs.
Further, the detailed geochemistry of water, geology ofreservoir, and geophysical parameters are needed to run theT- (thermal-) H- (hydraulic-) C- (chemical-) M (mechanics)model to evaluate the influence of thermal stress and well-bore scaling on the heat breakthrough. The effect of eco-nomic parameters (electricity price, heat price, and discountrate) should be considered to optimize the cost of reservoir
Time (year)
0
0.1
0.2
0.3
0.4
0.5
Wel
l hea
d pr
essu
re o
f pro
duct
ion
wel
l (M
pa)
RCSC1C2
C3C4C5
0 10 20 30 40 50
(a)
RCSC1C2
C3C4C5
0 10 20 30 40 50Time (year)
0.2
0.4
0.6
0.8
1
1.2
1.4
Wel
l hea
d pr
essu
re o
f inj
ectio
n w
ell (
Mpa
)
(b)
Figure 11:Wellhead pressure of production well (a) and injection well (b) over time by contrasting the RCS and five heterogeneous cases (C1,C2, C3, C4, and C5).
15Geofluids

exploitation in combination with numerical results in furtherstudy. More accurate main parameters, related coupling pro-cesses, and cost analysis should be updated and added intothe model to get accurate results to achieve optimumperformance.
Nomenclature
Mκ: Mass accumulation term, kg m−3
F: Mass or heat flux, W m−1
Vn: An arbitrary subdomain of the flow systemSβ: The saturation of phase βuβ: Darcy velocity in phase β, m s−1
Xβ: Mass fraction of component κ present in phase βk: Absolute permeability to phase β, m2
kr: Relative permeability, m2
P: The pressure of a reference phase and usuallytaken to be the gas phase, Pa
q: Sinks and sources, kg m−3 s−1
Uβ: The internal energy of phase β, J kg−1
uβ: The velocity of phase β in the wellbore, m s−1
1/2 uβ2: The kinetic energy per unit mass
A: Well cross-sectional area, m2
z: Distance along-wellbore coordinate (can beinclined), m
CR: Specific heat of rock, J kg−1°C−1
hβ: Specific enthalpy of fluid phase β, J kg−1
g: Gravitational acceleration, m s−2
q′: The wellbore heat loss/gain per unit length ofwellbore, kg m−3 s−1
Awi: The lateral area between wellbore and surround-ing formation, for grid cell i (wellbore), m2
Kwi: The overall heat transfer coefficient of wellboreand formation, W−1 K−1 m−1
Ti: The temperature of ith wellbore node, °CT∞ z : Ambient temperature, °Cr: Radium of the wellbore, mf t : Ramey’s well heat loss functionum: The velocity of mixture (liquid water in our
model), m s−1
k: Permeabilitya: Fitting parameterb: Fitting parameter.
Greek Letters
φ: Porosityρβ: The density of phase β, kg m−3
λ: Heat conductivity, W−1 K−1 m−1
ρR: Grain density, kg m−3
μβ: Viscosity, kg m−1 s−1
λ: The area-averaged heat conductivity of the wellbore(contains the fluids and possible solid portion),W−1 K−1m−1
θ: Incline angle of wellbore, °
Γn: Area of closed surface, m2
α: The thermal dispersivity of the surrounding formation,m2 s−1
Γ: Perimeter of wellbore, mτw: The wall shear tress, MPaρm: The mixture density (liquid water), kg m−3.
Subscripts and Superscripts
β: Refers to liquid water in this paperκ: The index for the components, 1 for H2O, 4 for energy.
Data Availability
We can directly link the dataset in this manuscript by provid-ing the relevant information. The data in this manuscript isavailable and can be found in the database linking page.
Conflicts of Interest
The authors declare that they have no conflicts of interest.
Acknowledgments
This study is supported by the National Key Research andDevelopment Program of China (no. 2016YFB0600804),National Natural Science Foundation of China (no.41572215, 41402205, and 41502222), Center for Hydrogeol-ogy and Environmental Geology Survey, China GeologicalSurvey (DD20179621 and DD20189113), Special Project forNew Energy, Jilin Province (SXGJSF2017-5), Graduate Inno-vation Found of Jilin University (no. 101832018C052), andthe Major Project of China National Science and Technology(no. 2016ZX05016-005).
References
[1] M. Shen, “Environmental pollution and prevention of coalburning,” Northwest Coal, vol. 6, no. 1, pp. 46–48, 2008.
[2] X. Li, “Empirical analysis of the smog factors inBeijing-Tianjin-Hebei region,” Ecological Economy, vol. 32,no. 3, pp. 144–150, 2016.
[3] Ministry of Ecology and Environment of the People’ s Repub-lic of China (original Ministry of Environment Protection ofthe People’ s Republic of China), Air Quality Analysis ofKey Regions and 74 Cities in China Reported by Ministryof Environment Protection of the People’s Republic of China,2015.
[4] J. Hou, M. Cao, and P. Liu, “Development and utilization ofgeothermal energy in China: current practices and futurestrategies,” Renewable Energy, vol. 125, pp. 401–412, 2018.
[5] L. Zhu, H. Gong, X. Li et al., “Land subsidence due togroundwater withdrawal in the northern Beijing plain,China,” Engineering Geology, vol. 193, pp. 243–255, 2015.
[6] A. C. Gringarten and J. P. Sauty, “A theoretical study of heatextraction from aquifers with uniform regional flow,” Journalof Geophysical Research, vol. 80, no. 35, pp. 4956–4962, 1975.
[7] A. C. Gringarten, “Reservoir lifetime and heat recovery factorin geothermal aquifers used for urban heating,” Pure andApplied Geophysics, vol. 117, no. 1-2, pp. 297–308, 1978.
[8] S. K. Sanyal, M. Sengul, and H. T. Meidav, “A semi-analyticalapproach to geothermal reservoir performance prediction,” inProceedings Second Workshop Geothermal Reservoir Engineer-ing, Stanford, CA, USA, December 1976.
16 Geofluids

[9] C. S. Chen and D. L. Reddell, “Temperature distributionaround a well during thermal injection and a graphical tech-nique for evaluating aquifer thermal properties,” WaterResources Research, vol. 19, no. 2, pp. 351–363, 1983.
[10] S. Ganguly and M. S. Mohan Kumar, “Analytical solutions fortransient temperature distribution in a geothermal reservoirdue to cold water injection,” Hydrogeology Journal, vol. 22,no. 2, pp. 351–369, 2014.
[11] F. Ascencio, F. Samaniego, and J. Rivera, “A heat loss analyticalmodel for the thermal front displacement in naturally frac-tured reservoirs,” Geothermics, vol. 50, no. 3, pp. 112–121,2014.
[12] Y.-S. Wu and K. Pruess, “An analytical solution for wellboreheat transmission in layered formations (includes associatedpapers 23410 and 23411),” SPE Reservoir Engineering, vol. 5,no. 4, pp. 531–538, 1990.
[13] J. Wu, Y. Liu, and H. Yang, “Analytical solution of the produc-tivity equation for a vertical fractured well in 3D anisotropic oilreservoirs,” Liquid Fuels Technology, vol. 34, no. 4, pp. 433–441, 2014.
[14] B. Izgec, C. S. Kabir, D. Zhu, and A. R. Hasan, “Transient fluidand heat flow modeling in coupled wellbore/reservoirsystems,” SPE Reservoir Evaluation & Engineering, vol. 10,no. 3, pp. 294–301, 2007.
[15] S. Ganguly, M. S. M. Kumar, A. Date, and A. Akbarzadeh,Numerical Modeling and Analytical Validation for TransientTemperature Distribution in a Heterogeneous Geothermal Res-ervoir Due to Cold-Water Reinjection, World GeothermalCongress, 2015.
[16] V. Hamm and S. Lopez, “Impact of fluvial sedimentary het-erogeneities on heat transfer at a geothermal doublet scale,”Proceedings, Thirty - Seventh Workshop on Geothermal Res-ervoir Engineering, Stanford University, Stanford, CA, USA,2012.
[17] A. Ghassemi and G. Suresh Kumar, “Changes in fractureaperture and fluid pressure due to thermal stress and silicadissolution/precipitation induced by heat extraction fromsubsurface rocks,” Geothermics, vol. 36, no. 2, pp. 115–140,2007.
[18] M. D. Aliyu and H. P. Chen, “Optimum control parametersand long-term productivity of geothermal reservoirs usingcoupled thermo-hydraulic process modelling,” RenewableEnergy, vol. 112, pp. 151–165, 2017.
[19] V. Hamm, M. Bouzit, and S. Lopez, “Assessment of complexwell architecture performance for geothermal exploitation ofthe Paris basin: a modeling and economic analysis,” Geother-mics, vol. 64, pp. 300–313, 2016.
[20] L. Pan and C. M. Oldenburg, “T2Well-an integratedwellbore-reservoir simulator,” Computers & Geosciences,vol. 65, no. 65, pp. 46–55, 2014.
[21] Y. Hu, B. Gao, B. Jin, and J. Wang, “Chemical distribution andforming mechanism of the geothermal water in Tianjin,” Geo-logical Survey and Research, vol. 30, no. 3, pp. 213–218, 2007.
[22] H. J. Ramey Jr, “Wellbore heat transmission,” Journal ofPetroleum Technology, vol. 14, no. 4, pp. 427–435, 1962.
[23] Z. Peng, Geothermal Reinjection Numerical Simulation andResource Evaluation of the Wumishan Group in Dongli Districtof Tianjin, China University of Geosciences, Beijing, 2016.
[24] G. Tian, Sustainable Development and Utilization of Geother-mal Resources in the Donglihu Hot Spring Resort of Tianjin,China University of Geosciences, Beijing, 2014.
[25] A. Franco and M. Vaccaro, “Numerical simulation of geother-mal reservoirs for the sustainable design of energy plants: areview,” Renewable & Sustainable Energy Reviews, vol. 30,no. 2, pp. 987–1002, 2014.
[26] L. Lin, Sustainable Development and Utilization of ThermalGroundwater Resources in the Geothermal Reservoir of theWumishan Group in Tianjin, China University of Geosciences,Beijing, 2006.
[27] G. Garven, “Continental-scale groundwater flow and geologicprocesses,” Annual Review of Earth and Planetary Sciences,vol. 23, no. 1, pp. 89–117, 1995.
[28] S.-B. Hu, L.-J. He, and J.-Y. Wang, “Compilation of heat flowdata in the China continental area (3rd edition),” ChineseJournal of Geophysics, vol. 44, no. 5, pp. 604–618, 2001.
[29] H. A. Loaiciga, D. R. Maidment, and J. B. Valdes, “Climate--change impacts in a regional karst aquifer, Texas, USA,” Jour-nal of Hydrology, vol. 227, no. 1-4, pp. 173–194, 2000.
[30] N. Zhao, “Geochemical simulation of lake water injection intothe geothermal reservoir in Tianjin, China,” in GeothermalTraining Programme, United Nations University, 2010.
[31] C. Ruan, “Numerical modeling of water level changes inTianjin low-temperature geothermal system, China,” in Geo-thermal Training Programme, United Nations University,2011.
[32] T. Xu, H. Zhu, G. Feng, Y. Yuan, and H. Tian, “On fluid andthermal dynamics in a heterogeneous CO2 plume geothermalreservoir,” Geofluids, vol. 2017, Article ID 9692517, 12 pages,2017.
[33] W. R. Bryant, W. Hottman, and P. Trabant, “Permeability ofunconsolidated and consolidated marine sediments, Gulf ofMexico,” Marine Geotechnology, vol. 1, no. 1, pp. 1–14, 1975.
[34] W. R. Bryant, “Permeability of clays, silty-clays andclayey-silts,” Gulf Coast Association of Geological SocietiesTransactions, vol. 52, pp. 1069–1077, 2002.
[35] C. E. Neuzil, “How permeable are clays and shales?,” WaterResources Research, vol. 30, no. 2, pp. 145–150, 1994.
[36] H. Tian, F. Pan, T. Xu, B. J. McPherson, G. Yue, andP. Mandalaparty, “Impacts of hydrological heterogeneities oncaprock mineral alteration and containment of CO2 in geolog-ical storage sites,” International Journal of Greenhouse GasControl, vol. 24, pp. 30–42, 2014.
[37] Z. Guo, X. Hu, and C. Cheng, “Affecting factors ofCretaceous-Paleogence shalecap in Jianghan Plain,” Journalof Jianghan Petroleum University of Staff and Workers,vol. 17, no. 2, pp. 10–13, 2004.
[38] L. He, L. Zhao, J. Li et al., “Complex relationship betweenporosity and permeability of carbonate reservoirs and its con-trolling factors: a case study of platform facies in Pre-CaspianBasin,” Petroleum Exploration and Development, vol. 41, no. 2,pp. 225–234, 2014.
[39] B. Esrafili-Dizaji and H. Rahimpour-Bonab, “Effects of deposi-tional and diagenetic characteristics on carbonate reservoirquality: a case study from the South Pars gas field in the Per-sian Gulf,” Petroleum Geoscience, vol. 15, no. 4, pp. 325–344,2009.
[40] H. C. Moore, “Carbonate reservoirs: porosity evolution anddiagenesis in a sequence stratigraphic framework,” Develop-ments in Sedimentology, vol. 55, pp. 80–122, 2001.
[41] S. Haldar and G. L. S. Babu, “Effect of soil spatial variability onthe response of laterally loaded pile in undrained clay,” Com-puters and Geotechnics, vol. 35, no. 4, pp. 537–547, 2008.
17Geofluids

[42] G. B. Baecher and J. T. Christian, Reliability and Statistics inGeotechnical Engineering, Wiley, 2003.
[43] G. Feng, T. Xu, F. Gherardi, Z. Jiang, and S. Bellani, “Geother-mal assessment of the Pisa plain, Italy: coupled thermal andhydraulic modeling,” Renewable Energy, vol. 111, pp. 416–427, 2017.
[44] A. Ghassemi, S. Tarasovs, and A. H.-D. Cheng, “An integralequation solution for three-dimensional heat extraction fromplanar fracture in hot dry rock,” International Journal forNumerical and Analytical Methods in Geomechanics, vol. 27,no. 12, pp. 989–1004, 2003.
[45] A. Ghassemi, S. Tarasovs, and A. H. D. Cheng, “Integral equa-tion solution of heat extraction-induced thermal stress inenhanced geothermal reservoirs,” International Journal forNumerical and Analytical Methods in Geomechanics, vol. 29,no. 8, pp. 829–844, 2005.
[46] K. F. Evans, A. Zappone, T. Kraft, N. Deichmann, and F. Moia,“A survey of the induced seismic responses to fluid injection ingeothermal and CO2 reservoirs in Europe,” Geothermics,vol. 41, pp. 30–54, 2012.
[47] P. Yang, M. Chen, Y. Jin et al., “Mechanical-thermal-chemicalcoupled research of wellbore stability in Jabung Oil Field,Indonesia,” Advanced Materials Research, vol. 402, pp. 709–714, 2012.
[48] T. Xu, Y. Ontoy, P. Molling, N. Spycher, M. Parini, andK. Pruess, “Reactive transport modeling of injection well scal-ing and acidizing at Tiwi Field, Philippines,” Geothermics,vol. 33, no. 4, pp. 477–491, 2004.
[49] C. Rawal and A. Ghassemi, “A reactive thermo-poroelasticanalysis of water injection into an enhanced geothermal reser-voir,” Geothermics, vol. 50, pp. 10–23, 2014.
[50] F. Nitschke, S. Held, T. Himmelsbach, and T. Kohl, “THC sim-ulation of halite scaling in deep geothermal single well produc-tion,” Geothermics, vol. 65, pp. 234–243, 2017.
18 Geofluids

Hindawiwww.hindawi.com Volume 2018
Journal of
ChemistryArchaeaHindawiwww.hindawi.com Volume 2018
Marine BiologyJournal of
Hindawiwww.hindawi.com Volume 2018
BiodiversityInternational Journal of
Hindawiwww.hindawi.com Volume 2018
EcologyInternational Journal of
Hindawiwww.hindawi.com Volume 2018
Hindawiwww.hindawi.com
Applied &EnvironmentalSoil Science
Volume 2018
Forestry ResearchInternational Journal of
Hindawiwww.hindawi.com Volume 2018
Hindawiwww.hindawi.com Volume 2018
International Journal of
Geophysics
Environmental and Public Health
Journal of
Hindawiwww.hindawi.com Volume 2018
Hindawiwww.hindawi.com Volume 2018
International Journal of
Microbiology
Hindawiwww.hindawi.com Volume 2018
Public Health Advances in
AgricultureAdvances in
Hindawiwww.hindawi.com Volume 2018
Agronomy
Hindawiwww.hindawi.com Volume 2018
International Journal of
Hindawiwww.hindawi.com Volume 2018
MeteorologyAdvances in
Hindawi Publishing Corporation http://www.hindawi.com Volume 2013Hindawiwww.hindawi.com
The Scientific World Journal
Volume 2018Hindawiwww.hindawi.com Volume 2018
ChemistryAdvances in
Scienti�caHindawiwww.hindawi.com Volume 2018
Hindawiwww.hindawi.com Volume 2018
Geological ResearchJournal of
Analytical ChemistryInternational Journal of
Hindawiwww.hindawi.com Volume 2018
Submit your manuscripts atwww.hindawi.com