assessment of gene flow across a hybrid zone in red-tailed
TRANSCRIPT

Molecular Ecology (2009) 18, 3097–3109 doi: 10.1111/j.1365-294X.2009.04196.x
Assessment of gene flow across a hybrid zone in red-tailedchipmunks (Tamias ruficaudus)
SARAH HIRD and JACK SULLIVAN
Department of Biological Sciences, Box 443051, University of Idaho, Moscow, ID 83844-3051, USA
Corresponde
jacks@uidaho
� 2009 Black
Abstract
The role of hybridization in animal speciation is controversial and recent research has
challenged the long-standing criterion of complete reproductive isolation to attain species
status. The speciation-with-gene-flow model posits that the genome is semi-permeable and
hybridization may be a phase in the process of divergence. Here, we apply these concepts
to a previously identified zone of mtDNA introgression between the two strongly morpho-
logically differentiated subspecies of red-tailed chipmunk (Tamias ruficaudus) in the US
Inland Northwest. Using multilocus genotype data from the southern, older contact zone,
we demonstrate that neutral gene flow is unusually low between the subspecies across the
Lochsa River. This is geographically congruent with the discontinuity in bacular morphology,
indicating that the cline of mitochondrial DNA (mtDNA) haplotypes is displaced. Furthermore,
we elucidate the evolutionary forces responsible by testing hypotheses of lineage sorting
and hybridization. We determined that introgressive hybridization is the cause of mtDNA/
morphology incongruence because there are non-zero levels of migration and gene flow.
Although our estimate of the age of the hybrid zone has wide credibility intervals, the
hybridization events occurred in the Late Pleistocene and the divergence occurred in the
Middle Pleistocene. Finally, we assessed substructure within and adjacent to the hybrid
zone and found that the hybrid zone constitutes a set of populations that are genetically
differentiated from parental sets of populations; therefore, hybridization in this system is
not likely an evolutionary sink, but has generated novel combinations of genotypes.
Keywords: gene flow, hybridization, introgression, Tamias
Received 31 July 2008; revision received 14 March 2009; accepted 17 March 2009
Introduction
Understanding the significance of hybridization is a
long-standing goal of evolutionary biology (Darwin 1859).
In plants, hybridization is well established as a generator
of variation and a source of new species (e.g. Rieseberg
et al. 1999). Among animals, however, hybridization has
classically been considered to be rare and to act in
opposition to divergence (e.g. Dobzhansky 1951; Mayr
1963). However, recent studies challenge this position
and demonstrate that hybridization can have varied
consequences. For example, hybridization may induce
speciation (Meyer et al. 2006) and hybrid zones can act
as genetic filters between taxa (Martinsen et al. 2001), can
permit introgression of sexually selected characters (Parsons
nce: Jack Sullivan, Fax: 208-885-7905; E-mail:
.edu
well Publishing Ltd
et al. 1993), or result in increased fitness under certain
conditions (Veen et al. 2001).
A well-documented consequence of hybridization is
introgression of mitochondrial DNA (mtDNA), where
the entire organellar genome crosses a morphological/
taxonomic boundary and spreads over significant
geographical distance without apparent disruption of the
nuclear genome (e.g. Ferris et al. 1983; Tegelstrom 1987).
Thus, Wu (2001) postulated that speciation may proceed
through a phase in which a semi-permeable barrier separates
genomes. During this transient phase, introgression at
some loci can be tolerated whereas other loci are resistant
to introgression. This permits divergence between nascent
species to continue despite incomplete reproductive isolation,
one consequence of which is that gene trees for introgressing
loci will differ from the true species tree. In instances of
hybridization, a single gene tree may therefore be incon-
gruent with the species phylogeny, but, when interpreted

Fig. 1 Distribution of Tamias ruficaudus including sampling localities. (a) White dots correspond to localities used in the transect; 1 is the
North Fork of the Clearwater River, 2 is the Lochsa River. Bacular morphologies are shown in the same scale and in the shading of their
subspecies. (b) Mitochondrial DNA frequencies overlaid on localities (black, eastern clade; white, western clade; gray, Clearwater clade
see Fig. 4). Clearwater clade is outlined in dashed line.
3098 S . HIRD and J . SULLIVAN
with gene trees from other loci, may elucidate historical
or current introgressive processes. Maternally inherited
markers (mitochondrial and chloroplast DNA) may be
more prone to misleading phylogenetic history, as they can
introgress with very low levels of gene flow (Ballard &
Whitlock 2004) and spread quickly (Chan & Levin 2005).
Additionally, incomplete lineage sorting of ancestral
polymorphism can leave a signal indistinguishable from
hybridization, especially if only one or a few loci are examined.
Therefore, interpreting phylogenetic signal and differenti-
ating between lineage sorting and hybridization will often
require data from multiple unlinked loci.
Chipmunks (Tamias) provide an excellent model to study
the effect of hybridization on speciation. Although many of
the 23 species of chipmunks in western North America
(subgenus Neotamias) are difficult to distinguish using
external or cranial characters, variation in the baculum, or
os penis, has long been the key taxonomic character in the
genus (e.g. White 1953; Sutton 1995; Sutton & Patterson
2000). Because the baculum is conserved within species, yet
exhibits stark discontinuities among them, discontinuities
in bacular morphology have been proposed to be a
mechanical reproductive barrier (White 1953; Patterson &
Thaeler 1982). However, interspecific mitochondrial intro-
gression has been documented between non-sister species
Tamias ruficaudus and Tamias amoenus (Good et al. 2003,
2008), indicating bacular morphology may not impose any
such barrier.
Tamias ruficaudus (red-tailed chipmunk), a northern Rocky
Mountains endemic, consists of two subspecies (the eastern
Tamias ruficaudus ruficaudus and the western Tamias ruficaudus
simulans) that meet at two contact zones: along the Lochsa
River in central Idaho, and northeast of Whitefish, Montana
(Fig. 1). Patterson & Heaney (1987) postulated that these
taxa represent full species based on the degree of bacular
differentiation (Fig. 1); however, since they did not know
the location or extent of contact between these subspecies
they refrained from formally recommending elevation of
each to species status. Good & Sullivan (2001) precisely
located and sampled two contact zones between the
subspecies and confirmed the discontinuity in bacular
morphology at each. The subspecific bacular morphs are
significantly different in multivariate space (canonical
variates analysis, Good et al. 2003) and no intermediate
morphologies were recorded (Good & Sullivan 2001).
Additionally, Good & Sullivan (2001) found two major
mtDNA clades (4.7% uncorrected sequence divergence),
largely corresponding to the two subspecies: an eastern
clade, present in almost all T. r. ruficaudus individuals and
a western clade, found only in T. r. simulans. Contrasting
with the pattern of bacular variation, and suggestive of
incomplete reproductive isolation, there is unidirectional
� 2009 Blackwell Publishing Ltd

HYBRID ZONE IN CH IPMUNK SUBSPECIES 3 09 9
mtDNA introgression at both contact zones (Good &
Sullivan 2001). At the southern contact zone, the eastern
mtDNA clade has introgressed approximately 150 km
north and west of the Lochsa River into T. r. simulans; at the
northern contact zone, the eastern mtDNA haplotypes
have introgressed west less than 25 km (into T. r. simulans).
Good & Sullivan (2001) also identified a third, small
mitochondrial haplogroup (the Clearwater clade) that is
sister to the widespread eastern clade that complicates the
simple mtDNA introgression hypothesis (Fig. 1). It occurs
only in populations within 60 km of the contact zone, is not
fixed in any population and occurs on both sides of the
Lochsa River (thus, in both morphologically defined
subspecies).
Given that the mtDNA and morphological markers do
not coincide geographically, our first aim here was to assess
patterns of genetic variation across the Lochsa River (the
southern subspecies boundary) at neutral, nuclear loci (i.e.
microsatellites). We hypothesized that the mtDNA is intro-
gressing across the Lochsa River, and that variation at
microsatellite loci will demonstrate strong differentiation
across the river (the morphological boundary). Alternatively,
if the mtDNA clades delimit the subspecies boundary, the
bacular contact zone is displaced; in this case, microsatellite
loci will be coincident with mtDNA clades. Thus, we used
10 microsatellite loci to evaluate these hypotheses.
Our second aim was to elucidate the roles of hybridization
and incomplete lineage sorting in the system, two processes
which can leave similar phylogenetic signal. We hypothes-
ized that hybridization is responsible for the introgression
since the purported hybrids are geographically restricted.
Alternatively, incomplete lineage sorting may have allowed
ancestral haplotypes to persist, despite total lack of gene flow.
To distinguish between these, we use our multilocus data
and coalescent analysis to estimate relevant parameters;
this, in turn, permits us to assess the role of hybridization
as a diversity-generating process.
Our final aim was to assess the relative timing and amount
of gene flow between the subspecies in order to place
hybridization events in temporal context and to establish
an ecological context. Integration of morphology, nuclear
data, mtDNA, coalescent theory and geology provides
well-supported conclusions regarding the difficult
problem of detecting and understanding hybridization
in natural systems and the role of hybridization in animal
speciation.
Materials and methods
Sampling and DNA extraction
In total, 191 chipmunks were sampled between 1999 and
2007. Along the Lochsa transect, we collected 64 Tamias
ruficaudus simulans from five localities and 46 Tamias
� 2009 Blackwell Publishing Ltd
ruficaudus ruficaudus from four localities. In addition, to put
transect data in a broader context, we sampled 44 T. r.
simulans and 37 T. r. ruficaudus from locations well away
from the transect (Fig. 1, Table S1, Supporting information).
A particularly relevant aspect of the current sampling
regime is that three localities (48, 54, and 58) are each
composed of paired traplines run on opposite banks of the
Lochsa River (Fig. 1).
Genomic DNA was extracted from ear clips (stored in 90%
ethanol), livers or kidneys, using either the cetyltrimethyl
ammonium bromide/dodecyltrimethyl ammonium bro-
mide (CTAB/DTAB) protocol (Gustincich et al. 1991) or the
Animal Tissue protocol with a DNeasy Tissue Kit (QIAGEN).
Animal use protocols were approved by the University of
Idaho IACUC (protocol: UIACUC-2005-40).
Genotyping microsatellites
Ten microsatellite loci were amplified using primer pairs
(forward and reverse) and polymerase chain reaction (PCR)
protocols from Schulte-Hostedde et al. (2000): EuAmMS26,
EuAmMS35, EuAmMS37, EuAmMS41, EuAmMS86,
EuAmMS94, EuAmMS108, EuAmMS114, EuAmMS138
and EuAmMS142 (the loci will be referred to by the
numerical portion of their names hereafter). The forward
primer of each pair was fluorescently labelled using 6-
FAM, HEX, NED, PET, TET or VIC [Applied Biosystems,
Inc. (ABI)] on the 5¢ end for detection on an ABI 3130. Based
on availability and annealing temperature, primers 26/35,
41/138 and 108/114/142 were multiplexed.
PCR amplifications of 20 lL were performed using
100 lg of genomic DNA, 0.75 lM of labelled primer, 1.5 lM
unlabelled primer, 2.5 mM dNTP, 1· PCR buffer (Invitrogen
Corp.), 1.5 mM MgCl2 (Invitrogen), 0.2 U Taq polymerase
(Invitrogen). PCR programmes consisted of an initial
denaturing step of 94 �C for 3 min, followed by 32 cycles of
45 s at 94 �C, 45 s at appropriate annealing temperature
(Schulte-Hostedde et al. 2000), 45 s at 72 �C. One and a half
microlitres of PCR product were added to 10 lL Hi-Di (ABI)
and 0.3 lL GeneScan LIZ-500 size standard and run on an
ABI 3130. Alleles were visualized and called using Gene-
Mapper (ABI).
Mitochondrial DNA sequencing and analysis
An approximately 800-bp segment of cytochrome b was
amplified following the protocols in Good et al. (2003). The
primers were designed specifically for chipmunks (Good
& Sullivan 2001) and amplify a fragment that exhibits
appropriate variation for this intraspecific study (4.7%
uncorrected divergence between subspecies, Good &
Sullivan 2001). PCR products were sequenced on an ABI
3130, and sequence editing and alignment were conducted
using Sequencher (Gene Codes Corp.). The complete

3100 S . HIRD and J . SULLIVAN
mtDNA data set contained 154 of the 191 T. ruficaudus
individuals and five outgroup individuals (three Tamias
amoenus and two Tamias townsendii); the data set was then
pruned so that all individual fragments were of the same
size (679 bp). This is adequate for our purpose, which is not
to reconstruct the mtDNA gene tree fully, but to resolve
to which mtDNA clade individuals belong. To ease
computational load, we then condensed redundant sequences
using MacClade (version 4.06; Maddison & Maddison
2003), which resulted in 52 unique sequences. We used
DT-ModSel (Minin et al. 2003) to select the simplest model
that is expected to perform well in phylogeny estimation
(Sullivan & Joyce 2005). We used PAUP* 4.0 (Swofford 2000)
to conduct an iterative maximum-likelihood (ML) search
following Sullivan et al. (2005). Nodal support was evaluated
via bootstrap analysis (Felsenstein 1985) with 500 bootstrap
replicates and only a single tree held at a time (i.e.
MaxTree ¼ 1). In addition, we assessed nodal support using
posterior probabilities generated by MrBayes (Huelsenbeck
& Ronquist 2001; Ronquist & Huelsenbeck 2003). Over
two independent runs, we ran four Metropolis-coupled
Markov chains for at least 5 · 106 generations. Convergence
was assessed using the standard deviation of split frequencies
and in both replicates, these were < 0.006 after 1.5 · 106 gen-
erations, which were discarded. We then filtered trees from
the remaining generations, combined runs and obtained the
partition frequencies. Haplotypes were assigned following
Good et al. (2003). All newly generated sequences were
uploaded to GenBank under accession nos FJ785647–
FJ785715.
Microsatellite diversity, population structure andhybridization
We used GenePop 3.4 (Raymond & Rousset 1995) to test
Hardy–Weinberg Equilibrium (HWE), estimate actual and
expected levels of heterozygosity. We assessed differentia-
tion within and among subspecies and populations and
calculated population level pairwise FST and RST.
Due to the possibility of recent divergence and low levels
of differentiation between the subspecies, we used a variety
of assignment methods. First, we used the program Struc-
ture (Pritchard et al. 2000) to estimate individual admixture
and population assignment without a priori assumptions
of population subdivision. Under the admixture model,
Structure estimates co-ancestry coefficients for individuals
in each of k populations. This is a robust model that can be
tailored to address a variety of questions and test assump-
tions. We ran six replicates with a burn-in of 5.0 · 104
followed by 1.5 · 105 subsequent generations for each value
of k, ranging from 1 to 26. The upper bound is equal to the
number of collection localities, corresponding to the hypoth-
esis that each collection locality is genetically differentiated.
The second-order rate of change of the likelihood function
(Dk, Evanno et al. 2005) was used to detect the amount of
structuring beyond which further subdivision does not sub-
stantially improve the fit of the admixture model. In addi-
tion, we used reversible jump Markov chain Monte Carlo
(MCMC) implemented in the program Structurama (Huel-
senbeck & Andolfatto 2007) to calculate the posterior proba-
bility distribution of k when it is treated as a random
variable and a Dirichlet process prior is assumed. We set the
mean expected prior number of populations to two and this
set the prior probabilities for k ¼ 1 through k ¼ 5 to 0.3597
(k ¼ 1), 0.3766 (k ¼ 2), 0. 1876 (k ¼ 3), 0.0596 (k ¼ 4) and
0.0137 (k ¼ 5). We ran the MCMC for 100 000 generations with
a sample frequency of 25 generations. This led to 4000 observa-
tions, the first 100 of which were discarded as burn-in.
Because neither of the above approaches is explicitly
designed to assign individuals into hybrid classes, we used
NewHybrids (Anderson & Thompson 2002) to estimate
posterior probabilities that each individual is pure parental,
F1, F2 or backcrossed, without a priori population assign-
ment. This program is best used with large samples from a
small geographical area to increase likelihood of detection
of first-generation migrants. However, here we applied
it to a sample from across the contact zone in order to
increase our chance of detecting movement of recent
hybrids across it. We ran two replicate analyses, each
consisting of a burn-in of 1 · 104 followed by 1 · 104 genera-
tions, as recommended by Anderson & Thompson (2002).
We ran a single long run, with a burn-in of 2.5 · 104, followed
by 1 · 105 generations to corroborate results. We then used
BayesAss (Wilson & Rannala 2003) for assignment because
it does not assume HWE within samples. It can identify
migrants and F1 hybrids and assess recent migration rates,
thus providing an independent assessment of individual
assignment, despite being limited by its single hybrid class.
Data were partitioned by subspecies and chains were run
for 3 · 106 iterations.
Fifth, we used GeneClass2 (Piry et al. 2004) to detect first
generation (F0) migrants. We used a Bayesian method
(Rannala & Mountain 1997), for the likelihood computa-
tions (L ¼ Lhome/Lmax) and set the acceptance threshold at
0.01. We calculated the probability that the individual was
not a migrant using the Paetkau et al. (2004) simulation
algorithm on 1000 simulated individuals with alpha set to
0.01. We also used the program to assign/exclude source
populations for all individuals, which we grouped by
subspecies, using the same likelihood and simulation
settings as above. GeneClass2 is fast and versatile and most
useful for paternity assignment when parentals are known.
Coalescent analysis
We used the coalescent-based program IM (Hey & Nielsen
2004) to estimate the following parameters: effective
population size of T. r. simulans (hTRS), T. r. ruficaudus (hTRR),
� 2009 Blackwell Publishing Ltd

HYBRID ZONE IN CH IPMUNK SUBSPECIES 3 10 1
and the ancestral T. ruficaudus population (hTR), migration
rate from T. r. simulans into T. r. ruficaudus (mTRR), and from
T. r. ruficaudus into T. r. simulans (mTRS) and time since diver-
gence (tdiv). These analyses were applied to the mtDNA data
set (n ¼ 153) partitioned by subspecies (i.e. following bacular
morphology). Upper bounds for priors were estimated
through a series of preliminary runs. A burn-in of 2 · 105
was followed by at least 5.0 · 106 additional generations.
Three independent runs were completed (lowest ESS > 200).
We also assessed the distributions of the number of migra-
tion events and mean timing of the migration events (tmig)
occurring over the course of the MCMC simulation (Won &
Hey 2005). To convert the parameters h and t into effective
population size (Ne) and years (T) respectively, we used a
gene mutation rate of 3.4 · 10)6 substitutions/locus/year. The
migration parameter, m, was converted to migrants per year
(M) by multiplying m and h.
IM is a powerful analytical tool that estimates many
parameters simultaneously. However, it assumes a biolog-
ically simple model (e.g. geographical subdivisions within
ancestral population and a single bifurcating history) that
nevertheless includes a large number of parameters. We
applied this model to our data despite likely violations
and interpret the results in the light of the biases that this
may cause.
Bacular morphotype
Data on seven variables were used to construct a discriminant
function equation; these variables were shaft length (SL),
tip length (TL), tip angle (TA), keel height (KH), neck
height (NH), shaft height (SH) and basal width (BW)
(Good et al. 2003). We used the program SPSS (SPSS Inc.),
which output this equation: [–20.597 + (5.829 · SL) +
(0.054 · TL) + (0.032 · TA) + (–7.449 · KH) + (8.212 · NH) +
Table 1 Observed number of alleles (A), genetic diversity corrected
heterozygosity (HE) and deviations from HWE (P) for each subspecies
Locus
Tamias ruficaudus simulans (107) Tamias ruficau
A A* HO H P A A*
26 11 10.9 0.623 0.839 < 0.01 10 9.9
35 11 10.6 0.762 0.829 0.78 11 11
37 16 15.3 0.825 0.889 0.09 12 12
41 9 8.1 0.636 0.627 0.78 8 7.8
86 10 9.7 0.696 0.805 < 0.01 10 9.9
94 11 10.7 0.858 0.83 0.75 14 13.9
108 12 10.9 0.726 0.797 0.03 11 10.9
114 24 22 0.874 0.887 0.65 14 13.9
138 9 8.9 0.841 0.84 0.9 6 5.8
142 27 25.4 0.895 0.937 0.19 19 18.9
Avg 14 13.2 0.774 0.828 11.5 11.4
SE 2.03 1.86 0.03 0.03 1.14 1.15
� 2009 Blackwell Publishing Ltd
(0.919 · SH) + (–6.753 · BW)]. Our sampling was restricted
to individuals collected before 2003 but the results were
extrapolated to all individuals within traditional subspecies
ranges since no intermediates have been recorded and we
have never seen population level polymorphism in bacular
types; additionally, the equation correctly assigned ten
individuals not used to construct the equation. Individuals
with a positive DFA score were assigned a hybrid index of
0 and negative values received a score of 1.
Results
Microsatellite diversity
All loci were polymorphic within subspecies, with an average
of 15.2 alleles per locus and a range of 6–27 (sample-
size adjusted values were mean ¼ 13.1; range ¼ 5.8–25.4).
Observed heterozygosity (HO) ranged from 0.405 to 0.895;
across all samples, HO was greater than 0.6 for all loci.
Expected heterozygosity (HE) ranged from 0.457 to 0.937
(Table 1).
Exact tests for HWE on all loci in each population and
subspecies indicated that assumptions of the assignment
tests are not strongly violated. Within the 24 populations,
only four of the 140 tests deviate from HWE (P < 0.05);
within subspecies, seven of the 20 tests were significant
(P < 0.05, Table 1). This increase in rejection rate is most
likely attributable to combining populations that are
genetically distinct (i.e. ignoring unassessed subdivision,
the Wahlund effect). Of these results, significance did not
cluster by locus, further suggesting that the markers are
suitable for analysis. A global test (Fisher’s method) for
linkage disequilibrium within subspecies indicated two of
46 pairwise comparisons deviated from the null hypothesis
of genotypes being independent across loci (P < 0.05).
for sample size (A*), observed heterozygosity (HO), expected
dus ruficaudus (84) Total (191)
HO H P A A* HO H
0.783 0.838 0.26 13 11.4 0.693 0.839
0.766 0.831 < 0.01 12 11 0.764 0.83
0.818 0.878 0.4 17 15.8 0.822 0.884
0.786 0.764 0.52 10 8.1 0.702 0.688
0.81 0.816 0.35 12 10.4 0.746 0.81
0.768 0.82 < 0.01 14 12.3 0.819 0.826
0.778 0.834 0.14 14 10.7 0.749 0.813
0.747 0.853 0.01 24 19.8 0.819 0.872
0.405 0.457 0.21 9 8.4 0.649 0.672
0.788 0.888 0.01 27 23.3 0.849 0.916
0.745 0.798 15.2 13.1 0.761 0.815
0.04 0.04 1.87 1.58 0.02 0.02

Fig. 2 Measurements of population likelihood. Black line is the
log likelihood averaged over six Structure runs. Gray line is Dk, or
the greatest change in log likelihood from previous k. Gray bars are
the posterior probability of each k, with expected prior number of
populations set to 2 (using Structurama).
3102 S . HIRD and J . SULLIVAN
The null hypotheses of identical allelic and genotypic
frequency distributions were both rejected (P < 0.001) at all
10 loci between subspecies. The distributions, therefore,
are significantly different. Between subspecies, FST was 0.07
and RST was 0.16; between populations, FST varied from 0 to
0.24 and RST varied from 0 to 0.54 (Table 2).
Population structure and hybridization
Averaged across six replicates, the log-likelihood values
from Structure increased from k ¼ 1 to k ¼ 3 and sharply
decreased after k ¼ 4 (Fig. 2). At k ¼ 4, individuals clustered
into an additional Tamias ruficaudus ruficaudus group and at
k ¼ 5 and higher, the co-ancestry of existing groups further
subdivide with every addition of a partition. However, at k ¼6 and greater, some groups have no individuals with
80% co-ancestry or greater. With k ¼ 2, individuals clus-
tered in a manner largely consistent with bacular
morphology (i.e. according to subspecies); there were 181
individuals assigned to their correct subspecies with > 80%
co-ancestry. The remaining 10 individuals were effectively
admixed, with co-ancestry to either subspecies between
20% and 80%. No individuals were assigned to the wrong
subspecies (i.e. conflicting with bacular type) with greater
than 80% co-ancestry, suggesting no recent migrants.
Furthermore, the paired samples separated by the Lochsa
River (48 S and 48 N; 54 S and 54 N; 58 S and 58 N) contained
individuals with almost no co-ancestry with the sample
from across the river (Fig. 3). The analysis with k ¼ 3 had
the second highest Dk score (Evanno et al. 2005) and, from
Structurama, the highest posterior probability [0.9068; the
second highest was k ¼ 4 (0.0888), Fig. 2]. These three par-
titions are congruent with other data: the three groups cor-
respond to (i) individuals with Tamias ruficaudus simulans
bacula and Western mtDNA, (ii) individuals with T. r. sim-
ulans bacula but Eastern mtDNA (i.e. individuals with int-
rogressed mtDNA), and (iii) individuals with T. r.
ruficaudus bacula and Eastern mtDNA (Fig. 3).
Of the 84 T. r. ruficaudus individuals, 74 were assigned by
NewHybrids to a pure parental class, four of the remaining
10 were assigned with > 80% probability to the F2 class and
six individuals were not assigned to any class with probabil-
ity > 80%. A second pure parental class was not identified;
of the 107 T. r. simulans individuals, 42 were assigned to the
F2 class, five to the backcrossed (with T. r. simulans) class
and 60 individuals were not assigned to any class.
The assignment test BayesAss determined that 188 of the
191 individuals had > 90% probability of assignment to the
appropriate subspecies as defined by bacular morphology.
The remaining three individuals (one T. r. simulans and two
T. r. ruficaudus) were assigned as hybrids with 47.3%, 89.7%
and 35.4% confidence (respectively). No individuals were
assigned to the incorrect subspecies (i.e. no migrant indi-
viduals were inferred). The results from GeneClass2 were
similar; 98% of our individuals were correctly assigned.
Three T. r. simulans and four T. r. ruficaudus individuals had
higher probability of belonging to the opposite subspecies
(thus, were migrants). All three T. r. simulans and one T. r.
ruficaudus individuals were significant (P < 0.01).
Coalescent analysis
The three independent IM runs converged on similar
results, which were averaged (Table 3). Across the runs, the
effective female population size (Nef) of T. r. simulans
averaged slightly over 6.1 · 106; Nef of T. r. ruficaudus was
2.4 · 106 and the Nef of the ancestral T. ruficaudus population
was 5.6 · 106. The value for migrants into T. r. simulans
(MTRS) was 0.3 migrants/year and MTRR was 10 migrants/
year; Tdiv was approximately 325 000 years ago. In addition,
we assessed the number of migration events and Tmig; the
highest posterior probability for number of migration
events into T. r. simulans was similar for both zero and one
[p(0) ¼ 0.21911; p(1) ¼ 0.20675] and into T. r. ruficaudus was
five [p(5) ¼ 0.17779]. The mean timings of these events
were 39 589 years ago (into T. r. simulans) and 48 387 years
ago (into T. r. ruficaudus).
Discussion
Aim 1: subspecies boundary
The morphological differentiation between the bacula
of the two subspecies, T. r. ruficaudus and T. r. simulans, is
statistically significant; this is a key taxonomic character in
rodents, especially in sciurids (including chipmunks).
Despite the bacular types being sufficiently differentiated
to have led Patterson & Heaney (1987) to suggest the
possibility of distinct species status for each subspecies,
� 2009 Blackwell Publishing Ltd
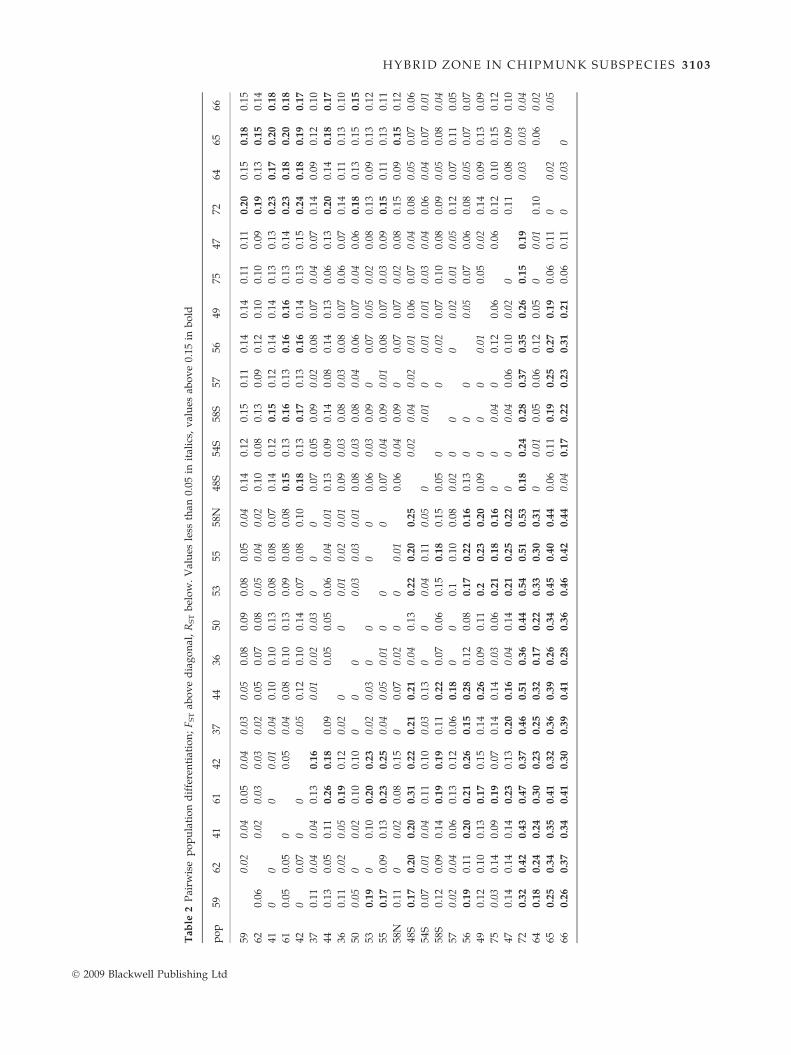
Tab
le2
Pai
rwis
ep
op
ula
tio
nd
iffe
ren
tiat
ion
;F
ST
abo
ve
dia
go
nal
,R
ST
bel
ow
.V
alu
esle
ssth
an0.
05in
ital
ics,
val
ues
abo
ve
0.15
inb
old
po
p59
6241
6142
3744
3650
5355
58N
48S
54S
58S
5756
4975
4772
6465
66
590.
020.
040.
050.
040.
030.
050.
080.
090.
080.
050.
040.
140.
120.
150.
110.
140.
140.
110.
110
.20
0.15
0.1
80.
15
620.
060.
020.
030.
030.
020.
050.
070.
080.
050.
040.
020.
100.
080.
130.
090.
120.
100.
100.
090
.19
0.13
0.1
50.
14
410
00
0.01
0.04
0.10
0.10
0.13
0.08
0.08
0.07
0.14
0.12
0.1
50.
120.
140.
140.
130.
130
.23
0.1
70
.20
0.1
8
610.
050.
050
0.05
0.04
0.08
0.10
0.13
0.09
0.08
0.08
0.1
50.
130
.16
0.13
0.1
60
.16
0.13
0.14
0.2
30
.18
0.2
00
.18
420
0.07
00
0.05
0.12
0.10
0.14
0.07
0.08
0.10
0.1
80.
130
.17
0.13
0.1
60.
140.
130.
150
.24
0.1
80
.19
0.1
7
370.
110.
040.
040.
130
.16
0.01
0.02
0.03
00
00.
070.
050.
090.
020.
080.
070.
040.
070.
140.
090.
120.
10
440.
130.
050.
110
.26
0.1
80.
090.
050.
050.
060.
040.
010.
130.
090.
140.
080.
140.
130.
060.
130
.20
0.14
0.1
80
.17
360.
110.
020.
050
.19
0.12
0.02
00
0.01
0.02
0.01
0.09
0.03
0.08
0.03
0.08
0.07
0.06
0.07
0.14
0.11
0.13
0.10
500.
050
0.02
0.10
0.10
00
00.
030.
030.
010.
080.
030.
080.
040.
060.
070.
040.
060
.18
0.13
0.15
0.1
5
530
.19
00.
100
.20
0.2
30.
020.
030
00
00.
060.
030.
090
0.07
0.05
0.02
0.08
0.13
0.09
0.13
0.12
550
.17
0.09
0.13
0.2
30
.25
0.04
0.05
0.01
00
00.
070.
040.
090.
010.
080.
070.
030.
090
.15
0.11
0.13
0.11
58N
0.11
00.
020.
080.
150
0.07
0.02
00
0.01
0.06
0.04
0.09
00.
070.
070.
020.
080.
150.
090
.15
0.12
48S
0.1
70
.20
0.2
00
.31
0.2
20
.21
0.2
10.
040.
130
.22
0.2
00
.25
0.02
0.04
0.02
0.01
0.06
0.07
0.04
0.08
0.05
0.07
0.06
54S
0.07
0.01
0.04
0.11
0.10
0.03
0.13
00
0.04
0.11
0.05
00.
010
0.01
0.01
0.03
0.04
0.06
0.04
0.07
0.01
58S
0.12
0.09
0.14
0.1
90
.19
0.11
0.2
20.
070.
060.
150
.18
0.15
0.05
00
0.02
0.07
0.10
0.08
0.09
0.05
0.08
0.04
570.
020.
040.
060.
130.
120.
060
.18
00
0.1
0.10
0.08
0.02
00
00.
020.
010.
050.
120.
070.
110.
05
560
.19
0.11
0.2
00
.21
0.2
60
.15
0.2
80.
120.
080
.17
0.2
20
.16
0.13
00
00.
050.
070.
060.
080.
050.
070.
07
490.
120.
100.
130
.17
0.15
0.14
0.2
60.
090.
110
.20
.23
0.2
00.
090
00
0.01
0.05
0.02
0.14
0.09
0.13
0.09
750.
030.
140.
090
.19
0.07
0.14
0.14
0.03
0.06
0.2
10
.18
0.1
60
00.
040
0.12
0.06
0.06
0.12
0.10
0.15
0.12
470.
140.
140.
140
.23
0.13
0.2
00
.16
0.04
0.14
0.2
10
.25
0.2
20
00.
040.
060.
100.
020
0.11
0.08
0.09
0.10
720
.32
0.4
20
.43
0.4
70
.37
0.4
60
.51
0.3
60
.44
0.5
40
.51
0.5
30
.18
0.2
40
.28
0.3
70
.35
0.2
60
.15
0.1
90.
030.
030.
04
640
.18
0.2
40
.24
0.3
00
.23
0.2
50
.32
0.1
70
.22
0.3
30
.30
0.3
10
0.01
0.05
0.06
0.12
0.05
00.
010.
100.
060.
02
650
.25
0.3
40
.35
0.4
10
.32
0.3
60
.39
0.2
60
.34
0.4
50
.40
0.4
40.
060.
110
.19
0.2
50
.27
0.1
90.
060.
110
0.02
0.05
660
.26
0.3
70
.34
0.4
10
.30
0.3
90
.41
0.2
80
.36
0.4
60
.42
0.4
40.
040
.17
0.2
20
.23
0.3
10
.21
0.06
0.11
00.
030
HYBRID ZONE IN CH IPMUNK SUBSPECIES 3 10 3
� 2009 Blackwell Publishing Ltd

Fig. 3 Hybrid indices. (a) Distribution of co-ancestry coefficients, averaged within populations for k ¼ 3 (using Structure) overlaid on
subspecies distributions (light gray ¼ Tamias ruficaudus simulans; dark gray ¼ Tamias ruficaudus ruficaudus). Populations that have both a
north shore and a south shore collection were split into two smaller pies to represent the two localities. (b) Hybrid indices along the transect
for morphology (black line, 1.0 is equivalent to a negative score in our discriminant function equation and 0 is a positive score), nuclear
microsatellite date (dashed gray line, co-ancestry coefficients are averaged within populations) and mtDNA haplotypes (solid gray line,
calculated as percentage of individuals belonging to the western clade); scaled to distance from the Lochsa River. (c) Comparison of all
populations: bacular morphotype (white ¼ T. r. simulans, black ¼ T. r. ruficaudus), averaged co-ancestry coefficients for k ¼ 2 and k ¼ 3 from
Structure, and mtDNA [percentage of individuals in the western {white} and eastern {black} clades]. Population numbers given and ordered
roughly northwest to southeast.
3104 S . HIRD and J . SULLIVAN
� 2009 Blackwell Publishing Ltd
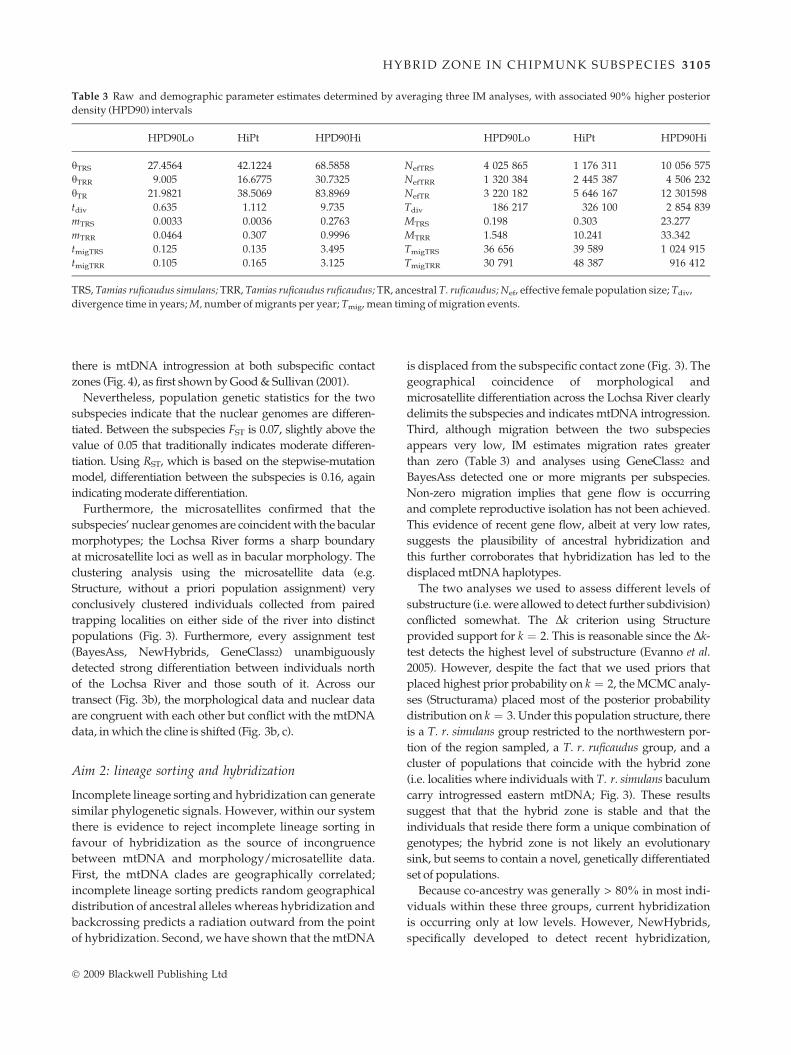
Table 3 Raw and demographic parameter estimates determined by averaging three IM analyses, with associated 90% higher posterior
density (HPD90) intervals
HPD90Lo HiPt HPD90Hi HPD90Lo HiPt HPD90Hi
hTRS 27.4564 42.1224 68.5858 NefTRS 4 025 865 1 176 311 10 056 575
hTRR 9.005 16.6775 30.7325 NefTRR 1 320 384 2 445 387 4 506 232
hTR 21.9821 38.5069 83.8969 NefTR 3 220 182 5 646 167 12 301598
tdiv 0.635 1.112 9.735 Tdiv 186 217 326 100 2 854 839
mTRS 0.0033 0.0036 0.2763 MTRS 0.198 0.303 23.277
mTRR 0.0464 0.307 0.9996 MTRR 1.548 10.241 33.342
tmigTRS 0.125 0.135 3.495 TmigTRS 36 656 39 589 1 024 915
tmigTRR 0.105 0.165 3.125 TmigTRR 30 791 48 387 916 412
TRS, Tamias ruficaudus simulans; TRR, Tamias ruficaudus ruficaudus; TR, ancestral T. ruficaudus; Nef, effective female population size; Tdiv,
divergence time in years; M, number of migrants per year; Tmig, mean timing of migration events.
HYBRID ZONE IN CH IPMUNK SUBSPECIES 3 10 5
there is mtDNA introgression at both subspecific contact
zones (Fig. 4), as first shown by Good & Sullivan (2001).
Nevertheless, population genetic statistics for the two
subspecies indicate that the nuclear genomes are differen-
tiated. Between the subspecies FST is 0.07, slightly above the
value of 0.05 that traditionally indicates moderate differen-
tiation. Using RST, which is based on the stepwise-mutation
model, differentiation between the subspecies is 0.16, again
indicating moderate differentiation.
Furthermore, the microsatellites confirmed that the
subspecies’ nuclear genomes are coincident with the bacular
morphotypes; the Lochsa River forms a sharp boundary
at microsatellite loci as well as in bacular morphology. The
clustering analysis using the microsatellite data (e.g.
Structure, without a priori population assignment) very
conclusively clustered individuals collected from paired
trapping localities on either side of the river into distinct
populations (Fig. 3). Furthermore, every assignment test
(BayesAss, NewHybrids, GeneClass2) unambiguously
detected strong differentiation between individuals north
of the Lochsa River and those south of it. Across our
transect (Fig. 3b), the morphological data and nuclear data
are congruent with each other but conflict with the mtDNA
data, in which the cline is shifted (Fig. 3b, c).
Aim 2: lineage sorting and hybridization
Incomplete lineage sorting and hybridization can generate
similar phylogenetic signals. However, within our system
there is evidence to reject incomplete lineage sorting in
favour of hybridization as the source of incongruence
between mtDNA and morphology/microsatellite data.
First, the mtDNA clades are geographically correlated;
incomplete lineage sorting predicts random geographical
distribution of ancestral alleles whereas hybridization and
backcrossing predicts a radiation outward from the point
of hybridization. Second, we have shown that the mtDNA
� 2009 Blackwell Publishing Ltd
is displaced from the subspecific contact zone (Fig. 3). The
geographical coincidence of morphological and
microsatellite differentiation across the Lochsa River clearly
delimits the subspecies and indicates mtDNA introgression.
Third, although migration between the two subspecies
appears very low, IM estimates migration rates greater
than zero (Table 3) and analyses using GeneClass2 and
BayesAss detected one or more migrants per subspecies.
Non-zero migration implies that gene flow is occurring
and complete reproductive isolation has not been achieved.
This evidence of recent gene flow, albeit at very low rates,
suggests the plausibility of ancestral hybridization and
this further corroborates that hybridization has led to the
displaced mtDNA haplotypes.
The two analyses we used to assess different levels of
substructure (i.e. were allowed to detect further subdivision)
conflicted somewhat. The Dk criterion using Structure
provided support for k ¼ 2. This is reasonable since the Dk-
test detects the highest level of substructure (Evanno et al.
2005). However, despite the fact that we used priors that
placed highest prior probability on k ¼ 2, the MCMC analy-
ses (Structurama) placed most of the posterior probability
distribution on k ¼ 3. Under this population structure, there
is a T. r. simulans group restricted to the northwestern por-
tion of the region sampled, a T. r. ruficaudus group, and a
cluster of populations that coincide with the hybrid zone
(i.e. localities where individuals with T. r. simulans baculum
carry introgressed eastern mtDNA; Fig. 3). These results
suggest that that the hybrid zone is stable and that the
individuals that reside there form a unique combination of
genotypes; the hybrid zone is not likely an evolutionary
sink, but seems to contain a novel, genetically differentiated
set of populations.
Because co-ancestry was generally > 80% in most indi-
viduals within these three groups, current hybridization
is occurring only at low levels. However, NewHybrids,
specifically developed to detect recent hybridization,

Fig. 4 Maximum-likelihood estimate (HKY +
I) of cytochrome b phylogeny. Unique
haplotypes designated by letter/number
codes, numbers in parentheses represent
number of individuals belonging to that
haplotype. Numbers above internal branches
correspond to maximum-likelihood boot-
strap analysis (PAUP); numbers below
internal branches correspond to posterior
probabilities (MrBayes).
3106 S . HIRD and J . SULLIVAN
identified all T. r. simulans individuals as hybrids with all
T. r. ruficaudus as pure parentals. This program is capable
of inferring hybrids without samples from both parental
populations; increased sampling across the northern half of
the species range may uncover a second pure parental class,
if one exists within T. ruficaudus.
Aim 3: amount and timing of gene flow
The program IM estimates migration and tdiv, as well as
assess the number and timing of migration events (tmig).
Our estimates place the subspecies divergence around
325 000 years ago, although the 90% credibility interval on
the posterior density ranges from 186 000 to over 2 million
years ago (Table 3). This estimate makes reasonable
biological sense, since chipmunks are believed to have
radiated > 2 million years ago and these chipmunks are
still sufficiently similar to exchange genes occasionally but
have distinct bacula.
IM can also assess number of migration events and mean
time of migration events (tmig) and this can be compared to
tdiv, without incorporating a mutation rate. Incomplete
lineage sorting would be supported if there were zero
migration events and/or tmig precedes tdiv. Alternatively,
hybridization is supported if there are multiple hybridization
events and tmig occurs substantially more recently than tdiv.
� 2009 Blackwell Publishing Ltd

HYBRID ZONE IN CH IPMUNK SUBSPECIES 3 10 7
Two of our results, therefore, support hybridization. First,
although zero migration events into T. r. simulans was
slightly better supported than one migration event, the
mtDNA phylogeny suggests there must have been at least
one migration event into T. r. simulans; therefore, there was
at least one migration event per locus per subspecies. Second,
tmig is approximately an order of magnitude less than
tdiv. These values indicate that hybridization events may
have been relatively frequent throughout time and have
occurred since their divergence. Since this is the mean time
of migration events, hybridization may have been occurring
before tmig and possibly quite close to tdiv.
Geologic history
The geologic history of the Inland Northwest supports
a complex history of vicariance and secondary contact
between these two subspecies. With glacial cycles occurring
until around 10 000 years ago, there was ample opportunity
for the range of these two subspecies to be fragmented.
Through the Pleistocene, the northern Rocky Mountains
experienced glaciation, with the Cordilleran ice sheet
extending south through much of the northern half of the
current range of T. ruficaudus (e.g. Delcourt & Delcourt
1993). The Clearwater Drainage has been hypothesized as a
refugium for multiple plant and animal groups throughout
the Pleistocene (Daubenmire 1952; Detling 1968; Brunsfeld
et al. 2001; Carstens et al. 2005). Therefore, the two subspecies
of T. ruficaudus may have had multiple instances of contact
throughout the Pleistocene, with sufficient isolation to
diverge yet enough intermittent contact to permit hybri-
dization on rare occasions.
Clearwater clade and model violation
Good & Sullivan (2001) identified a third mtDNA haplogroup
that is sister to the eastern (primarily T. r. ruficaudus) clade.
In our sample, we had seven T. r. simulans and three T. r.
ruficaudus individuals belonging to this mtDNA group and
all were localized to within 60 km of the Lochsa River
(Fig. 1). Based on this information, several hypotheses
on the history of this marker can be erected. Since the
group occurs in both subspecies, either lineage sorting
or hybridization is responsible for its distribution. The
Clearwater clade is sister to the eastern clade, which means
it was isolated long enough to accumulate mutations
that render it phylogenetically distinct. It would have then
introgressed back into either T. r. ruficaudus or T. r. simulans,
although we cannot assess whether the Clearwater group
first introgressed into T. r. simulans or T. r. ruficaudus.
Increasing the sample sizes around the Lochsa River,
specifically focusing on the localities that have the Clearwater
mtDNA clade would allow appropriate tests. Even without
further testing, the occurrence of this mtDNA haplogroup
� 2009 Blackwell Publishing Ltd
may support the hypothesis that a Clearwater Refugium
existed during the last glacial maxima. Those residents
were isolated from other populations that they merged
with upon secondary contact.
The IM estimates of migration contradict unidirec-
tional introgression of Eastern mtDNA into T. r. simu-
lans, since the estimates for migration are greater going
into T. r. ruficaudus than T. r. simulans. However, this is
likely due to violation of the simple model that assumes
no population subdivision. The inclusion of the Clearwa-
ter clade of mtDNA in this analysis is likely the result of
differentiation of T. r. ruficaudus mtDNA in a Clearwater
refugium, and this haplogroup is only found in and
around the contact zone. As seen in Fig. 1, there are more
T. r. simulans individuals (based on bacular morphology)
with the Clearwater clade mtDNA type than T. r. ruficaudus
individuals. It is likely that IM would infer that the Clearwa-
ter clade is a T. r. simulans clade that is introgressing east;
this would produce estimates of migration rates we
inferred (more introgression from T. r. simulans into T. r.
ruficaudus than vice versa). However, the complex geolog-
ical history (Good & Sullivan 2001) and broader phyloge-
netic analysis (N. Reid, unpublished data) support that
the IM-based conclusion is a spurious effect of model vio-
lation. This suggests that the robustness of phylogeo-
graphical conclusions using the isolation with migration
model needs to be examined systematically. For example,
estimates of migration rates may be less robust to model
violation than coalescent estimates of divergence times
(B. Carstens, unpublished data).
Implications for hybridization research
Classic studies of hybridization and hybrid zones can
be seen as falling broadly into two categories, those that
use clinal analysis to infer patterns of divergent selec-
tion and gene flow between populations by comparing
different markers (e.g. Szymura & Barton 1986; Brumfield
et al. 2001, etc.), and those that are primarily interested in
the importance and frequency of hybrid speciation (e.g.
Rieseberg et al. 1999). We suggest that our study falls
somewhere in between. It is clear that something akin to a
classical tension zone may be operating along the Lochsa
River, where a balance between very strong selection and
dispersal is maintaining a tight cline at many loci; how-
ever, a broader analysis indicates that historical levels of
gene flow between our two putative parental populations
have served to generate a genetically unique daughter
population. These insights could not have been made in a
classical cline-fitting context and the processes that pro-
duced this hybrid zone are perhaps analogous to the pro-
cesses that result in hybrid speciation. That is highly
speculative but it is necessary to be cognizant of both
important approaches in order to draw our conclusions.

3108 S . HIRD and J . SULLIVAN
A second implication of our research involves the use of
mtDNA as a hybrid zone marker. Many studies have
demonstrated that mtDNA can be particularly susceptible
to introgression (reviewed by Funk & Omland 2003). This
introgression has large implications for endeavours such as
the Barcode of Life Initiative, but has frequently been
thought to be of little importance to speciation, because
introgression that is limited to organellar genomes rep-
resents only a small fraction of an organism¢s genome.
However, we have demonstrated that, at least in this case,
introgression of mtDNA has been accompanied by enough
nuclear introgression (as inferred from microsatellite data)
that populations from the hybrid zone (between the North
Fork of the Clearwater and the Lochsa Rivers) are genetically
differentiated from both parentals. Hybrid zone research
that relies heavily or solely on comparisons of mtDNA
with morphology may uncover surprising results with the
incorporation of nuclear loci.
Conclusions
Previous studies have documented that the differentiation
of the bacula of the two red-tailed chipmunks subspecies is
significant; differentiation in mtDNA clades is strong but
not concordant with the bacular boundary. This study
has confirmed that the bacular morphotypes delimit the
subspecies boundary, based on neutral microsatellite data
that partition the samples in a manner precisely congruent
with bacular variation; the eastern mtDNA clade has
therefore introgressed. We have also attempted to elucidate
the reasons for the location and prominence of the three
mtDNA clades, framing our hypotheses in the context of
lineage sorting and hybridization. It is well supported that
hybridization is the source of the introgressed mtDNA types,
as we obtained non-zero estimates for both migration and
gene flow using a variety of methods. The timing of the
hybridization events occurred after the divergence of the
subspecies. Most notably, however, hybridization across
the Lochsa River appears to have resulted in the intro-
gressed populations being differentiated from both putative
parental populations. Thus, hybridization in this system
can be viewed as a diversity-generating process.
Acknowledgements
We thank N. Reid, J. Good, J. Demboski and the UI Mammalogy
classes (1999–2003) for assistance with field collection. L. Waits,
M. Cantrell, J. Yoder and W. Godsoe provided valuable comments on
the manuscript; C. Smith and C. Drummond assisted with analyses.
G. Hewitt and two anonymous reviewers greatly improved the
quality of this manuscript. This work was funded by NSF DEB-
0717426 (to JS). Analyses were run on the bioinformatics core facility
supported by the Initiative for Bioinformatics and Evolutionary
Studies (IBEST) and funded by NHI (NCRR 1P20RRO16448-01)
and NSF (EPS-809935).
References
Anderson EC, Thompson EA (2002) A model-based method for
identifying species hybrids using multilocus genetic data.
Genetics, 160, 1217–1229.
Ballard J, Whitlock M (2004) The incomplete natural history of the
mitochondria. Molecular Ecology, 13, 729–744.
Brumfield RT, Jernigan RW, McDonald DB, Braun MJ (2001)
Evolutionary implications of divergent clines in an avian
(Manacus: Aves) hybrid zone. Evolution, 55, 2070–2087.
Brunsfeld SJ, Sullivan J, Soltis DE, Soltis PS (2001) Comparative
phylogeography of Northwestern North America: a synthesis.
In: Integrating Ecological and Evolutionary Processes in a Spatial
Context (eds Silvertown J, Antonovics J), pp. 319–340. Blackwell
Science, Oxford, UK.
Carstens B, Brunsfeld S, Demboski J, Good J, Sullivan J (2005)
Investigating the evolutionary history of the Pacific northwest
mesic forest ecosystem: hypothesis testing within a comparative
phylogeographic framework. Evolution, 59, 1639–1652.
Chan K, Levin S (2005) Leaky prezygotic isolation and porous
genomes: rapid introgression of maternally inherited DNA.
Evolution, 59, 720–729.
Darwin CR (1859) On the Origin of Species by Means of Natural
Selection, or the Preservation of Favoured Races in the Struggle
for Life. John Murray, London.
Daubenmire R (1952) Plant geography of Idaho. In: Flora of Idaho(ed. Davis RJ), pp. 1–17. Brigham Young University Press,
Provo, Utah.
Delcourt PA, Delcourt HR (1993) Paleoclimates, paleovegetation,
and paleofloras during the late Quaternary. In: Flora North America,
Vol. 1, 1st edn, pp. 71–94. Oxford University Press, New York.
Detling LE (1968) Historical Background of the Flora of the PacificNorthwest. Bulletin No. 13. Museum of Natural History. University
of Oregon, Eugene, Oregon.
Dobzhansky T (1951) Genetics and the Origin of Species, 3rd edn.
Columbia University Press, New York.
Evanno G, Regnaut S, Goudet J (2005) Detecting the number of
clusters of individuals using the software structure: a simulation
study. Molecular Ecology, 14, 2611–2620.
Felsenstein J (1985) Confidence limits on phylogenies: an approach
using the bootstrap. Evolution, 39, 783–791.
Ferris SD, Sage RD, Huang CM, Nielsen JT, Ritte U, Wilson AC
(1983) Flow of mitochondrial DNA across a species boundary.
Proceedings of the National Academy of Sciences, USA, 80, 2290–
2294.
Funk DJ, Omland KE (2003) Species-level paraphyly and polyphyly:
frequency, causes, and consequences, with insights from animal
mitochondrial DNA. Annual Review of Ecology, Evolution and
Systematics, 34, 397–423.
Good J, Hird S, Reid N et al. (2008) Ancient hybridization and
mitochondrial capture between two distantly related species of
chipmunks (Tamias: Rodentia). Molecular Ecology, 17, 1313–1327.
Good JM, Sullivan J (2001) Phylogeography of the red-tailed
chipmunk (Tamias ruficaudus), a northern Rocky Mountain
endemic. Molecular Ecology, 10, 2683–2695.
Good JM, Demboski JR, Nagorsen DW, Sullivan J (2003) Phylo-
geography and introgressive hybridization: chipmunks (genus
Tamias) in the northern Rocky Mountains. Evolution, 57, 1900–
1916.
Gustincich S, Manfioletti G, Delsal G, Schneider C, Carninci P
(1991) A fast method for high-quality genomic DNA extraction
from whole human blood. BioTechniques, 11, 298–302.
� 2009 Blackwell Publishing Ltd

HYBRID ZONE IN CH IPMUNK SUBSPECIES 3 10 9
Hey J, Nielsen R (2004) Multilocus methods for estimating popu-
lation sizes, migration rates and divergence time, with applications
to the divergence of Drosophila pseudoobscura and D. persimilis.
Genetics, 167, 747–760.
Huelsenbeck J, Andolfatto P (2007) Inference of population struc-
ture under a Dirichlet process model. Genetics, 175, 1787–1802.
Huelsenbeck J, Ronquist F (2001) MrBayes: Bayesian inference of
phylogenetic tress. Bioinformatics, 17, 754–755.
Maddison DR, Maddison WP (2003) MacClade. Sinauer & Associates,
Sunderland, Massachusetts.
Martinsen G, Whitham T, Turek R, Keim P (2001) Hybrid popu-
lations selectively filter gene introgression between species.
Evolution, 55, 1325–1335.
Mayr E (1963) Animal Species and Evolution. Belknap Press,
Cambridge, Massachusetts.
Meyer A, Salzburger W, Schartl M (2006) Hybrid origin of a
swordtail species (Telostei: Xiphophorus clemenciae) driven by
sexual selection. Molecular Ecology, 15, 721–730.
Minin V, Abdo Z, Joyce P, Sullivan J (2003) Performance-based
selection of likelihood models for phylogeny estimation. Systematic
Biology, 52, 674–683.
Paetkau D, Slade R, Burden M, Estoup A (2004) Genetic assignment
methods for the direct, real-time estimation of migration rate: a
simulation-based exploration of accuracy and power. Molecular
Ecology, 13, 55–65.
Parsons TJ, Olson SL, Braun MJ (1993) Unidirectional spread of
secondary sexual plumage traits across an avian hybrid zone.
Science, 260, 1643–1646.
Patterson BD, Heaney LR (1987) Preliminary analysis of geographic
variation in red-tailed chipmunks (Eutamias ruficaudus). Journal
of Mammalogy, 68, 782–791.
Patterson BD, Thaeler CSJ (1982) The mammalian baculum:
hypotheses on the nature of bacular variability. Journal of
Mammalogy, 63, 1–15.
Piry S, Alapetite A, Cornuet JM, Paetkau D, Baudouin L, Estoup A
(2004) GeneClass2: a software for genetic assignment and
first-generation migrant detection. Journal of Heredity, 95, 536–
539.
Pritchard JK, Stephens M, Donnelly P (2000) Inference of population
structure using multilocus genotype data. Genetics, 155, 945–
959.
Rannala B, Mountain JL (1997) Detecting immigration by using
multilocus genotypes. Proceedings of the National Academy of
Sciences, USA, 94, 9197–9201.
Raymond M, Rousset F (1995) GenePop (version 1.2): population
genetics software for exact tests and ecumenicism. Journal of
Heredity, 86, 248–249.
Rieseberg LH, Whitton J, Gardner K (1999) Hybrid zones and the
genetic architecture of a barrier to gene flow between two
sunflower species. Genetics, 152, 713–727.
Ronquist F, Huelsenbeck J (2003) MrBayes 3: Bayesian phylogenetic
inference under mixed models. Bioinformatics, 19, 1572–1574.
� 2009 Blackwell Publishing Ltd
Schulte-Hostedde AI, Gibbs HL, Millar JS (2000) Microsatellite
DNA loci suitable for parentage analysis in the yellow-pine
chipmunk (Tamias amoenus). Molecular Ecology, 9, 2180–2181.
Sullivan J, Joyce P (2005) Model selection in phylogenetics. Annual
Review of Ecology, Evolution, and Systematics, 36, 445–466.
Sullivan J, Abdo Z, Joyce P, Swofford DL (2005) Evaluating
the performance of a successive-approximations approach
to parameter optimization in maximum-likelihood phylogeny
estimation. Molecular Biology and Evolution, 22, 1386–1392.
Sutton DA (1995) Problems of taxonomy and distribution in four
species of chipmunks. Journal of Mammalogy, 76, 843–850.
Sutton DA, Patterson BD (2000) Geographic variation of the western
chipmunks Tamias senex and T. siskiyou, with two new subspecies
from California. Journal of Mammalogy, 81, 299–316.
Swofford DL (2000) PAUP*. Phylogenetic Analysis Using Parsimony
(*and Other Methods). Sinauer & Associates, Sunderland,
Massachusetts.
Szymura JM, Barton NH (1986) Genetic analysis of a hybrid zone
between the fire-bellied toads, Bombina bombina and B. variegata,
near Cracow in southern Poland. Evolution, 40, 1141–1159.
Tegelstrom H (1987) Transfer of mitochondrial DNA from the
northern red-backed vole (Clethrionomys rutilus) to the bank
vole (Clethrionomys glareolus). Journal of Molecular Evolution, 24,
218–227.
Veen T, Borge T, Griffith SC et al. (2001) Hybridization and adaptive
mate choice in flycatchers. Nature, 411, 45–50.
White JA (1953) The baculum in the chipmunks of western North
America. University of Kansas Museum of Natural History
Publications, 5, 611–631.
Wilson GA, Rannala B (2003) Bayesian inference of recent migration
rates using multilocus genotypes. Genetics, 163, 1177–1191.
Won YJ, Hey J (2005) Divergence population genetics of chimpanzees.
Molecular Biology and Evolution, 22, 297–307.
Wu C-I (2001) The genic view of the process of speciation. Journal
of Evolutionary Biology, 14, 851–865.
S.H. is interested in chipmunk hybridization and bioinfor-
matics. J.S. is a mammalian systematist.
Supporting information
Additional supporting information may be found in the online
version of this article:
Table S1 Sampling localities for all individuals; latitude and lon-
gitude, number collected (N) and description of localities.
Please note: Wiley-Blackwell are not responsible for the content
or functionality of any supporting information supplied by the
authors. Any queries (other than missing material) should be
directed to the corresponding author for the article.