assessment of hcfc-based air conditioning equipment and...
TRANSCRIPT

Assessment of HCFC-Based Air Conditioning Equipment and Emerging
Alternative Technologies
Final Report
Prepared for
The World Bank Montreal Protocol Operations
Environment Department 1818 H Street, NW
Washington, DC 20433 USA
Prepared by
ICF International 1725 Eye Street, NW
Washington, DC 20006 USA
September 2007
Prepared prior to the HCFC Adjustments agreed upon at the 19th Meeting of the
Parties (MOP) to the Montreal Protocol.

Assessment of HCFC-Based Air Conditioning Equipment and Emerging Alternative Technologies
Table of Contents
1. Introduction................................................................................................................................. 1 2. Background: HCFC Consumption in Article 5 Countries ...................................................... 4 3. Methodology Overview............................................................................................................. 10 4. Chiller Sector............................................................................................................................. 13
4.1 Market Characterization ...................................................................................................... 13 4.2 Alternatives and Barriers/Drivers to Implementation.......................................................... 18 4.3 Projected Transitions ........................................................................................................... 23
5. Small and Large Air Conditioning Sector .............................................................................. 28 5.1 Market Characterization ...................................................................................................... 28 5.2 Alternatives and Barriers/Drivers to Implementation.......................................................... 30 5.3 Projected Transitions ........................................................................................................... 32
6. Summary of Results and Considerations for HCFC Phaseout ............................................. 35 6.1 Market Drivers..................................................................................................................... 36 6.2 Costs and Barriers Associated with HCFC Phaseout .......................................................... 37 6.3 Policy Implications.............................................................................................................. 38
7. References .................................................................................................................................. 39 Appendix 1 –Questionnaire for Key Government and Industry Contacts .................................... 43 Appendix 2 – List of Major Chiller and AC Manufacturers .......................................................... 44 Appendix 3 – Detailed Results Tables ............................................................................................... 45

1. Introduction The production and consumption of ozone-depleting hydrochlorofluorocarbons (HCFCs)—used as refrigerants, blowing agents, solvents, aerosols, and fire suppressants—are increasing rapidly in developing countries, even as they are being gradually phased out in developed countries under the current phaseout requirements for non-A5 countries, as articulated under the Montreal Protocol and subsequent adjustments and amendments. From 2005 to 2015, although consumption of HCFCs in developed countries will be reduced by approximately 85%, global consumption will increase by more than 20%, as consumption in developing countries increases by more than 135% during that same period (US EPA 2007a).
Indeed, because the cap on the consumption of HCFCs in developing countries does not enter into effect until 2016, annual consumption growth rates from 2005 to 2015 are impossible to know with certainty, but available reported information indicates a value of 9% (ICF estimates).1 Assuming this growth rate of 9%, Exhibit 1 graphically presents the projected increase in demand for HCFCs in developing (Article 5 or A5) countries compared to the projected decrease in demand in developed (non-Article 5 or non-A5) countries.
Exhibit 1: Historical and Projected Consumption of HCFCs in A5 and non-A5 Countries
0
100,000
200,000
300,000
400,000
500,000
600,000
700,000
800,000
900,000
Metri
c ton
nes
2002 2005 2010 2015
Non-A5 Country HCFC ConsumptionA5 Country HCFC Consumption
Source: US EPA (2007a).
1
1 This growth rate was developed by ICF through an effort to harmonize existing projections used by Parties in assessing and negotiating an expedited HCFC phaseout schedule, and is based primarily on actual and projected consumption and production estimates provided by A5 countries through the Study on the Strategy for the Long Term Management of HCFCs in China and HCFC Surveys in Nine Article 5 Countries. Other proposed annual growth rates range from 10.9% (World Bank 2006) to 5.9% (IPCC/TEAP 2005) to about 5% (UNEP 2007a). The TEAP XVIII/12 report (UNEP 2007b) based its baseline calculations on the growth rates developed in the SROC (average rate of 5.9%), but recognized that the SROC demand growth is relatively conservative (i.e., low growth compared to other assessments).

Moreover, because the Protocol does not require developing countries to reduce consumption until 2040, global HCFC consumption could remain excessively high for the next 35 years, undermining the phaseout efforts of developed countries and threatening the recovery of the ozone layer and posing threats to human health and the environment from excess UV radiation. These projected high levels of HCFC consumption will also have impacts on global climate change, through both direct and indirect processes. From this standpoint, an accelerated phase-out of HCFCs in developed and developing countries is imperative.
Any proposed accelerated phase-out schedule must take into account the costs of early retirement of HCFC equipment, particularly in the stationary AC sector, which currently represents the second largest source (about 20%) of total A5 HCFC demand, as shown in Exhibit 2 (US EPA 2007a, UNEP 2007b). Moreover, because large AC systems (chillers) have long lifetimes and high replacement costs, and because the import/export of smaller AC equipment significantly affect Article 5 economies, a technical assessment of the stationary air-conditioning market in Article 5 countries is needed to gain an understanding of the impacts and costs associated with an expedited HCFC phaseout.
Exhibit 2: Total A5 HCFC Demand by Sector (2005)
Commercial Refrigeration61%
Industrial Refrigeration5%
Stationary AC21%
Foams10%
Solvents/Other 2%
Transport Refrigeration<1%
Mobile AC<1%
Fire Protection <1%
Source: UNEP (2007b)
The purpose of this report is to provide the international community with an understanding of where and how much HCFCs will be installed within the stationary AC sector in Article 5 countries under a business-as-usual scenario, and what it will take to achieve phaseout. To this end, the report assesses current and projected A5 consumption of HCFCs in stationary AC applications, as well as the feasibility and likelihood of using non-ODS refrigerants in this sector through 2015 and beyond. The report also provides broad analysis of the costs of transitions to alternative refrigerants in existing and new equipment and identifies barriers associated with (a) the replacement and servicing of HCFC-based chillers and (b) the conversion of manufacturing facilities reliant on HCFC refrigerant for the production of smaller AC equipment in A5 countries.
2

3
The remainder of the report is organized as follows:
• Section 2 provides background information on ODS consumption, focusing on the commercial and residential air-conditioning sector in A5 countries;
• Section 3 provides an overview of the methodology used to prepare this report;
• Section 4 characterizes the chiller sector in A5 countries, providing estimated number of units installed by chiller type and refrigerant type, summarizing available alternatives, and projecting future refrigerant transitions;
• Section 5 characterizes the residential and small commercial air-conditioning market in A5 countries, providing estimated number of units installed by refrigerant type, summarizing available alternatives, and projecting future refrigerant transitions;
• Section 6 summarizes the results from Sections 4 and 5 and discusses the implications for A5 phaseout in terms of the cost to replace/service HCFC chillers and convert AC equipment manufacturing facilities reliant on HCFC refrigerant;
• Section 7 presents the references used in this report;
• Appendix 1 presents the questionnaires used in collecting information from industry and government sources;
• Appendix 2 provides a list of major chiller and air conditioning equipment manufacturers; and
• Appendix 3 presents detailed results on projected AC stocks by equipment type, refrigerant type, and A5 region.

4
2. Background: HCFC Consumption in Article 5 Countries Currently, 191 nations are Parties to the Montreal Protocol, a landmark international agreement to restore the Earth’s deteriorating stratospheric ozone layer. The global success of this effort to protect the environment requires the elimination of emissions to the atmosphere of ozone-depleting substances (ODS). Chlorofluorocarbons (CFCs)—used as refrigerants, blowing agents, solvents, and aerosols—are some of the most damaging ODS, and their phaseout in non-A5 countries was implemented in 1996. Hydrochlorofluorocarbons (HCFCs), used in part as replacements for CFCs, also deplete the stratospheric ozone layer and are controlled under the Montreal Protocol as Annex C Group 1 substances. In non-A5 countries, HCFC consumption is being reduced progressively to reach complete phaseout in 2030. In A5 countries, CFCs are scheduled for complete phaseout in 2010, while HCFCs are scheduled for complete phaseout in 2040 (with a freeze in 2016 at 2015 consumption levels).
While ODS have a wide variety of applications, the most common uses for CFCs and HCFCs are in the refrigeration and air conditioning (AC) sectors. In 2005, an estimated 75% of total global demand for CFCs and HCFCs was in the refrigeration/AC sector (UNEP 2007b). Exhibit 3 presents the most common CFC and HCFC refrigerants and their ODPs.
Exhibit 3: Common CFC and HCFC Refrigerants and their ODPs Chemical Name ODP
CFC-11 (CCl3F) 1 CFC-12 (CCl2 F2) 1 HCFC-22 (CHF2Cl) 0.055 HCFC-123 (C2HF3Cl2) 0.02 HCFC-124 (C2HF4Cl)* 0.022 HCFC-142b (CH3CF2Cl)* 0.065
*Used in blends only.
As a result of the global CFC phaseout underway, CFCs used in the refrigeration/AC and other sectors have declined steadily over time (see Exhibit 4 and Exhibit 5). By 2005, CFCs comprised only about 23% of ODS demand in the refrigeration/AC sector in A5 countries, and 21% in non-A5 countries (where CFC phaseout began earlier). As the CFC phaseout continues to progress, demand for CFCs is expected to decrease to less than 2% of A5 demand for ODS in the refrigeration/AC sector in 2015, and approximately 7% of non-A5 demand. (UNEP 2007b)
At the same time, the demand for HCFCs in the refrigeration/AC and other sectors has risen and will continue to rise steadily as market growth spurs demand (see Exhibit 4 and Exhibit 5). Indeed, by 2005, annual consumption of HCFCs had more than doubled in A5 countries relative to consumption in 1999, reaching 20,976 ODP-weighted tons (UNEP 2007c). From 2005 to 2015, HCFC consumption will grow at an estimated average rate of 9%2 in A5 countries, though some country growth rates (e.g., China, India) may be significantly higher (ICF estimates). Overall, HCFC growth rates are likely to correlate with the industrial growth rates of A5 countries.
2 This growth rate was developed by ICF through an effort to harmonize existing projections used by Parties in assessing and negotiating an expedited HCFC phaseout schedule, and is based primarily on actual and projected consumption and production estimates provided by A5 countries through the Study on the Strategy for the Long Term Management of HCFCs in China and HCFC Surveys in Nine Article 5 Countries. Other proposed annual growth rates range from 10.9% (World Bank 2006) to 5.9% (IPCC/TEAP 2005) to about 5% (UNEP 2007a). The TEAP XVIII/12 report (UNEP 2007b) based its baseline calculations on the growth rates developed in the SROC (average rate of 5.9%), but recognized that the SROC demand growth is relatively conservative (i.e., low growth compared to other assessments).

Exhibit 4: Historical Consumption of CFCs and HCFCs in Article 5 Countries (ODP-Weighted Tonnes)
0
20,000
40,000
60,000
80,000
100,000
120,000
140,000
160,000
180,000
200,000
1989
1990
1991
1992
1993
1994
1995
1996
1997
1998
1999
2000
2001
2002
2003
2004
2005
ODP-
Weig
hted
Ton
nes
CFC ConsumptionHCFC Consumption
Source: UNEP (2007c).
Exhibit 5: Historical Consumption of CFCs and HCFCs in Article 5 Countries (Metric Tonnes)
0
50,000
100,000
150,000
200,000
250,000
300,000
350,000
1989
1990
1991
1992
1993
1994
1995
1996
1997
1998
1999
2000
2001
2002
2003
2004
2005
Metri
c Ton
nes
CFC ConsumptionHCFC Consumption
Source: UNEP (2007c).
5

While the transition to HCFCs is well underway in A5 countries, a look at current CFC and HCFC consumption figures in individual countries reveals different stages of transition. Some countries continue to rely heavily on CFCs, while others have transitioned away from them, now relying on HCFCs or other ODS alternatives (e.g., HFCs). Still other countries never relied heavily on CFCs, having purchased the majority of ODS-containing equipment later in time, when manufacturers had largely already transitioned to HCFCs. The comparison of CFC and HCFC consumption on a regional basis reveals that Asia, driven by China, is the largest consumer of both CFCs and HCFCs (see Exhibit 6).
Exhibit 6: HCFC and CFC Consumption by A5 Region in 2005
Source: UNEP (2007c).
HCFC Consumption (20,915 ODP-Weighted
Tonnes)
CFC Consumption (43,040 ODP-Weighted
Tonnes)
HCFC Consumption (321,088 Metric Tonnes)
CFC Consumption (43,040 Metric Tonnes)
Asia 24,596
Latin America 8,611
Middle East/ North Africa
6,587
Africa 3,245
7,004
Asia244,210
27,227
Africa
Latin America 42,646
Middle East/North Africa
Asia 24,596
Latin America8,611
Middle East/North Africa6,587
Africa 3,245 Africa
456
Asia 15,906
Latin America 2,778
Middle East/ North Africa
1,773
On a country basis, as shown in Exhibit 7, China has the highest CFC consumption (30%) in A5 countries. Together with the Republic of Korea, Indonesia, Iran, and India, these countries represent over 50% of total A5 CFC consumption. China also dominates HCFC consumption, accounting for 55% of total A5 consumption. China and the five next largest A5 consuming countries—Korea, Mexico, Thailand, Brazil, and India—together represent over 80% of total HCFC consumption (see Exhibit 8). The fast-growing economies of China, Korea, and India, as well as their status as
6

7
technology centers, help explain why these countries are such large consumers of both CFCs and HCFCs.
Exhibit 7: Top 20 CFC-Consuming A5 Countries in 2005
Rank Country ODP-Weighted Metric Tons Percent of Total CFC 2005 Consumption
1 China 13,124 30% 2 Republic of Korea 2,730 6% 3 Indonesia 2,385 5% 4 Iran (Islamic Republic of) 2,221 5% 5 India 1,958 5% 6 Venezuela (Bolivarian Republic of) 1,842 4% 7 Argentina 1,676 4% 8 Mexico 1,604 4% 9 Thailand 870 3% 10 Philippines 1,014 2% 11 Brazil 967 2% 12 Saudi Arabia 879 2% 13 Syrian Arab Republic 870 2% 14 Algeria 859 2% 15 Egypt 821 2% 16 Yemen 711 2% 17 Malaysia 668 2% 18 Colombia 557 1% 19 Nigeria 466 1% 20 Pakistan 20 1%
TOTAL CFC Consumption by TOP 20 36,240 85% Source: UNEP (2007c).

8
Exhibit 8: Top 20 HCFC-Consuming A5 Countries in 2005
Rank Country ODP-Weighted Metric Tons Percent of Total HCFC 2005 Consumption
1 China 11,591 55% 2 Republic of Korea 1,834 9% 3 Mexico 1,179 6% 4 Thailand 901 4% 5 Brazil 847 4% 6 India 725 3% 7 Turkey 575 3% 8 United Arab Emirates 370 2% 9 Indonesia 309 1% 10 Saudi Arabia 213 1% 11 Kuwait 221 1% 12 Philippines 211 1% 13 South Africa 210 1% 14 Argentina 203 1% 15 Iran 193 1% 16 Egypt 174 1% 17 Colombia 152 1% 18 Singapore 149 1% 19 Viet Nam 130 1% 20 Venezuela 97 <1%
TOTAL Consumption of Top 20 A5 Countries 20,283 97% Source: UNEP (2007c).
Because the use of ODS is being phased out under the Montreal Protocol, alternative refrigerants and technologies are being sought and brought to market. The alternatives, while ozone-friendly, are each associated with certain disadvantages. For example, HFCs have high global warming potentials (GWPs) and therefore contribute to climate change; carbon dioxide (CO2) and ammonia can pose a human health hazard; and hydrocarbons (HCs) are a flammability risk. Of the HCFC alternatives currently in use, HFCs are the dominant market players. The most common HFCs used in the AC sector, as well as their GWPs, are presented in Exhibit 9.
Exhibit 9: GWPs and Application of Common HFCs in the Air Conditioning Sectora
Equipment Type R-134a (GWP: 1,300)
R-407C (GWP: 1,525)
R-410A (GWP: 1,725)
Chillers Window Units Residential Unitary AC Commercial Unitary AC Water and Ground Source Heat Pumps Packaged Terminal Units
a GWPs based on IPCC (1996).
R-134a chillers have been widely produced by manufacturers in A5 and non-A5 countries for both domestic and export markets. The use of R-407C and R-410A in AC applications is less mainstream, with producers in non-A5 countries adopting this technology relatively recently, in response to national HCFC phaseout requirements. A number of A5 producers have also begun using these HFC blends in newly produced AC equipment for export, to maintain market share in non-A5 countries.
Ultimately, however, regional refrigerant/technology choices are influenced by many factors, including local laws, regulations, standards, and economics. Ideally, in selecting ODS alternatives, climate-friendly options (i.e., CO2, ammonia, and HCs) should be considered, though these options

9
are currently rather limited in the air conditioning sector. Research suggests that not-yet-commercialized alternatives, including HC refrigerant blends, are being developed as next-generation alternatives to HCFCs.
The remainder of this report provides a more detailed look at current and future uses of CFCs, HCFCs, HFCs, and alternative refrigerants in air conditioning equipment in A5 countries.

10
3. Methodology Overview This section summarizes the broad methodology used to develop this study.
As a first step, literature and internet research was conducted to identify reports and key industry players that could provide data on current and future stocks of chillers and air conditioning (AC) equipment in Article 5 countries, as well as estimated costs associated with this transition. Specifically, data were collected from a variety of sources, including:
• Industry publications, such as the 2007 Latin America Chiller Market report from the Building Services Research and Information Association (BSRIA), and Appliance Magazine.
• Published reports from the United Nations Environment Programme (UNEP),3 the World Bank,4 the United Nations Development Programme (UNDP),5 GTZ,6 the Intergovernmental Panel on Climate Change (IPCC),7 and others.
• Selected project documents from the Executive Committee of the Multilateral Fund for the Implementation of the Montreal Protocol (MLF), including the African Fund for the Replacement of Chillers (AFROC) project report on the conversion of CFC chillers in five African countries.
• Selected technical presentations, such as those presented at the Stakeholder Meeting for the Implementation of UNEP Global Technical Assistance Programme in the Chiller Sub-Sector in New Delhi in October 2006, Open-ended Working Group of the Parties to the Montreal Protocol in Nairobi in June 2007 and the Stockholm Group meeting in Montreal in July 2007.
In addition, questionnaires were developed for key industry and government representatives (provided in Appendix I), and follow-up interviews were conducted. The following companies, trade associations, and government agencies were contacted:
• Bharat (India) • Blue Star (India) • Carrier (India, US) • Danfoss (Denmark) • Fujitsu (Japan) • GTZ • Haier (China) • LG (Korea) • Lennox (US) • McQuay/Daikin (India, US) • Mitsubishi (Japan) • National Ozone Units from Brazil, China, India, Mexico, South Africa, South Korea, and
Thailand • ONIDA (India) • Refrigeration and Air Conditioning Manufacturer’s Association of India • Samsung (Korea) • Trane (US)
3 UNEP (2004, 2007b, 2007d, 2007e). 4 World Bank (2002, 2005). 5 UNDP (2007). 6 UNEP (2007a), GTZ (2006). 7 IPCC/TEAP (2005).

• York (US) Due to time constraints, not all contacts listed above were capable of providing input to this study. Significant information was collected from York, Carrier India and Carrier US, Trane, ONIDA, and the National Ozone Unit in South Africa. To avoid disclosure of any confidential business information, all industry information received through surveys, emails, and telephone queries conducted for the purposes of this study has been aggregated in this report. To the extent possible, estimates developed based on industry sources were substantiated against other available data (e.g., UNDP 2007, UNEP 2007a, BSRIA 2007).
Both qualitative and quantitative data were obtained from the above sources regarding current and future stocks of AC equipment, by equipment type. Specifically, estimates were developed for the following end uses:
• Centrifugal chillers: Centrifugal chillers are large, centralized air-conditioning systems commonly used in large buildings, such as offices, hotels, and factories. Chillers can range in cooling capacity from 350 kW to 30,000 kW, with an average refrigerant charge of about 0.33 kg/kW (UNEP 2004, ICF 2007). They also have very long lifetimes, up to 30 years or more (IPCC 2000, ICF 2007).
• Positive Displacement chillers: Positive displacement chillers are smaller than centrifugals,
but are similarly used for cooling in buildings, offices, and large residential structures. They have average lifetimes of up to 25 years (ICF 2007).
⎯ Scroll: Scroll chillers have a cooling capacity range of 7-1,600 kW with an average refrigerant charge of 0.28 kg/kW (UNEP 2004, ICF 2007).
⎯ Screw: Screw chillers have a cooling capacity range of 140-2,275 kW with an average refrigerant charge of 0.28 kg/kW (UNEP 2004, ICF 2007).
⎯ Reciprocating: Reciprocating chillers range in cooling capacity from 7 kW to 1,600 kW, with an average refrigerant charge of 0.35 kg/kW (UNEP 2004, ICF 2007).
• Other Air Conditioners: For the purpose of this study, other air conditioners include small
self-contained AC units, non-ducted split residential and commercial units, and ducted split commercial and residential units (see text box below for additional description of the equipment types included). This analysis disaggregates this end use into “small” and “large” systems as follows:
⎯ Small AC: charge size of 0.75 - 3.5 kg. ⎯ Large AC: charge size of 7.5 -15 kg.
• Ductless AC: used in residences; comprised of an outdoor condenser and an air handler.
Non-Ducted Split Systems
• Water and ground-source heat pumps: use the earth and/or ground water as the sources of heat in the winter, and as the "sink" for heat removed from the building in the summer; common in office buildings, hotels, health care facilities, banks, schools, condominiums and apartments.
• Unitary AC: central AC systems used in houses and commercial applications; a compressor/heat exchanger unit outside the conditioned space supplies refrigerant to a heat exchanger, and the cooled/heated air is then supplied by a duct system.
Ducted Split Systems
• Packaged terminal AC/heat pumps: used in small- and medium- sized low-rise buildings (e.g., offices, motels, barracks, and warehouses); units are typically installed in the wall, and are self-contained.
• Window AC units: fit into open windows or through walls; refrigerative coolers packaged into a single box that produces cool air on one side and rejects hot air on the other.
Self Contained Units
11

12
For the purpose of this analysis, assumptions were developed regarding average charge size and lifetime for each of the equipment types listed above, as summarized in Exhibit 10. Exhibit 10. Assumptions on Average Charge Size and Lifetime
Equipment Type Assumed Average Charge Size (kg) Assumed Average Lifetime (years) Centrifugal Chillers 450 30 Screw Chillers 330 25 Scroll Chillers 150 25 Reciprocating Chillers 150 25 Large AC 10 15 Small AC 2 15
Source: ICF estimates based on UNEP (2004), Manikela (2007), IPCC (2000), World Bank (2002), ICF (2007), Stockholm Group (2007). All information was used to develop an Excel-based model to “inventory” current and future stocks of equipment for four distinct A5 regions: (1) Asia, (2) Latin America and the Caribbean, (3) Middle East/North Africa, and (4) Africa. The following general methodological steps were followed to develop such an inventory:
• Step 1: Estimate Stock by Region. Number of units currently in use by region, including average charge size, were estimated based on UNEP reports, BSRIA (2007), Manikela (2007), and ICF (2007).
• Step 2: Disaggregate Stock by Refrigerant Type. Equipment was disaggregated by
refrigerant based on data from UNEP reports, Manikela (2007), Stratus (2006), and industry information (ICF 2007).
• Step 3: Project Future Stocks. Market growth was projected in the short term (2007-2009)
and long term (2010-2040) by equipment type and region based on industry insights on published market information (ICF 2007, Han 2007).
• Step 4: Project ODS Transition. The transition away from ODS was projected by retiring
old equipment at a linear rate (based on equipment lifetime) and modifying the penetration of alternative refrigerants into new equipment based on anticipated market and regulatory trends. Specifically, in projecting the future penetration of refrigerants into new equipment, this analysis considered (a) the primary market players (i.e., A5 versus non-A5 equipment manufacturers), (b) the availability and cost effectiveness of ODS and substitute refrigerants, and (c) national and international regulations governing the use of ODS refrigerants. ICF estimates were developed based on input from industry, Manikela (2007), and UNEP reports.
A more detailed explanation of the assumptions, methodology, and sources used to develop current and future inventories of equipment and refrigerant by region is provided in chapters 4 and 5.

13
4. Chiller Sector Chillers are centralized air conditioning systems used in medium and large buildings—including offices, hotels, shopping centers, and other large buildings—as well as in specialty applications on ships, submarines, nuclear power plants, and other industrial applications. Large chillers are generally installed in large cities and resort areas, primarily in temperate, hot-arid or hot humid climates (UNEP 2004, US EPA 2006). Chillers represent large investments and have a very long life of up to 30 years or more, particularly when maintained through proper service and occasional overhaul (ICF 2007, IPCC 2000, ARAP 2006, UNEP 2004).
Two broad types of chillers are manufactured—vapor compression chillers and absorption chillers. Vapor compression chillers are identified by the type of compressor they employ: centrifugal compressors or positive displacement compressors. The positive displacement category includes reciprocating, screw, and scroll compressors. Vapor compression chillers have historically relied on ODS refrigerants. Conversely, absorption chillers commonly use water or ammonia as the refrigerant (with lithium bromide or water as the absorbent, respectively). Because absorption chillers do not use ODS, the remainder of this chapter is focused only on centrifugal and positive displacement chillers.
Chillers may range in capacity from a few kilowatts (kW) to 30,000 kW, as shown in Exhibit 11. Centrifugal chillers are the most common type of chillers with a capacity greater than 700 kW. The use of CFCs in chillers has been limited to the large centrifugal machines in the range of 1,000 to 10,000 kW (IPCC/TEAP 2005, UNEP 2004)
Exhibit 11: Cooling Capacity Range Offered by Single Unit Chillers Chiller Type Capacity Range (kW)a Average Refrigerant Charge (kg/kW)b
Centrifugal 350 - 30,000 0.33 Scroll and Reciprocating 7.0 - 1,600 0.28 Screw 140 - 6,000 0.35
Note: Many applications use multiple chillers to cool a particular space. For example, a large commercial office building may have 2 or more chillers. a Source: UNEP (2004). b Actual refrigerant charge varies slightly by refrigerant type; only average values are shown here. Reciprocating compressors have been used in smaller chillers for many decades. Beginning in the mid-1980s, screw compressors became available as alternatives to reciprocating compressors in the capacity range from 140 - 700 kW, and as alternatives to centrifugal compressors up to about 2,275 kW. Scroll compressors were introduced around the same time, and have been used as alternatives to reciprocating compressors in the range from 7 to about 100 kW (UNEP 2007d). Because positive displacement chillers use higher-pressure refrigerants than centrifugal chillers, these smaller chillers never used CFC refrigerants, but have instead relied on HCFCs and, more recently, HFCs. (IPCC/TEAP 2005, UNEP 2004)
The remainder of this section examines the current market characteristics of centrifugal and positive displacement chillers, as well as available alternatives, and the projected transition away from ODS in this end use.
4.1 Market Characterization
4.1.1 Centrifugal Chillers
Centrifugal chillers have historically been manufactured primarily in the United States, with later production in Europe and more recent production in Asia (UNEP 2004). The major centrifugal chiller manufacturers are: Carrier (US), Daikin/McQuay (Japan), Trane (US), and York (US). Centrifugal chillers are also produced in Korea, China, and India; these A5 manufacturers supply an estimated

14
15%-20% of the A5 chiller market, while the remainder is satisfied by imports from non-A5 countries (ICF 2007). A more comprehensive listing of manufacturers is provided in Appendix 2.
Prior to 1993, centrifugal chillers were offered with CFC-11, CFC-113, CFC-12, CFC-114, R-500, and HCFC-22 refrigerants. CFC-12 was the dominant refrigerant used in high-pressure chillers, while CFC-11 was the dominant refrigerant for low-pressure chillers (IPCC/TEAP 2005). Combined, in 2004, these two refrigerants represented almost 100% of the installed CFC centrifugal chiller base (UNEP 2004). R-500, a blend containing CFC-12, was historically used in a limited number of centrifugal chillers, although very few are believed to be installed in A5 countries. Centrifugal chillers used in naval submarines and surface vessels historically employed neat CFC-114 as the refrigerant (IPCC/TEAP 2005).
With the signing of the Montreal Protocol, the four US-based manufacturers and their European affiliates discontinued the production of chillers using CFCs starting in 1993, which significantly limited production of new CFC chillers by the end of 1992, since these companies accounted for a large market share of production (US EPA 2005, UNEP 2004, UNEP 2007d).
Since the early 1990s, HCFCs and HFCs have been used primarily in new centrifugal chillers, though centrifugal chillers using HCFC-22 rarely were produced after the late 1990s, primarily because they were less efficient than HCFC-123 chillers at the time (Calm 2004, UNEP 2004). Since the 1990s, HCFC-123 and HFC-134a have become the dominant market players (US EPA 2005, UNEP 2007d). Centrifugal chillers produced for A5 markets by Carrier, Daikin/McQuay, and York contain HFC-134a, while those produced by Trane for A5 markets contain HCFC-123. A5 producers in Korea, China, and India produce chillers using both R-134a and R-123 (ICF 2007).
Based on available information, the current estimated stocks of centrifugal chillers by A5 region are presented in Exhibit 12.
Exhibit 12: Installed Base of Centrifugal Chillers by Region (2007)
Existing Stock Asia Latin America/ Caribbean
Middle East/ North Africa Africa
Number of units in use 30,000 9,000 10,000 4,000 a ICF estimates based on BSRIA (2006), UNEP (2007d), ICF (2007).
The above estimates were developed based on the following data points:
• Asia: India has an estimated 6,000 centrifugal chillers currently installed (ICF 2007). China, which represents nearly 50% of the centrifugal chiller stocks in Asia (ICF 2007), reported had about 11,000 centrifugal chillers installed in 2004 (UNEP 2007d). Using an annual growth rate of 10.4% in China—China’s GDP growth from 2005 to 2007—the current stock in China is estimated to be about 13,000. Based on this information, this analysis estimates centrifugal chiller stocks for the region to be 30,000.
• Latin America/Caribbean: According to industry experts, centrifugal chiller stocks in this region, excluding Mexico, are approximately 7,500 (ICF 2007). BSRIA (2007) reported that Mexico installed 79 new chillers in 2005. Assuming an average historical growth rate of approximately 3% per year over a 30-year period, the stock of chillers in Mexico is estimated at approximately 1,500 (BSRIA 2007, ICF estimates). Thus, 2007 estimated chiller stocks for the region are estimated at 9,000 (7,500 + 1,500).
• Middle East/North Africa: According to industry estimates, there are between 9,000 and 11,000 centrifugal chillers installed in the Middle East/North Africa today (ICF 2007). For the purposes of this analysis, the median value of 10,000 was assumed.
• Africa: According to industry estimates, there are between 3,000 and 5,000 centrifugal chillers installed in Africa today (ICF 2007). For the purposes of this analysis, the median value of 4,000 was assumed.

15
As shown in Exhibit 12, Asia has the largest installed base of centrifugal chillers. The Asian market is driven by China, with Korea and Taiwan also representing significant markets for centrifugal chillers in Asia (UNEP 2007d, ICF 2007). The centrifugal markets in China, Korea, and Taiwan are also significant on a global scale; according to market reports, China represented approximately 18% of global centrifugal chiller sales in 2004 (~1,500 chillers), while South Korea comprised approximately 4% (~400 chillers), and Taiwan represented 3.5% (~300 chillers) (BSRIA 2007, UNEP 2007d).
In Africa, South Africa is the most prominent user of centrifugal chillers, while the Middle East/North Africa region has its most significant chiller use in Saudi Arabia, Turkey, and the United Arab Emirates (ICF 2007). In Latin America, Mexico and Brazil are the largest users of centrifugal chillers, with about 80 new centrifugal chillers having entered the markets of both countries in 2005 (UNEP 2007d, BSRIA 2007).
Centrifugal chillers in Article 5 countries contain CFC-11, CFC-12, HCFC-123, HCFC-22, and HFC-134a as refrigerants. A small number of R-500 units may also be in operation. To disaggregate the regional stocks of centrifugal chillers by refrigerant type, ICF relied on individual country data to the extent possible.
Specifically, for Asia, 2004 data on the refrigerant composition of chiller stocks in China were used as proxies for the entire region (UNEP 2007d). To account for equipment retirement between years 2004 to 2007, CFC stocks were reduced by 1/18 (5.6%)8 while the share of non-CFC refrigerants were grown by 10.4%—China’s GDP growth rate from 2004 to 2007. Exhibit 13 presents the 2004 and 2007 refrigerant inventories in centrifugal chillers in China, used as proxies for all of Asia. It should be noted that, based on data on India’s refrigerant inventory, the share of HFC-134a relative to HCFC-123 may be higher in China than in other A5 countries (ICF 2007).
Exhibit 13: Refrigerant Inventory in Centrifugal Chillers in China, Used as Proxies for All of Asiaa
Refrigerant Type Percent of Installed Base in 2004 Estimated Percent of Installed Base in 2007
CFCs 37% 27% HCFC-123 29% 33% HCFC-22 5% 6% HFC-134a 29% 34%
Source: UNEP (2007d), ICF (2007). For all other regions, data on refrigerant inventories was limited; only data on the number of CFC chillers were available for selected countries for 2004, as shown in Exhibit 14. In order to translate the 2004 CFC centrifugal stock estimates for these few countries into reasonable CFC stock estimates for their entire geographic regions, CFC stock estimates for these countries were first estimated for the year 2007 (by retiring CFC units at 5.6% or 1/18). Next, 1990 GDP values were used as proxies for scaling up total regional CFC chiller markets.9 The results derived using this methodology (as presented in Exhibit 14) are supported by various other sources. For example, it has been estimated that between 600 and 1,000 large tonnage CFC chillers are in use in Africa (UNEP 2007a).
8 Because production of CFC centrifugal chillers was phased out in 1995 and the assumed lifetime of a centrifugal chiller is 30 years, the number of CFC chillers is assumed to decline linearly to reach zero in 2025. 9 GDPs from 1990 were used because the majority of CFC chillers were installed in Article 5 countries in the late 1980s and early 1990s (Kuijpers 2006); thus, 1990 is an approximation for the peak demand for CFC chillers in Article 5 countries.

16
Exhibit 14: CFC Chiller Stocks and Share of Regional GDP for Select A5 Countries Region Countries with Known CFC
Chiller Stocks (2004) Number of
CFC Chillers in Selected Countries
(2004)a
Estimated Number of
CFC Chillers in Selected Countries
(2007)
Percent of Region GDP Represented by Selected Countries,
1990
Total Estimated Number of
CFC Chillers in Region
(2007)b
Africa Cameroon, Namibia, Sudan, Cote D’Ivoire, Nigeria 144 135 16.7% 810
Latin America/ Caribbean
Argentina, Brazil, Chile, Colombia, Ecuador, Jamaica, Mexico
3,990 3,390 86.7% 3,910
Middle East/ North Africa
Egypt 223 190 8.3% 2,290 a Sources: UNEP (2004) b Regional estimates were calculated by growing CFC chiller stocks to account for the remaining GDP of region. For example, for Latin America and the Caribbean, individual country data is available from UNEP (2004) on the 2004 CFC chiller stock in seven countries—Argentina, Brazil, Chile, Colombia, Ecuador, Jamaica, and Mexico—which was equal to approximately 3,990 chillers. After accounting for equipment retirement since 2004, it is estimated that these seven countries have about 3,390 CFC chillers in 2007 (ICF estimate). Because the aggregate share of these countries’ 1990 GDP represents approximately 87% of the total GDP for the Latin America/Caribbean region, it was assumed that these seven countries hold approximately 87% of the region’s centrifugal chillers. Accordingly, for 2007, it is estimated that the Latin America/Caribbean region as a whole has 3,910 CFC chillers.
Once the total number of CFC chillers by region was estimated, the percent of total regional chiller stocks (shown in Exhibit 12) that contain CFCs was calculated, and the remaining refrigerant inventory was apportioned based on China’s estimated refrigerant breakout of non-CFC chillers, namely:
• HCFC-123: 46% of non-CFC centrifugal chiller stocks • HFC-134a: 46% of non-CFC centrifugal chiller stocks • HCFC-22: 8% of non-CFC centrifugal chiller stocks
While refrigerant inventories will of course vary by country, the above percentages are supported by data provided by the World Bank (2002), which indicate that the installed base of R-123 and R-134a in centrifugal chillers in Latin America are roughly equal. Thus, at a macro-level, this breakout is believed to be reasonable. At a country level, however, the actual installed base of R-123 versus R-134a may vary widely. For example, in South Africa, the vast majority of centrifugal chillers use R-134a, with R-123 chillers being very uncommon; conversely, in India, R-123 chillers account for an estimated 35-40% of the installed base, whereas R-134a only accounts for an estimated 20-25% (Manikela 2007, ICF 2007). Refrigerant preference at the national level depends in part on the dominant market players in the region (i.e., company presence/size of sales force).
The resulting refrigerant inventory, by percent of refrigerant, is shown by region in Exhibit 15. Because the manufacture of CFC chillers generally stopped in 1995, countries with a lower overall percent of installed CFCs were later entrants to the centrifugal chiller market.
Exhibit 15: Assumptions of Refrigerant Inventory in Centrifugal Chillers (2007)
Refrigerant Type Asia Latin America/ Caribbean
Middle East/ North Africa
Africa
CFCsa 27% 43% 23% 20% HCFC-123 33% 26% 36% 37% HCFC-22 6% 4% 6% 6% HFC-134a 34% 26% 36% 37%
a CFC-11, CFC-12, R-500.

17
Exhibit 16 presents the corresponding estimates by stock (number of units by refrigerant and region).
Exhibit 16: Estimated Number of Centrifugal Chillers by Refrigerant Type (2007)
Refrigerant Type Asia Latin America/ Caribbean
Middle East/ North Africa Africa TOTAL
CFCs 8,240 3,910 2,290 810 15,250 HCFC-123 9,950 2,350 3,560 1,470 17,330 HCFC-22 1,710 390 590 250 2,940 HFC-134a 10,100 2,350 3,560 1,470 17,480
These estimates of CFC refrigerant inventory are supported by other published sources. According to GTZ (2006), there are an estimated 600 and 1,000 large tonnage CFC chillers installed in Africa. According to UNEP (2004), there were between 15,000 and 20,000 CFC chillers in A5 countries in 2004; therefore, it is reasonable that roughly 16,000 CFC chillers still remain in A5 countries in 2007. Similarly, according to the Alliance for Responsible Atmospheric Policy (2006), there are an estimated 50,000 remaining CFC chillers worldwide, and it is reasonable to assume that roughly 30% of these units are installed in Article 5 countries. No data are readily available to corroborate the stock estimates for HCFC and HFC centrifugal chillers.
4.1.2 Positive Displacement Chillers
Manufacturers of positive displacement chillers are located in Europe, the US, Japan, and Korea (World Bank 2005). The estimated number of positive displacement units currently installed in Article 5 countries is presented in Exhibit 17.
Exhibit 17: Installed Base of Positive Displacement Chillers by Region (2007) Chiller Type/Attribute Asia Latin America
and Caribbean Middle East/ North Africa
Africa
Scroll & Screw 550,000 61,000 70,000 5,000 Reciprocating 40,000 12,000 10,000 500
These estimates of stocks were developed based on available market data and input from industry representatives, as outlined below:
• Asia: Based on industry information, there are an estimated 550,000 screw and scroll chillers in Asia—about 30% of which are installed in China—and approximately 40,000 reciprocating chillers—about two-thirds of which are installed in China. (ICF 2007)
• Latin America/Caribbean: BSRIA (2007) reported that the demand for new reciprocating, screw and scroll chillers was approximately 2,000 in 2005 in Brazil, Argentina, and Mexico. Assuming an average historical growth rate of 3% per year over a 30-year period, there were an estimated 39,000 scroll and screw chillers in these three countries in 2005. To account for market growth between 2005 and 2007, this stock was grown by 5.6% per year—the average GDP growth rate for these three countries from 2006-2007. Next, this 2007 stock estimate was grown further to account for the rest of the countries in the region, based on the most recent GDP values available (2006). Specifically, because Argentina, Brazil, and Mexico represented approximately 72% of regional GDP in 2006, it was assumed that these three countries account for approximately 72% of the scroll and screw chillers in the region.. Thus, it is estimated that there are approximately 61,000 scroll and screw chillers and 12,000 reciprocating chillers in this region. (ICF 2007)
• Middle East/North Africa: According to industry representatives contacted for this report, there are an estimated 70,000 scroll/screw chillers and approximately 10,000 reciprocating chillers installed in the Middle East/North Africa today (ICF 2007). No other data estimates were readily available for this region.

18
• Africa: According to industry estimates developed for this report, there are an estimated 5,000 scroll/screw chillers and 500 reciprocating chillers installed in Africa (ICF 2007). No other data estimates were readily available for this region.
As shown in Exhibit 17, Asia has the largest installed base of positive displacement chillers, comprising over 80% of the total stock in A5 countries. UNEP (2007d) reported that the majority of positive displacement chillers are used in Europe and Asia, with Malaysia, Thailand, Singapore, Indonesia, and the Philippines accounting for several hundred units. In Latin America, demand for new chillers using positive displacement compressors accounts for 3,200 to 3,300 units with around 6% increase in stock every year. (UNEP 2007d)
Screw chillers generally employed HCFC-22 as the refrigerant when they were first produced in the mid-1980s. The trend has been to replace HCFC-22 product offerings with HFC-134a products when manufacturers introduce new product lines. Screw chillers using a higher pressure HFC blend refrigerant, R-410A, also have been introduced recently, largely in Europe. A small number of screw chillers with ammonia as the refrigerant are produced by some manufacturers, used primarily in northern European countries. Before implementation of the Montreal Protocol, some of the smaller reciprocating chillers (<100 kW) were offered with CFC-12 as the refrigerant, but most of the smaller chillers and nearly all the larger chillers employed HCFC-22. (UNEP 2007d) There is little data available on the number of small (non-centrifugal) CFC chillers (<350 kW), particularly in A5 countries; however, generally, the majority of small chillers for comfort cooling use HCFC-22 (UNEP 2004). Positive displacement chillers are sold with HFCs and HFC blends (i.e., R-407C and R-410A) in non-A5 countries; it is assumed that R-407C and HFC-134a have begun to penetrate a small share of the A5 market, but that R-410A has not (ICF 2007, Manikela 2007). Exhibit 18 presents the estimated current stock of positive displacement chillers in Article 5 countries by refrigerant type. Based on this assumed refrigerant inventory, Exhibit 19 presents the number of positive displacement chillers in use by refrigerant type in each A5 region, based on the total stock identified in Exhibit 17.
Exhibit 18: Assumptions of Refrigerant Inventory in Positive Displacement Chillers (2007) Chiller Type Percent of Current Inventory Scroll and Screw a
HCFC-22 95% HFC-134a 5% Reciprocating HCFC-22 95% HFC-134a 1% R-407C 4%
a Current percent of installed R-410A and R-407C in scroll and screw chillers is negligible. Source: ICF (2007).
Exhibit 19: Breakout of Current Positive Displacement Chiller Stock by Refrigerant Type Chiller Type Asia Latin
America/ Caribbean
Middle East/ North Africa
Africa
Scroll and Screw HCFC-22 522,500 57,950 66,500 4,750 HFC-134a 27,500 3,050 3,500 250 Reciprocating HCFC-22 38,000 11,400 9,500 475 HFC-407C 1,600 480 400 20 HFC-134a 400 120 100 5
Source: ICF (2007).
4.2 Alternatives and Barriers/Drivers to Implementation
The following table summarizes non-HCFC alternatives currently available in new chillers.

19
Exhibit 20: Availability of Non-HCFC Alternatives in New Chiller Equipment Chiller Type R-134a R-245fa R-407C R-410A HCs Ammonia
Centrifugal a a Screw Scroll Reciprocating a a
a Alternative has not measurably penetrated the global market. Source: ICF (2007).
The remainder of this section describes these and other potentially feasible alternatives.
4.2.1 Centrifugal Chillers
For the relatively small centrifugal chiller segment, the primary refrigerant that has replaced the market segment formerly reliant on CFC-11 is HCFC-123, while the primary alternative that has replaced the original CFC-12, R-500, and CFC-114 chiller markets is HFC-134a (US EPA 2005). Until the use of HCFC or HFC refrigerants (e.g., R-123, R-134a) is no longer allowable, the costly redesign of new equipment and the cost of testing to ensure refrigerant reliability render it unlikely that manufacturers will pursue other alternatives to replace these refrigerants (UNEP 2007d). The current and potential future alternatives to ODS refrigerants that are/may be used in centrifugal applications are described in more detail below.
• HFC-134a: Currently, the primary alternative to HCFC-123 is HFC-134a (R-134a). This refrigerant has been used in centrifugal chillers since the early 1990s.
• HFC-245fa: Another alternative to replace the use of R-123 in new centrifugal chillers is R-245fa. Theoretical efficiency tests performed on R-245fa indicate that equipment using this refrigerant consumes a similar amount of energy as R-123 systems, but could have a higher cost due to the manufacturing processes entailed (Calm 2004). R-245fa is higher pressure than HCFC-123 and CFC-11 but lower than R-134a, and could be used as a potential alternative for R-134a in high-pressure chillers. However, to use it in new equipment, compressors and heat exchangers must be redesigned (IPCC/TEAP 2005). One small manufacturer in Japan (Ebara) has adopted this refrigerant already in chillers above 2,800 kW (UNEP 2007d, York 2007). This manufacturer has reported that R-245fa has favorable heat transfer characteristics exceeding those of HCFC-123 (York 2007). However, due to the limited and uncertain availability of HFC-245fa, it is unlikely that this refrigerant will become widely used in centrifugal chillers in the foreseeable future (ICF 2007).
• Hydrocarbons: Currently, hydrocarbon (HC) refrigerants, such as propane (R-290) and propylene (R-1270), are used in centrifugal chillers in petrochemical plants. However, due to the large charge sizes associated with centrifugal chillers, the flammability risk prevents HC centrifugal chillers from being used in any other applications.
Exhibit 21 summarizes the relative energy consumption and life cycle climate performance (LCCP)10 of HCFC-22, R-123, R-134a, and R-245fa in centrifugal chillers. (Note that efficiencies of R-245fa are theoretical.) No information is available for HC chillers used in petrochemical plants.
10 LCCP measures direct refrigerant emissions and indirect greenhouse gas emissions associated with energy consumption, accounting for cradle to grave emissions.

20
Exhibit 21: Relative Energy Consumption and LCCP of Alternative Refrigerants in Centrifugal Chillers Alternative Refrigerant Baseline Energy Consumptiona
(Source) LCCP
(Source)
HCFC-22 Similar (ADL 2002, Calm and Domanski 2004)
-10% (ADL 2002) R-134a
R-123 +9% to +20% (Calm 2004)
Slight increase (Soffientini et al. undated)
HCFC-22 -7% to -11% (ADL 2002)
-9% (ADL 2002) R-245fab
R-123 Similar (Calm 2004)
Slight increase (Soffientini et al. undated)
a Positive energy consumption indicates that the alternative refrigerant consumes more energy than the baseline refrigerant. b Calculations performed were based on theoretical efficiencies.
Retrofits of existing stock of ODS centrifugal chillers are possible, though uncommon; such conversions are costly and typically result in efficiency losses or performance losses (i.e., lower cooling capacity). Moreover, by now, the conversion of most of the chillers that still have reasonable remaining operating life and relatively good energy efficiency have already been retrofit to use non-CFC refrigerants. Technically feasible retrofit options (which are not necessarily economically viable) are described below:
• CFC-11 centrifugal chillers may be retrofit to use HCFC-123. When performing such conversions, some non-metallic materials and hermetic motors must be replaced with compatible materials, and the compressor may need to be replaced with one that has a higher capacity. If the retrofit is done properly, there will only be a small reduction in capacity and a negligible reduction in energy efficiency. However, because retrofitting CFC-11 chillers to use HCFC-123 is technically difficult and is not always cost effective, replacing the chiller with a new unit may be a better investment (UNEP 2007d)
• CFC-12 and R-500 (which consists of CFC-12 and HFC-152a) centrifugal chillers may be retrofit to use HFC-134a. Such conversions may require compressor replacement (due to the need for higher impeller tip speeds) and/or the retubing of heat exchangers to minimize loss of capacity and efficiency. When converting from CFC-12 to R-134a, mineral oils must be replaced with polyolester oils and residual mineral oil concentrations must be minimized to prevent a reduction in heat exchanger performance. (UNEP 2007d),
• CFC-114 centrifugal chillers used in naval submarines and surface vessels can be retrofit to use HFC-236fa as a transitional refrigerant.11 While a number of such conversions have been performed globally, such equipment is not common in Article 5 countries. (UNEP 2007d)
• HFC-134a and R-407C (a blend containing HFC-134a/HFC-125/HFC-32) are possible retrofit options for HCFC-22. However, switching to R-134a reduces cooling capacity by one third, unless the compressor is replaced with one that has 50 % greater displacement. Further, converting an HCFC-22 unit to R-407C or R-134a requires the removal and replacement of the mineral oil lubricant with a compatible synthetic lubricant. In addition, switching to R-407C results in loss of capacity and energy efficiency. (UNEP 2007d)
• R-427A (a new blend containing HFC-134a/HFC-125/HFC-32/HFC-143a) can be retrofit for R-22 equipment, requiring only the replacement of the system’s original oil with a PolyOilEster (POE) lubricant. The performance of equipment retrofit to use R-427A is reportedly similar to that of R-22. However, because this refrigerant blend has a GWP of 1,830, it may not be a viable long-term solution. (Arkema 2006, BOC Gases 2007)
11 No manufacturer has produced new chillers using HFC-236fa; new naval chillers primarily use HFC-134a (UNEP 2007d).

21
• Other potentially feasible retrofit candidates proposed for CFC-12 are R-416A and R-423a but they have yet to be fully investigated. Testing on R-416A (GWP ~975) has been done in motor vehicle air conditioning but the resulting reduction in cycle performance indicates that its performance in chillers will be less than CFC-12. R-423a (GWP ~2,400) is now being sold by one manufacturer and tests show that its coefficient of performance is almost equal to that of CFC-12, but it leads to reduced evaporator capacity. (UNEP 2004) Due to the high GWP of R-423a, it may not be a viable long-term solution.
Anecdotal information indicates that CFC replacements are occurring at a much slower pace in A5 countries than they are in non-A5 countries. This is in part because chillers in A5 countries are operated for as long as possible, and generally only replaced after a catastrophic failure, when servicing becomes uneconomical. (UNEP 2004)
While the conversion of old equipment may not be economically feasible, it should be emphasized that replacing old chillers with new ones, regardless of refrigerant type, will bring energy savings and climate benefits. Manufacturers offer HCFC and HFC chillers with significantly improved energy efficiency compared to most CFC chillers in service. The average new chiller is estimated to use approximately 20 % less electricity than the average chiller manufactured 20 years ago, with the most energy efficient chiller manufactured today requiring up to 65 % less electricity. These energy savings can lead to the recovery of the investment cost of replacing an old CFC chiller in three to five years or less (assuming the region requires cooling for more than three months a year). If the building’s overall energy efficiency is improved along with the replacement of the chiller, the typical return on investment is 20% to 35%. This efficiency improvement results in indirect greenhouse gas emission reductions. (UNEP 2007d)
An additional climate benefit of replacing old CFC chillers is the reduction in refrigerant emissions. Newer HCFC and HFC chillers are typically more leak tight. Further, reduced refrigerant losses can also reduce operating costs (because the building owner will not have to purchase as much refrigerant and systems will cool more effectively with the proper amount of refrigerant charge, hence reducing energy requirements).
4.2.2 Positive Displacement Chillers
Historically, most positive displacement chillers have been manufactured with HCFC-22. As the HCFC phaseout advances in non-A5 countries, a number of HFC and other alternatives have been introduced. The development and adoption of these alternatives represent a significant opportunity for technological improvement, in the form of more leak-tight, efficient equipment. Each of the current and potential future alternatives that are or may be used in positive displacement chillers are described in more detail below.
• HFC-134a: R-134a is currently the primary replacement for HCFC-22 in all types of positive displacement chillers. However, R-134a requires larger compressor displacement than HCFC-22, which may initially result in higher prices for R-134a screw chillers. Market penetration is now such that the costs of HFC-134a screw chillers are similar to HCFC-22 screw chiller costs (UNEP 2007d).
• R-410A: This HFC blend (containing HFC-32 and HFC-125), with a GWP of 1,890, can be used in positive displacement chillers up to 350 kW capacity. It is currently used in newly manufactured scroll chillers. Because R-410A has a much higher pressure than HCFC-22, system components must be redesigned to meet pressure safety codes. The required redesign is costly and requires significant financial investments. However, using R-410A enables a reduction in refrigerant charge (up to 40% less than an HCFC-22 system) for a particular cooling capacity and leads to improved heat exchanger performance, enabling a reduction in heat exchanger sizes (UNEP 2007d). The cost of R-410A is expected to be somewhat higher than that of HCFC-22 refrigerant, at least in the near-term, as discussed in more detail in Appendix 1, which will render equipment containing R-410A more costly. In addition, the high GWP of this refrigerant may undermine its long-term viability.

22
• R-407C: This HFC blend, with GWP of 1,610, is offered in reciprocating chillers from a number of manufacturers, largely used as an intermediate option in the transition to R-410A or R-134a. In general, only minor changes in design are required to switch equipment from HCFC-22 to R-407C. For example, to maintain performance, R-407C requires the use of larger heat exchangers (due to changes in heat transfer capability), which are more expensive. (UNEP 2006, 2007d)
• HFC-32: R-32 is a potential alternative to HCFC-22 that has not yet been commercialized. However, it has operating pressures higher than HCFC-22 and is flammable so would require significant additional research and development to become a market player. (UNEP 2007d)
• Hydrocarbons (HCs): Although hydrocarbons have not measurably penetrated the global market, several new reciprocating chillers have been manufactured using R-290 (propane) and R-1270 (propylene) in Europe. Safety guidelines limit the charge size of HC positive displacement chillers, depending on application, and require protective measures to be taken, including proper placement and/or gas tight enclosure of the chiller, use of a low-charge system design, fail-safe ventilation systems, and gas detector alarm systems. Alternatively, HC chillers may be located outdoors to minimize health risks (IPCC/TEAP 2005). The safety concerns that limit the marketability of chillers using hydrocarbons results in a higher cost for HC chillers. (IPCC/TEAP 2005, UNEP 2007d)
• Ammonia: A very small number of water-cooled reciprocating chillers were manufactured with ammonia as refrigerant but ammonia has not yet significantly penetrated the market (UNEP 2007d). Ammonia can also be used in open drive screw chillers (200-1,500 kW, 50-400 tons), provided that safety issues are addressed (ADL 2002).
There is little information on the energy efficiency of alternative refrigerants relative to CFCs and HCFC-22; however, some calculations indicate that alternatives may be slightly more efficient than refrigerants used historically. Exhibit 22 summarizes the relative energy consumption and LCCP of actual and potential alternative refrigerants in positive displacement chillers, based on published data.
Exhibit 22: Relative Energy Consumption and LCCP of Alternative Refrigerants in Positive Displacement Chillers Alternative Refrigerant Baseline Energy Consumptiona
(Source) LCCP
(Source) Screw Chillers
CFC-12 Less (UNEP 2007d) R-134a HCFC-22 - + 6% (ADL 2002)
R-410A HCFC-22 - Similar (IPCC/TEAP 2005) HCFC-22 Same (Sand et al. 1997) Slight increase (IPCC/TEAP 2005) Ammonia R-134a Same (Sand et al. 1997) -
Scroll Chillers R-407C R-290 - Similar (IPCC/TEAP 2005) Reciprocating Chillers
HCFC-22 -5% (IPCC/TEAP 2005) - R-290 R-407C - Similar (IPCC/TEAP 2005)
- = No information available a Positive energy consumption indicates that the alternative refrigerant consumes more energy than the baseline refrigerant.
While retrofits of positive displacement chillers may be technically possible, they are typically not economically feasible. In general, it costs less to purchase a new R-410A scroll chiller than to convert an existing HCFC-22 unit to use R-410A (ICF 2007). Similarly, it costs less to purchase a new R-134a screw chiller than to convert an existing HCFC-22 unit to use R-134a (ICF 2007). Technically feasible retrofit options are described below:
• The most common replacement for CFC-12 is HCF-134a, due to their similarities in operating pressure levels and cooling capacities. (UNEP 2007d)

23
7A, which are more suitable as replacements for R-502, but no superior substitute has emerged. (UNEP 2007d)
4.3
The majority of ODS will be phased out of chillers not through retrofit activity, but through eventual repl t etirement. To project how the equipment stock and refrigerant inventory in centrifugal chillers will change over time, this analysis models the retirement of old
es in that year. Exhibit 23 summarizes the projected overall market growth of centrifugal chillers by region, based on input from industry sources. As indicated, China and the Middle
• HCFC-22 is most often replaced with R-407C, R-417A, or HFC-134a, all of which are compatible. HCFC-22 may also be replaced by R-404A or R-50
Projected Transitions
4.3.1 Centrifugal Chillers
acemen , once old units reach r
equipment and the phase-in of new units through 2040; no significant number of retrofits are assumed to occur in the future, assuming the current regulatory regime is maintained. Because CFC production was phased out in 1995 and the assumed lifetime of a centrifugal chiller is 30 years, the number of CFC chillers in all regions declines linearly to reach zero in 2025 at a retirement rate of 1/30 or 3.3% per year).
Meanwhile, as older CFC chillers are phased out, new chillers are added according to their market share of sal
East/North Africa are expected to maintain high growth rates in the short run, but growth in all regions is expected to slow between 2010 and 2040, as economic growth stabilizes and the market becomes saturated (ICF 2007).
Exhibit 23: Projected Market Growth for Centrifugal Chillers by Region Asia Timeframe
China All Others Latin America/
Caribbean Middle East/ North Africa
Africa
2007-2009 10.0% 6.5% 6.5% 10.5% 4.5% 2010-2040 5.0% 3.3% 5.0% 5.3% 4.0%
Source: ICF (2007). Current and future equipment sales frigerant type were projected through 2040. A tions
these projections are as follows:
. These market penetration rates are projected to remain constant until 2010.
• to 2040, the choice of refrigerant used in new equipment sold in
A5 countries is projected to stay constant, with R-134a accounting for 75% of the market and
Applyinpenetrat bit 25 graphically present the projected refrigerant bank in centrifugal chiller detailed
by re ssumpused in developing
• Current (2007) market penetration of refrigerants into new equipment sales are assumed to be: 75% R-134a, 24% R-123, and 1% R-22
In 2010, use of R-22 in new centrifugal chillers is assumed to stop in 2010, with R-123 taking its place. From 2010
R-123 accounting for the remaining 25%. While it is unlikely that actual market trends will remain constant for 30 years, this analysis does not attempt to project whether demand for R-123 chillers in A5 markets will increase or decrease in future.
g these assumptions regarding equipment retirement, market growth, and anticipated ion of refrigerants into new equipment, Exhibit 24 and Exhi
equipment across all A5 regions. Moreresults on the estimated stocks by refrigerant and region are presented in Appendix 3.

Exhibit 24: Projected Transition of Refrigerant Bank in Centrifugal Chillers in A5 Countries, 2007-2040
0%
10%
20%
30%
40%
50%
60%
70%
80%
90%
100%
2007
2009
2011
2013
2015
2017
2019
2021
2023
2025
2027
2029
2031
2033
2035
2037
2039
Ref
riger
ant B
ank
in C
entr
ifuga
l Chi
llers
CFCsHFC-134aHCFC-22HCFC-123
Exhibit 25: Projected Transition of Refrigerant Bank in Centrifugal Chillers in A5 Countries (2007 – 2040)
-
20,000
40,000
60,000
80,000
100,000
120,000
140,000
160,000
180,000
2007
2009
2011
2013
2015
2017
2019
2021
2023
2025
2027
2029
2031
2033
2035
2037
2039
Num
ber o
f Uni
ts In
stal
led
HFC-134aHCFC-22HCFC-123CFCs
24

25
4.3.2 Positive Displacement Chillers
The market share of screw and scroll chillers is expected to increase due to compactness of the units, maintainability, and ease of operation (World Bank 2005). Indeed, most of the volume increase in the positive displacement chiller market is moving to scroll and screw compressors, while markets for reciprocating chillers are decreasing (UNEP 2007, ICF 2007).
On a global scale, HFC-134a now accounts for approximately 15-20% of all positive displacement chiller sales, and will become the dominant refrigerant by 2020 as HCFC-22 is phased out. Specifically, it is projected that HFC-134a will comprise 80% of the new screw chiller market, 20% of the new scroll chiller market, and 100% of the new reciprocating chiller market, globally. After R-134a, R-410A will be the leading replacement for HCFC-22, especially in scroll chillers. However, without the need to phaseout HCFCs in the near future, A5 producers are likely to continue to rely on R-22 longer than producers in non-A5 countries; therefore, the transition away from ODS in A5 counties will be slower than in non-A5 countries. One exception to this will be A5 manufacturers that produce for export to non-A5 markets; such manufacturers will be required to transition away from ODS in order to maintain their market share.
To project how the equipment stock and refrigerant inventory in positive displacement chillers will change over time, this analysis modeled the retirement of old equipment and the phase-in of new units through 2040. Based on an assumed lifetime of 25 years, positive displacement chillers are retired at a rate of 4% (1/25) per year. It is assumed that no significant number of retrofits will occur in future under a business-as-usual scenario. Meanwhile, as the old chillers phase out, new chillers are added according to their market share of sales in that year. Exhibit 26 summarizes the projected market growth of positive displacement chillers by region, based on industry input. (ICF 2007).
Exhibit 26: Projected Market Growth of Positive Displacement Chillers by Region Asia Timeframe
China All Others Latin America/
Caribbean Middle East/ North Africa
Africa
Screw & Scroll 2007-2009 10.0% 6.5% 6.0% 5.5% 4.0% 2010-2040 5.0% 3.3% 5.0% 2.8% 4.0% Reciprocating 2007-2009 2.0% 1.3% 1.2% 1.1% 0.8% 2010-2040 0% 0% 0% 0% 0%
As presented, it is projected that the market growth for reciprocating chillers will be 0% in the long-term (beyond 2010), as market trends and industry representatives suggest that this equipment type is becoming obsolete. While this may not be the case in all A5 countries, it is assumed that overall sales of these units in the long-term will be negligible across A5 regions. Meanwhile, growth for screw and scroll chillers will be high. In fact, due to lack of market saturation and high growth potential in China, Africa, and Latin America/Caribbean, growth for screw and scroll chillers is projected to remain relatively high through 2040. For Asia and the Middle East, which have a higher rate of saturation, long term growth rates are projected to decline by 50% between 2010 and 2040, relative to short term growth rates. (ICF 2007).
Based on information provided by industry representatives, current and future market penetration rates by refrigerant type into new positive displacement chiller sales were projected through 2040. Assumptions used in developing these projections are as follows:
• Current (2007) market penetration of refrigerants into new equipment sales are assumed to be as follows:
⎯ Screw: 70% R-22, 30% R-134a ⎯ Scroll: 80% R-22, 10% R-134a, 10% R-410A ⎯ Reciprocating: 85% R-22, 10% R-407C, 5% R-134a

• Estimated 2007 market penetration rates of refrigerant into new equipment are projected to remain constant until 2010.
• In 2010, it is assumed that no new manufacture of reciprocating chillers occurs. For scroll and screw chillers, it is assumed that a shift away from HCFCs takes hold in response to the HCFC phaseout in non-A5 countries. While not all positive displacement chillers entering A5 markets are produced in non-A5 countries, the phaseout will influence the choice of refrigerants being offered in chiller equipment worldwide. Specifically, it is assumed that from 2010 to 2020, the market will gradually shift to the following make-up:
⎯ Screw: 20% R-22, 80% R-134a ⎯ Scroll: 30% R-22, 20% R-134a, 50% R-410A
• The choice of refrigerant used in new equipment sold in A5 countries is projected to stay constant from 2020 to 2040.
Applying these assumptions regarding equipment retirement, market growth, and anticipated penetration of refrigerants into new equipment, Exhibit 27 illustrates the total A5 projected refrigerant bank in positive displacement chillers through 2040. Exhibit 28 and Exhibit 29 present the total A5 projected refrigerant stock of scroll/screw and reciprocating chillers, respectively. More detailed results on the estimated stocks by equipment type and region are presented in Appendix 3.
Exhibit 27: Positive Displacement Chiller Stock in Article 5 Countries by Refrigerant, 2007-2040
0%
10%
20%
30%
40%
50%
60%
70%
80%
90%
100%
2007
2009
2011
2013
2015
2017
2019
2021
2023
2025
2027
2029
2031
2033
2035
2037
2039
Ref
riger
ant B
ank
in P
ositi
ve D
ispl
acem
ent C
hille
rs
R-407cR-410AHFC-134aHCFC-22
26

Exhibit 28: Projected Transition of Refrigerant Stock in Screw & Scroll Chillers in A5 Countries (2007 – 2040)
-
500,000
1,000,000
1,500,000
2,000,000
2,500,000
3,000,000
2007
2009
2011
2013
2015
2017
2019
2021
2023
2025
2027
2029
2031
2033
2035
2037
2039
Num
ber o
f Uni
ts In
stal
led
HFC-410AHFC-134aHCFC-22
Exhibit 29: Projected Transition of Refrigerant Stock in Reciprocating Chillers in A5 Countries (2007 – 2040)
-
10,000
20,000
30,000
40,000
50,000
60,000
70,000
2007
2009
2011
2013
2015
2017
2019
2021
2023
2025
2027
2029
2031
2033
2035
2037
2039
Num
ber o
f Uni
ts In
stal
led
R-407cHFC-134aHCFC-22
Note: the decline in banked refrigerant starting in 2023 represents the phaseout of equipment, as no new reciprocating chillers are assumed to be sold after 2009. The net stock of R-22 units begins to decline in 2023, while those of R-134a and R-407C begin to decline in 2030 (assuming an equipment lifetime of 30 years and that R-22 units began production in 1993 and R-134a/R-410A units began production in 2000).
27

28
5. Small and Large Air Conditioning Sector Small and large air conditioners comprise the vast majority of the global air conditioning market (UNEP 2007d). These systems cool enclosed spaces ranging from single rooms to large exhibition halls. Most are electrically-driven vapor-compression systems where air is drawn over a coil containing evaporating refrigerant. They generally fall into the following four categories:
• Small self contained air conditioners: These include small window-mounted, portable, and through-the-wall air conditioners. Due to their small size and relatively low cost, these are quite popular in Article 5 countries and are used in small shops and offices, as well as private residences. They range in capacity from 1.0 kW to 10.5 kW and have an average charge size of 0.75 kg or 0.25 kg per kW of cooling capacity (UNEP 2007d, IPCC/TEAP 2005).
• Non-ducted or duct-free split air conditioners: Non-ducted split air conditioners include a compressor/heat exchanger unit installed outside the space to be cooled or heated. The outdoor unit is connected via refrigerant piping to one (‘single-split’) or more (‘multi-split’) indoor units (fan coils) located inside the air conditioned space. These have become increasingly popular in Article 5 countries as entry-level ACs, especially in Asia for residential and light commercial applications (e.g., in schools, large apartments and free-standing residences). Capacities range from 2−28 kW for a single split, and from 4.5−135 kW for a multi-split system; charge sizes average about 1.28 kg or approximately 0.25 to 0.30 kg per kW of cooling capacity. (UNEP 2007d, IPCC/TEAP 2005).
A sub-category of non-ducted multi-split systems gaining ground in Article 5 countries are Variable Refrigerant Flow (VRF) systems. These systems provide air conditioning to multiple spaces using a single outdoor unit and multiple indoor units. VRF systems can regulate refrigerant flow in response to system demand and their capacities range from 10 kW to over 130 kW (UNEP 2007d).
• Ducted split residential air conditioners: Ducted split residential air conditioners have a duct system that supplies cooled or heated air to each room of a residence or individual zones within commercial or institutional buildings. Ducted systems are predominantly used in non-Article 5 countries; their capacities range from 2−20 kW, with corresponding charge sizes ranging from 0.26 to 0.35 kg per kW of capacity. (UNEP 2007d, IPCC/TEAP 2005).
• Ducted split commercial air conditioners: Ducted commercial air conditioners range in capacity from about 5 kW to as large as 420 kW. The majority of ducted, commercial split and single package air conditioners are mounted on the roof of buildings (e.g.., offices, retail stores and restaurants), or on the ground adjacent to the building. These can range in capacity from 5 to 420 kW (UNEP 2007d, IPCC/TEAP 2005).
Given that these types of residential and commercial AC equipment can range significantly in charge size, this analysis models a “small” and a “large” end use. Small AC is assumed to have an average charge size of 2 kg; large AC is assumed to have an average charge size of 11 kg (UNEP 2007d, IPCC/TEAP 2005). Equipment in this sector is assumed to have an average life span of 15 years (US EPA 2006).
The remainder of this section explores the market characteristics and refrigerants in use in this sector, as well as the projected transition away from ODS.
5.1 Market Characterization
According to industry sources there are hundreds of manufacturers of small and large AC equipment around the world (ICF 2007). China is the largest Article 5 manufacturer of AC equipment, with its total production having reached 67.6 million units in 2005 (UNEP 2007a). In 2006, China’s production of central AC equipment alone increased 20% over 2005, worth a total value of US$1.3

29
billion (Han 2005). In 2005, the top 10 brands in China accounted for about 75% of the domestic market (with Haier, Midea, and Gree alone representing nearly 40%), while the 29 smallest brands each accounted for less than 0.01%. Foreign and joint venture brands in China accounted for roughly 27% of the market (China Daily 2005).
A significant share of China’s production is for the export market. From August 2004 to July 2005, China exported nearly 24.68 million AC units (China Daily 2005). China supplies nearly 85% of the window, wall, and mini split AC imports to the United States. Other A5 producers are also important exporters; including South Korea, Thailand, Brazil, and Mexico. While non-A5 countries are small players in this global market, Canada, Germany, Italy, the United States, Israel, and others produce AC equipment for domestic and export markets. (Stratus 2006).
According to UNEP (2007), there were an estimated 478 million small window-mounted and wall air conditioning systems installed globally in 2004, of which 92.3% (or 441,194,000) used ODS refrigerants (UNEP 2007d). The same report estimates that a total of 21 million large AC systems were installed worldwide in 2004. According to UNEP (2005), 75% of AC units are installed in non-Article 5 countries. Thus, this analysis estimates that 25% of global AC units are installed in A5 countries (i.e., 108,842,000 small AC units, and 5,180,000 large AC units in 2004). To estimate current (2007) stocks of AC units, 2004 estimates were grown based on annual growth rates of 9% and 7% for small and large AC equipment, respectively,12 and A5 stocks were then disaggregated by region based on average GDPs from 1992-2006. Exhibit 30 presents the number of small and large AC units currently installed by A5 region.
Exhibit 30: Installed Base and Average Charge Size of Small and Large AC by Region (2007)a
AC Type/ Attribute Asia Latin America/ Caribbean
Middle East/ North Africa Africa
Small AC Number of units in use 86,446,200 30,177,700 12,938,900 12,168,400 Large AC Number of units in use 3,892,700 1,358,900 582,600 547,900
a ICF estimates based on UNEP (2007, 2005), ICF (2007).
The majority of Article 5 countries are still using HCFC-22 to produce AC products for their domestic markets (UNEP 2007d). According to various reports and industry sources, virtually the entire installed base of AC equipment in Article 5 countries contains HCFC-22 refrigerant (ICF 2007, UNEP 2007d, Stockholm Group 2007, Stratus 2006). However, some Article 5 countries do have access to HFC equipment, and such equipment has begun to penetrate A5 markets. For example, there were an estimated 100,000 R-407C AC units and 300,000 R-410A AC units in China in 2003 (UNEP 2007a). It is believed that much of the HFC-containing AC equipment penetrating the Chinese market is for “trophy projects,” where “green” products are sought, such as for new facilities being constructed for the Olympics (ICF 2007). Likewise, an estimated 5% of new AC equipment entering the market in South Africa contains R-410A, which is imported from Europe (Manikela 2007).
To estimate the current (2007) AC equipment stock that contains HFC refrigerants, China’s 2003 stock estimates of R-407C and R-410A were grown at an annual rate of 5% per year.13 These stock estimates were translated into share of current refrigerant inventory contained in AC equipment, assuming that China holds 50% of the AC units installed today in A5 countries in Asia (UNEP 2007a, ICF 2007). Based on this methodology, it is estimated that R-410A comprises 0.75% of the current stock of small and large AC units, while R-407C comprises 0.25% (see Exhibit 31). These percentages were assumed to apply to all Article 5 regions. Based on these estimates, Exhibit 32 presents the number of small and large AC units by refrigerant type currently installed by A5 region. 12 This growth rate is the weighted average projected market growth rates for A5 regions from 2007-2010, as shown in E . xhibit 34
hibit 3413 This growth rate is half of the projected market growth rate for AC equipment in Asia from 2007-2010, as shown in Ex ; it is reflective of the fact that demand for HFCs (e.g., for “trophy projects”) is growing, but not in step with the overall market.

30
Exhibit 31: Current Refrigerant Inventory in AC Units by Regiona
AC Type Asia Latin America/ Caribbean
Middle East/ North Africa Africa
Small AC R-22 99% 99% 99% 99% R-410A 0.75% 0.75% 0.75% 0.75% R-407C 0.25% 0.25% 0.25% 0.25% Large AC R-22 99% 99% 99% 99% R-410A 0.75% 0.75% 0.75% 0.75% R-407C 0.25% 0.25% 0.25% 0.25%
a ICF estimates based on UNEP (2007a), ICF (2007).
Exhibit 32: Installed Base of Small and Large AC Equipment by Refrigerant and Region (2007)a
AC Type Asia Latin America/ Caribbean
Middle East/ North Africa Africa
Small AC R-22 85,581,700 29,875,900 12,809,500 12,046,700 R-410A 648,300 226,300 97,000 91,300 R-407C 216,100 75,400 32,300 30,400 Large AC R-22 3,853,800 1,345,300 576,800 542,420 R-410A 29,200 10,200 4,400 4,110 R-407C 9,700 3,400 1,500 1,370
a ICF estimates based on UNEP (2007d), Manikela (2007), ICF (2007).
5.2 Alternatives and Barriers/Drivers to Implementation
As mentioned earlier, almost all of the small and large AC equipment manufactured in Article 5 countries uses HCFC-22. Currently, the only feasible alternatives for such equipment are HFCs, primarily R-410A and R-407C (IPCC/TEAP 2005, Calm and Domanski 2004). However, R-410A operates more efficiently than R-407C and globally, already accounts for approximately 10 percent of residential and small commercial AC sales, up from just 5 percent in 2004 (ICF 2007).
In the future, other alternatives may also become market players. R-417A is feasible for use in both new and existing unitary AC units, but has a high GWP (DuPont 2006). CO2 and HCs (e.g., propane) may also one day be feasible, but extensive research and development is still needed to design systems to address potential safety hazards (CIAA/ECSLA/EuroCommerce 2005, IPCC/TEAP 2005). However, these are unlikely to significantly displace R-410A unless regulations are introduced that require a shift away from R-410A.
Each of the current and potential future alternatives that are/may be used in AC applications are described in more detail below.
• R-410A: R-410A, with a GWP of 1,890, is a binary blend (HFC-32/HFC-125) that can replace HCFC-22 in new equipment production. R-410A air conditioners (up to 175 kW) are commercially available in the U.S., Asia, and Europe. A significant portion of the duct-free products manufactured in Japan and Europe now use R-410A as the preferred refrigerant. After 2010, air conditioners sold in the U.S. market will predominately utilize R-410A as the HCFC-22 replacement. This blend results in system pressures approximately 50 percent higher than with HCFC-22. However this has been addressed by implementing design changes such as heavier wall compressor shells, pressure vessels (accumulators, receivers, filter driers), heat exchangers and refrigerant tubing (UNEP 2007d).
• R-407C: R-407C, with a GWP of 1,610, is a blend composed of HFC-32, HFC-125, and HFC-134a. There are currently R-407C air conditioning products widely available in Europe, Japan and other parts of Asia. R-407C has also seen some limited usage in the United States and Canada, primarily in commercial applications. R-407C requires only

31
• HFC-134a: R-134a is the only single component HFC that has seen any commercial
• 17A, with a GWP of ~1,955, is composed of HFC-134a, HFC-125, and HC-600
• C-
• introduced into
In addit se alternative refrigerants, a number of other non-ODS technologies—such as
ergy consumption and LCCP of actual and potential
modest modifications to existing HCFC-22 systems and is sometimes used for retrofits of air conditioning equipment. Performance tests with R-407C indicate that in properly designed air conditioners, this refrigerant will have capacities and efficiencies within ±5% of equivalent HCFC-22 systems. However, many of these products are now beginning to transition from R-407C to R-410A to obtain improved serviceability and higher efficiencies. (UNEP 2007d).
application. However, R-134a is not a drop-in replacement for HCFC-22 since the compressor displacement must be increased approximately 40 percent to compensate for the lower refrigeration capacity of R-134a. Significant equipment redesign is necessary to achieve efficiency and capacity equivalent to HCFC-22 systems. These design changes include larger heat exchangers, larger diameter interconnecting refrigerant tubing, and re-sized compressor motors. R-134a has not seen broad use because manufacturers have been able to develop lower cost air conditioning systems using HFC blends such as R-407C and R-410A.
R-417A: R-4(butane). This zeotropic blend has primarily been promoted as a drop-in and retrofit refrigerant for HCFC-22 in air conditioning and refrigeration applications.
Hydrocarbons: While it has been reported that hydrocarbon blends such as HC-290, H1270 and HC-290/HC-170 have been used drop-in replacements for HCFC-22 in a few locations, the future use of hydrocarbon refrigerants in the air-conditioning sector will largely depend on the added costs of safety mitigation technologies. Compared to HFCs, hydrocarbon refrigerants offer reduced charge levels (approximately 0.10 - 0.15kg/kW of cooling capacity), miscibility with mineral oils (synthetic lubricants are not required), reduced compressor discharge temperatures, and improved heat transfer due to favourable thermo-physical properties. However, using hydrocarbon refrigerants in air conditioning systems also presents challenges, including safety concerns and difficulties with handling, installation practices, and field service skills and practices. (UNEP 2007d).
Carbon dioxide (R-744): While R-744-based air conditioners have not beenthe market yet and it is not expected to play a significant role in the replacement of HCFC-22 in air conditioning applications in the immediate future, the UNEP RTOC report (2007d) indicates that a number of compressor manufacturers have active R&D programs for R-744 compressors. R-744 offers a number of desirable properties as a refrigerant: readily available, low GWP and low cost. R-744 systems are also likely to be very compact; though not necessarily lower cost than HCFC-22 systems. These desirable characteristics are offset by the fact that R-744 air conditioning systems can have low operating efficiencies and very high operating pressures. It is also anticipated that the cost of CO2 air conditioning will be significantly more than conventional systems (up to 30% more than HCFC-22 systems), due to modifications that are required to improve safety (ADL 2002, IPCC/TEAP 2005, Sand et al. 1997)
ion to theabsorption, desiccant cooling systems, stirling systems, and thermoelectric systems—were previously presented as options that could have a positive impact on the phase-out of ODS in air-conditioning equipment. However, industry input and literature survey indicates that these technologies have not progressed much closer to commercial viability for air conditioning applications. While these alternative systems are theoretically feasible, it is highly unlikely that they will penetrate Article 5 markets in the next decade. (UNEP 2007d)
Exhibit 33 presents a summary of the enalternative refrigerants in unitary and window AC units relative to HCFC-22, based on published data.

32
Exhibit 33: Relative Energy Consumption and LCCP of Alternative Refrigerants in Unitary and Window AC Relative to HCFC-22 Alternative Refrigerant
Energy Consumptiona
(Source) LCCP
(Source) Unitary AC R-134a +5% to +10% (Sand et al 1997) -1% (ADL 2002) R-407C Similar (Sand et al 1997, ADL 2002) Similar (ADL 2002) R-410A -4% to -7% (Sand et al 1997) Similar (Minor 2004) CO2 Similar (ADL 2002) Slight reductions (IPCC/TEAP 2005) R-290 +12% to +23% (Goetzler and Dieckmann 2001, Sand et al. 1997) -3% to -8% (ADL 2002) Window AC R-134a Greater (Hundy and Pham 2001) - R-407C 0% to +5% (Minor 2004) Similar (Minor 2004) R-410A 0% to -7% (Calm and Domanski 2004, Minor 2004) - R-290 Similar (Hickman 2004) - - = No information available a Positive energy consumption indicates that the alternative refrigerant consumes more energy than the baseline refrigerant.
5.3 Projected Transitions
Commercialized products using HFC refrigerants are available in most non-Article 5 countries. In addition, climate-friendly products that utilize HC refrigerants are available to a limited extent in some product categories, such as portable air conditioners. The widespread availability of these technologies in non-Article 5 countries should provide optimism that the technologies will be cost effective and readily available in Article 5 countries in the next decade. In addition, some ODS alternatives have begun to penetrate Article 5 markets, including China and South Africa.
However, given the low price of HCFC-22 equipment, it is anticipated that most small and large AC equipment sold in Article 5 countries will continue to utilize HCFC-22 for the foreseeable future, within the limits imposed by the cap on consumption that enters into force in 2016. An accelerated phaseout of HCFCs in Article 5 countries could change this.
Exhibit 34 presents the projected overall market growth rates in the short- and long-terms for small and large AC equipment by Article 5 region. Short-term growth rates were based on:
• Latin America/Caribbean: weighted average of the projected growth rates from 2007-2010 for Argentina, Brazil, Colombia, Mexico, and Venezuela (UNDP 2007).
• Middle East/North Africa: weighted average of the growth rates in Lebanon and Iran (UNDP 2007).
• Asia: growth rates in China, India, and Indonesia (Han 2007, UNDP 2007, ICF 2007). • Africa: growth rates based on industry information (ICF 2007) and the projected growth rate
for South Africa (Manikela 2007). Long term (2010-2040) growth rates in small air conditioning systems were assumed to be half as much as the short term, due to fluctuations in economic growth and increasing market saturation.

33
Exhibit 34: Projected Market Growth by Region
Timeframe Asia Latin America/ Caribbean
Middle East/ North Africa Africa
Small AC 2007-2009 10%a 9% 9% 6% 2010-2040 5% 4% 4% 3% Large AC 2007-2009 10%a 3% 3% 3% 2010-2040 3% 3% 3% 2%
Source: UNDP (2007), Manikela (2007), Han (2007), ICF (2007). a While a 10% growth rate for the region is projected, actual growth may be significantly higher in certain countries, such as China and India. For example, because the urbanization level in China may reach 45% in 2010, considerable demand may be created for upgraded residences in that country (Han 2007). Similarly in India, domestic industry sources project that the compound annual growth rate in the short-term may be as high as 23% for small AC and 17% for large AC (ICF 2007). Because no significant number of retrofits is assumed to occur in the future, the transition to alternative refrigerants in AC equipment will occur as equipment manufacturers offer different refrigerants in new equipment in response to political and economic constraints. Based on industry consultations, current and future equipment sales by refrigerant type were projected through 2040. Assumptions used in developing these projections are as follows:
• Current market penetration of refrigerants remains constant until 2010 (i.e., 99% R-22, 0.75% R-410A, and 0.25% R-407C) in all Article 5 regions.
• In 2010, a slight, gradual shift towards increasing sales of HFC-containing equipment is projected to occur, as a result of the U.S. HCFC phaseout (which is expected to ban the import of pre-charged AC equipment), which will in turn compel A5 manufacturers to further transition their AC production away from R-22 to satisfy demand in export markets. Specifically, it is projected that the market share of R-22 in newly manufactured equipment will decline from 99% in 2010 to 90% in 2020.14 Meanwhile, it is projected that the market share of R-410A will gradually increase from less than 1% in 2010 to 10% in 2020. R-407C is assumed to drop out of the market in 2010, as it is less efficient than R-410A.
• From 2020 to 2040, the market penetration of refrigerants into new equipment is projected to remain constant (at 90% R-22 and 10% R-410A).
Applying these assumptions on equipment retirement, market growth, and anticipated penetration of refrigerants into new equipment, Exhibit 35 presents the refrigerant transition for all A5 countries in small and large AC equipment in terms of the installed bank. More detailed results on the estimated stocks by equipment type and region are presented in Appendix 3.
14 This analysis does not attempt to project how individual A5 countries will meet the HCFC consumption/production cap in 2016; given that use of HCFC-22 in small AC equipment was among the last HCFCs/equipment types to be phased out in many non-A5 countries (in order to meet phaseout targets), this analysis assume that use of HCFC-22 in AC equipment will be unconstrained in A5 countries until 2040.

Exhibit 35: Projected Transition of Refrigerant Stock in Installed AC Units in A5 Countries (2007-2040)
-
100,000,000
200,000,000
300,000,000
400,000,000
500,000,000
600,000,000
700,000,000
800,000,000
2007
2009
2011
2013
2015
2017
2019
2021
2023
2025
2027
2029
2031
2033
2035
2037
2039
Num
ber o
f Uni
ts In
stal
led
HFC-407CHFC-410AHCFC-22
34

6. Summary of Results and Considerations for HCFC Phaseout Based on information from recently published reports and key industry representatives, this report developed estimates of the current and future stocks of chillers and AC equipment in Article 5 regions under a business-as-usual scenario. The findings of the analysis indicate that the current installed base of CFCs in Article 5 countries, primarily contained in centrifugal chillers, will decline and reach full phase out by 2025. Meanwhile, HCFCs banks will continue to rise. As shown in Exhibit 36, the installed base of HCFCs in Article 5 countries will grow from nearly 518,250 MT in 2007 to more than 776,800 MT in 2015, nearly all of which will be HCFC-22. By 2040, this installed base of HCFCs in AC equipment will reach 1,853,700 MT; Asia, led by China, is projected to account for more than 70% of this amount.
Exhibit 36: Projected HCFC Bank in Chillers/ AC Equipment in Article 5 Countries (2007-2040)
-
200,000
400,000
600,000
800,000
1,000,000
1,200,000
1,400,000
1,600,000
1,800,000
2,000,000
2007
2009
2011
2013
2015
2017
2019
2021
2023
2025
2027
2029
2031
2033
2035
2037
2039
HC
FC B
ank
(MT)
Asia Latin America/Caribbean Middle East/North Africa Africa
• Centrifugal Chillers: The total bank of HCFCs currently installed in centrifugal chillers in
Article 5 countries is estimated to be 9,100 MT, 85% of which is composed of R-123 and the rest by R-22. The total bank of CFCs is estimated to be 6,900 MT. Around 60% of the bank is installed in Asia, 20% is in the Middle East/North Africa, 15% is in Asia; and the rest is installed in Africa. Market trends indicate that this sector will continue to grow rapidly in the near future, driven by growth in China and the Middle East.
The majority of the current bank is expected to be phased out through replacement—not retrofit—activity, as old equipment is retired. R-134a is and will remain the dominant refrigerant used in new centrifugal chillers, although R-123 captures 25% of the market. Given the costs involved in commercializing alternatives, it is unlikely that manufacturers will pursue the development of any other alternatives to replace these refrigerants—unless there is a regulatory imperative to do so, which there currently is not.
• Positive Displacement Chillers: The total bank of HCFCs currently installed in positive displacement chillers in Article 5 countries is estimated to be 164,000 MT, all of which is
35

36
composed of R-22. Of this, screw and scroll chillers account for 156,400 MT and reciprocating chillers account for 8,900 MT. 80% of the total bank is installed in Asia, 11% in Middle East/North Africa, and 9% in Latin America/Caribbean; the rest of Africa accounts for less than 1% of the current bank. Market trends indicate that the future market for screw and scroll chillers will remain strong, while markets for reciprocating chillers will decrease.
R-134a, which currently accounts for approximately 15-20% of all positive displacement chiller sales, will be the dominant refrigerant installed in new units by 2020—capturing 80% of the screw chiller market and 20% of the scroll chiller market. The remainder of the screw chiller market is projected to use R-22, while the remainder of the scroll chiller market is projected to use R-410A (50%) and R-22 (30%). Due to cost and efficiency constraints, retrofits are not expected to play a significant role in the transition away from HCFCs in this end use.
• Small and Large Air Conditioning: The total bank of HCFCs currently installed in small and large AC equipment is estimated to be 343,800 MT, nearly all of which is composed of R-22. Around 60% of this bank is installed in Asia, 20% in Latin America/Caribbean, with the remainder split between the Middle East/North Africa and Africa. This end use is expected to experience significant growth in the next few years across all Article 5 regions, especially the small AC segment.
R-22 is expected to continue dominating this sector in future. A slight shift towards R-410A is anticipated from 2010 onwards, when the U.S. bans imports of equipment pre-charged with R-22. Availability of R-410A and R-407C based AC equipment in Article 5 regions that manufacture equipment for export may promote the penetration of these alternatives. However, without an accelerated phaseout, the transition away from HCFCs in this sector will be slow.
6.1 Market Drivers
Only regulatory drivers are likely to force the transition away from HCFCs in A5 countries to occur faster than projected in Exhibit 36. Simply stated, manufacturers will avoid incurring the capital costs and down-time associated with plant conversion as long as possible, even though the annual costs associated with the transition (i.e., refrigerant and component prices) will not vary significantly once economies of scales are reached. Current market drivers will not promote a shift away from ODS, as explained further below.
Currently, the price of R-22 in China is $1.32/kg, while that of R-410A is $13.18/kg, and that of R-407C is $10.30/kg (UNEP 2007a). With no technical reasons to compel the switch to alternative refrigerants (e.g., significant efficiency improvements), these prices send clear signals to A5 equipment manufacturers to continue to rely on R-22. This is especially true given the intensely competitive nature of the AC market, with AC manufacturers facing market pressure associated with rising production and marketing costs, the implementation of new energy efficiency standards, and shrinking profits (China Daily 2005). Thus, while A5 countries export AC equipment containing R-407C and R-410A to non-A5 markets (e.g., Europe, Japan, U.S., Australia), market signals dictate that it continue using R-22 in new equipment sold in A5 markets.
Further, because of the financial incentives provided by the Kyoto Protocol’s Clean Development Mechanism (CDM) for the production of HCFC-22 (and capture of HFC-23), a large, steady supply of R-22 for use in new equipment, as well for the servicing of existing equipment, is guaranteed until 2012.
Indeed, the accessibility and affordability of refrigerants is critical for the servicing sector in A5 countries. Similarly, the servicing sector requires access to the AC equipment components; thus, to the extent that HFC refrigerants will require different materials and parts, the after-market will require that they be made available, at affordable prices. In short, the availability and affordability of HFC refrigerants and their associated components will be critical not only to compel manufacturers to

37
adopt ozone-friendly alternatives in the new equipment they produce, but also to compel consumers to choose that alternative equipment—and to ensure a well-functioning after-service market. This will be particularly critical after 2040 (under the current phaseout schedule for HCFCs), as HCFCs will become scarce and servicing needs for HCFC equipment will have to be met through recovered and reclaimed sources. To the extent that natural refrigerants can earn a larger market share over time, this will reduce dependence on HFCs as the market leader for transition, and will reduce demand for reclaimed HCFCs in non-essential sectors. A strong regulatory push away from HFCs with high global warming potentials (GWPs) in the future would trigger the intensified development and use of natural refrigerants (beyond that projected in this analysis).
Refrigerant price trends will also change because of availability. As the global phaseout of HCFC-22 in non-Article 5 countries reduces global supply of virgin R-22, quantities in Article 5 countries may also decline slightly, which would in turn cause prices to rise. In addition, the financial incentives to produce HCFC-22 under the CDM may no longer be in play beyond 2012. Meanwhile, R-410A, which is under patent until 2009, will drop in price once the patent expires, and once it begins to be produced at economies of scale in non-A5 countries (i.e., when R-22 is banned).
Further, as the HCFC phaseout progresses in non-A5 countries, global demand for HCFCs and other ozone-friendly alternatives will rise (e.g., in response to the expected US ban on the import of pre-charged products containing R-22 in 2010). These changes may cause a shift in refrigerant pricing structures over time and, potentially, provide a market signal to Article 5 countries to invest in manufacturing facilities that produce equipment and products without HCFCs. Such investments for alternative product lines may cause Article 5 countries, such as China, to produce the same products for domestic consumption as well, if economies of scale can be achieved.
Should economies of scale be reached, the overall costs to produce R-410A units will be similar to those of producing R-22 units, even though different components will be needed. In particular, R-410A units will require superior design to account for the higher pressure refrigerant, including tighter joints and better seals, but they will also require smaller (lower cost) compressors, so these costs will offset to some degree. Actual component costs will vary based on the location of suppliers, volumes purchased, and other factors (ICF 2007)
Under the current schedule, the shift to non-ODS alternatives in A5 countries will occur slowly. It will take years, if not decades, before equipment based on HFCs and other refrigerants become more readily available at truly competitive prices, and for equipment manufacturers to acquire the necessary capital investment in the form of factory tooling, sub-product design, and networks of suppliers of components, as described in more detail below.
6.2 Costs and Barriers Associated with HCFC Phaseout
Whenever the transition away from HCFCs in the AC sector occurs in A5 countries, there will be costs associated with the replacement of AC installations (i.e., large tonnage chillers), as well as the conversion of manufacturing facilities that produce HCFC-containing AC equipment.
6.2.1 Chiller Equipment Replacement
Given the large stocks of large tonnage HCFC chillers that are projected to be installed in A5 countries (see Exhibit 37), in addition to the long lifetime and high investment cost of such equipment, HCFC chillers are likely to remain in use for many more decades beyond 2040.
Exhibit 37. Projected Number of HCFC Centrifugal Chillers Installed in A5 Countries (2007-2040) Year 2007 2010 2015 2020 2030 2040
HCFC-123 17,330 20,920 24,490 28,690 39,580 55,190 HCFC-22 2,940 3,320 2,810 2,370 1,690 1,200 Total 20,270 24,240 27,300 31,060 41,270 56,390

38
In Article 5 countries, the average cost of a centrifugal chiller is roughly $140,000 (GTZ 2006, BSRIA 2007, ICF 2007). Based on this estimate, the information on number of units provided in Exhibit 37, and an assumed average equipment lifetime of 30 years, the cost of early retirement in 2020—assuming 100% of units are immediately retired in 2020—is approximately $1.6 billion at a 7% discount rate (or $2.1 billion at a 5% discount rate); in 2030, the estimated cost of early retirement is estimated at $1.1 billion at a 7% discount rate (or $1.7 billion at a 5% discount rate).
6.2.2 Conversion of AC Manufacturing Facilities
The total costs for converting chiller/AC manufacturing facilities to use non-HCFC refrigerants will largely depend on the total number and production capacity of manufacturing plants in Article 5 countries. At the facility-level, the cost can vary widely based on specific equipment type and the volume of refrigerant used.
For example, to rebuild a 500,000-unit product line of R-22-based window AC units to produce R-410A units, UNEP (2007a) estimates that it will cost roughly US$100,000. Industry research indicates, however, that this is a low-end conversion cost that could likely only be realized if the HCFC-based plant already produces a limited amount of HFC-based equipment; such that investment would only be required to switch the charging station to HFCs. In some places, this type of dual production may already be underway; for example, China is currently producing HCFC-based equipment for certain markets, and may have parallel production lines in the same manufacturing facilities that produce HFC-based equipment for other markets. However, if HFC technology is not already integrated into the production facility, an HCFC-based plant would require upwards of US$6 million to cover the cost of technology transfer, other research and development, retooling, and other conversion costs. Similar costs may be expected to convert manufacturing plants that produce other types of equipment with equivalent output. For example, for a plant that produces 3,000 chillers per year with average capacity of 3,500 kW, it would cost around US$6 million to convert from HCFCs to HFCs. (ICF 2007)
In addition to the capital cost of conversion, incremental operating costs will also be incurred in the form of higher incremental refrigerant costs and component costs. For window AC units, for example, the cost of R-410A is greater than that of R-22, and higher component costs (up to $5/unit) are associated with the use of thicker walled copper tubing, newly developed compressors, and other components needed to withstand the high pressures of R-410A (Actrol 2007, ICF 2007).
6.3 Policy Implications
The findings of this analysis indicate that in the absence of stronger regulatory drivers in Article 5 countries, the use of HCFC in chillers, and especially in other AC equipment, will continue to rapidly increase in the coming years. Due to the pervasive use of R-22, a large inventory will likely remain in service long after production is scheduled for phaseout in 2040. This build-up will lead to a surge in ODS emissions from equipment leakage, servicing, and disposal. Accelerating the phaseout of HCFCs in Article 5 countries could reduce this deepened reliance on R-22 and avoid emissions of ODS that could delay the recovery of the ozone layer. Programs that provide an economic incentive to replace older equipment, coupled with technical assistance programs that highlight the energy efficiency gains from replacing older ODS equipment, can help redirect this path.

39
7. References Actrol. R-410A: The Refrigerant of the Future. Accessed July 27, 2007. Available online at:
<http://www.actrol.com.au/techPapers/r410a.pdf>.
Alliance for Responsible Atmospheric Policy (ARAP). 2006. Transition to Non-CFC Chillers: Manufacturers’ Perspective. Presentation to Stakeholder Meeting for the Implementation of UNEP Global Technical Assistance Programme in the Chiller Sub-Sector, October 29, 2006.
Alliance for Responsible Atmospheric Policy (ARAP). 2004. HCFC Regulations. Available at <http://www.arap.org/regs/>. Last accessed 30 August 2007.
Arkema. 2006. Turkchem 2006, November 2-5 2006: Arkema Press Kit. Available at < http://www.arkema.com/pdf/EN/press_release/2006/turkchem06%20arkema%20press%20kit%20(oct%202006).pdf>. Last accessed 31 August 07.
Arthur D. Little (ADL). 2002. Global Comparative Analysis of HFC and Alternative Technologies for Refrigeration, Air Conditioning, Foam, Solvent, Aerosol Propellant, and Fire Protection Applications. Final Report to the Alliance for Responsible Atmospheric Policy, 21 March 2002 Accessible at: <http://www.arap.org/adlittle/toc.html>.
BOC Gases. 2007. Safety Data Sheet FX 100 (R427a). Available at <http://www1.boc.com/uk/sds/special/fx100.pdf>.
Building Services Research and Information Association (BSRIA). 2007. Latin America Chiller Market report
Calm, James M. 2005. Comparative efficiencies and implications for greenhouse gas emissions of chiller refrigerants. Presented at the Fourth International Symposium on Non-CO2 Greenhouse Gases (NCCGG-4, Utrecht, The Netherlands, 4-6 July 2005), Vereniging van Milieukundigen (VVM) [Netherlands Association for Environmental Professionals], Den Bosch; The Netherlands; Millpress Science Publishers, Rotterdam, The Netherlands; 671-680, July 2005.
Calm, James M. 2004. Refrigerant Options for Centrifugal Chillers. Proceedings of the 2004 International Workshop on Ozone Depleting Substance Substitute Technologies Xi’an, China, 2004.09.16-18- China State Environmental Protection Administration (SEPA), Beijing, PRC.
Calm, James M. and Piotr A. Domanski. 2004. R-22 Replacement Status. American Society of Heating, Refrigerating and Air-Conditioning Engineers (ASHRAE) Journal. August.
China Daily. 2005. Air-Conditioning Market Hotting Up. 22 September 2005. Available at <http://www.china.org.cn/english/BAT/143042.htm>.
Confederation of the Food and Drink Industries of the EU (CIAA)/European Cold Storage Logistics Association (ECSLA)/EuroCommerce. 2005. HCFC Alternatives Survey Response.
DuPont. 2006. “DuPontTM ISCEON® ‘9’ Series Refrigerants: Product Review for the ICF’s EC Study.” Provided by Mark A. Smith, Global Marketing Manager, Stationary Refrigeration, Dupont, Geneva, Switzerland. 18 August 2006.
Goetzler, William and John Dieckmann. 2001. “Assessment of the Commercial Implications of ASHRAE A3 Flammable Refrigerants in Air Conditioning and Refrigeration Systems (Final Report, June 2000 – August 2001).” Prepared by Arthur D. Little for the Air-Conditioning and Refrigeration Technology Institute. 12 April.
Han, Viloet. 2007. China is a Growing Market for Central Air-Conditioning. Appliance Magazine. June 2007. Available at <http://www.appliancemagazine.com/editorial.php?article=1770&zone=223&first=1>.

40
Hickman, Kenneth E. 2004. York International Corporation. “Assessment of Comparative Testing of HFC and Hydrocarbon Refrigerants.” The GREEN Program. York, Pennsylvania U.S.A.
Honeywell. 2007b. Personal communications between Honeywell and ICF International. August 16, 2007.
Hundy, GF and HM Pham. 2001. Copeland Corporation. “Effect of Refrigerant Choice on Efficiency in Air Conditioning.” Presented at the Annual Conference of the Institute of Refrigeration, London, England. 1 November.
Intergovernmental Panel on Climate Change (IPCC)/ Technology & Economic Assessment Panel (TEAP). 2005. Safeguarding the Ozone Layer and the Global Climate System: Issues Related to Hydrofluorocarbons And Perfluorocarbons. Intergovernmental Panel on Climate Change and the Technology & Economic Assessment Panel of the United Nations Environment Programme Ozone Secretariat. Available at < http://www.ipcc.ch/activity/sroc/index.htm>.
ICF International (ICF). 2007. Market information collected from industry representatives for the World Bank Chiller Report through surveys, phone, and email. May-August 2007.
Intergovernmental Panel on Climate Change (IPCC)/ Technology & Economic Assessment Panel (TEAP). 2005. Safeguarding the Ozone Layer and the Global Climate System: Issues Related to Hydrofluorocarbons And Perfluorocarbons. Intergovernmental Panel on Climate Change and the Technology & Economic Assessment Panel of the United Nations Environment Programme Ozone Secretariat. Available at < http://www.ipcc.ch/activity/sroc/index.htm>.
Intergovernmental Panel on Climate Change (IPCC). 2000. IPCC Good Practice Guidance and Uncertainty Management in National Greenhouse Gas Inventories (2000).
Intergovernmental Panel on Climate Change (IPCC). 1996. IPCC Second Assessment Report: Climate Change 1995. Available at <http://www.ipcc.ch/pub/sa(E).pdf>.
Kuijpers, Lambert. 2006. UNEP Chiller Task Force Update: Incentives and Impediments to Transition to Non-CFC Chillers including availability of Refrigerants for Servicing.
Manikela, Sam. 2007. Personal communication between Sam Manikela, Deputy Director: Ozone Layer Protection, South African Department of Environmental Affairs and Tourism, and Pamela Mathis, ICF International. August 2007.
Minor, Barbara H. 2004. "R-410A and R-407C Design and Performance - A Literature Review." Earth Technologies Forum, April 13-15, 2004.
Sand, James R., et al. 1997. Energy and Global Warming Impacts of HFC Refrigerants and Emerging Technologies. US Department of Energy, Alternative Fluorocarbons Environmental Acceptability Study (AFEAS).
Stockholm Group. 2007. Stockholm Group Meeting V: HCFC-Metrics, Costs, Ozone-Climate Synergy. Presentation given by Husamuddin Ahmadzai. 27 July 2007.
Stratus Consulting. 2006. Imports of Appliances Pre-Charged with Hydrochlorofluorocarbons. Draft report prepared for US Environmental Protection Agency. 31 October 2006.
United Nations Development Programme (UNDP). 2007. HCFC Surveys in Nine Article 5 Countries (Presented by UNDP). UNEP/OzL.Pro/ExCom/51/Inf. 2. 20 February 2007. Prepared by UNDP and country governments, organizations, and consultants.
United Nations Environment Programme (UNEP). 2007a. Study on the Strategy for the Long Term Management of HCFCs in China (Presented by Germany). UNEP/OzL.Pro/ExCom/51/Inf. 3. 19 February 2007.

41
United Nations Environment Programme (UNEP), 2007b. Report of the Task Force on HCFC Issues (with Particular Focus on the Impact of the Clean Development Mechanism) and Emissions Reduction Benefits arising from Earlier HCFC Phase-out and Other Practical Measures. United Nations Environment Programme. July 2007. Available at: <http://ozone.unep.org/Assessment_Panels/TEAP/Reports/TEAP_Reports/TEAP-TaskForce-HCFC-Aug2007.pdf> Last accessed: August 17, 2007.
United Nations Environment Programme (UNEP). 2007c. UNEP Ozone Secretariat Article 7 Reporting, accessed June 8, 2007 (Database last updated: Thursday 17th May 2007 at 10:26 am).
United Nations Environment Programme (UNEP). 2007d. UNEP 2006 Report of the Refrigeration, Air Conditioning and Heat Pumps Technical Options Committee.
United Nations Environment Programme (UNEP). 2007e. 2006 Assessment Report of the Technology and Economic Assessment Panel. March 2007.
United Nations Environment Programme (UNEP). 2006. Presentations made at the Stakeholder Meeting for the Implementation of the Global Technical Assistance Programme in the Chiller Sub-sector held on 29 October 2006 in New Delhi.
United Nations Environment Programme (UNEP). 2005. TEAP Supplement to the IPCC/TEAP Report. November 2005. Available at http://unep.org/ozone/teap/REPORTS/TEAP_Reports/teap-supplement-ippc-teap-report-nov2005.pdf
United Nations Environment Programme (UNEP). 2004. Report of the Technology and Economic Assessment Panel Chiller Task Force.
US Environmental Protection Agency (US EPA). 2007a. Changes in HCFC Consumption and Emissions from the US Proposed Adjustments for Accelerating the HCFC Phaseout. Prepared by ICF International for the US Environmental Protection Agency Office of Air and Radiation Stratospheric Protection Division. August 2007. Available at http://ozone.unep.org/Meeting_Documents/mop/19mop/USA-HCFC-Accerelated-phase-proposal.pdf
US Environmental Protection Agency (US EPA). 2006. The Potential Cost of Global Non-CO2 Greenhouse Gas Reduction.
US Environmental Protection Agency (US EPA). 2005. Current Trends in Industrial Process Refrigeration, Chillers, and Cold Storage. Report prepared by ICF International for US EPA Global Programs Division. 15 September 2005.
GTZ. 2006. Utilizing the Clean Development Mechanism of the Kyoto Protocol to Modernize Refrigeration Systems—AFROC – An Example for Chiller CDM Financing in Africa. Presentation given by Juergen Usinger at the World Bank Global Chiller Workshop, New Delhi, India. 29 October 2006.
World Bank. 2006. Global Development Network Growth Database, Macro Time Series. Available at http://econ.worldbank.org/WBSITE/EXTERNAL/EXTDEC/EXTRESEARCH/0,,contentMDK:20701055~pagePK:64214825~piPK:64214943~theSitePK:469382,00.html.
World Bank. 2005. International Chiller Sector Energy Efficiency and CFC Phaseout. Prepared by ICF International.
World Bank. 2002. CFC Markets in Latin America. Prepared by ICF International.
York. 2007. Letter from Tony Digmanese to Ahmadzai Husamuddin, Chair of Stockholm Group, and other distinguished members of the Group. Re: York International, A Johnson Controls

42
Company, comments on the Haag Report of Stockholm Group 3rd Meeting on Feb 6, 2007. 16 March 2007.

43
Appendix 1 –Questionnaire for Key Government and Industry Contacts Questionnaires were tailored to industry contacts, associations, and government representatives based on their areas of expertise (in terms of equipment types and regional coverage). The questionnaire presented below is a sample questionnaire sent to the National Ozone Unit in South Africa.
[Sample] Questionnaire on the Chiller/AC Markets in South Africa
Part I: Chillers
1. What percent of all chillers in use in Africa (excluding North Africa) are found in South Africa?
2. What is the estimated total number of centrifugal and positive displacement chillers currently in use in South Africa?
Current Chiller Stock by Type Chiller Type South Africa Centrifugal Positive Displacement Chillers
Screw & Scroll Reciprocating
3. What is the current market growth rate for chillers in South Africa? What do you project will be the growth rate from 2010-2015?
4. How do you expect the chiller market to grow in the rest of Africa (excluding North Africa)?
5. From where does South Africa import most of its centrifugal chillers? What about positive displacement chillers?
6. What is the average capacity (kW) of centrifugal chillers used in South Africa? What about the average capacity (kW) of positive displacement chillers?
7. Does the cost of chiller equipment sold in South Africa vary significantly by refrigerant type?
Part II: Residential and Commercial Air Conditioning
NOTE: Residential and commercial AC is assumed to include small self contained AC systems; non-ducted split residential and commercial AC systems; ducted, split residential AC systems; and ducted commercial split and packaged AC systems. For the purposes of this analysis, AC equipment is grouped into two general categories: (1) small AC, with an average charge size of 2 kg; and (2) large AC, with an average charge size of 10 kg.
8. From where does South Africa import most of its small and large AC equipment?
9. What percent of all residential/commercial AC equipment in use in Africa (excluding North Africa) is found in South Africa?
10. Can you estimate current stocks of small and large AC equipment in use in South Africa?
Existing AC Equipment Stock by Type (2007) AC Equipment Type Number of Units in South Africa Small (average 2 kg charge size) Large (average 10 kg charge size)
11. What is the current market growth rate for small and large AC equipment in South Africa? What do you project these market growth rates to be from 2010-2015?
12. What are the primary refrigerants in use in current stocks of AC equipment today, and how do you expect that mix of gases to change between now and 2020? For example, do you expect the phaseout of HCFC-22 in developed countries to influence the types of refrigerant used in newly manufactured equipment sold in South Africa?
13. What is the average cost of small and large AC equipment sold in South Africa?

44
Appendix 2 – List of Major Chiller and AC Manufacturers Exhibit: Major Chiller and AC Manufacturers
Company Headquarter Country Advance Cool Technology Co., Ltd. Thailand Aermec Italy Bharat Refrigerations Pvt. Ltd India Blue Box Italy Blue Star India C&D International China Carrier US Chigo China Ciat France Climaveneta Italy Clivet Italy Daikin/McQuay Japan/US Danfoss Denmark Dunham-Bush Inc Malaysia Emicon Italy Ferroli Italy Fujitsu-General Japan Gree Air Conditioners China Guangdong Kelon Electrical Holdings Co Ltd China Haier China HCF-Lennox France HITSA Spain Hstars Group China LG Electronics Ltd. South Korea Midea China Mitsubishi Japan Rhoss Italy Samsung Korea Teba Turkey Trane US Weeseng HVAC Technology Pte Ltd Singapore York (JCI) US Zamil Saudi Arabia Zhongshan Asiatic Electric Co. Ltd China
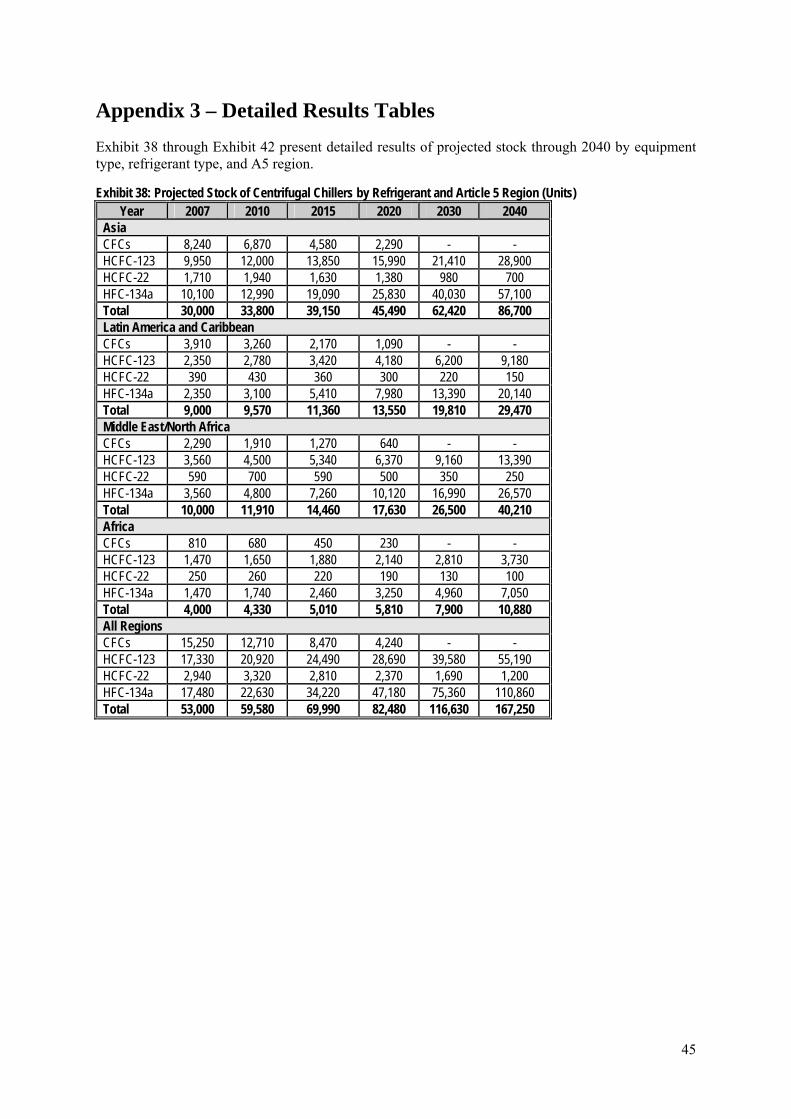
45
Appendix 3 – Detailed Results Tables Exhibit 38 through Exhibit 42 present detailed results of projected stock through 2040 by equipment type, refrigerant type, and A5 region.
Exhibit 38: Projected Stock of Centrifugal Chillers by Refrigerant and Article 5 Region (Units) Year 2007 2010 2015 2020 2030 2040
Asia CFCs 8,240 6,870 4,580 2,290 - - HCFC-123 9,950 12,000 13,850 15,990 21,410 28,900 HCFC-22 1,710 1,940 1,630 1,380 980 700 HFC-134a 10,100 12,990 19,090 25,830 40,030 57,100 Total 30,000 33,800 39,150 45,490 62,420 86,700 Latin America and Caribbean CFCs 3,910 3,260 2,170 1,090 - - HCFC-123 2,350 2,780 3,420 4,180 6,200 9,180 HCFC-22 390 430 360 300 220 150 HFC-134a 2,350 3,100 5,410 7,980 13,390 20,140 Total 9,000 9,570 11,360 13,550 19,810 29,470 Middle East/North Africa CFCs 2,290 1,910 1,270 640 - - HCFC-123 3,560 4,500 5,340 6,370 9,160 13,390 HCFC-22 590 700 590 500 350 250 HFC-134a 3,560 4,800 7,260 10,120 16,990 26,570 Total 10,000 11,910 14,460 17,630 26,500 40,210 Africa CFCs 810 680 450 230 - - HCFC-123 1,470 1,650 1,880 2,140 2,810 3,730 HCFC-22 250 260 220 190 130 100 HFC-134a 1,470 1,740 2,460 3,250 4,960 7,050 Total 4,000 4,330 5,010 5,810 7,900 10,880 All Regions CFCs 15,250 12,710 8,470 4,240 - - HCFC-123 17,330 20,920 24,490 28,690 39,580 55,190 HCFC-22 2,940 3,320 2,810 2,370 1,690 1,200 HFC-134a 17,480 22,630 34,220 47,180 75,360 110,860 Total 53,000 59,580 69,990 82,480 116,630 167,250

46
Exhibit 39: Projected Stock of Scroll & Screw Chillers by Refrigerant and Article 5 Region (Units) Year 2007 2010 2015 2020 2030 2040
Asia HCFC-22 522,500 631,100 716,200 778,500 904,200 1,090,300 HFC-134a 27,500 38,300 85,300 167,900 419,200 791,500 R-410A 0 4,200 22,900 62,600 188,300 272,900 TOTAL 550,000 673,600 824,400 1,009,000 1,511,700 2,154,700 Latin America/Caribbean HCFC-22 57,950 67,500 78,800 87,400 105,900 135,600 HFC-134a 3,050 4,200 10,400 21,900 58,900 118,400 R-410A 0 500 3,000 8,500 27,000 40,300 TOTAL 61,000 72,200 92,200 117,800 191,800 294,300 Middle East/North Africa HCFC-22 66,500 75,500 82,100 86,600 94,800 105,500 HFC-134a 3,500 4,400 8,000 14,000 30,400 51,700 R-410A 0 300 1,800 4,700 12,900 17,900 TOTAL 70,000 80,200 91,900 105,300 138,100 175,100 Africa HCFC-22 4,750 5,300 6,000 6,500 7,500 9,000 HFC-134a 250 320 700 1,400 3,400 6,300 R-410A 0 40 200 500 1,500 2,200 TOTAL 5,000 5,660 6,900 8,400 12,400 17,500 All Regions HCFC-22 651,700 779,400 883,100 959,000 1,112,400 1,340,400 HFC-134a 34,300 47,200 104,400 205,200 511,900 967,900 R-410A 0 5,000 27,900 76,300 229,700 333,300 TOTAL 686,000 831,600 1,015,400 1,240,500 1,854,000 2,641,600
Exhibit 40: Projected Stock of Reciprocating Chillers by Refrigerant and Article 5 Region (Units)
Year 2007 2010 2015 2020 2030 2040 Asia HCFC-22 38,000 39,300 39,300 39,300 28,300 18,800 HFC-134a 400 400 400 400 400 300 R-407C 1,600 1,700 1,700 1,700 1,600 1,100 TOTAL 40,000 41,300 41,300 41,300 30,300 20,200 Latin America and Caribbean HCFC-22 11,400 11,680 11,700 11,700 8,400 5,600 HFC-134a 120 120 100 100 100 100 R-407C 480 500 500 500 500 300 TOTAL 12,000 12,300 12,300 12,300 9,000 6,000 Middle East/North Africa HCFC-22 9,500 9,710 9,700 9,700 7,000 4,700 HFC-134a 100 100 100 100 100 100 R-407C 400 400 400 400 400 300 TOTAL 10,000 10,200 10,200 10,200 7,500 5,000 Africa HCFC-22 475 480 480 480 350 230 HFC-134a 5 10 10 10 0 0 R-407C 20 0 0 0 0 0 TOTAL 500 500 500 500 400 200 All Regions HCFC-22 59,375 61,100 61,100 61,100 44,100 29,300 HFC-134a 625 600 600 600 600 400 R-407C 2,500 2,600 2,600 2,600 2,500 1,600 TOTAL 62,500 64,300 64,300 64,300 47,200 31,400

47
Exhibit 41: Projected Stock of Small AC Units by Refrigerant and Article 5 Region Year 2007 2010 2015 2020 2030 2040
Asia HCFC-22 85,581,700 113,909,200 144,194,900 181,003,800 285,901,600 456,759,100 R-410A 216,100 273,400 323,200 340,800 340,800 241,400 R-407C 648,300 872,400 2,324,500 6,068,000 19,032,900 40,150,100 Total 86,446,100 115,055,000 146,842,600 187,412,600 305,275,300 497,150,600 Latin America/Caribbean HCFC-22 29,875,900 38,070,500 46,455,700 56,268,100 82,626,900 122,427,100 R-410A 75,400 92,000 105,900 110,600 110,600 78,300 R-407C 226,300 291,100 691,800 1,688,100 4,945,900 9,865,000 Total 30,177,600 38,453,600 47,253,400 58,066,800 87,683,400 132,370,400 Middle East/North Africa HCFC-22 12,809,500 16,435,100 20,170,500 24,567,800 36,489,700 54,706,000 R-410A 32,300 39,600 45,800 47,900 47,900 33,900 R-407C 97,000 125,700 304,300 750,800 2,224,300 4,475,800 Total 12,938,800 16,600,400 20,520,600 25,366,500 38,761,900 59,215,700 Africa HCFC-22 12,046,700 14,145,700 16,124,200 18,281,988 23,480,200 30,297,900 R-410A 30,400 34,700 38,000 39,010 39,000 27,600 R-407C 91,300 107,900 201,900 420,264 1,062,700 1,905,400 Total 12,168,400 14,288,300 16,364,100 18,741,262 24,581,900 32,230,900 All Regions HCFC-22 140,313,800 182,560,600 226,945,200 280,121,600 428,498,400 664,190,200 R-410A 354,200 439,700 512,800 538,300 538,300 381,200 R-407C 1,062,900 1,397,000 3,522,500 8,927,100 27,265,800 56,396,300 TOTAL 141,730,900 184,397,300 230,980,500 289,587,000 456,302,500 720,967,700
Exhibit 42: Projected Stock of Large AC Units by Refrigerant and Article 5 Region Year 2007 2010 2015 2020 2030 2040
Asia HCFC-22 3,853,800 5,129,400 5,915,600 6,783,600 8,914,100 11,777,000 R-410A 9,700 12,100 13,400 13,800 13,800 9,800 R-407C 29,200 37,700 75,100 163,000 426,300 780,200 Total 3,892,700 5,179,200 6,004,100 6,960,400 9,354,200 12,567,000 Latin America/Caribbean HCFC-22 1,345,300 1,461,700 1,670,500 1,898,900 2,451,300 3,179,600 R-410A 3,400 3,700 4,000 4,100 4,100 2,900 R-407C 10,200 11,500 21,400 44,500 112,800 202,800 Total 1,358,900 1,476,900 1,695,900 1,947,500 2,568,200 3,385,300 Middle East/North Africa HCFC-22 576,800 628,200 720,800 822,400 1,069,700 1,398,400 R-410A 1,500 1,600 1,800 1,800 1,800 1,300 R-407C 4,400 5,000 9,400 19,600 50,200 90,800 Total 582,700 634,800 732,000 843,800 1,121,700 1,490,500 Africa HCFC-22 542,420 592,700 652,100 714,600 856,800 1,030,200 R-410A 1,370 1,500 1,600 1,600 1,600 1,100 R-407C 4,110 4,600 7,400 13,700 31,300 52,700 Total 547,900 598,800 661,100 729,900 889,700 1,084,000 All Regions HCFC-22 6,318,320 7,812,000 8,959,000 10,219,500 13,291,900 17,385,200 R-410A 15,970 18,900 20,800 21,300 21,300 15,100 R-407C 47,910 58,800 113,300 240,800 620,600 1,126,500 TOTAL 6,382,200 7,889,700 9,093,100 10,481,600 13,933,800 18,526,800