assessment of immunization systems in select gavi...
TRANSCRIPT
ASSESSMENT OF IMMUNIZATION SYSTEMS IN SELECT GAVI COUNTRIES
UNIVER SITY O F WASHI N GT ON GLOBAL HEALTH S T ART PROGR AM REPORT TO THE B ILL A ND MEL INDA G ATE S FOU NDAT ION
MAY 31 2012
PRODUCE D BY : M ATHE SON, A, COLL IER , K , M ANHART, LE , WA L SO N, JL , LEV INE, G , H AWE S, S
Produced by UW GH START Program, May 2012 1
PURPOSE
This document is in response to the work order “Assessment of Immunization Systems in select GAVI
countries”, received by the University of Washington’s Strategic Analysis, Research, and Training (START)
team in the week of March 17.
The information below is the final compilation of relevant material located about the state of routine
immunization in Uganda, the Democratic Republic of the Congo, and Mozambique. Supporting figures
are located in three accompanying spreadsheets.

UGANDA Produced by UW GH START Program, May 2012 2
UGANDA
A. POLITICAL COMMITMENT
i. Timeline of vaccine introductions since 1990 and current vaccination schedule
TABLE 1: UGANDA VACCINE SCHEDULE AND TIMELINE OF INTRODUCTION
Vaccine Vaccine in schedule (as of 31 Dec 2010)
Year of introduction in entire country
Year of introduction in part of the country
HepB birth dose (in 2010)
Birth Dose offered to all children
Year of introduction of birth dose
BCG Yes <1990*
DTP** Yes <1990*
HepB** Yes 2002 No n/a n/a
Hib** Yes 2002
HPV Yes(P) n/a 2008
MCV Yes <1990*
OPV Yes <1990*
PCV No 2013
TT (pab) Yes <1990*
Vitamin A Yes ? * Date obtained from earliest reported coverage estimates
** Vaccine included in the DTwPHibHep pentavalent vaccine that was introduced in 2002
In addition to the 2013 introduction of PCV, Uganda is expected to introduce the rotavirus vaccine in
2015. (HPV Information Center)
Sources Vaccine schedule: WHO Vaccine Preventable Diseases Monitoring System
(http://apps.who.int/immunization_monitoring/en/globalsummary/countryprofileselect.cfm)
Vaccine introduction: WHO (http://www.who.int/entity/immunization_monitoring/data/year_vaccine_introduction.xls) (unless
noted)
HPV Information Center: WHO (http://apps.who.int/hpvcentre/statistics/dynamic/ico/SummaryReportsSelect.cfm)
ii. Percent of districts that have <50% coverage, 50-79% coverage and ≥80% coverage
Data not available for 2010 from WHO summary. However, 2009 data for DTP3 are below. (UNICEF
2012)
TABLE 2: UGANDA DPT3 COVERAGE BY DISTRICTS
Coverage level Proportion districts
< 50% 4%
50–79% 38%
≥ 80% 59%
Not reported 0%
UGANDA Produced by UW GH START Program, May 2012 3
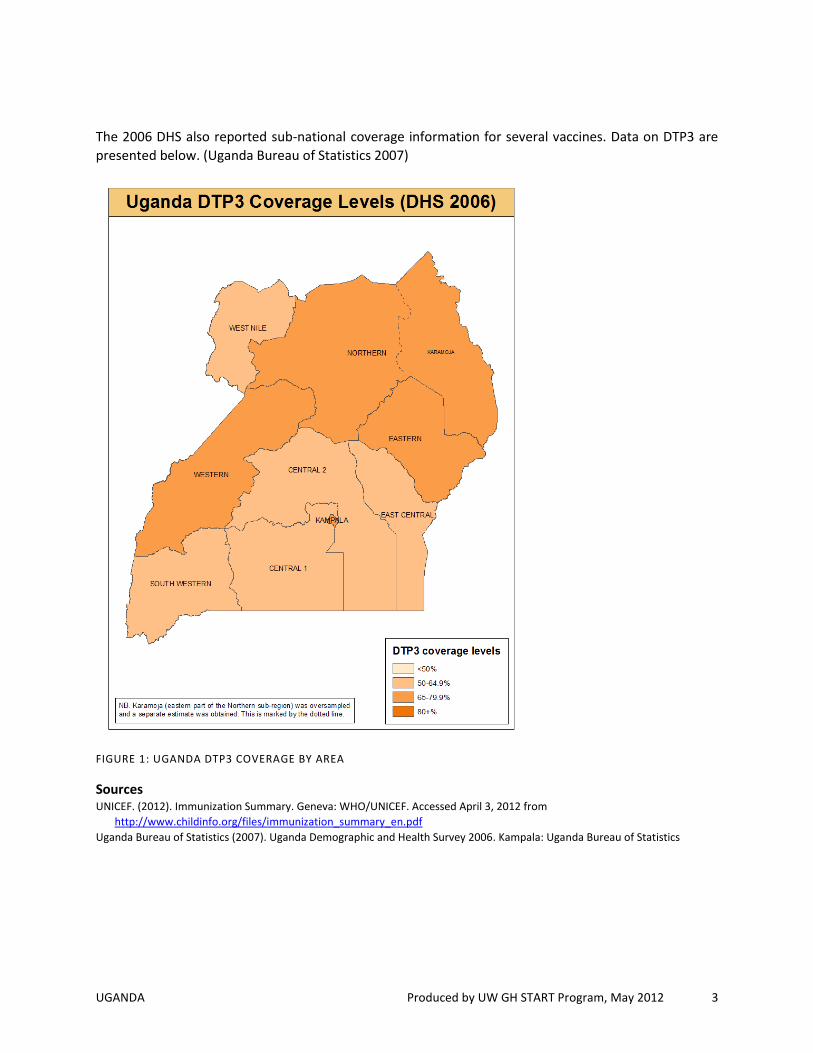
The 2006 DHS also reported sub-national coverage information for several vaccines. Data on DTP3 are
presented below. (Uganda Bureau of Statistics 2007)
FIGURE 1: UGANDA DTP3 COVERAGE BY AREA
Sources UNICEF. (2012). Immunization Summary. Geneva: WHO/UNICEF. Accessed April 3, 2012 from
http://www.childinfo.org/files/immunization_summary_en.pdf
Uganda Bureau of Statistics (2007). Uganda Demographic and Health Survey 2006. Kampala: Uganda Bureau of Statistics
UGANDA Produced by UW GH START Program, May 2012 4
iii. Summary of major immunization-related legislation
In late 2010, Sabin commissioned a study of Uganda’s existing health legislation with a focus on
immunization. Among the findings were these:
The Constitution of Uganda lacks a substantive provision on the right to health generally but
makes mention of the right under directive principles of government policy. Parliament has the
mandate to make laws to operationalize that constitutional right.
The Public Health Act 1935 (Ch 281) identifies notifiable diseases, outlines the government’s
epidemic control responsibilities, empowers the government to require certain vaccinations and
identifies vaccination as a requirement for school entry.
The Local Government Act (Ch 243) gives powers to the local governments to carry out
immunization and other public health functions and to pass laws, bylaws and local ordinances
on immunization provided they are compatible with federal laws.
There are no bills specific to immunization approved by or introduced to Parliament.
Sources Sabin Institute. (2011). Sustainable Immunization Financing — Uganda Country Summary. Accessed April 3, 2012
from http://www.sabin.org/files/Uganda_mm.pdf
iv. Summary of multi-year plan for immunization and annual work plan for immunization activities for recent years
The plan aims to address the stagnation in performance that occurred between 2007 and 2009. Priority
areas are as follows:
Focus on the district level to improve routine immunization and surveillance performance
Strengthen logistics at all levels
Introduce pneumococcal and rotavirus vaccines
Strengthen capacity of mid-level managers, operational level health workers and pre service
trainees to deliver quality EPI services
Advocate for sustainable financing of the program; achieve and maintain polio free status,
neonatal tetanus elimination and pre-elimination measles targets
Sources Republic of Uganda. (Revised April 2011). Uganda National Expanded Programme on Immunization Multi Year Plan
2010–2014
v. Definition of routine immunization
There does not appear to be a consistently used, formal definition of routine immunization in Uganda.
However, the cMYP draws a distinction between routine immunization and supplemental activities for
polio, tetanus, and measles.
UGANDA Produced by UW GH START Program, May 2012 5
vi. Budget making and other political considerations
Uganda operates under a parliamentary system with a unicameral legislature. A 19-year ban on multi-
party politics was rescinded in 2005 by national referendum. Presidential and legislative elections are
held every five years (the last being 2011). The current president, Yoweri Museveni, has been in power
since 1986 and his political party, the National Resistance Movement, gained majorities in the previous
two elections. We were able to identify three recent ministers of health:
Dr. Christine Ondoa (May 27, 2011–present)
Dr. Stephen Malinga (2006–May 27,2011)
Dr. Jim Muhwezi (2001–2006)
Jim Muhwezi was the minister when the Global Fund suspended disbursements in 2005 due to
misappropriation of funds and was also implicated in mismanagement of GAVI funds. (Njoroge, 2010)
During late 2007 and into 2008, Dr. Malinga was reported to be at odds with his deputy, state minister
for primary healthcare Dr. Emmanuel Otaala. This led to internal conflict within the Ministry of Health,
which had a flow on effect on the immunization program (though it was not clear how). (Sources:
Obore, n.d.; Obore, 2007)
The Ugandan budgeting process takes place at the national, sectorial and local levels. Each level
prepares what is termed a Budget Framework Paper (BFP), which lays out expected expenditure for the
next three years (they are updated annually on a rolling basis). The BFPs forms the basis for consultation
and coordination between each level. Ultimately, the BFPs are compiled into a national document that is
approved by the cabinet. (The Global Mechanism, 2008)
Sources Njoroge, J. (2010, June 6). Uganda: Muhwezi, Mukula And Group Face Anti-Corruption Court. The Independent (Kampala).
Accessed May 15, 2012 from http://allafrica.com/stories/201006090795.html
Obore, C. (n.d.) Uganda Ministry of Health Scandals, UNICEF Withdraws $$ [Web log comment]. Accessed May 14, 2012 from
http://protectafrica.wordpress.com/about/ug-ministry-of-health-scandals-unicef-withdraws-money/
Obore, C. (2007, November 3). Ministers fight at meeting. Sunday Monitor. Accessed May 15, 2012 from
http://www.connectuganda.com/forum/broken-news/4369-ministers-fight-at-meeting
The Global Mechanism of the UNCCD. (2008). Budget processes and financing instruments in Uganda. The Global Mechanism:
Rome. Accessed May 15, 2012 from http://www.global-mechanism.org/en/GM-Publications/GM-Publications/Budget-
processes-and-financing-instruments-in-Uganda/Download
UGANDA Produced by UW GH START Program, May 2012 6
B. FINANCING AND PRICING
i. Country health expenditure, by source from 1990-2010
Total Health Expenditure data:
Uganda allocated 10 percent of total recurrent government expenditure to health in 2007
In 2011 the level of funding for health was US$10.40 per capita (government and donor funds
pooled together)
▫ This translates to about $340,184,000 in total health funding, given the WHO 2009
population estimate of 32,710,000
▫ Total health expenditure of $10.40 per capita is below the $34 per capita WHO
recommends for developing countries
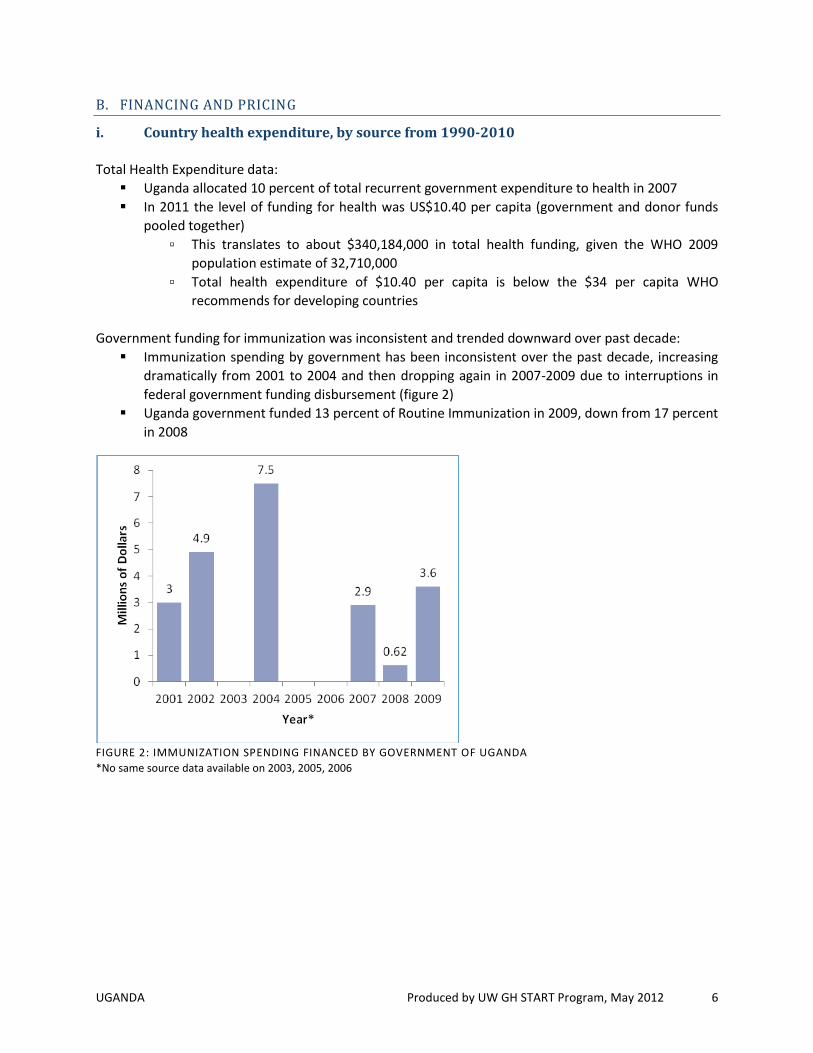
Government funding for immunization was inconsistent and trended downward over past decade:
Immunization spending by government has been inconsistent over the past decade, increasing
dramatically from 2001 to 2004 and then dropping again in 2007-2009 due to interruptions in
federal government funding disbursement (figure 2)
Uganda government funded 13 percent of Routine Immunization in 2009, down from 17 percent
in 2008
FIGURE 2: IMMUNIZATION SPENDING FINANCED BY GOVERNMENT OF UGANDA
*No same source data available on 2003, 2005, 2006
UGANDA Produced by UW GH START Program, May 2012 7
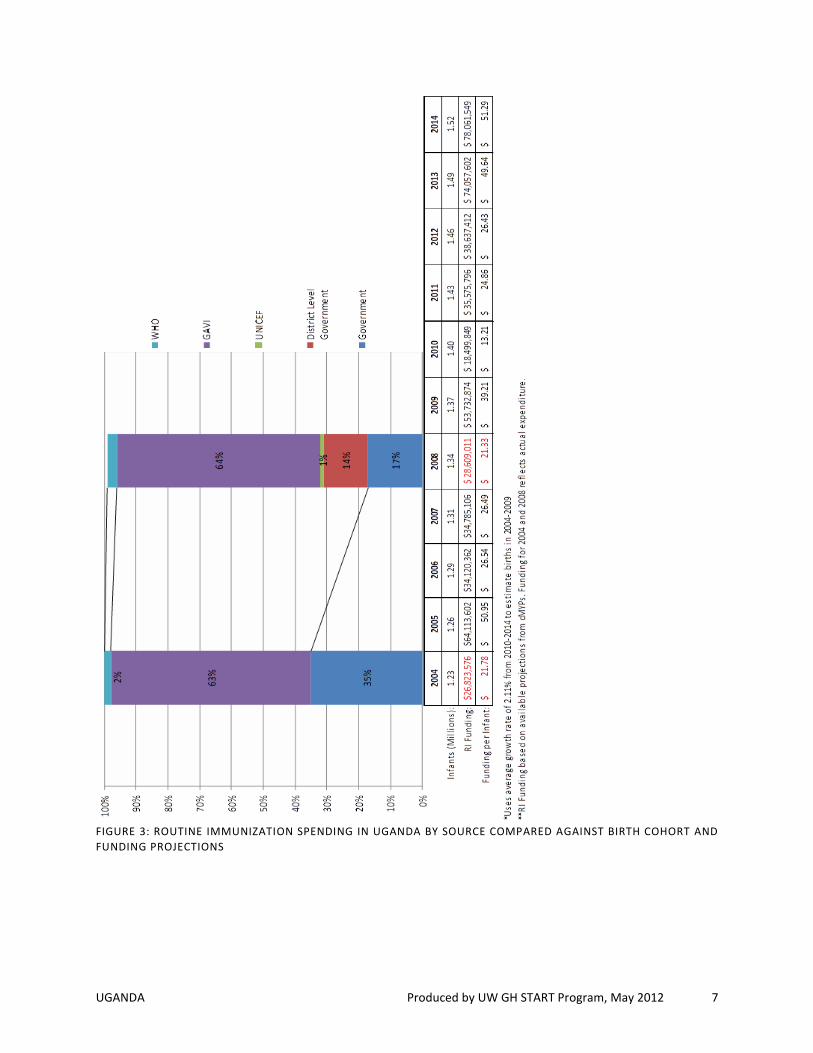
FIGURE 3: ROUTINE IMMUNIZATION SPENDING IN UGANDA BY SOURCE COMPARED AGAINST BIRTH COHORT AND
FUNDING PROJECTIONS

UGANDA Produced by UW GH START Program, May 2012 8
Sources UNICEF. (2012). Immunization Summary. Geneva: WHO/UNICEF. Accessed April 3, 2012 from
http://www.childinfo.org/files/immunization_summary_en.pdf
Republic of Uganda. (Revised April 2011). Uganda National Expanded Programme on Immunization Multi Year Plan 2010–2014
Republic of Uganda. (Revised August 2006). Uganda National Expanded Programme on Immunization Multi Year Plan 2006-
2010
Sabin Institute. (2011). Sustainable Immunization Financing Uganda Country Summary. Accessed April 3, 2012 from
http://www.sabin.org/files/Uganda_mm.pdf
ii. Percent of government health expenditure allocated to vaccines, portion of that allocated to RI
In 2008, vaccines represented 65 percent of EPI program costs (new and underused vaccines)
Overall budget expenditures for immunization increased 74 percent (all sources combined) from
2012 to 2013
▫ Major spending increases in personnel, new vaccines
▫ Increase likely due to introduction of PCV in 2013
TABLE 3: OVERALL BUDGETED EXPENDITURES FOR IMMUNISATION IN UGANDA FROM ALL SOURCES (GOVT &
DONORS) IN US$
*Traditional Vaccines: BCG, DTP, OPV (or IPV), Measles 1st dose (or the combined MR, MMR), TT. HepB and Hib vaccines also in
this row if these vaccines were introduced without GAVI support
Expenditure by CategoryBudgeted Year
2012
Budgeted Year
2013
Traditional Vaccines* 2,888,601$ 3,247,478$
New Vaccines 30,597,694$
Injection supplies with AD
syringes1,183,393$ 1,868,630$
Injection supply with syringes
other than Ads
Cold Chain equipment 60,780$ 111,918$
Personnel 6,276,248$
Other operational costs 15,873,295$ 11,890,327$
Supplemental Immunisation
Activities5,377,309$
Under used vaccines 17,271,533$ 20,065,307$
Total Expenditures for
Immunisation42,654,911$ 74,057,602$

UGANDA Produced by UW GH START Program, May 2012 9
Sources Government of Uganda. (Submitted June 2011). GAVI Alliance Annual Progress Report 2010. GAVI Alliance. Accessed April 13,
2012 from http://www.gavialliance.org/results/gavi-progress-reports/
iii. Spending focus, by donor in country
Spending by donor source:
Government: vaccines, injection supplies, personnel, transport, other recurrent costs
Donors: vaccines, injection supplies, training, monitoring and surveillance, all capital equipment
(vehicles, cold chain)
Districts (via federal PHC Grant and external partner grants): finance immunization operations
Government of Uganda (GOU):
Pays 100% for BCG, OPV, Measles, TT vaccines and injection safety materials
Co-finances DPT-HepB+Hib vaccine and will co-finance Pneumococcal and rotavirus vaccine
Funds secured (based on historical funding patterns) for 2010-2014 for the following cost
categories related to polio, measles, BCG, TT: injection supplies, personnel, transport,
maintenance for vehicles, gas for the cold chain, overhead
District Level Governments:
Use Primary Health Care (PHC) conditional grants to implement EPI activities and operations
Funding for EPI Program in the baseline year and expected for 2010-2014:
64 percent of funding from GAVI for the DPT-HepB+Hib vaccine
JICA expected to fund capital costs (cold chain expansion and rehabilitation, and vehicles)
Donors include UNICEF, WHO, USAID
Sources Republic of Uganda. (Revised April 2011). Uganda National Expanded Programme on Immunization Multi Year Plan
2010–2014
Sabin Institute. (2011). Sustainable Immunization Financing Uganda Country Summary. Accessed April 3, 2012 from
http://www.sabin.org/files/Uganda_mm.pdf
iv. Current funding gaps in health system (funds available vs. budget)
Uganda EPI Multiyear Plan requires budget of US$256,913,788 over five years, 2010-2014
Expected funding gap of US$73,615,260 summed over years 2010-2014
GAVI and the Government of Uganda may provide funding for Pneumococcal vaccines which
would reduce the total gap to US$4,480,772
The majority of the funding gap is for new vaccines and injection materials, and for
supplemental immunization activities

UGANDA Produced by UW GH START Program, May 2012 10
TABLE 4: COMPOSITION OF FUNDING GAP (IMMUNIZATION SPECIFIC ONLY) FOR UGANDA
TABLE 5: IMMUNIZATION FINANCING GAPS PER INFANT IN UGANDA
Inadequate funds for EPI routine operations:
The Government of Uganda contribution to EPI routine operations is inadequate
District level Primary Health Care (PHC) funds available for implementing EPI activities are
frequently delayed, causing delays in implementation
Few partners currently supporting EPI
Much government funding is not secured:
67 percent classified as “secure”(based on historical funding patterns)
31 percent classified as “probable”
2 percent classified as unsecured
Sources Republic of Uganda. (Revised April 2011). Uganda National Expanded Programme on Immunization Multi Year Plan 2010–2014
Country Profile: WHO Immunization Financing Uganda cMYP
(http://www.who.int/immunization_financing/countries/cmyp/uganda/en/index.html)
v. Qualitative summary of key barriers in financing and pricing at national and sub-national level
Macroeconomic challenges contribute to the shortage of funding:
38 percent of the population lives below the poverty line (down from 52 percent in 1992/93, 44
percent in 1997/98, but up from 35 percent in 2000)
The government has had difficulty mobilizing partners to contribute to health services
Compositition of the funding
gap2010 2011 2012 2013 2014
Vaccines and injection
equipment30,597,694$ 28,723,342$
Personnel 1,595,891$ 1,543,182$ 2,607,156$
Activities and other recurrent
costs674,948$ 211,270$ 2,180,704$ 1,748,936$ 1,408,305$
Logistics (Vehicles, cold chain
and other equipment)452,698$ 170,595$ 810,585$ 889,956$
Total Funding Gap 1,127,646$ 211,270$ 3,947,190$ 34,700,397$ 33,628,759$
*Shared costs not included
2007 2008 2009 2010 2011
Resource Needs per Infant $19.40 $30.00 $27.60 $13.80 $14.40
Financing per Infant $17.30 $27.80 $24.40 $10.40 $10.60
Gaps per Infant $2.10 $2.20 $3.20 $3.30 $3.80
Infants (Millions) 2.88 2.97 3.06 3.06 0.00

UGANDA Produced by UW GH START Program, May 2012 11
Potential for additional vaccination funding if government and the health sector receive additional
resources:
Health and agriculture are priorities among unfunded priorities
Vaccines among the health sector unfunded priorities
In addition to gaps, irregular funding for immunization (EPI) is a major challenge:
Routine Immunization 2001-2002:
▫ Prior to GAVI support, in 2001, Uganda government spent US$3.0 million for routine
immunization, US$2.1 million for supplementary immunization services
▫ In 2002, government expenditures increased to $4.9 million for routine immunization, in
part because a new immunization was introduced
EPI 2004-forward
▫ 2004 (cMYP): $22 million in 2004 for routine EPI program, plus $3.6 million for shared
health services expenditures
Government covered $7.5 million of the $22 million specifically for routine EPI
▫ 2007-2009 (WHO/UNICEF Joint Reporting Form): Government spending on routine
immunization program dropped to US$2.9 million, and then $617,077 in 2008, and $3.6
million in 2009
▫ 2010-2014 (cMYP): total expenditure on routine EPI was $16.8 million in 2009 (21%
from government)
Sources Republic of Uganda. (Revised April 2011). Uganda National Expanded Programme on Immunization Multi Year Plan 2010–2014
Government of Uganda. (Submitted June 2011). GAVI Alliance Annual Progress Report 2010. GAVI Alliance. Accessed April 13,
2012 from http://www.gavialliance.org/results/gavi-progress-reports/
C. SUPPLY CHAIN AND LOGISTICS
In August 2009 USAID released a logistics assessment of the Uganda National EPI. The report authors
identified several areas for improvement, but a recurring theme was inadequate reporting between
different levels of the immunization system.
Sources USAID | DELIVER PROJECT, Task Order 1. 2009. Logistics Assessment of the Uganda National Expanded Programme
on Immunization. Kampala, Uganda. USAID | DELIVER PROJECT, Task Order 1
D. HUMAN CAPACITY
i. Total est. number of providers that immunize, by provider type
Immunization services are available in 81 percent of private facilities, while 90 percent of government
facilities provide childhood immunizations. More than 70 percent of facilities in all regions provide
immunization. (SPA 2007)
During the implementation of the HSSP II the number of static service delivery points for immunization
increased from 1950 to 2100. (Uganda MoH HSSP III)

UGANDA Produced by UW GH START Program, May 2012 12
TABLE 6: PROPORTION OF FACILITIES IN UGANDA PROVIDING IMMUZIAITON
Facility type (N=491) Prop. providing
immunization*
Number of facilities
nationwide
Estimated no. providing
immunization
Hospital 98% 108 106
Health center-IV 100% 160 160
Health center-III 96% 873 838
Health center-II 82% 1,593 1,306
Total 88% 2,734 2,410
* Defined as offering child immunization services and storing vaccines
Sources Ministry of Health [Uganda], Uganda Bureau of Statistics, and Macro International Inc. (2007). Uganda Service Provision
Assessment Survey 2007: Key Findings on Family Planning, Maternal and Child Health, and Malaria. Kampala, Uganda:
Ministry of Health [Uganda] and Macro International, Inc.
Ministry of Health [Uganda]. (2010). Health Sector Strategic Plan III 2010/11–2014/15. Kampala, Uganda: Ministry of Health
[Uganda]. Accessed April 12, 2012 from
http://www.kampala.cooperazione.esteri.it/utlkampala/Download/HSSIP%20Final.pdf
Unknown author. (2005). Health System Profile for Uganda. Accessed April 10, 2012 from
http://www.afro.who.int/index.php?option=com_docman&task=doc_download&gid=2835&ei=dAWHT7TAM-
rjiAKykaDfDw&usg=AFQjCNFFP8HT_nk97BWpJLNuHypX1hIh9Q&cad=rja
ii. Profiles of providers who immunize people
No data identified.
E. PERFORMANCE MANAGEMENT AND TRAINING
i. Immunization responsibilities at the federal, state, district, village levels and ratios (number of HCWs per supervisor)
Ministry of Health/UNEPI is responsible for policy, standards and priority setting, capacity building,
coordinating with other stakeholders and partners, resource mobilization, procurement of inputs such
as vaccines and injection safety materials, monitoring and technical support supervision to the districts.
The districts and health sub-districts are responsible for planning, management and delivery of EPI
services through the implementation of the overall district health plan.
There were 20 EPI mid-level managers trained by 2010 and plans were in place to train 450 more by
2014. The cMYP reports that staffing norms were “available with skilled manpower at the
implementation levels (HSD)” but “not attained at national, district, and health facility levels”.
Around 84,000 people have been trained as village health team (VHT) members since the program’s
inception in 2002. However, there are no firm data on the number of current VHT members. There are
18 (23%) districts with no VHTs, but these districts have other community health workers.
Sources Republic of Uganda. (Revised April 2011). Uganda National Expanded Programme on Immunization Multi Year Plan 2010–2014
UGANDA Produced by UW GH START Program, May 2012 13
Ministry of Health [Uganda]. (2010). Health Sector Strategic Plan III 2010/11–2014/15. Kampala, Uganda: Ministry of Health
[Uganda]. Accessed April 12, 2012 from
http://www.kampala.cooperazione.esteri.it/utlkampala/Download/HSSIP%20Final.pdf
Unknown author. (2005). Health System Profile for Uganda. Accessed April 10, 2012 from
http://www.afro.who.int/index.php?option=com_docman&task=doc_download&gid=2835&ei=dAWHT7TAM-
rjiAKykaDfDw&usg=AFQjCNFFP8HT_nk97BWpJLNuHypX1hIh9Q&cad=rja
Taylor, H. (2009). Situation Analysis: Village Health Teams Uganda 2009. Kampala: Ministry of Health Uganda

UGANDA Produced by UW GH START Program, May 2012 14
FIGURE 4: IMMUNIZATION SYSTEM STRUCTURE IN UGANDA WITH RATIOS OF FACILITIES TO POPULATION
TARGET RATIO: 1:1,000 /
1:25 H/holds
Actual ratio: unknown
TARGET RATIO: 1:5,000
Actual ratio: 1:14,490
TARGET RATIO: 1:20,000
Actual ratio: 1:84,507
TARGET RATIO: 1:100,000
Actual ratio: 1:187,500
TARGET RATIO: 1:500,000
Actual ratio: 1:263,157

UGANDA Produced by UW GH START Program, May 2012 15
ii. Percent ‘missed opportunities’ (children eligible for vaccines that come to health center but do not receive them)
No data identified.
iii. Summary of any other performance metrics captured by the MoH or other organization (e.g., no. of supervisory visits)
The 2006 DHS found a vaccination card retention rate of 63%.
TABLE 7: DPT DROPOUT RATES IN UGANDA BY YEAR
Indicator 2006 2007 2008
National DPT1-3 dropout rate 10% 10% 11.6%
Proportion of districts with DPT1-3 dropout rate ≤ 10% 33/69 (47.8%) 39/80 (48.8%) 36/80 (45.0%)
TABLE 8: VACCINE WASTAGE (%) IN UGANDA BY VACCINE AND YEAR
Vaccine 2011 2010 2009 2008 2007 2006
BCG 72 70 73
DTP 11 7 6
HepB 11 7 6
Hib 11 7 6 9 9 10
Polio 29 20 31
MCV 40 51 44 44
Tetanus 23 10
Sources Uganda Bureau of Statistics (2007). Uganda Demographic and Health Survey 2006. Kampala: Uganda Bureau of Statistics
Republic of Uganda. (Revised April 2011). Uganda National Expanded Programme on Immunization Multi Year Plan 2010–2014
Vaccine schedule: WHO Vaccine Preventable Diseases Monitoring System
(http://apps.who.int/immunization_monitoring/en/globalsummary/countryprofileselect.cfm)

UGANDA Produced by UW GH START Program, May 2012 16
F. COMMUNITY ENGAGEMENT
i. Distribution of health posts/health centers compared to population density
FIGURE 5: AREAS OF UGANDA WHERE THE POPULATION IS WITHIN 5KM OF A HEALTH FACILITY

UGANDA Produced by UW GH START Program, May 2012 17
FIGURE 6: AREAS OF UGANDA WITH >1,500 POPULATION THAT ARE MORE THAN 10KM FROM A HEALTHCARE
FACILITY
UGANDA Produced by UW GH START Program, May 2012 18
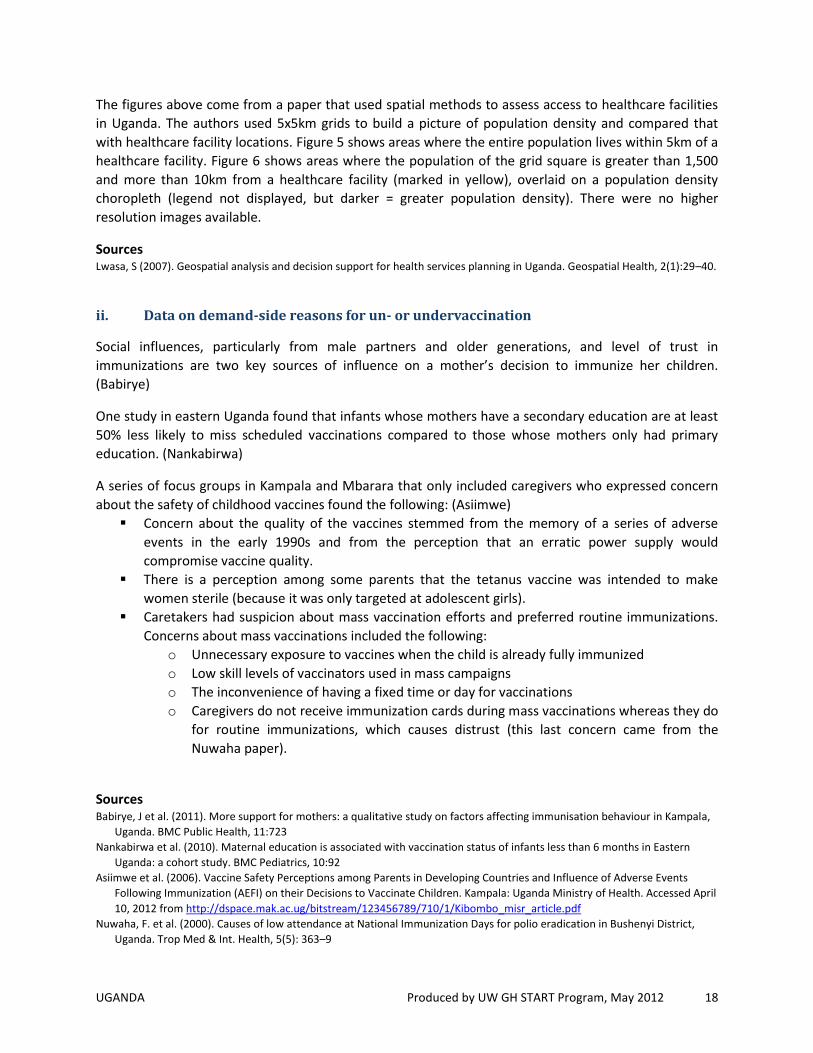
The figures above come from a paper that used spatial methods to assess access to healthcare facilities
in Uganda. The authors used 5x5km grids to build a picture of population density and compared that
with healthcare facility locations. Figure 5 shows areas where the entire population lives within 5km of a
healthcare facility. Figure 6 shows areas where the population of the grid square is greater than 1,500
and more than 10km from a healthcare facility (marked in yellow), overlaid on a population density
choropleth (legend not displayed, but darker = greater population density). There were no higher
resolution images available.
Sources Lwasa, S (2007). Geospatial analysis and decision support for health services planning in Uganda. Geospatial Health, 2(1):29–40.
ii. Data on demand-side reasons for un- or undervaccination
Social influences, particularly from male partners and older generations, and level of trust in
immunizations are two key sources of influence on a mother’s decision to immunize her children.
(Babirye)
One study in eastern Uganda found that infants whose mothers have a secondary education are at least
50% less likely to miss scheduled vaccinations compared to those whose mothers only had primary
education. (Nankabirwa)
A series of focus groups in Kampala and Mbarara that only included caregivers who expressed concern
about the safety of childhood vaccines found the following: (Asiimwe)
Concern about the quality of the vaccines stemmed from the memory of a series of adverse
events in the early 1990s and from the perception that an erratic power supply would
compromise vaccine quality.
There is a perception among some parents that the tetanus vaccine was intended to make
women sterile (because it was only targeted at adolescent girls).
Caretakers had suspicion about mass vaccination efforts and preferred routine immunizations.
Concerns about mass vaccinations included the following:
o Unnecessary exposure to vaccines when the child is already fully immunized
o Low skill levels of vaccinators used in mass campaigns
o The inconvenience of having a fixed time or day for vaccinations
o Caregivers do not receive immunization cards during mass vaccinations whereas they do
for routine immunizations, which causes distrust (this last concern came from the
Nuwaha paper).
Sources Babirye, J et al. (2011). More support for mothers: a qualitative study on factors affecting immunisation behaviour in Kampala,
Uganda. BMC Public Health, 11:723
Nankabirwa et al. (2010). Maternal education is associated with vaccination status of infants less than 6 months in Eastern
Uganda: a cohort study. BMC Pediatrics, 10:92
Asiimwe et al. (2006). Vaccine Safety Perceptions among Parents in Developing Countries and Influence of Adverse Events
Following Immunization (AEFI) on their Decisions to Vaccinate Children. Kampala: Uganda Ministry of Health. Accessed April
10, 2012 from http://dspace.mak.ac.ug/bitstream/123456789/710/1/Kibombo_misr_article.pdf
Nuwaha, F. et al. (2000). Causes of low attendance at National Immunization Days for polio eradication in Bushenyi District,
Uganda. Trop Med & Int. Health, 5(5): 363–9

UGANDA Produced by UW GH START Program, May 2012 19
iii. Data on level of public trust
No data identified.
G. MONITORING AND USE OF DATA
i. DHS, any national surveys and WUENIC coverage levels for all available dates (DTP3, MCV, and others), with potential explanations for any changes in trends
FIGURE 7: DISPARITY IN REPORTED VACCINE COVERAGE RATES IN UGANDA, BY REPORTING AGENCY
FIGURE 8: VACCINE COVERAGE RATES IN UGANDA BY WEALTH QUINTILE
84 83
60 55 55
90.5 89.8
63.9 68.1
59.3
79 77 79
0
10
20
30
40
50
60
70
80
90
100
BCG DTP1 DTP3 MCV Pol3
Vac
cin
e co
vera
ge (
%)
WHO/UNICEF 2010 DHS 2006 MoH HMIS 2008
0
10
20
30
40
50
60
70
80
90
100
Lowest Second Middle Fourth Highest
Vac
cin
e co
vera
ge (
%)
Wealth quintile
BCG
DPT3
Pol3
MCV

UGANDA Produced by UW GH START Program, May 2012 20
FIGURE 9: UGANDA DPT3 COVERAGE OVER TIME, COMPARED TO AFRICAN REGION
Sources UNICEF. (2012). Immunization Summary. Geneva: WHO/UNICEF. Accessed April 3, 2012 from
http://www.childinfo.org/files/immunization_summary_en.pdf
Uganda Bureau of Statistics (2007). Uganda Demographic and Health Survey 2006. Kampala: Uganda Bureau of Statistics
Republic of Uganda. (Revised April 2011). Uganda National Expanded Programme on Immunization Multi Year Plan 2010–2014
0
10
20
30
40
50
60
70
80
1980 1985 1990 1995 2000 2005 2010
DTP
3 v
acci
ne
cove
rage
(%
)
Uganda AFR
EPI revitalization plan developed
Pentavalent vaccine introduced (with GAVI support)
Period of decentralization
GAVI funding suspended
UGANDA Produced by UW GH START Program, May 2012 21
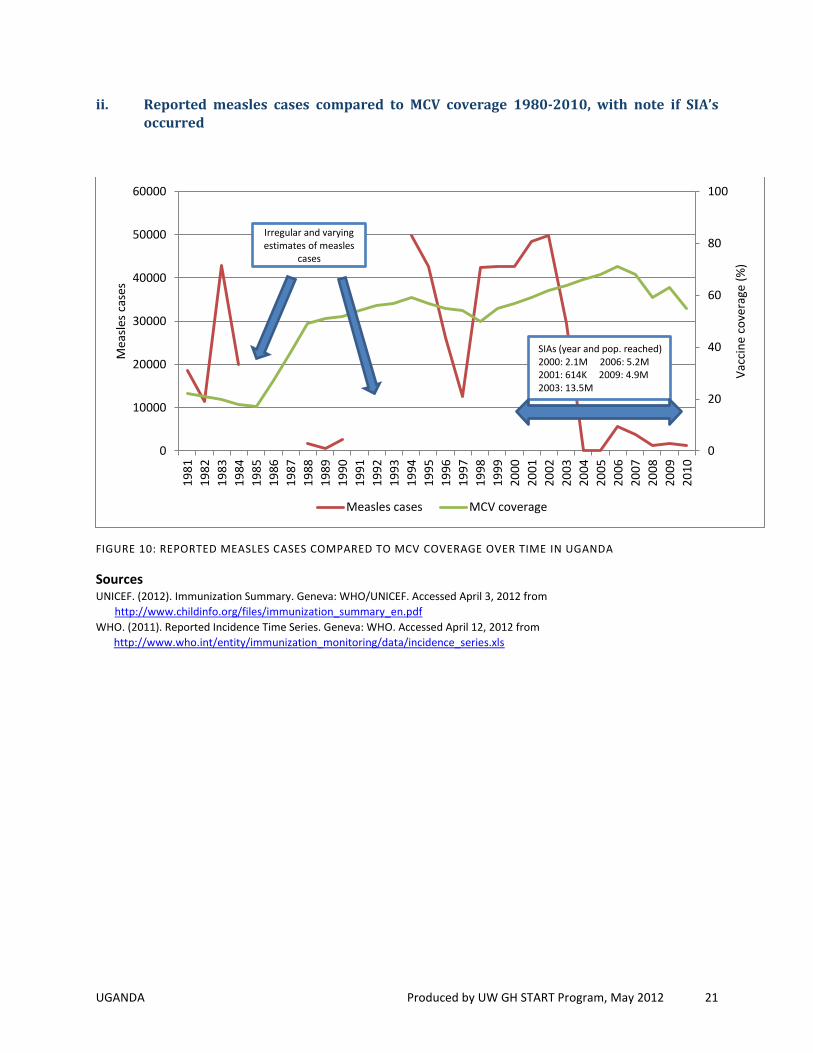
ii. Reported measles cases compared to MCV coverage 1980-2010, with note if SIA’s occurred
FIGURE 10: REPORTED MEASLES CASES COMPARED TO MCV COVERAGE OVER TIME IN UGANDA
Sources UNICEF. (2012). Immunization Summary. Geneva: WHO/UNICEF. Accessed April 3, 2012 from
http://www.childinfo.org/files/immunization_summary_en.pdf
WHO. (2011). Reported Incidence Time Series. Geneva: WHO. Accessed April 12, 2012 from
http://www.who.int/entity/immunization_monitoring/data/incidence_series.xls
0
20
40
60
80
100
0
10000
20000
30000
40000
50000
600001
98
1
19
82
19
83
19
84
19
85
19
86
19
87
19
88
19
89
19
90
19
91
19
92
19
93
19
94
19
95
19
96
19
97
19
98
19
99
20
00
20
01
20
02
20
03
20
04
20
05
20
06
20
07
20
08
20
09
20
10
Vac
cin
e co
vera
ge (
%)
Mea
sles
cas
es
Measles cases MCV coverage
SIAs (year and pop. reached) 2000: 2.1M 2006: 5.2M 2001: 614K 2009: 4.9M 2003: 13.5M
Irregular and varying estimates of measles
cases

DEMOCRATIC REPUBLIC OF CONGO Produced by UW GH START Program, May 2012 22
DEMOCRATIC REPUBLIC OF CONGO (DRC)
A. POLITICAL COMMITMENT
i. Timeline of vaccine introductions since 1990 and current vaccination schedule
TABLE 9: DRC VACCINE SCHEDULE AND TIMELINE OF INTRODUCTION
Vaccine Vaccine in schedule (as of 31 Dec 2010)
Year of introduction in entire country
Year of introduction in part of the country
HepB birth dose (in 2010)
Birth Dose offered to all children
Year of introduction of birth dose
BCG Yes <1990*
DTP** Yes <1990*
HepB** Yes 2007 No n/a n/a
Hib** Yes 2009
MCV Yes <1990*
OPV Yes <1990*
PCV No n/a 2011
Rotavirus No 2013
TT (pab) Yes <1990*
Vitamin A Yes ?
YF Yes 2004 2003 * Date obtained from earliest reported coverage estimates
** Vaccine included in the DTwPHibHep pentavalent vaccine that was introduced in 2009
There are currently no plans to introduce the HPV vaccine, though the quadrivalent vaccine (Gardasil) is
licensed in the DRC.
Sources Vaccine schedule: WHO Vaccine Preventable Diseases Monitoring System
(http://apps.who.int/immunization_monitoring/en/globalsummary/countryprofileselect.cfm)
Vaccine introduction: WHO (http://www.who.int/entity/immunization_monitoring/data/year_vaccine_introduction.xls) (unless
noted)
HPV information center: WHO (http://apps.who.int/hpvcentre/statistics/dynamic/ico/SummaryReportsSelect.cfm)
ii. Percent of districts that have <50% coverage, 50-79% coverage and ≥80% coverage
TABLE 10: DTP3 COVERAGE DATA IN THE DRC FROM 2010
Coverage level Proportion districts
< 50% 9%
50–79% 42%
≥ 80% 49%
Not reported 0%
DEMOCRATIC REPUBLIC OF CONGO Produced by UW GH START Program, May 2012 23
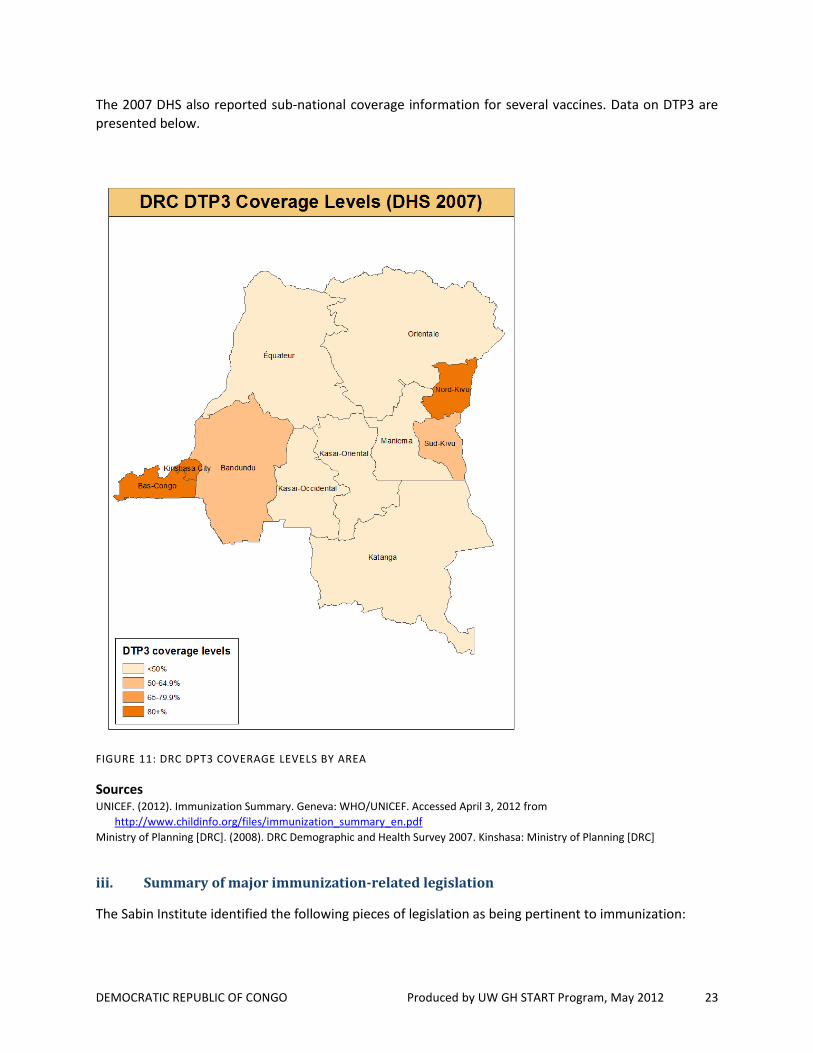
The 2007 DHS also reported sub-national coverage information for several vaccines. Data on DTP3 are
presented below.
FIGURE 11: DRC DPT3 COVERAGE LEVELS BY AREA
Sources UNICEF. (2012). Immunization Summary. Geneva: WHO/UNICEF. Accessed April 3, 2012 from
http://www.childinfo.org/files/immunization_summary_en.pdf
Ministry of Planning [DRC]. (2008). DRC Demographic and Health Survey 2007. Kinshasa: Ministry of Planning [DRC]
iii. Summary of major immunization-related legislation
The Sabin Institute identified the following pieces of legislation as being pertinent to immunization:
DEMOCRATIC REPUBLIC OF CONGO Produced by UW GH START Program, May 2012 24
Section I, Articles 42 and 47 of the Constitution (2006) obliges the State to guarantee the health
of every Congolais child
Section VII, Article 204 of the Constitution empowers provinces to organize basic health
services, including immunization campaigns
In 2010 the MoF began drafting a law to create a national immunization trust fund.
Sources Sabin Institute. (2010). Sustainable Immunization Financing — DRC Country Summary. Accessed April 12, 2012 from
http://www.sabin.org/files/DR%20Congo_mm.pdf
iv. Summary of multi-year plan for immunization and annual work plan for immunization activities for recent years
The current MYP identifies several priority areas: service delivery, procurement and quality of vaccines,
logistics, surveillance and the fight against disease and communication for EPI.
Key challenges include inconsistent availability of vaccines at the operational level, absence of a national
regulatory authority, the lack of transportation at the intermediate and operational levels, the internal
transmission of poliovirus, and the absence of national policy for the integration of vaccine interventions
Sources Ministry of Health [DRC]. (2008). Plan Pluriannuel Complet du PEV de la République Démocratique du Congo, 2008-2012
[Complete Multi-Year Plan for EPI in the Democratic Republic of Congo, 2008-2012]. Kinshasa: Ministry of Health [DRC]
v. Definition of routine immunization
The DRC’s cMYP describes the routine EPI as consisting of the seven vaccines currently listed on the
schedule. A distinction is drawn between routine EPI and supplemental activities for polio, tetanus, and
measles.
vii. Budget making and other political considerations
The DRC uses a bicameral legislature, with the two houses being the National Assembly and the Senate.
The first elections in over 40 years were held in July 2006 and again in 2011. Despite criticisms in the
integrity of the poll, Joseph Kabila continues as president, a position which he has held since 2001. We
were able to identify the following recent ministers of health:
New minister (we were unable to find any details about the new minister) (? 2012–present)
Victor Makwenge Kaput (February 2010– ? 2012)
Augustin Mopipi (Mupipi?) Mulumania(October 2008–February 2010)
Victor Makwenge Kaput (February 2007–October 2008)
Zacharie Kashogwe (? 2006–February 2007)
Professor Emile Bongeli (? 2005–February 2007)
We did not locate any additional information about how the ministers impacted routine immunization.

DEMOCRATIC REPUBLIC OF CONGO Produced by UW GH START Program, May 2012 25
The DRC’s budgeting process is opaque, receiving a score of 6 out of 100 in the International Budget
Partnership’s Open Budget Index 2010. We were unable to locate any documents that detail the budget
making process using English search terms, though it is likely that budgets are managed in a
decentralized manner.
Sources International Budget Partnership. (2010). Open Budget Index 2010—Democratic Republic of Congo. Accessed May 17, 2012
from http://internationalbudget.org/wp-content/uploads/2011/04/OBI2010-DemRepCongo.pdf
B. FINANCING AND PRICING
i. Country health expenditure, by source from 1990-2010
DRC allocated 6 percent of total recurrent government expenditure to health in 2007.
The government contributes very little to immunization and health in general
Government funded 5.5 percent of routine immunization in 2004, up from 1.3 percent in
2002
Government funded less than 2 percent of immunization in 2010 (according to the most
recent GAVI Alliance Progress Report)
WHO/UNICEF are the major contributors according to two GAVI reports
UNICEF provided 40 to 45 percent of total immunization finance from 2002 to 2004
WHO and UNICEF contributed 89 percent of immunization funding in 2010 (according to the
most recent GAVI Alliance Progress Report)
FIGURE 12: DRC IMMUNIZATION FINANCE BY SOURCE (RELATIVE SHARE IN %)
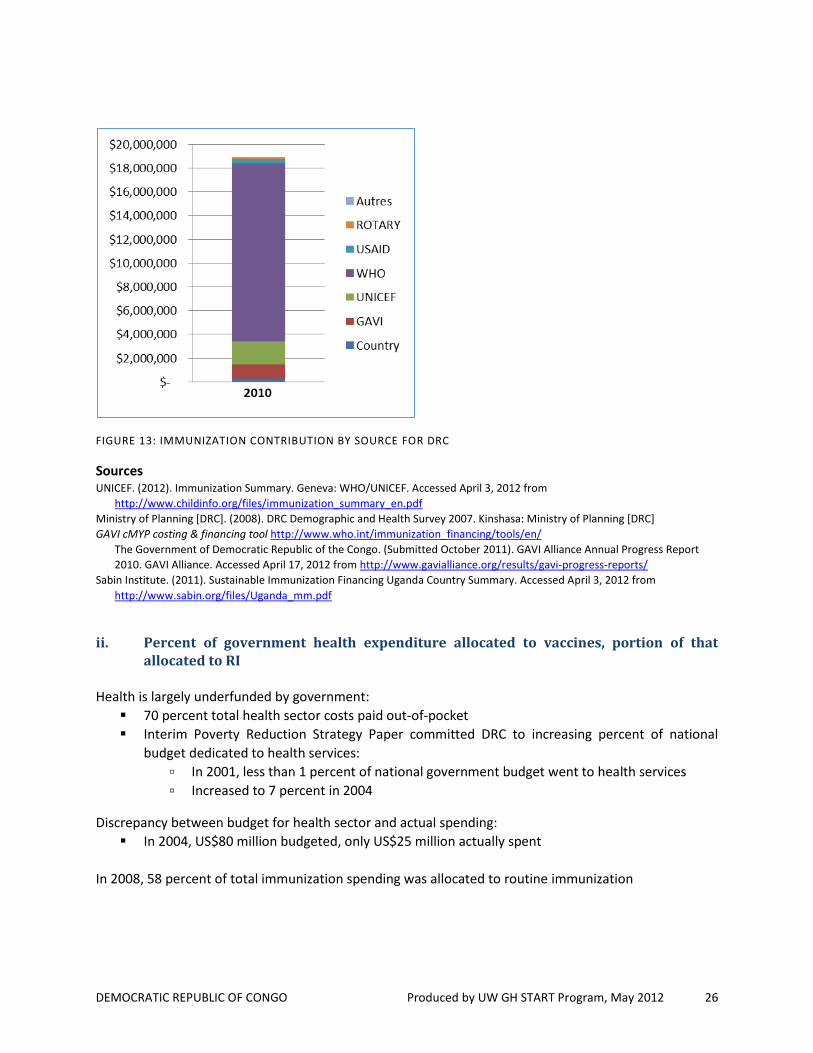
DEMOCRATIC REPUBLIC OF CONGO Produced by UW GH START Program, May 2012 26
FIGURE 13: IMMUNIZATION CONTRIBUTION BY SOURCE FOR DRC
Sources UNICEF. (2012). Immunization Summary. Geneva: WHO/UNICEF. Accessed April 3, 2012 from
http://www.childinfo.org/files/immunization_summary_en.pdf
Ministry of Planning [DRC]. (2008). DRC Demographic and Health Survey 2007. Kinshasa: Ministry of Planning [DRC]
GAVI cMYP costing & financing tool http://www.who.int/immunization_financing/tools/en/
The Government of Democratic Republic of the Congo. (Submitted October 2011). GAVI Alliance Annual Progress Report
2010. GAVI Alliance. Accessed April 17, 2012 from http://www.gavialliance.org/results/gavi-progress-reports/
Sabin Institute. (2011). Sustainable Immunization Financing Uganda Country Summary. Accessed April 3, 2012 from
http://www.sabin.org/files/Uganda_mm.pdf
ii. Percent of government health expenditure allocated to vaccines, portion of that allocated to RI
Health is largely underfunded by government:
70 percent total health sector costs paid out-of-pocket
Interim Poverty Reduction Strategy Paper committed DRC to increasing percent of national
budget dedicated to health services:
▫ In 2001, less than 1 percent of national government budget went to health services
▫ Increased to 7 percent in 2004
Discrepancy between budget for health sector and actual spending:
In 2004, US$80 million budgeted, only US$25 million actually spent
In 2008, 58 percent of total immunization spending was allocated to routine immunization

DEMOCRATIC REPUBLIC OF CONGO Produced by UW GH START Program, May 2012 27
TABLE 11: OVERALL BUDGETED EXPENDITURES FOR IMMUNISATION IN THE DRC FROM ALL SOURCES (GOVT &
DONORS) IN US$
Sources Ministry of Health [DRC]. (2008). Plan Pluriannuel Complet du PEV de la République Démocratique du Congo, 2008-2012
[Complete Multi-Year Plan for EPI in the Democratic Republic of Congo, 2008-2012]. Kinshasa: Ministry of Health [DRC]
The Government of Democratic Republic of the Congo. (Submitted October 2011). GAVI Alliance Annual Progress Report 2010.
GAVI Alliance. Accessed April 17, 2012 from http://www.gavialliance.org/results/gavi-progress-reports/
iii. Spending focus, by donor in country
No data identified.
iv. Current funding gaps in health system (funds available vs. budget)
Funding gap is growing year-on-year. The gap is 4-5 times larger than Uganda on a per infant in 2010-
2011
Expenditure by CategoryBudgeted Year
2012
Budgeted
Year 2013
Traditional Vaccines* 3,749,129$ 3,915,532$
New Vaccines 29,426,190$ 34,238,757$
Injection supplies with AD
syringes2,242,611$ 2,310,441$
Injection supply with syringes
other than Ads
Cold Chain equipment 548,988$ 624,227$
Personnel
Other operational costs
Supplemental Immunisation
Activities43,627,479$ 46,813,827$
Total Expenditures for
Immunisation79,594,397$ 87,902,784$

DEMOCRATIC REPUBLIC OF CONGO Produced by UW GH START Program, May 2012 28
TABLE 12: IMMUNIZATION FINANCING GAPS PER INFANT IN THE DRC
Sources Country Profile: WHO Immunization Financing Democratic Republic of the Congo cMYP
(http://www.who.int/immunization_financing/countries/cmyp/cod/en/index.html)
v. Qualitative summary of key barriers in financing and pricing at national and sub-national level
Unreliable funding institutions:
In 2010, the Congolese Bank liquidated and failed to release funds in a timely manner
Slow process for release of funds from central government, Ministries of Budget and Finance
The State is highly dependent on external partners for purchase of vaccines, equipment and finance of
immunization operations
2008-2012 cMYP advised increased advocacy to central government to create a specific budget for
purchase of vaccines, equipment and vaccine operations; advocacy in Ministry of Health to increase
the proportion of the health budget allocated for vaccination
Sources Ministry of Health [DRC]. (2008). Plan Pluriannuel Complet du PEV de la République Démocratique du Congo, 2008-2012
[Complete Multi-Year Plan for EPI in the Democratic Republic of Congo, 2008-2012]. Kinshasa: Ministry of Health [DRC]
C. SUPPLY CHAIN AND LOGISTICS
No data identified.
D. HUMAN CAPACITY
i. Total est. number of providers that immunize, by provider type
The WHO does not have any data on the number of community health workers in the DRC. In 2009
there were an estimated 52,329 nurses (0.79 per 1,000 population), but it is not clear how many provide
immunizations. (African Health Worker Observatory)
Sources African Health Worker Observatory. (2010). HRH Fact Sheet—DRC. Accessed May 17, 2012 (http://www.hrh-
observatory.afro.who.int/en/component/content/article/6-country-monitoring/57-drc-monitoring.html)
2007 2008 2009 2010 2011
Resource Needs per Infant $19.40 $30.00 $27.60 $13.80 $14.40
Financing per Infant $17.30 $27.80 $24.40 $10.40 $10.60
Gaps per Infant $2.10 $2.20 $3.20 $3.30 $3.80
Infants (Millions) 2.88 2.97 3.06 3.06 0.00

DEMOCRATIC REPUBLIC OF CONGO Produced by UW GH START Program, May 2012 29
ii. Profiles of providers who immunize people
No data identified.
E. PERFORMANCE MANAGEMENT AND TRAINING
i. Immunization responsibilities at the federal, state, district, village levels and ratios (number of HCWs per supervisor)
“The HZ integrates primary health care services and a first reference hospital. Each health zone is
managed by a Medical Inspector of the Health Zone (“Médecin Chef de Zone de Santé”) who is in charge
of the HZ Office, which houses a team of MCZ, an administrator, one/two nurse supervisors and a
pharmacist. HZ’s are divided in to areas that service between 5,000 and 10,000 persons in rural areas
and 15,000 to 30,000 in urban areas. Each area is served by a Health Center, staffed by a head nurse and
assistant and one midwife; and a number of health posts and community health workers.” (Mock 2006)
“At the organizational level, the EPI has a national headquarters, 11 provincial coordination units and 36
antennas each serving an average of 15 health areas. The central level plays a strategic and normative
role. The coordination units and antennas provide technical and logistical support to the health areas in
terms of training, supervision and the supply of vaccines and vaccination equipment. And immunization
activities are organized at the health center level.” (MoH Financial Sustainability Plan)
Three key strategies of vaccination applied to achieve the program's target populations are as follows:
Fixed strategy: these are the vaccinations performed in fixed centers to reach the target
population within a radius of less than 5 km around the clinic. This strategy covers almost 40%
of the target population, mainly in urban areas.
Outreach strategy: these are vaccinations carried out from fixed center to cover the target
population within a radius of 5 to 15 km around the clinic. It covers nearly 40% of the target and
applies in all health zones (HZs) according to the realities on the ground.
Decentralized mobile strategy: this is used to serve the target population located in areas of
difficult access, which represents nearly 20% of the overall target. The HZs rarely use them due
to lack of adequate transport.
(Translated from DRC cMYP)
In reality, the DRC’s healthcare system is decentralized and fragmented. Many health zones and facilities
are autonomous and charge patients fees to fund their operations. Due to a lack of funding from central
government, a large portion of health facilities are funded through non-governmental organizations or
international organizations such as the World Bank.
Sources Mock, N. et al. (May 2006). Public Health Training in the Democratic Republic of Congo: A Case Study of the Kinshasa School of
Public Health. Accessed May 17, 2012 from http://www.jhsph.edu/gra/Congo.pdf
Ministry of Health [DRC]. (2005). Financial Sustainability Plan of the Expanded Programme on Immunization. Kinshasa: Ministry
of Health [DRC]
Ministry of Health [DRC]. (2008). Plan Pluriannuel Complet du PEV de la République Démocratique du Congo, 2008-2012
[Complete Multi-Year Plan for EPI in the Democratic Republic of Congo, 2008-2012]. Kinshasa: Ministry of Health [DRC]

DEMOCRATIC REPUBLIC OF CONGO Produced by UW GH START Program, May 2012 30
Waldman, Ron. 2006. Health in Fragile States, Country Case Study: Democratic Republic of the Congo. Arlington, Virginia, USA:
Basic Support for Institutionalizing Child Survival (BASICS) for the United States Agency for International Development
(USAID).
Sabin Institute. (2010). Sustainable Immunization Financing — DRC Country Summary. Accessed April 12, 2012 from
http://www.sabin.org/files/DR%20Congo_mm.pdf
ii. Percent ‘missed opportunities’ (children eligible for vaccines that come to health center but do not receive them)
No data identified.
iii. Summary of any other performance metrics captured by the MoH or other organization (e.g., no. of supervisory visits)
TABLE 13: DPT DROPOUT RATES, 2002-2007 FOR DRC
Year DTP1–DTP3 dropout rate
2002 18.2%
2003 19.0%
2004 15.8%
2005 13.0%
2006 11.5%
2007 8.5%
TABLE 14: VACCINE WASTAGE (%) IN THE DRC BY VACCINE AND YEAR
Vaccine 2011 2010 2009 2008 2007 2006
BCG 29 34 35 39
DTP 5 7
HepB 5 7 9 18
Hib 5 7 9 NA
PCV 5
Polio 12 14 14 21
MCV 15 24 25 33 32 33
YF 16 22 25 27
Tetanus 16 20 21 28
Sources Ministry of Health [DRC]. (2008). Plan Pluriannuel Complet du PEV de la République Démocratique du Congo, 2008-2012
[Complete Multi-Year Plan for EPI in the Democratic Republic of Congo, 2008-2012]. Kinshasa: Ministry of Health [DRC]
Vaccine schedule: WHO Vaccine Preventable Diseases Monitoring System
(http://apps.who.int/immunization_monitoring/en/globalsummary/countryprofileselect.cfm)
F. COMMUNITY ENGAGEMENT

DEMOCRATIC REPUBLIC OF CONGO Produced by UW GH START Program, May 2012 31
i. Distribution of health posts/health centers compared to population density
“The DRC currently has some 401 hospitals, of which 176 belong to the State, 179 to religious groupings,
and 46 to public and private sector enterprises. There are a total of [7,725]* other healthcare
establishments in the form of referral health centers, health centers, maternity units, clinics and
polyclinics belonging to the State, enterprises, religious groupings, NGOs and private individuals or
entities. However, the hospitals and other State healthcare establishments are for the most part in a
state of advanced disrepair.” (MoH Financial Sustainability Plan)
*Note: Updated this figure based on more recent reports
“The DRC has over 500** hospitals and more than 5,000 health facilities that are in varying states of
functioning. Of these facilities, private institutions, churches, and NGOs operate more than half…. A
2004 survey in Equateur Province found that 42.7 percent of households had to walk over eight hours to
reach a health facility (World Bank 2005a)
**Government documents note the existence of 510 hospitals; a recent MSF report noted only about
400 hospitals and 5,000 health facilities.” (Waldman)
Sources Ministry of Health [DRC]. (2005). Financial Sustainability Plan of the Expanded Programme on Immunization. Kinshasa: Ministry
of Health [DRC]
Waldman, Ron. 2006. Health in Fragile States, Country Case Study: Democratic Republic of the Congo. Arlington, Virginia, USA:
Basic Support for Institutionalizing Child Survival (BASICS) for the United States Agency for International Development
(USAID).
ii. Data on demand-side reasons for un- or undervaccination
Cost is a major barrier to accessing healthcare, followed by non-availability of medicines and long
distances to healthcare. (Kassa 2005) There is some evidence of community resistance to vaccines in
some parts of the country, though we were not able to quantify it. (Seay 2011)
Sources Kassa, A. et al. (2005). Access to healthcare, mortality and violence in Democratic Republic of the Congo. Brussels: Médecins
Sans Frontières. Accessed April 12, 2012 from
www.doctorswithoutborders.org/publications/reports/2005/drc_healthcare_11-2005.pdf
Seay, L. (2011, August 31). A Vaccination Triumph in Congo Offers Strategic Lessons. The Interdependent. Accessed May 17,
2012 from http://www.theinterdependent.com/110831/a-vaccination-triumph-in-congo-offers-strategic-lessons
iii. Data on level of public trust
Though not quantified, a USAID report alluded to low levels of public trust in government-run
institutions.
Sources Waldman, Ron. 2006. Health in Fragile States, Country Case Study: Democratic Republic of the Congo. Arlington, Virginia, USA:
Basic Support for Institutionalizing Child Survival (BASICS) for the United States Agency for International Development
(USAID).

DEMOCRATIC REPUBLIC OF CONGO Produced by UW GH START Program, May 2012 32
G. MONITORING AND USE OF DATA
i. DHS, any national surveys and WUENIC coverage levels for all available dates (DTP3, MCV, and others), with potential explanations for any changes in trends
FIGURE 14: DISPARITIES IN REPORTED VACCINE COVERAGE RATES IN THE DRC, BY REPORTING AGENCY
FIGURE 15: VACCINE COVERAGE RATES IN THE DRC BY WEALTH QUINTILE
85
67 63
68 72
62
71.7 70.6
44.4
62.9
45.7 49.6
85 82
62
72
59
70
0
10
20
30
40
50
60
70
80
90
BCG DTP1 DTP3 MCV Pol3 YF
Vac
cin
e co
vera
ge (
%)
WHO/UNICEF 2010 DHS 2007 MICS 2010
0
10
20
30
40
50
60
70
80
90
100
Lowest Second Middle Fourth Highest
Vac
cin
e co
vera
ge (
%)
Wealth quintile
BCG
DPT3
Pol3
MCV
YF
DEMOCRATIC REPUBLIC OF CONGO Produced by UW GH START Program, May 2012 33
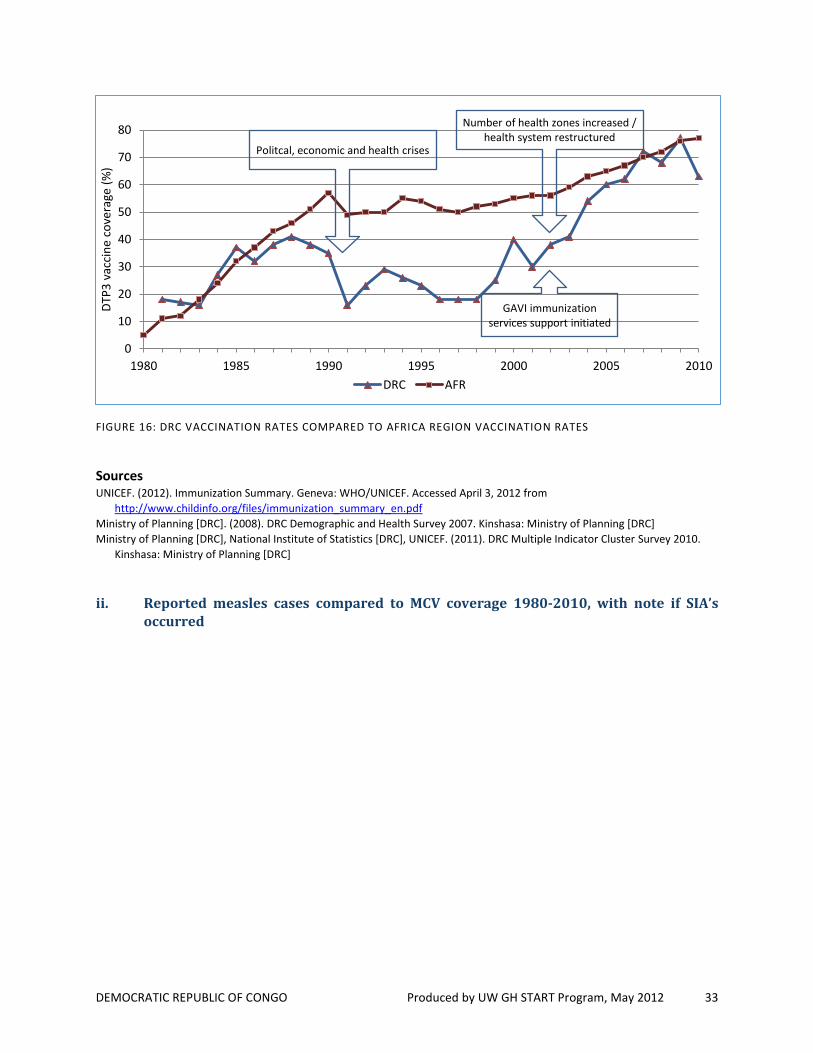
FIGURE 16: DRC VACCINATION RATES COMPARED TO AFRICA REGION VACCINATION RATES
Sources UNICEF. (2012). Immunization Summary. Geneva: WHO/UNICEF. Accessed April 3, 2012 from
http://www.childinfo.org/files/immunization_summary_en.pdf
Ministry of Planning [DRC]. (2008). DRC Demographic and Health Survey 2007. Kinshasa: Ministry of Planning [DRC]
Ministry of Planning [DRC], National Institute of Statistics [DRC], UNICEF. (2011). DRC Multiple Indicator Cluster Survey 2010.
Kinshasa: Ministry of Planning [DRC]
ii. Reported measles cases compared to MCV coverage 1980-2010, with note if SIA’s occurred
0
10
20
30
40
50
60
70
80
1980 1985 1990 1995 2000 2005 2010
DTP
3 v
acci
ne
cove
rage
(%
)
DRC AFR
Number of health zones increased / health system restructured
GAVI immunization services support initiated
Politcal, economic and health crises

DEMOCRATIC REPUBLIC OF CONGO Produced by UW GH START Program, May 2012 34
FIGURE 17: REPORTED MEASLES CASES COMPARED TO MCV COVERAGE IN THE DRC
Sources UNICEF. (2012). Immunization Summary. Geneva: WHO/UNICEF. Accessed April 3, 2012 from
http://www.childinfo.org/files/immunization_summary_en.pdf
WHO. (2011). Reported Incidence Time Series. Geneva: WHO. Accessed April 12, 2012 from
http://www.who.int/entity/immunization_monitoring/data/incidence_series.xls
0
20
40
60
80
100
0
20000
40000
60000
80000
100000
120000
140000
160000
180000
200000
1980 1982 1984 1986 1988 1990 1992 1994 1996 1998 2000 2002 2004 2006 2008 2010
Vac
cin
e co
vera
ge (
%)
Mea
sles
cas
es
Measles cases MCV coverage
SIAs Epidemic in
Kinshasa
These are the WHO figures, but, though we found some references to an outbreak in 2005/20006, there was little
detailed information

MOZAMBIQUE Produced by UW GH START Program, May 2012 35
MOZAMBIQUE
A. POLITICAL COMMITMENT
i. Timeline of vaccine introductions since 1990 and current vaccination schedule
TABLE 15: MOZAMBIQUE VACCINE SCHEDULE AND TIMELINE OF INTRODUCTION
Vaccine Vaccine in schedule (as of 31 Dec 2010)
Year of introduction in entire country
Year of introduction in part of the country
HepB birth dose (in 2010)
Birth Dose offered to all children
Year of introduction of birth dose
BCG Yes <1990*
DTP** Yes <1990*
HepB** Yes 2001 No n/a n/a
Hib** Yes 2009
MCV Yes <1990*
OPV Yes <1990*
PCV No 2012
TT (pab) Yes <1990*
Vitamin A Yes ? * Date obtained from earliest reported coverage estimates
** Vaccine included in the DTwPHibHep pentavalent vaccine that was introduced in 2009
There are currently no plans to introduce the HPV vaccine, and neither vaccine is licensed in
Mozambique. The estimated date of introduction of the rotavirus vaccine is 2014.
Sources Vaccine schedule: WHO Vaccine Preventable Diseases Monitoring System
(http://apps.who.int/immunization_monitoring/en/globalsummary/countryprofileselect.cfm)
Vaccine introduction: WHO (http://www.who.int/entity/immunization_monitoring/data/year_vaccine_introduction.xls) (unless
noted)
HPV information center: WHO (http://apps.who.int/hpvcentre/statistics/dynamic/ico/SummaryReportsSelect.cfm)
ii. Percent of districts that have <50% coverage, 50-79% coverage and ≥80% coverage
TABLE 16: DTP3 DATA FOR MOZAMBIQUE FROM 2010
Coverage level Proportion districts
< 50% 9%
50–79% 6%
≥ 80% 30%
Not reported 56%

MOZAMBIQUE Produced by UW GH START Program, May 2012 36
The 2008 MICS also reported sub-national coverage information for several vaccines. Data on DTP3 are
presented below.
FIGURE 18: MOZAMBIQUE DTP3 COVERAGE BY AREA
Sources UNICEF. (2012). Immunization Summary. Geneva: WHO/UNICEF. Accessed April 23, 2012 from
http://www.childinfo.org/files/immunization_summary_en.pdf
Instituto Nacional de Estatísticas [National Statistics Institute, Mozambique]. (2009). Final Report of the Multiple Indicator
Cluster Survey, 2008. Maputo: Instituto Nacional de Estatísticas [Mozambqiue]

MOZAMBIQUE Produced by UW GH START Program, May 2012 37
iii. Summary of major immunization-related legislation
A 2004 WHO report summarized legislation relating to primary care. The following is particularly related
to immunization:
Order of July 30, 1975—“Establishes that all (nationalized health facilities shall be supplied with
medicines, laboratory material, and so forth, by the Central de Medicamentos or Depositos
Provinciais”.
Law number 2/77 de 27 de Setembro—“The law establishes that all preventive care is free.”
Preventive care is defined under Order of October 12, 1977 to include immunizations.
Subsequent legislation modified allowable fees for healthcare services (including outpatient
care) but it is not clear if this altered the requirement for free immunizations.
The 1990 Mozambican Constitution—“Establishes the right of every citizen to health care…the
state is responsible for organizing the National Health System (NHS) to guarantee citizens’
rights.”
Sources Lindelow, M. et al. (2004). Primary Health Care in Mozambique—Service Delivery in a Complex Hierarchy. Washington, DC:
World Bank
iv. Summary of multi-year plan for immunization and annual work plan for immunization activities for recent years
The cMYP identified several specific priorities within each area of the EPI. The prominent priorities are
listed below:
Service delivery: address the high geographic variation in coverage and dropout rates
Logistics: implement a vaccine management system in all districts and improve transportation
Advocacy and communication: develop and implement a global communication strategy
Surveillance: improve surveillance of polio, measles, tetanus, and Hib
Program management: establish a data quality and management system, enhance district
planning by limiting central government involvement, an establish a vaccine wastage monitoring
system
Sources Republic of Mozambique Ministry of Health. (n.d.) Expanded Programme on Immunization Comprehensive Multi-year Plan
(2009–2013). Maputo: Ministry of Health [Mozambique]
v. Definition of routine immunization
The Mozambique cMYP appears to treat routine immunization as all activities conducted as part of the
EPI but excluding supplemental activities.
vi. Budget making and other political considerations
Mozambique uses a presidential democratic republic system where the president is both head of state
and head of government. The government exercises both executive power and legislative power in the
unicameral Assembly of the Republic. Mozambique has been led by the Liberation Front of Mozambique
(FRELIMO) since independence in 1975. Elections take place every five years and the current president

MOZAMBIQUE Produced by UW GH START Program, May 2012 38
(Armando Guebuza) has been in place since February 2005. We were able to identify two recent
ministers of health:
Dr. Alexandre Lourenço Jaime Manguele (October 2010–present)
Dr. Paulo Ivo Garrido (January? 2005–October 2010)
There was little information found from English search terms about the impact of the ministers on
routine immunization. Dr. Garrido was removed from office in October 2010 despite being reappointed
to a second term earlier that year but the reasons for his dismissal were not clear. One article did posit
that there had been tensions between Garrido and staff within the Ministry and that the resulting
resignations have disrupted the medicines distribution system. (Omondi 2010)
Mozambique’s budget process does not appear to be rigorous or transparent. Reviews of the process
noted that budgets are primarily a result of negotiations between the executive branch and donors, with
a legislative rubber stamp of approval. (Pereira 2011) Other challenges include a lack of linkages
between policy priorities and resource allocation and direct funding of ministries or projects by donors.
(Suleman 2007)
Sources Omondi, P. (2010, October 12). Mozambique: Economic Ministers Sent Packing. News from Africa. Accessed May 22, 2012 from
http://www.newsfromafrica.org/newsfromafrica/articles/art_12027.html
Pereira, J. (2011) Slow Progress towards Democratic Ownership in Mozambique. Accessed May 22, 2012 from
http://www.alliance2015.org/fileadmin/Texte__Pdfs/Text_Documents/Alliance2015_Democratic_Ownership_Mozambique
_2011.pdf
Suleman, J (2007). Mozambique: Better Budget Machinery – First Focus of Reforms. OECD Journal on Budgeting, 6(2). Accessed
May 22, 2012 from http://www.oecd.org/dataoecd/24/62/43470116.pdf
B. FINANCING AND PRICING
i. Country health expenditure, by source from 1990-2010
Total health Expenditure Data:
In 2010, the level of funding for health was US$21 per capita (government and donor funds pooled
together), up from US$12 per capita in 2003
This translates to $432,600,000 total, given the WHO 2007 population estimate of 20.6 million
Total Health Expenditure of US$21 per capita is lower than the $34 WHO-recommended for
developing countries
Government and other health funding grew significantly in late 2000s
State budget for health sector grew significantly in real terms 2004-2009 (Table 17)
Government funding projections in cMYP 2009-2012 showed continued growth trend, but actual
expenditure lagged, as made apparent in the cMYP 2012-2016 (Figure 18)
Government funded 25 percent of routine immunization in 2010, down from 46 percent in 2008
(Figure 18)

MOZAMBIQUE Produced by UW GH START Program, May 2012 39
TABLE 17: HEALTH EXPENDITURE (IN MILLIONS OF US$) FOR MOZAMBIQUE
FIGURE 19: ROUTINE IMMUNIZATION SPENDING IN MOZAMBIQUE BY SOURCE COMPARED AGAINST BIRTH
COHORT AND FUNDING PROJECTIONS
Source 2004 2005 2006 2007 2008
State Budget 4$ 104$ 108$ 127$ 138$
Common Fund 63$ 106$ 99$ 125$ 74$
Vertical Fund 85$ 130$ 141$ 150$ 300$
Total Expenditures 152$ 340$ 348$ 402$ 512$
2008 2009 2010 2011 2012 2013 2014 2015 2016
Infants (Millions): 0.79 0.80 0.81 0.82 0.83 0.84 0.85 0.86 0.87
RI Funding: 10,524,083$ 27,211,123$ 15,414,459$ 62,534,300$ 24,511,136$ 27,688,170$ 44,896,489$ 49,095,256$ 47,764,783$
Funding per Infant: 13.38$ 34.18$ 19.12$ 76.64$ 29.67$ 33.16$ 53.13$ 57.42$ 55.09$
*Uses average growth rate of 1.22% from 2012-2016 to estimate births in 2008-2011**RI Funding based on available projections from cMYPs. Funding for 2008 and 2010 reflect actual Expenditure
46%
25%
13%
7%
28%
45%
10%
2%
3%3%
10%
0%
10%
20%
30%
40%
50%
60%
70%
80%
90%
100%
JICA
Government GAVI Co-Financing
Prosaude
FDC
WHO
GAVI
UNICEF
Government
7%

MOZAMBIQUE Produced by UW GH START Program, May 2012 40
TABLE 18: CMYP COST PROJECTIONS FOR MOZAMBIQUE, YEARS 2008-2012 AND 2012-2016
Public Health financing structure:
Internal Funds (increasing in recent years)
External Funds (increasing in recent years)
o Common Fund called “Prosuade” – Pooled funding mechanism for 14 development partners
o Projects managed by individual agencies
o Sector Wide Approach (SWAp) About 26 bilateral and multilateral cooperation agencies (14
coordinated through Prosuade
Revenues from health sector
o Moving toward gratuitous system where children, pregnant women, and chronic patients do
not pay for consultation and admission
Sources The Government of Mozambique. (Submitted October 2010). GAVI Alliance Annual Progress Report 2010. GAVI Alliance.
Accessed May 10, 2012 from http://www.gavialliance.org/results/gavi-progress-reports/.
Republic of Mozambique Ministry of Health. (2009). Expanded Programme on Immunization Comprehensive Multi-Year Plan
2009-2013.
Republic of Mozambique Ministry of Health. (2012). Expanded Programme on Immunization Comprehensive Multi-Year Plan
2012-2016.
Country Profile: WHO Immunization Financing Mozambique cMYP
(http://www.who.int/immunization_financing/countries/cmyp/mozambique/en/index.html)
Actual
Expenditure
2008 (Baseline
Year)2009 2010 2011 2012 2013
Total 2009-2013
Cost Category
Routine Recurrent Costs 6,219,296$ 23,176,117$ 35,351,657$ 47,421,123$ 72,049,414$ 79,597,469$ 257,595,780$
Routine Capital Costs 250,344$ 695,485$ 1,775,783$ 1,846,461$ 1,732,683$ 1,095,269$ 7,145,681$
Campaign Costs 3,502,003$ 4,015,911$ 4,015,911$
Shared Health Systems Costs (personnel, transportation, new buildings)552,440$ 3,339,521$ 6,237,864$ 9,250,805$ 12,381,768$ 15,634,270$ 46,844,228$
Grand Total 10,524,083$ 27,211,123$ 43,365,304$ 62,534,300$ 86,163,865$ 96,327,008$ 315,601,600$
Routine Immunization 7,022,080$ 27,211,123$ 43,365,304$ 58,518,389$ 86,163,865$ 96,327,008$ 311,585,689$
Supplemental Immunization Activities3,502,003$ -$ -$ 4,015,911$ -$ -$ 4,015,911$
Note: cold chain infrastructure investments primarily made prior to 2012 introduction of pneumococcus vaccine
Actual
Expenditure
2010 (Baseline
Year)2012 2013 2014 2015 2016
Total 2012-2016
Cost Category
Routine Recurrent Costs 13,613,591$ 22,478,889$ 22,914,266$ 42,752,657$ 42,867,220$ 45,637,984$ 176,651,015$
Routine Capital Costs 861,400$ 1,029,226$ 1,621,861$ 1,010,056$ 852,207$ 947,218$ 5,460,567$
Campaign Costs -$ -$ 2,083,303$ -$ 4,219,377$ -$ 6,302,680$
Shared Health Systems Costs (personnel, transportation, new buildings)939,468$ 1,003,021$ 1,068,740$ 1,133,776$ 1,156,452$ 1,179,581$ 5,541,571$
Grand Total 15,414,459$ 24,511,136$ 27,688,170$ 44,896,489$ 49,095,256$ 47,764,783$ 193,955,834$
Routine Immunization 15,414,459$ 24,511,136$ 25,604,867$ 44,896,489$ 44,875,879$ 47,764,783$ 187,653,153$
Supplemental Immunization Activities -$ -$ 2,083,303$ -$ 4,219,377$ -$ 6,302,681$
Future Projections
Future Projections
MOZAMBIQUE Produced by UW GH START Program, May 2012 41
ii. Percent of government health expenditure allocated to vaccines, portion of that allocated to RI
In 2012, between 2 and 5 percent of total health expenditure was allocated to routine and campaign
immunization
Between 10-12 percent of government health expenditure was allocated to routine and campaign
immunization
In 2012, 97 percent of total EPI was allocated to routine immunization (the rest is for Supplementary
Immunization Activities like polio and measles)
Routine immunization is budgeted at $36.4 million per annum (average of five year projection,
2012-2016). Total resource requirements per annum over 2012-2016 for EPI is estimated at $37.7
million per annum
Projections take into account population growth of 2.14 percent, introduction of Pneumococcal
vaccine (PCV) from 2012, introduction of Rotavirus from 2014, increased coverage target for
traditional vaccines
EPI is among highest priorities for MoH, but lacks local partners to support implementation
Lack of implementation infrastructure and human resources may account for failure to spend
allocated budget
Total EPI future projected spending decreased from $315 million in the 2009 cMYP to $194 million in
2012 cMYP
MOZAMBIQUE Produced by UW GH START Program, May 2012 42
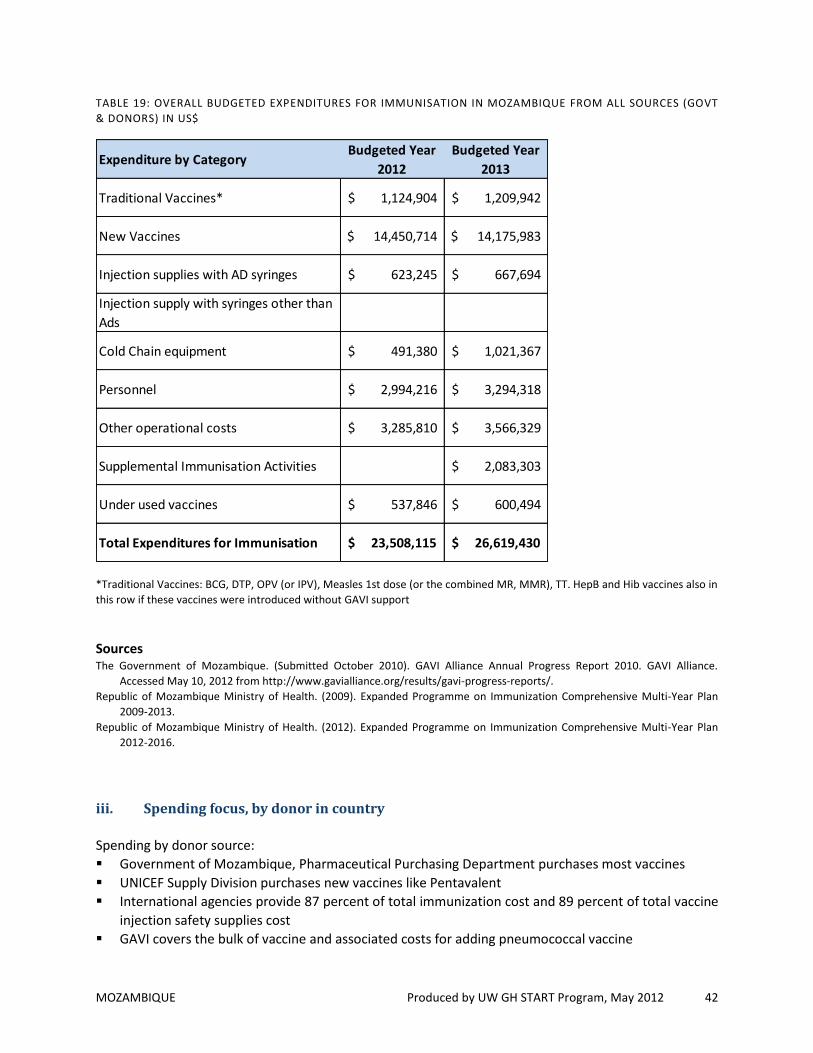
TABLE 19: OVERALL BUDGETED EXPENDITURES FOR IMMUNISATION IN MOZAMBIQUE FROM ALL SOURCES (GOVT
& DONORS) IN US$
*Traditional Vaccines: BCG, DTP, OPV (or IPV), Measles 1st dose (or the combined MR, MMR), TT. HepB and Hib vaccines also in
this row if these vaccines were introduced without GAVI support
Sources The Government of Mozambique. (Submitted October 2010). GAVI Alliance Annual Progress Report 2010. GAVI Alliance.
Accessed May 10, 2012 from http://www.gavialliance.org/results/gavi-progress-reports/.
Republic of Mozambique Ministry of Health. (2009). Expanded Programme on Immunization Comprehensive Multi-Year Plan
2009-2013.
Republic of Mozambique Ministry of Health. (2012). Expanded Programme on Immunization Comprehensive Multi-Year Plan
2012-2016.
iii. Spending focus, by donor in country
Spending by donor source:
Government of Mozambique, Pharmaceutical Purchasing Department purchases most vaccines
UNICEF Supply Division purchases new vaccines like Pentavalent
International agencies provide 87 percent of total immunization cost and 89 percent of total vaccine
injection safety supplies cost
GAVI covers the bulk of vaccine and associated costs for adding pneumococcal vaccine
Expenditure by CategoryBudgeted Year
2012
Budgeted Year
2013
Traditional Vaccines* 1,124,904$ 1,209,942$
New Vaccines 14,450,714$ 14,175,983$
Injection supplies with AD syringes 623,245$ 667,694$
Injection supply with syringes other than
Ads
Cold Chain equipment 491,380$ 1,021,367$
Personnel 2,994,216$ 3,294,318$
Other operational costs 3,285,810$ 3,566,329$
Supplemental Immunisation Activities 2,083,303$
Under used vaccines 537,846$ 600,494$
Total Expenditures for Immunisation 23,508,115$ 26,619,430$
MOZAMBIQUE Produced by UW GH START Program, May 2012 43
Sources Republic of Mozambique Ministry of Health. (2009). Expanded Programme on Immunization Comprehensive Multi-Year Plan
2009-2013.
Republic of Mozambique Ministry of Health. (2012). Expanded Programme on Immunization Comprehensive Multi-Year Plan
2012-2016.
iv. Current funding gaps in health system (funds available vs. budget)
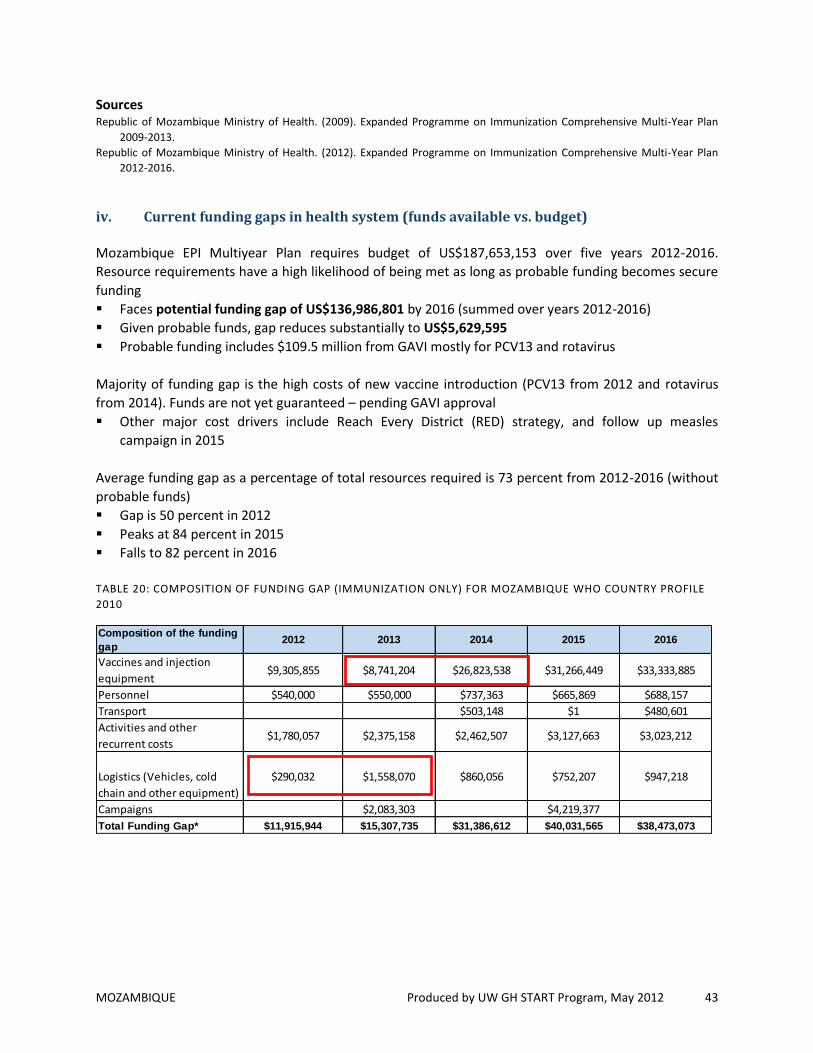
Mozambique EPI Multiyear Plan requires budget of US$187,653,153 over five years 2012-2016.
Resource requirements have a high likelihood of being met as long as probable funding becomes secure
funding
Faces potential funding gap of US$136,986,801 by 2016 (summed over years 2012-2016)
Given probable funds, gap reduces substantially to US$5,629,595
Probable funding includes $109.5 million from GAVI mostly for PCV13 and rotavirus
Majority of funding gap is the high costs of new vaccine introduction (PCV13 from 2012 and rotavirus
from 2014). Funds are not yet guaranteed – pending GAVI approval
Other major cost drivers include Reach Every District (RED) strategy, and follow up measles
campaign in 2015
Average funding gap as a percentage of total resources required is 73 percent from 2012-2016 (without
probable funds)
Gap is 50 percent in 2012
Peaks at 84 percent in 2015
Falls to 82 percent in 2016
TABLE 20: COMPOSITION OF FUNDING GAP (IMMUNIZATION ONLY) FOR MOZAMBIQUE WHO COUNTRY PROFILE
2010
Composition of the funding
gap2012 2013 2014 2015 2016
Vaccines and injection
equipment$9,305,855 $8,741,204 $26,823,538 $31,266,449 $33,333,885
Personnel $540,000 $550,000 $737,363 $665,869 $688,157
Transport $0 $503,148 $1 $480,601
Activities and other
recurrent costs$1,780,057 $2,375,158 $2,462,507 $3,127,663 $3,023,212
Logistics (Vehicles, cold
chain and other equipment)
$290,032 $1,558,070 $860,056 $752,207 $947,218
Campaigns $0 $2,083,303 $0 $4,219,377 $0
Total Funding Gap* $11,915,944 $15,307,735 $31,386,612 $40,031,565 $38,473,073

MOZAMBIQUE Produced by UW GH START Program, May 2012 44
TABLE 21: RESOURCE REQUIREMENTS, FINANCING AND GAPS IN MILLIONS OF US$ FOR MOZAMBIQUE
(CONSTRUCTED FROM 2009 CMYP AND 2012 CMYP)
Table 22: IMMUNIZATION FINANCING GAPS PER INFANT IN MOZAMBIQUE
Sources Republic of Mozambique Ministry of Health. (2009). Expanded Programme on Immunization Comprehensive Multi-Year Plan
2009-2013.
Republic of Mozambique Ministry of Health. (2012). Expanded Programme on Immunization Comprehensive Multi-Year Plan
2012-2016.
Country Profile: WHO Immunization Financing Mozambique cMYP
(http://www.who.int/immunization_financing/countries/cmyp/mozambique/en/index.html)
v. Qualitative summary of key barriers in financing and pricing at national and sub-national level
State is highly dependent on donors for future financing and sustainability of current EPI activities
Combined donor contribution accounts for 72 percent of routine immunization program cost
Funding difficulties include:
Late disbursements
Unpredictability of funding and lack of sustained long term financing agreements
Agency specific reporting mechanisms
Resistance of agencies to coordinate
Threats to financing identified in cMYP 2012:
Insufficient financial resources to implement EPI Plan of Action
Donors prefer to channel funds through Global Health Initiatives that target specific interventions
outside of immunization
Compositition of the funding gap (cMYP 2009) 2009 2010 2011 2012 2013 2014 2015 2016
Total Resource Requirements 23,871,602$ 37,127,440$ 53,283,494$ 73,782,097$ 80,692,738$
Total Resource Requirements (Routine only) 23,871,602$ 37,127,440$ 49,267,584$ 73,782,097$ 80,692,738$
per capita 1$ 2$ 3$ 3$ 4$
Total Secured Funding 22,680,893$ 34,387,449$ 40,809,708$ 54,839,770$ 62,134,814$
Funding Gap (Secured Funds Only) 1,190,709$ 2,739,991$ 12,473,786$ 18,942,327$ 18,557,924$
Total Probable Financing 1,540,710$ 2,739,992$ 12,473,789$ 18,942,327$ 18,557,925$
Funding Gap (Secured Funds & Probable Funds) (350,001)$ (1)$ (3)$ -$ (1)$
Compositition of the funding gap (cMYP 2012)
Total Resource Requirements 23,508,115$ 26,619,430$ 43,762,712$ 47,938,803$ 46,585,202$
Total Resource Requirements (Routine only) 23,508,115$ 24,536,127$ 43,762,712$ 43,719,426$ 46,585,202$
per capita 1$ 1$ 2$ 2$ 2$
Total Secured Funding 11,592,171$ 11,311,695$ 12,376,100$ 7,907,239$ 8,112,129$
Funding Gap (Secured Funds Only) 11,915,944$ 15,307,735$ 31,386,612$ 40,031,564$ 38,473,073$
Total Probable Financing 11,205,188$ 14,349,486$ 30,742,092$ 39,248,654$ 36,839,692$
Funding Gap (Secured Funds & Probable Funds) 710,756$ 958,249$ 644,520$ 782,910$ 1,633,381$
2012 2013 2014 2015 2016
Resource Needs per Infant $28.47 $31.89 $51.81 $56.05 $53.74
Financing per Infant $14.20 $13.55 $14.65 $9.24 $9.36
Gaps per Infant $14.27 $18.34 $37.16 $46.80 $44.39
Infants (Millions) 0.83 0.84 0.85 0.86 0.87
MOZAMBIQUE Produced by UW GH START Program, May 2012 45
Cost-effective health and other social interventions compete for government resource: Malaria,
treatment of diarrhea with ORS and Zinc, Vitamin A supplementation
Problems reaching harmony between partners and donors (aligning priorities, reliability and timing
of fund disbursements and financing agreements)
Threats to financing identified by Ministry of Health 2006:
High transaction costs due to the number of development partners
Low accountability among donor groups
High competition for funds from other health categories
Sources Republic of Mozambique Ministry of Health. (2009). Expanded Programme on Immunization Comprehensive Multi-Year Plan
2009-2013.
Ministry of Health for Mozambique. (2008). International Health Partnership Taking Stock Report Mozambique.
C. SUPPLY CHAIN AND LOGISTICS
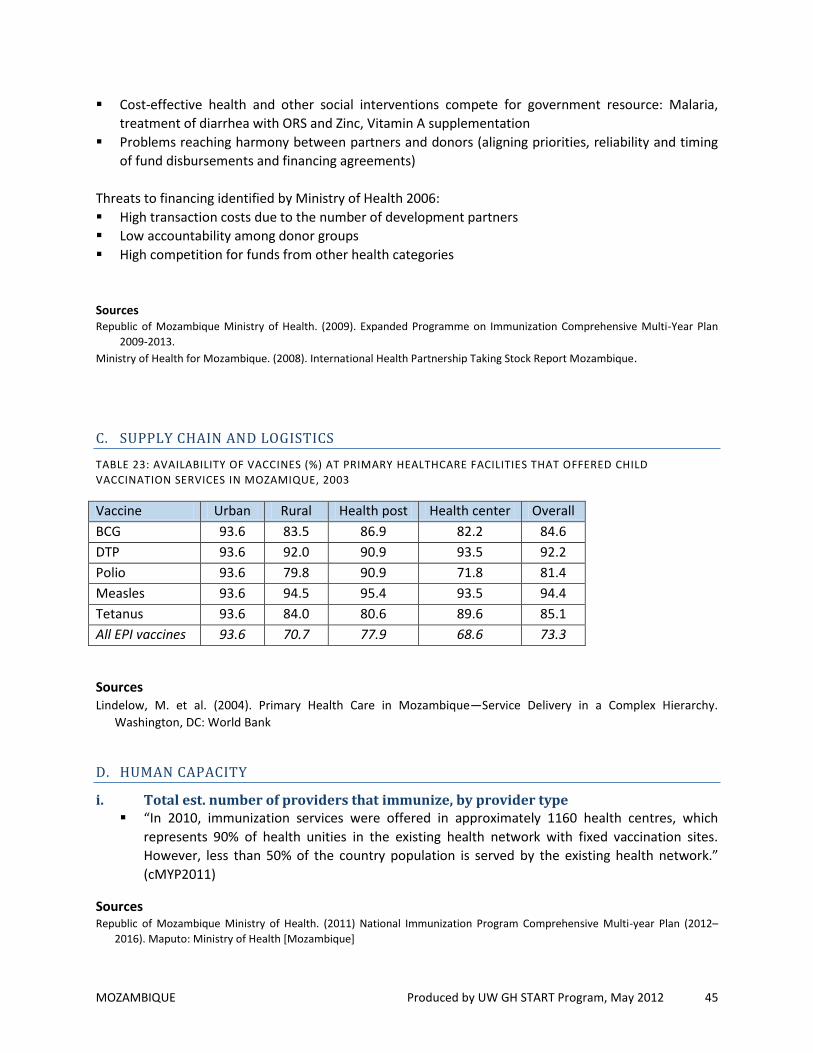
TABLE 23: AVAILABILITY OF VACCINES (%) AT PRIMARY HEALTHCARE FACILITIES THAT OFFERED CHILD
VACCINATION SERVICES IN MOZAMIQUE, 2003
Vaccine Urban Rural Health post Health center Overall
BCG 93.6 83.5 86.9 82.2 84.6
DTP 93.6 92.0 90.9 93.5 92.2
Polio 93.6 79.8 90.9 71.8 81.4
Measles 93.6 94.5 95.4 93.5 94.4
Tetanus 93.6 84.0 80.6 89.6 85.1
All EPI vaccines 93.6 70.7 77.9 68.6 73.3
Sources Lindelow, M. et al. (2004). Primary Health Care in Mozambique—Service Delivery in a Complex Hierarchy.
Washington, DC: World Bank
D. HUMAN CAPACITY
i. Total est. number of providers that immunize, by provider type “In 2010, immunization services were offered in approximately 1160 health centres, which
represents 90% of health unities in the existing health network with fixed vaccination sites.
However, less than 50% of the country population is served by the existing health network.”
(cMYP2011)
Sources Republic of Mozambique Ministry of Health. (2011) National Immunization Program Comprehensive Multi-year Plan (2012–
2016). Maputo: Ministry of Health [Mozambique]
MOZAMBIQUE Produced by UW GH START Program, May 2012 46
ii. Profiles of providers who immunize people
“In each facility one health worker is responsible for the EPI. It is usually the mid-wife who also holds
multiple health care program responsibilities, for example, maternal health care.” (Mavimbe 2005)
“Generally the cadre responsible [for immunization] are “agentes preventivas”—which are just below
nurses in seniority in the Mozambican system. Nurses or “tecnicos preventivas” may also give
immunizations, but less often. Most health facilities outside of district and provincial hospitals have
VERY few staff (2-3), so people wear many hats.” (S. Gimbell, personal communication, May 2, 2012)
Sources Mavimbe J. et al. (2005). Assessing immunization data quality from routine reports in Mozambique. BMC Public Health, 5:108
E. PERFORMANCE MANAGEMENT AND TRAINING
i. Immunization responsibilities at the federal, state, district, village levels and ratios (number of HCWs per supervisor)
Central level
Set policies, standards, and priorities
Build capacity (not further defined)
Coordinate with partners
Mobilize resources
Procure inputs such as vaccines
Monitor and provide technical support to the provincial level
Provincial level
Build capacity (not further defined)
Monitor, supervise and provide technical support to the district level
District level
Plan, manage and deliver EPI services
Community level
Mobilize and bring children in for immunization
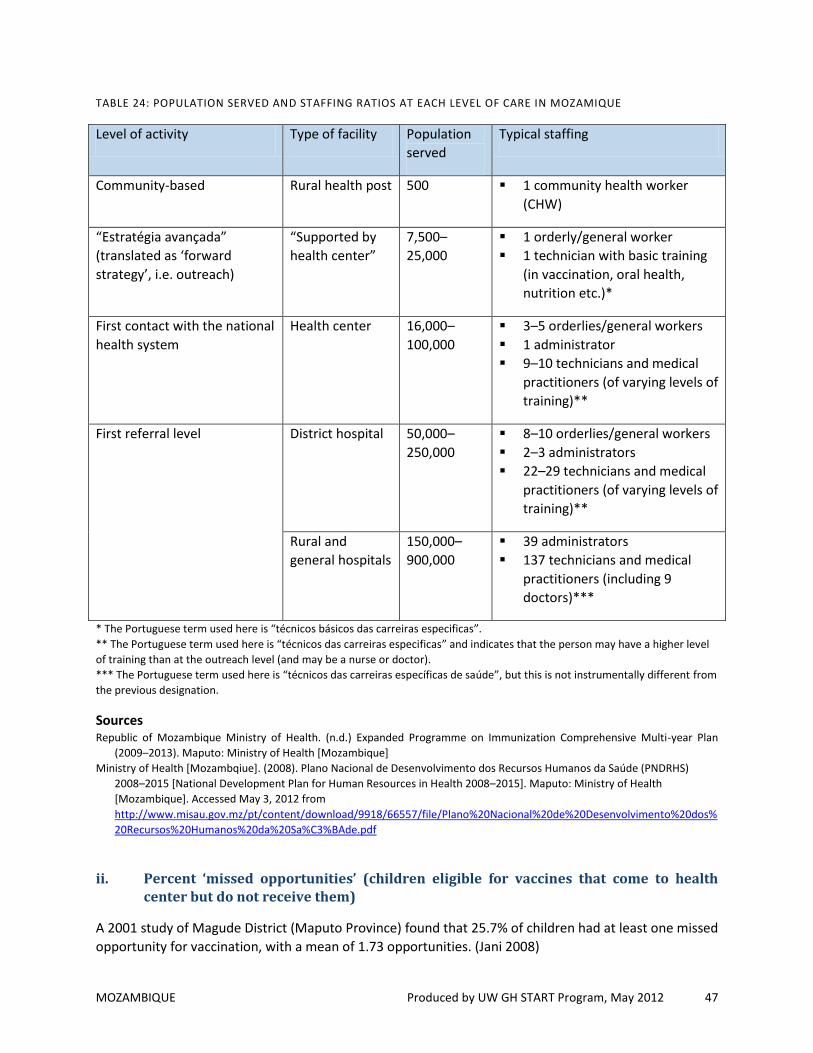
MOZAMBIQUE Produced by UW GH START Program, May 2012 47
TABLE 24: POPULATION SERVED AND STAFFING RATIOS AT EACH LEVEL OF CARE IN MOZAMIQUE
Level of activity Type of facility Population
served
Typical staffing
Community-based Rural health post 500 1 community health worker
(CHW)
“Estratégia avançada”
(translated as ‘forward
strategy’, i.e. outreach)
“Supported by
health center”
7,500–
25,000
1 orderly/general worker
1 technician with basic training
(in vaccination, oral health,
nutrition etc.)*
First contact with the national
health system
Health center 16,000–
100,000
3–5 orderlies/general workers
1 administrator
9–10 technicians and medical
practitioners (of varying levels of
training)**
First referral level District hospital 50,000–
250,000
8–10 orderlies/general workers
2–3 administrators
22–29 technicians and medical
practitioners (of varying levels of
training)**
Rural and
general hospitals
150,000–
900,000
39 administrators
137 technicians and medical
practitioners (including 9
doctors)***
* The Portuguese term used here is “técnicos básicos das carreiras especificas”.
** The Portuguese term used here is “técnicos das carreiras especificas” and indicates that the person may have a higher level
of training than at the outreach level (and may be a nurse or doctor).
*** The Portuguese term used here is “técnicos das carreiras específicas de saúde”, but this is not instrumentally different from
the previous designation.
Sources Republic of Mozambique Ministry of Health. (n.d.) Expanded Programme on Immunization Comprehensive Multi-year Plan
(2009–2013). Maputo: Ministry of Health [Mozambique]
Ministry of Health [Mozambqiue]. (2008). Plano Nacional de Desenvolvimento dos Recursos Humanos da Saúde (PNDRHS)
2008–2015 [National Development Plan for Human Resources in Health 2008–2015]. Maputo: Ministry of Health
[Mozambique]. Accessed May 3, 2012 from
http://www.misau.gov.mz/pt/content/download/9918/66557/file/Plano%20Nacional%20de%20Desenvolvimento%20dos%
20Recursos%20Humanos%20da%20Sa%C3%BAde.pdf
ii. Percent ‘missed opportunities’ (children eligible for vaccines that come to health center but do not receive them)
A 2001 study of Magude District (Maputo Province) found that 25.7% of children had at least one missed
opportunity for vaccination, with a mean of 1.73 opportunities. (Jani 2008)

MOZAMBIQUE Produced by UW GH START Program, May 2012 48
Household surveys conducted in Niassa and Cabo Delgado in 2010 found that approximately 40% of
respondents reported not receiving a vaccine for their child while visiting a health center. The two most
common reasons cited were a lack of vaccines in the health center and vaccines not being offered that
day. (VillageReach 2010—Niassa and Cabo Delgado)
A 2002/3 study in three provinces found that 15.7% of children who received their first polio or DPT-
HepB vaccine did not receive the other vaccine on the same day. Among children who had been
weighed five times, 18.1% had not received one or more of the BCG, polio (x3) or DPT-HepB (x3)
vaccines (there was substantial provincial variation, with 10.7% missing one or more vaccines in Gaza,
20.9% in Zambezia, and 27.2% in Nampula). (Sheldon 2003)
Sources Jani, J. et al. (2008). Risk factors for incomplete vaccination and missed opportunity for immunization in rural Mozambique.
BMC Public Health, 8:161
VillageReach. (2010). Vaccine Coverage and Vaccine and Rapid Diagnosis Tests Logistics Study—Niassa. Accessed May 1, 2012
from http://villagereach.org/vrsite/wp-content/uploads/2011/05/Vaccine-CovrageReport-Niassa-Final.pdf
VillageReach. (2010). Vaccine Coverage and Vaccine and Rapid Diagnosis Tests Logistics Study—Cabo Delgado. Accessed May 1,
2012 from http://villagereach.org/vrsite/wp-content/uploads/2011/05/Final-Vaccine-CovrageReport-Cabo-
Delgado_FINAL.pdf
Sheldon, S. and Alons, C. (2003). A Study to Describe Barriers to Childhood Vaccination in Mozambique. Accessed on May 10,
2012 from http://pdf.usaid.gov/pdf_docs/PNACW518.pdf
iii. Summary of any other performance metrics captured by the MoH or other organization (e.g., no. of supervisory visits)
A small 2005 study (Mavimbe) from one district in Niassa Province found inconsistencies between tally
sheets, facility reports, and district reports in terms of the counts of vaccinated children. Typically,
facility reports were higher than the individual tally sheets from within that facility. However, the facility
that performed the bulk of the vaccinations produced facility reports that were concordant with the
tally sheets, so numbers in the district reports were not substantially inflated.
Another data quality study of 9 facilities in three districts in Sofala Province found 85% concordance
over a 6-month period between facility clinical registers and monthly facility reports for DTP3. Most
discordance occurred in urban facilities. The same study compared DTP3 coverage with the DHS and
MICS surveys. There was generally good agreement between the sources, but the health information
system indicated a higher coverage level than the MICS estimates for 2006 and 2007, the most recent
years for which data were available. (Gimbel 2011)

MOZAMBIQUE Produced by UW GH START Program, May 2012 49
TABLE 25: VACCINE WASTAGE (%) IN MOZAMQIUE BY VACCINE AND YEAR
Vaccine 2011 2010 2009 2008 2007 2006
BCG 51
DTP 18
HepB 18
Hib 18
Polio 14
MCV 33
Tetanus
Sources Mavimbe J. et al. (2005). Assessing immunization data quality from routine reports in Mozambique. BMC Public Health, 5:108
Gimbel, S. et al. (2011) An assessment of routine primary care health information system data quality in Sofala Province,
Mozambique. Population Health Metrics, 9:12
Vaccine schedule: WHO Vaccine Preventable Diseases Monitoring System
(http://apps.who.int/immunization_monitoring/en/globalsummary/countryprofileselect.cfm)
F. COMMUNITY ENGAGEMENT
i. Distribution of health posts/health centers compared to population density
TABLE 26: NUMBER AND DENSITY OF HEALTH FACILITIES IN EACH PROVINCE OF MOZAMBIQUE, BY TYPE
(NATIONAL INVENTORY OF INFRASTRUCTURE, HEALTH RESOURCES AND SERVICES 2007)
Province Population Health level No. health units I II III IV
No. Pop. /facility
No. Pop. /facility
No. No.
Niassa 1,178,117 135 8,727 1 1,178,117 1 137
Cabo Delgado 1,632,809 95 17,187 4 408,202 1 100
Nampula 4,076,642 183 22,277 8 509,580 2 193
Zambézia 3,892,854 172 22,633 6 648,809 1 179
Tete 1,832,339 98 18,697 3 610,780 1 102
Manica 1,418,927 78 18,428 4 354,732 1 83
Sofala 1,654,163 134 12,345 4 413,541 1 139
Inhambane 1,267,035 101 12,545 2 633,518 1 104
Gaza 1,219,013 123 9,911 4 304,753 1 128
Maputo Province
1,259,713 78 17,496 2 629,857 80
Maputo City 1,099,102 27 40,707 3 366,367 2 32
Total 20,530,714 1,224 16,773 41 500,749 7 5 1,277
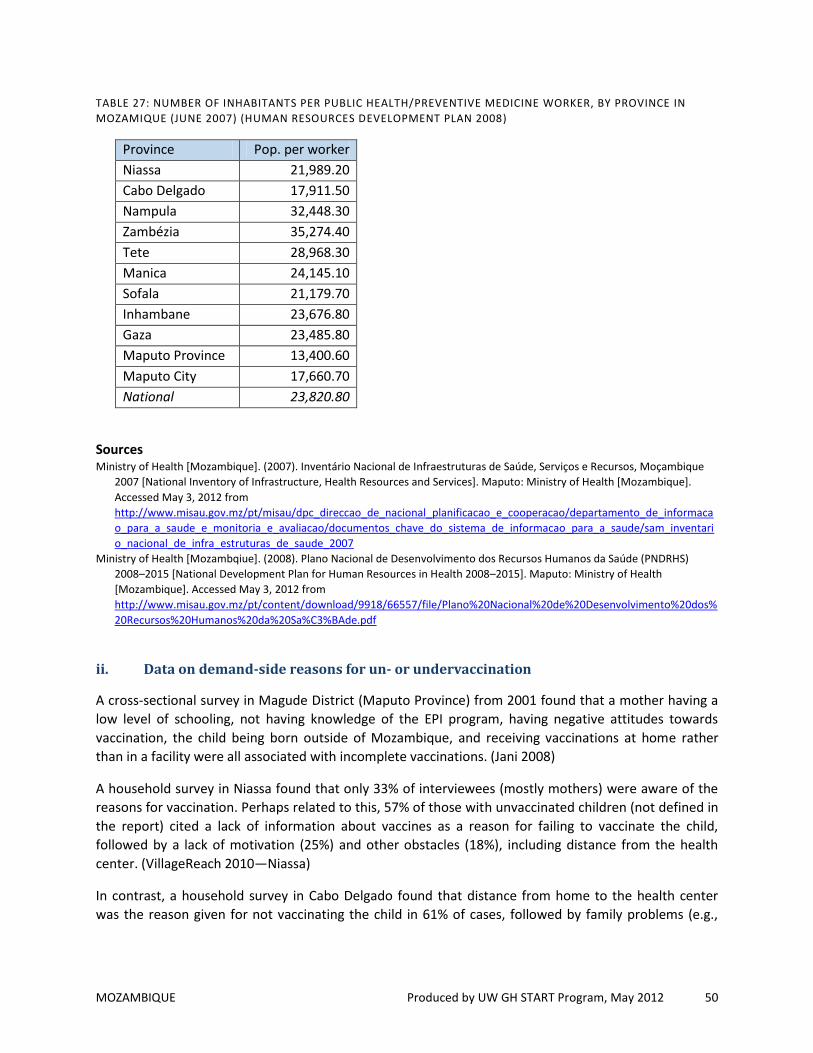
MOZAMBIQUE Produced by UW GH START Program, May 2012 50
TABLE 27: NUMBER OF INHABITANTS PER PUBLIC HEALTH/PREVENTIVE MEDICINE WORKER, BY PROVINCE IN
MOZAMIQUE (JUNE 2007) (HUMAN RESOURCES DEVELOPMENT PLAN 2008)
Province Pop. per worker
Niassa 21,989.20
Cabo Delgado 17,911.50
Nampula 32,448.30
Zambézia 35,274.40
Tete 28,968.30
Manica 24,145.10
Sofala 21,179.70
Inhambane 23,676.80
Gaza 23,485.80
Maputo Province 13,400.60
Maputo City 17,660.70
National 23,820.80
Sources Ministry of Health [Mozambique]. (2007). Inventário Nacional de Infraestruturas de Saúde, Serviços e Recursos, Moçambique
2007 [National Inventory of Infrastructure, Health Resources and Services]. Maputo: Ministry of Health [Mozambique].
Accessed May 3, 2012 from
http://www.misau.gov.mz/pt/misau/dpc_direccao_de_nacional_planificacao_e_cooperacao/departamento_de_informaca
o_para_a_saude_e_monitoria_e_avaliacao/documentos_chave_do_sistema_de_informacao_para_a_saude/sam_inventari
o_nacional_de_infra_estruturas_de_saude_2007
Ministry of Health [Mozambqiue]. (2008). Plano Nacional de Desenvolvimento dos Recursos Humanos da Saúde (PNDRHS)
2008–2015 [National Development Plan for Human Resources in Health 2008–2015]. Maputo: Ministry of Health
[Mozambique]. Accessed May 3, 2012 from
http://www.misau.gov.mz/pt/content/download/9918/66557/file/Plano%20Nacional%20de%20Desenvolvimento%20dos%
20Recursos%20Humanos%20da%20Sa%C3%BAde.pdf
ii. Data on demand-side reasons for un- or undervaccination
A cross-sectional survey in Magude District (Maputo Province) from 2001 found that a mother having a
low level of schooling, not having knowledge of the EPI program, having negative attitudes towards
vaccination, the child being born outside of Mozambique, and receiving vaccinations at home rather
than in a facility were all associated with incomplete vaccinations. (Jani 2008)
A household survey in Niassa found that only 33% of interviewees (mostly mothers) were aware of the
reasons for vaccination. Perhaps related to this, 57% of those with unvaccinated children (not defined in
the report) cited a lack of information about vaccines as a reason for failing to vaccinate the child,
followed by a lack of motivation (25%) and other obstacles (18%), including distance from the health
center. (VillageReach 2010—Niassa)
In contrast, a household survey in Cabo Delgado found that distance from home to the health center
was the reason given for not vaccinating the child in 61% of cases, followed by family problems (e.g.,
MOZAMBIQUE Produced by UW GH START Program, May 2012 51
illness in the family) in 13% of cases. A lack of information about vaccines was mentioned by 4% of
respondents. (VillageReach 2010—Cabo Delgado)
A study of four districts in three provinces (selected to represent a range of vaccination coverage levels)
found that among mothers whose child had never received a vaccine, over half cited distance to the
vaccination site as a reason for not immunizing their child (the figure in the report was 51.5% but
multiple responses were allowed so this actual proportion may be higher). Negative perceptions of the
vaccine (e.g., that it is ineffective or even causes disease), were not mentioned often as causes. (Sheldon
2003)
Sources Jani, J. et al. (2008). Risk factors for incomplete vaccination and missed opportunity for immunization in rural Mozambique.
BMC Public Health, 8:161
VillageReach. (2010). Vaccine Coverage and Vaccine and Rapid Diagnosis Tests Logistics Study—Niassa. Accessed May 1, 2012
from http://villagereach.org/vrsite/wp-content/uploads/2011/05/Vaccine-CovrageReport-Niassa-Final.pdf
VillageReach. (2010). Vaccine Coverage and Vaccine and Rapid Diagnosis Tests Logistics Study—Cabo Delgado. Accessed May 1,
2012 from http://villagereach.org/vrsite/wp-content/uploads/2011/05/Final-Vaccine-CovrageReport-Cabo-
Delgado_FINAL.pdf
Sheldon, S. and Alons, C. (2003). A Study to Describe Barriers to Childhood Vaccination in Mozambique. Accessed on May 10,
2012 from http://pdf.usaid.gov/pdf_docs/PNACW518.pdf
iii. Data on level of public trust
Though no studies were found that focused specifically on public trust, the studies mentioned in the
preceding section indicate generally high levels of support for vaccination among caregivers. This is
reinforced by the opinions of START’s contacts who work in Mozambique. It appears that structural
weaknesses in healthcare infrastructure are largely responsible for low vaccination rates.
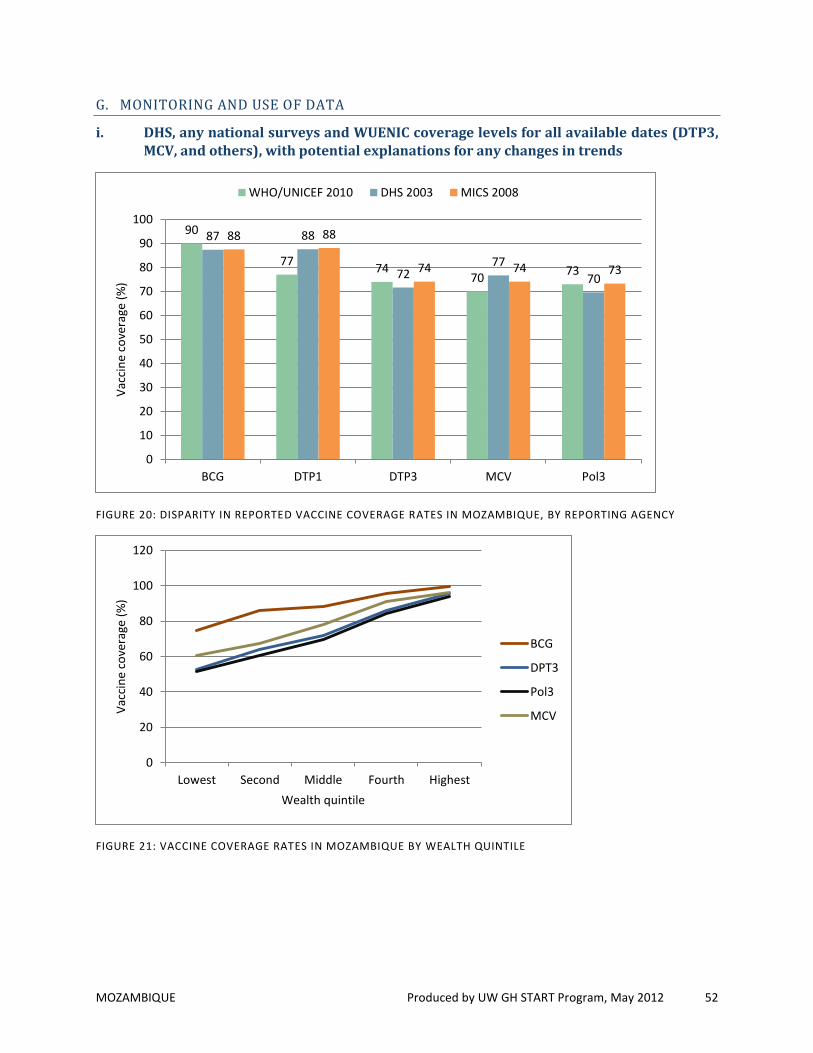
MOZAMBIQUE Produced by UW GH START Program, May 2012 52
G. MONITORING AND USE OF DATA
i. DHS, any national surveys and WUENIC coverage levels for all available dates (DTP3, MCV, and others), with potential explanations for any changes in trends
FIGURE 20: DISPARITY IN REPORTED VACCINE COVERAGE RATES IN MOZAMBIQUE, BY REPORTING AGENCY
FIGURE 21: VACCINE COVERAGE RATES IN MOZAMBIQUE BY WEALTH QUINTILE
90
77 74
70 73
87 88
72 77
70
88 88
74 74 73
0
10
20
30
40
50
60
70
80
90
100
BCG DTP1 DTP3 MCV Pol3
Vac
cin
e co
vera
ge (
%)
WHO/UNICEF 2010 DHS 2003 MICS 2008
0
20
40
60
80
100
120
Lowest Second Middle Fourth Highest
Vac
cin
e co
vera
ge (
%)
Wealth quintile
BCG
DPT3
Pol3
MCV
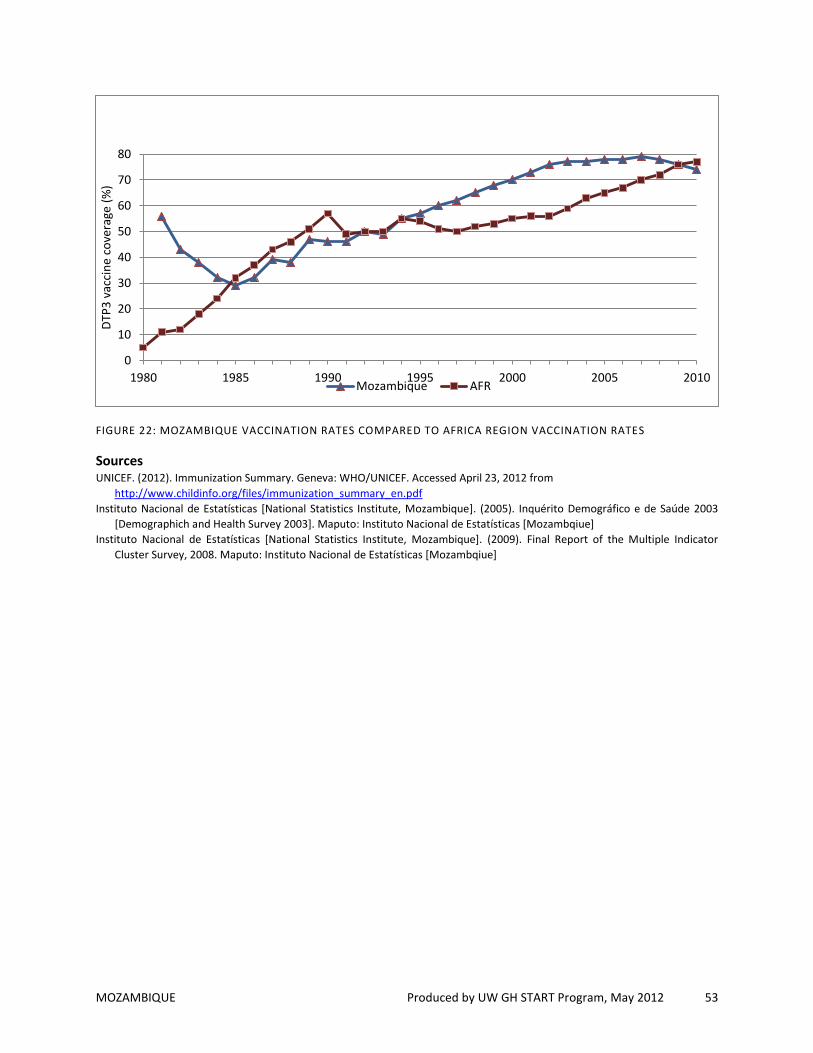
MOZAMBIQUE Produced by UW GH START Program, May 2012 53
FIGURE 22: MOZAMBIQUE VACCINATION RATES COMPARED TO AFRICA REGION VACCINATION RATES
Sources UNICEF. (2012). Immunization Summary. Geneva: WHO/UNICEF. Accessed April 23, 2012 from
http://www.childinfo.org/files/immunization_summary_en.pdf
Instituto Nacional de Estatísticas [National Statistics Institute, Mozambique]. (2005). Inquérito Demográfico e de Saúde 2003
[Demographich and Health Survey 2003]. Maputo: Instituto Nacional de Estatísticas [Mozambqiue]
Instituto Nacional de Estatísticas [National Statistics Institute, Mozambique]. (2009). Final Report of the Multiple Indicator
Cluster Survey, 2008. Maputo: Instituto Nacional de Estatísticas [Mozambqiue]
0
10
20
30
40
50
60
70
80
1980 1985 1990 1995 2000 2005 2010
DTP
3 v
acci
ne
cove
rage
(%
)
Mozambique AFR

MOZAMBIQUE Produced by UW GH START Program, May 2012 54
ii. Reported measles cases compared to MCV coverage 1980-2010, with note if SIA’s occurred
FIGURE 21: REPORTED MEASLES CASES COMPARED TO MCV COVERAGE IN MOZAMBIQUE, OVER TIME
Sources Mandomando, I. et al. (2011). Assessment of the epidemiology and burden of measles in Southern Mozambique. Am J Trop
Med Hyg, 85(1):146–51
UNICEF. (2012). Immunization Summary. Geneva: WHO/UNICEF. Accessed April 23, 2012 from
http://www.childinfo.org/files/immunization_summary_en.pdf
WHO. (2011). Reported Incidence Time Series. Geneva: WHO. Accessed April 12, 2012 from
http://www.who.int/entity/immunization_monitoring/data/incidence_series.xls
0
20
40
60
80
100
0
5000
10000
15000
20000
25000
30000
35000
19
80
19
81
19
82
19
83
19
84
19
85
19
86
19
87
19
88
19
89
19
90
19
91
19
92
19
93
19
94
19
95
19
96
19
97
19
98
19
99
20
00
20
01
20
02
20
03
20
04
20
05
20
06
20
07
20
08
20
09
20
10
Vac
cin
e co
vera
ge (
%)
Mea
sles
cas
es
Measles cases MCV coverage
SIAs (year and pop. reached) 2005: 8.2M 2010: 3.6M 2008: 3.3M
Measles outbreak with case fatality of 8/1,000