assessment of learning...
TRANSCRIPT
138
CHAPTER FIVE
ASSESSMENT OFLEARNING DISABILITIES
CHAPTER OUTLINE
INTRODUCTION
BROAD PURPOSES OF ASSESSMENT
ASSESSMENT FOR ELIGIBILITY DECISIONSPsychological ProcessesDiscrepancy CriteriaExclusionary ClauseResponse to Intervention
SAMPLE ELIGIBILITY REPORTS
Psychoeducational Team Assessment ReportEducational Consultant’s Evaluation
Cultural Diversity and Eligibility Decisions
ASSESSMENT FOR INSTRUCTION
Norm-Referenced Achievement TestingObservational ReportsCriterion-Referenced TestingCurriculum-Based AssessmentIn-Class Assessment PracticesInnovative Assessment PracticesOther Issues in Assessment
SUMMARY
ch05.indd 138ch05.indd 138 4/16/2007 8:08:02 AM4/16/2007 8:08:02 AM
CHAPTER FIVE ASSESSMENT OF LEARNING DISABILITIES 139
WHEN YOU COMPLETE THIS CHAPTER, YOU SHOULD BE ABLE TO:
1. Describe an assessment eligibility report that is based on ability-achievement discrepancies.
2. Describe an RTI assessment procedure.
3. Review a child-study team report to determine the type of perspective underlying the evaluation.
4. Identify the types of assessment information useful for eligibility decisions and instructional decisions.
5. Demonstrate a simple task analysis as an in-class assessment device.
6. List the types of daily work that should be used as informal assessments in child-study team meetings.
7. Describe the calculation of an ability-achievement discrepancy coupled with RTI as a basis for the eligibility decision.
KEYWORDS
intelligence testingeligibilityIEPcurriculum-based assessmentcriterion-referenced testingWISC-IIIsubtest scatterdiscrepancy
standard-score discrepancyregression-based discrepancyresponse to intervention (RTI)educational consultantnorm-referenced testsprereferral reporttask analysiserror analysis
authentic assessmentportfolio assessmentdynamic assessmentstrength-based assessmentminimum competency tests
INTRODUCTION
The purpose of this chapter is to present the various assessment options currently in use with children who have learning disabilities, in the context of the information that has al-ready been presented in the case-study reports, the history, and the perspectives on learning disabilities. Frequent references will be made to the case-study reports and the various per-spectives on learning disabilities discussed in Chapter 1, and the individualized educational plans (IEPs) in the Appendix. Therefore, this chapter on assessment is intended to provide a gestalt experience in which your understanding of the field of learning disabilities comes together and you perceive the diverse perspectives and assessment procedures as a mean-ingful whole. Also, it may be useful to reexamine the information in the earlier chapters as you read.
ch05.indd 139ch05.indd 139 4/16/2007 8:08:07 AM4/16/2007 8:08:07 AM
140 SECTION I INTRODUCTION TO LEARNING DISABILITIES
BROAD PURPOSES OF ASSESSMENT
In special education, assessment is mandated for several reasons. First of all, assessment was historically seen as one method of protecting the interests of the child (Commission for Excellence in Special Education, 2001; NJCLD, 2005). For example, in earlier years in school systems that had classes for students with mental retardation, if a particular child became disruptive and did not complete the homework assignment, the teacher may have wanted to remove that child from the class. One convenient way to accomplish this was to ship the child out to a special education class, even though the child may not have been retarded. Intelligence testing, conducted on an individual basis, was intended to prevent this type of disservice to the child.
Second, there is a need in the schools to identify children who need help earlier (Fuchs & Fuchs, 2006). Many children occasionally fail a semester or grade, but not every child who fails is disabled (Commission, 2001). Failure can occur for a number of other reasons, ranging from disruptions at home to incomplete homework assignments. Clearly, the schools need some mechanism by which to screen children in order to decide which children demonstrate failure resulting from a learning disability. Therefore, a major reason for individualized assessment is the need to document the eligibility of a particular child for a particular type of special educational service provided by the school.
Another reason for assessment is the need to document the actual levels of perfor-mance on various classroom tasks in order to provide an individualized educational plan (IEP) (Commission, 2001). This need led to the recent emphasis on curriculum-based assessment. Much of the recent research in assessment has been directed toward assess-ment for instruction (Bryant, 1999; Jones, 2001), and almost all this research has demon-strated the effectiveness of periodic assessments conducted by the teacher on a weekly, biweekly, or daily basis (Fuchs & Fuchs, 2005; Jones, 2001). Theorists have argued that special education assessment, by virtue of being totally individualized, should compare a child’s performance with a stated list of criteria or behavioral objectives that the child must master, rather than an arbitrary score derived from a norm group of children on a particular test (NJCLD, 2005). Consequently, concepts such as criterion-referenced testing, task analysis, curriculum-based assessment, and responsiveness to instruction have received increasing research emphasis. However, prior to discussion of these innovations, it is nec-essary to understand the use of psychometric assessment in identification of students with learning disabilities.
ASSESSMENT FOR ELIGIBILITY DECISIONS
As demonstrated in the discussion on definitions, and the recent passage of IDEA 2004, determining whether or not a child has a learning disability is a task about which there is little consensus at present (Commission, 2001; Gersten & Dimino, 2006; NJCLD, 2005). Consequently it is difficult to report on the best method to identify children or adolescents with learning disabilities. Since substantial change in how students’ learning disabilities are documented can be expected in coming years, the most appropriate approach meanwhile
ch05.indd 140ch05.indd 140 4/16/2007 8:08:07 AM4/16/2007 8:08:07 AM

CHAPTER FIVE ASSESSMENT OF LEARNING DISABILITIES 141
should include understanding both the new eligibility procedures as well as the more re-cently implemented eligibility procedures for documentation of a learning disability.
At present, new teachers in the field will probably be exposed to both more traditional eligibility procedures for documenting a learning disability as well as the more recently developed response-to-intervention procedures. In the sections below, the text will present the more traditional eligibility assessment procedures first, as listed in Figure 5.1, and sub-sequently a discussion of response-to-intervention procedures.
FIGURE 5.1 Assessment for Eligibility
COMPONENTS OF LD DEFINITION COMMON ASSESSMENTS
I. Psychological processing problem
IQ assessment WISC-III
(Subtest scatter/verbal) Stanford-Binet
Performance deficit/subtest regrouping Woodcock-JohnsonKaufman Assessment Battery for Children (K-ABC)
Visual-perception/visual-motor Bender GestaltWoodcock-JohnsonWISC-III
Auditory perception/language Test of Language DevelopmentWoodcock-JohnsonWISC-III
II. DiscrepancyIntraindividual differences Woodcock-Johnson
WISC-III
Ability-achievement discrepancy WISC-IIIWoodcock-JohnsonPeabody Individual Achievement Test– Revised (PIATr)Test of Written LanguageK-ABC
III. Exclusionary clause
MR IQ tests
Behavioral disorders Class observationsTeacher ratings of behaviorSociometric ratings
Mental disability Physician’s examination
Cultural/environmental/economic Examination of school recordsHistory of speech improvements
ch05.indd 141ch05.indd 141 4/16/2007 8:08:07 AM4/16/2007 8:08:07 AM
142 SECTION I INTRODUCTION TO LEARNING DISABILITIES
Psychological Processes
The psychological processes component of the definition is intended to focus on the types of ability deficits that may prohibit learning. Consequently, many tests of auditory and visual perception or motor control can be subsumed under this component. The use of intel-ligence tests to demonstrate deficits or developmental imbalances in psychological process-ing also represents an attempt to effectively quantify the psychological process component of the definition.
Intelligence Assessment. Currently, the Wechsler Intelligence Scale for Children, Third Edition (WISC-III), is the most commonly used assessment for measuring intelligence in children with learning disabilities. Other commonly used tests include the cognitive sec-tion of the Woodcock-Johnson Psychoeducational Battery, the Stanford-Binet Intelligence Scale, and the Kaufman Assessment Battery for Children.
The use of intelligence tests to document deficits in the basic psychological processes has been repeatedly attempted, and the roots of these efforts spring from the concept of “developmental imbalances.” Developmental imbalance may best be understood as an un-even pattern of development, such that a student may function on grade level in math but significantly below grade level in reading. Thus, an imbalance will be shown when his or her academic scores in these areas are compared.
Most of the suggestions for documenting a developmental imbalance have used one of the standard IQ measures mentioned previously. For example, the subtests on the WISC-III (Wechsler, 1991) may be used to calculate a single score on general intelligence, but they may also be used to calculate two different scores: verbal intelligence and performance intelligence. Here the verbal IQ would represent language-based learning, and the perfor-mance IQ would represent visual interpretation, synthesis, and the ability to copy designs. If these two scores were widely discrepant, a developmental imbalance could, presumably, be identified and would account for a learning disability. While this distinction between verbal IQ and performance IQ will be discussed in the occasional assessment report, this concept is now considered discredited (Commission, 2001; Siegel, 1999).
Another conceptualization of this developmental imbalance idea involves analysis of subtest scatter, or how the scores on an IQ assessment are grouped (Watkins, 1996). If the range of the individual subtest scores is unusually high, this would tend to indicate an imbalance in normal cognitive development. However, numerous theorists have raised questions about the appropriateness of these types of calculations (Watkins, 1996), and like the development imbalances approach described previously, the subtest scatter concept has been discredited. However, many practitioners in the field still attempt to utilize this rationale in describing a learning disability, and you may find such a rationale in various assessment reports even today. Thus, you should be aware of this logic and the unproven theoretical rationale on which it is based.
Visual-Perceptal and Visual-Motor Tests. The most common visual-perceptual and visual-motor tests used today are the Bender Visual Motor Gestalt Test and the Develop-mental Tests of Visual Motor Integration. Although most intelligence tests include some subtests that are basically visual in nature, IQ tests are not included in this general domain
ch05.indd 142ch05.indd 142 4/16/2007 8:08:07 AM4/16/2007 8:08:07 AM
CHAPTER FIVE ASSESSMENT OF LEARNING DISABILITIES 143
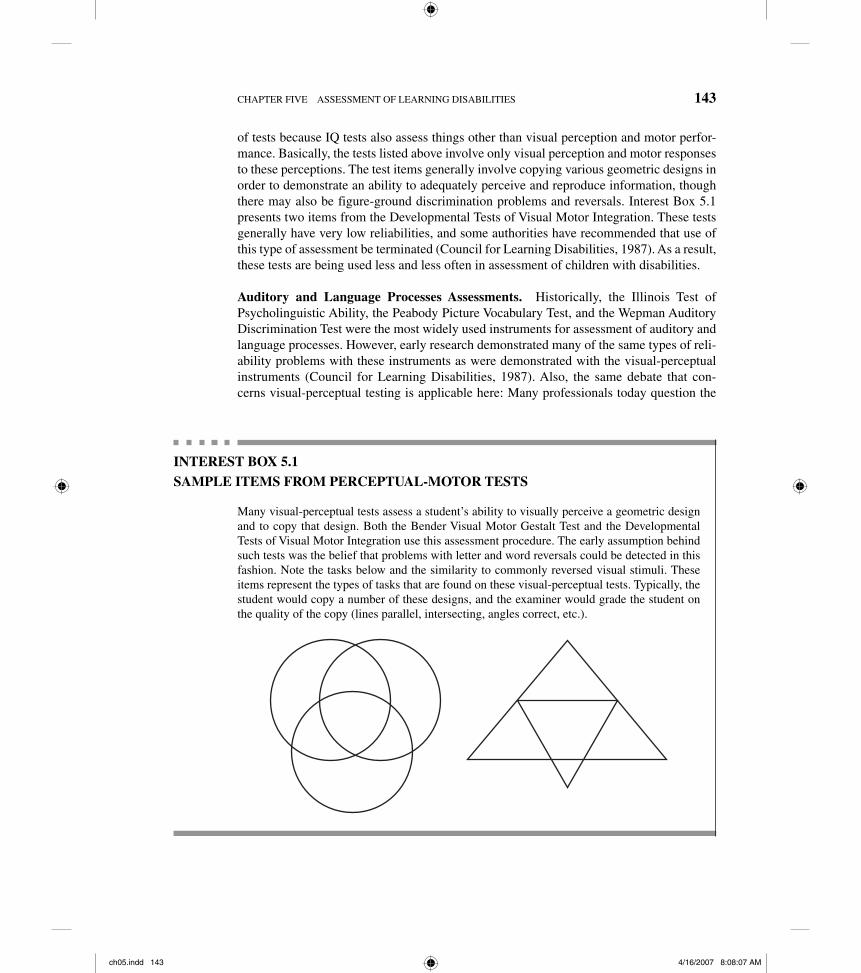
of tests because IQ tests also assess things other than visual perception and motor perfor-mance. Basically, the tests listed above involve only visual perception and motor responses to these perceptions. The test items generally involve copying various geometric designs in order to demonstrate an ability to adequately perceive and reproduce information, though there may also be figure-ground discrimination problems and reversals. Interest Box 5.1 presents two items from the Developmental Tests of Visual Motor Integration. These tests generally have very low reliabilities, and some authorities have recommended that use of this type of assessment be terminated (Council for Learning Disabilities, 1987). As a result, these tests are being used less and less often in assessment of children with disabilities.
Auditory and Language Processes Assessments. Historically, the Illinois Test of Psycho linguistic Ability, the Peabody Picture Vocabulary Test, and the Wepman Auditory Discrimination Test were the most widely used instruments for assessment of auditory and language processes. However, early research demonstrated many of the same types of reli-ability problems with these instruments as were demonstrated with the visual- perceptual instruments (Council for Learning Disabilities, 1987). Also, the same debate that con-cerns visual-perceptual testing is applicable here: Many professionals today question the
INTEREST BOX 5.1SAMPLE ITEMS FROM PERCEPTUAL-MOTOR TESTS
Many visual-perceptual tests assess a student’s ability to visually perceive a geometric design and to copy that design. Both the Bender Visual Motor Gestalt Test and the Developmental Tests of Visual Motor Integration use this assessment procedure. The early assumption behind such tests was the belief that problems with letter and word reversals could be detected in this fashion. Note the tasks below and the similarity to commonly reversed visual stimuli. These items represent the types of tasks that are found on these visual-perceptual tests. Typically, the student would copy a number of these designs, and the examiner would grade the student on the quality of the copy (lines parallel, intersecting, angles correct, etc.).
ch05.indd 143ch05.indd 143 4/16/2007 8:08:07 AM4/16/2007 8:08:07 AM
144 SECTION I INTRODUCTION TO LEARNING DISABILITIES
usefulness of these assessment instruments. However, many speech clinicians and learning disabilities teachers use various sections of these tests to assess language usage and supple-ment these assessments with classroom observations or recorded samples of children’s language output.
A host of more recently developed instruments has been designed to assess language functioning. For example, the Tests of Language Development, which come in either a pri-mary or intermediate version, are the most widely used assessments of language today. Like-wise, the recent assessments by Wiig (the Let’s Talk Inventory for Children or Adolescents) are well-designed assessments of language. These assessments are much more acceptable, from a technical assessment perspective, than the assessments that were utilized earlier.
Many intelligence tests have sections or subtests that provide information on verbal abilities and receptive or expressive language. Consequently, most professionals who need this type of information today utilize a verbal score from one of the frequently used tests of intelligence.
Process Testing Revisited. Assessment of basic psychological processes or ability defi-cits grew from the early medical assumptions in the field. Both the perceptual-motor theo-rists and the language theorists produced assessments that were later shown to be less than technically adequate for educational purposes (Ysseldyke, 1983). More recently, the use of standardized IQ assessments as a basis to document these psychological processes (Com-mission, 2001) has become commonplace. However, in some areas, newer assessments that are more acceptable technically have been developed.
As professionals, each of you will have to take responsibility for decisions regarding assessment of psychological processes or ability deficits. For example, as a student, you should be aware of the debate concerning the use of these tests, and as a teacher (or future teacher), you should realize that many different perspectives concerning these tests are possible. Will you use these tests or sit as a member of a team that uses these tests to make educational decisions? What additional evidence is necessary in order to supplement the assessment findings in these areas? All these questions are unanswered at present. Perhaps the best strategy is to discuss these concerns with the director of special education in your district in order to find out the local and state perspectives regarding the use of these instru-ments. However, at this point, it must be stated that accurate, technically sound assessment of basic psychological processes is not possible psychometrically, given the low reliability and validity of most of these instruments (CLD, 1987).
Discrepancy Criteria
The belief that children with learning disabilities have a problem in school subjects prompted the discrepancy concept. In a very basic sense, would an educator wish to pro-vide a specialized—and thus more expensive—program to a child who was capable of reaching his or her potential in the general education class without any modifications? The original discrepancy concept was merely an attempt to demonstrate that a child needed some type of extra assistance.
However, with the failure of assessments of psychological processes, the discrepancy component became the only defensible operationalized aspect of the definition. Conse-
ch05.indd 144ch05.indd 144 4/16/2007 8:08:07 AM4/16/2007 8:08:07 AM
CHAPTER FIVE ASSESSMENT OF LEARNING DISABILITIES 145
quently, many states now employ versions of this concept, and practitioners rely on this aspect of the definition more than on measures of psychological processes during the eli-gibility phase of assessment.
The ability-achievement discrepancy states that a child has a major deficit in some area of school achievement compared to his or her potential. This concept has had at least four major variations over the last 20 years, though only the most recent two aspects of this concept are directly relevant today (Commission, 2001). Interest Box 5.2 presents the historical development of the concept.
Standard-Score Discrepancies. Many states and local districts employ a standard-score discrepancy procedure for identification of learning disabilities (Commission, 2001; NJCLD, 2005). In this procedure, scores from an intelligence test and an achievement test—usually a reading achievement test—that have the same mean and standard deviation are obtained. The achievement score is then subtracted from the intelligence test score, and if the discrepancy is great enough, a learning disability has been documented.
Because many tests will yield scores that have a mean of 100 and a standard deviation of 15, this procedure is relatively easy for teachers and child-study team members to use.
INTEREST BOX 5.2
DISCREPANCY FORMULAS
There have been four major types of ability-achievement discrepancy calculations.
1. Some practitioners began to calculate a discrepancy between grade placement and achievement level by merely subtracting the latter from the former. This procedure sug-gested that a fifth-grader who was reading at a second-grade level must be disabled.
2. The “formula” calculations were the next to evolve. Because the procedure above did not take into account the child’s level of intelligence, numerous theorists developed formulas that did. These formulas usually involved calculation of an expected achievement based on intelligence and grade placement, which was then compared to actual achievement to indicate a discrepancy.
3. Standard-score calculations were developed next. The formulas described above were generally based on mathematical manipulation of grade-equivalent scores (e.g., a 3.5 in reading). Calculations such as these are inappropriate mathematically because the stan-dard deviations of the different grade-equivalent scores are different. Consequently, the concept of a standardized-score comparison was developed, where the practitioner would obtain an IQ score and an achievement score based on tests that have the same mean and standard deviation. These scores are mathematically comparable.
4. The regression-score table was developed from the standard-score procedure. As any statistics student knows, repeated tests resulting in scores that are either very high or very low tend to yield scores that regress toward (or fall back toward) the mean, and this can create error. Thus, some states use regression tables, which are basically standard-score comparisons that take this regression into account.
ch05.indd 145ch05.indd 145 4/16/2007 8:08:07 AM4/16/2007 8:08:07 AM
146 SECTION I INTRODUCTION TO LEARNING DISABILITIES
For example, school districts in the state of North Carolina regularly employ this method. Both the Wechsler Intelligence Scale for Children, Third Edition, and the cognitive battery of the Woodcock-Johnson, Revised, will yield IQ scores of this nature. The reading sec-tion of the Woodcock-Johnson, Revised, and the Peabody Individual Achievement Test, Revised, provide reading and math achievement scores that employ this metric.
However, the federal government failed to provide guidelines on how large the discrepancy between ability and achievement had to be before a student is considered dis-abled. State and local education agencies have chosen to define this discrepancy at various levels. For example, the state of North Carolina uses a 15-point (or a 1-standard-deviation) discrepancy while the state of Georgia has indicated that a discrepancy of 20 points is necessary in order to be eligible for placement in a class for the learning disabled. Certain theorists have recommended a 2-standard-deviation discrepancy prior to labeling a child as learning disabled. Clearly, a small discrepancy cannot be the sole indicator of a learning dis-ability because, given the nature of standardized scores, as many as 17% of all public school students demonstrate a difference of 1 standard deviation between IQ and achievement. However, the smaller the discrepancy that is required, the more flexibility local decision makers have in assigning a child to a class for the learning disabled, and this desire for flex-ibility may be one reason the use of such procedures has continued. A sample discrepancy calculation is presented in Interest Box 5.3.
Regression-Based Discrepancy Tables. A mathematical problem with the standard-score discrepancy procedure was soon identified. When a student is administered a series of tests and the scores are correlated, the scores of that student will tend to regress toward the mean, particularly if the scores are notably higher or lower than the mean. Consequently, the standard-score discrepancy procedure is likely to be much less accurate for a student whose IQ is particularly high or particularly low. As a result of this mathematical phenome-non, some states have produced tables of information that take this regression phenomenon into account even though based on the standard-score discrepancy concept. This is known as regression-based discrepancy. For example, Iowa uses regression tables of this nature. In states that use a regression table, the assessment personnel administer the intelligence and achievement tests and use the chart to identify the minimum discrepancy necessary to document a learning disability given that particular level of intelligence.
Exclusionary Clause
Although the discrepancy formulations discussed previously have received research atten-tion, very little information is available on methods by which the exclusionary clause may be operationalized. For example, what types of data may be used to discriminate between a child with learning disabilities and some secondary behavioral problems and a child with behavior problems who also demonstrates achievement deficits? How are children who are culturally disadvantaged separated from children who are learning disabled, and how does a team of assessment professionals (which will include you, as a teacher) distinguish between a child who needs services in a class for the learning disabled, based on language deficits, and a child who needs a speech clinician’s assistance? These are questions for which there are no easy answers.
ch05.indd 146ch05.indd 146 4/16/2007 8:08:07 AM4/16/2007 8:08:07 AM
CHAPTER FIVE ASSESSMENT OF LEARNING DISABILITIES 147
This issue is further complicated by the nature of the exclusionary clause. The federal definition does not say that students with learning disabilities cannot also demonstrate other disabilities. Rather, the definition merely stipulates that those other conditions are believed to be secondary in nature and not the primary cause of the learning disability. Thus, a stu-dent with learning disabilities may also have secondary emotional or behavioral problems and/or come from an environmentally disadvantaged background.
Current practice and federal guidelines do give some indications concerning these distinctions. Because the last part of the definition indicates the conditions that are ex-cluded as the primary cause of the learning disability, part of the assessment process for
INTEREST BOX 5.3SAMPLE DISCREPANCY CALCULATION FOR ELIGIBILITY DETERMINATION
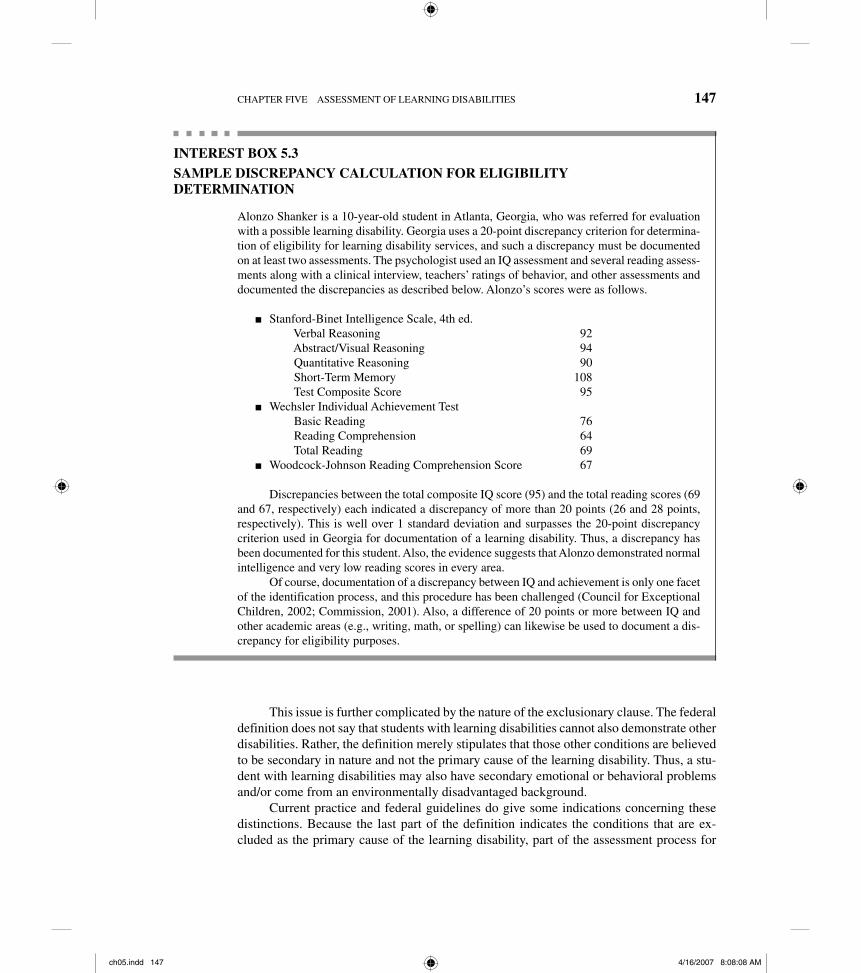
Alonzo Shanker is a 10-year-old student in Atlanta, Georgia, who was referred for evaluation with a possible learning disability. Georgia uses a 20-point discrepancy criterion for determina-tion of eligibility for learning disability services, and such a discrepancy must be documented on at least two assessments. The psychologist used an IQ assessment and several reading assess-ments along with a clinical interview, teachers’ ratings of behavior, and other assessments and documented the discrepancies as described below. Alonzo’s scores were as follows.
Stanford-Binet Intelligence Scale, 4th ed. Verbal Reasoning 92 Abstract/Visual Reasoning 94 Quantitative Reasoning 90 Short-Term Memory 108 Test Composite Score 95Wechsler Individual Achievement Test Basic Reading 76 Reading Comprehension 64 Total Reading 69Woodcock-Johnson Reading Comprehension Score 67
Discrepancies between the total composite IQ score (95) and the total reading scores (69 and 67, respectively) each indicated a discrepancy of more than 20 points (26 and 28 points, respectively). This is well over 1 standard deviation and surpasses the 20-point discrepancy criterion used in Georgia for documentation of a learning disability. Thus, a discrepancy has been documented for this student. Also, the evidence suggests that Alonzo demonstrated normal intelligence and very low reading scores in every area.
Of course, documentation of a discrepancy between IQ and achievement is only one facet of the identification process, and this procedure has been challenged (Council for Exceptional Children, 2002; Commission, 2001). Also, a difference of 20 points or more between IQ and other academic areas (e.g., writing, math, or spelling) can likewise be used to document a dis-crepancy for eligibility purposes.
■
■
■
ch05.indd 147ch05.indd 147 4/16/2007 8:08:08 AM4/16/2007 8:08:08 AM
148 SECTION I INTRODUCTION TO LEARNING DISABILITIES
determining potential learning disabilities in children is identification of the characteristics that would indicate the presence and severity of these other conditions.
Distinction: Mental Retardation. Children who are mentally retarded cannot techni-cally be learning disabled, though there is every reason to believe that some children with retardation may demonstrate the characteristics of learning disabilities in terms of letter-reversal problems, language problems, perceptual problems, and behavioral problems such as hyperactivity. Still, if the IQ score and adaptive behavior of the child indicate that a placement in a class for children who are retarded is warranted, the child should not be considered learning disabled. The problem arises in situations where a child’s IQ score is lower than normal (i.e., in the 74 to 85 range) but not low enough to warrant placement as retarded. Many such children are labeled learning disabled, in spite of the fact that their IQ is not in the normal range, which is usually assumed to be 85 or higher. Child-assessment teams may decide that such a label will result in services for the child that would be unavail-able otherwise. Although such practice cannot be condoned, it can be readily understood by any professional who has ever been in the position of a team member who sees a child failing in the traditional general education class. Many scholars have called for more flex-ibility in placing this type of child in non–special education classes that have small numbers of students, more individualized instruction, and an emphasis on remediation. However, until additional services such as these are available, many students without any identifiable disabilities will continue to be placed in classes for children with learning disabilities.
Distinction: Emotional and Behavioral Disorders. Unfortunately, the distinction be-tween emotional problems and learning disabilities is vague. This is because emotional and behavioral disorders often have a negative effect on academic work, and depressed aca-demic scores in an intelligent student may resemble a learning disability. Further, learning disabilities often have a negative emotional or behavioral effect and may therefore resemble an emotional or behavioral disorder. The guideline question or general rule of thumb in making this distinction is: Does the emotional problem cause the academic deficit, or does the academic deficit cause the emotional problem? In gathering evidence on this, several types of information may be sought. First, input from the teacher who referred the child concerning the child’s behavior, peer relationships, and motivation in class may indicate that the child’s problems are basically academic in nature. If the student seems emotion-ally healthy based on these indicators, the child is probably not emotionally disturbed or behaviorally disordered. Teachers are generally good observers of classroom behavior, and numerous ratings of behavior, which the general education teacher may be asked to com-plete, can provide this information.
Next, the peers in the class can also provide information on the behavior and social skills of the student. Various informal roster-rating techniques may be used to elicit infor-mation on the social acceptance of the child. These devices require every child in the class to indicate the level of social acceptance of every other child in the class. When the results are tallied, the totals will indicate the level of acceptance of any child in the class. If both teacher ratings and sociometric information indicate major behavioral abnormalities or very low social acceptance, perhaps a placement as emotionally disturbed is more justified than placement as learning disabled. Under those conditions, the child-study team would
ch05.indd 148ch05.indd 148 4/16/2007 8:08:08 AM4/16/2007 8:08:08 AM
CHAPTER FIVE ASSESSMENT OF LEARNING DISABILITIES 149
want to gather more complete information, possibly including a therapeutic interview be-tween the child and a trained counselor in order to determine the extent of the emotional disturbance.
It should be noted that teachers are not trained to conduct sociometric roster- rating procedures in most teacher education programs. Consequently, if such information is needed, child-study team members should be used to conduct this type of assessment. As in most cases involving assessment data, information from a sociometric assessment in the wrong hands can be detrimental.
Distinction: Medical Disability. The definition of learning disabilities clearly excludes individuals who have visual, auditory, or motor deficiencies. Unlike the perceptual prob-lems or basic psychological processes discussed previously, this phrase in the definition indicates problems that can be identified by visual, motor, or auditory screening and follow-up procedures. Although child-study assessment teams generally do not include a physi-cian, assessments for medically based conditions can be obtained. In some cases, the school nurse, a speech clinician, or an audiologist may be able to provide initial screening in these areas. Medical causes for learning problems must not be overlooked in the initial proce-dures dealing with new referrals, though few referrals require more than brief hearing and visual-screening procedures.
Distinction: Cultural, Environmental, Economic Disadvantage. One difficult distinc-tion to be made is the discrimination between students with disabilities and students who have been raised in a depressed or language-poor environment. Although children who are poor and economically or environmentally disadvantaged may have a learning disability, the placement team must determine that the primary cause for the disability is not envi-ronmental disadvantage. Some practitioners have argued that this distinction need not be made at all because students who are culturally deprived need many of the same types of educational modifications as children with learning disabilities. Still, the current federal definition stipulates that this distinction be made, though no guidelines are currently avail-able for making this distinction.
Distinction: Students Who Are Low Achieving. Often, it is quite difficult to distin-guish between students who have learning disabilities and students who are low achieving for other reasons (Commission, 2001; Fuchs & Fuchs, 2006). In fact, one reason for the recent emphasis on response to intervention is the fact that procedures used currently do not facilitate this distinction at all. While some individual research studies have suggested differences between students with learning disabilities and low-achieving students, school districts have not systematically attempted to make this distinction. Still, the intention of various legislative definitions of learning disabilities historically has been to exclude stu-dents who are low achieving from services unless they also manifested some documented disorder in the basic psychological processes described above.
Distinction: ADHD. With the recent increase in students identified as demonstrating attention-deficit hyperactivity disorders, there is a growing concern related to how to dis-tinguish students with learning disabilities from those with ADHD. The Commission on
ch05.indd 149ch05.indd 149 4/16/2007 8:08:08 AM4/16/2007 8:08:08 AM
150 SECTION I INTRODUCTION TO LEARNING DISABILITIES
Excellence in Special Education (2001) noted the similarities between ADHD and learning disabilities. Both groups do demonstrate problems in attention, and both may also demon-strate hyperactivity, impulsivity, and a lack of organizational skill. In fact, many students with ADHD have been considered “learning disabled” over the years, and determining the distinguishing characteristics of these groups has proven difficult. Further, Barkley (1990) indicated that as many as 40% of students with learning disabilities may also manifest attention-deficit disorders.
In a report on assessment and identification of students with attention-deficit disor-ders, Montague, McKinney, and Hocutt (1994) suggested that a number of procedures may be used for diagnosis, including teacher ratings, observational techniques, and interviews. Of course, these same techniques may also be employed when a learning disability is sus-pected, and use of the same techniques to identify these two groups merely confuses the discrimination process.
Given this difficulty in distinguishing these two groups, teachers should realize that the basis of the distinction is the documented discrepancy between ability and achievement. Although the size of the discrepancy required for an identification of learning disability changes from one state to another, if a large discrepancy is noted, the child will typically be identified as a student with a learning disability. Alternatively, if the child has attention problems, hyperactivity, and/or impulsivity, but does not demonstrate a large discrepancy between ability and achievement, the child will typically be identified as ADHD. Once identified as ADHD, the child may either receive special services in the regular education program or be placed in special education under the “other health impaired” category.
Response to Intervention
As discussed in previous chapters, federal law now allows the use of a child’s response to intervention (RTI) as a documentation of his or her learning disability (Batsche et al., 2004; Marston, 2005; Scruggs & Mastropieri, 2002; Mastropieri & Scruggs, 2005). This is the most recent change in eligibility procedures, and in many ways, it is perhaps the most innovative (Fuchs & Fuchs, 2005, 2006; Gersten & Dimino, 2006). This approach resulted from the general dissatisfaction with previous approaches for documentation of a learning disability, in particular a dissatisfaction with the discrepancy criteria described in Chapter 1. In short, many policy makers believe that the discrepancy criteria results in overidentification of students with learning disabilities and thus increases the overall costs of special education (Fuchs & Fuchs, 2006). Other reasons for dissatisfaction with current eligibility procedures include inconsistency in definitions of learning disabilities from one state to another and the tendency of discrepancy procedures to identify as learning disabled students who have merely been exposed to poor teaching (Fuchs & Fuchs, 2006).
The RTI procedure involves actual implementation of several intervention proce-dures that under normal conditions would be expected to result in academic growth. In the absence of such academic growth, a learning disability is assumed to exist (Batsche et al., 2004; Fuchs & Fuchs, 2006). Conceptually, this is perhaps the most effective method for documenting the existence of a learning disability, and the RTI eligibility procedure now has many proponents (Fuchs & Fuchs, 2005, 2006; Gersten & Dimino, 2006; Marston, 2005; Scruggs & Mastropieri, 2002; Mastropieri & Scruggs, 2005), though others have raised concerns with this new procedure (NJCLD, 2005).
ch05.indd 150ch05.indd 150 4/16/2007 8:08:09 AM4/16/2007 8:08:09 AM
CHAPTER FIVE ASSESSMENT OF LEARNING DISABILITIES 151
In the discussions available in the professional literature, a “tiered system” involving several interventions is typically recommended in order to “prove” a child has a learning disability (Batsche et al., 2004). For example, the National Joint Committee on Learning Disabilities described a three-tiered system of interventions (NJCLD, 2005). Perhaps an RTI example will best demonstrate this procedure; the description below is a synthesis of a variety of different research-based RTI models (Fuchs & Fuchs, 2005, 2006; Marston, 2005; Vaughn, Linan-Thompson, & Hickman, 2003; Vellutino et al., 1996).
Imagine a general education first-grade classroom including some 22 children. Under RTI procedures, the teacher would be expected to conduct some type of screening assessment in reading—perhaps a measure of word identification fluency—in the second or third month of the school year, in order to identify those children who may be struggling with reading. Early in grade 1, students may be expected to know perhaps 10 to 15 words (a, the, he, she, etc.), since some of these words may have been mastered in kindergarten and others would have been learned in the early fall of the first-grade year. After administering that assessment for every child, the teacher could then identify the lowest 25% of students in the class. These students would then be targeted for some type of scientifically validated instructional proce-dure in the general education classroom. Those students scoring above the lowest 25% would not be considered eligible for LD services. The intervention used for the lowest-scoring group of students would represent the first tier of the RTI process—that is, it would be the first at-tempt by the schools to remediate potential reading problems for these students.
Most researchers recommend that this first tier of intervention be viewed as the re-sponsibility of the general education teacher (Fuchs & Fuchs, 2005; Gersten & Dimino, 2006). Federal legislation requires that the teacher use a reading curriculum supported by scientific research. Surprising as it may seem, many commercially available reading cur-ricula are not supported by independent scientific research.
During the tier 1 intervention, the general education teacher would be expected to periodically monitor the child’s progress on various reading variables. Fuchs and Fuchs (2005) suggest such progress monitoring be undertaken at least once per week over a period of 8 to 10 weeks. Children whose weekly scores showed growth in reading skill would not be considered for further services for the learning disabled. However, students who did not demonstrate appropriate growth would move into the second tier of intervention.
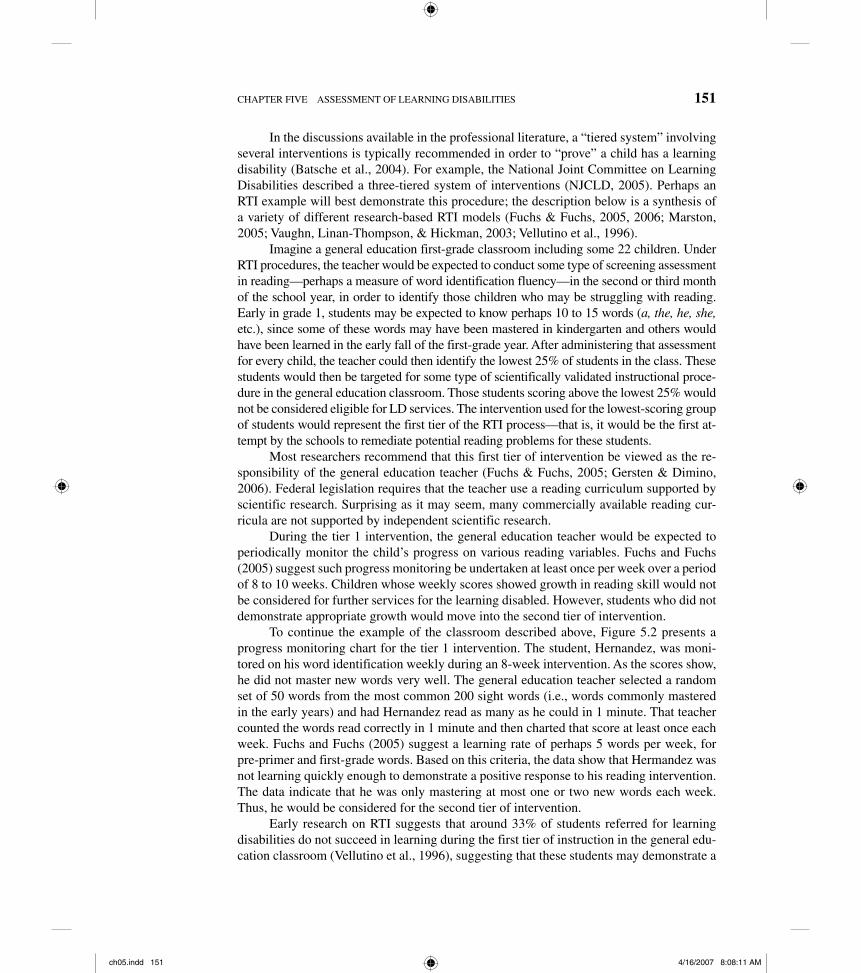
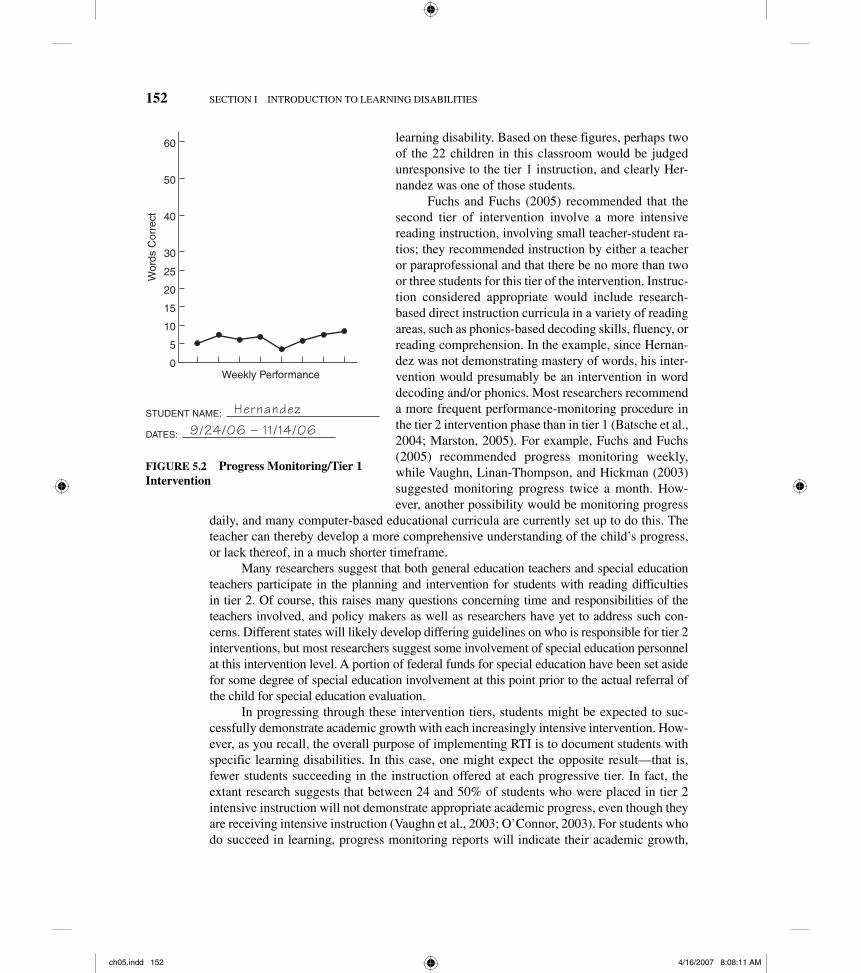
To continue the example of the classroom described above, Figure 5.2 presents a progress monitoring chart for the tier 1 intervention. The student, Hernandez, was moni-tored on his word identification weekly during an 8-week intervention. As the scores show, he did not master new words very well. The general education teacher selected a random set of 50 words from the most common 200 sight words (i.e., words commonly mastered in the early years) and had Hernandez read as many as he could in 1 minute. That teacher counted the words read correctly in 1 minute and then charted that score at least once each week. Fuchs and Fuchs (2005) suggest a learning rate of perhaps 5 words per week, for pre-primer and first-grade words. Based on this criteria, the data show that Hermandez was not learning quickly enough to demonstrate a positive response to his reading intervention. The data indicate that he was only mastering at most one or two new words each week. Thus, he would be considered for the second tier of intervention.
Early research on RTI suggests that around 33% of students referred for learning disabilities do not succeed in learning during the first tier of instruction in the general edu-cation classroom (Vellutino et al., 1996), suggesting that these students may demonstrate a
ch05.indd 151ch05.indd 151 4/16/2007 8:08:11 AM4/16/2007 8:08:11 AM
152 SECTION I INTRODUCTION TO LEARNING DISABILITIES
learning disability. Based on these figures, perhaps two of the 22 children in this classroom would be judged unresponsive to the tier 1 instruction, and clearly Her-nandez was one of those students.
Fuchs and Fuchs (2005) recommended that the second tier of intervention involve a more intensive reading instruction, involving small teacher-student ra-tios; they recommended instruction by either a teacher or paraprofessional and that there be no more than two or three students for this tier of the intervention. Instruc-tion considered appropriate would include research-based direct instruction curricula in a variety of reading areas, such as phonics-based decoding skills, fluency, or reading comprehension. In the example, since Hernan-dez was not demonstrating mastery of words, his inter-vention would presumably be an intervention in word decoding and/or phonics. Most researchers recommend a more frequent performance-monitoring procedure in the tier 2 intervention phase than in tier 1 (Batsche et al., 2004; Marston, 2005). For example, Fuchs and Fuchs (2005) recommended progress monitoring weekly, while Vaughn, Linan-Thompson, and Hickman (2003) suggested monitoring progress twice a month. How-ever, another possibility would be monitoring progress
daily, and many computer-based educational curricula are currently set up to do this. The teacher can thereby develop a more comprehensive understanding of the child’s progress, or lack thereof, in a much shorter timeframe.
Many researchers suggest that both general education teachers and special education teachers participate in the planning and intervention for students with reading difficulties in tier 2. Of course, this raises many questions concerning time and responsibilities of the teachers involved, and policy makers as well as researchers have yet to address such con-cerns. Different states will likely develop differing guidelines on who is responsible for tier 2 interventions, but most researchers suggest some involvement of special education personnel at this intervention level. A portion of federal funds for special education have been set aside for some degree of special education involvement at this point prior to the actual referral of the child for special education evaluation.
In progressing through these intervention tiers, students might be expected to suc-cessfully demonstrate academic growth with each increasingly intensive intervention. How-ever, as you recall, the overall purpose of implementing RTI is to document students with specific learning disabilities. In this case, one might expect the opposite result—that is, fewer students succeeding in the instruction offered at each progressive tier. In fact, the extant research suggests that between 24 and 50% of students who were placed in tier 2 intensive instruction will not demonstrate appropriate academic progress, even though they are receiving intensive instruction (Vaughn et al., 2003; O’Connor, 2003). For students who do succeed in learning, progress monitoring reports will indicate their academic growth,
60
50
40
30
25
20
15
10
5
0Weekly Performance
Wor
ds C
orre
ct
STUDENT NAME: Hernandez
DATES: 9/24/06 – 11/14/06
FIGURE 5.2 Progress Monitoring/Tier 1 Intervention
ch05.indd 152ch05.indd 152 4/16/2007 8:08:11 AM4/16/2007 8:08:11 AM
CHAPTER FIVE ASSESSMENT OF LEARNING DISABILITIES 153
and they will not be considered learning disabled. However, the 24 to 50% of students who do not succeed in tier 2 intervention will move to tier 3.
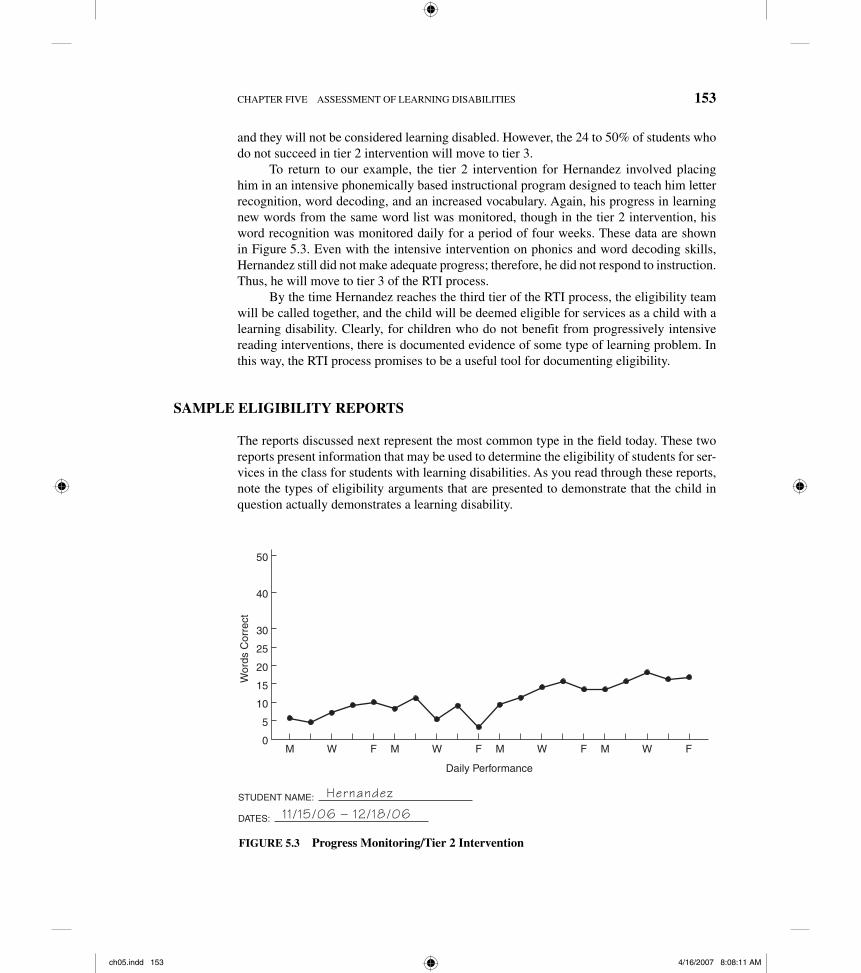
To return to our example, the tier 2 intervention for Hernandez involved placing him in an intensive phonemically based instructional program designed to teach him letter recognition, word decoding, and an increased vocabulary. Again, his progress in learning new words from the same word list was monitored, though in the tier 2 intervention, his word recognition was monitored daily for a period of four weeks. These data are shown in Figure 5.3. Even with the intensive intervention on phonics and word decoding skills, Hernandez still did not make adequate progress; therefore, he did not respond to instruction. Thus, he will move to tier 3 of the RTI process.
By the time Hernandez reaches the third tier of the RTI process, the eligibility team will be called together, and the child will be deemed eligible for services as a child with a learning disability. Clearly, for children who do not benefit from progressively intensive reading interventions, there is documented evidence of some type of learning problem. In this way, the RTI process promises to be a useful tool for documenting eligibility.
SAMPLE ELIGIBILITY REPORTS
The reports discussed next represent the most common type in the field today. These two reports present information that may be used to determine the eligibility of students for ser-vices in the class for students with learning disabilities. As you read through these reports, note the types of eligibility arguments that are presented to demonstrate that the child in question actually demonstrates a learning disability.
50
40
30
25
20
15
10
5
0
Daily Performance
Wor
ds C
orre
ct
STUDENT NAME: Hernandez
DATES: 11/15/06 – 12/18/06
M W F M W F M W F M W F
FIGURE 5.3 Progress Monitoring/Tier 2 Intervention
ch05.indd 153ch05.indd 153 4/16/2007 8:08:11 AM4/16/2007 8:08:11 AM
154 SECTION I INTRODUCTION TO LEARNING DISABILITIES
Psychoeducational Team Assessment Report
In most cases involving diagnosis of a learning disability, a team of specialists is involved. This team may include a school psychologist, special education and general education teachers, school administrators, the child’s parents, medical practitioners, and the student. The report in Interest Box 5.4 summarizes the types of information that the psychoeduca-tional team might collect.
The psychoeducational team report includes a number of examples of the eligibility arguments based on the developmental-imbalances perspective. For example, the neurol-ogist’s report indicated that scores on a visual test were lower than would be expected for a child of this age. This led that professional to the conclusion that this child might have a learning disability. However, the psychologist used a different visual-motor assessment and concluded that there was no evidence of a visual-perceptual problem. The educational consultant’s report was in agreement with the interpretation of the neurologist, in that there seemed to be evidence of a visual-perceptual problem and thus of a learning disability. Note that the summary for the entire team specifically highlighted the contradictory evidence on the presence or absence of a visual-perceptual problem. Finally, the educational consultants discussed the discrepancy between IQ and achievement in two areas.
Educational Consultant’s Evaluation
Often, when a parent and a school district disagree concerning the diagnosis of learning disabilities, a private educational consultant will assess the child—or, in some cases, re-view assessment data—and render a decision concerning the child’s eligibility for services. The report in Interest Box 5.5 represents the type of report an educational consultant might present.
As you can see from this report, the educational consultant has chosen to emphasize the developmental-imbalances perspective, by demonstrating a developmental imbalance between Adam’s skill in hearing information compared to visual input. This is another example of the developmental imbalances eligibility argument that was discussed earlier in this chapter. Also, notice that the educational consultant documented a discrepancy between IQ and achievement as a major factor in the diagnosis of learning disability. Finally, you may wish to note the relative lack of educational suggestions presented in this report. Be-yond the suggestions for placement and some work on writing skills, there is very little use-ful information in this report that could assist in planning educational activities for Adam.
Cultural Diversity and Eligibility Decisions
In spite of the best efforts of test manufacturers and educational personnel, research has shown that there is some degree of bias in many of the assessments used to document eligibility for services as learning disabled (Commission, 2001; Olivarez, Palmer, & Guil-lemard, 1992). This potential bias is particularly troubling when one considers that students with learning disabilities come from all cultures (Lerner & Chen, 1992). One growing concern with our eligibility assessment practices is the relatively limited cultural sensitivity of the assessment process (Hyun & Fowler, 1995; Leung, 1996). Many of the assessments
ch05.indd 154ch05.indd 154 4/16/2007 8:08:12 AM4/16/2007 8:08:12 AM
CHAPTER FIVE ASSESSMENT OF LEARNING DISABILITIES 155
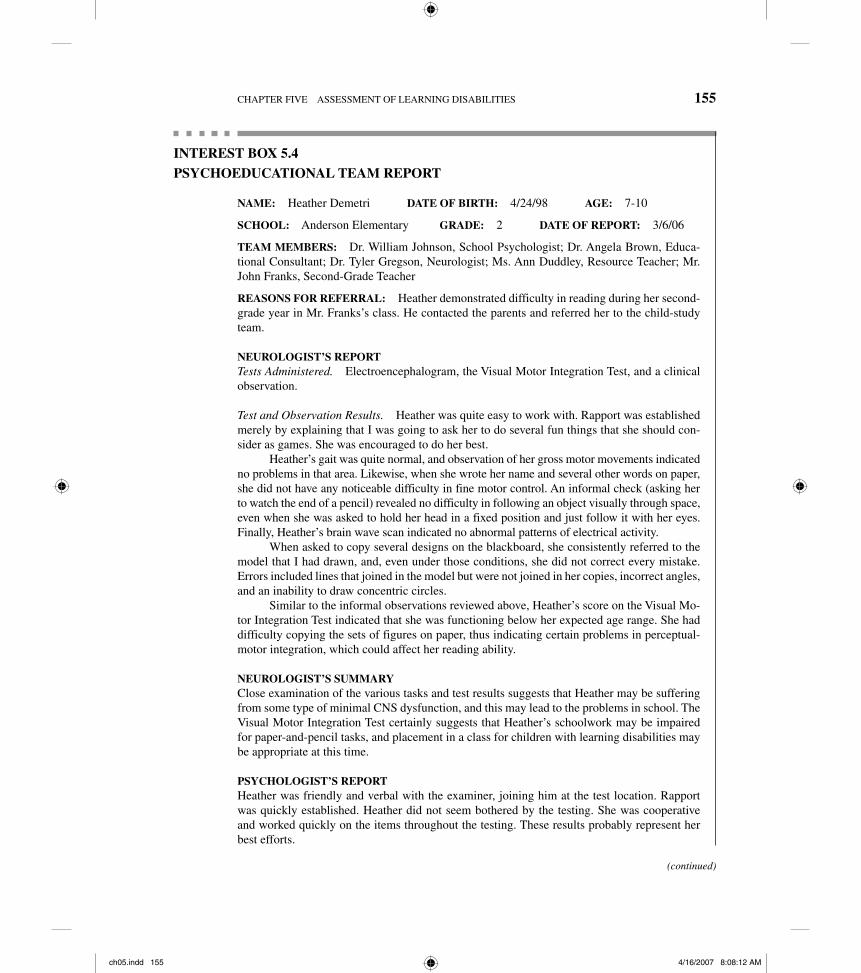
INTEREST BOX 5.4PSYCHOEDUCATIONAL TEAM REPORT
NAME: Heather Demetri DATE OF BIRTH: 4/24/98 AGE: 7-10
SCHOOL: Anderson Elementary GRADE: 2 DATE OF REPORT: 3/6/06
TEAM MEMBERS: Dr. William Johnson, School Psychologist; Dr. Angela Brown, Educa-tional Consultant; Dr. Tyler Gregson, Neurologist; Ms. Ann Duddley, Resource Teacher; Mr. John Franks, Second-Grade Teacher
REASONS FOR REFERRAL: Heather demonstrated difficulty in reading during her second-grade year in Mr. Franks’s class. He contacted the parents and referred her to the child-study team.
NEUROLOGIST’S REPORTTests Administered. Electroencephalogram, the Visual Motor Integration Test, and a clinical observation.
Test and Observation Results. Heather was quite easy to work with. Rapport was established merely by explaining that I was going to ask her to do several fun things that she should con-sider as games. She was encouraged to do her best.
Heather’s gait was quite normal, and observation of her gross motor movements indicated no problems in that area. Likewise, when she wrote her name and several other words on paper, she did not have any noticeable difficulty in fine motor control. An informal check (asking her to watch the end of a pencil) revealed no difficulty in following an object visually through space, even when she was asked to hold her head in a fixed position and just follow it with her eyes. Finally, Heather’s brain wave scan indicated no abnormal patterns of electrical activity.
When asked to copy several designs on the blackboard, she consistently referred to the model that I had drawn, and, even under those conditions, she did not correct every mistake. Errors included lines that joined in the model but were not joined in her copies, incorrect angles, and an inability to draw concentric circles.
Similar to the informal observations reviewed above, Heather’s score on the Visual Mo-tor Integration Test indicated that she was functioning below her expected age range. She had difficulty copying the sets of figures on paper, thus indicating certain problems in perceptual-motor integration, which could affect her reading ability.
NEUROLOGIST’S SUMMARYClose examination of the various tasks and test results suggests that Heather may be suffering from some type of minimal CNS dysfunction, and this may lead to the problems in school. The Visual Motor Integration Test certainly suggests that Heather’s schoolwork may be impaired for paper-and-pencil tasks, and placement in a class for children with learning disabilities may be appropriate at this time.
PSYCHOLOGIST’S REPORTHeather was friendly and verbal with the examiner, joining him at the test location. Rapport was quickly established. Heather did not seem bothered by the testing. She was cooperative and worked quickly on the items throughout the testing. These results probably represent her best efforts.
(continued)
ch05.indd 155ch05.indd 155 4/16/2007 8:08:12 AM4/16/2007 8:08:12 AM
156 SECTION I INTRODUCTION TO LEARNING DISABILITIES
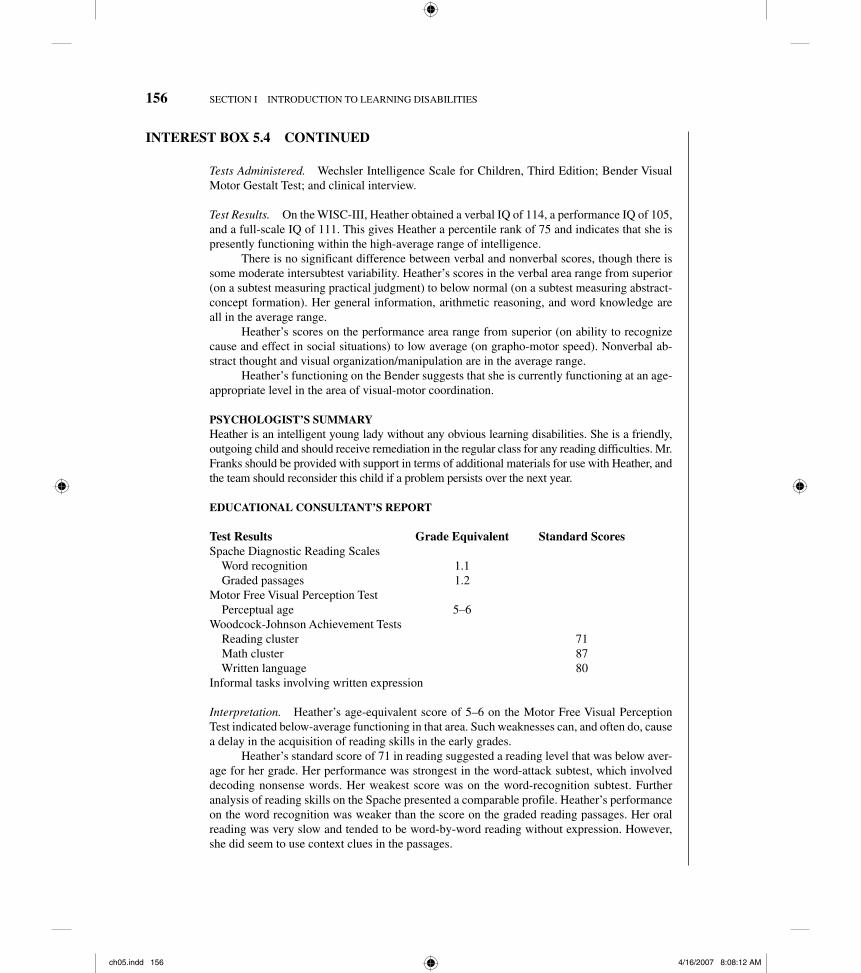
Tests Administered. Wechsler Intelligence Scale for Children, Third Edition; Bender Visual Motor Gestalt Test; and clinical interview.
Test Results. On the WISC-III, Heather obtained a verbal IQ of 114, a performance IQ of 105, and a full-scale IQ of 111. This gives Heather a percentile rank of 75 and indicates that she is presently functioning within the high-average range of intelligence.
There is no significant difference between verbal and nonverbal scores, though there is some moderate intersubtest variability. Heather’s scores in the verbal area range from superior (on a subtest measuring practical judgment) to below normal (on a subtest measuring abstract-concept formation). Her general information, arithmetic reasoning, and word knowledge are all in the average range.
Heather’s scores on the performance area range from superior (on ability to recognize cause and effect in social situations) to low average (on grapho-motor speed). Nonverbal ab-stract thought and visual organization/manipulation are in the average range.
Heather’s functioning on the Bender suggests that she is currently functioning at an age-appropriate level in the area of visual-motor coordination.
PSYCHOLOGIST’S SUMMARYHeather is an intelligent young lady without any obvious learning disabilities. She is a friendly, outgoing child and should receive remediation in the regular class for any reading difficulties. Mr. Franks should be provided with support in terms of additional materials for use with Heather, and the team should reconsider this child if a problem persists over the next year.
EDUCATIONAL CONSULTANT’S REPORT
Test Results Grade Equivalent Standard ScoresSpache Diagnostic Reading Scales Word recognition 1.1 Graded passages 1.2Motor Free Visual Perception Test Perceptual age 5–6Woodcock-Johnson Achievement Tests Reading cluster 71 Math cluster 87 Written language 80Informal tasks involving written expression
Interpretation. Heather’s age-equivalent score of 5–6 on the Motor Free Visual Perception Test indicated below-average functioning in that area. Such weaknesses can, and often do, cause a delay in the acquisition of reading skills in the early grades.
Heather’s standard score of 71 in reading suggested a reading level that was below aver-age for her grade. Her performance was strongest in the word-attack subtest, which involved decoding nonsense words. Her weakest score was on the word-recognition subtest. Further analysis of reading skills on the Spache presented a comparable profile. Heather’s performance on the word recognition was weaker than the score on the graded reading passages. Her oral reading was very slow and tended to be word-by-word reading without expression. However, she did seem to use context clues in the passages.
INTEREST BOX 5.4 CONTINUED
ch05.indd 156ch05.indd 156 4/16/2007 8:08:12 AM4/16/2007 8:08:12 AM

CHAPTER FIVE ASSESSMENT OF LEARNING DISABILITIES 157
Heather earned a standard score of 80 on the written language cluster, which indicated below-average functioning in this area. The tests involve proofing and dictation and assess punctuation, spelling, and capitalization. She was lower than expected grade level in all of these areas. When asked to write several sentences about her favorite TV show, she produced four sentences, one of which had no verb. She did not capitalize the first word of one sentence, though she did capitalize the word I in one sentence. In several instances, her writing went over the line, even though she was using second-grade paper for this informal assessment. Her up-percase and lowercase letters were basically the same size, and, in one instance, she wrote well into the right margin. These types of problems may indicate a weakness in visual perception, as indicated on the perceptual test discussed previously. Also, this informal assessment supports the score on written language and indicates below-average achievement in this area.
Heather’s standard score of 87 on the math cluster indicated a low-average functioning. There was little difference between her performance on paper-and-pencil calculations and ap-plied problems. Heather was able to do beginning addition and subtraction problems without regrouping, but she misread several signs on the math problems. Heather counted and calcu-lated using her fingers much of the time.
EDUCATIONAL CONSULTANT’S SUMMARYHeather’s visual-motor performance indicates a problem in that area that could cause a read-ing deficit. Her reading and writing standard scores are more than 2 standard deviations below her IQ score of 111, indicating a significant IQ/achievement discrepancy in these two areas. This documents a learning disability in reading and writing, and she will require a specialized educational placement in order to remediate these problems and to help her catch up to her grade-level peers. Ms. Duddley should work closely with Mr. Franks in an inclusion class set-ting to assist Heather in her academic progress.
RECOMMENDATIONSClearly, the test results are inconsistent, as are the recommendations of the psychologist and the educational consultant. At least one visual-perception test indicated a potential problem in that area, but Heather is clearly not mentally retarded. Further, there is no evidence from the teacher or in the clinical interview that these academic difficulties are a result of behavior or motivational problems. Finally, Heather’s anticipated failure in the second grade this year pro-vides evidence that some action should be taken. We, therefore, recommend that placement as a student with learning disabilities be initiated immediately, with a review of this placement at the end of the current school year. Further, the special education teacher and general education teacher will devise an inclusion class IEP in reading and language arts for completion during the next several months. Finally, the child-study team will assist in the decision concerning advancement or grade-level retention.
DATE: ________ SCHOOL: __________________ SIGNATURES: _____________
PSYCHOLOGIST: ___________________ PARENT: __________________________
ED. CONSULTANT: _________________ TEACHER: ________________________
NEUROLOGIST: ____________________ PRINCIPAL: _______________________
SP. ED. TEACHER: __________________
ch05.indd 157ch05.indd 157 4/16/2007 8:08:12 AM4/16/2007 8:08:12 AM
158 SECTION I INTRODUCTION TO LEARNING DISABILITIES
INTEREST BOX 5.5
EDUCATIONAL CONSULTANT’S REPORT
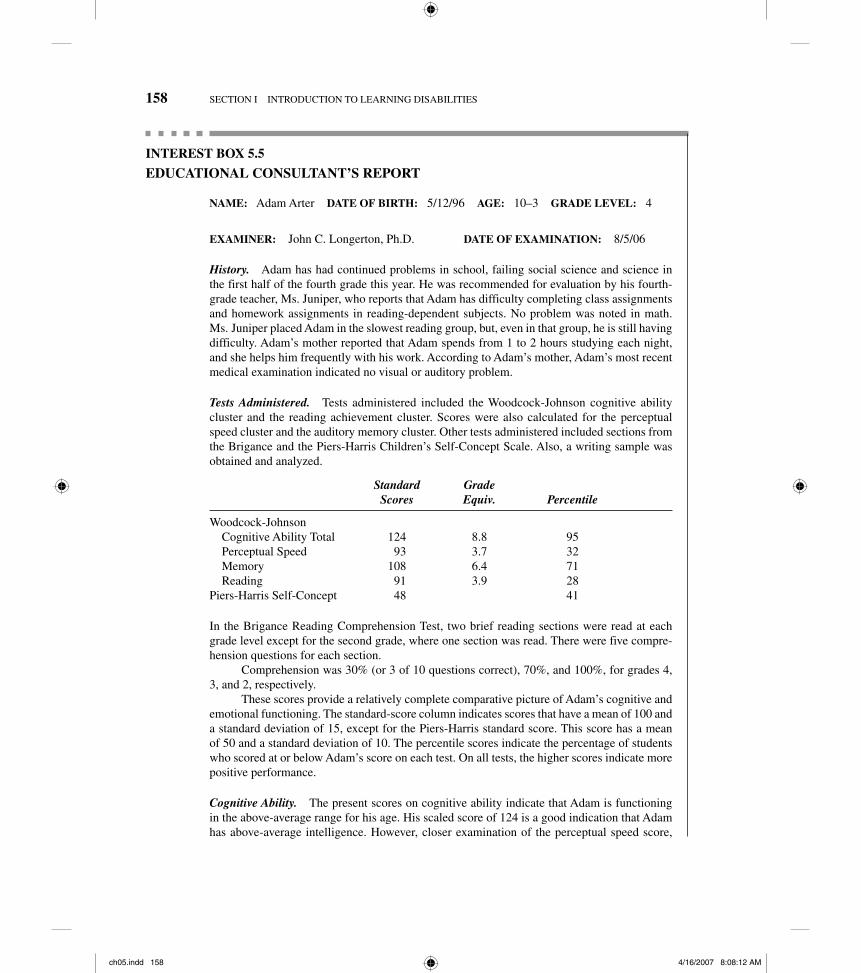
NAME: Adam Arter DATE OF BIRTH: 5/12/96 AGE: 10–3 GRADE LEVEL: 4
EXAMINER: John C. Longerton, Ph.D. DATE OF EXAMINATION: 8/5/06
History. Adam has had continued problems in school, failing social science and science in the first half of the fourth grade this year. He was recommended for evaluation by his fourth-grade teacher, Ms. Juniper, who reports that Adam has difficulty completing class assignments and homework assignments in reading-dependent subjects. No problem was noted in math. Ms. Juniper placed Adam in the slowest reading group, but, even in that group, he is still having difficulty. Adam’s mother reported that Adam spends from 1 to 2 hours studying each night, and she helps him frequently with his work. According to Adam’s mother, Adam’s most recent medical examination indicated no visual or auditory problem.
Tests Administered. Tests administered included the Woodcock-Johnson cognitive ability cluster and the reading achievement cluster. Scores were also calculated for the perceptual speed cluster and the auditory memory cluster. Other tests administered included sections from the Brigance and the Piers-Harris Children’s Self-Concept Scale. Also, a writing sample was obtained and analyzed.
Standard Grade Scores Equiv. Percentile
Woodcock-Johnson Cognitive Ability Total 124 8.8 95 Perceptual Speed 93 3.7 32 Memory 108 6.4 71 Reading 91 3.9 28Piers-Harris Self-Concept 48 41
In the Brigance Reading Comprehension Test, two brief reading sections were read at each grade level except for the second grade, where one section was read. There were five compre-hension questions for each section.
Comprehension was 30% (or 3 of 10 questions correct), 70%, and 100%, for grades 4, 3, and 2, respectively.
These scores provide a relatively complete comparative picture of Adam’s cognitive and emotional functioning. The standard-score column indicates scores that have a mean of 100 and a standard deviation of 15, except for the Piers-Harris standard score. This score has a mean of 50 and a standard deviation of 10. The percentile scores indicate the percentage of students who scored at or below Adam’s score on each test. On all tests, the higher scores indicate more positive performance.
Cognitive Ability. The present scores on cognitive ability indicate that Adam is functioning in the above-average range for his age. His scaled score of 124 is a good indication that Adam has above-average intelligence. However, closer examination of the perceptual speed score,
ch05.indd 158ch05.indd 158 4/16/2007 8:08:12 AM4/16/2007 8:08:12 AM
CHAPTER FIVE ASSESSMENT OF LEARNING DISABILITIES 159
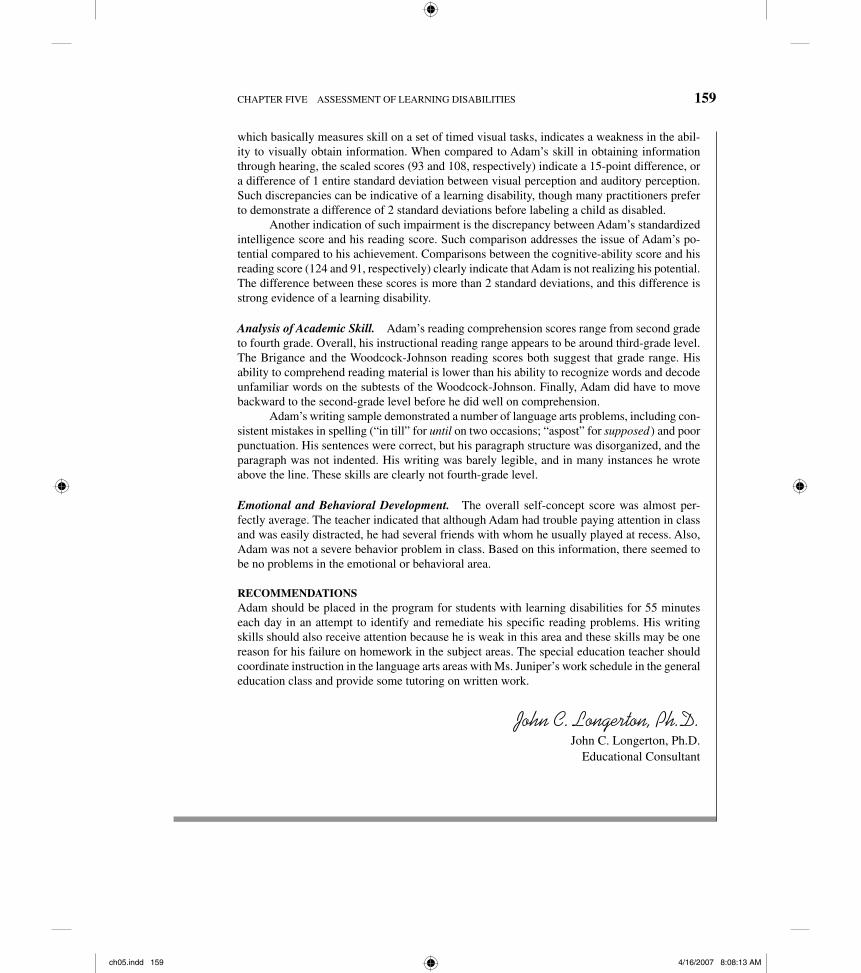
which basically measures skill on a set of timed visual tasks, indicates a weakness in the abil-ity to visually obtain information. When compared to Adam’s skill in obtaining information through hearing, the scaled scores (93 and 108, respectively) indicate a 15-point difference, or a difference of 1 entire standard deviation between visual perception and auditory perception. Such discrepancies can be indicative of a learning disability, though many practitioners prefer to demonstrate a difference of 2 standard deviations before labeling a child as disabled.
Another indication of such impairment is the discrepancy between Adam’s standardized intelligence score and his reading score. Such comparison addresses the issue of Adam’s po-tential compared to his achievement. Comparisons between the cognitive-ability score and his reading score (124 and 91, respectively) clearly indicate that Adam is not realizing his potential. The difference between these scores is more than 2 standard deviations, and this difference is strong evidence of a learning disability.
Analysis of Academic Skill. Adam’s reading comprehension scores range from second grade to fourth grade. Overall, his instructional reading range appears to be around third-grade level. The Brigance and the Woodcock-Johnson reading scores both suggest that grade range. His ability to comprehend reading material is lower than his ability to rec ognize words and decode unfamiliar words on the subtests of the Woodcock-Johnson. Finally, Adam did have to move backward to the second-grade level before he did well on comprehension.
Adam’s writing sample demonstrated a number of language arts problems, including con-sistent mistakes in spelling (“in till” for until on two occasions; “aspost” for supposed) and poor punctuation. His sentences were correct, but his paragraph structure was disorganized, and the paragraph was not indented. His writing was barely legible, and in many instances he wrote above the line. These skills are clearly not fourth-grade level.
Emotional and Behavioral Development. The overall self-concept score was almost per-fectly average. The teacher indicated that although Adam had trouble paying attention in class and was easily distracted, he had several friends with whom he usually played at recess. Also, Adam was not a severe behavior problem in class. Based on this information, there seemed to be no problems in the emotional or behavioral area.
RECOMMENDATIONSAdam should be placed in the program for students with learning disabilities for 55 minutes each day in an attempt to identify and remediate his specific reading problems. His writing skills should also receive attention because he is weak in this area and these skills may be one reason for his failure on homework in the subject areas. The special education teacher should coordinate instruction in the language arts areas with Ms. Juniper’s work schedule in the general education class and provide some tutoring on written work.
John C. Longerton, Ph.D.John C. Longerton, Ph.D.
Educational Consultant
ch05.indd 159ch05.indd 159 4/16/2007 8:08:13 AM4/16/2007 8:08:13 AM
160 SECTION I INTRODUCTION TO LEARNING DISABILITIES
used to determine eligibility have norm samples that do not include appropriate representa-tion of children in various minority groups (Leung, 1996). Also, in our increasingly diverse society, many minority groups that have been underrepresented in the population are now growing in size.
Several reports on the implementation of special education law indicated that there may be some bias in the frequently used eligibility assessment practices (Alexander, 1992; Commission, 2001). Specifically, these reports indicated that a higher percentage of minor-ity children were referred to special education than one would anticipate, and concerns such as this have documented the need to increase our efforts to be sensitive to cultural differ-ences that may account for differential test performance.
Although most authorities indicate the general validity of current IQ assessment pro-cedures, there is still a need to validate a minority child’s performance with other data (Leung, 1996). Rather than relying exclusively on test results, practitioners should col-lect other data, including interviews with parents about the child’s functioning or direct observations of the child in school and perhaps at home. These data then can be used to cross-validate the assessment results and assure that a child is protected from subtle bias in eligibility decisions. Leung (1996) also encouraged teachers to consider their own assump-tions relative to particular minority groups by asking themselves questions such as, “What assumptions do I make about the cultural group from which this child comes?” or “Will my attitude affect this child’s performance?” Such self-examination should lead everyone in the field to more fair and equitable assessment and decision-making practices.
Most Western democracies value cultural diversity in their populations, and aware-ness of the strengths of cultural diversity is increasing. There have been recommendations for modifications of assessment practices for certain minority groups, but such modifica-tions are far from normative in today’s environment. Of course, when evidence of bias is found, educators have a moral obligation to make every effort to eliminate that bias in assessments. Some evidence has suggested that there may be a bias against male students in the identification process (Clarizio & Phillips, 1986; Leinhardt, Seewald, & Zigmond, 1982). Further, Olivarez and colleagues (1992) indicated that the commonly used assess-ment batteries for determination of eligibility tend to overestimate the achievement of Af-rican American and Hispanic students.
With this evidence of bias in hand, researchers and practitioners alike must make every effort to mitigate the effects of bias in the eligibility decision making. There are, as yet, only various sets of general guidelines for mitigating the negative consequences of bias. Chin and McCormick (1986) provided a set of guidelines, which are presented in Interest Box 5.6.
ASSESSMENT FOR INSTRUCTION
While child-study team members grapple with eligibility issues together, the teacher often faces the need for assessment information for instructional planning alone. Psychologists, social workers, school nurses, and educational-assessment consultants often perform some basic achievement testing, resulting in a score that compares a child with a group of chil-dren, but such information is not necessary or useful in planning individualized instruction
ch05.indd 160ch05.indd 160 4/16/2007 8:08:13 AM4/16/2007 8:08:13 AM
CHAPTER FIVE ASSESSMENT OF LEARNING DISABILITIES 161
(Bryant, 1999). Based on current practice in most states, it is clear that you, as the teacher, will often know the child better than any other member of the assessment team—except, of course, the parents. Consequently, educational assessment for instruction is often the responsibility of the teacher. You need a great deal of preparation in such assessment, and most teacher education programs include at least one entire course devoted to individual-ized assessment of children with disabilities.
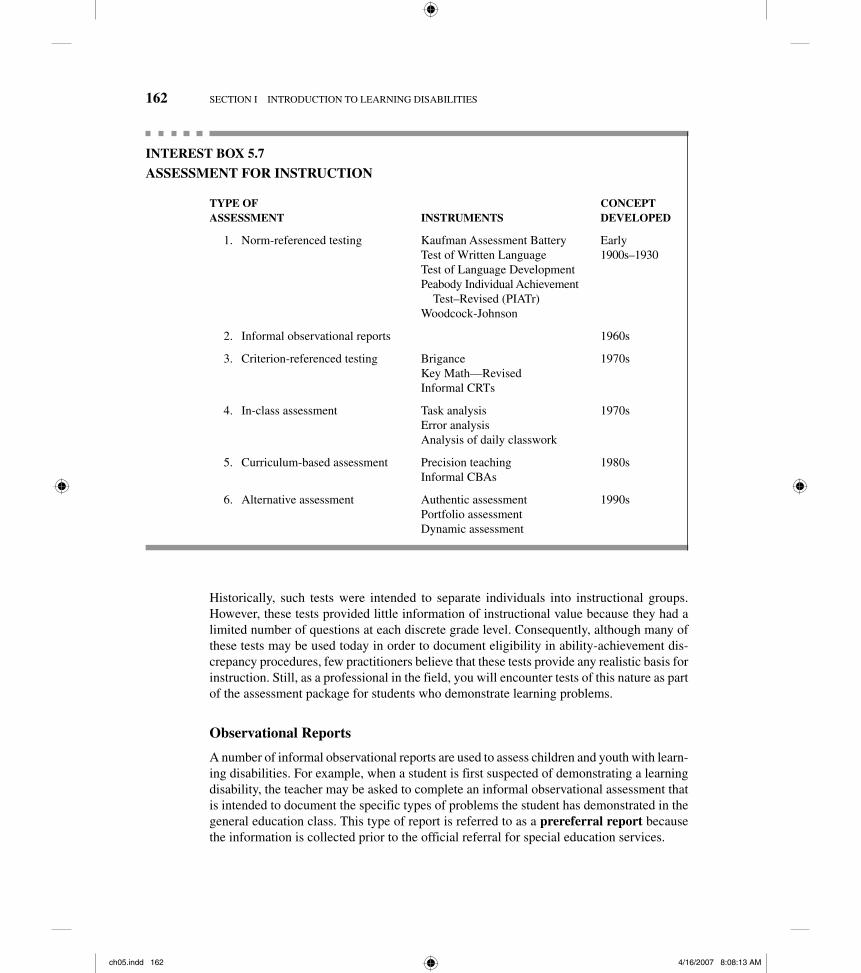
The information presented in Interest Box 5.7 is intended to briefly introduce the various approaches to individualized assessment for instruction. Note that a number of assessment examples are given as well as the dates when the assessments developed. The dates are rough estimates; once an assessment concept has been developed, commercially available instruments continue to be published over time. Still, the dates indicate the rough order in which these various assessment approaches have been developed and indicate that assessment practices are not static. No doubt the field will witness continuing change in assessment practices for students with learning disabilities.
Norm-Referenced Achievement Testing
Assessment for instructional purposes has been reformulated several times in recent history. Initially, norm-referenced academic achievement tests, administered on an individual basis, were used. Norm-referenced tests compare a student’s performance to the performance of other students and often result in an age- or grade-equivalent score or a standardized score.
INTEREST BOX 5.6
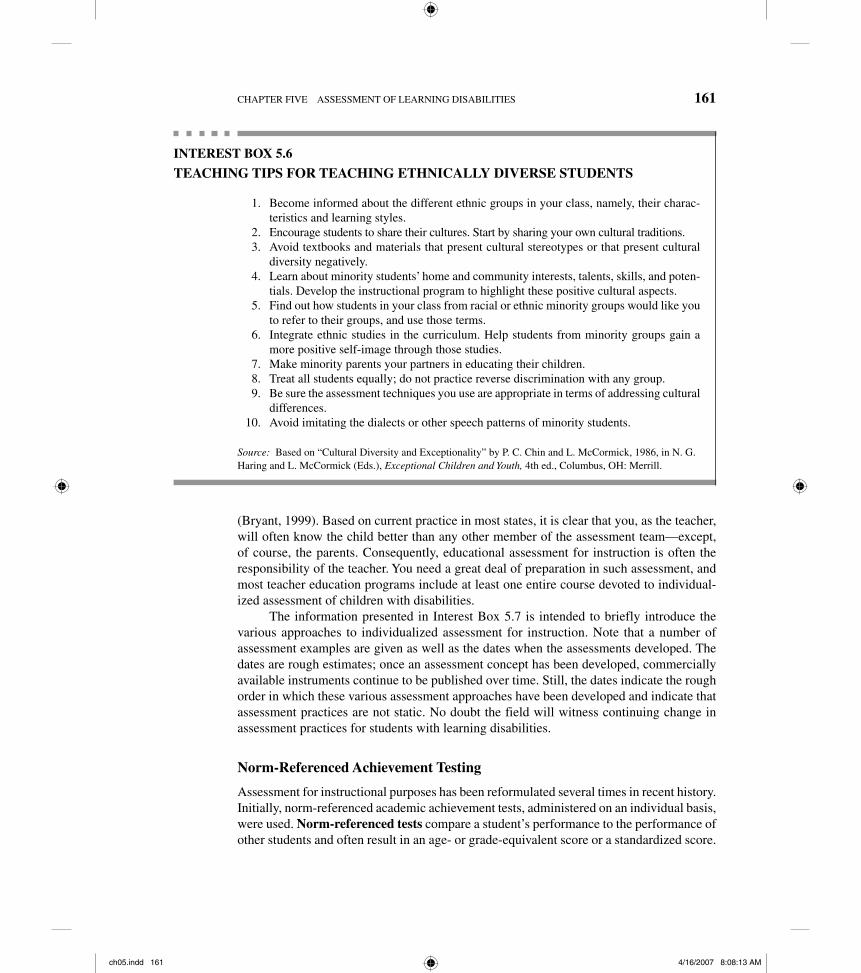
TEACHING TIPS FOR TEACHING ETHNICALLY DIVERSE STUDENTS
1. Become informed about the different ethnic groups in your class, namely, their charac-teristics and learning styles.
2. Encourage students to share their cultures. Start by sharing your own cultural traditions. 3. Avoid textbooks and materials that present cultural stereotypes or that present cultural
diversity negatively. 4. Learn about minority students’ home and community interests, talents, skills, and poten-
tials. Develop the instructional program to highlight these positive cultural aspects. 5. Find out how students in your class from racial or ethnic minority groups would like you
to refer to their groups, and use those terms. 6. Integrate ethnic studies in the curriculum. Help students from minority groups gain a
more positive self-image through those studies. 7. Make minority parents your partners in educating their children. 8. Treat all students equally; do not practice reverse discrimination with any group. 9. Be sure the assessment techniques you use are appropriate in terms of addressing cultural
differences.10. Avoid imitating the dialects or other speech patterns of minority students.
Source: Based on “Cultural Diversity and Exceptionality” by P. C. Chin and L. McCormick, 1986, in N. G. Haring and L. McCormick (Eds.), Exceptional Children and Youth, 4th ed., Columbus, OH: Merrill.
ch05.indd 161ch05.indd 161 4/16/2007 8:08:13 AM4/16/2007 8:08:13 AM
162 SECTION I INTRODUCTION TO LEARNING DISABILITIES
Historically, such tests were intended to separate individuals into instructional groups. However, these tests provided little information of instructional value because they had a limited number of questions at each discrete grade level. Consequently, although many of these tests may be used today in order to document eligibility in ability-achievement dis-crepancy procedures, few practitioners believe that these tests provide any realistic basis for instruction. Still, as a professional in the field, you will encounter tests of this nature as part of the assessment package for students who demonstrate learning problems.
Observational Reports
A number of informal observational reports are used to assess children and youth with learn-ing disabilities. For example, when a student is first suspected of demonstrating a learning disability, the teacher may be asked to complete an informal observational assessment that is intended to document the specific types of problems the student has demonstrated in the general education class. This type of report is referred to as a prereferral report because the information is collected prior to the official referral for special education services.
INTEREST BOX 5.7
ASSESSMENT FOR INSTRUCTION
TYPE OF CONCEPTASSESSMENT INSTRUMENTS DEVELOPED
1. Norm-referenced testing Kaufman Assessment Battery Early Test of Written Language 1900s–1930 Test of Language Development Peabody Individual Achievement
Test–Revised (PIATr) Woodcock-Johnson
2. Informal observational reports 1960s
3. Criterion-referenced testing Brigance 1970s Key Math—Revised Informal CRTs
4. In-class assessment Task analysis 1970s Error analysis Analysis of daily classwork
5. Curriculum-based assessment Precision teaching 1980s Informal CBAs
6. Alternative assessment Authentic assessment 1990s Portfolio assessment Dynamic assessment
ch05.indd 162ch05.indd 162 4/16/2007 8:08:13 AM4/16/2007 8:08:13 AM
CHAPTER FIVE ASSESSMENT OF LEARNING DISABILITIES 163
However, informal observational checklists and observational reports may be used at any time, either before the referral or afterward. In many cases, a standardized, commer-cially produced behavioral checklist may be required, whereas in other cases, an informal observational record may be obtained.
Criterion-Referenced Testing
Because of the need for more complete information on a child’s performance, tests were developed that compared a child’s performance to a list of behavioral objectives in highly discrete skill areas rather than other children’s performance. For example, a criterion-ref-erenced test may assess only whole-number addition, with five items for each type of ad-dition problem. Each of the objectives on such a test is keyed to a particular question or set of questions, and if the student missed a particular set of items, that discrete skill would be included in his or her IEP. Documentation of levels of performance in each relevant area on criterion-referenced tests results in complete information for instruction. The theoretical basis for such testing procedures is the behavioral perspective, presented in Chapter 1.
Curriculum-Based Assessment
One recent thrust in assessment is very similar to criterion-referenced assessment, but it is conducted much more frequently. Because the levels of student performance vary consider-ably over time, various theorists have recommended assessment based on the work a stu-dent does in class, which takes place on a daily or biweekly basis (Jones, 2001; King-Sears, Burgess, & Lawson, 1999; Phillips, Fuchs, & Fuchs, 1994). These frequent assessments help the teacher monitor student performance.
For example, one such procedure—precision teaching—requires that data on a child’s completion rate for a particular type of problem be kept on a daily basis (Bender, 2002). Information such as this can be used to chart the student’s achievement on a particular skill over time. By looking at the recent daily work, the teacher can quickly tell when a student has mastered a task. Also, the teacher can tell when the type of instructional activity is not increasing the child’s comprehension and rate of successful problem completion. In short, teachers get a daily picture of student performance on which to base educational program-ming decisions (King-Sears et al., 1999).
Although curriculum-based assessment practices have demonstrated effectiveness, many teachers consider these procedures much too time-consuming for use in special edu-cation classes. Fortunately, however, these daily data collections can be utilized in a manner that does not take an undue amount of time (Jones, 2001). For example, a teacher may use only the last several minutes of each period to assess the timed performance of the students, and several students may be timed simultaneously. Also, students may be trained to chart their own behaviors over a period of several weeks in order to see their own progress.
Several scholars have recommended that eligibility decisions for children with learning disabilities be made on the basis of curriculum-based assessment (Bender, 2002; Commission, 2001; Fuchs & Fuchs, 2005), and the new RTI emphasis proposes exactly this utilization of curriculum-based measures. The curriculum-based assessment report presented in Interest Box 5.8 demonstrates how several daily curriculum-based measures
ch05.indd 163ch05.indd 163 4/16/2007 8:08:13 AM4/16/2007 8:08:13 AM
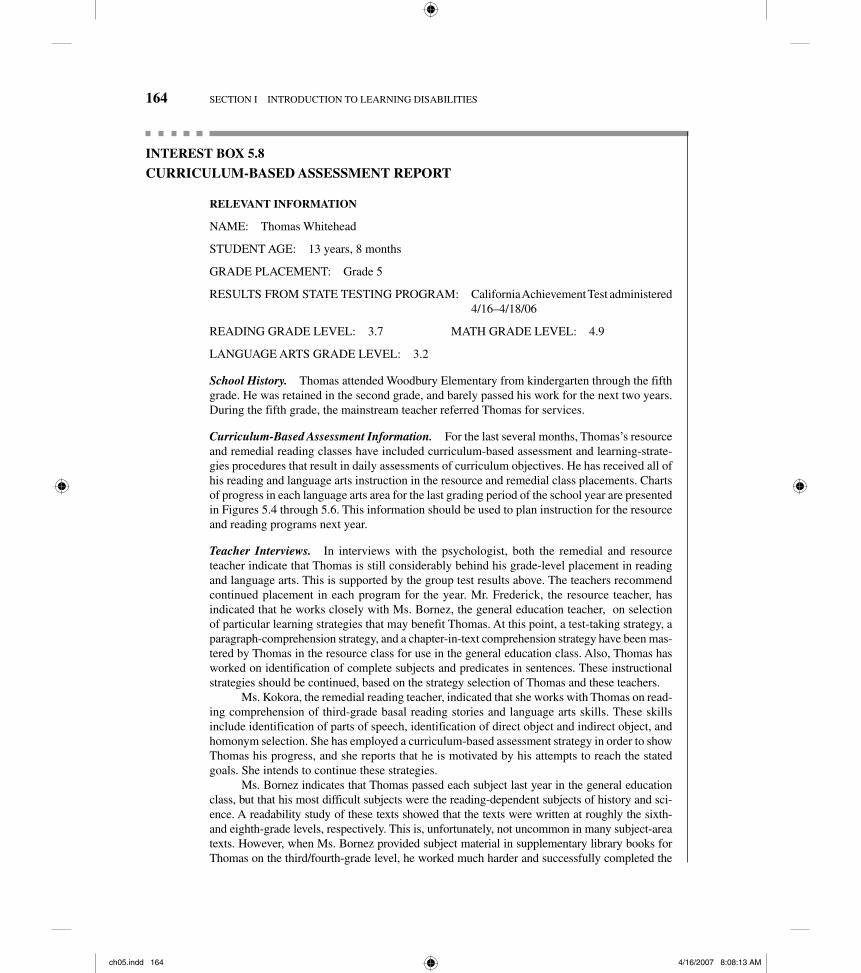
164 SECTION I INTRODUCTION TO LEARNING DISABILITIES
INTEREST BOX 5.8
CURRICULUM-BASED ASSESSMENT REPORT
RELEVANT INFORMATION
NAME: Thomas Whitehead
STUDENT AGE: 13 years, 8 months
GRADE PLACEMENT: Grade 5
RESULTS FROM STATE TESTING PROGRAM: California Achievement Test administered 4/16–4/18/06
READING GRADE LEVEL: 3.7 MATH GRADE LEVEL: 4.9
LANGUAGE ARTS GRADE LEVEL: 3.2
School History. Thomas attended Woodbury Elementary from kindergarten through the fifth grade. He was retained in the second grade, and barely passed his work for the next two years. During the fifth grade, the mainstream teacher referred Thomas for services.
Curriculum-Based Assessment Information. For the last several months, Thomas’s re source and remedial reading classes have included curriculum-based assessment and learning-strate-gies procedures that result in daily assessments of curriculum objectives. He has received all of his reading and language arts instruction in the resource and remedial class placements. Charts of progress in each language arts area for the last grading period of the school year are presented in Figures 5.4 through 5.6. This information should be used to plan instruction for the resource and reading programs next year.
Teacher Interviews. In interviews with the psychologist, both the remedial and resource teacher indicate that Thomas is still considerably behind his grade-level placement in reading and language arts. This is supported by the group test results above. The teachers recommend continued placement in each program for the year. Mr. Frederick, the resource teacher, has indicated that he works closely with Ms. Bornez, the general education teacher, on selection of particular learning strategies that may benefit Thomas. At this point, a test-taking strategy, a paragraph-comprehension strategy, and a chapter-in-text comprehension strategy have been mas-tered by Thomas in the resource class for use in the general education class. Also, Thomas has worked on identification of complete subjects and predicates in sentences. These instructional strategies should be continued, based on the strategy selection of Thomas and these teachers.
Ms. Kokora, the remedial reading teacher, indicated that she works with Thomas on read-ing comprehension of third-grade basal reading stories and language arts skills. These skills include identification of parts of speech, identification of direct object and indirect object, and homonym selection. She has employed a curriculum-based assessment strategy in order to show Thomas his progress, and she reports that he is motivated by his attempts to reach the stated goals. She intends to continue these strategies.
Ms. Bornez indicates that Thomas passed each subject last year in the general education class, but that his most difficult subjects were the reading-dependent subjects of history and sci-ence. A readability study of these texts showed that the texts were written at roughly the sixth- and eighth-grade levels, respectively. This is, unfortunately, not uncommon in many subject-area texts. However, when Ms. Bornez provided subject material in supplementary library books for Thomas on the third/fourth-grade level, he worked much harder and successfully completed the
ch05.indd 164ch05.indd 164 4/16/2007 8:08:13 AM4/16/2007 8:08:13 AM
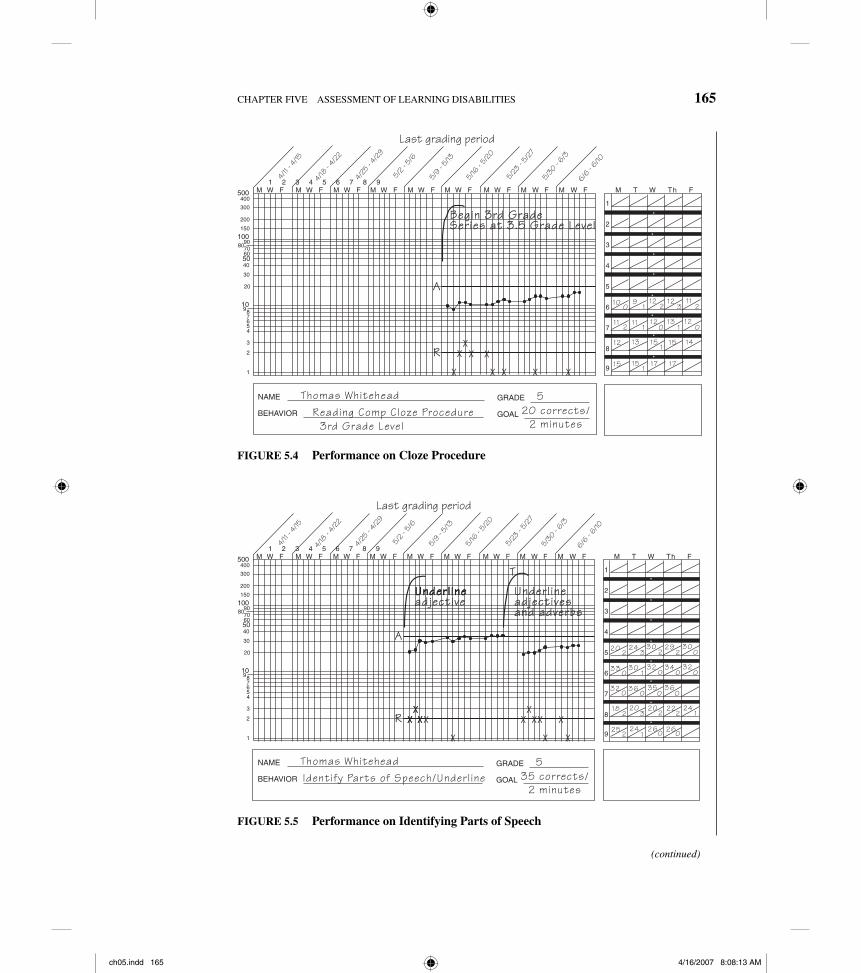
CHAPTER FIVE ASSESSMENT OF LEARNING DISABILITIES 165
(continued)
20 corrects/2 minutes
1
2
3
4
5
6
7
8
9
M T W Th FM W FM W FM W F M W F M W FM W FM W FM W FM W F500400
300
200
150
10090
807060
40
30
50
20
1098
7654
3
2
1
NAME
BEHAVIOR
A
R
Reading Comp Cloze Procedure 3rd Grade Level
100
GRADE
GOAL
Begin 3rd GradeSeries at 3.5 Grade Level
4/11 -
4/15
4/18 -
4/22
4/25 -
4/29
5/2 -
5/6
5/9 -
5/13
5/16 -
5/20
5/23 -
5/27
5/30 -
6/3
6/6 -
6/10
Last grading period
91
122
123
1 12
1 12 1 1
112 13 12
12 13 15 15 14
X
XX X
1 2 3 4 5 6 7 8 9
Thomas Whitehead 5
0 1 0
1
15 15 17 171X X X
X
X
FIGURE 5.4 Performance on Cloze Procedure
35 corrects/2 minutes
1
2
3
4
5
6
7
8
9
M T W Th FM W FM W FM W F M W F M W FM W FM W FM W FM W F500400
300
200
150
10090
807060
40
30
50
20
1098
7654
3
2
1
NAME
BEHAVIOR
A
R
Identify Parts of Speech/Underline
330
GRADE
GOAL
UnderlineUnderlineadjective
4/11 -
4/15
4/18 -
4/22
4/25 -
4/29
5/2 -
5/6
5/9 -
5/13
5/16 -
5/20
5/23 -
5/27
5/30 -
6/3
6/6 -
6/10
Last grading period
301
320
340
320
320 36
035 36
18 20 20 22 24XX
1 2 3 4 5 6 7 8 9
Thomas Whitehead 5
0 0
25 24 26 261X
202
243
302
292
300
2 3 2 2 1
2 0 0
X XX
X X XX
X X X
X X
Underlineadjectivesand adverbs
T
FIGURE 5.5 Performance on Identifying Parts of Speech
ch05.indd 165ch05.indd 165 4/16/2007 8:08:13 AM4/16/2007 8:08:13 AM
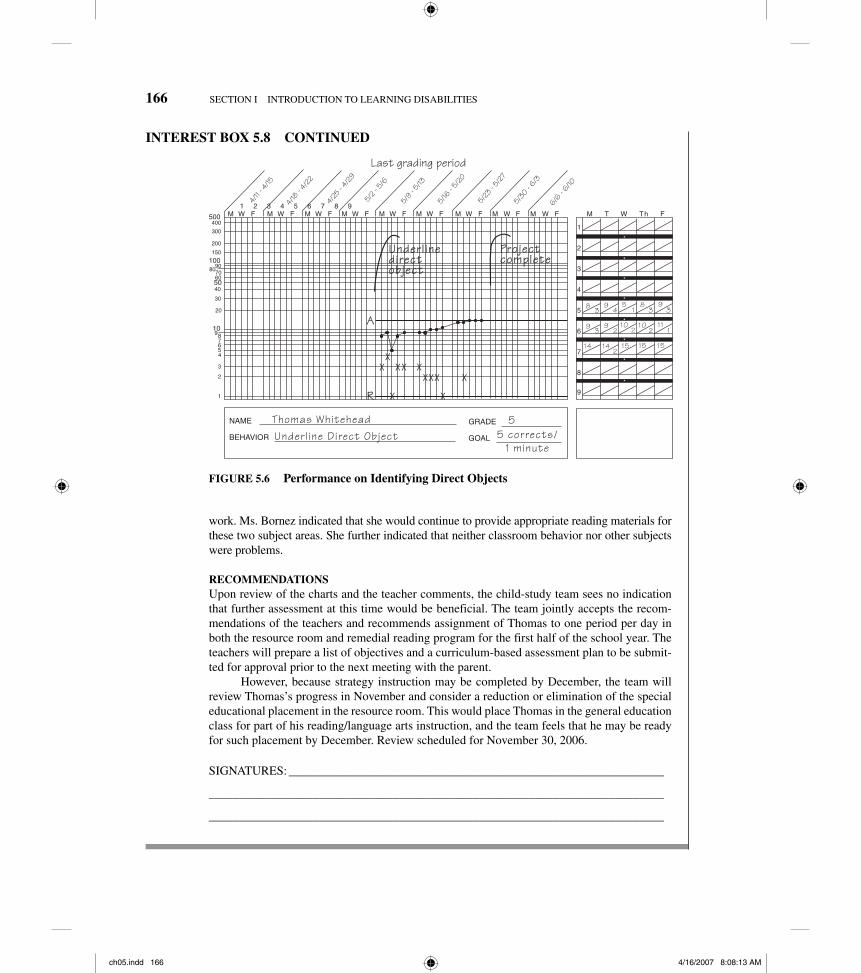
166 SECTION I INTRODUCTION TO LEARNING DISABILITIES
work. Ms. Bornez indicated that she would continue to provide appropriate reading materials for these two subject areas. She further indicated that neither classroom behavior nor other subjects were problems.
RECOMMENDATIONSUpon review of the charts and the teacher comments, the child-study team sees no indi cation that further assessment at this time would be beneficial. The team jointly accepts the recom-mendations of the teachers and recommends assignment of Thomas to one period per day in both the resource room and remedial reading program for the first half of the school year. The teachers will prepare a list of objectives and a curriculum-based assessment plan to be submit-ted for approval prior to the next meeting with the parent.
However, because strategy instruction may be completed by December, the team will review Thomas’s progress in November and consider a reduction or elimination of the special educational placement in the resource room. This would place Thomas in the general education class for part of his reading/language arts instruction, and the team feels that he may be ready for such placement by December. Review scheduled for November 30, 2006.
SIGNATURES: _____________________________________________________________
__________________________________________________________________________
__________________________________________________________________________
5 corrects/1 minute
1
2
3
4
5
6
7
8
9
M T W Th FM W FM W FM W F M W F M W FM W FM W FM W FM W F500400
300
200
150
10090
807060
40
30
50
20
1098
7654
3
2
1
NAME
BEHAVIOR
A
R
Underline Direct Object
93
GRADE
GOAL
Underlinedirectobject
4/11 -
4/15
4/18 -
4/22
4/25 -
4/29
5/2 -
5/6
5/9 -
5/13
5/16 -
5/20
5/23 -
5/27
5/30 -
6/3
6/6 -
6/10
Last grading period
92
102
102
1 11
14 142
15 15 15
1 2 3 4 5 6 7 8 9
Thomas Whitehead 5
X
83
94
51
83
93
XX
Projectcomplete
X X XXXX X
X
FIGURE 5.6 Performance on Identifying Direct Objects
INTEREST BOX 5.8 CONTINUED
ch05.indd 166ch05.indd 166 4/16/2007 8:08:13 AM4/16/2007 8:08:13 AM
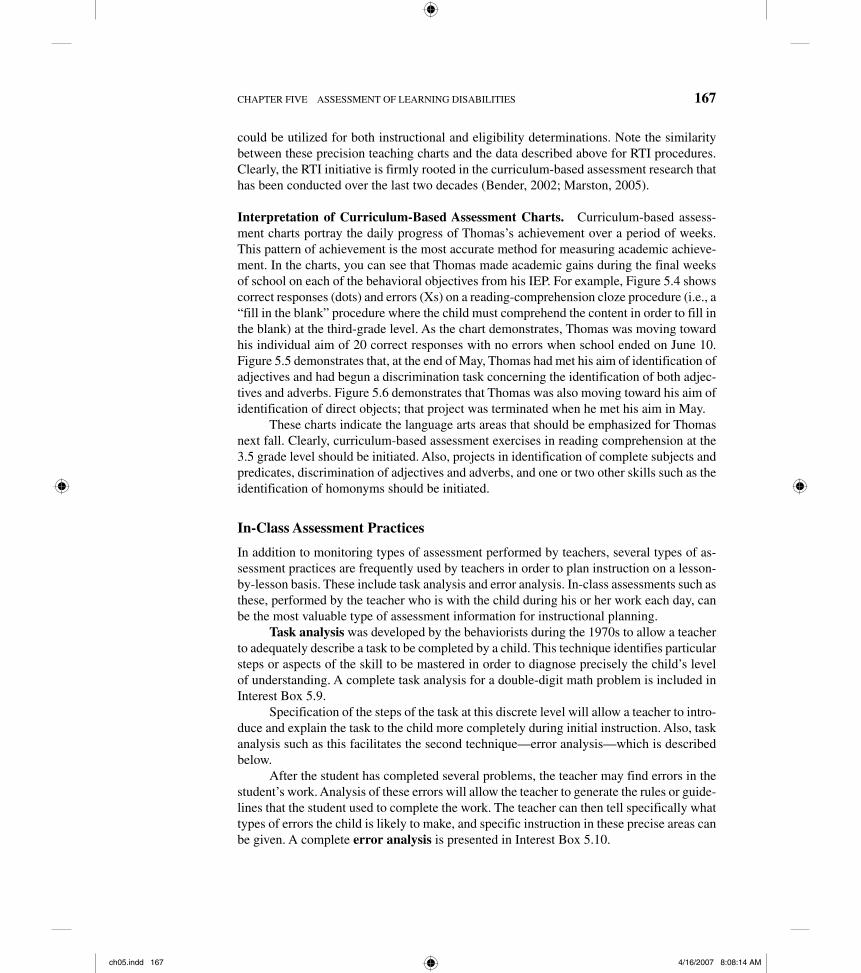
CHAPTER FIVE ASSESSMENT OF LEARNING DISABILITIES 167
could be utilized for both instructional and eligibility determinations. Note the similarity between these precision teaching charts and the data described above for RTI procedures. Clearly, the RTI initiative is firmly rooted in the curriculum-based assessment research that has been conducted over the last two decades (Bender, 2002; Marston, 2005).
Interpretation of Curriculum-Based Assessment Charts. Curriculum-based assess-ment charts portray the daily progress of Thomas’s achievement over a period of weeks. This pattern of achievement is the most accurate method for measuring academic achieve-ment. In the charts, you can see that Thomas made academic gains during the final weeks of school on each of the behavioral objectives from his IEP. For example, Figure 5.4 shows correct responses (dots) and errors (Xs) on a reading-comprehension cloze procedure (i.e., a “fill in the blank” procedure where the child must comprehend the content in order to fill in the blank) at the third-grade level. As the chart demonstrates, Thomas was moving toward his individual aim of 20 correct responses with no errors when school ended on June 10. Figure 5.5 demonstrates that, at the end of May, Thomas had met his aim of identification of adjectives and had begun a discrimination task concerning the identification of both adjec-tives and adverbs. Figure 5.6 demonstrates that Thomas was also moving toward his aim of identification of direct objects; that project was terminated when he met his aim in May.
These charts indicate the language arts areas that should be emphasized for Thomas next fall. Clearly, curriculum-based assessment exercises in reading comprehension at the 3.5 grade level should be initiated. Also, projects in identification of complete subjects and predicates, discrimination of adjectives and adverbs, and one or two other skills such as the identification of homonyms should be initiated.
In-Class Assessment Practices
In addition to monitoring types of assessment performed by teachers, several types of as-sessment practices are frequently used by teachers in order to plan instruction on a lesson-by-lesson basis. These include task analysis and error analysis. In-class assessments such as these, performed by the teacher who is with the child during his or her work each day, can be the most valuable type of assessment information for instructional planning.
Task analysis was developed by the behaviorists during the 1970s to allow a teacher to adequately describe a task to be completed by a child. This technique identifies particular steps or aspects of the skill to be mastered in order to diagnose precisely the child’s level of understanding. A complete task analysis for a double-digit math problem is included in Interest Box 5.9.
Specification of the steps of the task at this discrete level will allow a teacher to intro-duce and explain the task to the child more completely during initial instruction. Also, task analysis such as this facilitates the second technique—error analysis—which is described below.
After the student has completed several problems, the teacher may find errors in the student’s work. Analysis of these errors will allow the teacher to generate the rules or guide-lines that the student used to complete the work. The teacher can then tell specifically what types of errors the child is likely to make, and specific instruction in these precise areas can be given. A complete error analysis is presented in Interest Box 5.10.
ch05.indd 167ch05.indd 167 4/16/2007 8:08:14 AM4/16/2007 8:08:14 AM
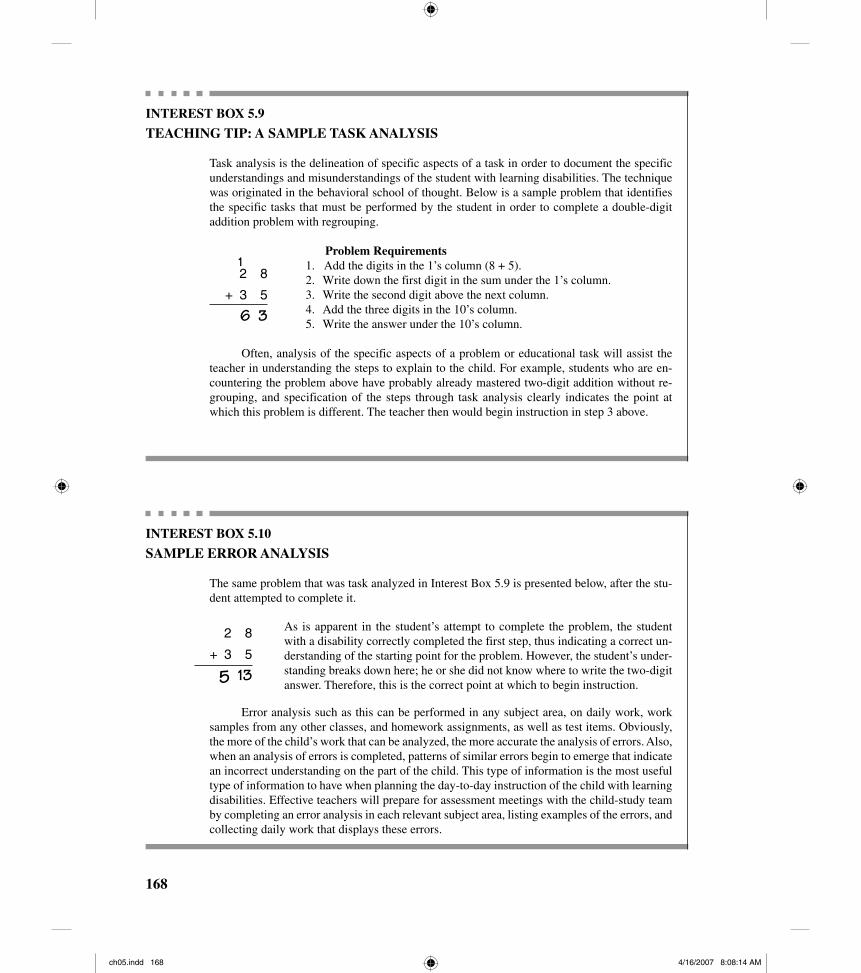
INTEREST BOX 5.9
TEACHING TIP: A SAMPLE TASK ANALYSIS
Task analysis is the delineation of specific aspects of a task in order to document the specific understandings and misunderstandings of the student with learning disabilities. The technique was originated in the behavioral school of thought. Below is a sample problem that identifies the specific tasks that must be performed by the student in order to complete a double-digit addition problem with regrouping.
Problem Requirements 1. Add the digits in the 1’s column (8 + 5). 2. Write down the first digit in the sum under the 1’s column. 3. Write the second digit above the next column. 4. Add the three digits in the 10’s column. 5. Write the answer under the 10’s column.
Often, analysis of the specific aspects of a problem or educational task will assist the teacher in understanding the steps to explain to the child. For example, students who are en-countering the problem above have probably already mastered two-digit addition without re-grouping, and specification of the steps through task analysis clearly indicates the point at which this problem is different. The teacher then would begin instruction in step 3 above.
INTEREST BOX 5.10
SAMPLE ERROR ANALYSIS
The same problem that was task analyzed in Interest Box 5.9 is presented below, after the stu-dent attempted to complete it.
As is apparent in the student’s attempt to complete the problem, the student with a disability correctly completed the first step, thus indicating a correct un-derstanding of the starting point for the problem. However, the student’s under-standing breaks down here; he or she did not know where to write the two-digit answer. Therefore, this is the correct point at which to begin instruction.
Error analysis such as this can be performed in any subject area, on daily work, work samples from any other classes, and homework assignments, as well as test items. Obviously, the more of the child’s work that can be analyzed, the more accurate the analysis of errors. Also, when an analysis of errors is completed, patterns of similar errors begin to emerge that indicate an incorrect understanding on the part of the child. This type of information is the most useful type of information to have when planning the day-to-day instruction of the child with learning disabilities. Effective teachers will prepare for assessment meetings with the child-study team by completing an error analysis in each relevant subject area, listing examples of the errors, and collecting daily work that displays these errors.
2 8
+ 3 5
5 13
1 2 8
+ 3 5
6 3
168
ch05.indd 168ch05.indd 168 4/16/2007 8:08:14 AM4/16/2007 8:08:14 AM

CHAPTER FIVE ASSESSMENT OF LEARNING DISABILITIES 169
Innovative Assessment Practices
Over the last decade, there has been an effort within education to move toward assessments that have more bearing on how children actually perform various educational tasks (Bry-ant, 1999; Commission, 2001; Fuchs & Fuchs, 2006; Jones, 2001; King-Sears et al., 1999). These alternatives include authentic assessment (sometimes referred to as performance as-sessment), portfolio assessment, dynamic assessment, and strength-based assessment.
The term authentic assessment has been used to suggest that particular types of as-sessment practices are authentically related to a task that may be required of someone in the real world. In this concept of assessment, the individual must perform the task required in a real-world setting. Thus, the term performance assessment is sometimes used. The teaching example in Interest Box 5.11 illustrates authentic assessment practices.
If children can conduct the types of authentic tasks described—tasks that are required of adults in a real-world arena such as ecological studies—then the students may be said to understand the concepts. In short, they have been “assessed” in a much more authentic fashion than if given paper-and-pencil tests on the same topic in the school classroom. This type of assessment has many proponents among educators because this practice stresses the applicability of education to real-world problems.
For example, students of English or literature may create a school newspaper, doing various writing and editing jobs, as one example of authentic assessment. Alternatively, the students may jointly write an article each week for the local newspaper. As another example, high school students who take media production classes often can be involved in
INTEREST BOX 5.11
AN EXAMPLE OF AUTHENTIC ASSESSMENT
In a traditionally taught sixth-grade earth science class, the children may study concepts such as ecology, preservation of wetlands, the interdependence of life within a particular ecosystem, and so on. The class would then take a written test—with questions in multiple-choice or per-haps essay format—to demonstrate their knowledge. In contrast, using an authentic assessment model, the children would be assessed by actually applying their knowledge to real-world problems. For example, children may take a local field trip to a wetlands environment and perform a number of tasks demonstrating their understanding of the concepts that approximate tasks done in the real world by ecologists studying that ecosystem. Some of these assessments may include:
Conduct tests on turbidity (i.e., clarity) of the water in streams feeding that environmentIdentify wildlife footprints for animals using the wetlands as a watering source Extract a water sample and, under a field microscope, count and identify the microbes in the water sampleCompare the types and number of microbes to a record of microbes from the same wet-lands conducted previously (if such a record exists)Conduct other experiments to determine the quality of the wetlands environment
■
■
■
■
■
ch05.indd 169ch05.indd 169 4/16/2007 8:08:14 AM4/16/2007 8:08:14 AM

170 SECTION I INTRODUCTION TO LEARNING DISABILITIES
running the school’s television studio and producing the “Morning News”—the morning announcements for the school. These are just a few examples of authentic assessment; the only limit on what may comprise an authentic assessment or performance assessment is the teacher’s imagination. Students generally find these assessments much more interesting and motivating than traditional instructional and assessment practices.
Portfolio assessment is one form of authentic assessment that, in addition to perfor-mance of real-world tasks, involves the student in the production of a file or portfolio that includes a number of projects designed and developed to demonstrate the student’s skill in a particular area over time (Swicegood, 1994). This type of assessment originated in elemen-tary education and has recently been applied in special education settings. Using portfolio assessment, teachers create a portfolio of student worksheets or homework, including nu-merous samples of the child’s work—perhaps paragraphs written on topics selected by the student or math worksheets throughout a unit on multiplication. The teachers note the dates of completion for each assignment, and on the basis of the collected work samples, teachers identify strengths and weaknesses of the child.
In a sense, the portfolio or collection of student work becomes the basis for in-depth error analysis across the period during which the class papers, homework, or other work samples were collected. Using this portfolio, teachers and parents can gain a very accurate picture of where a particular child is and how that child is progressing toward the curricu-lum goals for the year (Swicegood, 1994). Also, many teachers find this form of ongoing as-sessment more manageable than the curriculum-based assessment charting plans described earlier in this chapter.
Portfolios vary considerably, and may include either a student’s finished work on several projects in various areas or samples of the student’s work in one particular area over time. For example, many teachers of writing include writing selections for a student from the beginning, the middle, and the end of the academic year. Thus, these written samples may be used to show a student’s continuing progress in writing.
Dynamic assessment is, perhaps, the most interesting of these developing assess-ment concepts for the field of learning disabilities. In dynamic assessment, consideration is given not only to the student’s performance on a particular task but also to the thought processes the student uses in performing the task (Bryant, 1999). For example, while com-pleting a series of math problems that involve regrouping in the 10’s place, the teacher may observe the student making an error and actually stop the student’s work during one of the problems to inquire about why he or she wrote down a particular digit in the answer. Us-ing this strategy, the teacher can begin to understand the dynamics of what the student was thinking while completing a problem (Bryant, 1999).
This assessment development is particularly intriguing when one considers the decid-edly unorthodox thought processes that may be associated with a learning disability. If the teacher can, in a particular assessment, stop a child during a problem and discuss his or her solution immediately, the teacher may find out much more information on why a particular child often fails to complete that type of problem correctly.
Strength-based assessment is an assessment concept that emphasizes documenta-tion of the strengths of students rather than merely cataloging their weaknesses (Epstein, 1999; Epstein, Rudolph, & Epstein, 2000). Michael Epstein developed this concept in an effort to specify an assessment alternative for students with disabilities. He indicated that,
ch05.indd 170ch05.indd 170 4/16/2007 8:08:14 AM4/16/2007 8:08:14 AM
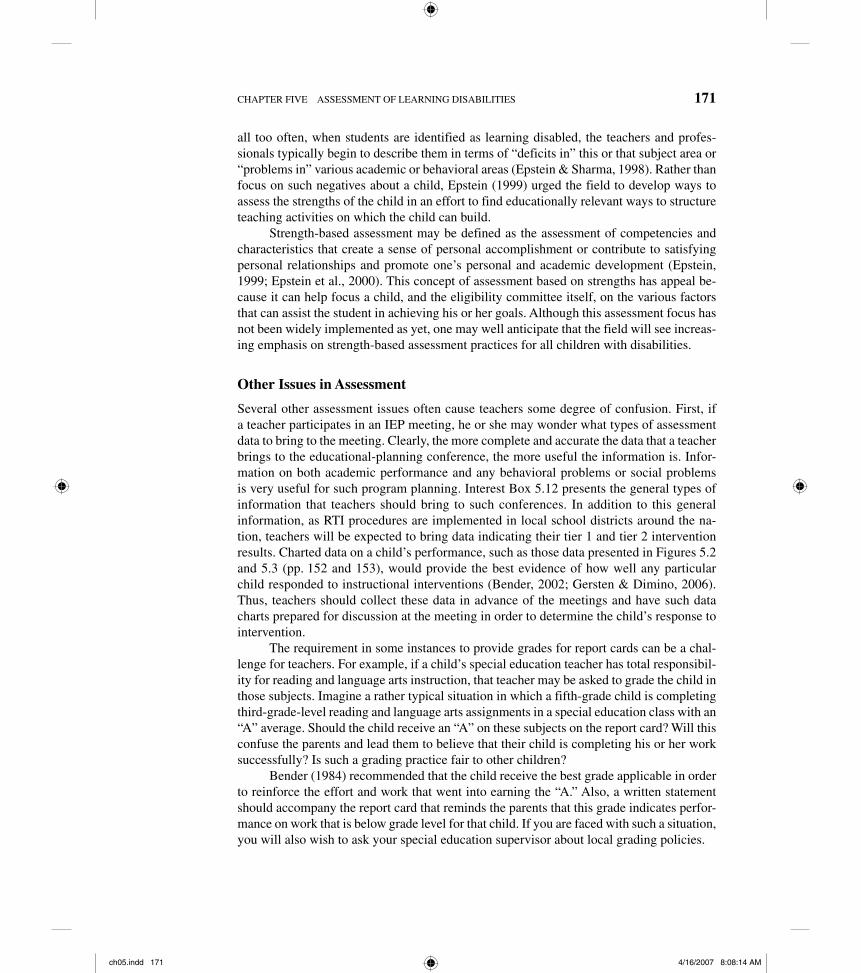
CHAPTER FIVE ASSESSMENT OF LEARNING DISABILITIES 171
all too often, when students are identified as learning disabled, the teachers and profes-sionals typically begin to describe them in terms of “deficits in” this or that subject area or “problems in” various academic or behavioral areas (Epstein & Sharma, 1998). Rather than focus on such negatives about a child, Epstein (1999) urged the field to develop ways to assess the strengths of the child in an effort to find educationally relevant ways to structure teaching activities on which the child can build.
Strength-based assessment may be defined as the assessment of competencies and characteristics that create a sense of personal accomplishment or contribute to satisfying personal relationships and promote one’s personal and academic development (Epstein, 1999; Epstein et al., 2000). This concept of assessment based on strengths has appeal be-cause it can help focus a child, and the eligibility committee itself, on the various factors that can assist the student in achieving his or her goals. Although this assessment focus has not been widely implemented as yet, one may well anticipate that the field will see increas-ing emphasis on strength-based assessment practices for all children with disabilities.
Other Issues in Assessment
Several other assessment issues often cause teachers some degree of confusion. First, if a teacher participates in an IEP meeting, he or she may wonder what types of assessment data to bring to the meeting. Clearly, the more complete and accurate the data that a teacher brings to the educational-planning conference, the more useful the information is. Infor-mation on both academic performance and any behavioral problems or social problems is very useful for such program planning. Interest Box 5.12 presents the general types of information that teachers should bring to such conferences. In addition to this general information, as RTI procedures are implemented in local school districts around the na-tion, teachers will be expected to bring data indicating their tier 1 and tier 2 intervention results. Charted data on a child’s performance, such as those data presented in Figures 5.2 and 5.3 (pp. 152 and 153), would provide the best evidence of how well any particular child responded to instructional interventions (Bender, 2002; Gersten & Dimino, 2006). Thus, teachers should collect these data in advance of the meetings and have such data charts prepared for discussion at the meeting in order to determine the child’s response to intervention.
The requirement in some instances to provide grades for report cards can be a chal-lenge for teachers. For example, if a child’s special education teacher has total responsibil-ity for reading and language arts instruction, that teacher may be asked to grade the child in those subjects. Imagine a rather typical situation in which a fifth-grade child is completing third-grade-level reading and language arts assignments in a special education class with an “A” average. Should the child receive an “A” on these subjects on the report card? Will this confuse the parents and lead them to believe that their child is completing his or her work successfully? Is such a grading practice fair to other children?
Bender (1984) recommended that the child receive the best grade applicable in order to reinforce the effort and work that went into earning the “A.” Also, a written statement should accompany the report card that reminds the parents that this grade indicates perfor-mance on work that is below grade level for that child. If you are faced with such a situation, you will also wish to ask your special education supervisor about local grading policies.
ch05.indd 171ch05.indd 171 4/16/2007 8:08:14 AM4/16/2007 8:08:14 AM
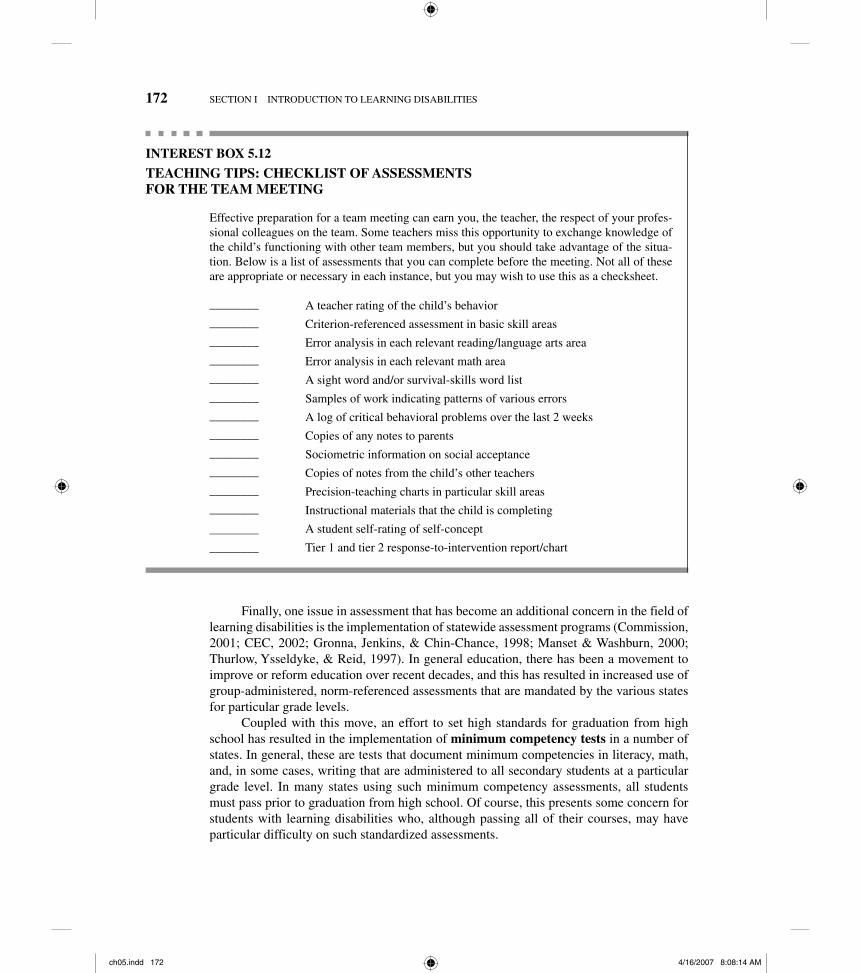
172 SECTION I INTRODUCTION TO LEARNING DISABILITIES
Finally, one issue in assessment that has become an additional concern in the field of learning disabilities is the implementation of statewide assessment programs (Commission, 2001; CEC, 2002; Gronna, Jenkins, & Chin-Chance, 1998; Manset & Washburn, 2000; Thurlow, Ysseldyke, & Reid, 1997). In general education, there has been a movement to improve or reform education over recent decades, and this has resulted in increased use of group-administered, norm-referenced assessments that are mandated by the various states for particular grade levels.
Coupled with this move, an effort to set high standards for graduation from high school has resulted in the implementation of minimum competency tests in a number of states. In general, these are tests that document minimum competencies in literacy, math, and, in some cases, writing that are administered to all secondary students at a particular grade level. In many states using such minimum competency assessments, all students must pass prior to graduation from high school. Of course, this presents some concern for students with learning disabilities who, although passing all of their courses, may have particular difficulty on such standardized assessments.
INTEREST BOX 5.12
TEACHING TIPS: CHECKLIST OF ASSESSMENTS FOR THE TEAM MEETING
Effective preparation for a team meeting can earn you, the teacher, the respect of your profes-sional colleagues on the team. Some teachers miss this opportunity to exchange knowledge of the child’s functioning with other team members, but you should take advantage of the situa-tion. Below is a list of assessments that you can complete before the meeting. Not all of these are appropriate or necessary in each instance, but you may wish to use this as a checksheet.
________ A teacher rating of the child’s behavior
________ Criterion-referenced assessment in basic skill areas
________ Error analysis in each relevant reading/language arts area
________ Error analysis in each relevant math area
________ A sight word and/or survival-skills word list
________ Samples of work indicating patterns of various errors
________ A log of critical behavioral problems over the last 2 weeks
________ Copies of any notes to parents
________ Sociometric information on social acceptance
________ Copies of notes from the child’s other teachers
________ Precision-teaching charts in particular skill areas
________ Instructional materials that the child is completing
________ A student self-rating of self-concept
________ Tier 1 and tier 2 response-to-intervention report/chart
ch05.indd 172ch05.indd 172 4/16/2007 8:08:14 AM4/16/2007 8:08:14 AM
CHAPTER FIVE ASSESSMENT OF LEARNING DISABILITIES 173
As a result of the moves toward minimum competency testing, researchers have be-gun to investigate the impact of these statewide assessment initiatives on students with learning disabilities (Commission, 2001; Gronna et al., 1998; Manset & Washburn, 2000; Thurlow et al., 1997). As early as 1997, Thurlow and co-workers reported that 17 states had requirements for a minimum competency test or some other type of exit exam. More recently, that number has increased, and concerns have likewise increased. The Commis-sion on Excellence in Special Education (2001) noted several problems in use of these as-sessments, which in many cases will not allow for modifications for students with learning disabilities. The commission notes:
Despite the fact that IDEA requires participation of students with disabilities in statewide as-sessments, children with disabilities are often excluded from these assessments to establish the accountability and progress of schools. This is a major problem, as such assessments generally are designed without consideration of modifications or accommodations students with disabilities may need to complete the assessment. (Commission, 2001)
The commission responded to this problem by calling on test manufacturers to use universal design principles that would allow teachers to modify these assessments for stu-dents with learning disabilities without sacrificing accuracy or test integrity. Further, many researchers have expressed concern that these statewide testing programs, and the general move toward accountability for higher standards, may be driving the school curriculum to an inappropriate degree. This debate is ongoing, but many general education teachers feel that they must teach to the standards within the curriculum, as represented by these statewide assessments, even if those standards are clearly inappropriate for students with learning disabilities in the general education classes. As a professional in the field, you should remain cognizant of this ongoing debate within the field. You will probably find yourself administering one or more of these assessments as you begin/continue your teach-ing career.
SUMMARY
This chapter has presented information on assessment procedures for students with learn-ing disabilities. Eligibility decisions were examined in terms of the various aspects of the federal definition of such disabilities. Although tests designed to measure basic psycho-logical processes or ability deficits have not proven to be technically adequate, certain sections of intelligence tests provide some information on developmental imbalances that may indicate impaired psychological processes. The discrepancy criterion was shown to be the single most influential indicator of learning disability, though presence of an ability-achievement discrepancy is merely a necessary and not a sufficient indicator of such a dis-ability. Also, the use of discrepancies may cease in the next few years as RTI procedures are phased in.
Assessment for instruction was shown to be the more recent emphasis in assessment for students with learning disabilities. Criterion-referenced assessment, curriculum-based as-sessment, various in-class assessments, and several examples of alternative assessments were
ch05.indd 173ch05.indd 173 4/16/2007 8:08:14 AM4/16/2007 8:08:14 AM
174 SECTION I INTRODUCTION TO LEARNING DISABILITIES
presented. Assessment for instruction planning was shown to be the responsibility of you, as the teacher, though various child-study teams will, in many cases, assist with these tasks.
The following points should assist you in studying this chapter:
Generally, psychological processes may be assessed using tests that are specific to that purpose or tests used to measure intelligence. The intelligence tests are more defensible in terms of technical standards than process tests.The discrepancy criterion is generally addressed by demonstrating a discrepancy be-tween intelligence and achievement. Typically, this is done by using a standard-score discrepancy or a regression-based discrepancy table.The newly proposed RTI procedures will impact how professionals document a learn-ing disability, and both special and general education teachers will play a role in RTI.The exclusionary clause in the definition of learning disabilities has not been ad-equately explained by scholars in the field, though this chapter presented some rough guidelines concerning how to differentiate between learning disabilities and other disabilities.Assessment for instruction may include norm-based assessments, observation re-ports, criterion-based assessments, curriculum-based assessments, in-class assess-ments, and alternative assessments. All of these are useful, but the last several are clearly the most appropriate assessments for instructional purposes.
■
■
■
■
■
QUESTIONS AND ACTIVITIES
1. What members of local child-study teams as-sist with assessment for instruction? Bring in a local team and several special education teach-ers for a round-table discussion of curriculum-based assessment.
2. What theoretical perspective provides the ba-sis for curriculum-based assessment? For error analysis? For intelligence testing? For norm-based achievement testing?
3. Explain the RTI procedure using the charts in Figure 5.2 and 5.3. Are these similar to the charts later in the chapter? How?
4. Discuss the different purposes of assessment. How does assessment for documentation of eligibility relate to assessment for instruction?
5. Read the report of the Commission on Excel-lence in Special Education and discuss the rec-ommendations on assessment with the class.
6. Present a debate between theorists who sup-port curriculum-based assessment and those who support assessment of psychological processes.
REFERENCES
Alexander, L. (1992). To assure the free appropriate public education of all children with disabilities. Fourteenth annual report to Congress on the im-plementation of the Individuals with Disabilities Act. Washington, DC: U.S. Office of Special Edu-cation and Rehabilitative Services.
Barkley, R. A. (1990). Attention deficit hyperactivity dis-order: A handbook for diagnosis and treatment. New York: Guilford.
Batsche, G., Elliott, J., Graden, J. L., Grimes, J., Kova-leski, J. F., Prasse, D., Reschly, D. J., Schrag, J., & Tilly, W. D. (2004). Response to intervention:
ch05.indd 174ch05.indd 174 4/16/2007 8:08:14 AM4/16/2007 8:08:14 AM
CHAPTER FIVE ASSESSMENT OF LEARNING DISABILITIES 175
Policy considerations and implementation. Alex-andria, VA: National Association of State Directors of Special Education.
Bender, W. N. (2002). Differentiating instruction for stu-dents with learning disabilities. Thousand Oaks, CA: Corwin.
Bender, W. N. (1984). Daily grading in mainstream classes. The Directive Teacher, 6(2), 4–5.
Bryant, B. R. (1999). The dynamics of assessment. In W. N. Bender (Ed.), Professional issues in learn-ing disabilities (pp. 385–414). Austin, TX: ProEd.
Chin, P. C., & McCormick, L. (1986). Cultural diversity and exceptionality. In N. G. Haring and L. McCor-mick (Eds.), Exceptional children and youth (4th ed.) (p. 117). Columbus, OH: Merrill.
Clarizio, H. F., & Phillips, S. E. (1986). Sex bias in the diagnosis of learning disabled students. Psychol-ogy in the Schools, 23, 44–52.
Commission on Excellence in Special Education (2001). Revitalizing special education for children and their families. Available from www.ed.gov/inits/commissionsboards/whspecialeducation.
Council for Exceptional Children (CEC) (2002). Com-mission report calls for special education reform. Today, 9(3), 1–6.
Council for Learning Disabilities (CLD) (1987). The CLD position statement. Journal of Learning Disabili-ties, 20, 349–350.
Epstein, M. H. (1999). Development and validation of a scale to assess the emotional and behavioral strengths of children and adolescents. Remedial and Special Education, 20, 258–262.
Epstein, M. H., Rudolph, S., & Epstein, A. A. (2000). Using strength-based assessment in transition planning. Teaching Exceptional Children, 32(6), 50–55.
Epstein, M. H., & Sharma, J. M. (1998). Behavioral and emotional rating scale: A strength-based approach to assessment. Austin, TX: ProEd.
Fuchs, D., & Fuchs, L. S. (2006). Introduction to response to intervention: What, why, and how valid is it? Reading Research Quarterly, 41(1), 93–98.
Fuchs, D., & Fuchs, L. S. (2005). Responsiveness-to- intervention: A blueprint for practitioners, poli-cymakers, and parents. Teaching Exceptional Children, 38(1), 57–61.
Gersten, R., & Dimino, J. A. (2006). RTI (response to in-tervention): Rethinking special education for stu-dents with reading difficulties (yet again). Reading Research Quarterly, 41(1), 99–108.
Gronna, S. S., Jenkins, A. A., & Chin-Chance, S. A. (1998). The performance of students with disabili-ties in a norm-referenced, statewide standardized testing program. Journal of Learning Disabilities, 31, 482–493.
Hyun, J. K., & Fowler, S. A. (1995). Respect, cultural sensitivity, and communication: Promoting par-ticipation by Asian families in the individualized family service plan. Teaching Exceptional Chil-dren, 28(1), 25–28.
Jones, C. J. (2001). CBAs that work: Assessment of stu-dents’ math content-reading levels. Teaching Ex-ceptional Children, 34(1), 24–29.
King-Sears, M. E., Burgess, M., & Lawson, T. L. (1999). Applying curriculum-based assessment in in-clusive settings. Teaching Exceptional Children, 32(1), 30–39.
Leinhardt, G., Seewald, A. M., & Zigmond, N. (1982). Sex and race differences in learning disabilities classrooms. Journal of Educational Psychology, 74, 835–843.
Lerner, J., & Chen, A. (1992). Critical issues in learning disabilities: The cross-cultural nature of learning disabilities: A profile in perseverance. Learning Disabilities Research and Practice, 7, 147–149.
Leung, B. P. (1996). Quality assessment practices in a diverse society. Teaching Exceptional Children, 28(3), 42–45.
Manset, G., & Washburn, S. J. (2000). Equity through accountability? Mandating minimum competency exit examinations for secondary students with learning disabilities. Learning Disabilities Re-search and Practice, 15, 160–167.
Marston, D. (2005). Tiers of intervention in responsive-ness to intervention: Prevention outcomes and learning disabilities identification patterns. Journal of Learning Disabilities, 38(6), 539–544.
Mastropieri, M. A., & Scruggs, T. W. (2005). Feasibility and consequences of response to intervention: Ex-amination of the issues and scientific evidence as a model for the identification of individuals with learning disabilities, Journal of Learning Disabili-ties, 38(6), 525–531.
Montague, M., McKinney, J. D., & Hocutt, A. (1994). As-sessing students for attention deficit disorder. In-tervention in School and Clinic, 29(4), 212–218.
National Joint Committee on Learning Disabilities (NJCLD) (2005). Responsiveness to intervention and learning disabilities: A report prepared by the National Joint Committee on Learning Disabilities. Learning Disability Quarterly 28(4), 249–260.
O’Connor, R. (2003, December). Tiers of intervention in kindergarten through third grade. Paper presented at the national research center on learning disabili-ties responsiveness-to-intervention symposium, Kansas City, MO. (See the discussion of this paper in Marston, 2005.)
Olivarez, A., Palmer, D. J., & Guillemard, L. (1992). Pre-dictive bias with referred and nonreferred black,
ch05.indd 175ch05.indd 175 4/16/2007 8:08:15 AM4/16/2007 8:08:15 AM
176 SECTION I INTRODUCTION TO LEARNING DISABILITIES
Hispanic, and white pupils. Learning Disability Quarterly, 15, 175–186.
Phillips, N. B., Fuchs, L. S., & Fuchs, D. (1994). Effects of classwide curriculum-based measurement and peer tutoring: A collaborative researcher-practi-tioner interview study. Journal of Learning Dis-abilities, 27(7), 420–434.
Scruggs, T. W., & Mastropieri, M. A. (2002). On babies and bathwater: Addressing the problems of identi-fication of learning disabilities. Learning Disabil-ity Quarterly, 25(2), 155–168.
Siegel, L. S. (1999). Issues in the definition and diagnosis of learning disabilities: A perspective on Gucken-berger v. Boston University. Journal of Learning Disabilities, 32, 304–319.
Swicegood, P. (1994). Portfolio-based assessment prac-tices. Intervention in School and Clinic, 30(1), 7–16.
Thurlow, M. L, Ysseldyke, J. E., & Reid, C. L. (1997). High school graduation requirements for students with disabilities. Journal of Learning Disabilities, 30, 608–616.
Watkins, M. W. (1996). Diagnostic utility of the WISC-III developmental index as a predictor of learning disabilities. Journal of Learning Disabilities, 29, 305–312.
Wechsler, D. (1991). Wechsler Intelligence Scale for Chil-dren (3rd ed.). San Antonio, TX: Psychological Corporation.
Vaughn, S., Linan-Thompson, S., & Hickman, P. (2003). Response to treatment as a means of identifying students with reading/learning disabilities. Excep-tional Children, 6 9(4), 391–409.
Vellutino, F. R., Scanlon, D. M., Sipay, E. R., Small, S., Chen, R., Pratt, A., & Denckla, M. B. (1996). Cog-nitive profiles of difficult to remediate and readily remediated poor readers: Early intervention as a vehicle for distinguishing between cognition and experiential deficits as basic cause of specific read-ing disability. Journal of Educational Psychology, 88, 601–638.
ch05.indd 176ch05.indd 176 4/16/2007 8:08:15 AM4/16/2007 8:08:15 AM