assessment of lipid oxidation in indonesian salted-dried marine catfish (arius thalassinus)
TRANSCRIPT

J Sci Food Agric 1990, 51, 193-205
Assessment of Lipid Oxidation in Indonesian Salted-dried Marine Catfish (Arius thalassinus)*
Gillian Smith, Mike Hole and Steven W Hanson
School of Food and Fisheries Studies, Humberside College of Higher Education, Nun’s Corner, Grimsby, South Humberside DN34 5BQ, UK
(Received 20 January 1989; revised version received 28 June 1989; accepted 25 July 1989)
ABSTRACT
Analysis of Indonesian salted-dried catfish (Arius thalassinus Ruppell) during processing and storage indicates that although peroxide, thiobarbituric acid and anisidine values give an indication of the onset of lipid oxidation, the values become negligible in the consumed product. Alternative methods have been developed and the signijcant, steady increases found in the levels of acetic acid soluble colour and fluorescence indicate that these parameters are realistic indicators of the tertiary products formed by interactions of carbonyl compounds with amino-type compounds. These increases are complemented by a fall in the level of free amino acids during storage of the product. A 30 % loss of polyunsaturated fatty acids was found during salting, but no subsequent loss was found during drying and storage.
Key words: Lipid oxidation, salted-dried fish, fluorescence, browning, marine catfish, Arius thalassinus.
INTRODUCHON
It was pointed out in an F A 0 review on the assessment and prevention of cured fish losses ( F A 0 1981) that harmful compounds such as lipid oxidation products might be present in cured fish but that little information was available with respect to their levels and whether they may be causing health, especially nutritional, problems.
Cured fish may be prepared by drying, smoking or salting, and combinations of these treatments. The curing process is important in the south-east Asian region * Part of this paper was presented at the seventh session of the Indo-Pacific Fishery Commission Working Party on Fish Technology and Marketing, Bangkok, Thailand, 19-22 April 1988.
193
J Sci Food Agric 0022-5142/90/$03.50 0 1990 Society of Chemical Industry. Printed in Great Britain

194 G Smith, M Hole, S W Hanson
where about 30% of the marine catch is utilised in this way. During the drying process, the water activity of the fish decreases to 0.7CL0.75. Salted-dried fish would be expected to have a shelf life of 4 to 12 weeks at these water activities, with the main types of spoilage including mould growth, beetle infestation and rancidity development (Poulter et a1 1982; Hanson and Esser 1985; Esser et a1 1986).
After death, fish lipids are subject to two major changes: lipolysis (hydrolysis) and oxidation, both of which may proceed via enzymic and non-enzymic mechanisms. Hydrolysis mainly occurs through the action of lipases (Olley and Lovern 1960; Koizumi et a1 1980).
The normal mechanism of lipid oxidation in processed flesh foods is autoxidation, but photo-oxidation and enzymic (lipoxygenase) catalysed oxidation also result in the production of hydroperoxides (Frankel 1985; Chan 1987; Chan and Coxon 1987). Further reactions of these peroxides produce aldehydes and ketones, eg malondialdehyde, together with other secondary breakdown products (Gunstone 1984; Frankel 1985; Gardner 1987; Grosch 1987).
When lipid oxidation occurs in foods such as salted-dried fish, further reactions are possible between the primary and secondary lipid oxidation products and other, mainly nitrogenous, food constituents, eg protein, amino acids and phospholipids (mainly phosphatidylethanolamine), to give tertiary products and the possibility of browning. Measurements of fluorescence, believed to be derived from interactions between carbonyl compounds and the amino group of amino acids (Chio and Tappel 1969; Kikugawa et al 1981), together with the determination of colour arising from further Maillard type reactions of the fluorescent Schiff base type compounds (Smith 1988), should give some indication of the extent of these tertiary reactions.
Lipid oxidation may also lead to nutritional damage, including losses of essential fatty acids, fat soluble vitamins and essential amino acids (Eriksson 1987), and the development of toxicity (Addis et al1983; Ames 1983; Pearson et al 1983), but little is known regarding the extent of such reactions in salted-dried fish.
In this paper the suitability of standard methods for assessing the degree of lipid oxidation in salted-dried catfish (Arius thalassinus) during processing and storage was examined. These were peroxide value, thiobarbituric acid value, anisidine value, iodine value and polyunsaturated fatty acid (PUFA) losses using gas chromatography of individual fatty acid methyl esters (FAMEs). Alternative techniques were also developed to measure the levels of tertiary products. This was achieved by monitoring fluorescence and browning. Additionally, the changes in the levels of free fatty acids and free amino acids were determined.
EXPERIMENTAL
Materials
Fish samples Marine catfish (Arius thalassinus Ruppell) were purchased unprocessed at the landing site in Cirebon, Indonesia, and then processed in Cirebon as described below.

Assessment of lipid oxidation in salted-dried murine catfish 195
Twelve catfish were graded according to size into four ‘small’ (< 1 kg), four ‘medium’ (- 1 kg) and four ‘large’ (< 2 kg). They were then split, gutted and washed. Three fish, one of each size, were subsequently taken to be analysed as control (unprocessed) fish. The remaining fish were immersed overnight in saturated brine at ambient temperatures (25-30°C). After salting, three fish, one of each size, were removed for later analysis at Humberside College. The other fish were placed on drying trays constructed of bamboo matting, which were placed outside in the sun to dry until the fish were approximately 50% of their original weight (2-5 days). A further three fish, as above, were removed after this stage for later analysis in Grimsby. The remaining three samples were stored at ambient temperature (25-30°C) inside a wooden box in the processing premises at Cirebon for 10 weeks. This time interval coincided with the next visit to the processor after the initial salt-drying.
All samples were frozen immediately after being taken, and were sent by air to Humberside College where they were stored at -60°C until analysed. Prior to analysis, whole fish (ie flesh, skin and bones) were sliced and minced while frozen and the mince was thoroughly mixed before samples were taken.
The proximate composition (moisture, salt, lipid and protein) of the fish samples were determined according to the methods of Egan et a1 (1981).
Chemicals All reagents and solvents were AR grade where possible, otherwise GPR grade, and obtained from May and Baker Ltd (Dagenham, Essex), BDH Ltd (Poole, Dorset) or Fisons Scientific Apparatus Ltd (Loughborough, Leks). Standard FAME mixes for peak indentification on the gas chromatokraph were obtained from Alltech Associates (Carnforth, Lancs).
Met hods
Standard methods Standard methods were used for lipid extraction (Bligh and Dyer 1959, as modified by Hanson and Olley 1963) and determinations of peroxide value (Lea 1952), Wij’s iodine value, expressed as g iodine (per 100 g lipid) (AOAC 1984), and free fatty acid value (Egan et a1 1981) on the lipid. A modified procedure, involving the use of glacial acetic acid to clarify some solutions, was used for the anisidine value (Egan et a1 1981).
TBA value The malondialdehyde content was determined directly on a known weight of fish sample (w g) using a TBA distillation method (Tarladgis et al 1960) with the following modification (Banasihan 1985): 1.0 ml of 2 g litre-’ ethylene diaminetetracetic acid (EDTA) disodium salt solution and 5 drops of an antioxidant mixture (0.3 g of butylated hydroxyanisole (BHA) in 5-4 g of propylene glycol mixed with 0.3 g of butylated hydroxytoluene (BHT) in 4 g of Tween 40) were added to the acidified sample mixture in a 2-neck round-bottomed flask. The distillation was carried out under nitrogen and the flask was heated at such a rate that 50ml of distillate was collected in the shortest possible time (20 min).

196 G Smith, M Hoie, S W Hanson
A standard curve was prepared from tetraethoxypropane (TEP) solution to give solutions containing the equivalent of 0, 0.2, 0.4, 0.6, 0.8 and 1.Opg ml-' malondialdehyde (0.3056 g of TEP was dissolved in 1 litre of distilled water, 10 ml of this was diluted to 1 litre to give the standard concentration of 0.01389 nmol litre- ', 5 ml of this solution contained the equivalent of 1.0 pg ml-' malondialdehyde). These standard solutions and an aliquot of the distillate were subsequently treated with TBA as detailed by Tarladgis et a1 (1960). Absorbances were measured at 532 nm and related to the concentration of malondialdehyde from the calibration curve ( T pg ml-').
The TBA value was calculated as:
500x T 7 x w
mg malondialdehyde (kg fish)-'
based on a measured 70% recovery of malondialdehyde in the distillation step (Banasihan 1985).
Acetic acid soluble colour ( A A S C ) This was determined on the fish samples using the method developed by Eshiet (1984). Glacial acetic acid (50 ml (v ml)) was added to 0.5-1.5 g of a representative fish sample, accurately weighed (w g), in a 150-ml beaker. After stirring the mixture for 15 min using a magnetic stirrer, the contents of the beaker were filtered through Whatman GP filter paper. The absorbance ( E ) of the filtrate was measured at 400 nm.
v x E AASC=- absorbance units ml g-'
W
Fluorescence This was determined on the fish tissue by a method adapted from Fletcher et a1 (1973). Fish tissue (about 1.5 g (w g)) was accurately weighed into a homogenising flask and 20 ml of chloroform together with 10 ml of methanol were added. After blending for 90 s in a 45°C water bath, 30 ml of distilled water was added before homogenising for a further 30 s. The homogenate was transferred to glass centrifuge tubes and centrifuged at 2000 x g for 5 min. Aliquots of the upper aqueous and lower organic layers were collected, and filtered if cloudy. A few drops of methanol were added to the organic layer if this was still cloudy after filtering. The organic layer was then exposed to a source of high intensity UV light (Camag, 254 nm) to destroy any retinol present. The excitation and emission spectra of the extracts were determined and subsequent fluorescence measurements ( F ) were made at an excitation wavelength of 362 nm and an emission wavelength of 440 nm with a Shimadzu spectrofluorophotometer RF-540.
To ensure linearity of fluorescence measurements with respect to the concentration of fluorescent material, the following procedure was carried out. Serial dilutions of a very highly fluorescent extract were made, the fluorescence was measured at the above wavelengths, and a graph was plotted of fluorescence against dilution. The limit of linearity was noted, and it was subsequently ensured that all

Assessrnenl of lipid oxidation in salted-dried marine catjsh 197
fluorescent readings fell in the linear region of the curve. This was achieved by suitable dilution of extracts.
Quinine sulphate solution (1 pg ml-' in 0 1 M sulphuric acid) was used as a standard of fluorescence intensity ( S ) . The fluorescence of the sample relative to the standard was calculated using the following formula:
F x V Fluorescence (ml g - ') =-
s x w
where V ml =volume of extract (diluted where necessary) giving fluorescence F .
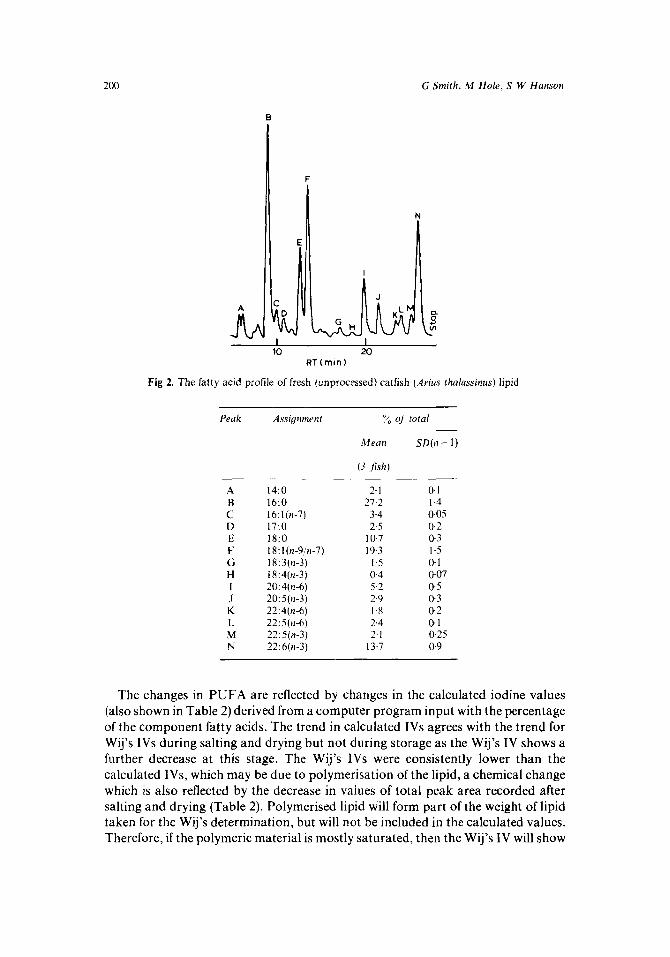
FAMEs A modified methylation procedure (IUPAC 1979; Salter 1988) was used to obtain FAMEs from the fish lipid. These were separated and analysed using an SP2330 packed column in a Shimadzu GLC-RIA gas chromatograph with a Shimadzu GC 1 data processor. Nitrogen was used as the carrier gas with a flow rate of 25 ml min-', initial temperature 180°C for 5 min rising to 230°C at a rate of 4°C min- '. Nonadecanoic acid was used as an internal standard at a concentration of 1 mg ml- ' and eluted directly after peak F, Fig 2, which corresponded to a region of the profile which gave no significant peaks. The final relative fatty acid concentrations ( C ) were calculated per 100 mg of lipid methylated and expressed relative to 19:0= 100.
s x 0.1 x 100 WP
C =
where S =sample peak area; P = standard peak area; and W = weight of sample (g). Standard PUFA retention times, hydrogenation of FAMEs (Hardy et a1 1979;
Christie 1982) and comparisons with previous work with the SP2330 column for fish oil FAMEs analysis (Christie 1982; Ahmad 1985) were used for identification of peaks.
Free amino acids The copper method of Pope and Stevens (1939) was used to determine amino nitrogen.
RESULTS
Proximate composition
The data in Table 1 show that, during drying, the moisture content decreased from approximately 740 to 440 g kg ~ ' , with accompanying apparent increases in levels of salt, lipid and protein. The final moisture content of the stored sample, at 467 g kg - ', was slightly but significantly higher than the dried value, indicating an absorption of moisture during storage. This absorption would account for the apparent decrease in protein content during storage. The reason for the increase in salt over this period is unclear, but it may be due to sampling variation.

G Smith, M Hole, S W Hanson 198
TABLE 1 Proximate analysis" and free amino acid (AA) content of salted-dried catfish (Arius
thalassinus) during processing and storage (g kg- I)'
Unprocessed Salted Dried Stored
Moisture 743.1 (17.5) 694.5 (12.6) 435.0 (10.8) 467.2 (7.7) Salt 0.8 (01) 52.6 (1-6) 102.5 (3.1) 117-2 (2.5) Lipid 32.4 (8.1) 37.6 (12.9) 55.0 (11.9) 54.5 (15.6) Protein 224.0 (10.8) 216.1 (12.6) 407.0 (17.6) 361.3 (20.1) Free amino acid
Free amino acid
Free amino acid
nitrogen in flesh 0176 (0052) 1.29 (0.59) 5.27 (0.23) 2.41 (0.75)
in flesh 1.55 (0.45) 11.33 (5.23) 46.34 (2.02) 21.19 (6.56)
in protein 7.0 (2.2) 53.3 (26.3) 114.0 (8.5) 59.4 (20.2)
Wet weight basis. All values are means of 9 determinations (3 x 3 fish) with standard deviations in parentheses.
A conversion factor of 8.8 was used to calculate the amino acid content from amino acid nitrogen.
Changes in standard parameters
Figure 1 shows the changes in peroxide, anisidine, TBA, free fatty acid and iodine values during salting, drying and storage of catfish ( A thalassinus).
Peroxide values increased to a maximum during the processing before falling to zero in the stored product as found by Eshiet (1984) and Jeong and Park (1983) for salted-dried mackerel (Scomber scombrus) mince and sardine (Sardinops melanosticta), respectively. The peroxide value of the fresh (unprocessed) catfish was 43 mEq kg - lipid and as such would be classified as rancid by Connell(l980). This value may have arisen after catching, since the fresh fish may be held at tropical ambient temperatures (25-30°C) before being sold for processing. Overall, it is possible to conclude that peroxide values are unreliable indicators of lipid oxidation since a low value, in isolation, may indicate either limited or extensive lipid oxidation.
The TBA and anisidine values (Fig 1) also reach maxima and then decrease in the stored products, indicating that these determinations are also unsuitable measures of advanced lipid oxidation.
The free fatty acid (FFA) results shown in Fig 1 demonstrate that extensive hydrolysis of the lipid has occurred upon salting the fish (up to 300 g kg-' FFA), with a final level of 500 g kg- FFA in the stored samples, as also found by Lovern (1 962).
The fresh catfish had an iodine value (IV) of 118 which decreased by 20% during processing and storage. This is consistent with loss of polyunsaturation through lipid oxidation.
Fatty acid profiles
A typical fatty acid profile for A thalassinus lipid is shown in Fig 2. If this is compared with profiles of Atlantic mackerel (Scomber scombrus; Ackman 1980),

Assessment of lipid oxidation in salted-dried marine catjsh 199
226 -r 176
160 1 126
100
76
60
26
0
. ~-
C
Frerh Selted Drled =Stored
Fig 1. Lipid oxidation parameters for Arius rhalassinus during processing. All A values are means of triplicate determinations on three fish (ie nine values), with SD in parentheses (a) Peroxide value (mEq kg-' lipid); (B) anisidine value (absorbance g- ' lipid); (C) TBA value (mg MA kg- '); (D) free fatty acid
value (g oleic acid kg-' x 0.1); (E) iodine value (g per 100 g lipid).
then several differences emerge, including greater saturation of the Arius lipid and a greater n-6/n-3 ratio. In particular 5.2 % of arachidonic acid (20:4n-6) is present in Arius lipid compared with levels of < 2 % for S scombrus. These trends have been observed elsewhere in tropical marine fish (Gopakumar and Nair 1972; Gibson 1983; Fogerty et a1 1986). Additionally, in Fig 2, no clear peak for linoleic acid is apparent, ie it is present at a concentration of < 1 %.
To allow a comparison of the effect of processing on the fish lipid, methyl nonadecanoate was added as an internal standard and the sample peak sizes were calculated relative to this. The significance of the change in levels of fatty acids, shown in Table 2, was analysed using a Student's t-test. There was a significant decrease ( P < 0.05) in the levels of each of the C20 and C22 polyunsaturates upon salting, giving an average decrease of 28*4%, but not in the case of any other fatty acid. A more unexpected change in levels of PUFA, particularly 20:4(n-6), 22:4(n-6) and 22: 6(n-3), appeared during storage of salted-dried catfish in that these fatty acids showed an apparent increase over this stage. This may be attributable to possible sample variation. Therefore, the determination of changes in the fatty acid profile appears to be unsuitable as a measure of the extent of lipid oxidation in this product.
200 G Smith, M Hole , S W Hanson
RT(rn ln)
Fig 2. The fatty acid profile of fresh (unprocessed) catfish (Arius thalassinus) lipid
Peak Assiyrzrnrni :< oJ iota1
Mean SD(n - 1)
(3 f ish)
A B C D E F G H I J K L M N
14:O 16:O 16:l (n-71 17:O 18:O 18:l(n-9!n-7) 18:3(n-3) 18:4(n-3) 2(3:4(n-6) 20:5(n-3) 22:4(n-6) 22: 5(t1-6) 22:5(n-3) 22:6(n-3)
2.1 27.2
3.4 2.5
10.7 19.3
1.5 0.4 5.2 2.9 1.8 2.4 2.1
13.7
0.1 1 4 0.05 0.2 0.3 1 .5 0. I 0.07 0.5 0.3 0.2 0.1 0.25 0.9
The changes in PUFA are reflected by changes in the calculated iodine values (also shown in Table 2) derived from a computer program input with the percentage of the component fatty acids. The trend in calculated IVs agrees with the trend for Wij’s IVs during salting and drying but not during storage as the Wij’s IV shows a further decrease at this stage. The Wij’s IVs were consistently lower than the calculated IVs, which may be due to polymerisation of the lipid, a chemical change which is also reflected by the decrease in values of total peak area recorded after salting and drying (Table 2). Polymerised lipid will form part of the weight of lipid taken for the Wij’s determination, but will not be included in the calculated values. Therefore, if the polymeric material is mostly saturated, then the Wij’s IV will show

Assessment o/' lipid oxidation in sulted-dried marine catfish 201
TABLE 2 The fatty acid profiles of catfish (Arius thalassinus) lipid at various stages of processing.
Average peak areas relative to 19:0= 100
Peak
14:O 16:O 16:l 17:O 18:O 18:l 19:O 18:3 18:4 20:4 20: 5 22:4 22:5 (n-6)
22:6 Unknown
Total
Calc IV Wij's IV
22:5 (n-3)
Unprocessed Salted Dried Stored
17.7 (1.0) 230.2 (12.2)
28.7 (0.5) 21.3 (2.0) 90.3 (2.6)
163.6 (13.1) 100.0 12.4 (0.8) 3.1 (0.6)
43.8 (4.2) 24.3 (2.9) 14.8 (2.0)
17.5 (2.1) 116.0 (7.3) 42.0 (7.5)
946 (26)
135.2 (6.7) 118.4 (11.5)
20.1 (1.0)
15.2 (1.4) 212.7 (32.8)
26.9 (3.4) 18.2 (2.9) 83.8 (11.6)
151.1 (14.5) 100.0 14.0 (0.6) 4.1 (1.0)
30.6 (7.1) 16.3 (1.1) 9.4 (1.4)
16.9 (1.9) 12.7 (0.4) 84.3 (6.4) 30.0 (8.1)
826 (55) 123.4 (8.0) 112.6 (7.9)
16.3 (1.9) 211.6 (26.3) 27.6 (1.8) 18.5 (0.2) 86.5 (9.0)
141.9 (19.9) 1000 11.7 (0.6) 4 2 (0.7)
28.0 (3.1) 14.9 (2.3) 8.8 (1.6)
17.3 (1.2)
79.2 (1 0.0) 28.5 (4.4)
12.0 (2.1)
807 (59)
114.3 (2.6) 101.9 (5.4)
12.9 (0.9) 193.0 (28.3) 26.3 (2-8) 17.3 (2.4) 83.8 (5.8)
140.3 (18.7) 100.0 11.5 (0.4) 4.9 (0.9)
17.1 (3.8) 14.5 (3.9) 20.9 (3.9) 16.3 (2.6) 98.0 (7.0) 30.0 (6.1)
37.4 (5.3)
824 (54)
127.5 (7.7) 94-3 (8.8)
All values are mean of 9 determinations (3 x 3 fish) with standard deviations in parentheses.
an overall lower degree of unsaturation per unit weight of lipid than calculated values.
Colour and fluorescence
Figure 3 shows the changes in values of acetic acid soluble colour, and fluorescence (chloroform/methanol soluble), during salting, drying and storage of catfish. The colour values remained relatively constant during salting and drying but increased during storage. Fluorescence values, however, remained low during salting but thereafter increased. The observed development of fluorescence which precedes the formation of colour is as expected (Chio and Tappel 1969; Kikugawa et a1 1981; Pokorny 1981). The increases in colour and fluorescence suggest that these could be more reliable indicators of lipid oxidation during storage of salted-dried fish than the standard methods.
Free amino acids
Despite some large variations between the fish samples, the data in Table 1 clearly show that free amino acids accumulate (through proteolysis) during the salting and drying stages of fish processing. Additionally, there is a significant decrease in the level of free amino acid nitrogen during storage of the product. Similar losses of amino nitrogen in dried fish have been observed by Lee et a! (1982) and Byun et al (1978). A 54% decrease in available lysine has also been observed during the

202 G Smith, M Hole, S W Hanson
1 Aoetlo eold roluble oolour 1 Fluoreeoenoe
Abeorbanoe unlte ml/Q Reletlve emleelon ml/e
10 L (1.70)
Frerh pizd Salted Drled 69 Stored
Fig 3. Changes in colour and fluorescence of Arius thulassinus during processing. All values are means of triplicate determinations on three fish (ie nine values) with SD in parentheses.
processing and storage of catfish (Smith 1988). These results reinforce the conclusion of Lee et al (1982) that available lysine and extractable nitrogenous compounds are involved in the initial stages of brown pigment formation.
DISCUSSION
Fluorescence and acetic acid soluble colour appear to be more useful indicators of lipid oxidation during processing and storage of salted-dried Arius than peroxide, TBA and anisidine values.
The origin of the fluorescence and colour has been investigated with model systems of aerated fish oil at 25°C. These preliminary studies indicate that the products of lipid oxidation react with amino compounds to produce fluorescence and browning (Smith 1988). No browning or fluorescence developed during oxidation of the fish oil alone at 25°C. Interactions with phospholipid resulted in chloroform/methanol soluble fluorescence while reactions with amino acids led to chloroform/methanol and aqueous soluble fluorescence. Although protein was not involved in the development of fluorescence in a protein/fish oil mixture, protein and amino acids were found to contribute to browning when water (a polar solvent) was present.
Similar reactions are likely in the salted-dried fish, as demonstrated by the reduction in the level of free amino acids which accompanies the increases in fluorescence and browning during storage of the product.
An approximately 30% loss of PUFA was apparent during the salting of catfish, but no further significant change was observed during subsequent drying and

Assessment of lipid oxidation in salted-dried marine catJish 203
storage of the product, despite a further decrease in Wij’s IV (see the section ‘Fatty acid profiles’). I t must also be noted that after storage of salteddried catfish, although zero levels of hydroperoxides and malondialdehyde were recorded, high levels of potentially oxidisable PUFA remained. The suggested antioxidant properties of ‘polymeric’, Maillard type lipid oxidation products (El-Khateeb and El-Zeany 1982) present in the catfish may account for this observation.
I t is likely that values of fluorescence can be correlated with nutritional quality to give an indication of the potential useful shelf-life of this type of product.
ACKNOWLEDGEMENT
We are indebted to the Overseas Development Administration (ODA) for providing the funding for one of us (G Smith).
REFERENCES
Ackman R G 1980 Fish lipids. Part 1 . In: Advances in Fish Science and Technology, ed Connell J J. Fishing News Books, Farnham, pp 86103.
Addis P B, Csallany A S, Kindom S E 1983 Some lipid oxidation products as xenobiotics. In: Xenobiotics in Foods and Feeds, eds Finley J W & Schwass D E. American Chemical Society, Washington, DC, pp 85-98.
Admad N 1985 Investigation of nutritionally important fatty acids. M Phil thesis, University of Loughborough.
Ames B N 1983 Dietary carcinogens and anticarcinogens. Science 221 12561264. AOAC 1984 Iodine value. In: Oficial Methods of Analysis (14th edn), Association of Official
Analytical Chemists, Washington, DC, p 506. Banasihan E T 1985 Inhibition of oxidative rancidity development in minced fatty fish. PhD
thesis, University of Reading. Bligh E G, Dyer W J 1959 A rapid method of total lipid extraction and purification. Can J
Biochern Physioi 37 911-917. Byun D S , Song Y 0, Pyeun J H 1978 Changes in available lysine and lipid oxidation
products during the storage of dried sea eel (Muraesox cinereus). Korean J Food Sci Techno1 10 387.
Chan H W S 1987 The mechanism of autoxidation. In: Autoxidation of Unsaturated Lipids, ed Chan H W S. Academic Press, London, pp 1-16.
Chan H W S, Coxon D T 1987 Lipid hydroperoxides. In: Autoxidation of Unsaturated Lipids, ed Chan H W S. Academic Press, London, pp 17-50.
Chio K S, Tappel A L 1969 Synthesis and characterisation of the fluorescent products derived from malonaldehyde and amino acids. Biochemistry 8 2821-2827.
Christie W W 1982 Lipid Analysis (2nd edn). Pergamon Press, Oxford. Connell J J 1980 Control of Fish Quality. Fishing News (Books), Farnham. Egan H, Kirk R S, Sawyer R 1981 Pearson’s Chemical Analysis of Foods (8th edn). Churchill-
Livingstone, London. El-Khateeb S Z, El-Zeany B A 1982 Oxidised lipids-proteins browning reactions. IX. Effect
of lipoinsoluble brown products on subsequent browning reactions. Riv i tal Sost Grasse 56
Eriksson C E ‘1987 Oxidation of lipids in food systems. In: Autoxidation of Unsaturated 257-259.
Lipids, ed Chan H W S . Academic Press, London, pp 207-231.

204 G Smith, M Hole, S W Hanson
Eshiet I N 1984 The influence of salt on rancidity development in salted dried fish. MPhil thesis, University of Loughborough.
Esser J R, Hanson S W, Rosenthal A J , Tausin S, Harijanto 1986 Report on the Training Programme Carried Out in East Java During October and November 1986. Overseas Development Administration, London. Directorate General of Fisheries, Jakarta.
F A 0 1981 The prevention oflosses in cured fish. F A 0 Fish Technology Paper, N o 219, FAO, Rome.
Fletcher B L, Dillard C J , Tappel A L 1973 Measurement of fluorescent lipid peroxidation products in biological systems and tissues. Anal Riochem 52 1-9.
Fogerty A C, Evans A J , Ford G L, Kennet B H 1986 Distribution of w6 and w3 fatty acids in lipid classes in Australian fish. Nutr Rep Int 33 777-786.
Frankel E N 1985 Chemistry of free radical and singlet oxidation of lipids. Prog Lipid Res 23 197-221.
Gardner H W 1987 Reactions of hydroperoxides: products of high molecular weight. In: Autoxidation of Unsaturated Lipids, ed Chan H W S. Academic Presf, London, pp 51-93.
Gibson R A 1983 Australian fish-an excellent source of both arachidonic and w3 polyunsaturated fatty acids. Lipids 18 743 -752.
Gopakumar K, Nair M R 1972 Fatty acid composition of eight species of Indian marine fish. J Sci Food Agric 23 493-752.
Grosch W 1987 Reactions of hydroperoxides: products of low molecular weight. In: Autoxidation of Unsaturated Lipids, ed Chan H W S. Academic Press, London,
Gunstone F D 1984 Reaction of oxygen and unsaturated fatty acids. J Amer 0;I Chem SOC 61
Hanson S W, Esser J R 1985 Investigation into Post Harvest Losses of Cured Fish in South East Asia. O D A Project R3693. Report 9 , Final Report. Overseas Development Administration, London.
Hanson S W F , Olley J 1963 Application of the Bligh and Dyer method of lipid extraction t o tissue homogenates. Riochem J 89 101.
Hardy R, McGill AS, Gunstone F D 1979 Lipid and autoxidative changes in cold stored cod (Gadus morhuu). J SOC Food Agric 30 999-1006
International Union of Pure and Applied Chemists (IUPAC) 1979 Standard Methods for the Andysis of Oils, Fats and Deriuatioes (6th edn). IUPAC, New York, pp 96-102.
Jeong H K, Park Y K 1983 Condition of processing and change of chemical composition on the salted dried sardine during storage. Bull Korean Fish Soc 16 231.
Kikugawa K, Machida Y, Kida M, Kurechi T 1981 Studies on peroxidised lipid. I11 Fluorescent pigments derived from the reaction of malonaldehyde and amino acids. Chem Pharm Bull 29 3003-301 1.
Koizumi C, Terashima H , Wada S, Nonaka J 1980 Lipid oxidation of salted freeze-dried fish meats at different equilibrium relative humidities. Bull Japan SOC Sci Fish 46 871-877.
Lea C H 1952 Methods for determining peroxide in lipids. J Sci Food Agric 3 586594. Lee K H, Song D S, You B J , Kim M N 1982 Changes in available lysine and extractable
nitrogen and extent of browning during the storage of dried fish meat. Bull Korean Fish Soc
Lovern J A 1962 The lipids of fish and changes occurring in them during processing and storage. In: Fish in Nutrition, eds Heen E & Kreizer R. Fishing News (Bookd) Ltd, London pp 86111 .
Olley J, Lovern J A 1960 Phospholipid hydrolysis in cod flesh stored at various temperatures. J Sci Food Agric 11 644-652.
Pearson A M, Gray J I, Wolzak A M, Horenstein N A 1983 Safety implications of oxidised lipids in muscle foods. Food Technol 37 121-129.
Pokorny J 1981 Browning from lipid-protein interactions. Prog Food Nutr Sci 5 421-428. Pope C G, Stevens M F 1939 The determination of amino nitrogen using a copper method.
pp 95-139.
44 1 -447.
15 271-282.
Biochemistry 33 107%1077.
Assessment of lipid oxidation in salted-dried marine catfish 205
Poulter R G, Doe P E, Olley J 1982 Isohalic sorption isotherms, 11. Use in prediction of storage life of dried salted fish. .J Food Techno! 17 201-210.
Salter R M 1988 Analysis of food lipid material using capillary gas-liquid chromatography. PhD thesis, CNAA, Humberside College of Higher Education.
Smith G 1988 Lipid oxidation in south-east Asian salted-dried fish. PhD thesis, CNAA, Humberside College of Higher Education.
Tarladgis B G, Watts B M, Younathan M T, Dugan L 1960 A distillation method for the quantitative determination of malondialdehyde in rancid foods. J Amer Oil Chem Soc 37 4449.