assessment of lottery market issues - gov uk · 2013. 2. 5. · assessment of lottery market issues...
TRANSCRIPT
Assessment of Lottery Market Issues
Draft Report for the National Lottery Commission, the Department for Culture, Media and Sport, and the Gambling Commission
17 April 2012
Project Team
Stuart Holder Helen Smith Adam Boult
This report sets forth the information required by the terms of NERA’s engagement by the National Lottery Commission and is prepared in the form expressly required thereby. This report is intended to be read and used as a whole and not in parts. Separation or alteration of any section or page from the main body of this report is expressly forbidden and invalidates this report.
Information furnished by others, upon which all or portions of this report are based, is believed to be reliable but has not been verified. No warranty is given as to the accuracy of such information. Public information and industry and statistical data are from sources we deem to be reliable; however, we make no representation as to the accuracy or completeness of such information and have accepted the information without further verification.
The findings contained in this report may contain predictions based on current data and historical trends. Any such predictions are subject to inherent risks and uncertainties. In particular, actual results could be affected by future events which cannot be predicted or controlled, including, without limitation, changes in business strategies, the development of future products and services, changes in market and industry conditions, the outcome of contingencies, changes in management, changes in law or regulations. NERA accepts no responsibility for actual results or future events.
The opinions expressed in this report are valid only for the purpose stated herein and as of the date of this report. No obligation is assumed to revise this report to reflect changes, events or conditions, which occur subsequent to the date hereof.
All decisions in connection with the implementation or use of advice or recommendations contained in this report are the sole responsibility of National Lottery Commission. This report does not represent investment advice nor does it provide an opinion regarding the fairness of any transaction to any and all parties.
This report is for the exclusive use of the National Lottery Commission. There are no third party beneficiaries with respect to this report, and NERA does not accept any liability to any third party. In particular, NERA shall not have any liability to any third party in respect of the contents of this report or any actions taken or decisions made as a consequence of the results, advice or recommendations set forth herein.
NERA Economic Consulting 15 Stratford Place London W1C 1BE United Kingdom Tel: +44 20 7659 8500 Fax: +44 20 7659 8501 www.nera.com
Contents
Contents
Executive Summary i
1. Introduction 1
2. Potential Lessons from the Economic
Literature 3 2.1. Evidence from the Economic Literature 4 2.2. Conclusions 17
3. Potential Lessons from Overseas Lotteries 19 3.1. Italy 19 3.2. Netherlands 23 3.3. Other Countries 26
4. Impact on National Lottery Sales 27 4.1. Introduction 27 4.2. Context 28 4.3. Impact on Individual Games 30 4.4. Conclusions 42
5. Impact on Society Lottery Sales 44
6. Impact on Future Licence Competitions 47 6.1. Background 47 6.2. Implications for Key Players 48 6.3. Overall Assessment 51
7. Key Features of Existing Society Lotteries 52 7.1. All Society Lotteries 53 7.2. Differences Between Types of Lottery 58
8. Potential Impact of Greater Competition 60 8.1. The Impact of the Health Lottery 60 8.2. Other Possible Competitors 64 8.3. Policy Implications 65
Appendix A. Additional Society Lottery Charts 67
Appendix B. References Cited in Literature Survey 74
Assessment of Lottery Market Issues Executive Summary
NERA Economic Consulting i
Executive Summary
This draft report, by NERA Economic Consulting for the National Lottery Commission, the Department of Culture, Media and Sport and the Gambling Commission, considers the impact of the Health Lottery or similar multiple society lotteries on the wider lottery market.1
The Impact of the Health Lottery
The Health Lottery, which was launched on 8 October 2011, is an umbrella brand for 51 separate society lotteries. At present, two society lotteries participate in the draw each week, with 20.3 per cent of proceeds being passed on to the relevant good cause and 35 per cent of proceeds being paid, on average, as prizes. The Health Lottery’s target is to raise £50 million a year for health causes, which would require annual sales of £246 million (around £4.7 million per week). During its first quarter, it raised £8 million for health causes, suggesting sales of around £3 million per week. Even at this level of sales, the 51 society lotteries represented by the Health Lottery brand are collectively at a scale of operation that is very significant when we consider that the 447 society lotteries licensed by the GC in 2010/11, generated total annual sales of £208 million.
Experience of previous market entry and from overseas lotteries described in the economic literature would lead us to expect the Health Lottery to have some impact on National Lottery sales. However, market entry usually leads to an increase in total lottery sales, especially when new games are differentiated from existing games (as is certainly the case between the Health Lottery and Lotto or Euromillions). And the economic literature also provides some examples where existing games have benefitted from market entry or improvements in a competitor’s game, probably reflecting marketing spillovers or multiple purchases where tickets for both games are sold in the same location.
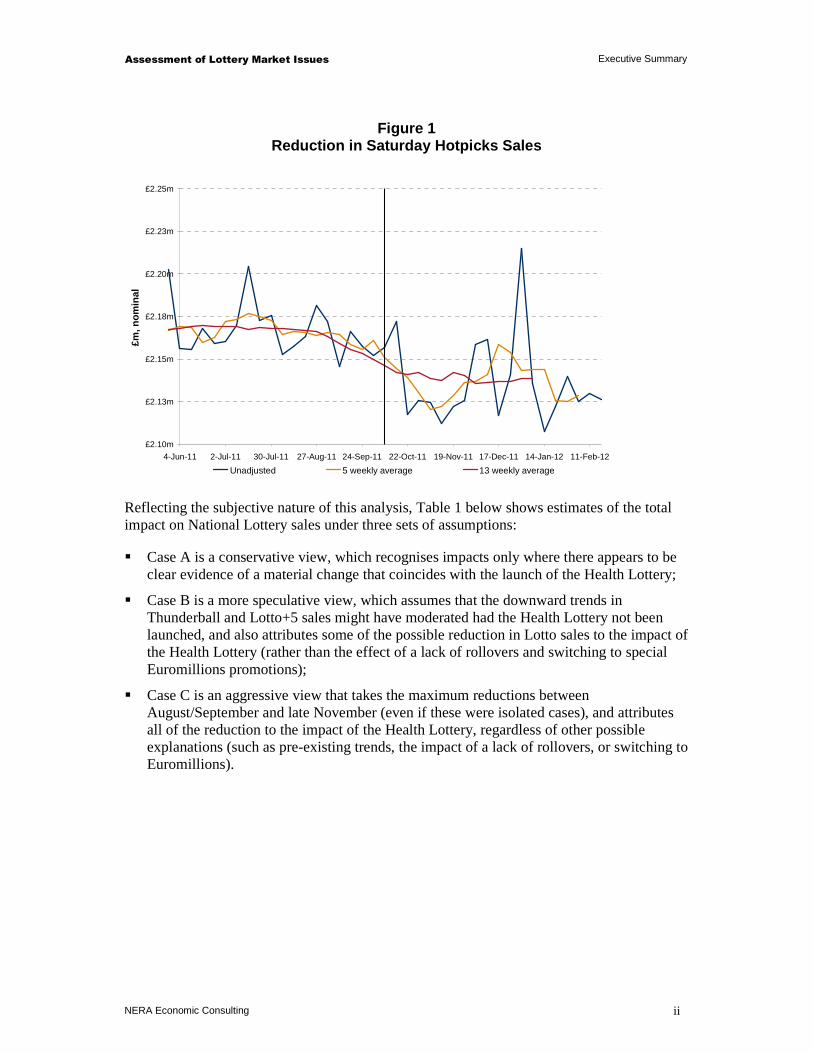
We have examined National Lottery sales data for the periods immediately before and after the launch of the Health Lottery. As shown in Figure 1, there appears to have been a reduction in Saturday Hotpicks sales that coincided with the launch of the Health Lottery, though the difference is relatively small (between £30,000 and £50,000 a week, plus a possible reduction of £10,000-20,000 a week in Wednesday Hotpicks sales). For other games, there is no sign of such a clear impact, though some of the data are more difficult to interpret. Sales of many games (including the three Thunderball draws and Lotto+5) were already falling before the launch of the Health Lottery, and potential impacts are difficult to estimate when sales vary significantly from week to week (as the conclusions depend on the precise weeks chosen for any comparison).
1 Throughout this report, we use the term “the Health Lottery” to refer to both the Health Lottery ELM Ltd and the 51 society lotteries operated under the Health Lottery brand.
Assessment of Lottery Market Issues Executive Summary
NERA Economic Consulting ii
Figure 1 Reduction in Saturday Hotpicks Sales
£2.10m
£2.13m
£2.15m
£2.18m
£2.20m
£2.23m
£2.25m
4-Jun-11 2-Jul-11 30-Jul-11 27-Aug-11 24-Sep-11 22-Oct-11 19-Nov-11 17-Dec-11 14-Jan-12 11-Feb-12
£m, n
omin
al
Unadjusted 5 weekly average 13 weekly average
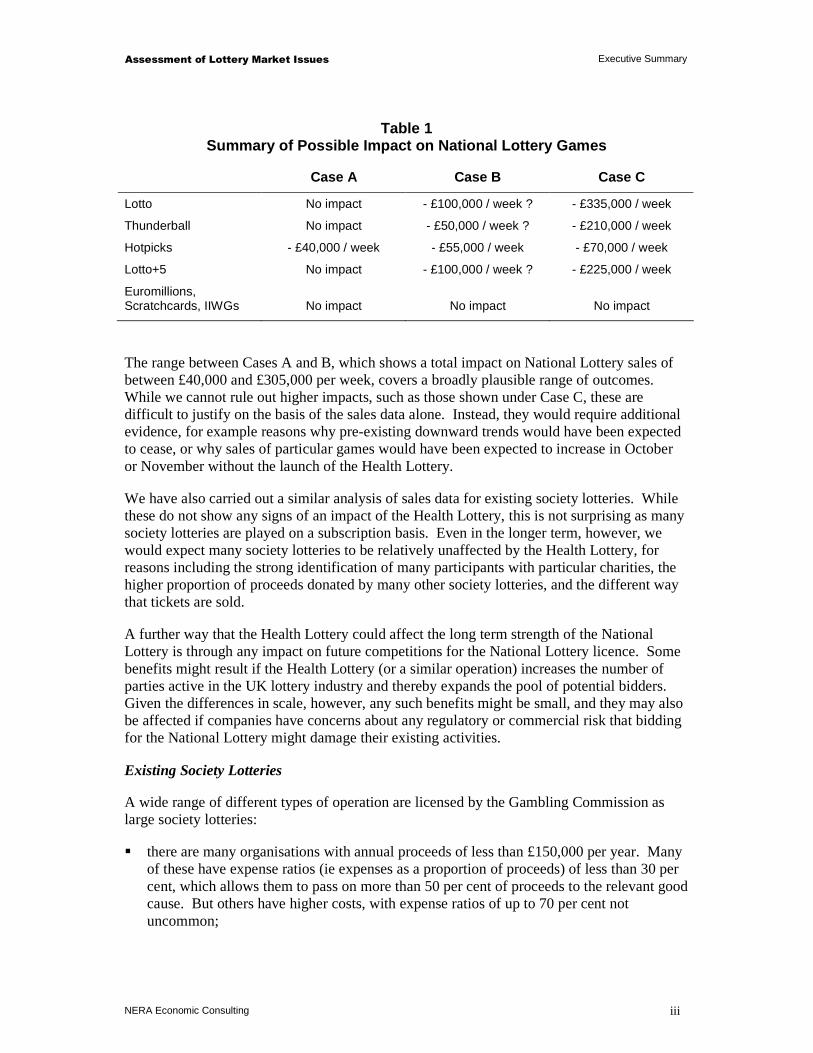
Reflecting the subjective nature of this analysis, Table 1 below shows estimates of the total impact on National Lottery sales under three sets of assumptions:
� Case A is a conservative view, which recognises impacts only where there appears to be clear evidence of a material change that coincides with the launch of the Health Lottery;
� Case B is a more speculative view, which assumes that the downward trends in Thunderball and Lotto+5 sales might have moderated had the Health Lottery not been launched, and also attributes some of the possible reduction in Lotto sales to the impact of the Health Lottery (rather than the effect of a lack of rollovers and switching to special Euromillions promotions);
� Case C is an aggressive view that takes the maximum reductions between August/September and late November (even if these were isolated cases), and attributes all of the reduction to the impact of the Health Lottery, regardless of other possible explanations (such as pre-existing trends, the impact of a lack of rollovers, or switching to Euromillions).
Assessment of Lottery Market Issues Executive Summary
NERA Economic Consulting iii
Table 1 Summary of Possible Impact on National Lottery Game s
Case A Case B Case C
Lotto No impact - £100,000 / week ? - £335,000 / week
Thunderball No impact - £50,000 / week ? - £210,000 / week
Hotpicks - £40,000 / week - £55,000 / week - £70,000 / week
Lotto+5 No impact - £100,000 / week ? - £225,000 / week
Euromillions, Scratchcards, IIWGs
No impact
No impact
No impact
The range between Cases A and B, which shows a total impact on National Lottery sales of between £40,000 and £305,000 per week, covers a broadly plausible range of outcomes. While we cannot rule out higher impacts, such as those shown under Case C, these are difficult to justify on the basis of the sales data alone. Instead, they would require additional evidence, for example reasons why pre-existing downward trends would have been expected to cease, or why sales of particular games would have been expected to increase in October or November without the launch of the Health Lottery.
We have also carried out a similar analysis of sales data for existing society lotteries. While these do not show any signs of an impact of the Health Lottery, this is not surprising as many society lotteries are played on a subscription basis. Even in the longer term, however, we would expect many society lotteries to be relatively unaffected by the Health Lottery, for reasons including the strong identification of many participants with particular charities, the higher proportion of proceeds donated by many other society lotteries, and the different way that tickets are sold.
A further way that the Health Lottery could affect the long term strength of the National Lottery is through any impact on future competitions for the National Lottery licence. Some benefits might result if the Health Lottery (or a similar operation) increases the number of parties active in the UK lottery industry and thereby expands the pool of potential bidders. Given the differences in scale, however, any such benefits might be small, and they may also be affected if companies have concerns about any regulatory or commercial risk that bidding for the National Lottery might damage their existing activities.
Existing Society Lotteries
A wide range of different types of operation are licensed by the Gambling Commission as large society lotteries:
� there are many organisations with annual proceeds of less than £150,000 per year. Many of these have expense ratios (ie expenses as a proportion of proceeds) of less than 30 per cent, which allows them to pass on more than 50 per cent of proceeds to the relevant good cause. But others have higher costs, with expense ratios of up to 70 per cent not uncommon;
Assessment of Lottery Market Issues Executive Summary
NERA Economic Consulting iv
� there are also quite a few organisations with annual proceeds of between £150,000 and £750,000 a year. While there are exceptions, many of these have expense ratios of between 10 and 40 per cent, and donate between 30 and 70 per cent of proceeds. Many of these are lotteries supporting local hospices, offering mainly low value but very frequent (typically weekly) draws;
� there are some larger organisations with higher annual proceeds. Many of these have expense ratios between 10 and 40 per cent, and donate between 40 and 80 per cent of proceeds. But there are also a number of lotteries with total proceeds well in excess of £1 million a year that pass on only 20 per cent of proceeds to the causes they support.
The wide range of expense ratios reflects, among other things, the relatively low costs often incurred by organisations that are locally-based or that can make significant use of volunteers (or other donated inputs). While it is not possible to make general statements about economies of scale, therefore, we note that almost none of the largest organisations in the sample (ie those with total proceeds above £2 million per year) have expense ratios higher than 40 per cent.
Potential Future Developments
To date, there is no clear evidence that the Health Lottery has taken very significant revenues from the National Lottery or that it poses a threat to existing society lotteries. It is likely, therefore, to have increased the total amount of money raised by lotteries for good causes. However, it is not clear whether the Health Lottery’s current business model is sustainable in the medium to long term. Much will depend on whether sales levels can be maintained as marketing is scaled back and as existing players gain first hand experience of the relatively low odds of winning any prize at all. And the Health Lottery cannot necessarily rely on continued support and prominent point of sales displays throughout its large retail network, as the average commission paid to each retailer could well be less than £4 per week (and perhaps significantly less than this for some retailers, especially if sales are less than £3 million per week, are concentrated in certain retailers, or some sales are not made through retailers at all).
For similar reasons, we doubt that future expansion by the Health Lottery poses a significant threat to the National Lottery. There is unlikely to be a strong business case to support either a second weekly draw (which would increase costs and might abstract revenues from the Health Lottery’s current draw) or scratchcards (which would give rise to significant additional costs).
Nevertheless, there may be some risk that a new society lottery, perhaps aiming more at the middle ground between specific society lotteries and the general good causes supported by the National Lottery, and with a lower cost business model than the Health Lottery, could follow the Health Lottery’s lead in establishing a high profile brand representing several society lotteries. While the Health Lottery appears to have increased the total amounts being passed on to health causes, it remains a relatively inefficient was of supporting good causes (as only 20.3 per cent of proceeds are passed on). If a future entrant were to take a significant number of players from existing, and more generous, society lotteries, or even reduce direct donations to certain good causes, then there might be a greater risk that total donations could fall, or that certain individual charities could suffer.
Assessment of Lottery Market Issues Executive Summary
NERA Economic Consulting v
Among the possible policy responses, there are clear risks from either a cap on expenses or a change in regulations to make an operation such as the Health Lottery illegal. However, an increase in the minimum required proportion of donations may have some attractions. Around 93 per cent of existing society lotteries already donate more than 30 per cent of proceeds,2 well above the current minimum. And our analysis to date has not revealed any common features of those existing lotteries that donate low proportions, which might otherwise suggest that some types of society lottery cannot support a higher rate of contribution.
A modest increase in the minimum proportion of proceeds that society lotteries pass on might therefore lead to increased donations from those lotteries currently below the new minimum threshold, and it would also “raise the bar” for potential entrants considering launching new society lotteries (including new multiple lotteries). Further consideration of such a change might usefully include:
� a more detailed analysis of those lotteries that currently pass on low proportions of proceeds, to consider whether there is any evidence to suggest that some or all of these might be unable to increase the share of proceeds that is passed on to the supported good cause;
� consideration of possible exemptions, certainly for newly established society lotteries, and possibly also for organisations with low annual proceeds, to ensure that any change does not stifle market entry or unintentionally harm very small operations;
� assessment of possible new entry strategies, following on from the Health Lottery’s lead, the likely impact of such entry on existing lotteries and on total donations, whether a regulatory change might prevent or discourage such entry, and what would be the implications of this for the lottery sector and for good causes.
2 This excludes organisations that entered the Gambling Commission dataset after the start of 2008. Compared with existing lotteries, a greater proportion of new lotteries in their first few years have low levels of donations (including some below 20 per cent).

Assessment of Lottery Market Issues Introduction
NERA Economic Consulting 1
1. Introduction
This draft report, by NERA Economic Consulting for the National Lottery Commission (NLC), the Department of Culture, Media and Sport (DCMS) and the Gambling Commission (GC), considers the impact of the Health Lottery or similar multiple society lotteries on the wider lottery market, including on the National Lottery.3 It is intended to provide information that will be useful when considering the need for, and nature of, any change to the existing regulations applying to society lotteries.
The Health Lottery was launched on 8 October 2011. It is an umbrella brand for 51 separate society lotteries which operate in rotation and together represent each geographical region of Great Britain. At present, two society lotteries participate in the draw each week. 20.3 per cent of proceeds are passed on to health causes, and on average 35 per cent of proceeds are paid as prizes. Because the prizes are fixed, however, the actual prize payout ratio varies from week to week.
The Health Lottery’s target is to raise £50 million a year for health causes, which would require annual sales of £246 million or around £4.7 million per week. During its first quarter, however, the Health Lottery is reported to have raised £8 million for health causes,4 suggesting sales of around £3 million per week.
The Health Lottery is not the only multiple society lottery. Other models have been adopted, for example where players can choose which good causes will benefit from their participation. But the Health Lottery’s scale of operation is clearly very different from existing society lotteries. Its sales target exceeds the £208 million that was achieved collectively in 2010/11 by the 447 society lotteries licensed by the GC.
To investigate the potential impact of the Health Lottery or similar operations, we have:
� reviewed the economic literature on the determinants of lottery demand, to look for any existing evidence on the interaction between games and the effect of market entry. Our findings are reported in Section 2;
� surveyed overseas lottery markets that might provide useful practical examples, and perhaps might be worth investigating further – see Section 3;
� compared sales of individual National Lottery games, before and after the launch of the Health Lottery, to see if the data show any signs of an impact on sales – see Section 4;
� carried out a similar analysis for society lotteries – see Section 5; and
� considered the potential implications of the Health Lottery, or similar operations, for future competitions for the National Lottery licence – see Section 6.
To the extent that a policy response is considered to address any of these impacts, it will be important to consider the implications of any policy changes for existing society lotteries.
3 Multiple society lotteries are a series of separate lotteries promoted under a single brand by a society lottery operator, a collective of society lottery operators, or an external lottery manager.
4 Announced by the Health Lottery’s Chief Executive at a London conference on 17 January 2012.

Assessment of Lottery Market Issues Introduction
NERA Economic Consulting 2
Section 7 therefore provides an overview of some key characteristics of the lotteries licensed by the GC. Section 8 then sets out our conclusions on the potential impact of greater competition between lotteries in the UK.
Throughout this report, we use the term “the Health Lottery” to refer to both the Health Lottery ELM Ltd and the 51 society lotteries operated under the Health Lottery brand.
Assessment of Lottery Market Issues Potential Lessons from the Economic Literature
NERA Economic Consulting 3
2. Potential Lessons from the Economic Literature
There is an extensive economic literature on lottery demand, addressing several aspects of demand, including the reasons people buy lottery tickets, the impact of game characteristics (such as prize levels and structure), and how non-price factors (such as income, gender and education) affect demand. Within the literature, there are two general approaches to analysing lottery demand – using time series sales data to investigate changes in lottery demand over time, or using cross sectional data from consumer expenditure surveys to analyse the determinants of expenditure on lotteries.
Many studies in the literature have taken a time series approach to estimating price elasticity, using an “effective price” methodology. Effective price is the difference between the face value of a lottery ticket and its expected value, and is in effect the price paid to take part in the lottery. Under this approach, demand for the lottery is assumed to depend on the effective price, plus any other relevant explanatory variables. In turn, effective price depends on the expected value of the ticket, which is affected by the volume of sales, and whether there has been a rollover. This approach addresses the problem that the face value of a lottery ticket rarely changes.
As effective price is determined by sales, it is endogenous within the model. To address this, studies typically take a two stage estimation approach, and instrument for effective price, for example by using the amount rolled over from previous draws. Players are assumed to have rational expectations, and use publicly available information to estimate effective price. For example, this typically includes the size of the rollover.
Studies estimating price elasticities using this methodology include Roger (2008), Geronikolaou and Papachristou (2007), and Forrest, Simmons and Chester (2002). Most studies report price elasticities of between -0.6 and -1.6. A small minority of studies have found price elasticities significantly higher than one, ranging up to -3.21 for the Wednesday draw in the UK, but these estimates are outliers. There is also reason to believe that price elasticities estimated this way may be biased upwards, for example because of intertemporal substitution.
The effective price approach is successful in allowing price elasticities to be calculated despite few changes in the face value of lottery tickets. However, it has several weaknesses that indicate price elasticities calculated in this way may be overestimates of the responsiveness of demand to changes in price:
� the effective price approach uses temporary variations in effective price (caused by rollovers) to estimate price elasticity, and it is not clear that the same demand response would result from a permanent price change, as players may simply reallocate some of their expenditure over time in response to a rollover, or demand might be affected by the extra publicity attached to the rollover; and
� the effective price approach ignores the structure of prizes.
There is some evidence that the value of the jackpot has an effect on demand over and above its influence through effective price (for example see Forrest, Simmons and Chesters 2002). Several studies have used an alternative “jackpot” model, where demand for lotto is affected

Assessment of Lottery Market Issues Potential Lessons from the Economic Literature
NERA Economic Consulting 4
by the size of the jackpot. This is based on the idea that people are “buying a dream”, and that a bigger jackpot allows people to have a better dream. These studies report jackpot elasticities of demand, the responsiveness of demand to a change in the expected jackpot. Estimates typically lie between 0.1 and 0.4.
Within this literature on lottery demand, some studies consider competition and substitution between different lottery games, analysing competition between lotteries or the entry of a new product. We set out the main findings from the most relevant studies in section 2.1, and draw conclusions in section 2.2.
2.1. Evidence from the Economic Literature
There are two elements to the interaction between lottery products; the relationship between the demand for established products with respect to changes in price or other characteristics, and the impact on demand for existing products when a new lottery game launches. The economic literature on lottery demand provides some evidence in both these areas.
The literature covers a range of different countries. There is some evidence to suggest that lottery demand behaviour differs between countries, and so caution should be used in applying results to the UK without taking into account their context.5
As well has the literature on lottery demand, there are also a number of studies on the demand for charitable gambling products. Findings from these studies are set out in Box 2.1.
5 Roger (2008) finds that there are large disparities in own-price elasticities for Euromillions between different countries due to the different behaviour of lottery players.

Assessment of Lottery Market Issues Potential Lessons from the Economic Literature
NERA Economic Consulting 5
Box 2.1 Demand for Charitable Gambling Products
The economic literature contains little evidence on whether the proportion of lottery revenues donated to charity influences demand. This may be because of a lack of variation over time in the percentage donated to charity, making quantitative analysis difficult. Some consumers may be unaware of the percentage of revenues donated to charity, which means it is unlikely to be a key driver of demand.
The literature supports the idea that lotteries increase public good provision over voluntary contribution mechanisms (Morgan and Sefton (2000), Landry et al (2006)). There is also evidence that direct and indirect giving are complementary (Apinunmahakul and Devlin (2004), Lin and Wu (2007)), perhaps because once individuals decide to play a charitable lottery, it may be easier for charities to sell the idea of giving directly. There is evidence that purchasing premium charity lottery tickets is seen as mainly a donation rather than gambling, although the fun element is also important (Hassay and Peloza, 2005). However, there are some suggestions that the National Lottery has reduced direct charitable giving. For example, Passey (2000) presents evidence based on UK consumer research data, and finds that charitable donations fell 7.2 per cent.
There is also some evidence that linking lottery purchases with a specific public good may be important, rather than generating money for general state funds (for example Landry et al, 2006). Morgan and Sefton (2000) find that charitable lottery ticket purchases fall significantly when the public good benefiting from the lottery is not valued by participants. This suggests that the choice of charitable cause may be important.
2.1.1. Competition between lottery products
The literature provides mixed evidence on the level of substitution between lottery products. While some studies provide evidence of substitution, others find lottery products to be complementary, and some studies are inconclusive. In this section we describe this evidence further.
Assessment of Lottery Market Issues Potential Lessons from the Economic Literature
NERA Economic Consulting 6
Box 2.2 Methodological Approaches to Analysing Competition Between Lotteries
Many studies investigate lottery demand by exploiting changes in effective price, including in some cases the relationships between demand for different lottery products.6 Typically, studies estimate sales for a lottery product as a function of variables including the effective price of that product, and the effective price of other products competing in the same market. Other variables may be included, such as trend variables and lagged sales to account for habit in lottery purchases. As effective price is endogenous within the model (it depends on sales), many authors use two stage least squares and instrument for effective price.
However, Jia (2011) argues that some earlier papers suffer from a lack of identification as they fail to control for unobserved heterogeneities - it is difficult to be sure that changes in the demand for a product are caused by changes in the price of another product. For example this could be due to a shock that affects both the lottery price and lottery sales. By not taking this into account, the cross-price elasticity may be biased. One approach to this problem is to exploit a change in the face value of a lottery ticket and employ a regression discontinuity method.
A further weakness of the effective price methodology is that it is unsuitable for cases where there is little or no variation in effective price, for example in fixed prize games. Variations in effective price are necessary to estimate cross-price elasticities of demand. An approach that has been used in the literature to overcome this is to use a formal demand system.
Another approach used in the literature is to use consumer survey data to examine the determinants of lottery demand. This approach has been used primarily for examining the demand for individual lottery products, and less commonly for spending on alternative lottery games. However, if effective price cannot be observed for the lottery purchases in the dataset, it is not possible to determine whether products are substitutes or complements, only to analyse the relationship between participation (and spending) in different lottery markets.
2.1.1.1. Substitution
Several studies find evidence of substitution between lottery products, although often restricted to a subset of the lottery products under consideration and not always statistically significant. These include studies of competition in Spain, Canada, the US and the UK, many of which exploit changes in effective price to calculate cross-price impacts between lotteries.
� The state-owned Spanish lottery agency is one of the biggest in the world and offers a number of games. Perez and Forrest (2011) study own- and cross-price elasticities for
6 An alternative approach, used in some studies described in this review, is to use a jackpot model, as described above.
Assessment of Lottery Market Issues Potential Lessons from the Economic Literature
NERA Economic Consulting 7
selected games within the state lottery portfolio in Spain - La Primitiva, Bonoloto, and El Gordo de la Primitiva.7
– These games have long odds and large jackpots, often subject to rollovers which generate the necessary variations in effective price. The authors state that the games place very different emphases on the size of the jackpot prize.
– The authors assume that players make their decisions on which products to buy week by week, and investigate the relationships between different lotto draws in the same week. Using a log-linear specification, they regress sales on variables including the effective price of several products and draws, and lagged sales.
– They find only 5 of 43 estimated cross-price effects are statistically significant among the Spanish lottery games considered, and only 3 of these effects indicate substitution. Cross-price elasticities range from 0.150 (substitutes) to -0.085 (complements).
– Substitution is intertemporal in nature, between consecutive draws of a single lottery game rather than between games. The authors suggest the lottery agency has been adept in separating markets.
� Jia (2011) examines whether two nationwide Canadian lotteries, Lotto 6/49 and Super 7 (now Lotto Max), are substitutes for each other.8
– In contrast to studies which use an effective price approach, this study uses a regression discontinuity method, to isolate the demand response of Super 7 to a change in the price of Lotto 6/49 in 1996.
– The author finds an increase in sales of Super 7 following the price change of Lotto 6/49, and a cross price elasticity of 0.1 between Lotto 6/49 and Super 7, but neither result is statistically significant.9
– He suggests that the low substitution between lotteries may be explained by their very different price patterns: Lotto 6/49 has a more stable payout than Super 7, so regular players may play Lotto 6/49, and more risk-loving players buy Super 7, especially when the jackpot is high.
– He finds that lottery players do not switch demand in response to price changes, suggesting that lottery consumption is sticky, in the sense that consumers seem to be stuck to one type of lottery game even if there are similar and cheaper alternative games available.
– The author suggests that this needs further investigation with more detailed data at an individual level.
� Forrest, Gulley and Simmons (2004) investigate substitution between games in the UK National Lottery, using weekly sales data from Lotto, Instants (scratchcards) and Thunderball between 1997 and 2000.10
7 The authors state that as the whole portfolio of games was available throughout the data period, the study does not cover potential displacement effects when a new product is introduced.
8 Regional lotteries are also offered in Canada. 9 Furthermore, this result is not close to being statistically significant.
Assessment of Lottery Market Issues Potential Lessons from the Economic Literature
NERA Economic Consulting 8
– The authors estimate demand equations for the three games using a two stage procedure. For Instants and Thunderball, it is not possible to observe changes in price as both have fixed prizes, so it is only possible to estimate demand equations with price constant.
– They find that while lotto sales do not influence scratchcard sales, scratchcard sales may come at the expense of Lotto sales – a 10% (£1.3 million) increase in scratchcard sales results in a 1.07% (£924,994) decrease in Lotto sales.
– There is a very small negative impact of Thunderball sales on Lotto sales – the coefficient on Thunderball sales implies that a 10% (£438,000) increase in Thunderball sales is associated with a 0.025% (£21,612) decrease in Lotto sales, a very low level of substitution. Thunderball sales have a negative and significant impact on Saturday lotto sales, but their impact on Wednesday lotto sales is not significant.
– There is significant substitution between Wednesday and Saturday Lotto, with a cross price elasticity of 0.74. The authors suggest that Saturday lotto drawings are good substitutes for Wednesday lotto when the Saturday price is low. The elasticity of Saturday lotto sales with respect to Wednesday price is significantly lower at 0.18.
– They conclude that the low levels of substitution between UK lottery products result because Camelot has designed and marketed games to appeal to players in different ways. The results do not provide evidence that the games are complements to each other, so arguments for lower transaction costs, brand awareness and a portfolio effect are not very strong.
� Trousdale (2011) investigates price sensitivity of demand for lottery games in Texas, examining the sales of a number of lottery games within the portfolio of a single lottery operator.
– The author employs an approach that differs from others in the literature, using a formal demand system, which has the advantages of being consistent with the theory of utility maximisation, allowing calculation of compensated and uncompensated demand elasticities, and providing identification for games that do not exhibit price variation.
– The study uses a different approach to overcome endogeneity of prices, by using a publicly available sales prediction, and also uses an alternative definition of effective price.
– The study finds positive and significant uncompensated cross-price effects between most combinations of games, indicating the products are substitutes. Uncompensated cross-price elasticities are between -1 and 1.5, and many are between 0 and 0.6. Compensated cross-price elasticities are higher.11
10 See section 2.1.2 for the observations of Forrest, Gulley and Simmons (2004) on the impact of the introduction of Thunderball.
11 Compensated cross-price elasticities measure the responsiveness to demand of one product to the price of another, assuming that following the price change, the consumer is compensated in income so that they are able to afford a bundle of goods that gives them as much utility as the bundle purchased before the price change.
Assessment of Lottery Market Issues Potential Lessons from the Economic Literature
NERA Economic Consulting 9
– The author concludes that lottery games compete with each other and players are sensitive to relative price differences.
Other evidence that lottery products compete comes from the literature on cross-border lottery shopping. For example, Knight and Schiff (2010) find that the relationship between sales and prices is stronger in states with small populations and densely populated border regions, indicating that states face significant competitive pressure from neighbouring states, although the effects vary across states.12 Mikesell and Zorn (1987) find that the presence of competing lottery games in neighbouring states reduces lottery sales. Stover (1990) also finds evidence of substitution between neighbouring state lotteries.
While there is evidence that lottery products are substitutes, a common theme in these studies is that product differentiation limits the switching of lottery demand between products. Both Perez and Forrest (2011) and Forrest, Gulley and Simmons (2004) offer the explanation that national lottery operators have successfully marketed products to appeal to players in different ways and to separate markets. Jia (2011) offers a similar argument; that it is the differences in price patterns between lotteries that limit demand substitution.
As product differentiation is important, it is significant that the lottery products examined above are all part of the portfolio of the state lottery operator and are offered nationally. This allows operators to design their product portfolio to separate markets. When one or more of the competing products is offered by a different lottery operator, existing evidence is likely to be a lower bound to the substitution between competing products.
There is also some evidence that habit is important in determining lottery demand. Perez and Forrest (2011) find strong habit effects for most Spanish games studied, captured by highly significant impacts of lagged sales. Given that this study (and others), examines short-run cross-price elasticities, habit could provide an explanation why cross-price effects are found to be small or insignificant. It may be that in the long-run, consumers are more likely to switch demand as their habits change. Other papers also present evidence supporting the importance of habit to lottery demand, including Forrest, Gulley and Simmons (2004), Forrest and McHale (2007), Mikesell and Zorn (1987) and Mizerski et al (2004).13
Griffiths and Wood (1999) present an overview of evidence on lottery gambling and addiction, focused on the psychology of lottery gambling. They present findings that support the importance of habit and addiction as a determinant of lottery demand, including that entrapment may be an important factor behind the success of lotteries, where players feel they must keep on playing as the time their numbers will come up is getting closer. The authors also suggest source credibility may be important– the fact that the National Lottery has government backing and is broadcast on BBC1 lends it credibility.
12 Other papers in this area include Tosun and Skidmore (2004), which is described in section 2.1.2.
13 Forrest, Gulley and Simmons (2004) also find a strong correlation between lagged sales and current sales. Forrest and McHale (2007) find that lagged lotto sales have a positive and significant impact on sales for both Saturday and Wednesday lotto. Using data for several US states between 1983 and 1985, Mikesell and Zorn (1987) find evidence that as a lotto game ages, it has a small but significant negative effect on per capita sales of other lottery games. The authors suggest this indicates the lotto game substitutes for other products. Mizerski et al (2004) also find evidence of high levels of habitual behaviour.
Assessment of Lottery Market Issues Potential Lessons from the Economic Literature
NERA Economic Consulting 10
2.1.1.2. Complementarity
Although much of the economic literature provides evidence of substitution between lottery products, a number of studies find evidence of complementarity between products under some circumstances. We describe several of these studies below.
� Forrest and McHale (2007) examine the relationship between a national and multistate game for the UK; Lotto and Euromillions.
– The study models the demand for Saturday and Wednesday lotto as a function of variables including own price, Euromillions price and a Euromillions dummy variable, using two stage least squares.
– The authors find a cross-price elasticity of demand between Lotto and Euromillions of -0.033, indicating these products are complementary.
– They suggest that the explanation is likely to be related to transaction costs, as if consumers are attracted to buy a ticket for Euromillions, the transaction cost of buying a ticket for the next day’s Lotto at the same time is almost zero. They postulate that the result could have been different if the draws took place on different days, or in states where the domestic game has lower prizes (and cannibalisation might be more of a threat).
� Grote and Matheson (2006) aim to answer the question of whether competing lottery games are complements or substitutes, focusing on the competition between state and multi-state games.14
– The study uses data from several US states with state and multi-state games. It applies regression analysis, estimating sales as a function of the jackpot and other variables. It examines the gross effect on state lotto sales as a result of joining the multi-state game,15 and the marginal effect on state sales of a change in the multi-state jackpot.
– Examining the marginal effect on state sales of a change in the multi-state jackpot, the authors find evidence of complementarity between state and multi-state games in 11 out of 12 games examined. For example, at a Powerball jackpot of $50 million, the expected sales for the South Dakota Wednesday drawings would rise by 8.8 per cent. They suggest that the complementarity between multi-state and state lottery games may result from the larger multi-state jackpots attracting buyers to ticket retailers, and while they are there they also buy a ticket for the state game.
� Humphreys and Perez (2010) examine network externalities in consumer spending on lottery games, investigating spending on two state-run games (Loteria Nacional and Euro Millones), and El Cuponazo de la ONCE, a separately run lottery game.
14 This paper is extended by Matheson and Grote (2007), described in section 2.1.2.
15 The study examines the impact of a state joining a multi-state game using data for Colorado, New Jersey and Ohio. It finds that while state sales fell following the introduction of the multi-state game, overall sales increased. This analysis is extended by Matheson and Grote (2007), described in section 2.1.2.
Assessment of Lottery Market Issues Potential Lessons from the Economic Literature
NERA Economic Consulting 11
– The study applies a latent variable model of consumer choice to consumer survey data, modelling lottery demand through a two-stage process: first the decision whether to gamble, and then the decision over how many tickets to purchase. The authors do not allow for gambling addiction.
– Using a double hurdle model, the authors find that participation in Euro Millones is more likely if consumers also play Loteria Nacional or El Cuponazo, but there is no effect of other games on participation in Loteria Nacional or El Cuponazo. The authors interpret this as indicating that passive draw players also like active draw games, and perhaps the larger jackpots generated by Euro Millones. There is no evidence that the convenience of buying three tickets at one outlet matters to consumers.
– There is weak evidence that individuals who frequently purchase Loteria Nacional are less likely to purchase Euromillions but statistical significance is marginal. The authors interpret this as providing little evidence of displacement in participation in the Spanish lottery market.
– There is evidence of inter-related consumption decisions. Participation in Loteria Nacional is associated with more spending on both other games, and vice versa. Results suggest games with similar characteristics are more likely to be purchased in combination.
– The authors recognise that as no new lottery games were introduced during the period under consideration, they cannot comment on the impact of a new lottery game on consumer spending.
� For Spain, Perez and Forrest (2011) find the two drawings of La Primitiva in the same week to be complementary, and suggest this could be due to the way La Primitiva is marketed.16 As this evidence relates to two draws of the same lottery, it is not very relevant to the competition between different lottery products.
� Papachristou (2006) investigates whether marketers can be confident in using existing evidence on demand elasticities to develop new lottery products. The study uses sales data from Greece, before and after the launch of a new lottery game Joker, added to the market by the Greek operator several years after the launch of its initial game Lotto. Joker has a higher payout and lower odds than Lotto.
– The author estimates both effective price and jackpot demand equations using a two stage least squares approach.
– The study finds Lotto does not affect Joker sales, as cross-price and cross-jackpot coefficients are statistically insignificant.
– Papachristou claims that Joker effective price and jackpot affect Lotto.17 The coefficients on Joker jackpot and effective price have different signs, with a negative coefficient on price.18
16 This study is described in section 2.1.1.1.
17 The author does not mark these coefficients as statistically significant.
Assessment of Lottery Market Issues Potential Lessons from the Economic Literature
NERA Economic Consulting 12
A number of papers attribute findings of complementarity between lottery products to the impact of marketing or retailing of the lottery products. There is mixed evidence on whether the availability of tickets for different lottery games at the same retail outlet affects demand. Humphreys and Perez (2010) conclude that there is no evidence that the convenience of being able to buy tickets at the same outlet increases sales. However, Grote and Matheson (2006) suggest this might explain complementarity between state and multi-state products, and Forrest and McHale (2007) suggest this could be an explanation for the increased sales of UK Lotto when Euromillions was introduced. In particular, they suggest that the timing of the draws on consecutive days might be a factor explaining this finding.
It is also significant that much of the evidence for complementarity is specific to the impact of a multi-country or multi-state product with long odds and a large jackpot (such as Euromillions) on a smaller national or state product (such as Lotto).19 If complementarity between games is associated with the impact of a higher jackpot, this evidence is less likely to be relevant in cases where a lottery with a much smaller top prize enters the market.
There is some more general evidence that marketing can be an important influence on demand. For example, Stover (1990) finds a positive effect of promotional spending on lottery sales, although this does not take into account the content of the campaign. Paola and Scoppa (2011) investigate the impact of media coverage on sales of the SuperEnalotto in Italy. They find a positive and significant impact of media coverage on sales, with one additional news article increasing sales by 8 to 12 per cent. However, the literature does not explicitly address the question of how marketing affects the balance of demand between competing lottery products.
2.1.1.3. Inconclusive evidence
A number of studies find no significant evidence of either complementarity or substitution between different lottery games. Both studies described below, Lin and Lai (2006) and Gulley and Scott (1993), examine cases where competing lotteries are within the state lottery portfolio. These results may be explained by product differentiation or marketing limiting the extent of substitution.
� Lin and Lai (2006) study substitution effects between Lotto and Big Lotto in Taiwan, both offered by Taipei Bank.20 The authors use OLS regression with a log-linear model and find that the Lotto price does not have a significant impact on sales of Big Lotto.21 They conclude that the behaviour of Taiwanese lottery players is different to that of players in the UK or US.
18 Papachristou interprets this as indicating that Joker competes with Lotto, as evidence by the negative cross-price coefficient, but also supports it, as evidenced by the positive cross-jackpot coefficient. However, if these are conventional estimates, we believe both coefficients suggest complementarity between Lotto and Joker.
19 Forrest and McHale (2007) suggest there may be differences between comparing state with multi-state games in the US, and comparing Lotto with Euromillions in UK, due to possible different attitudes of consumers. In contrast to some US states, UK Lotto achieves big jackpots, so life changing top prizes are already available.
20 The authors also report the own-price elasticity of Big Lotto
21 As suggested by Jia (2011) and discussed in Box 2.2, this specification does not account for unobserved heterogeneities, and so may result in a biased cross-elasticity.

Assessment of Lottery Market Issues Potential Lessons from the Economic Literature
NERA Economic Consulting 13
� Gulley and Scott (1993) study the demand for state-operated lottery games in the US, with a focus on evaluating the extent to which games are structured to maximise state tax revenues.
– The authors estimate a logarithmic form using data for the Kentucky Lotto, the Massachusetts MassMillions, the Massachusetts Megabucks and the Ohio Super Lotto. As well as own-price elasticities, they report the cross-price elasticity between the two Massachusetts games.
– The authors find that there is no statistically significant relationship between sales in these games. However, the authors also find evidence that may indicate a gradual shift from Megabucks to MassMillions, which is a game with longer odds and a bigger jackpot.
Cook and Clotfelter (1993) also find that increased betting on the Massachusetts lotto game, associated with a large jackpot caused by a rollover, did not come at the cost of reduced sales in a numbers game.
2.1.1.4. Summary of quantitative evidence
Table 2.1 draws together the evidence described above and shows reported estimates of ongoing substitution between lottery products. For example, the cross-price elasticity of 0.1 reported by Jia (2011) indicates that a 10 per cent increase in the effective price of Lotto 6/49 would result in a 1 per cent increase in demand for Super 7.
As these estimates relate to a number of different countries and different lottery products, they should be interpreted with caution and are not directly comparable.
Table 2.1 Substitution between Lottery Products
Cross-price elasticities Interpretation
Jia (2011) 0.1 (reported but not statistically significant)
Substitutes
Trousdale (2011) -1.0-1.5 (most of the significant values are in the range 0-0.6) 1
Substitutes
Perez and Forrest (2011) -0.085, -0.073, 0.023, 0.102, 0.150 Mix of substitutes and complements
Forrest and McHale (2007)
-0.033 Complements
Lin and Lai (2006) Not statistically significant
Forrest, Gulley and Simmons (2004)
-0.107, -0.0025 2 Substitutes (sales elasticities)2
Gulley and Scott (1993) Not statistically significant
Source: NERA based on Jia (2011), Forrest, Gulley and Simmons (2004), Forrest and McHale (2007), Gulley and Scott (1993), Lin and Lai (2006), Perez and Forrest (2011), and Trousdale (2011) 1. Uncompensated price elasticities. Compensated price elasticities are higher. 1. Sales elasticity – the responsiveness of Lotto demand to a change in sales of Instants or Thunderball. Negative values of sales elasticities indicate substitution.
Assessment of Lottery Market Issues Potential Lessons from the Economic Literature
NERA Economic Consulting 14
2.1.2. Impact of entry
Several studies examine the introduction of a new lottery product to the market, most commonly the introduction of a multi-state or multi-country game. Examples include the introduction of Euromillions, and the introduction of multi-state games in the US (for example Powerball or Mega Millions). While the number of examples means this is a good source of evidence, there are several factors that limit its usefulness, for example:
� most multi-state or multi-country lotteries are also run by the state or national lottery operator and so are positioned in the market taking into account existing state or national lottery products;
� these games typically have large jackpots, often larger than existing games, which means that they are competing with smaller games.
Unsurprisingly, many studies find evidence that the launch of new lottery products expands the lottery market. Forrest and McHale (2007) find that the presence of Euromillions in the market increased lottery demand, and Matheson and Grote (2007) find a similar effect on total sales of state and multi-state games when a multi-state game launches, for most states examined.22
Normally, given consumers’ fixed budget constraints, we would expect demand for existing products to be affected even if total lottery demand increases when a new product enters the market. The evidence described in section 2.1.1 suggests lottery products are likely to be substitutes. As expected, most studies find that the introduction of new lottery products causes demand for existing lotteries to fall.
� Matheson and Grote (2007) examine substitution between lottery games, considering the impact on state lottery sales of a multi-state game launching.23
– The study uses data from Colorado, New Jersey, Ohio, California and Texas, five states where a multi-state game was added during the period covered by sales data. It applies regression analysis, estimating sales as a function of the jackpot and other variables using two different model specifications.
– The authors find that sales of state-run games fall when multi-state games are introduced. This impact is the net result of a positive impact on state sales of the multi-state game (not always statistically significant), and a negative interaction with the state jackpot, such that the multi-state game “dampens” the impact of increases in the state lotto jackpot.
– They find that when a multi-state lottery is introduced, total ticket sales increase more in states with smaller jackpots in the state lotto, suggesting a lower degree of substitution when there is more variety in prize levels.
22 See below for further details of this study. This effect was not observed for California. Product differentiation between state and multi-state games in California is lower than in other states as a result of high jackpots in the state lottery. The effect of product differentiation is discussed further below.
23 This paper extends Grote and Matheson (2006), described in section 2.1.1.2, by examining the introduction of Mega Millions in Texas and California.

Assessment of Lottery Market Issues Potential Lessons from the Economic Literature
NERA Economic Consulting 15
� Similar evidence is presented by Tosun and Skidmore (2004). This study uses lottery sales data for West Virginia to examine the determinants of lottery revenues, focusing on interstate competition:
– The authors use a two-way fixed effects model to estimate the effects of new neighbouring state lotteries or lottery game on lottery sales in border counties.
– The introduction of new lottery games in neighbouring states reduces West Virginia border country revenues by 10.4 per cent. Impacts include 34.2 per cent for counties bordering Kentucky when Kentucky’s Powerball game came online, and 11.1 per cent for counties bordering Virginia when Virginia introduced Big Game.24
– The authors also investigate impacts over time. In the fifth year following the introduction of a new lottery or new lottery game in a neighbouring state, border county losses total 30.5 per cent. There are significant cumulative effects in some, but not all, border counties. This includes lottery sales being 33 per cent lower in counties bordering Virginia five years after the introduction of Virginia’s new lottery, and 17 per cent lower for counties bordering Maryland.
– They conclude that in some cases, allowing for the effects to change over time provide a better estimate, and that these estimates are in general larger than those generated using indicator variables.
� NERA (2003) investigates demand for Saturday and Wednesday Lotto, to understand inter-relationships between games and estimate cannibalisation when new games are launched.
– This study adopts a two-stage least squares approach using weekly sales data for several UK National Lottery products.
– The study finds that the introduction of new lottery games, including Wednesday Lotto, Thunderball and Hotpicks, had long run negative impacts on Saturday Lotto sales of between 3 per cent and 17 per cent.
– These long run impacts are higher than the short-run impacts of introducing the new lottery games.
� As described in section 2.1.1.1, Forrest, Gulley and Simmons (2004) investigate substitution between games in the UK National Lottery. The authors find that the entry of Thunderball had a positive and significant effect on scratchcard sales, and a negative and significant impact on Wednesday lotto sales, suggesting that the introduction of Thunderball reduced average sales in the Wednesday game. There is no evidence of a significant impact of the introduction of Thunderball on Saturday lotto sales.25
24 Impacts are not significant for all neighbouring states. 25 The authors also find that the introduction of a temporary game, Big Draw 2000, did not have a significant impact on
sales of the three existing lottery games, with the exception of a negative and significant impact on Wednesday lotto.
Assessment of Lottery Market Issues Potential Lessons from the Economic Literature
NERA Economic Consulting 16
In contrast to the evidence above, Forrest and McHale (2007) find the introduction of Euromillions increased demand for both Saturday and Wednesday Lotto.26 They suggest that the addition of Euromillions to the product profile stimulated interest in the domestic Lotto game, but advise treating this result with caution as the counterfactual sales for Lotto are unknown.
The evidence presented above is clear that the entry of a new lottery product is likely to cause a fall in demand for existing products. There is some evidence that this impact may be larger in the long-term than in the short-term, for example as found by Tosun and Skidmore (2004). The evidence on habit discussed in section 2.1.1.1 also supports this conclusion – players may not switch their demand between products immediately for a number of reasons.
Another important factor may be product differentiation, as discussed in section 2.1.1.1. Matheson and Grote (2007) find evidence that total ticket sales increase more on the launch of a multi-state lottery when the state lottery has a lower jackpot. However, we note that evidence on the impact of competition from products in neighbouring states may underestimate the likely impact of competition when products are available in the same geographical area.
2.1.2.1. Summary of quantitative evidence
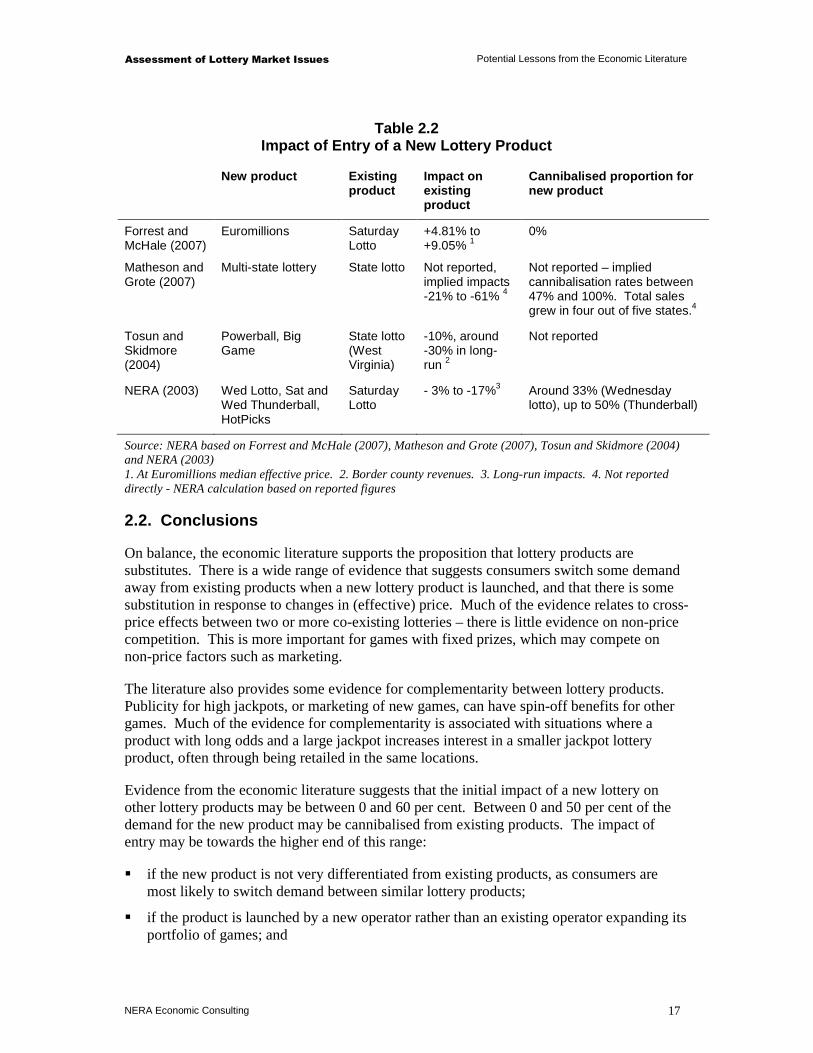
Table 2.2 shows reported impacts of the introduction of a lottery product on sales of existing lotteries. Positive impacts indicate sales of an existing product increased when a new product was launched. For example, Forrest and McHale (2007) found an increase in sales of Saturday Lotto of between 4.81 per cent and 9.05 per cent associated with the presence of Euromillions in the market. However, most impacts are negative, indicating a fall in sales of an existing product. The final column of the table shows, where available, what proportion of the sales of the entering product are cannibalised from an existing product.
As these estimates relate to a number of different countries and different lottery products, they should be interpreted with caution and are not directly comparable.
26 The effective price of Euromillions has a statistically significant impact on Saturday Lotto sales, but not sales of Wednesday Lotto. However, the presence of Euromillions does have a statistically significant impact on Wednesday Lotto sales.
Assessment of Lottery Market Issues Potential Lessons from the Economic Literature
NERA Economic Consulting 17
Table 2.2 Impact of Entry of a New Lottery Product
New product Existing product
Impact on existing product
Cannibalised proportion for new product
Forrest and McHale (2007)
Euromillions Saturday Lotto
+4.81% to +9.05% 1
0%
Matheson and Grote (2007)
Multi-state lottery State lotto Not reported, implied impacts -21% to -61% 4
Not reported – implied cannibalisation rates between 47% and 100%. Total sales grew in four out of five states.4
Tosun and Skidmore (2004)
Powerball, Big Game
State lotto (West Virginia)
-10%, around -30% in long-run 2
Not reported
NERA (2003) Wed Lotto, Sat and Wed Thunderball, HotPicks
Saturday Lotto
- 3% to -17%3 Around 33% (Wednesday lotto), up to 50% (Thunderball)
Source: NERA based on Forrest and McHale (2007), Matheson and Grote (2007), Tosun and Skidmore (2004) and NERA (2003) 1. At Euromillions median effective price. 2. Border county revenues. 3. Long-run impacts. 4. Not reported directly - NERA calculation based on reported figures
2.2. Conclusions
On balance, the economic literature supports the proposition that lottery products are substitutes. There is a wide range of evidence that suggests consumers switch some demand away from existing products when a new lottery product is launched, and that there is some substitution in response to changes in (effective) price. Much of the evidence relates to cross-price effects between two or more co-existing lotteries – there is little evidence on non-price competition. This is more important for games with fixed prizes, which may compete on non-price factors such as marketing.
The literature also provides some evidence for complementarity between lottery products. Publicity for high jackpots, or marketing of new games, can have spin-off benefits for other games. Much of the evidence for complementarity is associated with situations where a product with long odds and a large jackpot increases interest in a smaller jackpot lottery product, often through being retailed in the same locations.
Evidence from the economic literature suggests that the initial impact of a new lottery on other lottery products may be between 0 and 60 per cent. Between 0 and 50 per cent of the demand for the new product may be cannibalised from existing products. The impact of entry may be towards the higher end of this range:
� if the new product is not very differentiated from existing products, as consumers are most likely to switch demand between similar lottery products;
� if the product is launched by a new operator rather than an existing operator expanding its portfolio of games; and
Assessment of Lottery Market Issues Potential Lessons from the Economic Literature
NERA Economic Consulting 18
� in the long-term, when habits have had time to adjust.
A number of studies in the economic literature find cross-price elasticities between -0.1 and 0.1, with a more recent study, Trousdale (2011) finding most cross-price elasticities in the slightly higher range of 0 to 0.6, indicating substitution between products. There are some factors that increase the degree of substitution between products:
� the number of competing operators – a single lottery operator manages its product portfolio to minimise cannibalisation between game types. Separately owned operators of lottery products are unlikely to do any better than a single operator in minimising cannibalisation, and may position their product in a way that increases substitution.
� marketing – if operators market their products to win demand from competing lottery products, then the products might be more substitutable
Other factors reduce the degree of substitution between products:
� product differentiation – the more differentiated lottery products are, the lower the degree of substitution, for example in terms of jackpot size or prize structure. This difference particularly applies to competition between state and multi-state games, which can be very different.
� habit – consumers may be loyal to a particular lottery product, or be in the habit of buying a certain number of tickets each week, and this may reduce the likelihood of them switching demand away to other products. The impact of this factor may reduce over time.
� marketing – if operators market their products to make them appear more differentiated, substitution may be lower.
This evidence is drawn from studies on the short-term response for one lottery to a temporary change in effective price of another (for example caused by a rollover or special promotion). A permanent change in the prize structure of a game (and corresponding change in effective price) is likely to have a larger impact in the long-run (ie the cross-price elasticity may be higher than 0 to 0.6), as players are more likely to change habits.
Assessment of Lottery Market Issues Potential Lessons from Overseas Lotteries
NERA Economic Consulting 19
3. Potential Lessons from Overseas Lotteries
This section provides an overview of the most relevant examples of lotteries internationally. We reached an early conclusion that Italy and the Netherlands might provide the most useful examples, and we describe these markets below. These countries were selected using the following criteria:
� more than one operator – we selected countries with more than one lottery operator. This complements the economic literature (where many papers analyse demand for games within the portfolio of a single operator), and is most similar to the situation in the UK;
� entry– where examples exist, we have selected countries with recent lottery entry, although in some cases this was not possible and competition is between lotteries that have co-existed for a long time;
� charitable donations – we have selected some examples that have are focused on donations to charity, either through their marketing or because they donate a high percentage to charity; and
� feasibility –we have favoured countries where there are reports or studies on the lottery market or lottery competition, or where it seems most likely that data will be available.
We also considered several other countries, including Sweden, Spain, Germany and Australia. We set out the reasons for not considering these examples further in section 3.3.
3.1. Italy
3.1.1. Lotteries market
Italy has two large lottery operators; Lottomatica and Sisal. The gambling sector is organised as a state monopoly, with private organisations licensed to offer different gambling products and services. The Amministrazione Autonoma dei Monopoli di Stato (AAMS), is responsible for the state monopoly. Several laws and ministerial decrees regulate the gambling markets.27
Lottomatica is the sole concessionaire for the Italian Lotto game. The Italian operations segment of Lottomatica operates online lotteries and games (operated through computerized systems), as well as games using pre-printed tickets.28 Gioco del Lotto is the most popular Italian game, and has been played in Italy for hundreds of years. Lottomatica has been sole concessionaire since 1993. Lottomatica operates instant (Scratch and Win) and traditional lotteries through its subsidiary Lotterie Nazionali S.r.l., in which it holds a 51.5 per cent interest.29 It is also active in the wider gaming market, offering services in sports betting, machine gaming, interactive and commercial services.
27 Kingma and van Lier (2006), “The leeway of lotteries in the European Union” 28 The Lottomatica group also includes the GTECH lottery segment, the SPIELO international segment, and the GTECH
G2 segment. 29 http://www.lottomaticagroup.com/eng/investor/documents/Q3_2011_CONSOB_Report-Third_Draft_Clean.PDF
Assessment of Lottery Market Issues Potential Lessons from Overseas Lotteries
NERA Economic Consulting 20
Sisal offers a range of gaming products, including the SuperEnalotto and the newly launched multi-country EuroJackpot. The SuperEnalotto was launched in 1997, and is a game with long odds and high jackpots. In the simplest version of the game, players select 6 numbers between 1 and 90, and 6 balls and a “jolly” (bonus) ball are drawn three times a week.30 There is no cap on the jackpot.31
Under an access agreement, Sisal allows other operators (including Lottomatica) to sell its SuperEnalotto game online. From 2009, the Italian competition authority investigated an allegation that Sisal prevented competitors from connecting to the IT network for online receipt of plays.32 In 2011, the competition authority closed the case without a finding of abuse of dominant position, subject to commitments offered by Sisal to make it easier for competitors to operate online nationally totalised numbers games (SuperEnalotto and Superstar).33
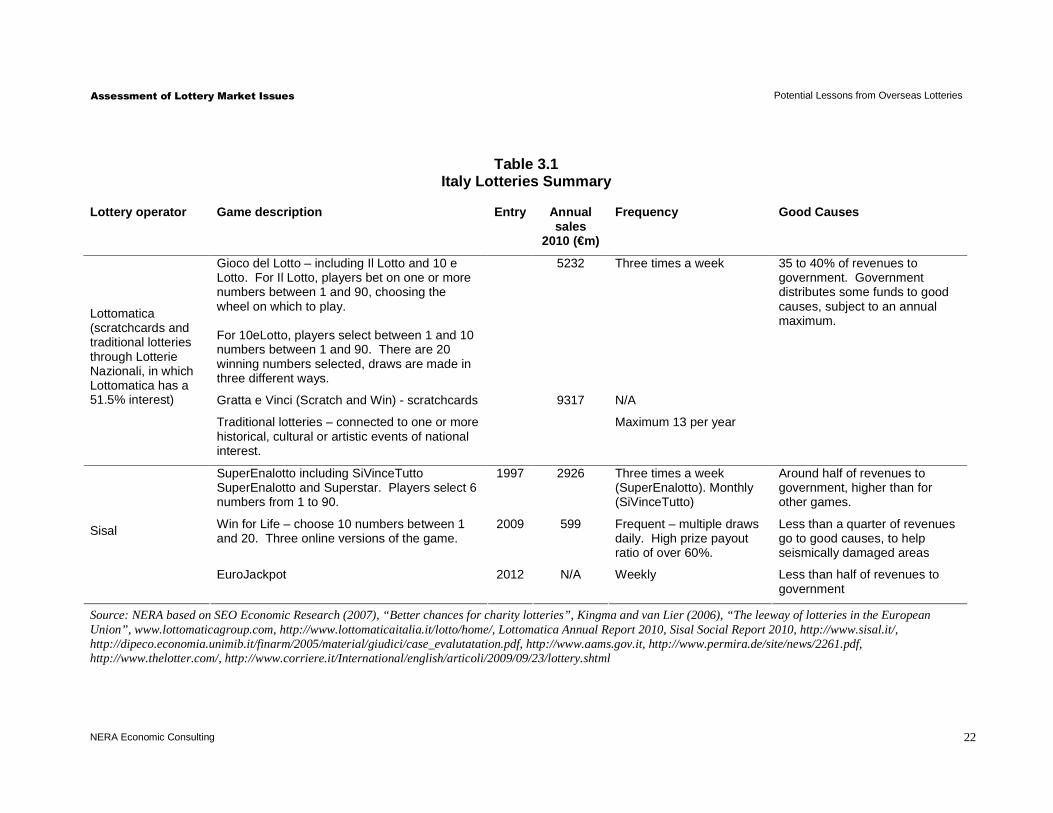
Table 3.1 sets out the key features of each of these lotteries. We note that this table is based on a number of different sources commenting on different time periods, and therefore sources may not be consistent with each other.
3.1.2. Competition and substitution between lotteri es
There have been a number of lottery-related competition cases in Italy, including an investigation into an anticompetitive agreement between Lottomatica and Sisal to partition the gaming and betting market to protect their own market position. This was judged to be a serious infringement of competition and Lottomatica and Sisal were fined.34 During the investigation of this case, the Italian Antitrust Authority (Autorità Garante della Concorrenza e del Mercato) considered both the demand and supply sides of the market, and how the agreements Lottomatica and Sisal made had affected the market.35
On the demand-side, the Authority considered that the lottery and other gambling products considered are almost perfect substitutes from the perspective of consumers. The Authority reported Sisal evidence on how games differ along two axes: whether they are emotional (random) or rational (skill-based), and the structure of prizes (from a small chance of winning a large prize to a larger chance of winning small prizes). This evidence suggests Lotto and SuperEnalotto offer very different prize structures, with SuperEnalotto having a very low probability of winning a very large prize, and Lotto having a much higher probability of winning a small prize. Despite this evidence, the Authority argued that products were not sufficiently different to be considered as being in separate markets.
30 There are also variants of the game where players can play multiple lines, choose more than 6 numbers, or select an additional “Superstar” number. Some of these variants involve additional costs.
31 http://www.superenalotto.net/ 32 http://www.agcm.it/en/newsroom/press-releases/1680-a419-superenalotto-sisal-to-be-investigated-over-alleged-abuse-
of-its-dominant-position.html 33 http://www.agcm.it/stampa/comunicati/5538-a419-superenalotto-accettati-gli-impegni-di-sisal.html 34 See http://www.agcm.it/en/newsroom/press-releases/1531-lottomatica-sisal.html and
http://www.concurrences.com/article.php3?id_article=15531&lang=fr#nb4. The fine was subsequently reduced on appeal.
35 L’Autorità Garante della Concorrenza e del Mercato (2004), Provvedimento n. 13780
Assessment of Lottery Market Issues Potential Lessons from Overseas Lotteries
NERA Economic Consulting 21
The Authority also presented evidence that since 1999 market demand had been stable. In this context the introduction of new games had caused demand to switch away from existing games causing cannibalisation, despite any differences in game structure. The Authority also cited Sisal evidence that one of the reasons for a fall in demand in 2002 was cannibalisation by other products.
On the supply side, the Authority highlighted two main barriers to entry: administrative (obtaining a licence) and technological (creating a network). It also described the plans of AAMS to move towards a different market model by 2012, where AAMS would manage lottery games, and Sisal and Lottomatica would provide the network.36 This would avoid the problem that occurs when lottery operators only have an incentive to promote games for which they have exclusivity. For games that are shared, firms have no incentive to invest in marketing, as competitors would also benefit.
3.1.3. Potential relevance to the UK
The Italian lottery market provides some interesting insights on the interaction between rival lotteries in the same market. There are similarities between the UK and Italian lottery markets, in that there is direct competition between rival games, and major lottery operators are commercially focused. However, while there are rival games, there has been a suspicion of collusion between operators, as discussed above. Furthermore, it is not clear that the charity aspect of Italian lotteries is very important.
36 See paragraph 113 and footnotes 134, 135 and 136 of Provvedimento n. 13780. This plan was related to the expiration of the Lotto concession in 2012: according to Lottomatica’s 2010 Annual Report, this concession is due to expire in 2016, although this is under dispute with AAMS. The current status of this plan is unclear.
Assessment of Lottery Market Issues Potential Lessons from Overseas Lotteries
NERA Economic Consulting 22
Table 3.1 Italy Lotteries Summary
Lottery operator Game description Entry Annual sales
2010 (€m)
Frequency Good Causes
Gioco del Lotto – including Il Lotto and 10 e Lotto. For Il Lotto, players bet on one or more numbers between 1 and 90, choosing the wheel on which to play. For 10eLotto, players select between 1 and 10 numbers between 1 and 90. There are 20 winning numbers selected, draws are made in three different ways.
5232 Three times a week 35 to 40% of revenues to government. Government distributes some funds to good causes, subject to an annual maximum.
Gratta e Vinci (Scratch and Win) - scratchcards 9317 N/A
Lottomatica (scratchcards and traditional lotteries through Lotterie Nazionali, in which Lottomatica has a 51.5% interest)
Traditional lotteries – connected to one or more historical, cultural or artistic events of national interest.
Maximum 13 per year
SuperEnalotto including SiVinceTutto SuperEnalotto and Superstar. Players select 6 numbers from 1 to 90.
1997 2926 Three times a week (SuperEnalotto). Monthly (SiVinceTutto)
Around half of revenues to government, higher than for other games.
Win for Life – choose 10 numbers between 1 and 20. Three online versions of the game.
2009 599 Frequent – multiple draws daily. High prize payout ratio of over 60%.
Less than a quarter of revenues go to good causes, to help seismically damaged areas
Sisal
EuroJackpot 2012 N/A Weekly Less than half of revenues to government
Source: NERA based on SEO Economic Research (2007), “Better chances for charity lotteries”, Kingma and van Lier (2006), “The leeway of lotteries in the European Union”, www.lottomaticagroup.com, http://www.lottomaticaitalia.it/lotto/home/, Lottomatica Annual Report 2010, Sisal Social Report 2010, http://www.sisal.it/, http://dipeco.economia.unimib.it/finarm/2005/material/giudici/case_evalutatation.pdf, http://www.aams.gov.it, http://www.permira.de/site/news/2261.pdf, http://www.thelotter.com/, http://www.corriere.it/International/english/articoli/2009/09/23/lottery.shtml

Assessment of Lottery Market Issues Potential Lessons from Overseas Lotteries
NERA Economic Consulting 23
3.2. Netherlands
3.2.1. Lottery market
There are several lotteries in the Dutch market, including the State lottery, the Lotto, the National Postcode Lottery, the VriendenLoterij (Friends Lottery) and the Bank Giro Lottery. The State lottery has a permanent license, whereas the Lotto and charity lotteries are granted licences for at most five years, although these licences can be renewed. There are also a number of smaller incidental lotteries, licensed for six months at most, that must raise money for good causes.37 Until recently, the Netherlands lotteries market was regulated by the Netherlands Gaming Control Board. From 1 April 2012 this responsibility will pass to the Dutch Gaming Authority.
The State lottery has existed since 1726 and was privatised in 1992. It offers a monthly and a weekly game with a high proportion of revenues paid out in prizes (70 per cent in 2010). Returns to good causes or government are a low proportion of revenues, 17 per cent of revenues went to general funds in 2010. The privately owned Lotto is also well established, and offers several games, including lotto, scratchcards and a multi-state game EuroJackpot. The prize payout ratio must be at least 47.5 per cent by law, and was 50 per cent in 2010. Most games have weekly draws.
The National Postcode Lottery, Friends Lottery and Bank Giro Lottery are all owned by the National Charity Lottery Holding (Nationale Goede Doelen Loterijen NV).38 The Friends Lottery has been owned by the National Charity Lottery Holding since 1998, and the Bank Giro Lottery since 2002. In these games, players are assigned a lottery number (eg based on postcode or bank account number) and draws are made up to 14 times each year. These games donate a high proportion of revenues to charity (a minimum of 50 per cent by law).
Table 3.2 sets out the key features of each of these lotteries. We note that this table is based on a number of different sources commenting on different time periods, and therefore sources may not be consistent with each other.
3.2.2. Competition and substitution between lotteri es
Several commentators have suggested that the Netherlands lotteries market is competitive.39 The 2002 takeover of the Bank Giro Lottery by the Postcode Lottery was investigated and approved by the Netherlands Competition Authority, the NMa.40 The NMa judged that there was no evidence that a dominant position would arise from, or be strengthened by, the acquisition, and that players face competitive pressures from other sources (scratch-card lotteries, small-scale lotteries, foreign lotteries and lotto games). The NMa found that there was full-blown competition between the parties in the market.
37 These include National Grote Club Actie and the Zonnebloem Loterij. 38 The Friends Lottery was previously known as the Sponsor Bingo Lottery. 39 For example Kingma and van Liter (2006), and the NMa in its 2002 decision described below. 40 http://www.nma.nl/en/documents_and_publications/press_releases/news/archive/2002/02_29.aspx

Assessment of Lottery Market Issues Potential Lessons from Overseas Lotteries
NERA Economic Consulting 24
The NMa ruled against an earlier proposed merger between the State Lottery, the Lotto/SNS and the Bank Giro lottery.41 It found that the merger would create a dominant position in the market, with the new company having a market share of 60-70 per cent.
Based on a simple econometric analysis of the relationship between state lottery, lotto and charity lottery revenues in the Netherlands, SEO Economic Research (2007) finds that the lotto and the state lottery are substitutes, and charity lotteries and the state lottery are complements. The study finds that a 1 per cent increase in charity lottery revenues is associated with a 0.36 per cent increase in revenues for the state lottery, whereas a 1 per cent increase in lotto revenues is associated with a 0.15 per cent decrease in revenues for the state lottery. SEO Economic Research (2007) also finds evidence that market segmentation has a positive effect on gross gaming revenues per capita of charity lotteries, and so on charity funds available.
3.2.3. Potential relevance to the UK
There are several interesting features of the Netherlands situation that makes it a useful comparison for the UK. For example, charity lottery draws are focused on different causes and marketed on this basis, and charity lotteries entered the market at different times, in competition with well-established incumbents. However, there are also a number of differences. Charity lottery draws are monthly rather than weekly, tickets are sold by subscription, and the proportion of funds donated to charity is high (as a result of the high statutory minimum).
41 http://www.nma.nl/en/documents_and_publications/press_releases/news/archive/1999/99_24.aspx
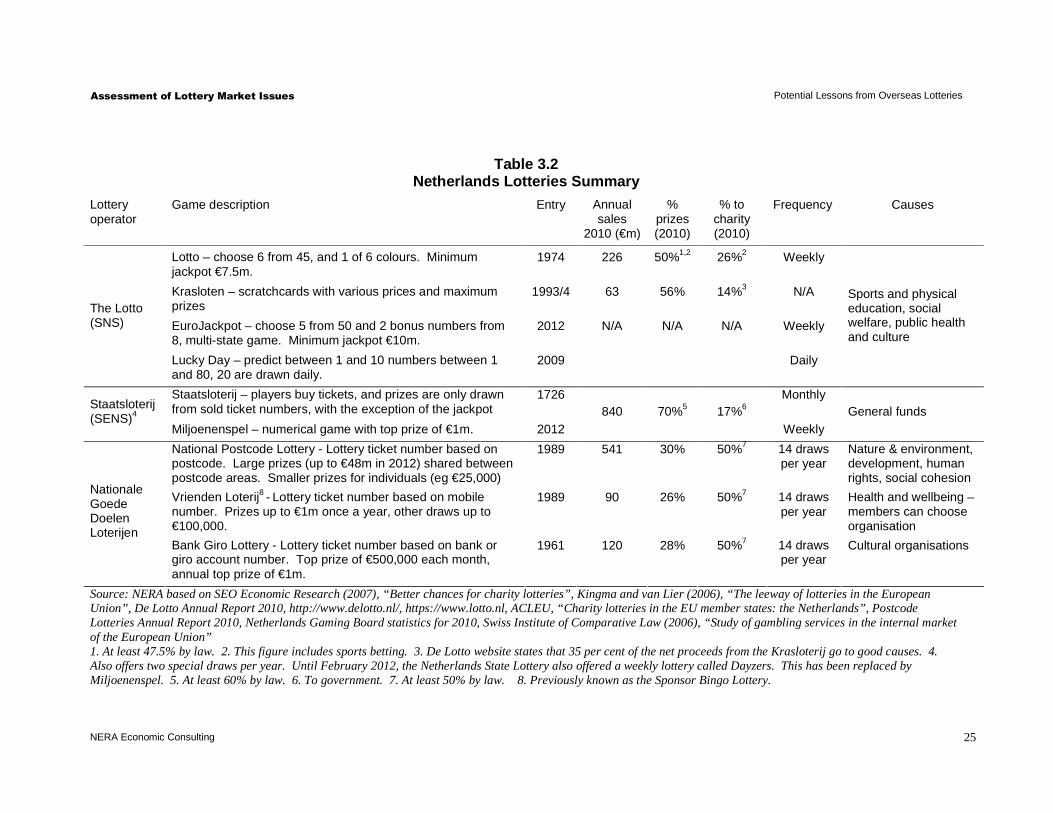
Assessment of Lottery Market Issues Potential Lessons from Overseas Lotteries
NERA Economic Consulting 25
Table 3.2 Netherlands Lotteries Summary
Lottery operator
Game description Entry Annual sales
2010 (€m)
% prizes (2010)
% to charity (2010)
Frequency Causes
Lotto – choose 6 from 45, and 1 of 6 colours. Minimum jackpot €7.5m.
1974 226 50%1,2 26%2 Weekly
Krasloten – scratchcards with various prices and maximum prizes
1993/4 63 56% 14%3 N/A
EuroJackpot – choose 5 from 50 and 2 bonus numbers from 8, multi-state game. Minimum jackpot €10m.
2012 N/A N/A N/A Weekly The Lotto (SNS)
Lucky Day – predict between 1 and 10 numbers between 1 and 80, 20 are drawn daily.
2009 Daily
Sports and physical education, social welfare, public health and culture
Staatsloterij – players buy tickets, and prizes are only drawn from sold ticket numbers, with the exception of the jackpot
1726 Monthly Staatsloterij (SENS)4
Miljoenenspel – numerical game with top prize of €1m. 2012 840 70%5 17%6
Weekly General funds
National Postcode Lottery - Lottery ticket number based on postcode. Large prizes (up to €48m in 2012) shared between postcode areas. Smaller prizes for individuals (eg €25,000)
1989 541 30% 50%7 14 draws per year
Nature & environment, development, human rights, social cohesion
Vrienden Loterij8 - Lottery ticket number based on mobile number. Prizes up to €1m once a year, other draws up to €100,000.
1989 90 26% 50%7 14 draws per year
Health and wellbeing – members can choose organisation
Nationale Goede Doelen Loterijen
Bank Giro Lottery - Lottery ticket number based on bank or giro account number. Top prize of €500,000 each month, annual top prize of €1m.
1961 120 28% 50%7 14 draws per year
Cultural organisations
Source: NERA based on SEO Economic Research (2007), “Better chances for charity lotteries”, Kingma and van Lier (2006), “The leeway of lotteries in the European Union”, De Lotto Annual Report 2010, http://www.delotto.nl/, https://www.lotto.nl, ACLEU, “Charity lotteries in the EU member states: the Netherlands”, Postcode Lotteries Annual Report 2010, Netherlands Gaming Board statistics for 2010, Swiss Institute of Comparative Law (2006), “Study of gambling services in the internal market of the European Union” 1. At least 47.5% by law. 2. This figure includes sports betting. 3. De Lotto website states that 35 per cent of the net proceeds from the Krasloterij go to good causes. 4. Also offers two special draws per year. Until February 2012, the Netherlands State Lottery also offered a weekly lottery called Dayzers. This has been replaced by Miljoenenspel. 5. At least 60% by law. 6. To government. 7. At least 50% by law. 8. Previously known as the Sponsor Bingo Lottery.

Assessment of Lottery Market Issues Potential Lessons from Overseas Lotteries
NERA Economic Consulting 26
3.3. Other Countries
We considered a number of other countries as potentially useful international examples, and we set out our thoughts on the most relevant below.
� Sweden - the largest player in the Swedish lottery market is the state operator Svenska Spel. Other operators with significant revenues are the postcode lottery (under the same ownership as the equivalents in the Netherlands and the UK), and Folkspel. A Sweden case study is likely to be similar to the Netherlands, and so with limited evidence available, unlikely to provide extra value.
� Spain has a big lottery market, dominated by the state operator LAE, but with the significant presence of ONCE, an organisation supporting the blind and visually impaired. Spain is covered relatively well by the economic literature, and further investigation into such a well established market is unlikely to yield useful insights for the purpose of this study.
� In Australia, there are separately owned lottery operators in some states, which appear to be licensed to offer different games. While there may be some competition between these games, the fact that the second operator entered by taking over some of the games of the first operator, and there are little or no data or other evidence on competition, suggests that Australia may not be a useful example.
� Germany - several lotteries exist, including a national lotto block of operators licensed at the regional level, two multi-region lotteries, and two TV “charity lotteries”. However, evidence on competition is very limited, and all of these lotteries have co-existed for a long time. We are not aware of any recent entry.
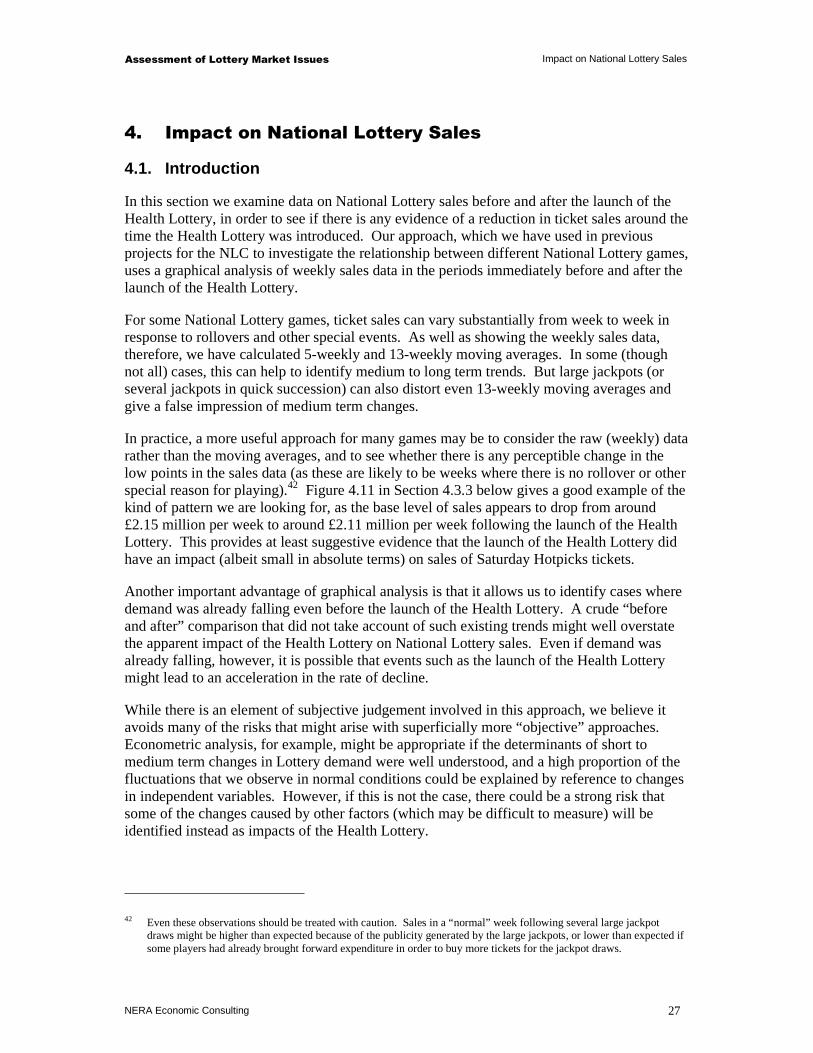
Assessment of Lottery Market Issues Impact on National Lottery Sales
NERA Economic Consulting 27
4. Impact on National Lottery Sales
4.1. Introduction
In this section we examine data on National Lottery sales before and after the launch of the Health Lottery, in order to see if there is any evidence of a reduction in ticket sales around the time the Health Lottery was introduced. Our approach, which we have used in previous projects for the NLC to investigate the relationship between different National Lottery games, uses a graphical analysis of weekly sales data in the periods immediately before and after the launch of the Health Lottery.
For some National Lottery games, ticket sales can vary substantially from week to week in response to rollovers and other special events. As well as showing the weekly sales data, therefore, we have calculated 5-weekly and 13-weekly moving averages. In some (though not all) cases, this can help to identify medium to long term trends. But large jackpots (or several jackpots in quick succession) can also distort even 13-weekly moving averages and give a false impression of medium term changes.
In practice, a more useful approach for many games may be to consider the raw (weekly) data rather than the moving averages, and to see whether there is any perceptible change in the low points in the sales data (as these are likely to be weeks where there is no rollover or other special reason for playing).42 Figure 4.11 in Section 4.3.3 below gives a good example of the kind of pattern we are looking for, as the base level of sales appears to drop from around £2.15 million per week to around £2.11 million per week following the launch of the Health Lottery. This provides at least suggestive evidence that the launch of the Health Lottery did have an impact (albeit small in absolute terms) on sales of Saturday Hotpicks tickets.
Another important advantage of graphical analysis is that it allows us to identify cases where demand was already falling even before the launch of the Health Lottery. A crude “before and after” comparison that did not take account of such existing trends might well overstate the apparent impact of the Health Lottery on National Lottery sales. Even if demand was already falling, however, it is possible that events such as the launch of the Health Lottery might lead to an acceleration in the rate of decline.
While there is an element of subjective judgement involved in this approach, we believe it avoids many of the risks that might arise with superficially more “objective” approaches. Econometric analysis, for example, might be appropriate if the determinants of short to medium term changes in Lottery demand were well understood, and a high proportion of the fluctuations that we observe in normal conditions could be explained by reference to changes in independent variables. However, if this is not the case, there could be a strong risk that some of the changes caused by other factors (which may be difficult to measure) will be identified instead as impacts of the Health Lottery.
42 Even these observations should be treated with caution. Sales in a “normal” week following several large jackpot draws might be higher than expected because of the publicity generated by the large jackpots, or lower than expected if some players had already brought forward expenditure in order to buy more tickets for the jackpot draws.

Assessment of Lottery Market Issues Impact on National Lottery Sales
NERA Economic Consulting 28
4.2. Context
Before we examine the detailed sales data for the periods immediately before and after the launch of the Health Lottery, it is useful to identify the medium to long term changes that were already occurring in the market. Figure 4.1 to Figure 4.3 show 13 week moving averages for weekly sales of the National Lottery’s draw-based games, together with total sales of scratchcards and interactive instant win games (IIWGs), since February 2009 (the start of the third licence).43
For some games, these moving averages come close to eliminating the impact of short term changes due to high jackpots or other one-off events. But the moving averages for Lotto and especially Euromillions games are still significantly affected by either single very large jackpots or periods when there was an unusually high number of rollovers.
Nevertheless, a clear picture that emerges from the charts is that sales of nearly all of the draw-based games have been falling over time. With one exception (Euromillions), all draw-based games that have operated throughout the last three years had lower sales at the time of the Health Lottery launch than they did in February 2009. But increases in Euromillions sales, together with growth in scratchcard and IIWG revenues, mean that total revenues from both draw-based games and from all games have increased since February 2009.
Sales of the three Thunderball games appear to have been falling at a faster rate than those for the other established games, though the two new games launched during this period (Tuesday Euromillions and Lotto+5) also experienced significant falls. Initially, Wednesday Lotto sales were falling more gradually than most other games (and were boosted by periods with several rollovers), but sales appear to have been adversely affected by the launch of the Tuesday Euromillions draw in May 2011.
43 Note that the moving average is “centred” on the dates shown in the charts. So sales data for weeks after the Health Lottery launch will start to affect the moving average from late August onwards.
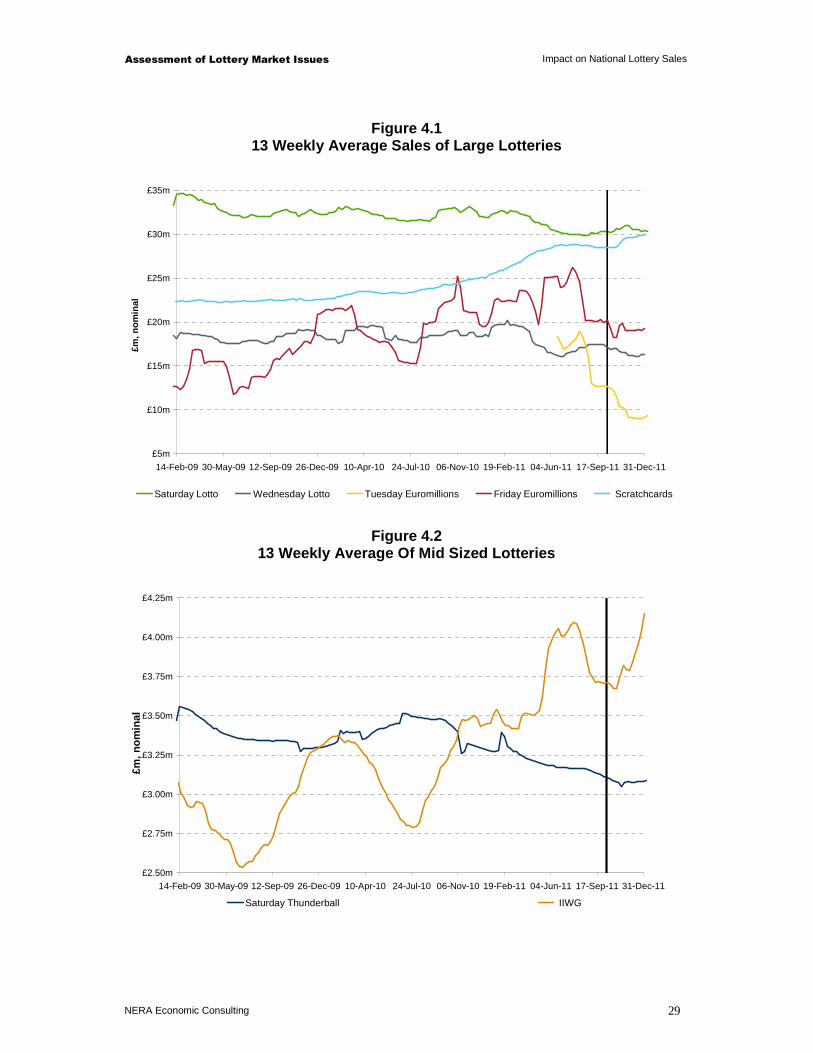
Assessment of Lottery Market Issues Impact on National Lottery Sales
NERA Economic Consulting 29
Figure 4.1 13 Weekly Average Sales of Large Lotteries
£5m
£10m
£15m
£20m
£25m
£30m
£35m
14-Feb-09 30-May-09 12-Sep-09 26-Dec-09 10-Apr-10 24-Jul-10 06-Nov-10 19-Feb-11 04-Jun-11 17-Sep-11 31-Dec-11
£m, n
omin
al
Saturday Lotto Wednesday Lotto Tuesday Euromillions Friday Euromillions Scratchcards
Figure 4.2 13 Weekly Average Of Mid Sized Lotteries
£2.50m
£2.75m
£3.00m
£3.25m
£3.50m
£3.75m
£4.00m
£4.25m
14-Feb-09 30-May-09 12-Sep-09 26-Dec-09 10-Apr-10 24-Jul-10 06-Nov-10 19-Feb-11 04-Jun-11 17-Sep-11 31-Dec-11
£m, n
omin
al
Saturday Thunderball IIWG

Assessment of Lottery Market Issues Impact on National Lottery Sales
NERA Economic Consulting 30
Figure 4.3 13 Weekly Average Of Small Lotteries
£1.0m
£1.2m
£1.4m
£1.6m
£1.8m
£2.0m
£2.2m
£2.4m
£2.6m
£2.8m
£3.0m
14-Feb-09 30-May-09 12-Sep-09 26-Dec-09 10-Apr-10 24-Jul-10 06-Nov-10 19-Feb-11 04-Jun-11 17-Sep-11 31-Dec-11
£m, n
omin
al
Wednesday Thunderball Friday Thunderball Saturday Hotpicks Wednesday Hotpicks Lotto+5
4.3. Impact on Individual Games
In the following sections, we examine the pattern of sales for each individual draw-based game in the period before and after the launch of the Health Lottery. Though we also show the 5-weekly and 13-weekly moving averages in these charts, short term movements in these lines can be difficult to interpret,44 and we believe the unadjusted sales data are often the most informative. Where the weekly sales data show significant fluctuations, for example because rollovers lead to higher sales in certain weeks, then focusing on the low points of the series (eg the weeks without rollovers) may be a useful approach.
4.3.1. Lotto
Figure 4.4 shows weekly sales for Saturday Lotto, the National Lottery’s largest game. A triple rollover on 15 October meant that sales rose very sharply one week after the launch of the Health Lottery. Looking in detail at later weeks, however, we note that sales in the two October draws without rollovers (22 and 29 October) were higher than those in two of the three September draws without rollovers (10 and 24 September), and only very slightly lower than the third (3 September).
44 For example, the change in the 13-week average at any particular time will depend on whether the level of sales six weeks after that point was higher or lower than the level of sales six weeks before that time.

Assessment of Lottery Market Issues Impact on National Lottery Sales
NERA Economic Consulting 31
Looking further beyond the launch of the Health Lottery, only two subsequent draws had sales lower than the 10 September draw. These were on 26 November, which was £88,000 below the September low point but also coincided with the launch of Euromillions’ “Millionaires Month” (when there were 18 £1million prizes for UK players), and the weekend before Christmas. In other weeks, sales remained comparable with, or higher than, those before the launch of the Health Lottery.
Figure 4.4 Saturday Lotto Sales
£28m
£29m
£30m
£31m
£32m
£33m
£34m
£35m
£36m
4-Jun-11 2-Jul-11 30-Jul-11 27-Aug-11 24-Sep-11 22-Oct-11 19-Nov-11 17-Dec-11 14-Jan-12 11-Feb-12
£m, n
omin
al
Unadjusted 5 weekly average 13 weekly average
In the case of the Wednesday draw, as shown in Figure 4.5, sales were quite volatile in August, September and early October, reflecting the impact of three double rollovers (the final one immediately following the launch of the Health Lottery). The rest of October and November saw relatively flat sales, as the next Wednesday rollover was not until December. Despite this, sales remained above previous recent low points for the rest of October, and it was only in mid-to-late November that sales fell below this. At this time, weekly sales were £247,000 below the September low point.
There might be some suggestion, therefore, of possibly lower sales for Wednesday Lotto following the launch of the Health Lottery, albeit with a delayed impact (the effect might even appear positive during October). A larger impact on the Wednesday draw might appear counterintuitive, as the Health Lottery is drawn on Saturday and might therefore be expected to have a greater impact on that day’s Lotto. However, we cannot rule out such an impact on theoretical grounds alone. Indeed, one explanation might be that Saturday Lotto is viewed as the “must play” game, and some players who previously bought Saturday and Wednesday Lotto tickets might switch to buying Saturday Lotto and Health Lottery tickets instead.

Assessment of Lottery Market Issues Impact on National Lottery Sales
NERA Economic Consulting 32
Figure 4.5 Wednesday Lotto Sales
£15m
£16m
£17m
£18m
£19m
£20m
£21m
£22m
4-Jun-11 2-Jul-11 30-Jul-11 27-Aug-11 24-Sep-11 22-Oct-11 19-Nov-11 17-Dec-11 14-Jan-12 11-Feb-12
£m, n
omin
al
Unadjusted 5 weekly average 13 weekly average
Figure 4.6 shows the combined weekly totals for both Lotto games. As discussed above, there is no sign of an immediate impact on sales following the launch of the Health Lottery (in contrast with the behaviour of Hotpicks sales, see Section 4.3.3). Even if, for unspecified reasons, we believe the impact might have been delayed until late November, the maximum difference that could be observed from these data would be around £335,000 per week (£88,000 for the Saturday draw and £247,000 for the Wednesday draw – these are the differences between the September and November low points for each draw).
But we believe this almost certainly exaggerates the impact, if any, of the Health Lottery on Lotto sales as:
� in most other weeks without jackpots, sales were comparable with, or higher than, those before the launch of the Health Lottery;
� the low points also coincided with (for the Saturday draw) the launch of Euromillions’ Millionaires Month and (for the Wednesday draw) a period when there were no rollovers; and
� longer term data suggest that sales of both games were falling, in any case, before the launch of the Health Lottery.
An important caveat is that this analysis is based simply on observing sales data, without any assessment of factors that might have been expected to increase (or indeed reduce) sales between September and October in any case. And we cannot rule out a smaller impact, which might be difficult to detect in such volatile series. But, in general, the data do not suggest that the Health Lottery had a material impact on Lotto sales. Indeed, the level of sales in late October appears relatively healthy compared with the low points in September, shortly before the launch of the Health Lottery.
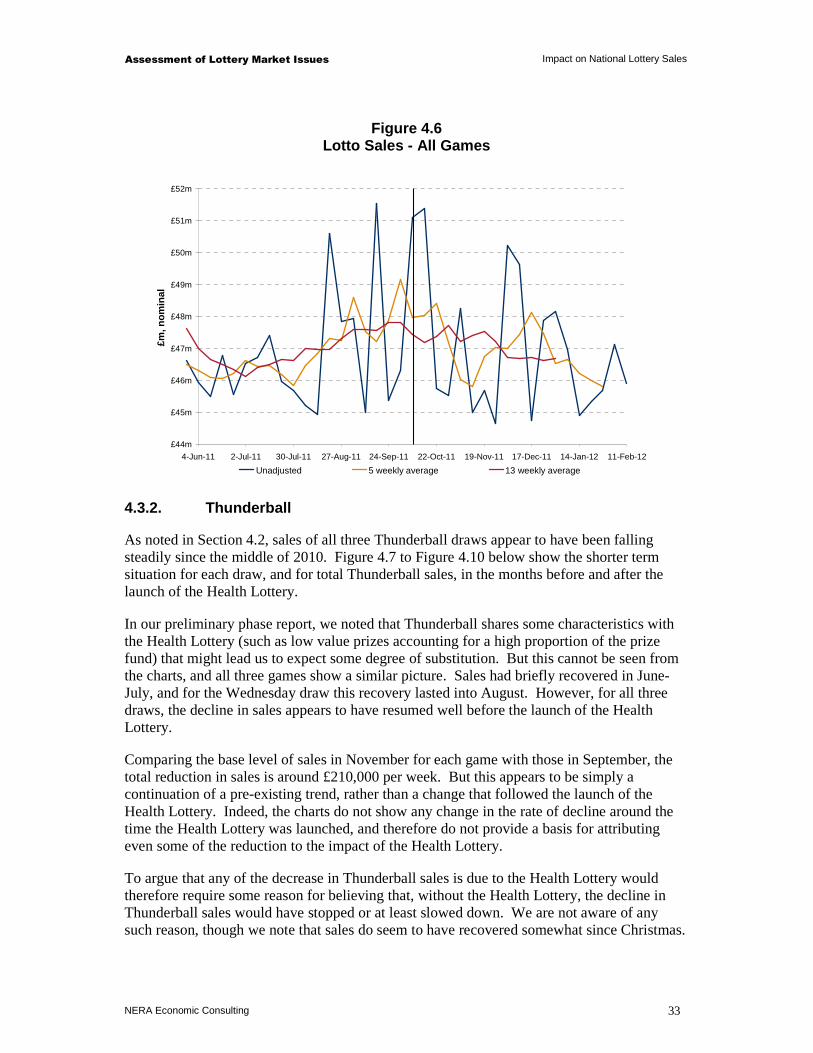
Assessment of Lottery Market Issues Impact on National Lottery Sales
NERA Economic Consulting 33
Figure 4.6 Lotto Sales - All Games
£44m
£45m
£46m
£47m
£48m
£49m
£50m
£51m
£52m
4-Jun-11 2-Jul-11 30-Jul-11 27-Aug-11 24-Sep-11 22-Oct-11 19-Nov-11 17-Dec-11 14-Jan-12 11-Feb-12
£m, n
omin
al
Unadjusted 5 weekly average 13 weekly average
4.3.2. Thunderball
As noted in Section 4.2, sales of all three Thunderball draws appear to have been falling steadily since the middle of 2010. Figure 4.7 to Figure 4.10 below show the shorter term situation for each draw, and for total Thunderball sales, in the months before and after the launch of the Health Lottery.
In our preliminary phase report, we noted that Thunderball shares some characteristics with the Health Lottery (such as low value prizes accounting for a high proportion of the prize fund) that might lead us to expect some degree of substitution. But this cannot be seen from the charts, and all three games show a similar picture. Sales had briefly recovered in June-July, and for the Wednesday draw this recovery lasted into August. However, for all three draws, the decline in sales appears to have resumed well before the launch of the Health Lottery.
Comparing the base level of sales in November for each game with those in September, the total reduction in sales is around £210,000 per week. But this appears to be simply a continuation of a pre-existing trend, rather than a change that followed the launch of the Health Lottery. Indeed, the charts do not show any change in the rate of decline around the time the Health Lottery was launched, and therefore do not provide a basis for attributing even some of the reduction to the impact of the Health Lottery.
To argue that any of the decrease in Thunderball sales is due to the Health Lottery would therefore require some reason for believing that, without the Health Lottery, the decline in Thunderball sales would have stopped or at least slowed down. We are not aware of any such reason, though we note that sales do seem to have recovered somewhat since Christmas.
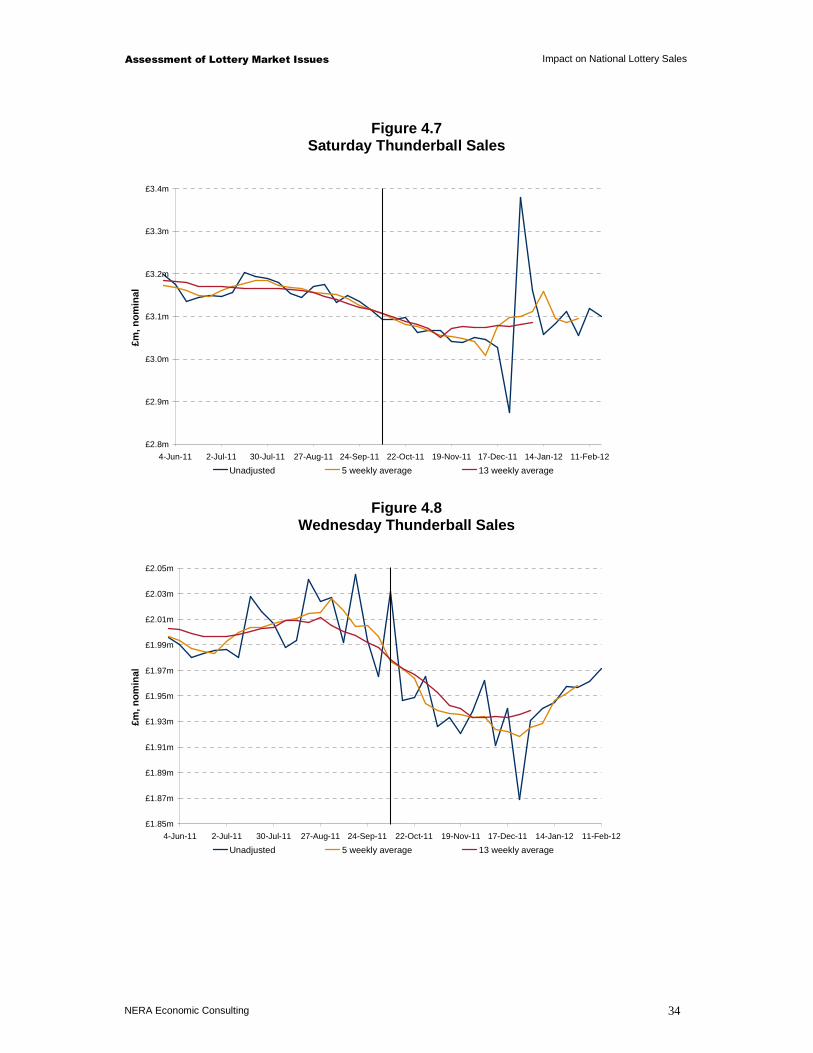
Assessment of Lottery Market Issues Impact on National Lottery Sales
NERA Economic Consulting 34
Figure 4.7 Saturday Thunderball Sales
£2.8m
£2.9m
£3.0m
£3.1m
£3.2m
£3.3m
£3.4m
4-Jun-11 2-Jul-11 30-Jul-11 27-Aug-11 24-Sep-11 22-Oct-11 19-Nov-11 17-Dec-11 14-Jan-12 11-Feb-12
£m, n
omin
al
Unadjusted 5 weekly average 13 weekly average
Figure 4.8 Wednesday Thunderball Sales
£1.85m
£1.87m
£1.89m
£1.91m
£1.93m
£1.95m
£1.97m
£1.99m
£2.01m
£2.03m
£2.05m
4-Jun-11 2-Jul-11 30-Jul-11 27-Aug-11 24-Sep-11 22-Oct-11 19-Nov-11 17-Dec-11 14-Jan-12 11-Feb-12
£m, n
omin
al
Unadjusted 5 weekly average 13 weekly average
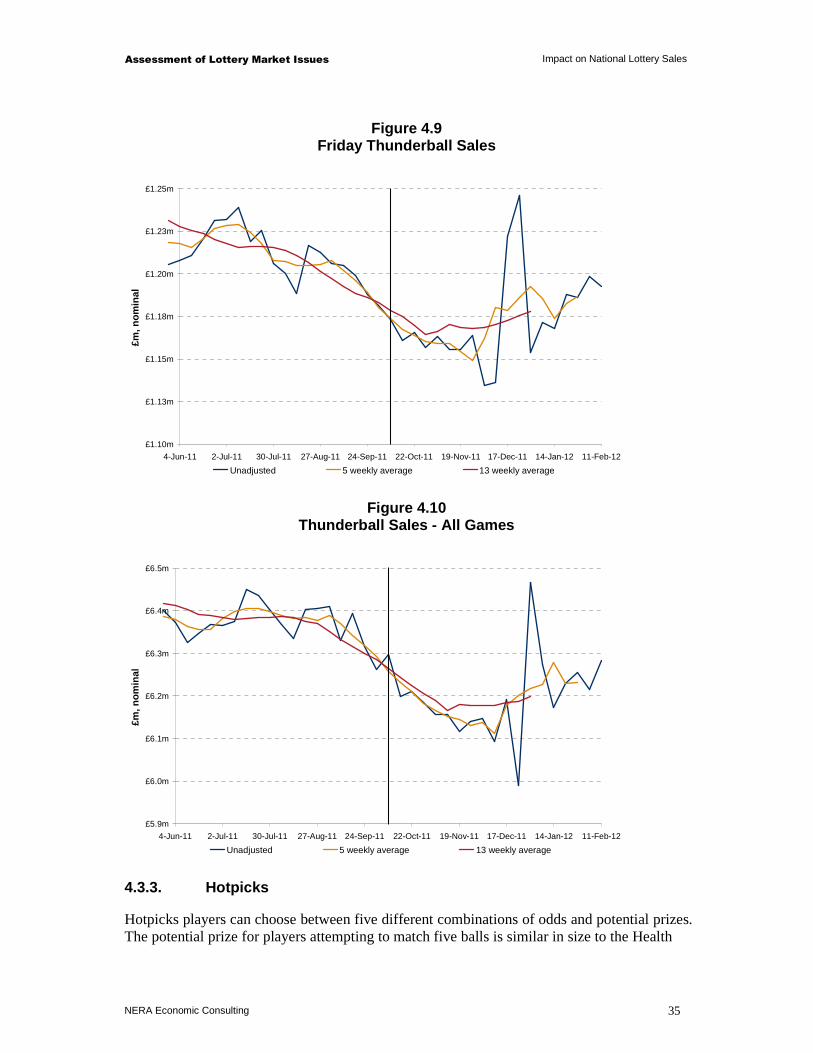
Assessment of Lottery Market Issues Impact on National Lottery Sales
NERA Economic Consulting 35
Figure 4.9 Friday Thunderball Sales
£1.10m
£1.13m
£1.15m
£1.18m
£1.20m
£1.23m
£1.25m
4-Jun-11 2-Jul-11 30-Jul-11 27-Aug-11 24-Sep-11 22-Oct-11 19-Nov-11 17-Dec-11 14-Jan-12 11-Feb-12
£m, n
omin
al
Unadjusted 5 weekly average 13 weekly average
Figure 4.10 Thunderball Sales - All Games
£5.9m
£6.0m
£6.1m
£6.2m
£6.3m
£6.4m
£6.5m
4-Jun-11 2-Jul-11 30-Jul-11 27-Aug-11 24-Sep-11 22-Oct-11 19-Nov-11 17-Dec-11 14-Jan-12 11-Feb-12
£m, n
omin
al
Unadjusted 5 weekly average 13 weekly average
4.3.3. Hotpicks
Hotpicks players can choose between five different combinations of odds and potential prizes. The potential prize for players attempting to match five balls is similar in size to the Health
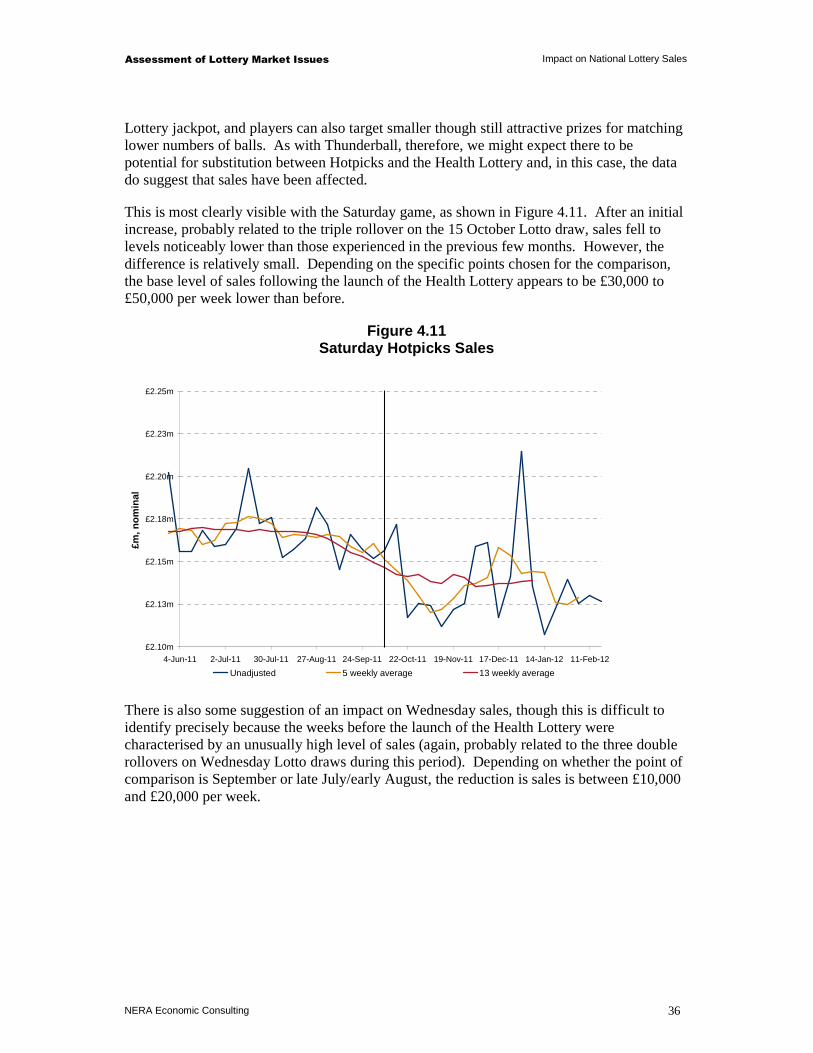
Assessment of Lottery Market Issues Impact on National Lottery Sales
NERA Economic Consulting 36
Lottery jackpot, and players can also target smaller though still attractive prizes for matching lower numbers of balls. As with Thunderball, therefore, we might expect there to be potential for substitution between Hotpicks and the Health Lottery and, in this case, the data do suggest that sales have been affected.
This is most clearly visible with the Saturday game, as shown in Figure 4.11. After an initial increase, probably related to the triple rollover on the 15 October Lotto draw, sales fell to levels noticeably lower than those experienced in the previous few months. However, the difference is relatively small. Depending on the specific points chosen for the comparison, the base level of sales following the launch of the Health Lottery appears to be £30,000 to £50,000 per week lower than before.
Figure 4.11 Saturday Hotpicks Sales
£2.10m
£2.13m
£2.15m
£2.18m
£2.20m
£2.23m
£2.25m
4-Jun-11 2-Jul-11 30-Jul-11 27-Aug-11 24-Sep-11 22-Oct-11 19-Nov-11 17-Dec-11 14-Jan-12 11-Feb-12
£m, n
omin
al
Unadjusted 5 weekly average 13 weekly average
There is also some suggestion of an impact on Wednesday sales, though this is difficult to identify precisely because the weeks before the launch of the Health Lottery were characterised by an unusually high level of sales (again, probably related to the three double rollovers on Wednesday Lotto draws during this period). Depending on whether the point of comparison is September or late July/early August, the reduction is sales is between £10,000 and £20,000 per week.
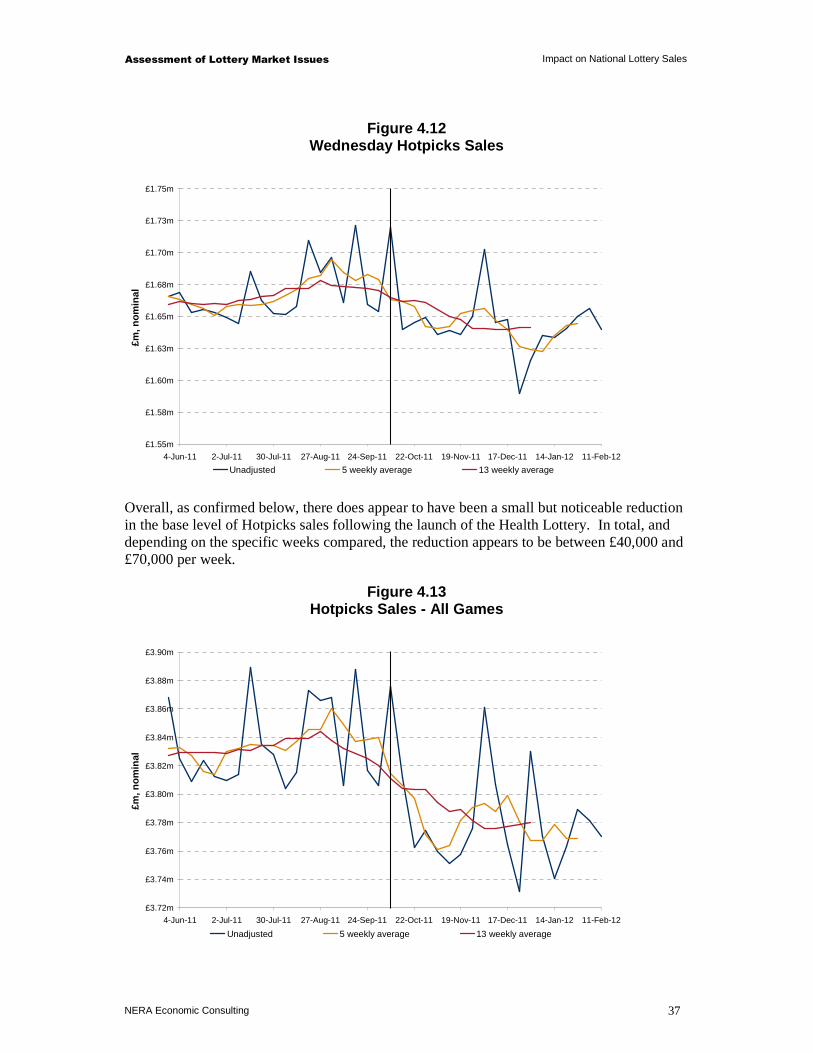
Assessment of Lottery Market Issues Impact on National Lottery Sales
NERA Economic Consulting 37
Figure 4.12 Wednesday Hotpicks Sales
£1.55m
£1.58m
£1.60m
£1.63m
£1.65m
£1.68m
£1.70m
£1.73m
£1.75m
4-Jun-11 2-Jul-11 30-Jul-11 27-Aug-11 24-Sep-11 22-Oct-11 19-Nov-11 17-Dec-11 14-Jan-12 11-Feb-12
£m, n
omin
al
Unadjusted 5 weekly average 13 weekly average
Overall, as confirmed below, there does appear to have been a small but noticeable reduction in the base level of Hotpicks sales following the launch of the Health Lottery. In total, and depending on the specific weeks compared, the reduction appears to be between £40,000 and £70,000 per week.
Figure 4.13 Hotpicks Sales - All Games
£3.72m
£3.74m
£3.76m
£3.78m
£3.80m
£3.82m
£3.84m
£3.86m
£3.88m
£3.90m
4-Jun-11 2-Jul-11 30-Jul-11 27-Aug-11 24-Sep-11 22-Oct-11 19-Nov-11 17-Dec-11 14-Jan-12 11-Feb-12
£m, n
omin
al
Unadjusted 5 weekly average 13 weekly average

Assessment of Lottery Market Issues Impact on National Lottery Sales
NERA Economic Consulting 38
4.3.4. Lotto+5
Lotto+5 was introduced in February 2011, and has suffered from falling sales for most of the subsequent period. From a peak of £3.8 million per week in mid-March, sales fell to less than £2 million per week before the Health Lottery was launched, and to less than £1.7 million per week by February 2012.
Although weekly sales in late November were around £225,000 lower than in late September, we note that sales were already falling throughout September (following a brief recovery in July and August) and so there is no clear indication of a separate impact of the Health Lottery. Indeed, the speed of decline in October, while similar to that in September, is much slower than that experienced during April and May.
To identify an impact of the Health Lottery on Lotto+5 sales would therefore require a belief that the decline in sales experienced in September would have slowed down or even ceased in the absence of the Health Lottery.
Figure 4.14 Lotto+5 Sales
£1.6m
£1.7m
£1.8m
£1.9m
£2.0m
£2.1m
£2.2m
£2.3m
4-Jun-11 2-Jul-11 30-Jul-11 27-Aug-11 24-Sep-11 22-Oct-11 19-Nov-11 17-Dec-11 14-Jan-12 11-Feb-12
£m, n
omin
al
Unadjusted 5 weekly average 13 weekly average
4.3.5. Euromillions
Euromillions sales are even more volatile than those of Lotto. Along with a significant difference in size, this also means that any impact of the Health Lottery would be difficult to identify. As the charts below show, moreover, the period after the launch of the Health Lottery saw fewer very large draws than the months before the launch. This is true for both draws, but especially the Tuesday draw (see Figure 4.16).
In general, however, there is no clear sign of an impact of the Health Lottery. Considering the Friday draw – with one exception (which was 18 November, the week before the launch

Assessment of Lottery Market Issues Impact on National Lottery Sales
NERA Economic Consulting 39
of Millionaires Month), the base levels of sales in the last three months of 2011 seem comparable with those in July, the previous period of several weeks without very large draws (and also, though not shown in the chart, those in April which was another relatively quiet period).
The sales data for the Tuesday draw are even more difficult to interpret, as the launch of the Health Lottery coincided with an unprecedented period with no large draws, and also because sales had been falling since the Tuesday draw was introduced in May 2011. Nevertheless, the base level of turnover in October is broadly comparable to that during the brief quiet period in August, and higher than that during a previous quiet period in May.
Figure 4.15 Friday Euromillions Sales
£10m
£15m
£20m
£25m
£30m
£35m
£40m
4-Jun-11 2-Jul-11 30-Jul-11 27-Aug-11 24-Sep-11 22-Oct-11 19-Nov-11 17-Dec-11 14-Jan-12 11-Feb-12
£m, n
omin
al
Unadjusted 5 weekly average 13 weekly average
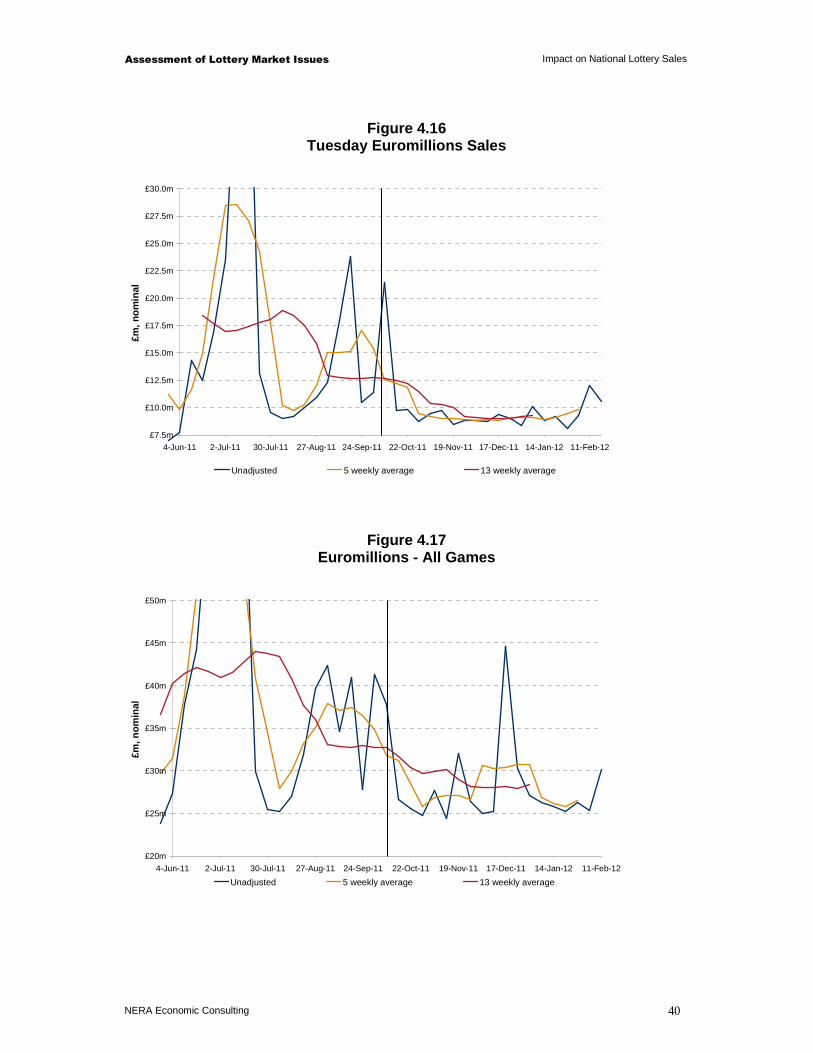
Assessment of Lottery Market Issues Impact on National Lottery Sales
NERA Economic Consulting 40
Figure 4.16 Tuesday Euromillions Sales
£7.5m
£10.0m
£12.5m
£15.0m
£17.5m
£20.0m
£22.5m
£25.0m
£27.5m
£30.0m
4-Jun-11 2-Jul-11 30-Jul-11 27-Aug-11 24-Sep-11 22-Oct-11 19-Nov-11 17-Dec-11 14-Jan-12 11-Feb-12
£m, n
omin
al
Unadjusted 5 weekly average 13 weekly average
Figure 4.17 Euromillions - All Games
£20m
£25m
£30m
£35m
£40m
£45m
£50m
4-Jun-11 2-Jul-11 30-Jul-11 27-Aug-11 24-Sep-11 22-Oct-11 19-Nov-11 17-Dec-11 14-Jan-12 11-Feb-12
£m, n
omin
al
Unadjusted 5 weekly average 13 weekly average
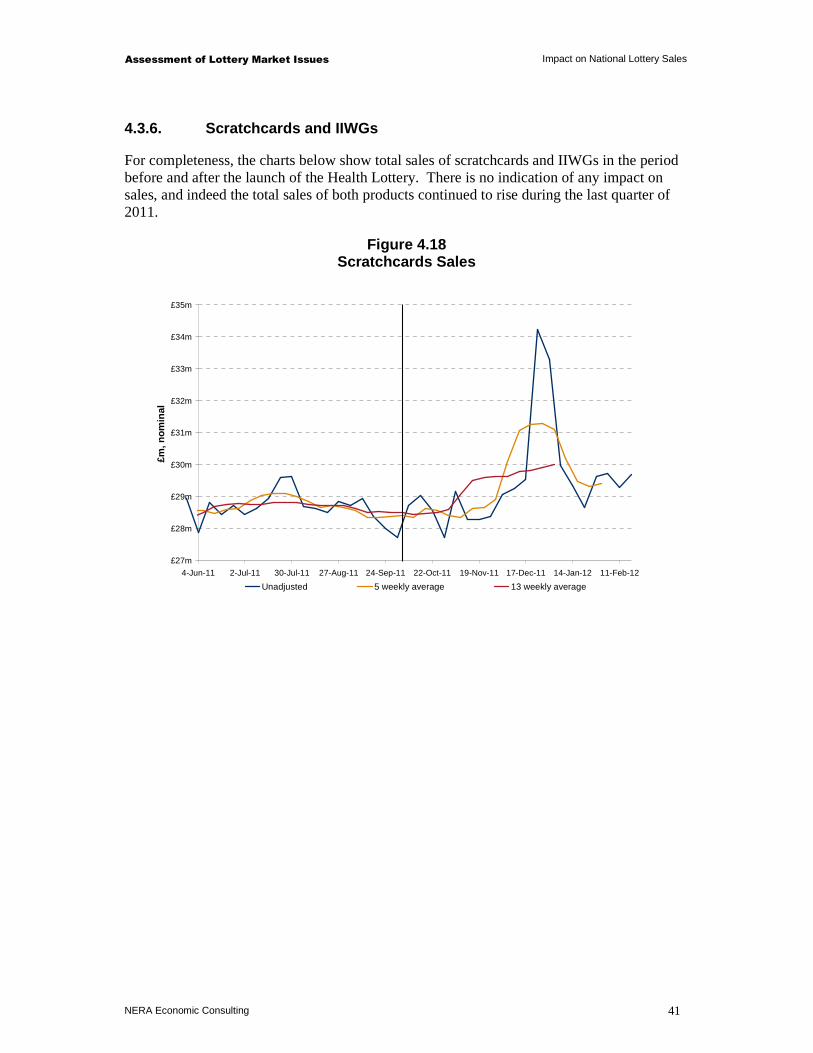
Assessment of Lottery Market Issues Impact on National Lottery Sales
NERA Economic Consulting 41
4.3.6. Scratchcards and IIWGs
For completeness, the charts below show total sales of scratchcards and IIWGs in the period before and after the launch of the Health Lottery. There is no indication of any impact on sales, and indeed the total sales of both products continued to rise during the last quarter of 2011.
Figure 4.18 Scratchcards Sales
£27m
£28m
£29m
£30m
£31m
£32m
£33m
£34m
£35m
4-Jun-11 2-Jul-11 30-Jul-11 27-Aug-11 24-Sep-11 22-Oct-11 19-Nov-11 17-Dec-11 14-Jan-12 11-Feb-12
£m, n
omin
al
Unadjusted 5 weekly average 13 weekly average
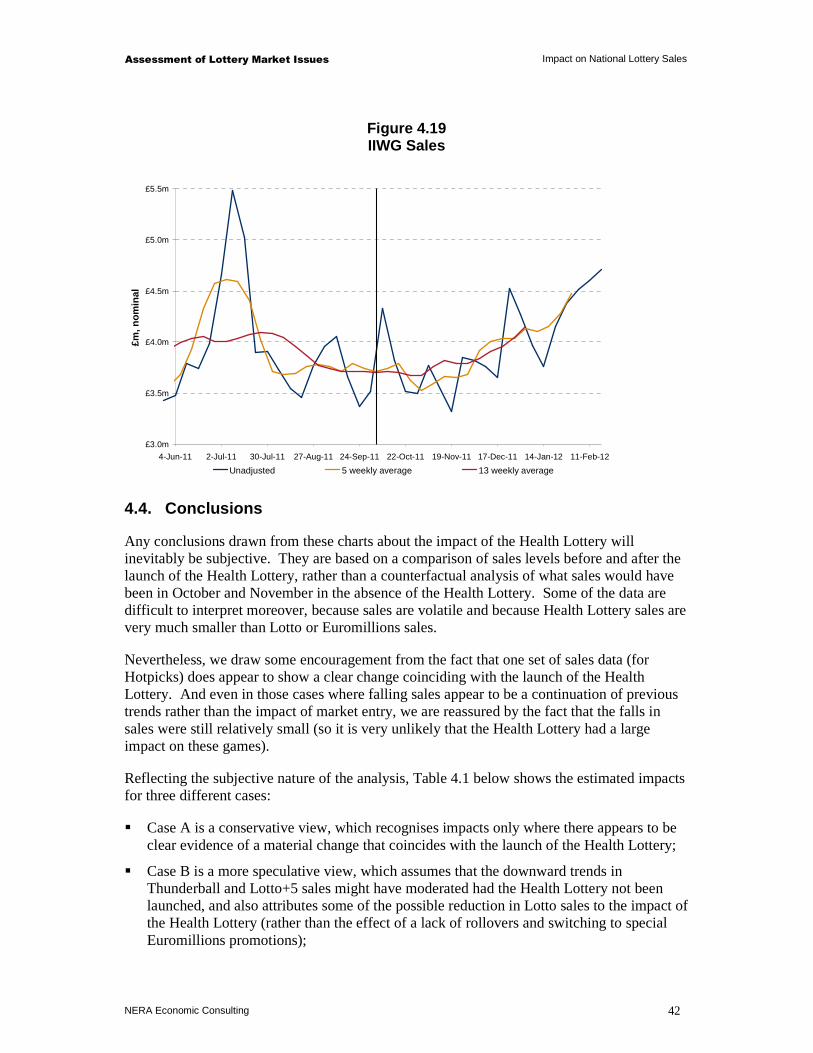
Assessment of Lottery Market Issues Impact on National Lottery Sales
NERA Economic Consulting 42
Figure 4.19 IIWG Sales
£3.0m
£3.5m
£4.0m
£4.5m
£5.0m
£5.5m
4-Jun-11 2-Jul-11 30-Jul-11 27-Aug-11 24-Sep-11 22-Oct-11 19-Nov-11 17-Dec-11 14-Jan-12 11-Feb-12
£m, n
omin
al
Unadjusted 5 weekly average 13 weekly average
4.4. Conclusions
Any conclusions drawn from these charts about the impact of the Health Lottery will inevitably be subjective. They are based on a comparison of sales levels before and after the launch of the Health Lottery, rather than a counterfactual analysis of what sales would have been in October and November in the absence of the Health Lottery. Some of the data are difficult to interpret moreover, because sales are volatile and because Health Lottery sales are very much smaller than Lotto or Euromillions sales.
Nevertheless, we draw some encouragement from the fact that one set of sales data (for Hotpicks) does appear to show a clear change coinciding with the launch of the Health Lottery. And even in those cases where falling sales appear to be a continuation of previous trends rather than the impact of market entry, we are reassured by the fact that the falls in sales were still relatively small (so it is very unlikely that the Health Lottery had a large impact on these games).
Reflecting the subjective nature of the analysis, Table 4.1 below shows the estimated impacts for three different cases:
� Case A is a conservative view, which recognises impacts only where there appears to be clear evidence of a material change that coincides with the launch of the Health Lottery;
� Case B is a more speculative view, which assumes that the downward trends in Thunderball and Lotto+5 sales might have moderated had the Health Lottery not been launched, and also attributes some of the possible reduction in Lotto sales to the impact of the Health Lottery (rather than the effect of a lack of rollovers and switching to special Euromillions promotions);

Assessment of Lottery Market Issues Impact on National Lottery Sales
NERA Economic Consulting 43
� Case C is an aggressive view that takes the maximum reductions between August/September and late November (even if these were isolated cases), and attributes all of the reduction to the impact of the Health Lottery, regardless of other possible explanations (such as pre-existing trends, the impact of a lack of rollovers, or switching to Euromillions).
Table 4.1 Summary – Impact on Draw-Based Games
Case A Case B Case C
Lotto No impact - £100,000 / week ? - £335,000 / week
Thunderball No impact - £50,000 / week ? - £210,000 / week
Hotpicks - £40,000 / week - £55,000 / week - £70,000 / week
Lotto+5 No impact - £100,000 / week ? - £225,000 / week
Euromillions, Scratchcards, IIWGs
No impact
No impact
No impact
The range between Cases A and B, which shows a total impact on National Lottery sales of between £40,000 and £305,000 per week, covers a broadly plausible range of outcomes. There is not firm evidence to justify figures towards the top end of this range, but equally there may be arguments why some of the downward trends might have been expected to moderate if the Health Lottery had not entered the market.
While we cannot rule out higher impacts, such as those shown under Case C, these are difficult to justify on the basis of the sales data alone. Instead, they would require additional evidence of reasons why pre-existing downward trends would have been expected to cease, or why sales of particular games would have been expected to increase in October or November without the launch of the Health Lottery.
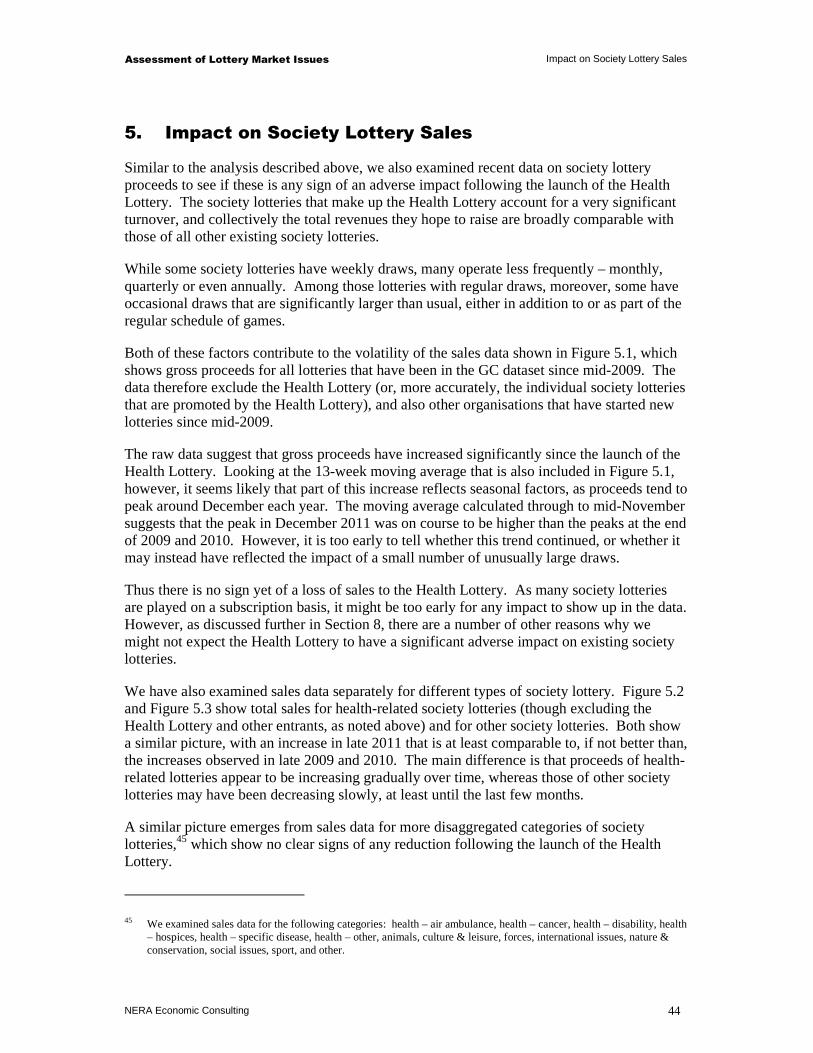
Assessment of Lottery Market Issues Impact on Society Lottery Sales
NERA Economic Consulting 44
5. Impact on Society Lottery Sales
Similar to the analysis described above, we also examined recent data on society lottery proceeds to see if these is any sign of an adverse impact following the launch of the Health Lottery. The society lotteries that make up the Health Lottery account for a very significant turnover, and collectively the total revenues they hope to raise are broadly comparable with those of all other existing society lotteries.
While some society lotteries have weekly draws, many operate less frequently – monthly, quarterly or even annually. Among those lotteries with regular draws, moreover, some have occasional draws that are significantly larger than usual, either in addition to or as part of the regular schedule of games.
Both of these factors contribute to the volatility of the sales data shown in Figure 5.1, which shows gross proceeds for all lotteries that have been in the GC dataset since mid-2009. The data therefore exclude the Health Lottery (or, more accurately, the individual society lotteries that are promoted by the Health Lottery), and also other organisations that have started new lotteries since mid-2009.
The raw data suggest that gross proceeds have increased significantly since the launch of the Health Lottery. Looking at the 13-week moving average that is also included in Figure 5.1, however, it seems likely that part of this increase reflects seasonal factors, as proceeds tend to peak around December each year. The moving average calculated through to mid-November suggests that the peak in December 2011 was on course to be higher than the peaks at the end of 2009 and 2010. However, it is too early to tell whether this trend continued, or whether it may instead have reflected the impact of a small number of unusually large draws.
Thus there is no sign yet of a loss of sales to the Health Lottery. As many society lotteries are played on a subscription basis, it might be too early for any impact to show up in the data. However, as discussed further in Section 8, there are a number of other reasons why we might not expect the Health Lottery to have a significant adverse impact on existing society lotteries.
We have also examined sales data separately for different types of society lottery. Figure 5.2 and Figure 5.3 show total sales for health-related society lotteries (though excluding the Health Lottery and other entrants, as noted above) and for other society lotteries. Both show a similar picture, with an increase in late 2011 that is at least comparable to, if not better than, the increases observed in late 2009 and 2010. The main difference is that proceeds of health-related lotteries appear to be increasing gradually over time, whereas those of other society lotteries may have been decreasing slowly, at least until the last few months.
A similar picture emerges from sales data for more disaggregated categories of society lotteries,45 which show no clear signs of any reduction following the launch of the Health Lottery.
45 We examined sales data for the following categories: health – air ambulance, health – cancer, health – disability, health – hospices, health – specific disease, health – other, animals, culture & leisure, forces, international issues, nature & conservation, social issues, sport, and other.

Assessment of Lottery Market Issues Impact on Society Lottery Sales
NERA Economic Consulting 45
Figure 5.1 Gross proceeds - all existing lotteries
£0
£1,000,000
£2,000,000
£3,000,000
£4,000,000
£5,000,000
£6,000,000
£7,000,000
£8,000,000
Sep - 09 Dec - 09 Mar - 10 Jun - 10 Sep - 10 Dec - 10 Mar - 11 Jun - 11 Sep - 11 Dec - 11
We
ek
ly P
roce
ed
s
Date of Draw
Figure 5.2 Gross proceeds – health causes
£0
£1,000,000
£2,000,000
£3,000,000
£4,000,000
£5,000,000
£6,000,000
Sep - 09 Dec - 09 Mar - 10 Jun - 10 Sep - 10 Dec - 10 Mar - 11 Jun - 11 Sep - 11 Dec - 11
We
ek
ly P
roce
ed
s
Date of Draw
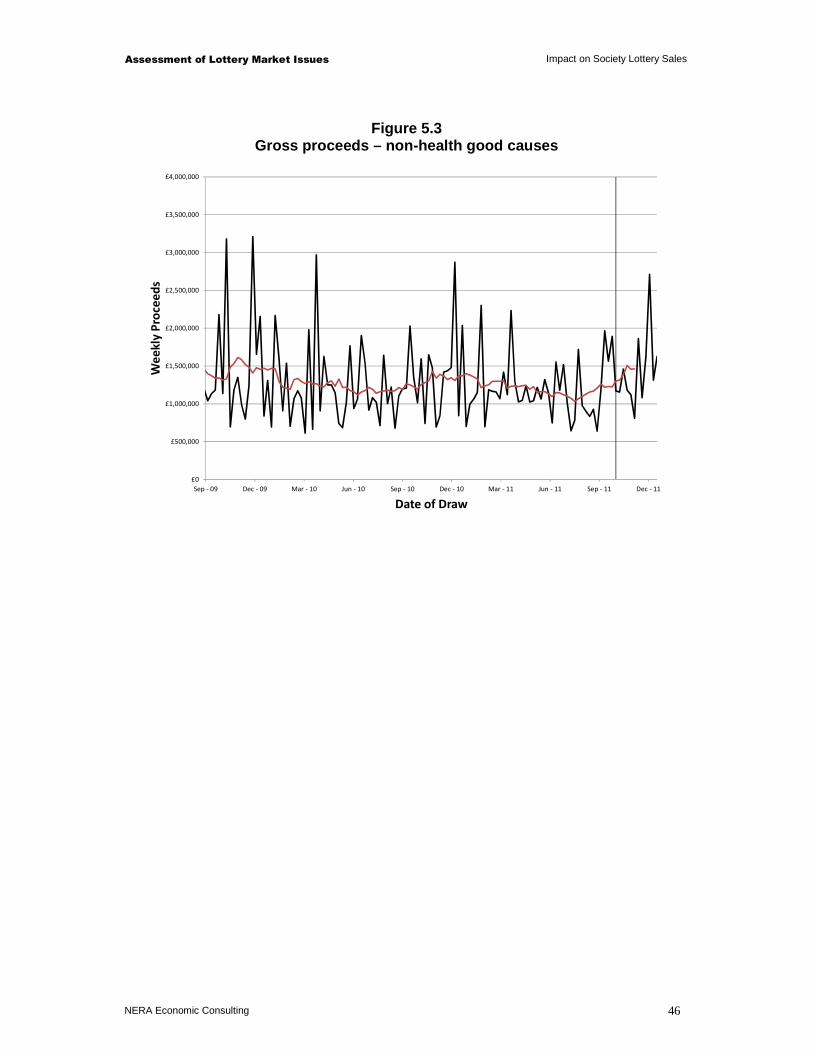
Assessment of Lottery Market Issues Impact on Society Lottery Sales
NERA Economic Consulting 46
Figure 5.3 Gross proceeds – non-health good causes
£0
£500,000
£1,000,000
£1,500,000
£2,000,000
£2,500,000
£3,000,000
£3,500,000
£4,000,000
Sep - 09 Dec - 09 Mar - 10 Jun - 10 Sep - 10 Dec - 10 Mar - 11 Jun - 11 Sep - 11 Dec - 11
We
ek
ly P
roce
ed
s
Date of Draw
Assessment of Lottery Market Issues Impact on Future Licence Competitions
NERA Economic Consulting 47
6. Impact on Future Licence Competitions
6.1. Background
In addition to the direct impact on National Lottery sales, as discussed elsewhere in this report, the Health Lottery (or similar operations) could have a significant impact on the long term strength of the National Lottery if it affects the nature of future competitions for the licence. Regular licence competitions play an important role in ensuring that the National Lottery continues to provide a healthy level of returns to good causes, despite the lack of direct competition from independently-operated lotteries offering similarly large jackpots.
As noted in Section 3, there are relatively few cases where there is direct competition between large lotteries operating in the same geographic area. One reason for this is the risk that direct competition might dilute the jackpots that can be offered by each individual lottery, and thereby harm the market as a whole.46
In industries where competition in the market may not be desirable, competition for the market may be preferred to possible alternatives that include either public sector provision or ongoing economic regulation (or sometimes both). But this logic has only been applied to lottery markets in a few cases, and many governments continue either to run large lotteries themselves or to retain a high degree of control over the lottery.
The UK, in contrast, has allowed private sector firms to provide the National Lottery. Regular competitions for the licence therefore play an important role in placing pressure on the operator to act in the best interests of good causes, whether through improvements in game design, avoiding excessive profits, reductions in operating costs or more effective marketing. While the incentive framework seeks to align the operator’s incentives with the interests of good causes during each licence period, regular competitions help to prevent complacency and provide a potential opportunity for firms with new or better ideas to replace the existing operator.
The benefits from licence competitions cannot be taken for granted, however. The competitions for the second and third licences each attracted only a single competitor to bid against Camelot. There remains a risk that potential future competitors could be discouraged from bidding, especially if they perceive a relatively low probability of winning against Camelot.
For this reason, close attention might be paid to any developments that either increase or decrease the likelihood of there being strong competitions for future National Lottery licences. While important, this is a medium to long term concern, as the current National Lottery licence has recently been extended until January 2023.
46 The benefits of larger lotteries are described in many papers. The classic reference is Cook P J and C T Clotfelter, “The Peculiar Scale Economies of Lotto”, The American Economic Review, Vol. 83, No 3 (June 1993), pp 634-643.
Assessment of Lottery Market Issues Impact on Future Licence Competitions
NERA Economic Consulting 48
6.2. Implications for Key Players
We assume that Camelot will continue to bid for future National Lottery licences. Given the much smaller scale of society lotteries, and the limited opportunities for making substantial profits, it seems very unlikely indeed that Camelot would decide not to bid for future National Lottery licences in order to pursue opportunities with society lotteries.
So the key question to be addressed is whether the launch of the Health Lottery, and other potential developments, might change the number or strength of bidders that will compete with Camelot in future licence competitions. Possible impacts might result from either:
� a change in the number of strong potential bidders – for example because more firms gain experience of operating lotteries in the UK, which encourages them either to lead a bid themselves or else to join a consortium that otherwise might have been short of a key player; or
� a change in potential bidders’ willingness to enter the competition. The low number of competitors in recent competitions reflects, in part at least, decisions by certain potentially strong bidders not to participate in the competition. The decision whether or not to bid for a future licence will depend on factors including
– the attractiveness of the licence, in particular the likely profits that the licence would generate, including indirect benefits (such as a stronger international reputation, or potential spin-off activities),
– the perceived likelihood of displacing Camelot, which will have operated the National Lottery for more than 25 years by the time of the next competition, and
– other possible influences on a firm’s likelihood of bidding, including both the cost of putting together a bid, and also whether winning the licence would give rise to any opportunity cost (for example, if a firm would have to cease or divest certain existing business interests).
It will be important to clarify if there are likely to be any regulatory or other constraints on participation in the National Lottery by firms that are already active in society lotteries. Given the current structure of the industry, especially the very small size of society lotteries in comparison with the National Lottery, it would be surprising if any such constraints were imposed, however changes between now and 2023 could potentially alter the situation.
If a regulatory or other constraint meant that a firm might need to cease or divest certain activities if its bid for the National Lottery were successful, then it would be important to clarify the process through which this might happen. Ideally, the firm would not need to take any action until its success in the National Lottery licence competition had been confirmed, and then the firm would have sufficient time to complete the process without the risk of having to sell a business immediately, when market conditions might be unfavourable. But at present it seems unlikely that such measures would be required in any case.
A similar, and perhaps more realistic, consideration is whether certain suppliers to existing society lotteries might feel constrained in their actions. For example, if their existing customer is participating in a bid, they might feel at least a partial obligation to join that bid even if a potentially stronger team would also like them to join. Again, the disparity in size

Assessment of Lottery Market Issues Impact on Future Licence Competitions
NERA Economic Consulting 49
between society lotteries and the National Lottery may mean that such risks are very low indeed. But this might be reviewed nearer the time of the next competition.
Table 6.1 lists some of the main potential impacts on future licence competitions. “Positive” impacts are those that might lead to stronger competition in future – either a larger pool of potential bidders or a greater likelihood that they will decide to bid. Even if such bidders are not successful, their presence might elicit a stronger bid from Camelot than it would otherwise have submitted. In contrast, “negative” impacts are those that might lead to weaker competitions.
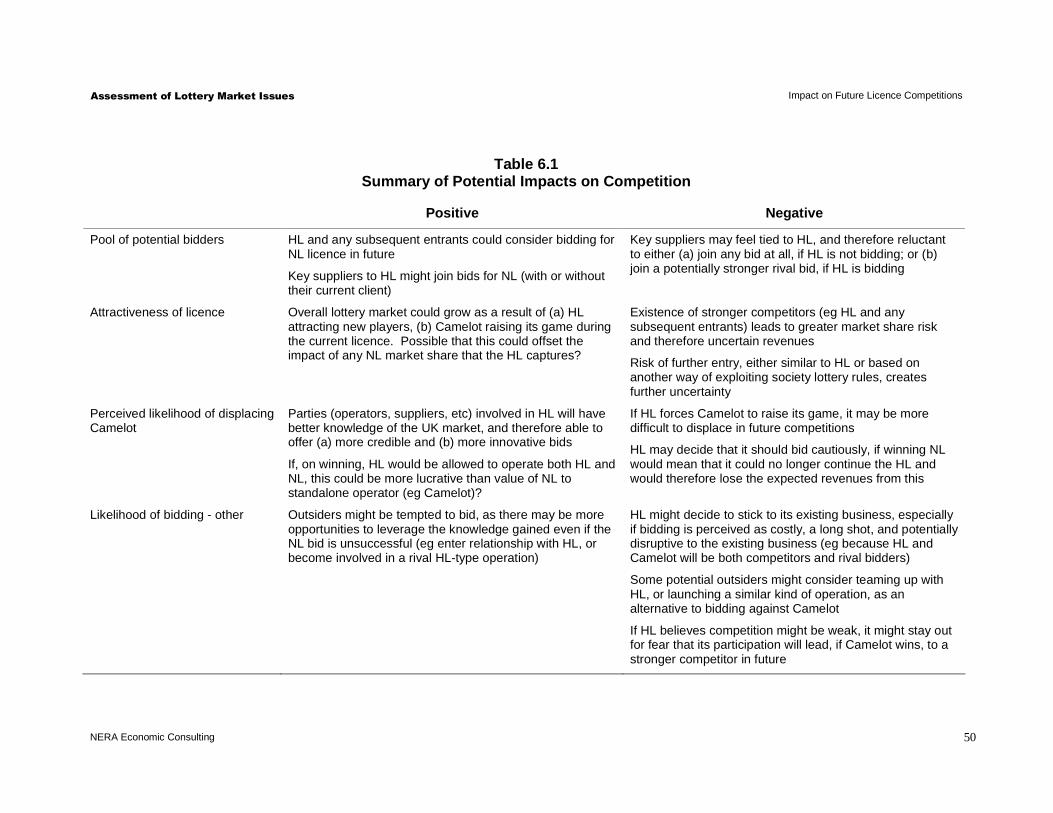
Assessment of Lottery Market Issues Impact on Future Licence Competitions
NERA Economic Consulting 50
Table 6.1 Summary of Potential Impacts on Competition
Positive Negative
Pool of potential bidders HL and any subsequent entrants could consider bidding for NL licence in future
Key suppliers to HL might join bids for NL (with or without their current client)
Key suppliers may feel tied to HL, and therefore reluctant to either (a) join any bid at all, if HL is not bidding; or (b) join a potentially stronger rival bid, if HL is bidding
Attractiveness of licence Overall lottery market could grow as a result of (a) HL attracting new players, (b) Camelot raising its game during the current licence. Possible that this could offset the impact of any NL market share that the HL captures?
Existence of stronger competitors (eg HL and any subsequent entrants) leads to greater market share risk and therefore uncertain revenues
Risk of further entry, either similar to HL or based on another way of exploiting society lottery rules, creates further uncertainty
Perceived likelihood of displacing Camelot
Parties (operators, suppliers, etc) involved in HL will have better knowledge of the UK market, and therefore able to offer (a) more credible and (b) more innovative bids
If, on winning, HL would be allowed to operate both HL and NL, this could be more lucrative than value of NL to standalone operator (eg Camelot)?
If HL forces Camelot to raise its game, it may be more difficult to displace in future competitions
HL may decide that it should bid cautiously, if winning NL would mean that it could no longer continue the HL and would therefore lose the expected revenues from this
Likelihood of bidding - other Outsiders might be tempted to bid, as there may be more opportunities to leverage the knowledge gained even if the NL bid is unsuccessful (eg enter relationship with HL, or become involved in a rival HL-type operation)
HL might decide to stick to its existing business, especially if bidding is perceived as costly, a long shot, and potentially disruptive to the existing business (eg because HL and Camelot will be both competitors and rival bidders)
Some potential outsiders might consider teaming up with HL, or launching a similar kind of operation, as an alternative to bidding against Camelot
If HL believes competition might be weak, it might stay out for fear that its participation will lead, if Camelot wins, to a stronger competitor in future

Assessment of Lottery Market Issues Impact on Future Licence Competitions
NERA Economic Consulting 51
6.3. Overall Assessment
As Table 6.1 shows, there are several different changes that could lead to either stronger or weaker competitions for the National Lottery licence in future. Some of the may well be quite small, but are included in the table for completeness. For example, given the very significant uncertainty about future sales growth that any bidder for the National Lottery will already face, the additional impact of the risk of losing market share to one or more society lotteries should be very small.
Overall, we consider the main impacts are likely to be those associated with expanding the pool of potential bidders and those with direct UK experience, and also the impact of any regulatory or commercial constraints, whether real or perceived. Some of the others listed in the table, such as the potential benefits from joint operation of the Health Lottery and the National Lottery, are likely to be very small, given the differences in scale.
If the impact of the Health Lottery and any similar future developments is to increase the number of parties active in the UK lottery industry, and to provide additional opportunities for international firms to gain some direct experience of the UK market, this could have a positive impact on future licence competitions. Firms that might not have previously considered bidding may now be more likely to participate in a bid, and potential bidders may feel that they stand a better chance of winning.
It is difficult to judge the likely scale of such benefits. Given the much smaller size of society lotteries, it is possible that any potential benefits would also be small, though we note some aspects of certain society lotteries (such as the Health Lottery’s large retail network) are comparable with the National Lottery.
To ensure that any such benefits are realised, it might be useful to consider measures to ensure that possible regulatory or commercial concerns are minimised. If potential bidders feel that they might damage their existing activities by joining a bid for the National Lottery (and, if applicable, making a sensible choice of which bid to join), this might instead lead to weaker competition for the National Lottery licence in future.

Assessment of Lottery Market Issues Key Features of Existing Society Lotteries
NERA Economic Consulting 52
7. Key Features of Existing Society Lotteries
In order to inform a possible consideration of potential policy changes (such as a change to the minimum proportion of proceeds that society lotteries should donate, or a cap on expense ratios), in this section we summarise some of the key features of existing society lotteries.
This analysis is based on data supplied by the GC, covering each draw by lotteries licensed by the GC (these are mostly “large” society lotteries, ie those with single draw proceeds exceeding £20,000 or annual proceeds exceeding £250,000).47 The data identify the lottery promoter and the date of each draw, along with total proceeds, prizes, expenses and donations as reported by the individual organisations. But they do not separately identify lotteries that are run by external lottery managers, or which are part of a group of multiple lotteries.
These lotteries are subject to a number of regulatory requirements. Among others:
� a minimum of 20 per cent of gross proceeds must be passed on to the supported cause;
� the maximum value of ticket sales is £4 million for a single draw or £10 million in any calendar year;
� the maximum single prize (including rollovers) is the larger of either £25,000 or 10 per cent of proceeds (thus giving a maximum prize of £400,000 from any draw).
The following sections show summary data on the donations, prizes and expenses for each individual draw. The data reflect expenses and prizes that are deducted from the lottery proceeds. In some cases, these will understate the true level of operating costs and prize payouts as:
� some inputs to running the lottery may be donated, and will therefore not show up as expenses. These range from labour inputs from unpaid volunteers (typically for smaller lotteries) to services that are provided free of charge by companies or other organisations. The latter might include some specific services that are not charged for, but in other cases they include substantial inputs to the running of the lottery provided using the staff and resources of an organisation associated with the cause;
� some prizes may also be donated.
First, we present data for all society lotteries, then we comment on whether this general picture applies to smaller categories of society lottery, distinguishing between both different types of causes and between established and new society lotteries.
The sections below show charts with a limited range – either total proceeds of up to £2 million a year, or average proceeds of up to £150,000 per draw. These charts have been truncated so that the circumstances of the vast majority of lotteries are more clearly visible. Appendix A contains some additional charts with an extended range (though this is still truncated, and excludes the small number of lotteries with very high total proceeds per year or very high average proceeds per draw).
47 A small number of organisations that do not meet these thresholds, and therefore do not require a GC licence, maintain their licence and continue to provide data to the GC.

Assessment of Lottery Market Issues Key Features of Existing Society Lotteries
NERA Economic Consulting 53
In addition, the charts exclude data for organisations that entered the GC dataset after the start of 2008 (for example, the various organisations that participate in the Health Lottery, as well as many others). We comment further on these in Section 7.2 below. For organisations in the GC dataset prior to 2008, the charts in section 7.1 below include an observation for each calendar year from 2008 to 2011. Each point on the chart represents the data for a single organisation in a single calendar year.
7.1. All Society Lotteries
7.1.1. Donations to good causes
Figure 7.1 and Figure 7.2 show scatter plots of the relationship between lottery proceeds and the percentage passed on to the relevant cause. In Figure 7.1, donations are compared with the total proceeds from each organisation’s draws during the year, so that an observation to the right hand side of the chart might represent either an organisation with a small number of very large draws, or else an organisation that arranges a large number of smaller draws during the year. Figure 7.2 shows a similar comparison against the average proceeds per draw for each organisation in each individual year.
Some noticeable features of the charts are that:
� there are great many organisations with annual proceeds of less than £150,000 per year. The proportion of proceeds that they donate to their respective causes varies widely, with many small organisations donating 50 per cent or higher;
� among organisations with higher annual proceeds, while donations still vary widely, there is some sign of a positive relationship between total proceeds and the proportion donated. Among lotteries with proceeds between £150,000 and £750,000 a year, a high proportion of organisations donate between 30 and 70 per cent of proceeds, while many of those with even higher proceeds donate between 40 and 80 per cent. Figure A.1 in Appendix A shows that this positive relationship continues for even larger organisations, with the only exceptions being lotteries that donate very close to the minimum 20 per cent of proceeds;
� there is less sign of a relationship between average draw size and the proportion of proceeds donated. But Figure 7.2 does show that there are a great many organisations with average draw sizes of between £5,000 and £15,000.
In addition to a small number of organisations that appear to have been in breach of the minimum level of donations (20 per cent),48 there are a number of both large and small lotteries that donate the minimum required 20 per cent of proceeds. However, the majority of lotteries (almost 93 per cent of those shown in the charts) donate at least 30 per cent of proceeds to the causes they support.
48 A very small proportion of draws gave less than 20 per cent of revenues to charity, the minimum specified in the Gambling Act 2005. In these cases the Gambling Commission would contact the operator for an explanation, and if necessary conduct follow up compliance work. A return of less than 20% is usually due to the launch of a new draw or scheme where a disproportionately large proportion of proceeds are spent on start-up expenses.

Assessment of Lottery Market Issues Key Features of Existing Society Lotteries
NERA Economic Consulting 54
Figure 7.1 Donations vs Total Proceeds - All Existing Lotterie s
0%
10%
20%
30%
40%
50%
60%
70%
80%
90%
100%
£0 £200,000 £400,000 £600,000 £800,000 £1,000,000 £1,200,000 £1,400,000 £1,600,000 £1,800,000 £2,000,000
Do
na
tio
ns
as
a p
rop
ort
ion
of
pro
cee
ds
Total proceeds per year
Figure 7.2 Donations vs Proceeds per Draw - All Existing Lotte ries
0%
10%
20%
30%
40%
50%
60%
70%
80%
90%
100%
£0 £25,000 £50,000 £75,000 £100,000 £125,000 £150,000
Do
na
tio
ns
as
a p
rop
ort
ion
of
pro
cee
ds
Average proceeds per draw

Assessment of Lottery Market Issues Key Features of Existing Society Lotteries
NERA Economic Consulting 55
7.1.2. Prizes
Not surprisingly, given the importance of the charitable aspect of society lotteries, many have relatively low prize payout ratios. This is especially true for larger draws, as can be seen in Figure 7.3. There are only a relatively small number of large draws that return more than 30 per cent of proceeds as prizes, and many return less than 10 per cent of proceeds.
Most lotteries that return more than 20 per cent of proceeds as prizes have relatively small draw sizes, and therefore a higher prize payout ratio may be necessary in order to offer attractive top prizes.
Figure 7.3 Prizes vs Proceeds per Draw - All Existing Lotterie s
0%
10%
20%
30%
40%
50%
60%
70%
80%
90%
100%
£0 £25,000 £50,000 £75,000 £100,000 £125,000 £150,000
Pri
zes
as
a p
rop
ort
ion
of
pro
cee
ds
Average proceeds per draw
7.1.3. Expenses
As noted above, the expenses recorded in the data submitted to the GC will not include various forms of donations to the running of individual lotteries. The expenses that are recorded will be the costs taken out of the proceeds to run the lottery and/or payments made to external lottery managers.49 And in cases where an external lottery manager promotes multiple society lotteries under a single brand, any economies of scale resulting from this will
49 Often, an externally managed lottery will return a fixed percentage of proceeds to the individual society lotteries (eg 20 per cent for The Peoples Postcode Lottery, 20.3 per cent for the Health Lottery), in which case “expenses” will be simply the amount of money left over after paying this amount and also prizes.

Assessment of Lottery Market Issues Key Features of Existing Society Lotteries
NERA Economic Consulting 56
not be reflected in the charts below, as the proceeds shown will be those for each individual lottery promoted under the brand.
As shown in Figure 7.4 and Figure 7.5, most society lotteries have expense ratios of less than 40 per cent, and many small lotteries (ie lotteries with low total proceeds per year) have expense ratios of less than 30 per cent. However, the latter may reflect the greater ability of such organisations to use volunteer staff.
Figure 7.4 Expenses vs Total Proceeds - All Existing Lotteries
0%
10%
20%
30%
40%
50%
60%
70%
80%
90%
100%
£0 £200,000 £400,000 £600,000 £800,000 £1,000,000 £1,200,000 £1,400,000 £1,600,000 £1,800,000 £2,000,000
Ex
pe
nse
s a
s a
pro
po
rtio
n o
f p
roce
ed
s
Total proceeds per year
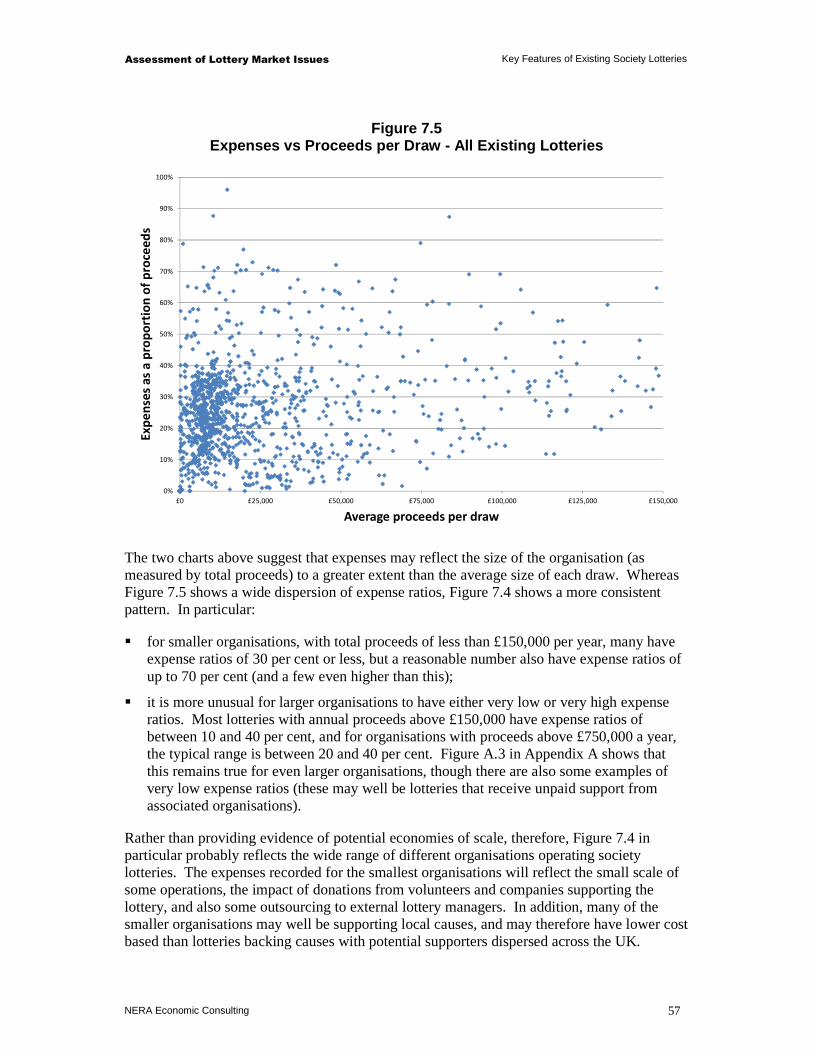
Assessment of Lottery Market Issues Key Features of Existing Society Lotteries
NERA Economic Consulting 57
Figure 7.5 Expenses vs Proceeds per Draw - All Existing Lotter ies
0%
10%
20%
30%
40%
50%
60%
70%
80%
90%
100%
£0 £25,000 £50,000 £75,000 £100,000 £125,000 £150,000
Ex
pe
nse
s a
s a
pro
po
rtio
n o
f p
roce
ed
s
Average proceeds per draw
The two charts above suggest that expenses may reflect the size of the organisation (as measured by total proceeds) to a greater extent than the average size of each draw. Whereas Figure 7.5 shows a wide dispersion of expense ratios, Figure 7.4 shows a more consistent pattern. In particular:
� for smaller organisations, with total proceeds of less than £150,000 per year, many have expense ratios of 30 per cent or less, but a reasonable number also have expense ratios of up to 70 per cent (and a few even higher than this);
� it is more unusual for larger organisations to have either very low or very high expense ratios. Most lotteries with annual proceeds above £150,000 have expense ratios of between 10 and 40 per cent, and for organisations with proceeds above £750,000 a year, the typical range is between 20 and 40 per cent. Figure A.3 in Appendix A shows that this remains true for even larger organisations, though there are also some examples of very low expense ratios (these may well be lotteries that receive unpaid support from associated organisations).
Rather than providing evidence of potential economies of scale, therefore, Figure 7.4 in particular probably reflects the wide range of different organisations operating society lotteries. The expenses recorded for the smallest organisations will reflect the small scale of some operations, the impact of donations from volunteers and companies supporting the lottery, and also some outsourcing to external lottery managers. In addition, many of the smaller organisations may well be supporting local causes, and may therefore have lower cost based than lotteries backing causes with potential supporters dispersed across the UK.
Assessment of Lottery Market Issues Key Features of Existing Society Lotteries
NERA Economic Consulting 58
7.2. Differences Between Types of Lottery
7.2.1. Causes supported
In addition to the analysis shown above, we have analysed more detailed breakdowns of the GC data to investigate whether there are consistent differences between types of society lottery.
Appendix A shows similar scatter plots of donations, prizes and expenses to those discussed above, but distinguishing between health causes and non-health good causes. These suggest that many of the lotteries with very low total proceeds per year are not health-related, whereas many of the slightly larger lotteries support health-related causes. One reason for this is the large number of health-related lotteries that have low value (typically around £10,000, see Figure A.7) but very frequent draws (typically weekly). Many of these support individual hospices.
The most striking difference concerns prizes (see Figure A.9 and Figure A.10). Only a very small number of health-related lotteries with average proceeds per draw above £20,000 return more than 20 per cent of sales as prizes, whereas this is much more common for lotteries that are not health-related. This is consistent with health-related lotteries being closely identified with charitable giving, and thus having less need to offer large prizes.
We also examined similar scatter plots for a more detailed breakdown of causes.50 In general, these confirmed the patterns described above (including the differences between health and non-health causes). But two categories that showed atypical features were:
� hospice lotteries, the majority of which have relatively low proceeds per draw. Because of their high frequency (often weekly), however, they generate reasonably large total proceeds each year (many around £500,000 or higher). Most hospice lotteries have expense ratios of between 10 and 40 per cent, and donate between 30 and 70 per cent of proceeds to the hospice (in most cases more than 50 per cent);
� lotteries that support local air ambulance services. While this is a smaller sample, all of these lotteries donated at least 50 per cent of proceeds to the supported service (many between 60 and 80 per cent, and some even higher), and all had expense ratios of less than 40 per cent.
7.2.2. Changes over time
In addition, we examined the GC data:
� for society lotteries that have been introduced in each year since 2008:
– the main change observable is that the range of expense ratios appears to narrow slightly once lotteries have been in operation for several years. Compared with the
50 The categories were: health – air ambulance, health – cancer, health – disability, health – hospices, health – specific disease, health – other, animals, culture & leisure, forces, international issues, nature & conservation, social issues, sport, and other.
Assessment of Lottery Market Issues Key Features of Existing Society Lotteries
NERA Economic Consulting 59
first year or two, we tend to observe slightly fewer lotteries with very high expense ratios, but also fewer with very low expense ratios (eg below 10 per cent),
– probably reflecting the latter, the number of lotteries donating very high proportions of proceeds (eg 90 per cent or more) also tends to fall over time; and
� for lotteries already operating before 2008, but looking separately at data for 2008, 2009, 2010 and 2011:
– while there was no sign of a general change in the patterns described in the previous sections, we did observe a possible slight increase in expense ratios,
– comparing 2011 and 2008 data, for example, we find slightly more lotteries with expense ratios of 60 to 70 per cent, and slightly fewer large organisations with expense ratios of less than 20 per cent.
Assessment of Lottery Market Issues Potential Impact of Greater Competition
NERA Economic Consulting 60
8. Potential Impact of Greater Competition
This section draws together some initial conclusions on the nature of competition between different types of lottery in the UK, the prospects for greater competition in future, and the potential impacts of such competition. First we reflect on the impact that the Health Lottery has had to date, and whether there are reasons to expect the situation to change in future. Then we consider prospects for further competition, either from an expansion of the Health Lottery or from other organisations launching multiple society lotteries. Finally, we provide some comments on policy implications.
8.1. The Impact of the Health Lottery
8.1.1. Impact to date on sales of other lotteries
Based on the analysis set out in Section 4, we have not found evidence of a significant reduction in National Lottery sales as a result of the launch of the Health Lottery. There is certainly some evidence of an impact, albeit a relatively small one, on Hotpicks sales. And the evidence on sales of other games is open to interpretation, depending for example on whether pre-existing downward trends would have continued in any case, or indeed whether there was any reason to expect sales of some games to increase.
A plausible range for the impact on National Lottery sales is between £40,000 and £305,000 per week. We cannot definitely rule out a more substantial impact, which might have been hidden by the volatility of sales for some games, the substantially large size of Lotto and Euromillions sales, or reasons that National Lottery sales would have been expected to increase. However, even if the actual impact were significant larger, it is still likely that the launch of the Health Lottery has increased the total amount of money generated by lotteries for good causes.51
The relatively small apparent impact on National Lottery sales is not necessarily surprising. The economic literature described in Section 2 finds that the degree of substitution depends on the extent of product differentiation. Despite the Health Lottery’s national marketing campaign and the wide availability of tickets, it is clearly different from many National Lottery Games as it cannot offer large jackpots. In addition, the literature reports some evidence of complementarities, including marketing spillovers when advertising boosts demand for rival products, and benefits when tickets for competing games are sold in the same locations. Both of these could, in theory at least, apply to competition between the Health Lottery and the National Lottery.
While the economic literature also noted that players’ habits sometimes reduced switching, and this might raise the possibility of increased substitution in future, there are also reasons to think that any substitution from National Lottery to Health Lottery sales might actual shrink over time.
51 Even under Camelot’s estimate of a decrease in sales of £1 million per week, the reduction in returns to National Lottery good causes during the last three months of 2011 would have be less than half of the £8 million that the Health Lottery raised for its charities.
Assessment of Lottery Market Issues Potential Impact of Greater Competition
NERA Economic Consulting 61
Neither did we find any evidence of a reduction in society lottery revenues. This is not surprising, as many society lotteries are played on a subscription basis and so it is more difficult for players to switch their expenditure immediately (should they want to). However, there are a number of significant reasons why we would not expect the Health Lottery to cause a substantial reduction in sales of other society lotteries even in the medium to long term. These include:
� the strong identification that many society lottery players have with particular causes. One manifestation of this is the low prize payout ratios that many society lotteries offer, especially for health-related causes (see Figure A.9 in Appendix A);
� the significantly higher proportion of proceeds that most society lotteries pass on to the causes they support, as compared with the 20.3 per cent of Health Lottery proceeds that goes to health causes;
� the ability of many society lotteries to communicate directly with their players (reflecting both the fact that many society lotteries are played on a subscription basis, and also the close association of some players with the cause that benefits from the lottery). Among other things, this will allow society lotteries to encourage continued participation by existing players, and also point out their advantages (such as more generous donations) compared with the Health Lottery;
� the different ways in which most society lottery tickets are sold, reducing the risk of impulse switching between existing society lotteries and the Health Lottery at the point of sale;
� the lack of importance of prizes in promoting society lottery participation, thus reducing the ways in which the Health Lottery might attract players of existing society lotteries;
� the fact that, to date at least, the Health Lottery’s marketing and game design appear to have been aimed at attracting National Lottery players, rather than supporters of other society lotteries; and
� the prospect of a scaling down of the Health Lottery’s marketing, which may now focus on point of sale rather than high profile national media.52
8.1.2. Future competition
Even though the impact of the Health Lottery appears relatively modest at present, it is important to consider whether there are any reasons to believe that it might increase in future. This could be either because of new switching from existing lotteries to the Health Lottery, or because of a change in the Health Lottery’s marketing or range of games.
There is some risk, in theory at least, that switching between lotteries could be delayed because players take time to change their habits. Some of the papers included in the literature review (see Section 2) raise this as a possibility. But the risk of further substantial switching appears relatively low, as:
52 Marketing Week on 28 March 2012, for example, reported that the Health Lottery’s marketing will now focus on point-of-sale activity (http://www.marketingweek.co.uk/news/health-lotterys-top-marketer-exits/4000893.article).
Assessment of Lottery Market Issues Potential Impact of Greater Competition
NERA Economic Consulting 62
� whereas many of the games studied in the economic literature are relatively close substitutes, a key attraction of the National Lottery is the large (and sometimes very large) jackpots available, which the Health Lottery is unable to match (for both regulatory and also commercial reasons);
� the Health Lottery carried out extensive marketing at the time of its launch, which would have encouraged potential switchers, and appears less likely to undertake a similar level of marketing in future.
In fact, it may be more likely that some players who switched to playing the Health Lottery might switch back to National Lottery games at some point in future. The low frequency of wins for Health Lottery players,53 combined with a scaling back of marketing, might lead to disappointment. There is also a risk that adverse publicity, for example stressing the low proportion of proceeds that are donated to health causes and the low prize payout ratio, could further damage the Health Lottery’s reputation. And retailers might be reluctant to continue providing counter and display space for the Health Lottery if sales are disappointing.
As noted in Section 7.1.3, cost levels vary significantly among existing society lotteries. In general, however, it appears that lotteries with low expense ratios are often those with a local focus and/or those which are able to use volunteers or other donated resources. The Health Lottery, in contrast, is targeting a nationwide market, addressed through mass media (rather than sources specific to a narrow cause), and is supporting a large and potentially expensive distribution network.
It is not clear whether the Health Lottery’s business model will prove sustainable in the medium to long term. Figure 8.1 compares the prize, donation and expense ratios of Lotto, the Health Lottery and an illustrative depiction of a typical society lottery.54 The Health Lottery’s high expense ratio means that its prize payout ratio compares unfavourably with National Lottery games, while it donates a significantly smaller share of proceeds to good causes than many society lotteries (and also the National Lottery, especially if Lottery Duty is included in this comparison).
53 On average, a Lotto player will win a prize every 54 games, whereas a Health Lottery player will win a prize every 209 games (though we note that the lowest Health Lottery prize is £50, as compared with £10 for Lotto).
54 This purely illustrative example of a “typical” society lottery is based on casual observation of the concentrations of data points visible in Figure 7.2, Figure 7.3 and Figure 7.5 above.
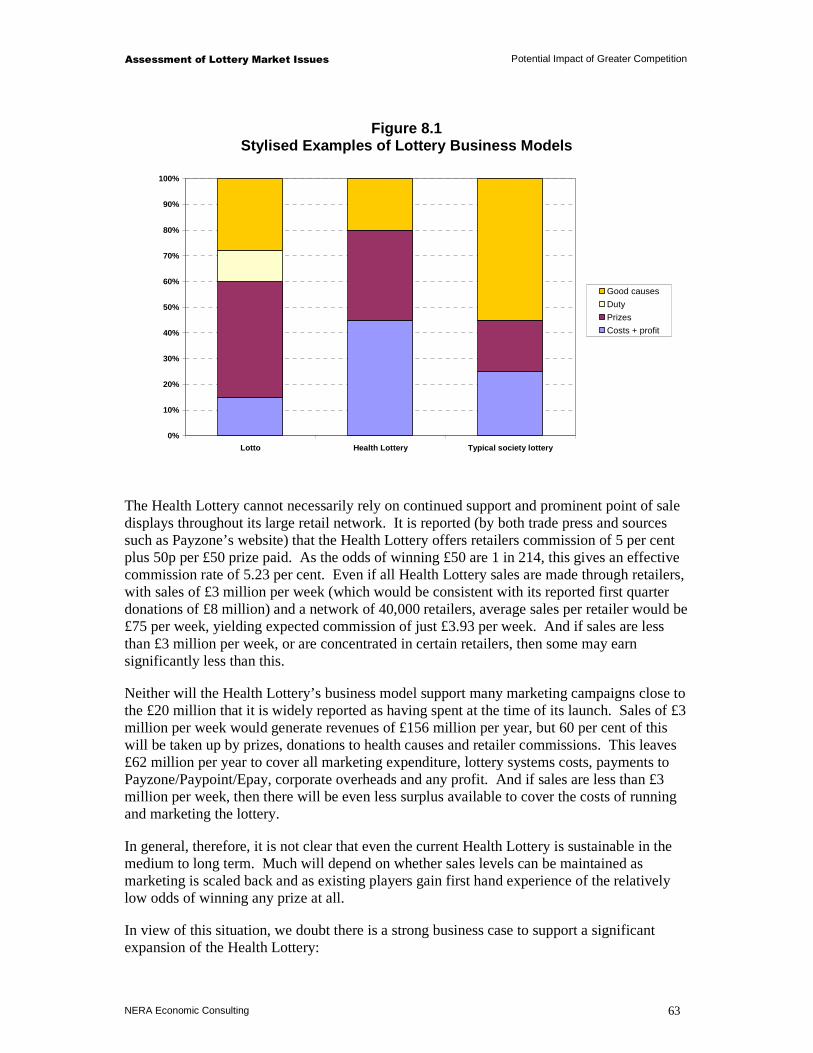
Assessment of Lottery Market Issues Potential Impact of Greater Competition
NERA Economic Consulting 63
Figure 8.1 Stylised Examples of Lottery Business Models
0%
10%
20%
30%
40%
50%
60%
70%
80%
90%
100%
Lotto Health Lottery Typical society lottery
Good causes
Duty
Prizes
Costs + profit
The Health Lottery cannot necessarily rely on continued support and prominent point of sale displays throughout its large retail network. It is reported (by both trade press and sources such as Payzone’s website) that the Health Lottery offers retailers commission of 5 per cent plus 50p per £50 prize paid. As the odds of winning £50 are 1 in 214, this gives an effective commission rate of 5.23 per cent. Even if all Health Lottery sales are made through retailers, with sales of £3 million per week (which would be consistent with its reported first quarter donations of £8 million) and a network of 40,000 retailers, average sales per retailer would be £75 per week, yielding expected commission of just £3.93 per week. And if sales are less than £3 million per week, or are concentrated in certain retailers, then some may earn significantly less than this.
Neither will the Health Lottery’s business model support many marketing campaigns close to the £20 million that it is widely reported as having spent at the time of its launch. Sales of £3 million per week would generate revenues of £156 million per year, but 60 per cent of this will be taken up by prizes, donations to health causes and retailer commissions. This leaves £62 million per year to cover all marketing expenditure, lottery systems costs, payments to Payzone/Paypoint/Epay, corporate overheads and any profit. And if sales are less than £3 million per week, then there will be even less surplus available to cover the costs of running and marketing the lottery.
In general, therefore, it is not clear that even the current Health Lottery is sustainable in the medium to long term. Much will depend on whether sales levels can be maintained as marketing is scaled back and as existing players gain first hand experience of the relatively low odds of winning any prize at all.
In view of this situation, we doubt there is a strong business case to support a significant expansion of the Health Lottery:
Assessment of Lottery Market Issues Potential Impact of Greater Competition
NERA Economic Consulting 64
� a second weekly draw might require significant additional marketing, and there is a strong risk that it would generate a low level of additional proceeds for the Health Lottery (as its main impact might be to abstract revenues from the current draw);
� the introduction of Health Lottery scratchcards would give rise to significant additional costs associated with the need to maintain an effective nationwide distribution network. Especially in view of the higher prize payout ratios already offered by National Lottery scratchcards, it seems unlikely that Health Lottery scratchcards would be economically viable.
In view of the significantly larger jackpots that the National Lottery is able to offer (and also its much higher marketing budget), it seems likely that any expansion of the Health Lottery would be most likely to take sales away from the Health Lottery’s existing Saturday draw, rather than the National Lottery. And we doubt that the Health Lottery would target existing society lottery players instead, as this population is relatively small, diverse and probably difficult to win over.
8.2. Other Possible Competitors
In addition to possible changes to the Health Lottery, new competition could come through other organisations following the Health Lottery’s example in promoting multiple society lotteries on a more ambitious basis than previous cases. For the reasons described above, we are sceptical about the long term viability of using mass market media and a nationwide distribution network, even in the case of a lottery that supports health causes. The risk of a second high profile entrant, seeking to attract players from the National Lottery, might therefore be low, especially as the cause they supported (whether a non-health cause or more specific health cause) might have less appeal than the generic “health” cause.
Nevertheless, the Health Lottery has demonstrated the feasibility of a commercial approach to promoting society lotteries, and this could encourage others to consider possible options. These might include, for example:
� new entry by an organisation seeking to set up a similar operation to the Health Lottery, but probably supporting a different (or more specific) cause, and perhaps also adopting a more low-cost and/or targeted approach to marketing and distribution (eg mainly internet based);
� a relaunch of an existing major society lottery, setting up several separate lotteries that can be managed jointly and will allow the organisation to target higher sales and offer higher prizes; or
� a joint operation by a number of organisations involved with a specific type of cause (such as cancer charities) that currently offer separate lotteries. A combined multiple lottery could offer higher prizes, while existing players and non-playing supporters of each charity could provide an initial and relatively inexpensive focus for the new lottery’s initial marketing.
Each of these might be positioned as a more attractive society lottery, but still focused on raising money for the relevant cause(s), rather than necessarily trying to attract players from the National Lottery. An entirely new lottery might try to widen participation, seeking to attract those likely to be sympathetic to the cause but not necessarily playing a society lottery

Assessment of Lottery Market Issues Potential Impact of Greater Competition
NERA Economic Consulting 65
at present, whereas a lottery based on one or more existing lotteries might be more focused on current players.
The differences in prize payout ratios that we observe between different causes, and even between different types of draw supporting quite similar causes,55 might be taken as a crude indicator of the balance between charitable motivations and the need for some financial incentive as well. Further analysis could be carried out to identify and analyse the most “commercial” sections of the society lottery sector, which might provide some indication of the potential scope for an even more commercial approach by either a new entrant or one or more existing lottery providers.
8.3. Policy Implications
Overall, there does not appear to be an immediate threat to either the National Lottery or to existing society lotteries. While the Health Lottery has demonstrated a more ambitious commercial approach to managing multiple society lotteries, it may also be handicapped by its inability to offer large jackpots and by the high costs of launching a major national marketing campaign and maintaining a large nationwide network of retailers.
Nevertheless, there may be some risk that a new society lottery, perhaps aiming more at the middle ground between specific society lotteries and the general good causes supported by the National Lottery, and with a lower cost business model than the Health Lottery, could follow the Health Lottery’s lead in establishing a high profile multiple lottery. While the Health Lottery appears to have increased the total amounts being passed on to health causes, it remains a relatively inefficient was of supporting good causes (as only 20.3 per cent of proceeds are passed on). If a future entrant were to take a significant number of players from existing, and more generous, society lotteries, or even reduce direct donations to certain good causes, then there might be a greater risk that total donations could fall, or that certain individual charities could suffer.
Among the possible policy responses, there are clear risks from either a cap on expenses or a change in regulations to make an operation such as the Health Lottery illegal. An expense cap might be difficult to enforce, especially given the way that some lotteries benefit from inputs from volunteers and donated resources, and it could also hit those organisations (perhaps mainly health-related) that can maintain healthy donations despite a relatively high expense ratio, because they can also operate with a low prize payout ratio. And taking action to prevent multiple lotteries operating in this way might be difficult to justify, as the Health Lottery does appear to have generated an overall increase in the funds going to good causes, and there are other existing multiple lotteries that might well be affected by any change in the current regulations.
An increase in the minimum required proportion of donations, in contrast, has some attractions. Around 93 per cent of existing society lotteries already donate more than 30 per cent of proceeds, well above the current minimum. And our analysis to date has not revealed
55 For some good causes, there are signs of distinct types of lottery co-existing - we observe a number of different lotteries with prize payout ratios of less than 20 per cent and others with ratios in excess of 40 per cent, but almost no lotteries in the middle ground between these groups.
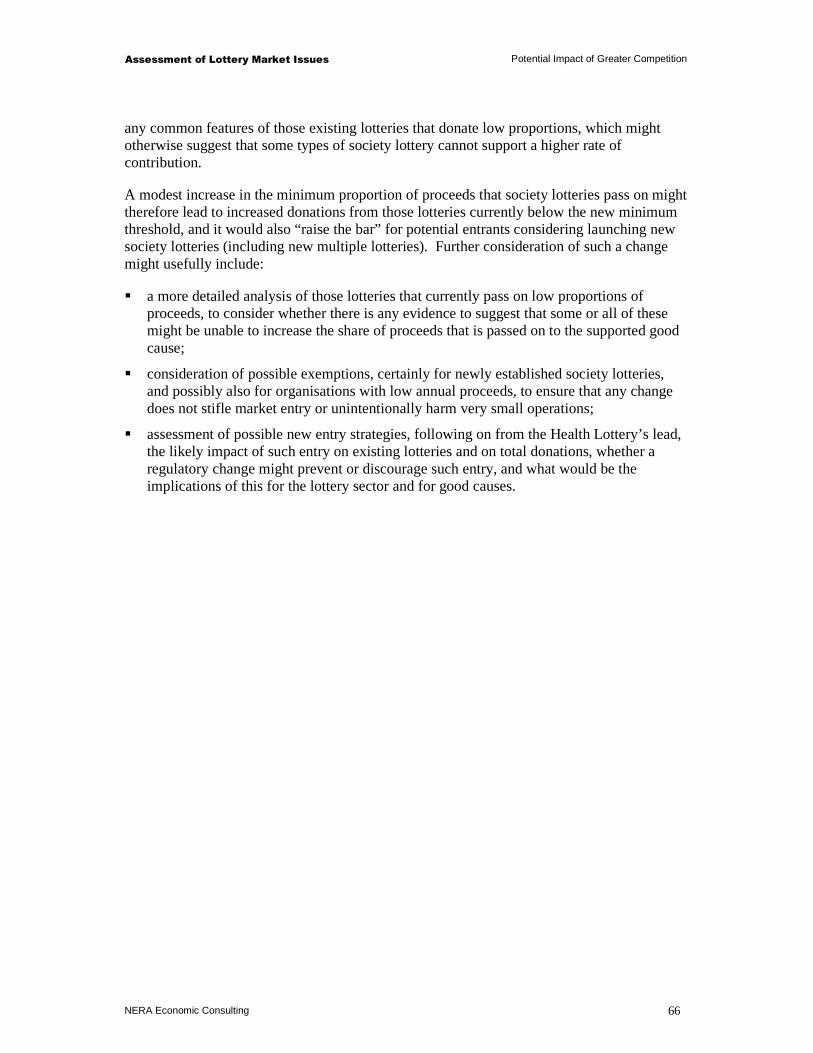
Assessment of Lottery Market Issues Potential Impact of Greater Competition
NERA Economic Consulting 66
any common features of those existing lotteries that donate low proportions, which might otherwise suggest that some types of society lottery cannot support a higher rate of contribution.
A modest increase in the minimum proportion of proceeds that society lotteries pass on might therefore lead to increased donations from those lotteries currently below the new minimum threshold, and it would also “raise the bar” for potential entrants considering launching new society lotteries (including new multiple lotteries). Further consideration of such a change might usefully include:
� a more detailed analysis of those lotteries that currently pass on low proportions of proceeds, to consider whether there is any evidence to suggest that some or all of these might be unable to increase the share of proceeds that is passed on to the supported good cause;
� consideration of possible exemptions, certainly for newly established society lotteries, and possibly also for organisations with low annual proceeds, to ensure that any change does not stifle market entry or unintentionally harm very small operations;
� assessment of possible new entry strategies, following on from the Health Lottery’s lead, the likely impact of such entry on existing lotteries and on total donations, whether a regulatory change might prevent or discourage such entry, and what would be the implications of this for the lottery sector and for good causes.
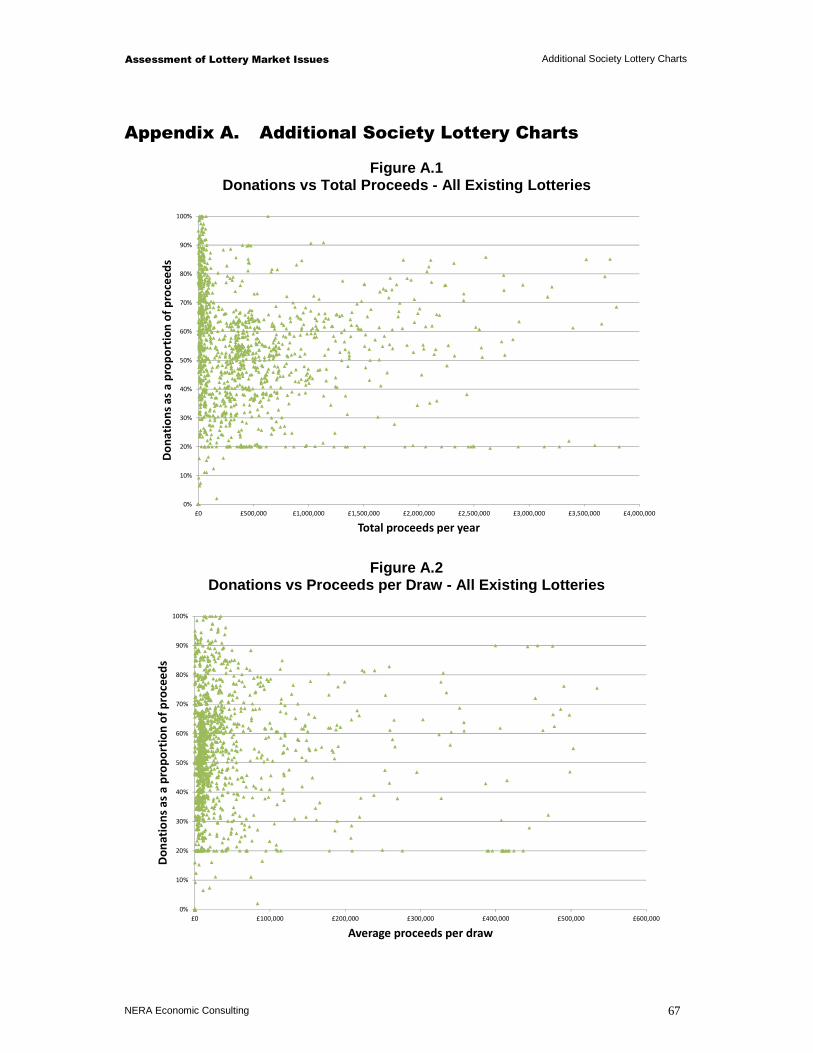
Assessment of Lottery Market Issues Additional Society Lottery Charts
NERA Economic Consulting 67
Appendix A. Additional Society Lottery Charts
Figure A.1 Donations vs Total Proceeds - All Existing Lotterie s
0%
10%
20%
30%
40%
50%
60%
70%
80%
90%
100%
£0 £500,000 £1,000,000 £1,500,000 £2,000,000 £2,500,000 £3,000,000 £3,500,000 £4,000,000
Do
na
tio
ns
as
a p
rop
ort
ion
of
pro
cee
ds
Total proceeds per year
Figure A.2 Donations vs Proceeds per Draw - All Existing Lotte ries
0%
10%
20%
30%
40%
50%
60%
70%
80%
90%
100%
£0 £100,000 £200,000 £300,000 £400,000 £500,000 £600,000
Do
na
tio
ns
as
a p
rop
ort
ion
of
pro
cee
ds
Average proceeds per draw
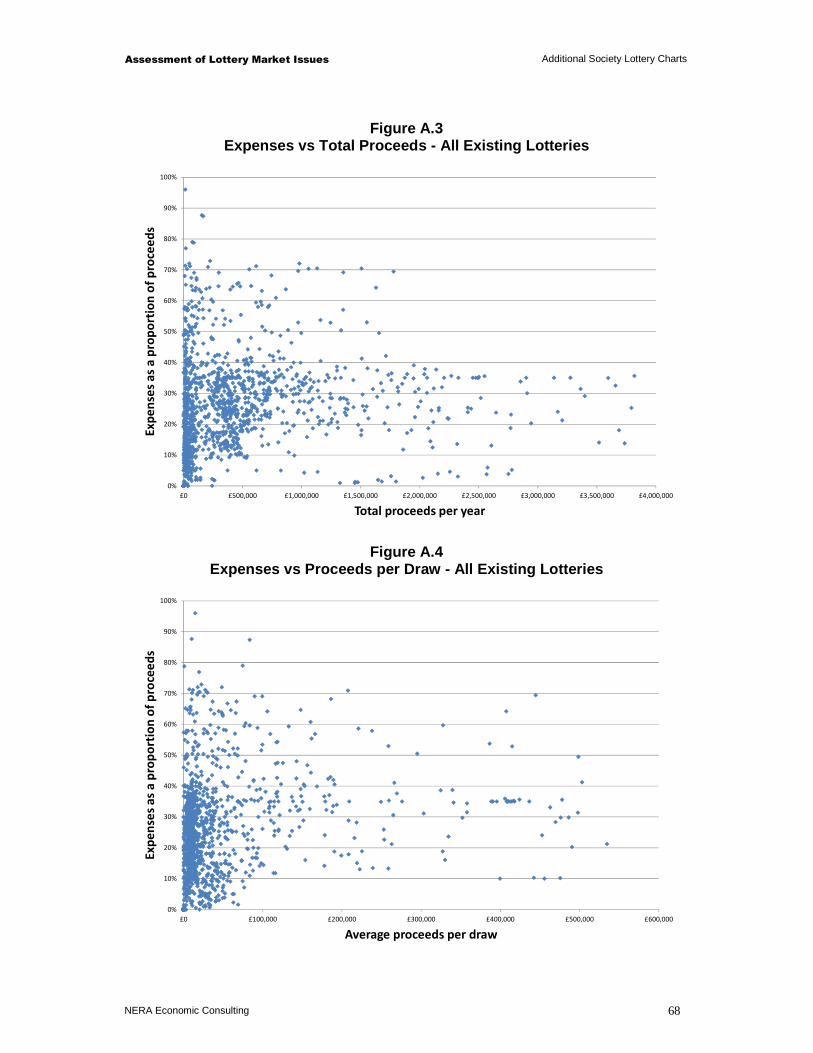
Assessment of Lottery Market Issues Additional Society Lottery Charts
NERA Economic Consulting 68
Figure A.3 Expenses vs Total Proceeds - All Existing Lotteries
0%
10%
20%
30%
40%
50%
60%
70%
80%
90%
100%
£0 £500,000 £1,000,000 £1,500,000 £2,000,000 £2,500,000 £3,000,000 £3,500,000 £4,000,000
Ex
pe
nse
s a
s a
pro
po
rtio
n o
f p
roce
ed
s
Total proceeds per year
Figure A.4 Expenses vs Proceeds per Draw - All Existing Lotter ies
0%
10%
20%
30%
40%
50%
60%
70%
80%
90%
100%
£0 £100,000 £200,000 £300,000 £400,000 £500,000 £600,000
Ex
pe
nse
s a
s a
pro
po
rtio
n o
f p
roce
ed
s
Average proceeds per draw

Assessment of Lottery Market Issues Additional Society Lottery Charts
NERA Economic Consulting 69
Figure A.5 Donations vs Total Proceeds – Health Causes
0%
10%
20%
30%
40%
50%
60%
70%
80%
90%
100%
£0 £200,000 £400,000 £600,000 £800,000 £1,000,000 £1,200,000 £1,400,000 £1,600,000 £1,800,000 £2,000,000
Do
na
tio
ns
as
a p
rop
ort
ion
of
pro
cee
ds
Total proceeds per year
Figure A.6 Donations vs Total Proceeds – Non-Health Good Cause s
0%
10%
20%
30%
40%
50%
60%
70%
80%
90%
100%
£0 £200,000 £400,000 £600,000 £800,000 £1,000,000 £1,200,000 £1,400,000 £1,600,000 £1,800,000 £2,000,000
Do
na
tio
ns
as
a p
rop
ort
ion
of
pro
cee
ds
Total proceeds per year
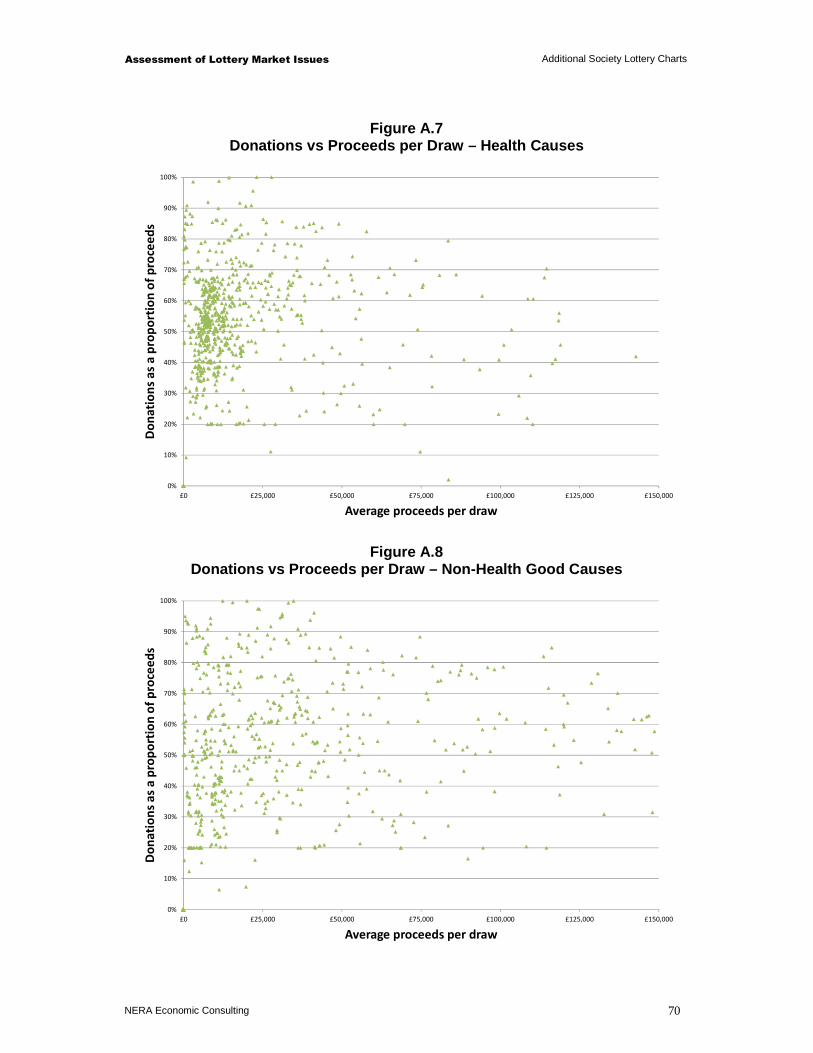
Assessment of Lottery Market Issues Additional Society Lottery Charts
NERA Economic Consulting 70
Figure A.7 Donations vs Proceeds per Draw – Health Causes
0%
10%
20%
30%
40%
50%
60%
70%
80%
90%
100%
£0 £25,000 £50,000 £75,000 £100,000 £125,000 £150,000
Do
na
tio
ns
as
a p
rop
ort
ion
of
pro
cee
ds
Average proceeds per draw
Figure A.8 Donations vs Proceeds per Draw – Non-Health Good Ca uses
0%
10%
20%
30%
40%
50%
60%
70%
80%
90%
100%
£0 £25,000 £50,000 £75,000 £100,000 £125,000 £150,000
Do
na
tio
ns
as
a p
rop
ort
ion
of
pro
cee
ds
Average proceeds per draw
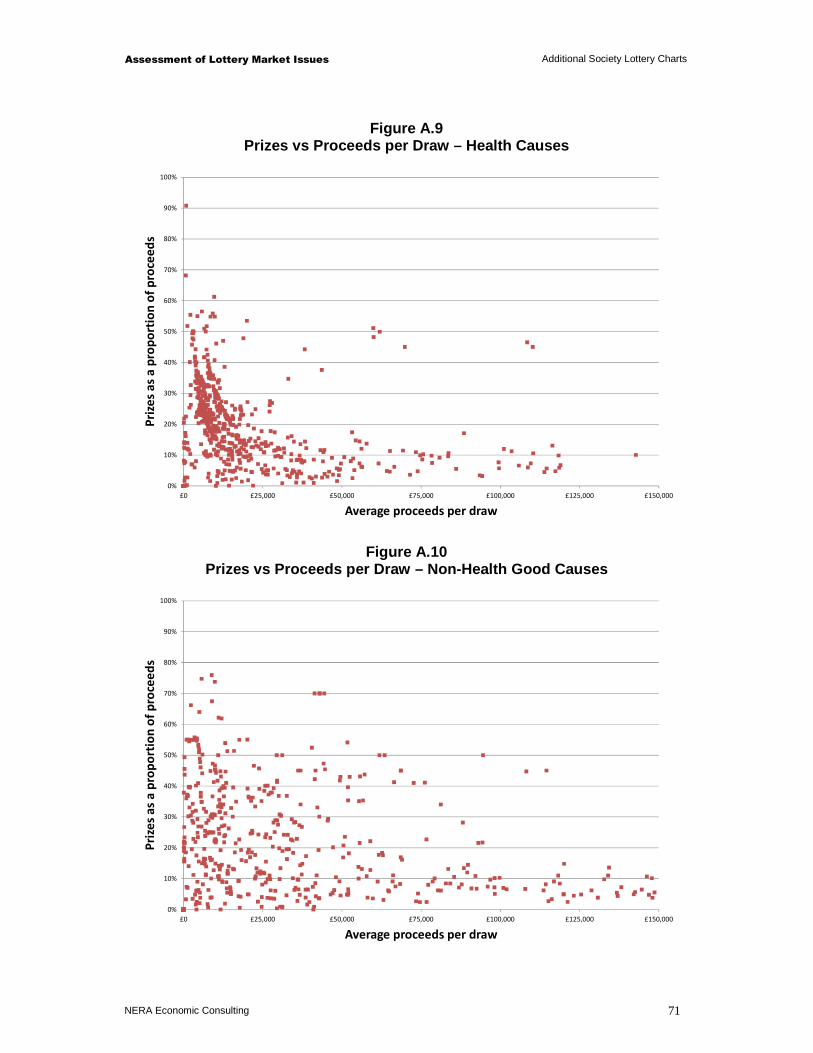
Assessment of Lottery Market Issues Additional Society Lottery Charts
NERA Economic Consulting 71
Figure A.9 Prizes vs Proceeds per Draw – Health Causes
0%
10%
20%
30%
40%
50%
60%
70%
80%
90%
100%
£0 £25,000 £50,000 £75,000 £100,000 £125,000 £150,000
Pri
zes
as
a p
rop
ort
ion
of
pro
cee
ds
Average proceeds per draw
Figure A.10 Prizes vs Proceeds per Draw – Non-Health Good Cause s
0%
10%
20%
30%
40%
50%
60%
70%
80%
90%
100%
£0 £25,000 £50,000 £75,000 £100,000 £125,000 £150,000
Pri
zes
as
a p
rop
ort
ion
of
pro
cee
ds
Average proceeds per draw
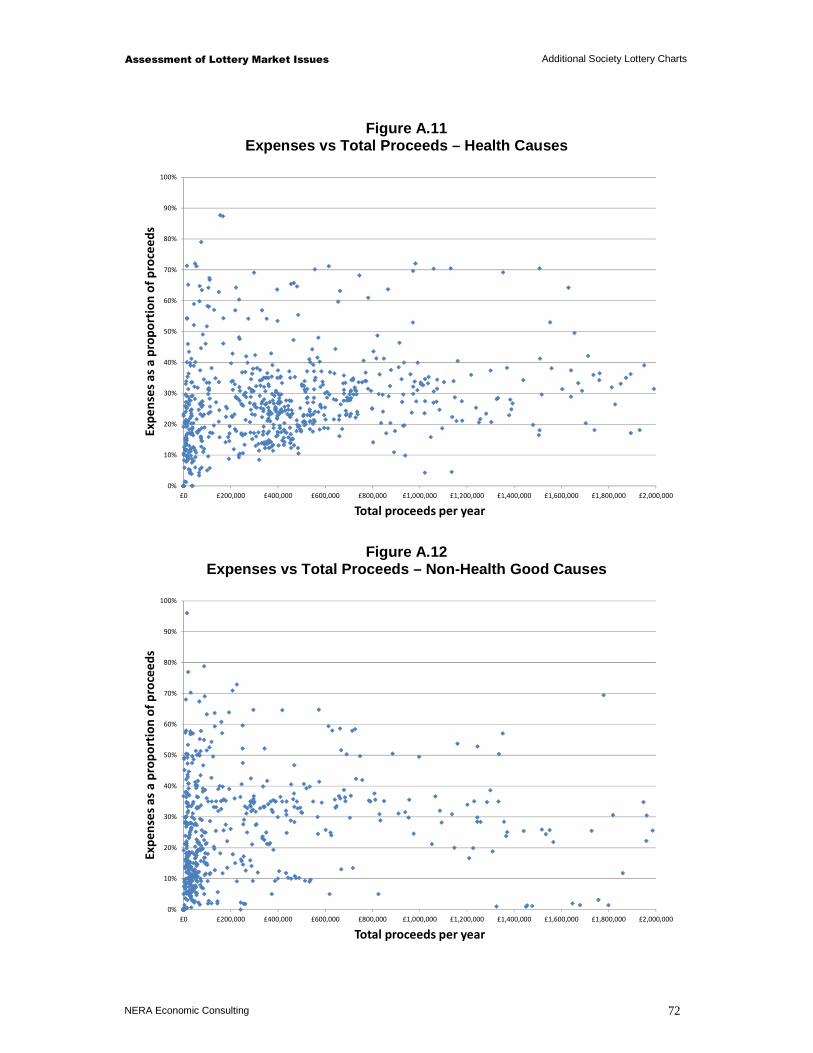
Assessment of Lottery Market Issues Additional Society Lottery Charts
NERA Economic Consulting 72
Figure A.11 Expenses vs Total Proceeds – Health Causes
0%
10%
20%
30%
40%
50%
60%
70%
80%
90%
100%
£0 £200,000 £400,000 £600,000 £800,000 £1,000,000 £1,200,000 £1,400,000 £1,600,000 £1,800,000 £2,000,000
Ex
pe
nse
s a
s a
pro
po
rtio
n o
f p
roce
ed
s
Total proceeds per year
Figure A.12 Expenses vs Total Proceeds – Non-Health Good Causes
0%
10%
20%
30%
40%
50%
60%
70%
80%
90%
100%
£0 £200,000 £400,000 £600,000 £800,000 £1,000,000 £1,200,000 £1,400,000 £1,600,000 £1,800,000 £2,000,000
Ex
pe
nse
s a
s a
pro
po
rtio
n o
f p
roce
ed
s
Total proceeds per year
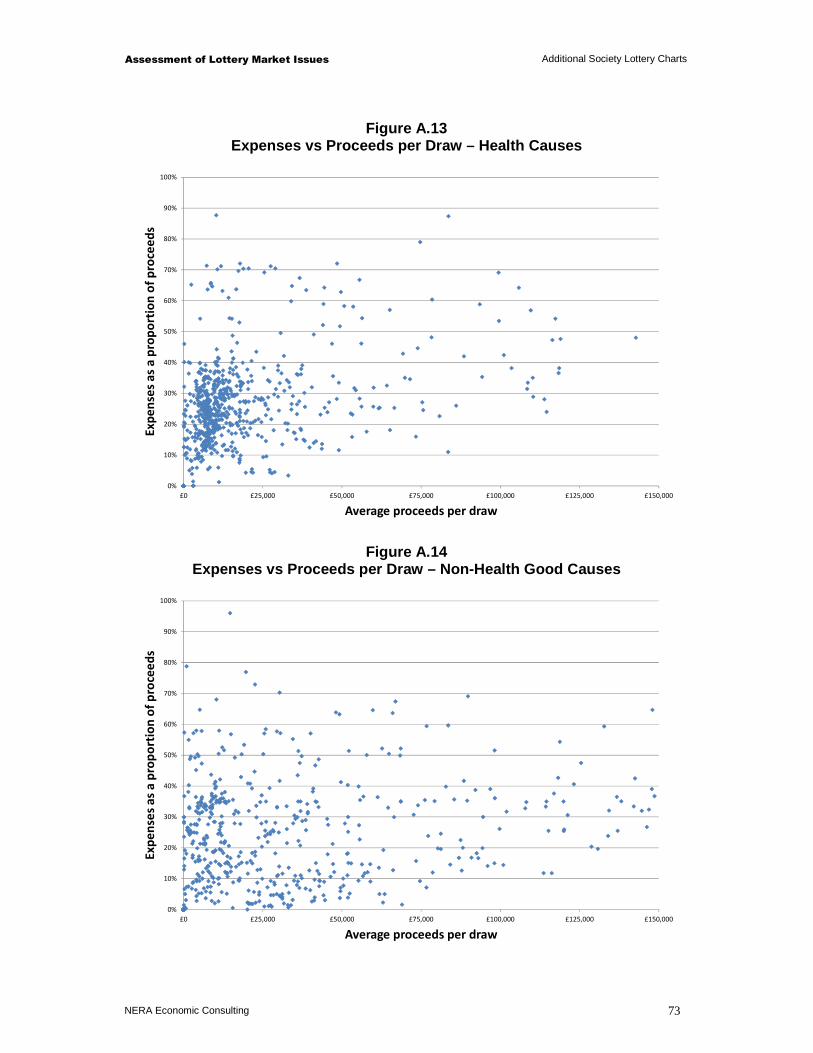
Assessment of Lottery Market Issues Additional Society Lottery Charts
NERA Economic Consulting 73
Figure A.13 Expenses vs Proceeds per Draw – Health Causes
0%
10%
20%
30%
40%
50%
60%
70%
80%
90%
100%
£0 £25,000 £50,000 £75,000 £100,000 £125,000 £150,000
Ex
pe
nse
s a
s a
pro
po
rtio
n o
f p
roce
ed
s
Average proceeds per draw
Figure A.14 Expenses vs Proceeds per Draw – Non-Health Good Cau ses
0%
10%
20%
30%
40%
50%
60%
70%
80%
90%
100%
£0 £25,000 £50,000 £75,000 £100,000 £125,000 £150,000
Ex
pe
nse
s a
s a
pro
po
rtio
n o
f p
roce
ed
s
Average proceeds per draw
Assessment of Lottery Market Issues References Cited in Literature Survey
NERA Economic Consulting 74
Appendix B. References Cited in Literature Survey
Apinunmahakul and Devlin (2004), “Charitable giving and charitable gambling: an empirical investigation”, National Tax Journal, Vol. LVII, No. 1, pp. 67-88
Cook and Clotfelter (1993), “The peculiar scale economies of lotto”, American Economic Review, Vol. 83, No.3, pp.634-643
Forrest, Gulley and Simmons (2004), “Substitution between games in the UK national lottery”, Applied Economics, Vol. 36, pp.645-651
Forrest and McHale (2007), “The relationship between a national and a multistate lotto game”, The Journal of Gambling Business and Economics, Vol. 1, No.3, pp. 207-216
Forrest, Simmons and Chester (2002), “Buying a dream: alternative models of demand for lotto”, Economic Inquiry, Vol. 40, pp. 485-496
Geronikolaou and Papachristou (2007), “On the demand for lotteries in Greece”, International Journal of Business and Economics, Vol. 6, pp. 255-259
Griffiths and Wood (1999), “Lottery gambling and addiction: an overview of European research”, Psychology Division, Nottingham Trent University
Grote and Matheson (2006), “Dueling jackpots: are competing lotto games complements or substitutes?”, Atlantic Economic Journal, Vol. 34, pp. 85-100
Grote and Matheson (2011), “The economics of lotteries: a survey of the literature”, College of the Holy Cross, Department of Economics, Faculty Research Series, Paper No. 11-09
Gulley and Scott (1993), “The demand for wagering on state-operated lotto games”, National Tax Journal, Vol. XLV, No. 1, pp. 13-22
Hassay and Peloza (2005), “FUNdraising: having fun while raising funds”, Advances in Consumer Research, Vol. 32
Humphreys and Perez (2010), “Network externalities in consumer spending on lottery games: evidence from Spain”, Empirical Economics, Online, December 2010
Jia (2011), “Are lotteries substitutes for each other?”, The Journal of Gambling Business and Economics, Vol. 5, No. 3, pp. 1-14
Knight and Schiff (2010), “Spatial competition and cross-border shopping: evidence from state lotteries”, NBER Working Paper Series, working paper 15713
Landry, Lange, List, Price and Rupp (2006), “Toward an understanding of the economics of charity: evidence from a field experiment”, The Quarterly Journal of Economics, Vol. 121, No. 2, pp. 747-782
Lin and Lai (2006), “Substitute effects between Lotto and Big Lotto in Taiwan”, Applied Economics Letters, Vol. 13, pp. 655-658
Assessment of Lottery Market Issues References Cited in Literature Survey
NERA Economic Consulting 75
Lin and Wu (2007), “Lottery expenses and charitable contributions – Taiwan’s experience”, Applied Economics, Vol. 39, pp. 2241-2251
Matheson and Grote (2007), “Gamblers’ love for variety and substitution among lotto games”, The Journal of Gambling Business and Economics, Vol. 1, No. 2, pp. 85-99
Mikesell and Zorn (1987), “State lottery sales: separating the influence of markets and game structure”, Growth and Change, Vol. 18, No. 4, pp. 10-19
Mizerski, Miller, Mizerski and Lam (2004), “The stochastic nature of purchasing a state’s lottery products”, Australasian Marketing Journal, Vol. 12, No. 3, pp. 56-69
Morgan and Sefton (2000), “Funding public goods with lotteries: experimental evidence”, Review of Economic Studies, Vol. 67, No. 4, pp. 785-810
NERA (2003), “A review of the lottery market: a final report for the National Lottery Commission”, 21 December 2003
Paola and Scoppa (2011), “Media exposure and individual choices: evidence from lotto players”, Università della Calabria, Dipartimento di Economia e Statistica, working paper no. 02-2011
Papachristou (2006), “Is lottery demand elasticity a reliable marketing tool? Evidence from a game innovation in Greece”, RISEC, Vol. 53, No. 4, pp. 627-640
Passey (2000), “Charity and lottery: the British experience”, The Philanthropist, Vol. 16, No. 1, pp. 33-41
Perez (2009), “The state of empirical research on the demand for lottery”, Departamento de Economía, Universidad de Oviedo, economic discussion paper EDP 01/2009
Perez and Forrest (2011), “Own- and cross-price elasticities for games within a state lottery portfolio”, Contemporary Economic Policy, Vol. 29, No. 4, pp. 536-549
Roger (2008), “The demand for Euromillions lottery tickets: an international comparison”, LaRGE working paper no. 2009-05
Stover (1990), “Contiguous state lotteries: substitutes or complements?”, Journal of Policy Analysis and Management, Vol. 9, No. 4, pp. 565-568
Tosun and Skidmore (2004), “Interstate competition and state lottery revenues”, National Tax Journal, Vol. LVII, No. 2, Part 1, pp. 163-178
Trousdale (2011), “Demand for lottery gambling: the use of a differential demand system to evaluate price sensitivity within a portfolio of lottery games”, Texas A&M University, working paper.

NERA Economic Consulting 15 Stratford Place London W1C 1BE United Kingdom Tel: +44 20 7659 8500 Fax: +44 20 7659 8501 www.nera.com
NERA UK Limited, registered in England and Wales, No 3974527 Registered Office: 15 Stratford Place, London W1C 1BE