assessment of macroinvertebrate communities in … stores/data libraries/files/watershe… ·...
TRANSCRIPT
Printed on recycled paper.
ASSESSMENT OF MACROINVERTEBRATE COMMUNITIES IN RELATION TO LAND USE, PHYSICAL HABITAT, AND WATER
QUALITY IN THE TUALATIN RIVER BASIN, OREGON
FINAL REPORT
Prepared for
Clean Water Services155 N. First Avenue, Suite 270Hillsboro, Oregon 97124-3072
Prepared by
Michael B. Cole, Ph.D.
ABR, Inc.—Environmental Research & ServicesP.O. Box 249
Forest Grove, Oregon 97116
April 2002

ABR Final Report i 2001 Tualatin Basin Macroinvertebrate Study
EXECUTIVE SUMMARY
• Macroinvertebrate communities, physicalhabitat, and water chemistry were sampledfrom 63 stream reaches in the Tualatin Riverbasin in fall 2001 to assess the condition ofmacroinvertebrate communities in relation toland use patterns and instreamphysicochemical conditions. Thirty sevenlow-gradient and 26 high-gradient reacheswere sampled.
• High-gradient reaches were assessed usingmultimetric analysis, followed by correlationof environmental variables with multimetricscores to examine the ability of this metric setto reflect the condition of high-gradientreaches in the basin in relation toenvironmental conditions. Relationshipsbetween environmental conditions and benthiccommunity structure in low-gradient reacheswere examined with multivariate patternanalysis and indirect gradient analysis, as wellas with a set of selected metrics that was usedto rank low-gradient reach conditions.
• Community composition differed considerablybetween high and low-gradient reaches.High-gradient reaches ranged widely in theircondition; major gradients in communitycondition were strongly related to land-usetypes and a number of instream environmentalvariables. High-gradient reaches occurringprimarily in forested catchments werecharacterized by high EPT (mayfly, stonefly,and caddisfly taxa) richness, low proportionsof tolerant organisms, high sensitive-taxarichness, low collective tolerance todisturbance, and high total taxonomic richness.These conditions ranged to the other extremein heavily urbanized areas, where taxonomicrichness was low, collective communitytolerance to disturbance was high, and EPTrichness was low. Metric values were highlycorrelated with a number of environmentalvariables indicative of impairment, indicatingthat the metric set employed is an effectiveassessment tool for use on macroinvertebratecommunity data from high-gradient reaches inthe Tualatin River basin.
• Low-gradient reaches showed much lessvariability in community composition. Thesereaches occurred exclusively in areasdominated by urban or agricultural land uses.Low-gradient reaches were characterized bylow taxonomic richness, few or no EPT taxa,high dominance by a few taxa, largeproportions of oligochates, chironomids, andmollusks, and a large proportion of tolerantorganisms. Multivariate analysis and indirectgradient analysis indicated that invertebratecommunity conditions in low-gradient reachesdid recognizably vary with land use andinstream physical conditions, particularlysubstrate, but also with dissolved oxygen, asthe overall community tolerance to impairmentincreased with decreases in the condition ofthese measured variables.
• Our data indicate that 2001 drought conditionsmay have further degraded macroinvertebratecommunities in more rural areas where, in2000, higher taxonomic richness and, inparticular, higher EPT taxonomic richnesswere measured.

2001 Tualatin Basin Macroinvertebrate Study ii ABR Final Report
TABLE OF CONTENTS
EXECUTIVE SUMMARY ............................................................................................................................ iLIST OF FIGURES ....................................................................................................................................... iiLIST OF TABLES........................................................................................................................................iiiLIST OF APPENDICES............................................................................................................................... ivACKNOWLEDGMENTS ............................................................................................................................ ivINTRODUCTION ......................................................................................................................................... 1STUDY AREA .............................................................................................................................................. 2METHODS.................................................................................................................................................... 2
STUDY REACH SELECTION.................................................................................................................. 2FIELD DATA COLLECTION ................................................................................................................... 2SAMPLE SORTING AND MACROINVERTEBRATE IDENTIFICATION.......................................... 6QUALITY ASSURANCE .......................................................................................................................... 8DATA ANALYSIS..................................................................................................................................... 8
PATTERN ANALYSIS OF ALL MACROINVERTEBRATE DATA .................................................. 8CHARACTERIZATION OF ENVIRONMENTAL CONDITIONS IN HIGH- AND LOW-
GRADIENT REACHES........................................................................................................................ 9ANALYSIS OF LOW-GRADIENT REACH MACROINVERTEBRATE DATA................................ 9ANALYSIS OF HIGH-GRADIENT REACH MACROINVERTEBRATE DATA............................. 10COMPARISON OF YEAR 2000 AND 2001 RESULTS...................................................................... 11
RESULTS.................................................................................................................................................... 11PATTERN ANALYSIS OF ALL MACROINVERTEBRATE DATA ................................................ 11CHARACTERIZATION OF ENVIRONMENTAL CONDITIONS IN HIGH AND LOW-
GRADIENT REACHES...................................................................................................................... 14ANALYSIS OF LOW-GRADIENT REACH MACROINVERTEBRATE DATA.............................. 15ANALYSIS OF HIGH-GRADIENT REACH MACROINVERTEBRATE DATA............................. 19COMPARISON OF YEAR 2000 AND 2001 RESULTS...................................................................... 24
DISCUSSION.............................................................................................................................................. 25LITERATURE CITED................................................................................................................................ 28
LIST OF FIGURES
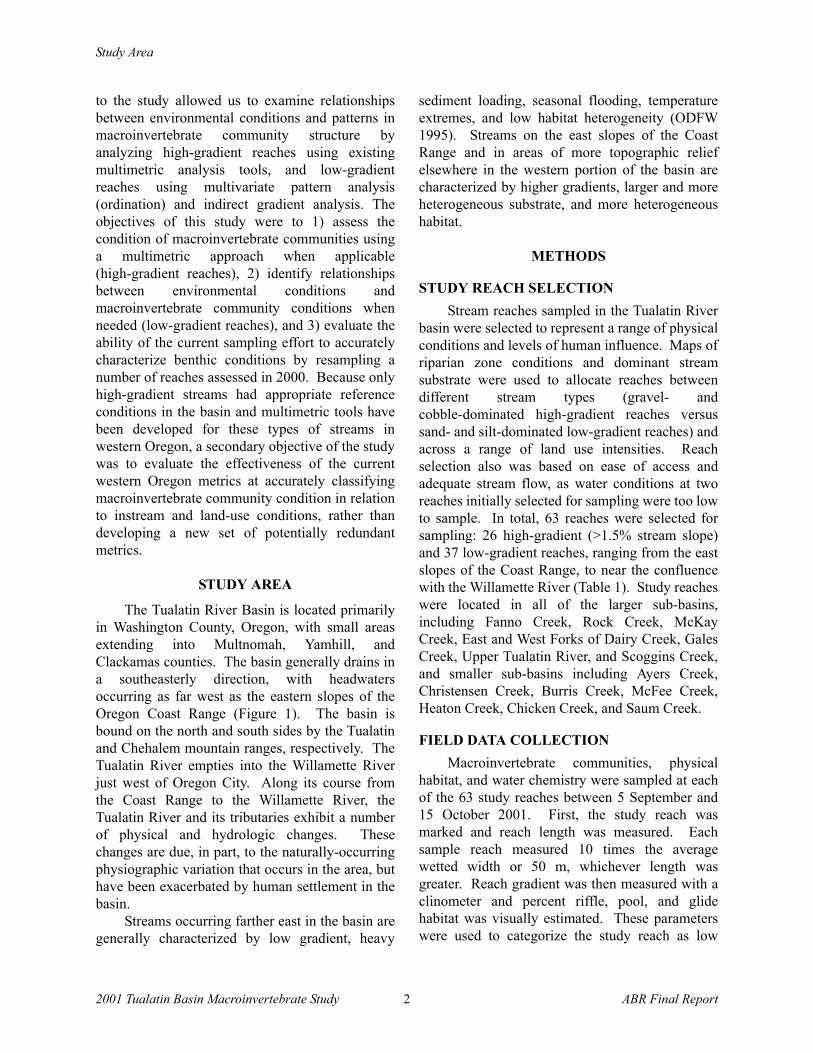
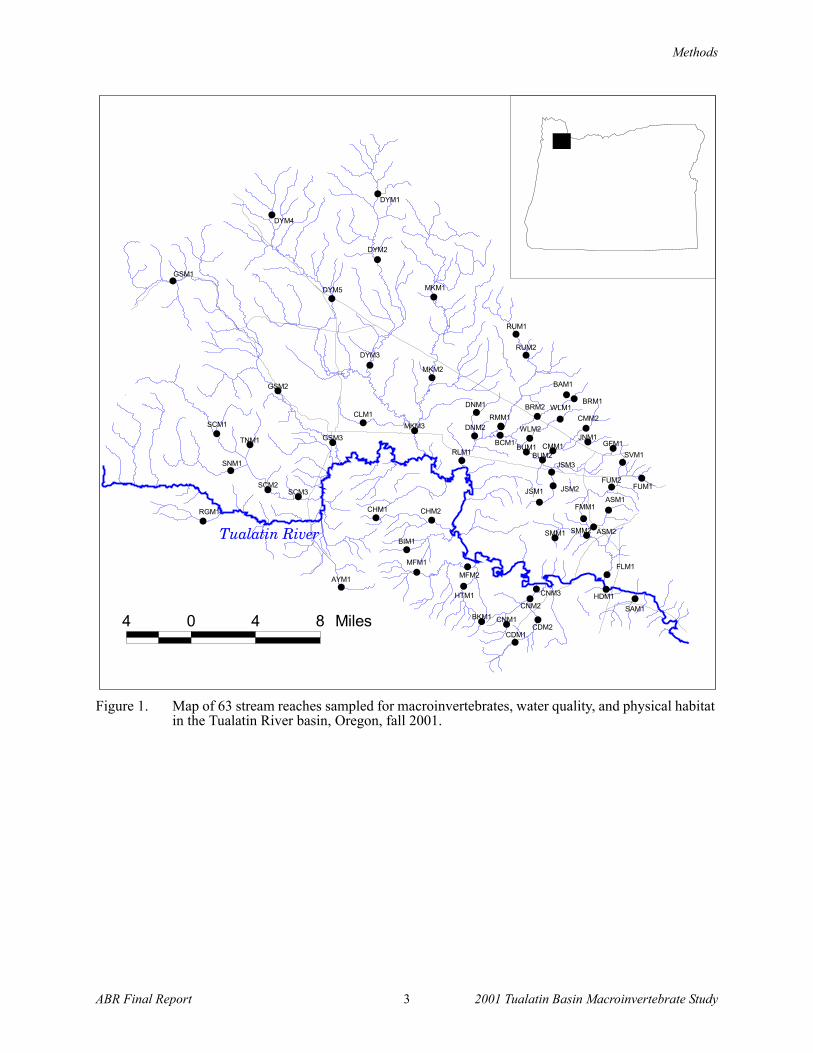
Figure 1. Map of 63 stream reaches sampled for macroinvertebrates, water quality, and physical habitat in the Tualatin River basin, Oregon, fall 2001. ............................................................ 3
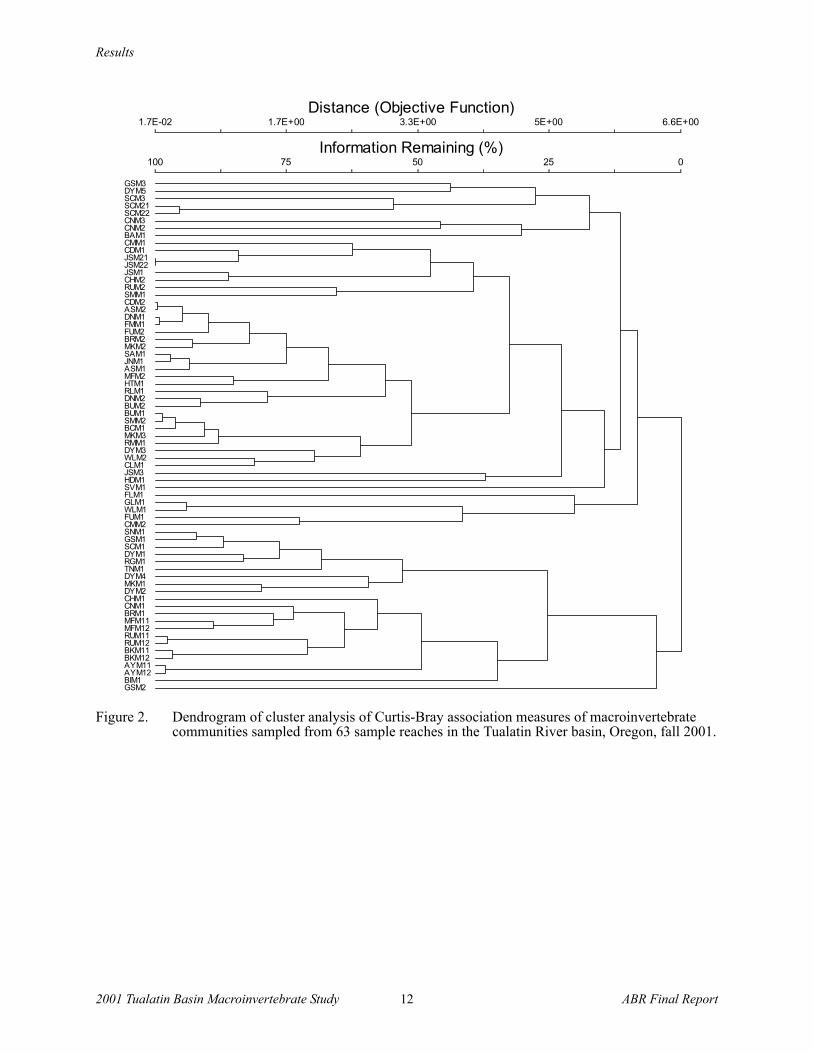
Figure 2. Dendrogram of cluster analysis of Curtis-Bray association measures of macroinvertebrate communities sampled from 63 sample reaches in the Tualatin River basin, Oregon, fall 2001. ....................................................................................................................................... 12
Figure 3. MS ordination biplot of macroinvertebrate samples collected from high- and low-gradient stream reaches in the Tualatin River basin, Oregon, fall 2001............................................... 13
Figure 4. Mean taxa richness and richness of mayflies, stoneflies and caddisflies in high- and low-gradient stream reaches sampled in the Tualatin River basin, Oregon, fall 2000 and fall 2001. ....................................................................................................................................... 13
Figure 5. NMS ordination biplots of macroinvertebrate samples collected from low-gradient stream reaches in the Tualatin River basin, Oregon, fall 2001. ......................................................... 17
Figure 6. Overlay of effective impervious area classes on NMS plot of macroinvertebrate communities sampled from 37 low-gradient stream reaches in the Tualatin River basin, Oregon, fall 2001. ................................................................................................................... 19
ABR Final Report iii 2001 Tualatin Basin Macroinvertebrate Study
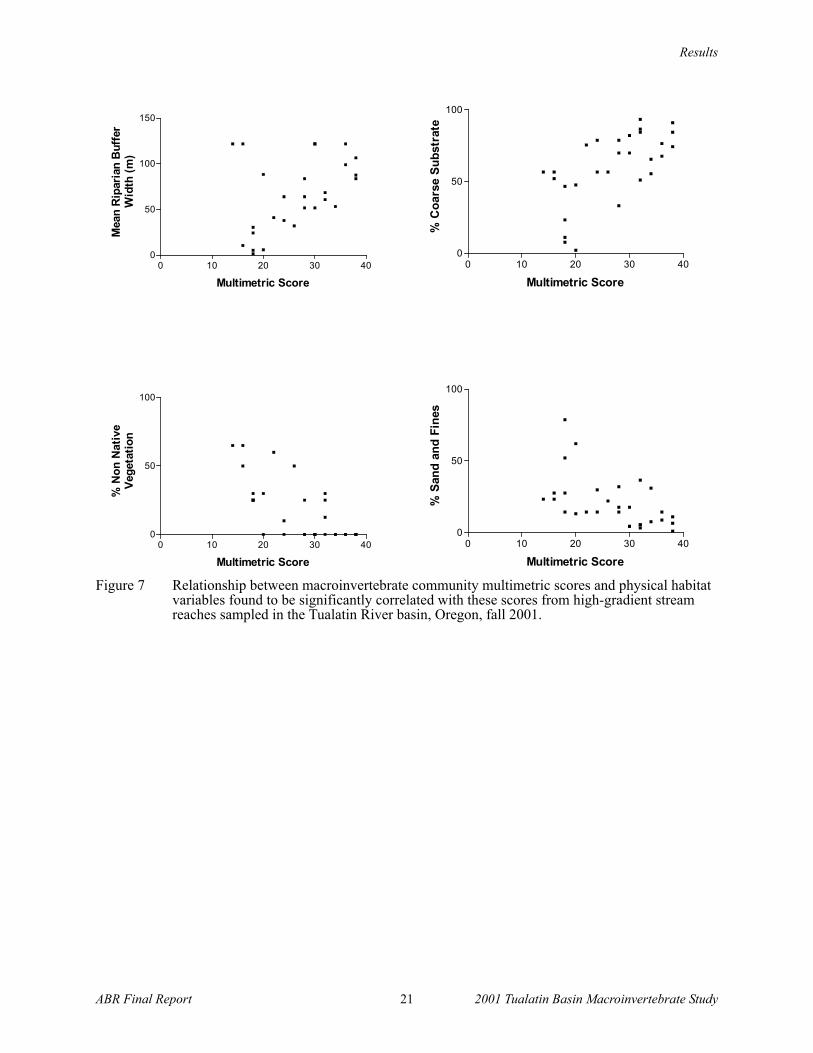
Figure 7. Relationship between macroinvertebrate community multimetric scores and physical habitat variables found to be significantly correlated with these scores from high-gradient stream reaches sampled in the Tualatin River basin, Oregon, fall 2001. ............................... 21
Figure 8. Relationship between macroinvertebrate community multimetric scores and water quality variables found to be significantly correlated with these scores from high-gradient stream reaches sampled in the Tualatin River basin, Oregon, fall 2001. ........................................... 22
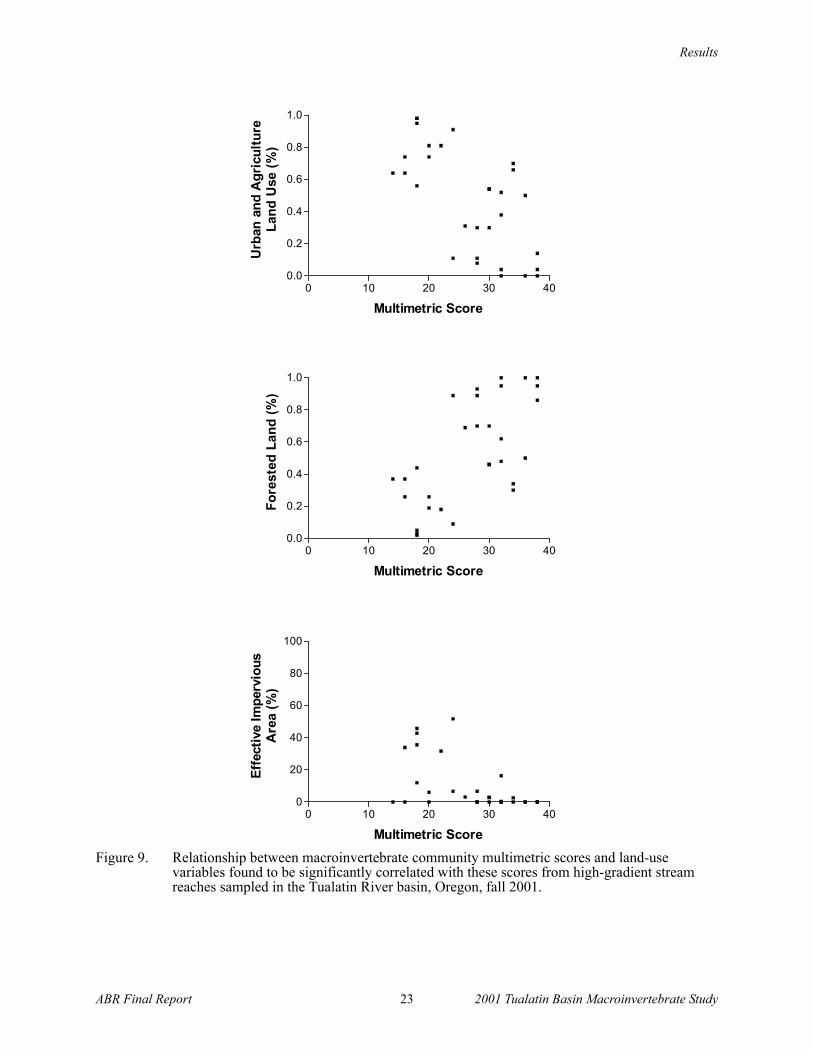
Figure 9. Relationship between macroinvertebrate community multimetric scores and land-use variables found to be significantly correlated with these scores from high-gradient stream reaches sampled in the Tualatin River basin, Oregon, fall 2001. ............................... 23
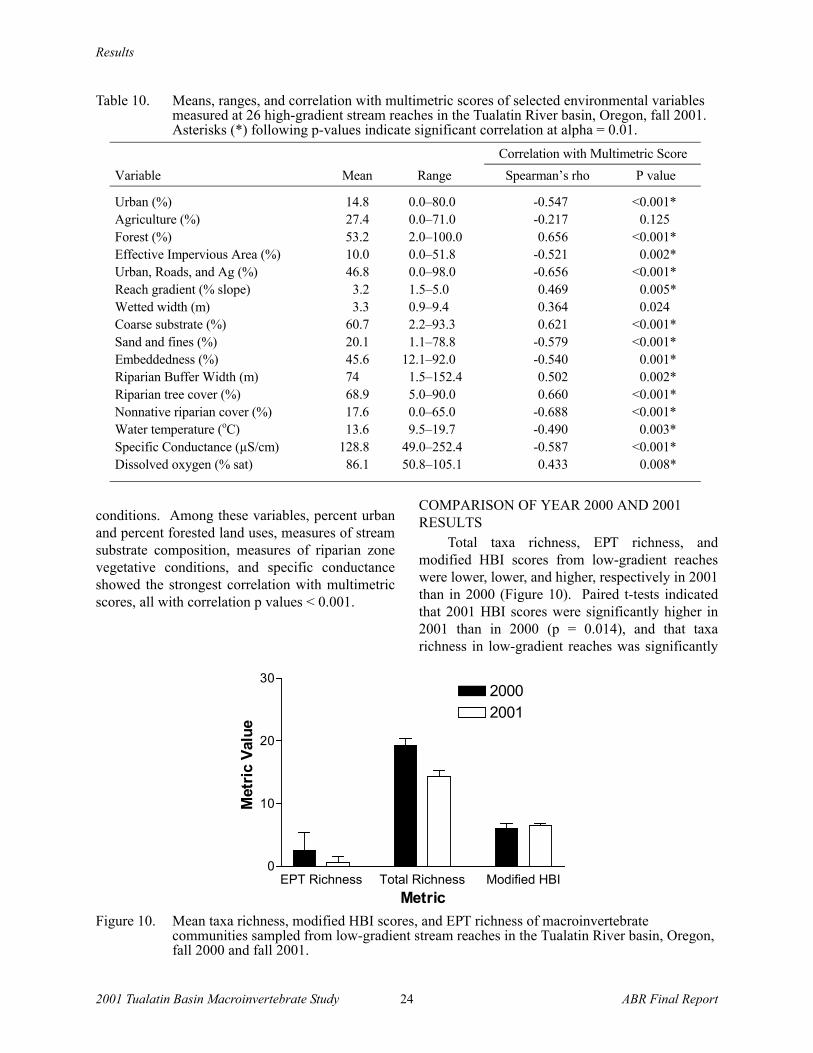
Figure 10. Mean taxa richness, modified HBI scores, and EPT richness of macroinvertebrate communities sampled from low-gradient stream reaches in the Tualatin River basin, Oregon, fall 2000 and fall 2001. ............................................................................................. 24
Figure 11. Location of high-gradient stream reaches sampled for macroinvertebrate community conditions in the Tualatin River basin, Oregon, fall 2001...................................................... 26
LIST OF TABLES
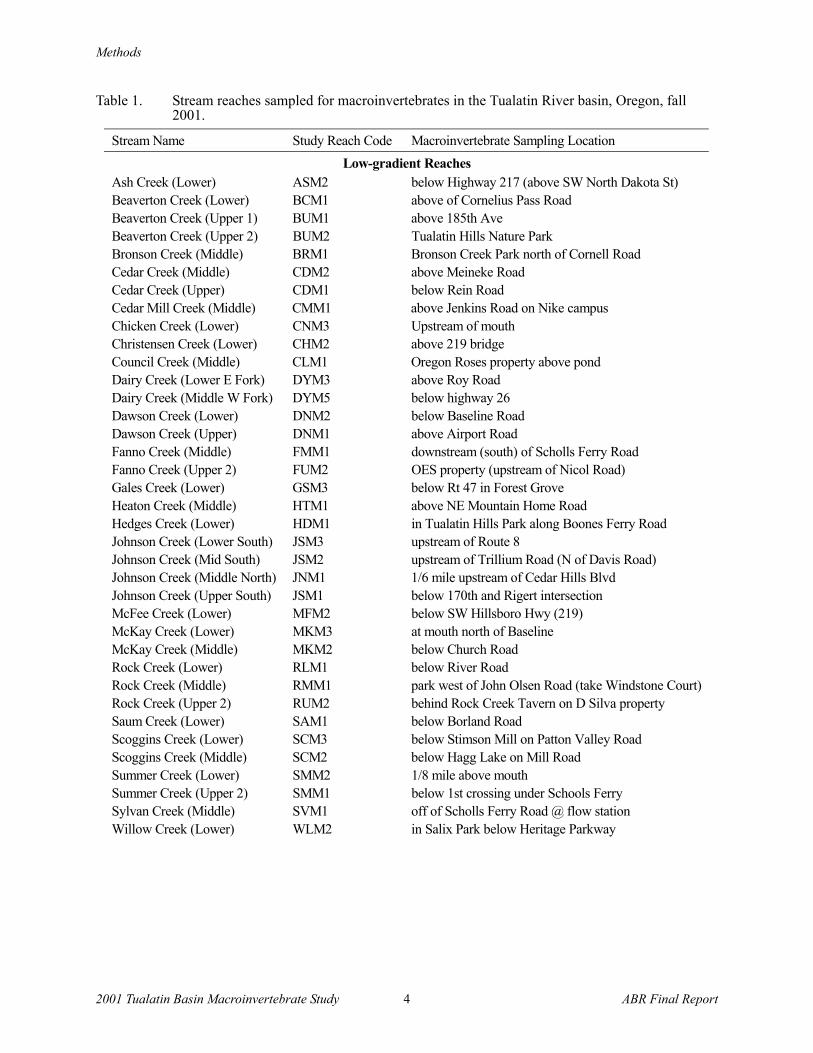
Table 1. Stream reaches sampled for macroinvertebrates in the Tualatin River basin, Oregon, fall 2001. ......................................................................................................................................... 4
Table 2. Environmental variables collected in the field and generated using geographical information systems for characterizing streams in the Tualatin River basin, Oregon, fall 2001. ......................................................................................................................................... 7
Table 3. Metric set and scoring criteria used to assess condition of macroinvertebrate communities in the Tualatin River basin, Oregon, fall 2001. ...................................................................... 10
Table 4. Multimetric score ranges for assignment of macroinvertebrate community condition levels. ...................................................................................................................................... 11
Table 5. Environmental conditions of low-gradient and high-gradient stream reaches in the Tualatin River basin, Oregon, fall 2001. ................................................................................ 14
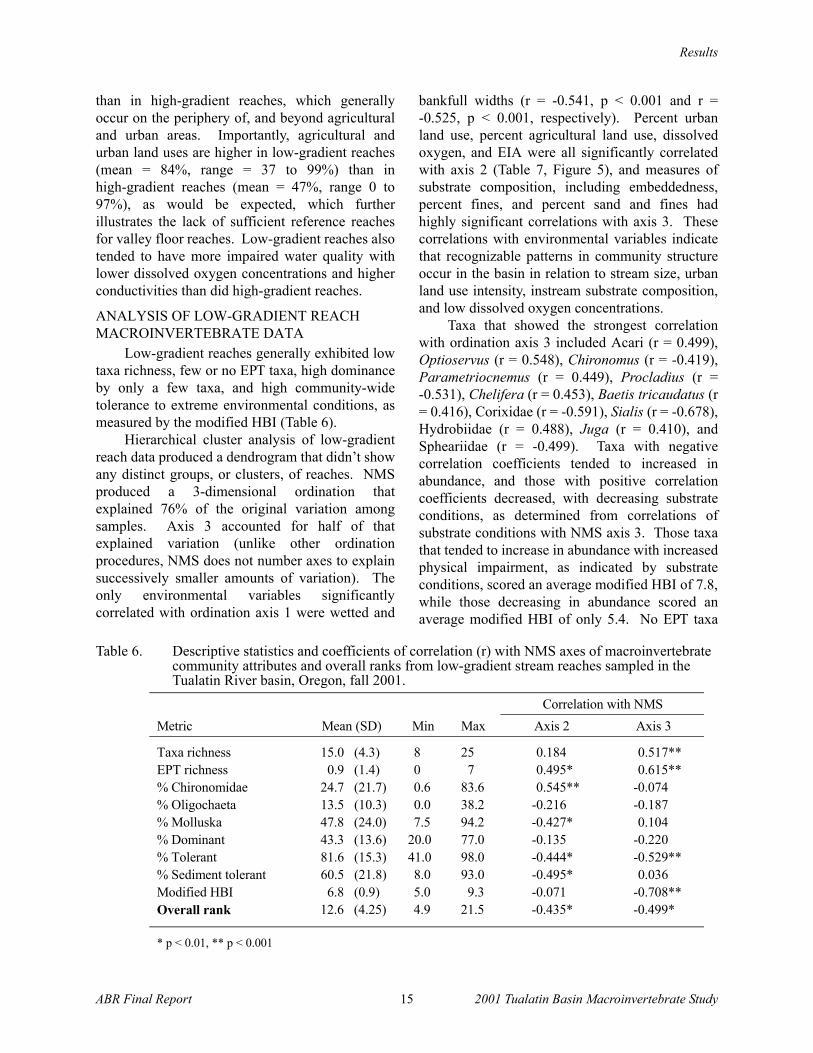
Table 6. Descriptive statistics and coefficients of correlation with NMS axes of macroinvertebrate community attributes and overall ranks from low-gradient stream reaches sampled in the Tualatin River basin, Oregon, fall 2001. ................................................................................ 15
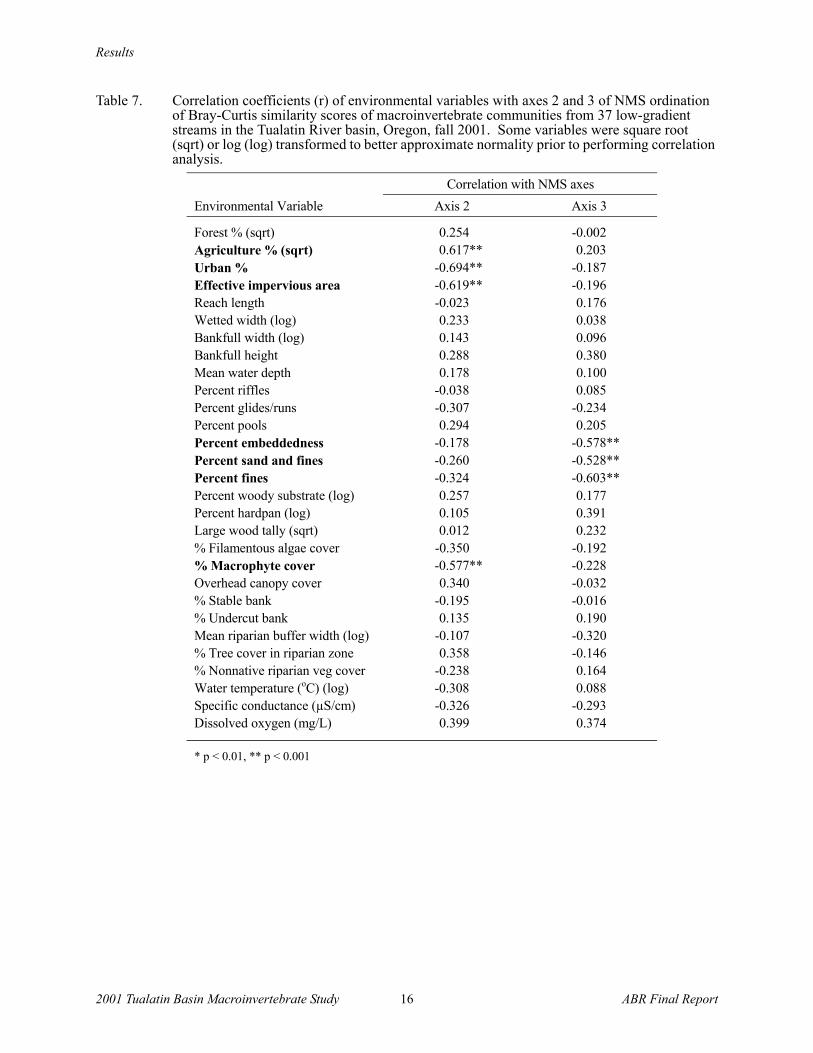
Table 7. Correlation coefficients of environmental variables with axes 2 and 3 of NMS ordination of Bray-Curtis similarity scores of macroinvertebrate communities from 37 low-gradient streams in the Tualatin River basin, Oregon, fall 2001 .......................................................... 16
Table 8. Mean ranks of metric scores of macroinvertebrate communities from 37 low-gradient stream reaches in the Tualatin River basin, Oregon, fall 2001............................................... 18
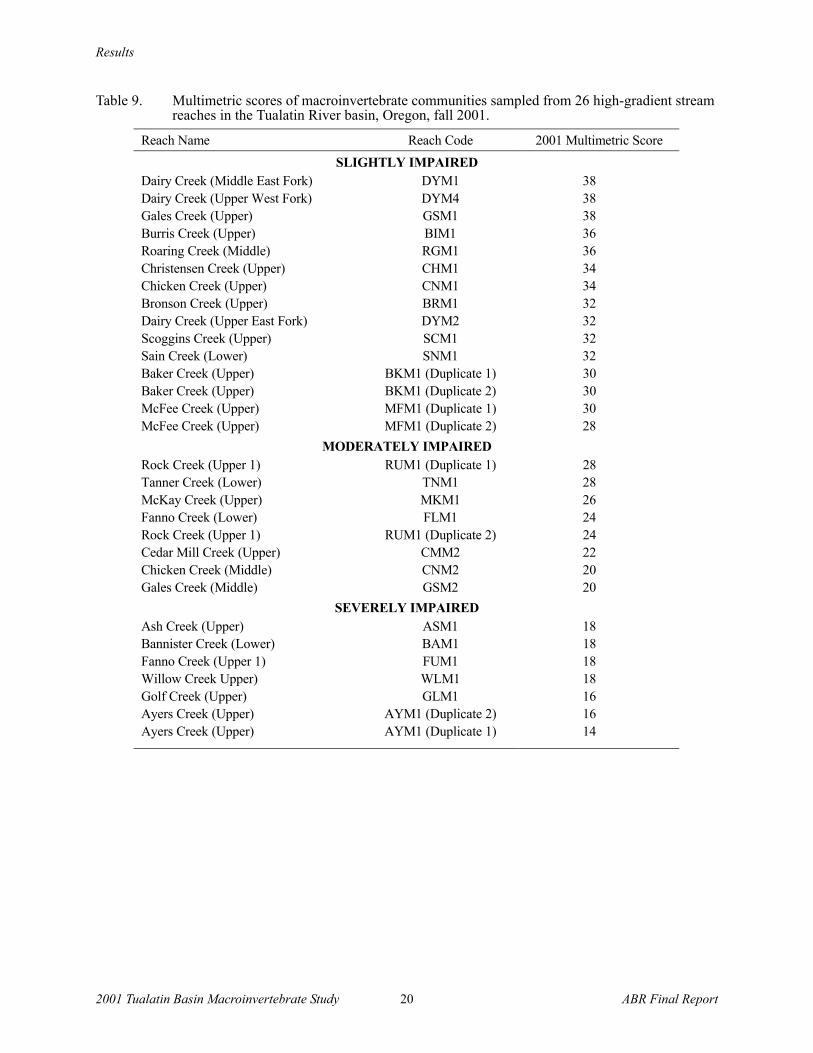
Table 9. Multimetric scores of macroinvertebrate communities sampled from 26 high-gradient stream reaches in the Tualatin River basin, Oregon, fall 2001............................................... 20
Table 10. Means, ranges, and correlation with multimetric scores of selected environmental variables measured at 26 high-gradient stream reaches in the Tualatin River basin, Oregon, fall 2001. ................................................................................................................................. 24

2001 Tualatin Basin Macroinvertebrate Study iv ABR Final Report
LIST OF APPENDICES
Appendix 1. Environmental variables measured at 37 low-gradient stream reaches in the Tualatin River basin, Oregon, fall 2001........................................................................................ 31
Appendix 2. Metrics calculated from macroinvertebrate communities sampled from 37 low- gradient stream reaches in the Tualatin River basin, Oregon, fall 2001......................... 37
Appendix 3. Metrics calculated from macroinvertebrate communities from 26 high-gradient stream reaches in the Tualatin River basin, Oregon, fall 2001. ...................................... 38
ACKNOWLEDGMENTS
This study was funded by Clean Water Services, Inc. We thank all of the Tualatin River basinproperty owners who kindly allowed us on their property to gain access to study reaches. Alex Gonyawand Justin Strom of ABR, Inc. provided field assistance and sorted macroinvertebrate samples in thelaboratory. Jill Ory of Clean Water Services and Rich Blaha of ABR, Inc. provided GIS support. BrianCooper, Steve Murphy, and Bob Burgess of ABR, Inc. reviewed the report.
Introduction
ABR Final Report 1 2001 Tualatin Basin Macroinvertebrate Study
INTRODUCTION
The Tualatin River basin has undergonesteady agricultural, forestry, industrial, and urbandevelopment for more than 100 years. Thissteadily increasing human influence on the basinhas degraded water quality and physical habitat ofsurface waters, and has altered the hydrology of thebasin. Concerns over the effects of these changeson aquatic life have led to basin-wide assessmentsof fish and macroinvertebrate communities inrecent years (Friesen and Ward 1996, Cole 2000,Leader 2001).
In September 2000, Clean Water Servicesinitiated a large-scale assessment ofmacroinvertebrate communities in the upper andmiddle Tualatin River Basin to characterize thecondition of benthic biological communities. Theresulting study ranked the biological condition ofeach of 44 stream reaches and provided a baselinedata set for these conditions throughout much ofthe basin (Cole 2000). While providing valuableinformation, the study was limited by a lack ofanalytical tools and environmental data that couldallow low-gradient, glide-dominated streams to beevaluated independently of high-gradient,riffle-dominated streams. Consequently, allstreams were ranked in relation to one anotherwithout regard to the physical characteristics of thestream reach or its surrounding landscape.
Macroinvertebrate communities are stronglyinfluenced by physical differences among habitats,both naturally occurring and human-induced.Characterizing these relationships betweenenvironmental factors and invertebratecommunities is essential to understanding howaquatic communities in a particular geographicarea are structured by the physical and chemicalmakeup of their environment and how they areaffected by alterations to those conditions. Theinclusion of habitat variables in amacroinvertebrate assessment allows theserelationships to be explored and allowscomparisons of biological conditions among sitesto be made with consideration to gradient and othernatural physical features that shape benthiccommunity structure. In recent years, a number ofstudies have used ordination and correlation toexamine such relationships (Reece and Richardson2000, Marchant et al. 1999, Turak et al. 1999, Tate
and Heiny 1995), including recent work by OregonState University in the Willamette basin.
The current lack of analytical tools to evaluatethe condition of macroinvertebrate communities inlow-gradient, Tualatin valley floor streams isprimarily the result of a lack of relativelyundisturbed reference conditions against whichother, more impaired reaches can be compared. Incontrast to these low-gradient, valley floor streams,higher gradient streams still occur in relativelyundisturbed, mature second-growth forests on thefringes of the Tualatin River basin, and elsewherethroughout the Willamette valley and westernOregon. Consequently, both multimetric andmultivariate tools have been developed for analysisof these higher gradient streams.
Both multimetric and multivariate approachesevaluate the sampled community by comparingobserved conditions to what conditions or taxa areexpected to occur in the absence of disturbance.Multimetric analysis uses a set of metrics, orcommunity attributes, that are known to beresponsive to stream degradation (Karr and Chu1999). Each of these metrics is calculated from thesample data and then converted to a standardizedscore using scoring criteria. Scoring criteria aredeveloped from examining relationships betweenindividual metric scores and an indicator ofimpairment (e.g., effective impervious area) acrossa range of impairment levels, includingundisturbed reference conditions. Thestandardized scores are then added to produce thefinal multimetric score. Multivariate analysis usesmultivariate statistics and reference condition datato produce models that predict what taxa shouldoccur at a site of a given stream type and locationin the absence of impairment. The observed taxalist is then compared to what is expected to occurin the absence of disturbance to produce anobserved/expected (O/E) score. Both of these toolsrequire appropriate reference reaches for properdevelopment and application (e.g, Hawkins et al.2000).
In fall 2001, we conducted an expanded studyof macroinvertebrate communities in the TualatinRiver basin. In contrast to the work conducted in2000, this study examined high-gradient (>1.5%stream slope) and low-gradient (<1.5% streamslope) stream reaches independently and includedphysical habitat assessments. These enhancements
Study Area
2001 Tualatin Basin Macroinvertebrate Study 2 ABR Final Report
to the study allowed us to examine relationshipsbetween environmental conditions and patterns inmacroinvertebrate community structure byanalyzing high-gradient reaches using existingmultimetric analysis tools, and low-gradientreaches using multivariate pattern analysis(ordination) and indirect gradient analysis. Theobjectives of this study were to 1) assess thecondition of macroinvertebrate communities usinga multimetric approach when applicable(high-gradient reaches), 2) identify relationshipsbetween environmental conditions andmacroinvertebrate community conditions whenneeded (low-gradient reaches), and 3) evaluate theability of the current sampling effort to accuratelycharacterize benthic conditions by resampling anumber of reaches assessed in 2000. Because onlyhigh-gradient streams had appropriate referenceconditions in the basin and multimetric tools havebeen developed for these types of streams inwestern Oregon, a secondary objective of the studywas to evaluate the effectiveness of the currentwestern Oregon metrics at accurately classifyingmacroinvertebrate community condition in relationto instream and land-use conditions, rather thandeveloping a new set of potentially redundantmetrics.
STUDY AREA
The Tualatin River Basin is located primarilyin Washington County, Oregon, with small areasextending into Multnomah, Yamhill, andClackamas counties. The basin generally drains ina southeasterly direction, with headwatersoccurring as far west as the eastern slopes of theOregon Coast Range (Figure 1). The basin isbound on the north and south sides by the Tualatinand Chehalem mountain ranges, respectively. TheTualatin River empties into the Willamette Riverjust west of Oregon City. Along its course fromthe Coast Range to the Willamette River, theTualatin River and its tributaries exhibit a numberof physical and hydrologic changes. Thesechanges are due, in part, to the naturally-occurringphysiographic variation that occurs in the area, buthave been exacerbated by human settlement in thebasin.
Streams occurring farther east in the basin aregenerally characterized by low gradient, heavy
sediment loading, seasonal flooding, temperatureextremes, and low habitat heterogeneity (ODFW1995). Streams on the east slopes of the CoastRange and in areas of more topographic reliefelsewhere in the western portion of the basin arecharacterized by higher gradients, larger and moreheterogeneous substrate, and more heterogeneoushabitat.
METHODS
STUDY REACH SELECTIONStream reaches sampled in the Tualatin River
basin were selected to represent a range of physicalconditions and levels of human influence. Maps ofriparian zone conditions and dominant streamsubstrate were used to allocate reaches betweendifferent stream types (gravel- andcobble-dominated high-gradient reaches versussand- and silt-dominated low-gradient reaches) andacross a range of land use intensities. Reachselection also was based on ease of access andadequate stream flow, as water conditions at tworeaches initially selected for sampling were too lowto sample. In total, 63 reaches were selected forsampling: 26 high-gradient (>1.5% stream slope)and 37 low-gradient reaches, ranging from the eastslopes of the Coast Range, to near the confluencewith the Willamette River (Table 1). Study reacheswere located in all of the larger sub-basins,including Fanno Creek, Rock Creek, McKayCreek, East and West Forks of Dairy Creek, GalesCreek, Upper Tualatin River, and Scoggins Creek,and smaller sub-basins including Ayers Creek,Christensen Creek, Burris Creek, McFee Creek,Heaton Creek, Chicken Creek, and Saum Creek.
FIELD DATA COLLECTIONMacroinvertebrate communities, physical
habitat, and water chemistry were sampled at eachof the 63 study reaches between 5 September and15 October 2001. First, the study reach wasmarked and reach length was measured. Eachsample reach measured 10 times the averagewetted width or 50 m, whichever length wasgreater. Reach gradient was then measured with aclinometer and percent riffle, pool, and glidehabitat was visually estimated. These parameterswere used to categorize the study reach as low
Methods
ABR Final Report 3 2001 Tualatin Basin Macroinvertebrate Study
Figure 1. Map of 63 stream reaches sampled for macroinvertebrates, water quality, and physical habitat in the Tualatin River basin, Oregon, fall 2001.
�
�
��
�
�
�
�
�
�
�
��
�
�
�
��
�
�
�
�
�
�
�
��
�
�
�
�
�
�
�� ��
� �
�
�
�
��
�
�
�
�
��
�
�
�
�
�
�
�
�
�
�
�
�
�
�
����
����
������
���
����
����
���
����
��� ����
��� ���� ���
����
��
���
���� ����
���
����
���
���
����
����
����
��� ����
����
����
����
����
����
�������
���
���
��� ���
����
����
���
������
���
����
���
���
��� ����
����
����
����
���
��
����
��������
���
����
���
�������
������������
� � � � �����
Methods
2001 Tualatin Basin Macroinvertebrate Study 4 ABR Final Report
Table 1. Stream reaches sampled for macroinvertebrates in the Tualatin River basin, Oregon, fall 2001.
Stream Name Study Reach Code Macroinvertebrate Sampling Location Low-gradient Reaches
Ash Creek (Lower) ASM2 below Highway 217 (above SW North Dakota St) Beaverton Creek (Lower) BCM1 above of Cornelius Pass Road Beaverton Creek (Upper 1) BUM1 above 185th Ave Beaverton Creek (Upper 2) BUM2 Tualatin Hills Nature Park Bronson Creek (Middle) BRM1 Bronson Creek Park north of Cornell Road Cedar Creek (Middle) CDM2 above Meineke Road Cedar Creek (Upper) CDM1 below Rein Road Cedar Mill Creek (Middle) CMM1 above Jenkins Road on Nike campus Chicken Creek (Lower) CNM3 Upstream of mouth Christensen Creek (Lower) CHM2 above 219 bridge Council Creek (Middle) CLM1 Oregon Roses property above pond Dairy Creek (Lower E Fork) DYM3 above Roy Road Dairy Creek (Middle W Fork) DYM5 below highway 26 Dawson Creek (Lower) DNM2 below Baseline Road Dawson Creek (Upper) DNM1 above Airport Road Fanno Creek (Middle) FMM1 downstream (south) of Scholls Ferry Road Fanno Creek (Upper 2) FUM2 OES property (upstream of Nicol Road) Gales Creek (Lower) GSM3 below Rt 47 in Forest Grove Heaton Creek (Middle) HTM1 above NE Mountain Home Road Hedges Creek (Lower) HDM1 in Tualatin Hills Park along Boones Ferry Road Johnson Creek (Lower South) JSM3 upstream of Route 8 Johnson Creek (Mid South) JSM2 upstream of Trillium Road (N of Davis Road) Johnson Creek (Middle North) JNM1 1/6 mile upstream of Cedar Hills Blvd Johnson Creek (Upper South) JSM1 below 170th and Rigert intersection McFee Creek (Lower) MFM2 below SW Hillsboro Hwy (219) McKay Creek (Lower) MKM3 at mouth north of Baseline McKay Creek (Middle) MKM2 below Church Road Rock Creek (Lower) RLM1 below River Road Rock Creek (Middle) RMM1 park west of John Olsen Road (take Windstone Court) Rock Creek (Upper 2) RUM2 behind Rock Creek Tavern on D Silva property Saum Creek (Lower) SAM1 below Borland Road Scoggins Creek (Lower) SCM3 below Stimson Mill on Patton Valley Road Scoggins Creek (Middle) SCM2 below Hagg Lake on Mill Road Summer Creek (Lower) SMM2 1/8 mile above mouth Summer Creek (Upper 2) SMM1 below 1st crossing under Schools Ferry Sylvan Creek (Middle) SVM1 off of Scholls Ferry Road @ flow station Willow Creek (Lower) WLM2 in Salix Park below Heritage Parkway

Methods
ABR Final Report 5 2001 Tualatin Basin Macroinvertebrate Study
gradient or high gradient. Generally, reaches withgradients exceeding 1.5% contained coarse (gravel,cobble, and boulder) substrate that allowed rifflesto occur at a frequency sufficient to sample fromthem (>10–15% total habitat area). Glides weresampled from reaches that had gradients lower than1.5% and no, or infrequent (<10% total habitatarea), riffles, and predominantly sand and finersubstrates.
Macroinvertebrates were collected using theLevel 3 sampling protocols, as described in WQIW(1999). At each of the 63 study reaches, two unitsof the same habitat type (riffles or glides, asdescribed above) were selected for sampling.From each of these two units, two instreamsampling points were selected using a randomnumbers table. Two four-digit numbers wereselected: the first two digits represented thepercent distance upstream through the unit and the
second two digits represented the percent of streamwidth across the unit. In reaches with only onecontinuous unit (most often glides in low-gradientreaches), four instream sampling points wereselected from within this single habitat unit.
Macroinvertebrates were collected with aD-frame kicknet (12-in wide, 500-µm meshopening) from a 30 x 60 cm (1 x 2 ft) area at eachof these sampling points. A 1 x 2 ft metal framewith sheet-metal sides and open front and rear endswas placed over each sample point to contain thesample material and prevent organisms and debrisfrom escaping outside the net. Larger substrates,when present, were first hand-washed inside thenet, and then placed outside of the sampled area.The area was then thoroughly disturbed by hand(or by foot in deeper water) to a depth of ~5 cm. Inareas with little or no discernible streamflow, thekicknet was pulled back and forth through the
Table 1. (Continued).Stream Name Study Reach Code Macroinvertebrate Sampling Location
High-gradient Reaches Ash Creek (Upper) ASM1 above Taylors Ferry Road Ayers Creek (Upper) AYM1 above 1st Road Xing along Dopp Road Baker Creek (Upper) BKM1 above Kruger Road Bannister Creek (Lower) BAM1 Above Laidlaw Rd above confluence with Bronson Bronson Creek (Upper) BRM1 above Saltzman Burris Creek (Upper) BIM2 above falls upstream of SW Stickney Road Cedar Mill Creek (Upper) CMM2 upstream of 113th Street Chicken Creek (Middle) CNM2 below Edy Road Chicken Creek (Upper) CNM1 above Kruger Road Christensen Creek (Upper) CHM1 above Dixon Mill Road (above pond) Dairy Creek (Middle E Fork) DYM2 1/2 mile below Meachum Road Dairy Creek (Upper E Fork) DYM1 Little Bend Park Dairy Creek (Upper W Fork) DYM4 above 1st Nehalem Highway road crossing N of 26 Fanno Creek (Lower) FLM1 Durham City Park below bridge Fanno Creek (Upper 1) FUM1 below 39th Street Gales Creek (Middle) GSM2 at access site off of Gales Creek Road Gales Creek (Upper) GSM1 below Gales Creek Campground Golf Creek (Upper) GLM1 below Barnes Road Xing McFee Creek (Upper) MFM1 above Finnigan Hill Road McKay Creek (Upper) MKM1 below Northrup Road crossing Roaring Creek (Middle) RGM1 along Roaring Creek Road Rock Creek (Upper 1) RUM1 along Rock Creek Road Sain Creek (Lower)) SNM1 above Henry Hagg Lake Scoggins Creek (Upper) SCM1 below confluence with Parsons Creek Tanner Creek (Lower) TNM1 above Scoggins Valley Road Xing Willow Creek Upper) WLM1 below 143rd Ave
Methods
2001 Tualatin Basin Macroinvertebrate Study 6 ABR Final Report
water column over the disturbed area to collectsuspended materials.
The four samples from a reach were placedtogether into a 500-µm sieve and carefully washedto remove larger substrate and leaves afterinspection for clinging macroinvertebrates. Thecomposite sample was then placed into one ormore 1-L polyethylene wide-mouth jars, labeled,and preserved with 70% isopropyl alcohol for latersorting and identification at the laboratory.
Following macroinvertebrate samplecollection at each reach, we collected the followingwater chemistry data: pH, temperature, dissolvedoxygen, and specific conductance. Temperature,dissolved oxygen, and conductivity were measuredin the field using a YSI Model 85 water chemistrymeter. We measured pH in the field with anOakton pHTestr 3.
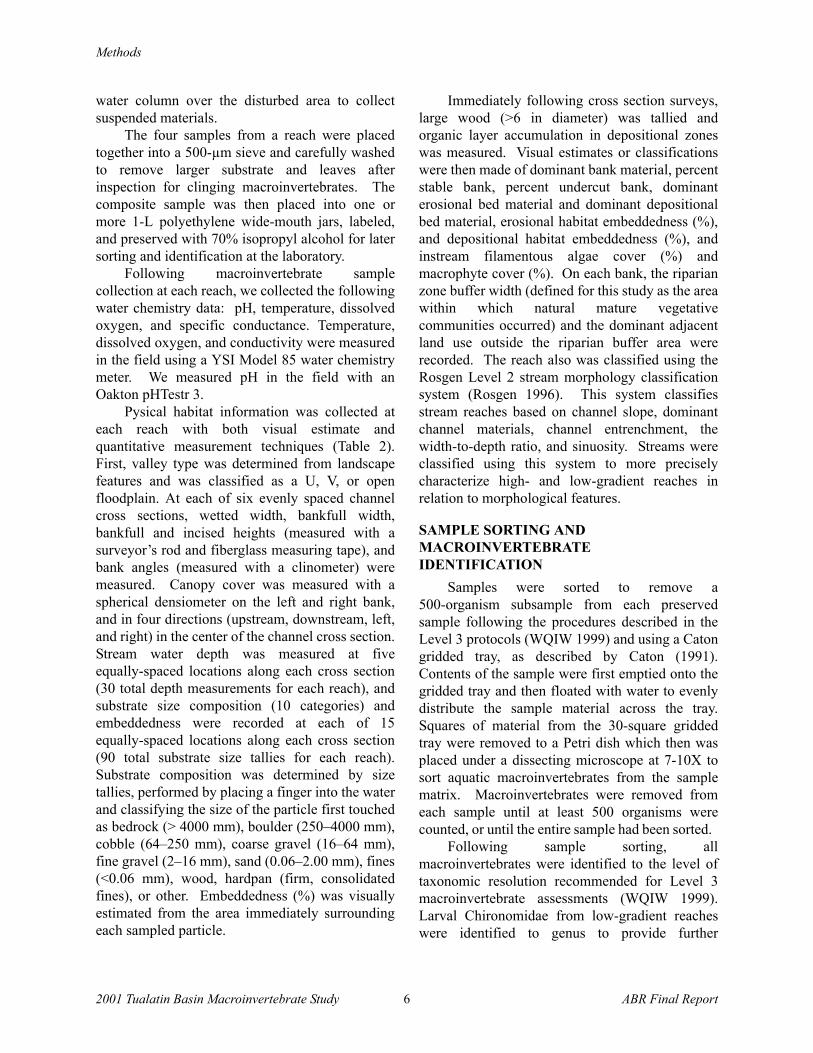
Pysical habitat information was collected ateach reach with both visual estimate andquantitative measurement techniques (Table 2).First, valley type was determined from landscapefeatures and was classified as a U, V, or openfloodplain. At each of six evenly spaced channelcross sections, wetted width, bankfull width,bankfull and incised heights (measured with asurveyor’s rod and fiberglass measuring tape), andbank angles (measured with a clinometer) weremeasured. Canopy cover was measured with aspherical densiometer on the left and right bank,and in four directions (upstream, downstream, left,and right) in the center of the channel cross section.Stream water depth was measured at fiveequally-spaced locations along each cross section(30 total depth measurements for each reach), andsubstrate size composition (10 categories) andembeddedness were recorded at each of 15equally-spaced locations along each cross section(90 total substrate size tallies for each reach).Substrate composition was determined by sizetallies, performed by placing a finger into the waterand classifying the size of the particle first touchedas bedrock (> 4000 mm), boulder (250–4000 mm),cobble (64–250 mm), coarse gravel (16–64 mm),fine gravel (2–16 mm), sand (0.06–2.00 mm), fines(<0.06 mm), wood, hardpan (firm, consolidatedfines), or other. Embeddedness (%) was visuallyestimated from the area immediately surroundingeach sampled particle.
Immediately following cross section surveys,large wood (>6 in diameter) was tallied andorganic layer accumulation in depositional zoneswas measured. Visual estimates or classificationswere then made of dominant bank material, percentstable bank, percent undercut bank, dominanterosional bed material and dominant depositionalbed material, erosional habitat embeddedness (%),and depositional habitat embeddedness (%), andinstream filamentous algae cover (%) andmacrophyte cover (%). On each bank, the riparianzone buffer width (defined for this study as the areawithin which natural mature vegetativecommunities occurred) and the dominant adjacentland use outside the riparian buffer area wererecorded. The reach also was classified using theRosgen Level 2 stream morphology classificationsystem (Rosgen 1996). This system classifiesstream reaches based on channel slope, dominantchannel materials, channel entrenchment, thewidth-to-depth ratio, and sinuosity. Streams wereclassified using this system to more preciselycharacterize high- and low-gradient reaches inrelation to morphological features.
SAMPLE SORTING AND MACROINVERTEBRATE IDENTIFICATION
Samples were sorted to remove a500-organism subsample from each preservedsample following the procedures described in theLevel 3 protocols (WQIW 1999) and using a Catongridded tray, as described by Caton (1991).Contents of the sample were first emptied onto thegridded tray and then floated with water to evenlydistribute the sample material across the tray.Squares of material from the 30-square griddedtray were removed to a Petri dish which then wasplaced under a dissecting microscope at 7-10X tosort aquatic macroinvertebrates from the samplematrix. Macroinvertebrates were removed fromeach sample until at least 500 organisms werecounted, or until the entire sample had been sorted.
Following sample sorting, allmacroinvertebrates were identified to the level oftaxonomic resolution recommended for Level 3macroinvertebrate assessments (WQIW 1999).Larval Chironomidae from low-gradient reacheswere identified to genus to provide further

Methods
ABR Final Report 7 2001 Tualatin Basin Macroinvertebrate Study
Table 2. Environmental variables collected in the field and generated using geographical information systems (GIS) for characterizing streams in the Tualatin River basin, Oregon, fall 2001.
Variable
Quantitative or Categorical
Data Source (GIS or Field)
Visual Estimate or Measured Variable
Forest (%) Q G M Agriculture (%) Q G M Urban (%) Q G M Roads (%) Q G M Effective impervious area (EIA) Q G M Reach length Q F M Valley type C F V Channel type C F M Reach gradient (%) Q F M Wetted width Q F M Bankfull width Q F M Bankfull height Q F M Mean water depth Q F M Discharge Q F M Percent riffles Q F V Percent glides/runs Q F V Percent pools Q F V Dominant eros material C F V Dominant dep material C F V Substrate composition Q F M Percent embeddedness Q F M Large wood tally Q F M Organic layer accumulation Q F V % Filamentous algae cover Q F V % Macrophyte cover Q F V Overhead canopy cover Q F M Dominant bank material C F V % Stable bank Q F V % Undercut bank Q F V Mean riparian buffer width Q F V % Tree cover in riparian zone Q F V % Nonnative riparian veg cover Q F V Dom adjacent land use C F V Water temperature (oC) Q F M pH Q F M Specific conductance (µS/cm) Q F M Dissolved oxygen (mg/L) Q F M
Methods
2001 Tualatin Basin Macroinvertebrate Study 8 ABR Final Report
characterization of aquatic macroinvertebratecommunities in those reaches. Aquatic insectswere keyed using Merritt and Cummins (1996) anda number of regional and taxa-specific keys.Chironomidae were identified to genus usingWeiderholm (1983). Other invertebrates werekeyed using Pennak (1989).
QUALITY ASSURANCEFollowing Level 3 protocols (WQIW 1999),
we collected duplicate composite samples at 10%of the sampled reaches in the field (six samples).Duplicate samples were compared to assesswithin-site sample variability. Additionally, avoucher collection of all macroinvertebrate taxaidentified in the study was assembled as a standardreference for the project identification work.
DATA ANALYSISData were analyzed using multimetric and
multivariate techniques. Data were entered intoExcel spreadsheets and formatted as needed foreach analysis. Multivariate analyses wereperformed using PC-Ord Version 4 statisticalsoftware. All other statistical analyses wereperformed with SPSS Version 10.0. For allmultivariate analyses, macroinvertebrate densitydata were log (x+1) transformed to reduce theinfluence of very large values (Krebs 1989). Thistype of transformation is useful when there is ahigh degree of variation within attributes (taxa, inthe case of this study) or among attributes within asample (McCune and Mefford 1999) and haspreviously been used on macroinvertebratecommunity data prior to performing multivariateanalysis (e.g. Reece and Richardson 2000, Zimmeret al. 2000, Jackson 1993). These logarithmicdensity data served as the raw data for allsubsequent multivariate analyses in this study.
Because no consensus exists regarding what,if any, data standardization should be performedprior to conducting multivariate analysis ofcommunity data (Jackson 1993), data wereanalyzed using 1) unstandardized data (e.g. Reeceand Richardson 2000), 2) relative abundance(standardized in relation to row totals; e.g. Fordand Rose 2000) and, 3) data standardized relativeto the taxon maximum abundance (standardized inrelation to column maximum; e.g. Jackson 1993).
Results of multivariate analyses using these threetypes of data were generally similar; however,ordination of relative abundance data produced thestrongest correlations with environmental variablesand tested metrics, so these results were used forexamining conditions of low-gradient reachcommunities and are presented in this study.
Land use data for each reach were calculatedin Arc/Info from 1990 land use/land cover dataproduced by the Pacific Northwest EcosystemResearch Consortium. Anderson level IIclassifications were reclassified to providemeasures of percent urban, agriculture, forested,and road land uses. The percent coverage of eachland use type was calculated in a 2000-m long by800-m wide (400-m from each bank) bufferupstream of each sample reach.
PATTERN ANALYSIS OF ALL MACROINVERTEBRATE DATA
To confirm that the sampling design hadproduced two relatively distinct macroinvertebratecommunity data sets that reflected high- andlow-gradient reach types, and to perform an overallpattern analysis on the entire data set, all reacheswere first compared to one another usingmultivariate techniques. First, cluster analysis wasperformed to arrange reaches in a hierarchicalclassification using the Sorenson (Bray-Curtis)distance measure, and flexible unweightedpair-group arithmetic averaging (flexible UPGMA)(Gauch 1982, Krebs 1989, Marchant, et al. 1999).Non-metric multidimensional scaling (NMS) wasthen performed using the Sorenson (Bray-Curtis)distance measure and a minimum of 400 iterations.NMS, a non-parametric ordination technique, wasselected as the ordination procedure because it isrobust to data departures from normality, assumesno underlying distribution of the data, and for thesereasons is suggested to be particularly suitable foruse with ecological data (McCune and Mefford1999). These two approaches to pattern analysisare considered to be complementary to oneanother, as classification first helps identify groupsof reaches that have the most similar taxacomposition, then ordination further elucidatesthese patterns by ordinating the reaches in relationto one another in k-dimensional space (Gauch1982).
Methods
ABR Final Report 9 2001 Tualatin Basin Macroinvertebrate Study
To determine whether the differences incommunity types were a result of sampling fromdifferent habitat types in high- and low-gradientreaches, or a result of overall environmentaldifferences between reach types, total taxa richnessand total mayfly, stonefly, and caddisfly taxarichness (EPT richness) were compared betweenyears from reaches that were sampled both years.Because glides were sampled from high-gradientreaches in 2000, we were able to compare 2001riffle to 2000 glide samples from reaches sampledin both years to determine what effect samplingdifferent habitat types within a single stream typehad on the resulting macroinvertebrate data. Ifdifferences in taxa richness and compositionbetween 2000 and 2001 high-gradient sampleswere small, then differences between low-gradientand high-gradient reaches would primarily fromdifferences in overall stream type and condition,and not a result of sampling from two differenthabitat types.
CHARACTERIZATION OF ENVIRONMENTAL CONDITIONS IN HIGH- AND LOW-GRADIENT REACHES
Physical and chemical properties weresummarized and compared between high- andlow-gradient reaches to further examine how thesetwo stream types differ in the basin. To betterexplore relationships between physical andbiological conditions, several classes of variablessuch as percent urban, percent agriculture, andpercent road land uses; percent coarse gravel,cobble, and boulder; and percent sand and finesubstrate were summed to produce variablesnamed “percent urban, roads, and ag”, “percentcoarse substrate”, and “percent sand and fines”.
ANALYSIS OF LOW-GRADIENT REACH MACROINVERTEBRATE DATA
Macroinvertebrate community data fromlow-gradient reaches were analyzed usingmultivariate pattern analysis and indirect gradientanalysis, as well as by analysis with a set ofselected community metrics. Currently, there areno widely-accepted analytical tools to evaluatemacroinvertebrate communities in low-gradientstream reaches on the Tualatin Valley floor. Thefirst step towards developing such tools is toexamine relationships between macroinvertebrate
community structure and environmentalconditions, including water quality, physicalhabitat conditions, and surrounding land use.Although reference conditions for low-gradient,valley floor streams may no longer exist, a range inland use intensity and types may produce enoughvariation in local stream environmental conditionsto result in measurable differences inmacroinvertebrate community structure that couldbe related to these environmental gradients. Toexamine low-gradient reaches for patterns incommunity composition, cluster analysis wasperformed on the data using the Sorenson(Bray-Curtis) association measure and flexibleUPGMA. NMS was then performed using theSorenson association measure and a minimum of400 iterations to ordinate reaches based oncommunity similarities and to allow subsequentcorrelation of ordinations with environmentalvariables (indirect gradient analysis).
Environmental variables to be correlated withmacroinvertebrate NMS ordinations were firstchecked for normality using normal probabilityplots. Data were then log and square-roottransformed where necessary. Environmentalvariables were then correlated with the resultingordinations axes to examine whether majorgradients in community structure were correlatedwith measured chemical, physical, or landscapeattributes. The endpoints of this type of analysisare the identification 1) of groups of reaches andmajor gradients of site similarity, and 2) theidentification of environmental variables that arecorrelated with major gradients in communitysimilarity.
To identify the taxa responsible for major thegradients in community structure, correlationswere computed between the NMS ordinations andthe macroinvertebrate data matrix. The resultinginformation can be used to examine what taxa ortaxa groups might be appropriate indicators ofbiological conditions in low-gradient reaches of theTualatin Valley floor, based on patterns ofabundance in relation to major patterns in overallsite similarity.
A similar approach was used to identifycommunity metrics most closely correlated withmajor gradients in community structure. Metricsthat provided a range of values amonglow-gradient reaches were selected for inclusion in
Methods
2001 Tualatin Basin Macroinvertebrate Study 10 ABR Final Report
the set; metrics that showed little variation amonglow-gradient reaches, such as sensitive taxarichness, were excluded from the set. Metrics werecalculated for each sample; then the set wascorrelated with NMS ordination axes to determinehow well the major gradients in communitycomposition produced by NMS corresponded tothe selected metrics known to be responsive todegradation. As a final measure ofmacroinvertebrate community conditions inlow-gradient reaches, each sample reach wasranked in relation to other reaches for each metricscore. A mean rank was then computed for eachreach to provide a measure of relative benthiccommunity condition.
ANALYSIS OF HIGH-GRADIENT REACH MACROINVERTEBRATE DATA
High-gradient reach data were analyzed usingmultimetric analysis. Multimetric analysisemploys a set of community metrics, each of whichdescribes an attribute of the macroinvertebratecommunity that is known to be responsive to oneor more types of pollution or habitat degradation.This approach uses scoring criteria that convertraw metric values to standardized scores that canbe summed to produce a single numeric measure ofoverall biological integrity. Reference conditiondata are required to develop this type of assessmenttool. Metric sets and standardized metric scoringcriteria are developed and calibrated for specific
community types, based on both geographiclocation and stream/habitat type. The OregonDepartment of Environmental Quality (DEQ)currently employs a 10-metric set for use withriffle samples from higher gradient streams inwestern Oregon (WQIW 1999).
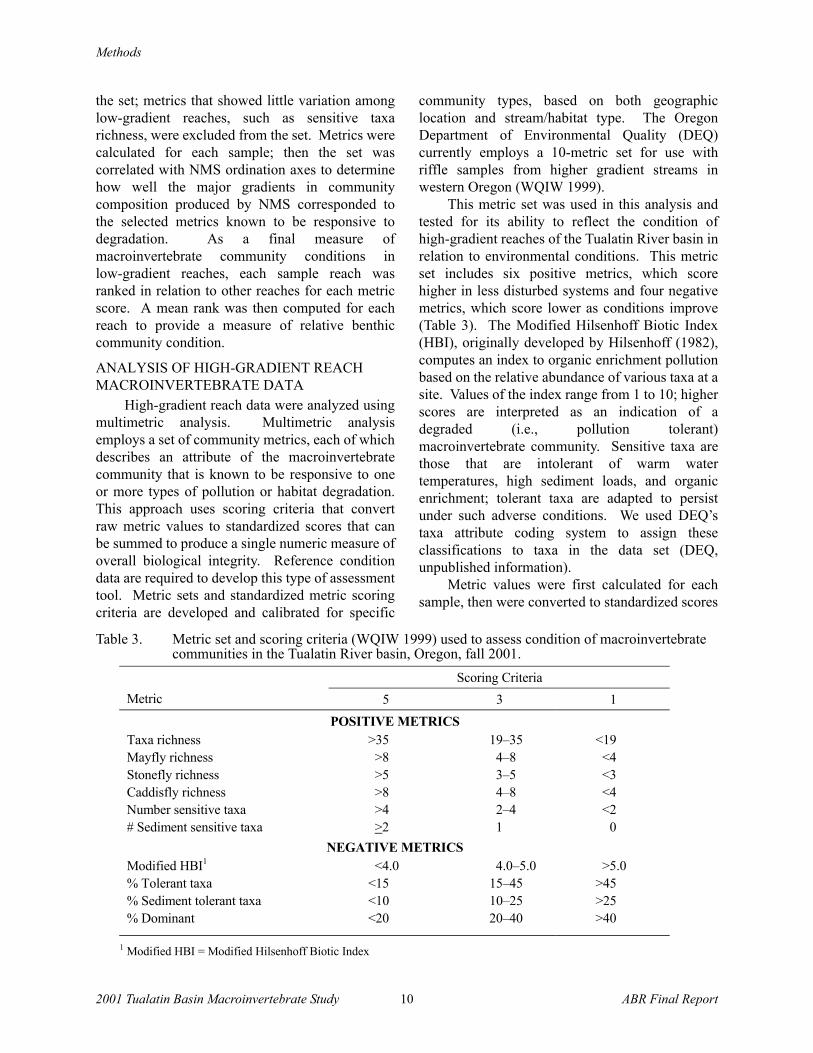
This metric set was used in this analysis andtested for its ability to reflect the condition ofhigh-gradient reaches of the Tualatin River basin inrelation to environmental conditions. This metricset includes six positive metrics, which scorehigher in less disturbed systems and four negativemetrics, which score lower as conditions improve(Table 3). The Modified Hilsenhoff Biotic Index(HBI), originally developed by Hilsenhoff (1982),computes an index to organic enrichment pollutionbased on the relative abundance of various taxa at asite. Values of the index range from 1 to 10; higherscores are interpreted as an indication of adegraded (i.e., pollution tolerant)macroinvertebrate community. Sensitive taxa arethose that are intolerant of warm watertemperatures, high sediment loads, and organicenrichment; tolerant taxa are adapted to persistunder such adverse conditions. We used DEQ’staxa attribute coding system to assign theseclassifications to taxa in the data set (DEQ,unpublished information).
Metric values were first calculated for eachsample, then were converted to standardized scores
Table 3. Metric set and scoring criteria (WQIW 1999) used to assess condition of macroinvertebrate communities in the Tualatin River basin, Oregon, fall 2001.
Scoring Criteria Metric 5 3 1
POSITIVE METRICS Taxa richness >35 19–35 <19 Mayfly richness >8 4–8 <4 Stonefly richness >5 3–5 <3 Caddisfly richness >8 4–8 <4 Number sensitive taxa >4 2–4 <2 # Sediment sensitive taxa >2 1 0
NEGATIVE METRICS Modified HBI1 <4.0 4.0–5.0 >5.0 % Tolerant taxa <15 15–45 >45 % Sediment tolerant taxa <10 10–25 >25 % Dominant <20 20–40 >40
1 Modified HBI = Modified Hilsenhoff Biotic Index
Results
ABR Final Report 11 2001 Tualatin Basin Macroinvertebrate Study
using DEQ scoring criteria for riffle samples fromwestern Oregon streams (Table 3). Thestandardized scores were summed to produce amultimetric score ranging between 10 and 50.Reaches were then assigned to a level ofimpairment based on these total scores (Table 4).
Finally, relationships between multimetricscores and selected environmental variables wereexamined using nonparametric correlation analysis(Spearman’s Rho) to determine how well themetric set responds to increasing levels ofdisturbance in the Tualatin River basin.
COMPARISON OF YEAR 2000 AND 2001 RESULTS
Year 2000 data were compared to year 2001macroinvertebrate data using only low-gradientdata because high-gradient samples were collectedfrom different habitat types in the two samplingyears. Low-gradient data were examined todetermine the similarity 2000 and 2001 siteconditions. If differences occurred, the data setswould then be further examined to determinewhether sampling error, or real changes incommunity composition were producing thesedifferences. Three metrics: total taxa richness,total EPT richness, and the modified HBI werecompared between years. When 2000 and 2001metrics were paired up by site, it was apparent thatunidirectional differences indicative of moreimpaired community conditions had occurredbetween years in many of the reaches. To examinewhether significant differences were occurring inthese community attributes between 2000 and2001, paired t-tests were performed onuntransformed HBI and richness data followingexamination of data for normality with normalprobability plots and Kolmogorov-Smirnov tests ofnormality.
RESULTS
PATTERN ANALYSIS OF ALL MACROINVERTEBRATE DATA
Cluster analysis of all 63 samples produced 2groups of reaches at the farthest dissimilaritydistance (Figure 2). With the exception of a smallgroup of high-gradient reaches with impairedmacroinvertebrate communities on the right side ofthe left cluster, these two groups representhigh-gradient reach samples on the right andlow-gradient reach samples on the left, indicatingthat the sampling design produced two distincttypes of community information with fewexceptions: one type from high-gradient riffles, andthe other from low-gradient glides. Ordinations ofreaches resulting from NMS also showed clearseparation on two dimensions between mostsamples from low-gradient and high-gradientreaches (Figure 3). The only exception to thisgrouping was the occurrence of a numberhigh-gradient reach samples from urbanized areaswith heavily impaired communities; these samplesmuch more closely resembled low-gradientsamples than other high-gradient samples.
A number of environmental variables,including percent fine substrate, percent sand andfine substrate, embeddedness, percent coarsesubstrate, reach gradient, percent riffles, percenturban land use, EIA, percent urban and agriculturalland use, and percent forestry land use, were highlycorrelated (p < 0.001) with NMS axes one and two;these variables, some indirectly, are likelyproducing these major patterns in communitycomposition observed in the basin.
Mean taxa richness and mean EPT richnessfrom high-gradient glide samples in 2000 were26.3 and 10.4, respectively, as compared to 26.3and 12.9 from high-gradient riffle samples in 2001(Figure 4). In contrast, low-gradient glide sampleshad much lower mean taxa and EPT richness thanthose from high-gradient samples in both 2000 and2001 (Figure 4), indicating that these groupsproduced by the multivariate analyses are resultingprimarily from the differences between high- andlow-gradient stream reaches in their overallcapacity to support diverse, sensitivemacroinvertebrate communities, and not a result ofsampling from different habitats.
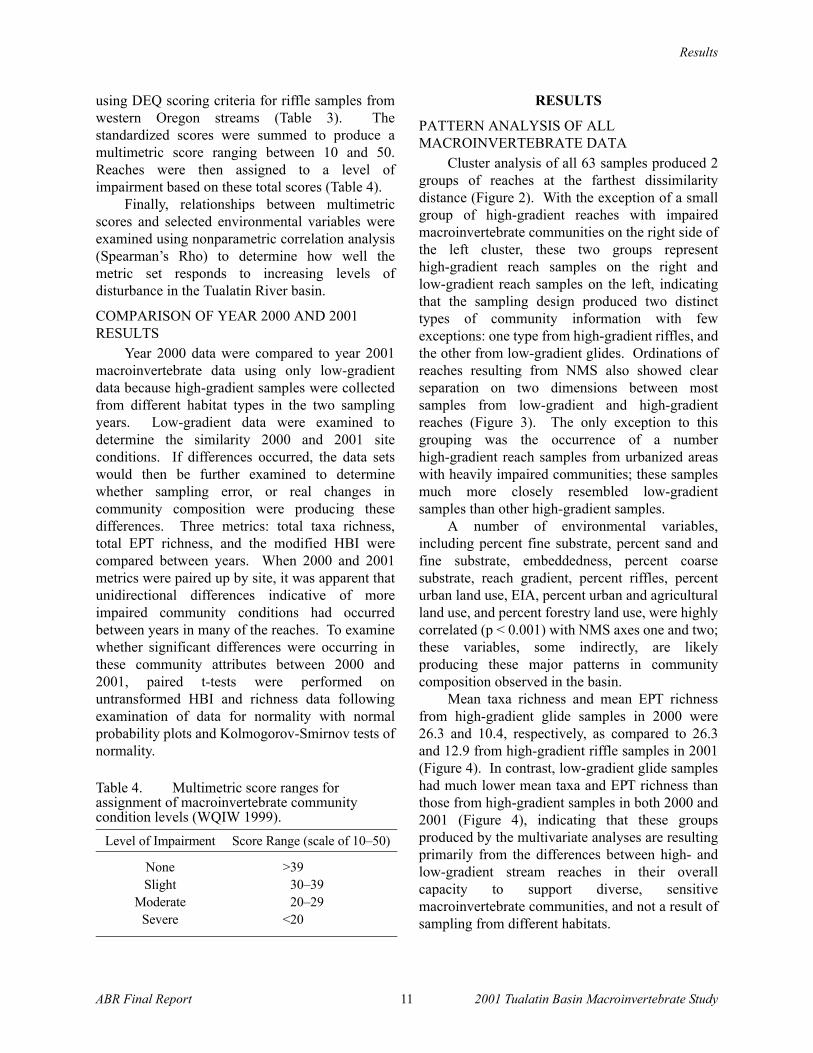
Table 4. Multimetric score ranges for assignment of macroinvertebrate community condition levels (WQIW 1999).
Level of Impairment Score Range (scale of 10–50)
None >39 Slight 30–39
Moderate 20–29 Severe <20
Results
2001 Tualatin Basin Macroinvertebrate Study 12 ABR Final Report
Figure 2. Dendrogram of cluster analysis of Curtis-Bray association measures of macroinvertebrate communities sampled from 63 sample reaches in the Tualatin River basin, Oregon, fall 2001.
Distance (Objective Function)
Information Remaining (%)
1.7E-02
100
1.7E+00
75
3.3E+00
50
5E+00
25
6.6E+00
0
GSM3DYM5SCM3SCM21SCM22CNM3CNM2BAM1CMM1CDM1JSM21JSM22JSM1CHM2RUM2SMM1CDM2ASM2DNM1FMM1FUM2BRM2MKM2SAM1JNM1ASM1MFM2HTM1RLM1DNM2BUM2BUM1SMM2BCM1MKM3RMM1DYM3WLM2CLM1JSM3HDM1SVM1FLM1GLM1WLM1FUM1CMM2SNM1GSM1SCM1DYM1RGM1TNM1DYM4MKM1DYM2CHM1CNM1BRM1MFM11MFM12RUM11RUM12BKM11BKM12AYM11AYM12BIM1GSM2

Results
ABR Final Report 13 2001 Tualatin Basin Macroinvertebrate Study
Figure 3. MS ordination biplot of macroinvertebrate samples collected from high- and low-gradient stream reaches in the Tualatin River basin, Oregon, fall 2001. Only environmental variables with most significant correlation coefficients (p < 0.001, r cutoff = 0.600) are included on the biplot. Vector lines of environmental variable overlays point in the direction that the stated variable increases; longer lines indicate stronger correlation with one or both axes.
Figure 4. Mean taxa richness and richness of mayflies, stoneflies and caddisflies (EPT) in high- and low-gradient stream reaches sampled in the Tualatin River basin, Oregon, fall 2000 and fall 2001.
Reach Gradient
% Riffles
% Coarse Substrate
% Fines
% Sand and FinesEmbeddedness
% Forested
% Urban and Ag
Axis 1
Axis
2
Reach Gradient
Low (<1.5%)High (>1.5%)
Hig
h G
radi
ent 2
000
Hig
h G
radi
ent 2
001
Low
Gra
dien
t 200
0
Low
Gra
dien
t 200
10
10
20
30
40RichnessEPT Richness
Num
ber o
f Tax
a

Results
2001 Tualatin Basin Macroinvertebrate Study 14 ABR Final Report
CHARACTERIZATION OF ENVIRONMENTAL CONDITIONS IN HIGH AND LOW-GRADIENT REACHES
Streams sampled in this study encompassed awide range of land use conditions, riparian andbank conditions, stream channel dimensions,gradients, and substrate characteristics (Table 5).Based on the Rosgen stream classification system,higher gradient reaches were channel types A, B,or C and substrate types 3 or 4, characterized bygradients >1.5–2% and dominant substrates ofcoarse gravel or cobble. These reaches weregenerally dominated by riffle-pool complexhabitat, and were usually contained within U orV-shaped valleys in areas of more topographic
relief along the periphery of the Coast, Tualatin,and Chehalem Mountain Ranges. Riparian zoneconditions ranged from completely intact matureforest in forested areas to non-existent buffers andmaintained lawns and parks up against the top ofthe bank slope.
Low-gradient reaches fell into the E6 and F6Rosgen level II stream classes, characterized bygradients usually <1.5% and dominant substratesof sand and silt. Glide and pool habitat comprisedmost, if not all, aquatic habitat in theselow-gradient reaches; riffles were infrequent, if notabsent. Riparian zone conditions ranged widely,but tended to be poorer (as determined by bufferwidth, % non-native vegetation, and % tree cover)
Table 5. Environmental conditions (mean [range]) of low-gradient and high-gradient stream reaches in the Tualatin River basin, Oregon, fall 2001.
Reach Type Mean (Range) Environmental Variable Low-gradient High-gradient
Urban (%) 38.7 (0.0–75.0) 14.9 (0.0–0.80) Agriculture (%) 32.8 (2.0–94.0) 27.4 (0.0–71.0) Urban, Agri., Roads (%) 83.7 (37.0–99.0) 47.0 (0.0–99.0) Forest (%) 15.4 (1.0–60.0) 53.2 (20.0–100.0) Effective impervious area (%) 26.5 (0.0–51.50) 10.0 (0.0–51.8) Reach gradient (%) 1.0 (0.5–1.5) 3.2 (1.5–5.5) Wetted width (m) 4.2 (0.3–10.1) 3.3 (0.9–9.5) Bankfull width (m) 5.6 (0.5–11.8) 5.7 (1.5–17.1) Mean water depth (cm) 24.4 (4.2–67.5) 8.5 (1.9–19.1) Percent riffles 3.2 (0.0–10.0) 49.6 (15.0–80.0) Percent glides/runs 52.7 (0.0–90.0) 27.2 (0.0–75.0) Percent pools 44.0 (10.0 -100.0) 23.2 (0.0–50.0) Percent coarse substrate 8.1 (0.0–40.0) 53.0 (2.2–87.8) Percent sand and fines 67.1 (13.3–100.0) 20.9 (2.2–78.8) Percent fines 60.0 (1.1–100.0) 12.3 (0.0–78.8) Percent hardpan 9.7 (0.0–78.9) 1.0 (0.0–6.7) Embeddedness (%) 89.3 (55.9–100.0) 45.6 (12.0–92.0) Large wood tally 11.9 (0–50) 8.9 (0–25) Filamentous algae (%) 5.3 (0–60) 0.3 (0–10) Macrophytes (%) 14.0 (0–80) 0.8 (0–25) Canopy cover (%) 64.3 (1.0–97.9) 90.8 (48.9–100.0) Bank stability (%) 58.2 (10–95) 75.8 (10–100) Mean riparian buffer width (m) 23.7 (2.2–91.5) 74.0 (1.5–150+) Tree cover in riparian zone (%) 36.7 (0 - 80) 68.9 (5–90) Rip nonnative veg cover (%) 42.3 (0 -100) 17.6 (0–65) Water temperature (oC) 16.3 (11.1–21.4) 13.6 (10 -20) Spec. conductance (µS/cm) 198.4 (78.6–621.0) 128.8 (49.0–252.4) Dissolved oxygen (% sat) 58.9 (6.0–101.0) 86.1 (50.8–105.1)
Results
ABR Final Report 15 2001 Tualatin Basin Macroinvertebrate Study
than in high-gradient reaches, which generallyoccur on the periphery of, and beyond agriculturaland urban areas. Importantly, agricultural andurban land uses are higher in low-gradient reaches(mean = 84%, range = 37 to 99%) than inhigh-gradient reaches (mean = 47%, range 0 to97%), as would be expected, which furtherillustrates the lack of sufficient reference reachesfor valley floor reaches. Low-gradient reaches alsotended to have more impaired water quality withlower dissolved oxygen concentrations and higherconductivities than did high-gradient reaches.
ANALYSIS OF LOW-GRADIENT REACH MACROINVERTEBRATE DATA
Low-gradient reaches generally exhibited lowtaxa richness, few or no EPT taxa, high dominanceby only a few taxa, and high community-widetolerance to extreme environmental conditions, asmeasured by the modified HBI (Table 6).
Hierarchical cluster analysis of low-gradientreach data produced a dendrogram that didn’t showany distinct groups, or clusters, of reaches. NMSproduced a 3-dimensional ordination thatexplained 76% of the original variation amongsamples. Axis 3 accounted for half of thatexplained variation (unlike other ordinationprocedures, NMS does not number axes to explainsuccessively smaller amounts of variation). Theonly environmental variables significantlycorrelated with ordination axis 1 were wetted and
bankfull widths (r = -0.541, p < 0.001 and r =-0.525, p < 0.001, respectively). Percent urbanland use, percent agricultural land use, dissolvedoxygen, and EIA were all significantly correlatedwith axis 2 (Table 7, Figure 5), and measures ofsubstrate composition, including embeddedness,percent fines, and percent sand and fines hadhighly significant correlations with axis 3. Thesecorrelations with environmental variables indicatethat recognizable patterns in community structureoccur in the basin in relation to stream size, urbanland use intensity, instream substrate composition,and low dissolved oxygen concentrations.
Taxa that showed the strongest correlationwith ordination axis 3 included Acari (r = 0.499),Optioservus (r = 0.548), Chironomus (r = -0.419),Parametriocnemus (r = 0.449), Procladius (r =-0.531), Chelifera (r = 0.453), Baetis tricaudatus (r= 0.416), Corixidae (r = -0.591), Sialis (r = -0.678),Hydrobiidae (r = 0.488), Juga (r = 0.410), andSpheariidae (r = -0.499). Taxa with negativecorrelation coefficients tended to increased inabundance, and those with positive correlationcoefficients decreased, with decreasing substrateconditions, as determined from correlations ofsubstrate conditions with NMS axis 3. Those taxathat tended to increase in abundance with increasedphysical impairment, as indicated by substrateconditions, scored an average modified HBI of 7.8,while those decreasing in abundance scored anaverage modified HBI of only 5.4. No EPT taxa
Table 6. Descriptive statistics and coefficients of correlation (r) with NMS axes of macroinvertebrate community attributes and overall ranks from low-gradient stream reaches sampled in the Tualatin River basin, Oregon, fall 2001.
Correlation with NMS Metric Mean (SD) Min Max Axis 2 Axis 3
Taxa richness 15.0 (4.3) 8 25 0.184 0.517** EPT richness 0.9 (1.4) 0 7 0.495* 0.615** % Chironomidae 24.7 (21.7) 0.6 83.6 0.545** -0.074 % Oligochaeta 13.5 (10.3) 0.0 38.2 -0.216 -0.187 % Molluska 47.8 (24.0) 7.5 94.2 -0.427* 0.104 % Dominant 43.3 (13.6) 20.0 77.0 -0.135 -0.220 % Tolerant 81.6 (15.3) 41.0 98.0 -0.444* -0.529** % Sediment tolerant 60.5 (21.8) 8.0 93.0 -0.495* 0.036 Modified HBI 6.8 (0.9) 5.0 9.3 -0.071 -0.708** Overall rank 12.6 (4.25) 4.9 21.5 -0.435* -0.499*
* p < 0.01, ** p < 0.001
Results
2001 Tualatin Basin Macroinvertebrate Study 16 ABR Final Report
Table 7. Correlation coefficients (r) of environmental variables with axes 2 and 3 of NMS ordination of Bray-Curtis similarity scores of macroinvertebrate communities from 37 low-gradient streams in the Tualatin River basin, Oregon, fall 2001. Some variables were square root (sqrt) or log (log) transformed to better approximate normality prior to performing correlation analysis.
Correlation with NMS axes Environmental Variable Axis 2 Axis 3
Forest % (sqrt) 0.254 -0.002 Agriculture % (sqrt) 0.617** 0.203 Urban % -0.694** -0.187 Effective impervious area -0.619** -0.196 Reach length -0.023 0.176 Wetted width (log) 0.233 0.038 Bankfull width (log) 0.143 0.096 Bankfull height 0.288 0.380 Mean water depth 0.178 0.100 Percent riffles -0.038 0.085 Percent glides/runs -0.307 -0.234 Percent pools 0.294 0.205 Percent embeddedness -0.178 -0.578** Percent sand and fines -0.260 -0.528** Percent fines -0.324 -0.603** Percent woody substrate (log) 0.257 0.177 Percent hardpan (log) 0.105 0.391 Large wood tally (sqrt) 0.012 0.232 % Filamentous algae cover -0.350 -0.192 % Macrophyte cover -0.577** -0.228 Overhead canopy cover 0.340 -0.032 % Stable bank -0.195 -0.016 % Undercut bank 0.135 0.190 Mean riparian buffer width (log) -0.107 -0.320 % Tree cover in riparian zone 0.358 -0.146 % Nonnative riparian veg cover -0.238 0.164 Water temperature (oC) (log) -0.308 0.088 Specific conductance (µS/cm) -0.326 -0.293 Dissolved oxygen (mg/L) 0.399 0.374
* p < 0.01, ** p < 0.001

Results
ABR Final Report 17 2001 Tualatin Basin Macroinvertebrate Study
other than B. Tricaudatus showed correlationshigher than r² = 0.150, largely because so few EPTtaxa were collected from low-gradient reaches thisyear. Nonetheless, EPT taxa tended to occur onlyin samples aggregated in the lower left corner ofthe NMS ordination plot of axes one and two.
Several metrics calculated from low-gradientdata showed highly significant correlations withNMS axes two and three, indicating that gradientsin these measured community attributescorresponded well with the community variationexplained by the NMS ordination (Table 6,Figure 5), and that the variation explained by theNMS axes corresponds with gradients incommunity condition measured by these metrics.Overall community ranks were also highlycorrelated with both ordination axes two and three(p < 0.01).
Although EPT and other more sensitive taxawere largely absent from low-gradient samples thisyear, NMS still produced an ordination of reacheson axes 2 and 3 that tended to decrease in conditionfrom the upper right to lower left quadrants of theNMS plot, as indicated by correlations with both anumber of environmental variables, including
percent urban land use, EIA, and percent finesubstrate, as well as a with a number of benthicmetrics. Overlay of EIA classes on thelow-gradient NMS plot shows a trend incommunity structure in relation to this indicator ofland use intensity (Figure 6).
To further compare conditions amonglow-gradient reaches, reaches were assigned ranksfor each metric score, then ranks were averaged toproduce a single measure of relative condition ineach low-gradient reach (Table 8). Reachesranking highest were generally located in morerural areas (with a few notable exceptions,including reach RUM2), including lower ScogginsCreek, middle McKay Creek, the middle WestFork of Dairy Creek, Heaton Creek, and lowerGales Creek. Communities in these and otherhigher-ranking reaches, on average, had higherrichness, lower collective tolerance, and higherEPT richness than other low-gradient reaches. Thelowest scoring low-gradient reaches includedreaches located in Fanno, Rock, and SummerCreeks, all of which had low dissolved oxygenconcentrations, which could be limitingmacroinvertebrate communities in these systems.
Figure 5. NMS ordination biplots of macroinvertebrate samples collected from low-gradient stream reaches in the Tualatin River basin, Oregon, fall 2001. Plot one includes overlays of environmental variables with highly significant (p < 0.01) correlation coefficients; plot two includes overlays of benthic community metrics with highly significant (P < 0.01) correlation coefficients. Vector lines of environmental variable overlays point in the direction that the stated variable increases; longer lines indicate stronger correlation with one or both axes.
ASM 2BCM 1 BRM 2
BUM 1
BUM 2
CDM 1
CDM 2
CHM 2
CLM 1
CM M 1
CNM 3
DNM 1
DNM 2
DYM 3
DYM 5
FM M 1
FUM 2
GSM 3
HDM 1
HTM 1
JNM 1
JSM 1
JSM 21JSM 3
M FM 2
M KM 2
M KM 3
RLM 1
RM M 1
RUM 2
SAM 1
SCM 21
SCM 3
SM M 1
SM M 2
SVM 1
WLM 2
% Fines, % Sand and Fines
Embeddedness
% Macrop
DO%
EIA, % Urban
% Agriculture
Axis 2
Axis
3
ASM 2BCM 1 BRM 2
BUM 1
BUM 2
CDM 1
CDM 2
CHM 2
CLM 1
CM M 1
CNM 3
DNM 1
DNM 2
DYM 3
DYM 5
FM M 1
FUM 2
GSM 3
HDM 1
HTM 1
JNM 1
JSM 1
JSM 21JSM 3
M FM 2
M KM 2
M KM 3
RLM 1
RM M 1
RUM 2
SAM 1
SCM 21
SCM 3
SM M 1
SM M 2
SVM 1
WLM 2
Taxa Richness
EPT Richness
% Chironomidae
% Tolerant
% Sediment Tol
Modified HBI
Axis 2
Axis
3

Results
2001 Tualatin Basin Macroinvertebrate Study 18 ABR Final Report
Table 8. Mean ranks of metric scores of macroinvertebrate communities from 37 low-gradient stream reaches in the Tualatin River basin, Oregon, fall 2001. Reaches in bold are those showing the best macroinvertebrate community conditions among sampled reaches, as indicated by both ranks and location on NMS ordination plot.
Reach Name Reach Code 2001 Rank
Scoggins Creek (Lower) SCM3 4.8 Chicken Creek (Lower) CNM3 5.3 Mckay Creek (Middle) MKM2 5.3 Dairy Creek (Middle W) DYM5 6.7 Johnson Ck. (Middle N) JNM1 7.0 Gales Creek (Lower) GSM3 7.5 Heaton Creek (Middle) HTM1 7.5 Bronson Creek (Middle) BRM2 8.0 Saum Creek (Lower) SAM1 9.2 Johnson Ck. (Middle S) JSM2 10.2 Cedar Creek (Upper) CDM1 10.3 Council Creek (Middle) CLM1 10.3 Scoggins Creek (Middle) SCM2 10.8 Johnson South (Upper S) JSM1 11.3 Mckay Creek (Lower) MKM3 11.5 Beaverton Ck. (Upper 1) BUM1 11.8 Rock Creek (Lower) RLM1 12.2 Beaverton Ck. (Upper 2) BUM2 12.5 Hedges Creek (Lower) HDM1 12.7 Johnson Creek (Lower S) JSM3 12.8 Beaverton Creek (Lower) BCM1 13.0 Ash Creek (Lower) ASM2 13.3 Cedar Mill Creek (Middle) CMM1 13.3 Cedar Creek (Middle) CDM2 14.2 McFee Creek (Middle) MFM2 14.5 Christensen Ck. (Lower) CHM2 15.0 Willow Creek (Lower) WLM2 15.2 Dawson Creek (Lower) DNM2 15.3 Dawson Creek (Upper) DNM1 15.8 Fanno Creek (Upper 2) FUM2 16.7 Summer Creek (Lower) SMM2 16.7 Dairy Creek (Lower E) DYM3 16.8 Rock Creek (Milddle) RMM1 17.2 Fanno Creek (Middle) FMM1 18.2 Sylvan Creek (Middle) SVM1 18.8 Summer Creek (Upper) SMM1 20.0 Rock Creek (Upper 2) RUM2 21.5

Results
ABR Final Report 19 2001 Tualatin Basin Macroinvertebrate Study
ANALYSIS OF HIGH-GRADIENT REACH MACROINVERTEBRATE DATA
Multimetric scores of high-gradient rifflesamples ranged from 14 to 38 (Table 9). Reachesscoring in the upper end of the “slight impairment”score range included upper Burris Creek, upperEast and West Forks of Dairy Creek, upper GalesCreek, and Roaring Creek. These stream reachesrepresent the best available reference conditionsfor high-gradient, riffle-pool complex streams inthe Tualatin River basin and are characterized asoccurring in well forested drainages, and havingsubstrate relatively free of fine sediment, and highwater quality (Figures 7, 8, and 9). These reachessupport species-rich communities with high EPTrichness, and a collective sensitivity to habitat andwater quality impairment. Chicken Creek andChristensen Creek scored only slightly lower thanthese first five reaches, and upper Bronson Creek,upper Baker Creek, and East Fork Dairy Creekbelow Meachum road scored in the lower end of
the slight impairment category. These systemshave lost some capacity to support the diverseassemblages that the upper Gales, Dairy, Roaring,and Burris Creek support, but still harbor EPT andother taxa that are relatively sensitive to physicaland chemical impairment.
Upper Ash Creek, lower Bannister Creek,upper Fanno Creek, upper Willow Creek, upperGolf Creek, and upper Ayers Creek all scored inthe severely impaired range. These stream reachesscoring in the highly impaired range primarilyoccurred in areas with higher urban andagricultural land use intensities, and had higherfine sediment levels, lower dissolved oxygenconcentrations, and higher water temperatures.
Multimetric scores from high-gradient reacheswere significantly correlated with a number ofenvironmental variables (Table 10), indicating thatthe metric set employed accurately characterizedmacroinvertebrate community conditions inrelation to these measures of instream and land use
Figure 6. Overlay of effective impervious area (EIA) classes on NMS plot of macroinvertebrate communities sampled from 37 low-gradient stream reaches in the Tualatin River basin, Oregon, fall 2001.
ASM 2BCM 1 BRM 2
BUM 1
BUM 2
CDM 1
CDM 2
CHM 2
CLM 1
CM M 1
CNM 3
DNM 1
DNM 2
DYM 3
DYM 5
FM M 1
FUM 2
GSM 3
HDM 1
HTM 1
JNM 1
JSM 1
JSM 21JSM 3
M FM 2
M KM 2
M KM 3
RLM 1
RM M 1
RUM 2
SAM 1
SCM 21
SCM 3
SM M 1
SM M 2
SVM 1
WLM 2
Axis 2
Axis
3
EIA Category
0-10%10-25%25-40%>40%
Results
2001 Tualatin Basin Macroinvertebrate Study 20 ABR Final Report
Table 9. Multimetric scores of macroinvertebrate communities sampled from 26 high-gradient stream reaches in the Tualatin River basin, Oregon, fall 2001.
Reach Name Reach Code 2001 Multimetric Score SLIGHTLY IMPAIRED
Dairy Creek (Middle East Fork) DYM1 38 Dairy Creek (Upper West Fork) DYM4 38 Gales Creek (Upper) GSM1 38 Burris Creek (Upper) BIM1 36 Roaring Creek (Middle) RGM1 36 Christensen Creek (Upper) CHM1 34 Chicken Creek (Upper) CNM1 34 Bronson Creek (Upper) BRM1 32 Dairy Creek (Upper East Fork) DYM2 32 Scoggins Creek (Upper) SCM1 32 Sain Creek (Lower) SNM1 32 Baker Creek (Upper) BKM1 (Duplicate 1) 30 Baker Creek (Upper) BKM1 (Duplicate 2) 30 McFee Creek (Upper) MFM1 (Duplicate 1) 30 McFee Creek (Upper) MFM1 (Duplicate 2) 28
MODERATELY IMPAIRED Rock Creek (Upper 1) RUM1 (Duplicate 1) 28 Tanner Creek (Lower) TNM1 28 McKay Creek (Upper) MKM1 26 Fanno Creek (Lower) FLM1 24 Rock Creek (Upper 1) RUM1 (Duplicate 2) 24 Cedar Mill Creek (Upper) CMM2 22 Chicken Creek (Middle) CNM2 20 Gales Creek (Middle) GSM2 20
SEVERELY IMPAIRED Ash Creek (Upper) ASM1 18 Bannister Creek (Lower) BAM1 18 Fanno Creek (Upper 1) FUM1 18 Willow Creek Upper) WLM1 18 Golf Creek (Upper) GLM1 16 Ayers Creek (Upper) AYM1 (Duplicate 2) 16 Ayers Creek (Upper) AYM1 (Duplicate 1) 14
Results
ABR Final Report 21 2001 Tualatin Basin Macroinvertebrate Study
Figure 7 Relationship between macroinvertebrate community multimetric scores and physical habitat variables found to be significantly correlated with these scores from high-gradient stream reaches sampled in the Tualatin River basin, Oregon, fall 2001.
0 10 20 30 400
50
100
150
Multimetric Score
Mea
n Ri
paria
n Bu
ffer
Wid
th (m
)
0 10 20 30 400
50
100
Multimetric Score
% C
oars
e Su
bstr
ate
0 10 20 30 400
50
100
Multimetric Score
% N
on N
ativ
eVe
geta
tion
0 10 20 30 400
50
100
Multimetric Score
% S
and
and
Fine
s

Results
2001 Tualatin Basin Macroinvertebrate Study 22 ABR Final Report
Figure 8. Relationship between macroinvertebrate community multimetric scores and water quality variables found to be significantly correlated with these scores from high-gradient stream reaches sampled in the Tualatin River basin, Oregon, fall 2001.
0 10 20 30 400
5
10
15
20
Multimetric Score
Tem
pera
ture
(C)
0 10 20 30 400
20
40
60
80
100
Multimetric Score
Diss
olve
d O
xyge
n(%
sat)
0 10 20 30 400
50
100
150
200
250
300
Multimetric Score
Spec
ific
Cond
ucta
nce
Results
ABR Final Report 23 2001 Tualatin Basin Macroinvertebrate Study
Figure 9. Relationship between macroinvertebrate community multimetric scores and land-use variables found to be significantly correlated with these scores from high-gradient stream reaches sampled in the Tualatin River basin, Oregon, fall 2001.
0 10 20 30 400.0
0.2
0.4
0.6
0.8
1.0
Multimetric Score
Urb
an a
nd A
gric
ultu
reLa
nd U
se (%
)
0 10 20 30 400.0
0.2
0.4
0.6
0.8
1.0
Multimetric Score
Fore
sted
Lan
d (%
)
0 10 20 30 400
20
40
60
80
100
Multimetric Score
Effe
ctiv
e Im
perv
ious
Are
a (%
)
Results
2001 Tualatin Basin Macroinvertebrate Study 24 ABR Final Report
conditions. Among these variables, percent urbanand percent forested land uses, measures of streamsubstrate composition, measures of riparian zonevegetative conditions, and specific conductanceshowed the strongest correlation with multimetricscores, all with correlation p values < 0.001.
COMPARISON OF YEAR 2000 AND 2001 RESULTS
Total taxa richness, EPT richness, andmodified HBI scores from low-gradient reacheswere lower, lower, and higher, respectively in 2001than in 2000 (Figure 10). Paired t-tests indicatedthat 2001 HBI scores were significantly higher in2001 than in 2000 (p = 0.014), and that taxarichness in low-gradient reaches was significantly
Table 10. Means, ranges, and correlation with multimetric scores of selected environmental variables measured at 26 high-gradient stream reaches in the Tualatin River basin, Oregon, fall 2001. Asterisks (*) following p-values indicate significant correlation at alpha = 0.01.
Correlation with Multimetric Score Variable Mean Range Spearman’s rho P value
Urban (%) 14.8 0.0–80.0 -0.547 <0.001* Agriculture (%) 27.4 0.0–71.0 -0.217 0.125 Forest (%) 53.2 2.0–100.0 0.656 <0.001* Effective Impervious Area (%) 10.0 0.0–51.8 -0.521 0.002* Urban, Roads, and Ag (%) 46.8 0.0–98.0 -0.656 <0.001* Reach gradient (% slope) 3.2 1.5–5.0 0.469 0.005* Wetted width (m) 3.3 0.9–9.4 0.364 0.024 Coarse substrate (%) 60.7 2.2–93.3 0.621 <0.001* Sand and fines (%) 20.1 1.1–78.8 -0.579 <0.001* Embeddedness (%) 45.6 12.1–92.0 -0.540 0.001* Riparian Buffer Width (m) 74 1.5–152.4 0.502 0.002* Riparian tree cover (%) 68.9 5.0–90.0 0.660 <0.001* Nonnative riparian cover (%) 17.6 0.0–65.0 -0.688 <0.001* Water temperature (oC) 13.6 9.5–19.7 -0.490 0.003* Specific Conductance (µS/cm) 128.8 49.0–252.4 -0.587 <0.001* Dissolved oxygen (% sat) 86.1 50.8–105.1 0.433 0.008*
Figure 10. Mean taxa richness, modified HBI scores, and EPT richness of macroinvertebrate communities sampled from low-gradient stream reaches in the Tualatin River basin, Oregon, fall 2000 and fall 2001.
EPT Richness Total Richness Modified HBI0
10
20
3020002001
Metric
Met
ric V
alue

Discussion
ABR Final Report 25 2001 Tualatin Basin Macroinvertebrate Study
lower in 2001 than in 2000 (p = 0.001). EPTrichness was also significantly lower inlow-gradient reaches in 2001 than in 2000, asindicated by a paired t-test (p = 0.001).
DISCUSSION
The wide variation in macroinvertebratecommunity composition exhibited by TualatinRiver basin streams is related to both naturalvariation in land form and resulting streammorphology, as well as by degraded habitat andwater quality and altered hydrology resulting fromhuman activities. Multivariate pattern analysis ofall reaches and subsequent correlation withenvironmental variables showed highly significantcorrelations between major gradients incommunity composition and a number ofenvironmental variables. These variables includedthose that describe natural variation (e.g.,gradient), those that primarily measure degree ofhuman alteration of the surrounding landscape(e.g., land use, EIA, and riparian zone conditions),and those that are highly influenced by both naturaland human forces (e.g., substrate composition).Because so many of these factors are correlatedamong themselves, assigning cause to certain onesis a tenuous task beyond the design and scope ofthis type of study. What becomes clear, however,is that as whole, land-use type and intensity (theultimate causes) have had a measurable effect onphysical habitat and water quality (proximatecauses) in basin streams, which in turn, hasmeasurably impaired biological integrity. Oneaspect of disturbance not measured directly in thisstudy, yet known to significantly affect both theform and function of streams, is hydrologicmodification by urban and agricultural land uses.Urban development, in particular, significantlyalters stream hydrology. Physical data from Seattlearea watersheds indicate that EIA levels of lessthan 10% can cause significant habitat degradationto sensitive waterbodies as a result of alteredhydrology (Booth and Jackson 1997).
High-gradient streams exhibited such a widerange in community conditions, that some reaches,including upper Fanno and Golf creeks, hadmacroinvertebrate communities that closelyresembled those sampled from low-gradientreaches. High-gradient reaches that support the
richest and most sensitive macroinvertebratecommunities can be characterized as having intactand mature riparian zones, low levels of substrateembeddedness, high dissolved oxygenconcentrations, low water temperatures, highpercentages of coarse substrates (coarse gravel,cobble, and boulder), and they typically occur inheavily forested drainages (Figure 11).Multimetric scores were highly correlated with allof these environmental variables, indicating that asphysical and chemical conditions have becomeimpaired by increased land-use intensity across thebasin, macroinvertebrate communities also havebeen compromised. It should be noted that all ofthese measured relationships are only correlativeand, therefore, do not establish cause and effect.For example, specific conductance was highlycorrelated with multimetric scores, yetmacroinvertebrates are relatively insensitive to therange of conductivities occurring in the samplereaches (EPA 1991). In this case, conductivity issimply covarying with other factors that doinfluence macroinvertebrate community structure,perhaps dissolved oxygen or one or moreunmeasured water quality variables.
Low-gradient reaches exhibited a much morenarrow range in both physical and benthiccommunity conditions than did high-gradientreaches. Land use was predominantly agricultural,urban, or a mix of the two immediately aboveevery low-gradient reach, as combined urban andagricultural land use averaged 84% abovelow-gradient stream reaches and only 47% abovehigh-gradient stream reaches. Biologicalconditions in low-gradient reaches varied justenough to allow analyses to relate gradients incommunity composition to environmentalvariables and land use. Although EPT and othersensitive taxa were absent from many low-gradientreaches, reaches still ranged in their taxacomposition and collective tolerance to disturbanceenough to produce patterns in communitycondition that were related to certainenvironmental gradients. Percent fine substrate,percent urban land use, EIA, and dissolved oxygenconcentrations all were correlated with majorpatterns in community composition identified byNMS axes two and three for low-gradient reaches.Individual metrics and overall metric ranks oflow-gradient stream conditions also were highly

Discussion
2001 Tualatin Basin Macroinvertebrate Study 26 ABR Final Report
Figu
re 1
1.
Loca
tion
of h
igh-
grad
ient
stre
am re
ache
s sam
pled
for m
acro
inve
rtebr
ate
com
mun
ity c
ondi
tions
in th
e Tu
alat
in R
iver
bas
in, O
rego
n,
fall
2001
. C
ircle
size
coi
ncid
es w
ith st
ream
con
ditio
n cl
assi
ficat
ion:
smal
lest
circ
les i
ndic
ate
seve
re im
pairm
ent a
nd la
rges
t circ
les
repr
esen
t min
imal
impa
irmen
t.
� �
��
� �
� �
��
��
� �
��
��
� �
��
��
� �
� �
� �
� �
� �
��
��
� �
� �
��
��
� �
� �
� �
����
����
����
����
��
����
���
����
����
����
���
����
����
���
���� ����
����
����
��
�
���
����
����
����
����
����
��
�������
��������� ��!�"��"#!�
��$��%
��$� %
%�$��&
���$��%
�� � � � � ��
Discussion
ABR Final Report 27 2001 Tualatin Basin Macroinvertebrate Study
correlated with NMS ordinations, indicating thatthat the two approaches to analyzing benthiccommunities in low-gradient streams wereproducing similar results, thereby strengtheningour ability to draw conclusions from the results ofthis study.
Overall rankings of low-gradient reachesranged from 4.8 to 21.5, but because ranking doesnot provide a measure of absolute difference inconditions among reaches, the ranked list ofreaches should be interpreted with care. In general,this approach of ranking reaches is of limited usebecause the ranks cannot be used to makecomparisons with reaches other than those in theranked group (i.e., sampled at other times or fromother locations). It should be stressed thatlow-gradient reaches did not vary as widely incommunity composition as did high-gradientreaches; therefore, reaches with relativelydissimilar mean ranks may have only subtledifferences in actual community composition.Those reaches ranked at the top of the list,including lower Scoggins, lower Chicken, middleMckay, middle Dairy, Johnson (north), lowerGales, middle Heaton, middle Bronson, and lowerSaum creeks, also occurred towards the upperright-hand corner of the NMS plot; both analysesindicate that these reaches support benthiccommunities in better condition than in othersampled low-gradient reaches. Reaches rankinglower on the list did not show as clear arelationship with location on the ordination plotand, therefore, share very similarmacroinvertebrate communities, despite receivingranks between 10.2 and 21.5.
Because patterns in community compositionwere related to environmental conditions inlow-gradient reaches, and a number of metrics alsowere correlated with major patterns inmacroinvertebrate community composition, wesuggest the continued use of a number of thesemetrics that are most appropriate for describing therange of conditions occurring in low-gradientreaches on the basin valley floor. In doing so, thecondition of each reach can be monitored over timewith these metrics that have been shown to berelated to major patterns in macroinvertebratecommunity composition in the lower basin.
Without reference condition information forlow-gradient Willamette Valley streams,
assessment tools based on comparison to a desiredor reference condition cannot be developed. Themetrics tested in this study offer a tool forevaluating the condition of streams in the absenceof calibrated multimetric and multivariate toolsthat compare observed to expected conditions.Oregon DEQ has recently located and sampledfrom what they consider low-gradient referenceconditions elsewhere in the Willamette Valley(Rick Hafele, DEQ, personal communication), buthow well the data might apply to Tualatin Valleystreams has yet to be determined. Until then,examining relationships between gradients inenvironmental conditions and benthic communitystructure, and continued use of appropriate metricsprovides an effective approach to evaluatingmacroinvertebrate community conditions in theselow-gradient streams.
Low-gradient, valley floor reaches typicallyare subjected to high water temperatures, lowdissolved oxygen, extreme variation in discharge,and other environmental extremes that have beenexacerbated by human development of the valleyfloor. The results of this study show strongrelationships between environmental conditionsand macroinvertebrate community condition.Although there is no current reference data set orcondition with which to assess low-gradient valleyfloor streams, the range in low-gradient streamconditions and the relationship of these conditionsto substrate composition, dissolved oxygen, andother environmental variables indicates that most,if not all, of these systems occurring belowdeveloped land uses are degraded to variousdegrees. A number of low-gradient stream reacheshad dissolved oxygen saturations of less than 20%,and one reach (upper Rock Creek, RUM2) was 6%.Such environmental extremes most certainly didnot occur in these streams prior to Europeansettlement, and aquatic communities have beenmeasurably impaired as a result of more than 150years of intensifying land use.
Comparison of 2000 and 2001 data collectedfrom low-gradient reaches indicates thatlow-gradient reaches in 2001 were, on average, inslightly poorer condition than in 2000. We choseto use only the low-gradient data in this assessmentbecause different habitats were sampled fromhigh-gradient reaches in 2000 and 2001. Intra-sitedifferences between years can be produced by 1)

Literature Cited
2001 Tualatin Basin Macroinvertebrate Study 28 ABR Final Report
sampling error, 2) variability in sampling methods,3) real differences in community compositionbetween years, or 4) some combination of thethree. Thus, there is a risk of misinterpreting thecause of inter-annual differences in communityattributes, particularly in low-gradient reaches,where temperature, flow, and other environmentalextremes would be most pronounced in a droughtyear, as occurred in 2001. In general, reaches hadlower overall taxa richness and higher modifiedHBI scores in 2001 than in 2000. Theunidirectional nature of differences between 2000and 2001 suggests that these differences are likelybeing produced by real changes in one direction(towards less rich, more disturbance tolerantcommunities during drought conditions), ratherthan by random sampling error, which shouldproduce random variation in metric scores betweenyears. Both this year’s and last year’s duplicatesamples produced very similar taxonomic lists andmetric scores, indicating that the current samplingprotocol is capable of obtaining representativesamples of macroinvertebrate communities instudy reaches.
As further evidence for having measured theeffect of drought on macroinvertebratecommunities in the basin, EPT richness wasnoticeably lower in low-gradient streams in 2001,accounting for much of the reduction in overalltaxonomic richness between years. Mayfly,stonefly, and caddisfly taxa collectively are knownto be among the most sensitive macroinvertebratesto disturbance and environmental extremes. It isplausible that environmental conditions exceededthe tolerance limits of these taxa in thelow-gradient streams in late summer 2001,reducing their abundance in these areas. This hassignificant implications for biomonitoring inlow-gradient Tualatin Valley reaches, especially inregard to timing of sampling episodes, and infurthering our understanding of the distributionallimits of sensitive taxa in these valley floorstreams.
One objective of this study was to examinerelationships between environmental variables andmacroinvertebrate community composition inlow-gradient reaches. This objective was set forthwith the intent to gain a better understanding ofwhat type of macroinvertebrate communities aresupported by various land-use types, riparian
management practices, and instream physical andchemical conditions. Because we attempted toexamine such relationships during a drought year,it appears likely that reaches that support moresensitive taxa and a richer community during lessextreme conditions were sampled when biologicalconditions were worse than they would be in a yearwith normal rainfall. If drought conditions of latesummer 2001 further compromised biologicalconditions in low-gradient streams, as our datasuggest they did, then years or seasons of lessextreme environmental conditions should besupport richer, but more sensitive communities.Examining communities during less extremeperiods, such as early summer, well after springflooding, yet before drought conditions ensue,would allow distributional patterns of sensitiveorganisms in the basin to be examined in relation toshifts in environmental gradients. Collectivechanges in the distribution of sensitive organismswould produce measurable changes in communitycomposition that could also be related back toenvironmental conditions at that time. Mostimportantly, this information would provide abetter understanding of what environmentalconditions in low-gradient streams are required forsupporting more healthy and diversemacroinvertebrate communities.
LITERATURE CITED
Booth, D. B., and C. R. Jackson. 1997.Urbanization of aquaticsystems—degradation, thresholds, stormwaterdetention, and the limits of mitigation.Journal of the American Water ResourcesAssociation 22(5): 1–17.
Caton L. 1991. Improved subsampling methodsfor the EPA “Rapid Bioassessment” benthicprotocols. Bulletin of the North AmericanBenthological Society 8:317–319.
Cole, M. B. 2000. Assessment ofmacroinvertebrate communities of theTualatin River basin. Unpublished report tothe Unified Sewerage Agency, Hillsboro, OR.31 pp.

Literature Cited
ABR Final Report 29 2001 Tualatin Basin Macroinvertebrate Study
Cole, M. B., J. T. Hawksworth, and K. Menninger.1999. Upper Tualatin-Scoggins Watershedmacroinvertebrate assessment. Pages195–200 in Upper Tualatin-ScogginsWatershed Analysis. Washington County Soiland Water Conservation District, Hillsboro,OR.
EPA. 1991. Monitoring guidelines to evaluateeffects of forestry activities on streams in thePacific Northwest and Alaska. United StatesEnvironmental Protection Agency, Region 10,Seattle, WA. EPA/910/9-91-001
EPA. 1997. Biological monitoring of aquaticcommunities. Chapter 3 in Monitoringguidance for determining the effectiveness ofnonpoint source controls. United StatesEnvironmental Protection Agency,Washington, D.C. EPA/841-B-96-004
Ford, J. and C. E. Rose, 2000. Characterizingsmall subbasins: A case study from coastalOregon. Environmental Monitoring andAssessment 64: 359–377.
Friesen, T. A., and D. L. Ward. 1996. Status andcondition of fish assemblages in the TualatinRiver basin, Oregon. Northwest Science 70:120–131.
Gauch, H. G., Jr. 1982. Multivariate analysis incommunity ecology. Cambridge UniversityPress. New York, NY. 298 pp.
Hawkins, C. P., R. H. Norris, J. N. Hogue, and J.W. Feminella. 2000. Development andevaluation of predictive models for measuringthe biological integrity of streams. EcologicalApplications 10(5): 1456–1477.
Hilsenhoff, W. L. 1982. Using a biotic index toevaluate water quality in streams. TechnicalBulletin No. 132. Department of NaturalResources, Madison, WI.
Jackson, D. A. 1993. Multivariate analysis ofbenthic invertebrate communities: theimplication of choosing particular datastandardizations, measures of association, andordination methods. Hydrobiologia 268:9–26.
Karr, J. R., and E. W. Chu. 1999. Restoring life inrunning waters: better biological monitoring.Island Press, Washington, D.C. 206 pp.
Krebs, C. J. 1989. Ecological Methodology.Harper Collins Publishers, New York, NY.654 pp.
Leader, K. 2001. Distribution of fish and crayfish,and measurement of available habitat in theTualatin River basin. Unpublished report bythe Oregon Department of Fish and Wildlifefor Clean Water Services, Hillsboro, OR 67pp.
Marchant, R., A. Hirst, R. Norris, and L.Metzeling. 1999. Classification ofmacroinvertebrate communities acrossdrainage basins in Victoria, Australia:consequences of sampling on a broad spatialscale for predictive modeling. FreshwaterBiology 41: 253–268.
McCune, B., and M. J. Mefford. 1999. PC-ORD.Multivariate analysis of ecological data,Version 4. MJM Software Design, GlenedenBeach, Oregon, USA.
Merritt, R. W., and K. W. Cummins (eds.). 1996.An introduction to the aquatic insects of NorthAmerica. Third Edition. Kendall/HuntPublishing Co., Dubuque, IA. 862 pp.
ODFW. 1995. Distribution of fish and crayfish,and measurement of available habitat in theTualatin River basin. Final Report ofResearch. D. L. Ward, ed. OregonDepartment of Fish and Wildlife, Clackamas,Or. 69 pp.
Pennak, R. W. 1989. Freshwater invertebrates ofthe United States. Third Edition. J. Wiley &Sons, New York, NY. 628 pp.
Reece, P. F., and J. S. Richardson. 2000. Benthicmacroinvertebrate assemblages of coastal andcontinental streams and large rivers ofsouthwestern British Columbia, Canada.Hydrobiologia 439: 77–89.
Rosgen, D. 1996. Applied river morphology.Wildland Hydrology, Pagosa Springs, CO.

Literature Cited
2001 Tualatin Basin Macroinvertebrate Study 30 ABR Final Report
Tate, C. M., and J. S. Heiny. 1995. The ordinationof benthic invertebrate communities in theSouth Platte River Basin in relation toenvironmental factors. Freshwater Biology33: 439–454.
ter Braak, C. J. F. and P. F. M. Verdonschot. 1995.Canonical correspondence analysis andrelated multivariate methods in aquaticecology. Aquatic Sci. 57: 255–289.
Turak, E., L. K. Flack, R. H. Norris, J. Simpson,and N. Waddell. 1999. Assessment of rivercondition at a large spatial scale usingpredictive models. Freshwater Biology 41:283–298.
Weiderholm, T. 1983. Chironomidae of theHolarctic region. Keys and diagnoses. Vol. I.Larvae. Entol. Scandinavica. Suppl. 19:1–457.
WQIW. 1999. Chapter 12: Streammacroinvertebrate protocol, Oregon plan forsalmon and watersheds. Water QualityMonitoring Guide Book, Version 1.03. WaterQuality Interagency Workgroup for theOregon Plan.
Zimmer, K. D., M. A. Hanson, and M. G. Butler.2000. Factors influencing invertebratecommunities in prairie wetlands: amultivariate approach. Canadian Journal ofFisheries and Aquatic Science 57: 76–85.
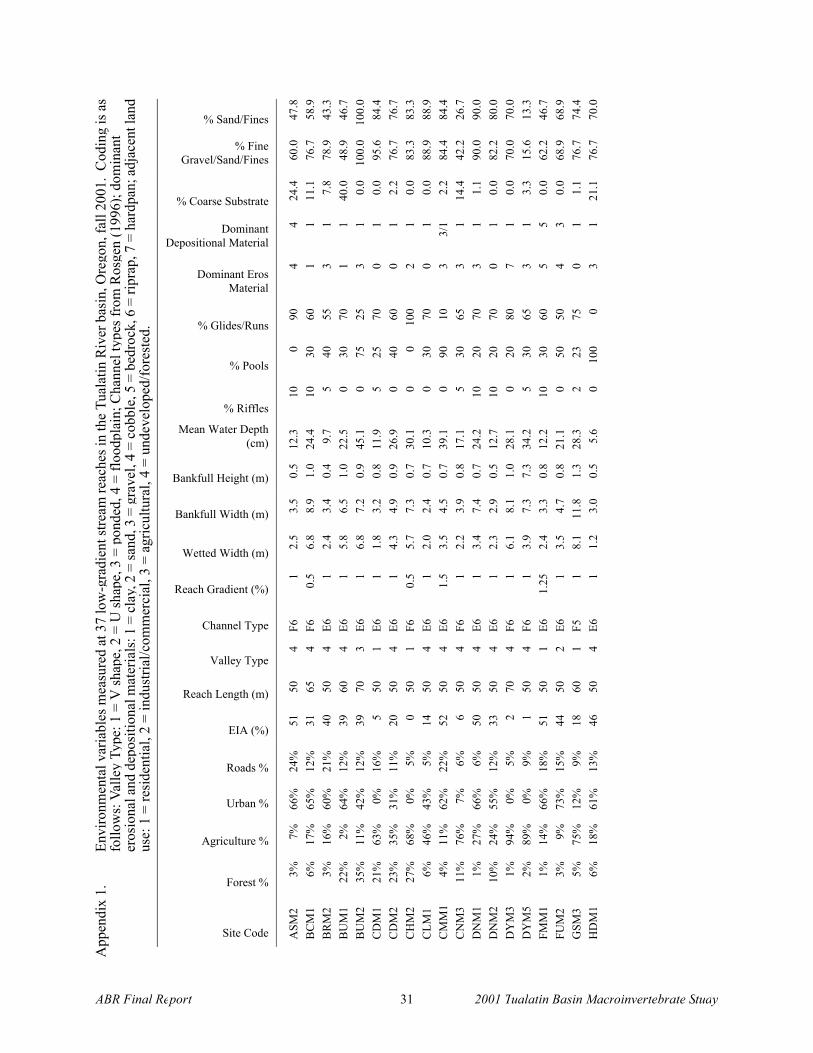
ABR Final Report 31 2001 Tualatin Basin Macroinvertebrate Study
App
endi
x 1.
En
viro
nmen
tal v
aria
bles
mea
sure
d at
37
low
-gra
dien
t stre
am re
ache
s in
the
Tual
atin
Riv
er b
asin
, Ore
gon,
fall
2001
. C
odin
g is
as
follo
ws:
Val
ley
Type
: 1 =
V sh
ape,
2 =
U sh
ape,
3 =
pon
ded,
4 =
floo
dpla
in; C
hann
el ty
pes f
rom
Ros
gen
(199
6); d
omin
ant
eros
iona
l and
dep
ositi
onal
mat
eria
ls: 1
= c
lay,
2 =
sand
, 3 =
gra
vel,
4 =
cobb
le, 5
= b
edro
ck, 6
= ri
prap
, 7 =
har
dpan
; adj
acen
t lan
d us
e: 1
= re
side
ntia
l, 2
= in
dust
rial/c
omm
erci
al, 3
= a
gric
ultu
ral,
4 =
unde
velo
ped/
fore
sted
.
Site Code
Forest %
Agriculture %
Urban %
Roads %
EIA (%)
Reach Length (m)
Valley Type
Channel Type
Reach Gradient (%)
Wetted Width (m)
Bankfull Width (m)
Bankfull Height (m)
Mean Water Depth (cm)
% Riffles
% Pools
% Glides/Runs
Dominant Eros Material
Dominant Depositional Material
% Coarse Substrate
% Fine Gravel/Sand/Fines
% Sand/Fines
ASM
2 3%
7%
66
%
24%
51
50
4
F6
1 2.
5 3.
5 0.
5 12
.3
10
0 90
4
4 24
.4
60.0
47
.8
BC
M1
6%
17%
65
%
12%
31
65
4
F6
0.5
6.8
8.9
1.0
24.4
10
30
60
1
1 11
.1
76.7
58
.9
BR
M2
3%
16%
60
%
21%
40
50
4
E6
1 2.
4 3.
4 0.
4 9.
7 5
40
55
3 1
7.8
78.9
43
.3
BU
M1
22%
2%
64
%
12%
39
60
4
E6
1 5.
8 6.
5 1.
0 22
.5
0 30
70
1
1 40
.0
48.9
46
.7
BU
M2
35%
11
%
42%
12
%
39
70
3 E6
1
6.8
7.2
0.9
45.1
0
75
25
3 1
0.0
100.
0 10
0.0
CD
M1
21%
63
%
0%
16%
5
50
1 E6
1
1.8
3.2
0.8
11.9
5
25
70
0 1
0.0
95.6
84
.4
CD
M2
23%
35
%
31%
11
%
20
50
4 E6
1
4.3
4.9
0.9
26.9
0
40
60
0 1
2.2
76.7
76
.7
CH
M2
27%
68
%
0%
5%
0 50
1
F6
0.5
5.7
7.3
0.7
30.1
0
0 10
0 2
1 0.
0 83
.3
83.3
C
LM1
6%
46%
43
%
5%
14
50
4 E6
1
2.0
2.4
0.7
10.3
0
30
70
0 1
0.0
88.9
88
.9
CM
M1
4%
11%
62
%
22%
52
50
4
E6
1.5
3.5
4.5
0.7
39.1
0
90
10
3 3/
1 2.
2 84
.4
84.4
C
NM
3 11
%
76%
7%
6%
6
50
4 F6
1
2.2
3.9
0.8
17.1
5
30
65
3 1
14.4
42
.2
26.7
D
NM
1 1%
27
%
66%
6%
50
50
4
E6
1 3.
4 7.
4 0.
7 24
.2
10
20
70
3 1
1.1
90.0
90
.0
DN
M2
10%
24
%
55%
12
%
33
50
4 E6
1
2.3
2.9
0.5
12.7
10
20
70
0
1 0.
0 82
.2
80.0
D
YM
3 1%
94
%
0%
5%
2 70
4
F6
1 6.
1 8.
1 1.
0 28
.1
0 20
80
7
1 0.
0 70
.0
70.0
D
YM
5 2%
89
%
0%
9%
1 50
4
F6
1 3.
9 7.
3 7.
3 34
.2
5 30
65
3
1 3.
3 15
.6
13.3
FM
M1
1%
14%
66
%
18%
51
50
1
E6
1.25
2.
4 3.
3 0.
8 12
.2
10
30
60
5 5
0.0
62.2
46
.7
FUM
2 3%
9%
73
%
15%
44
50
2
E6
1 3.
5 4.
7 0.
8 21
.1
0 50
50
4
3 0.
0 68
.9
68.9
G
SM3
5%
75%
12
%
9%
18
60
1 F5
1
8.1
11.8
1.
3 28
.3
2 23
75
0
1 1.
1 76
.7
74.4
H
DM
1 6%
18
%
61%
13
%
46
50
4 E6
1
1.2
3.0
0.5
5.6
0 10
0 0
3 1
21.1
76
.7
70.0
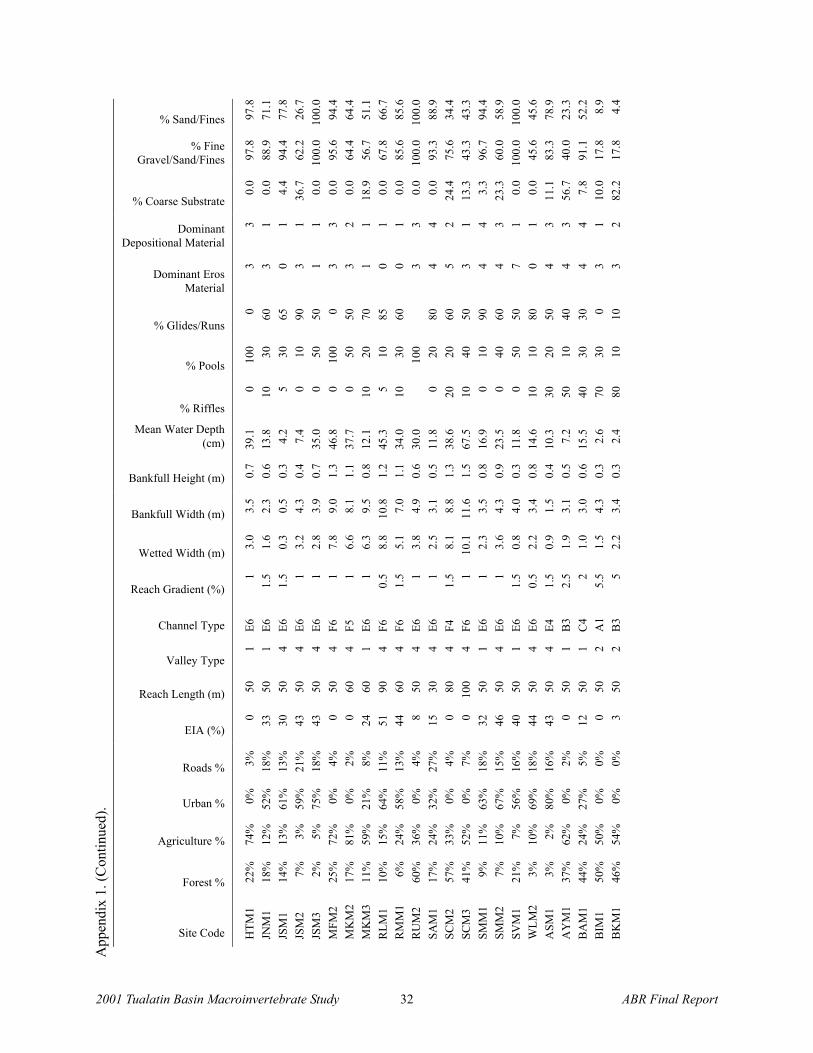
2001 Tualatin Basin Macroinvertebrate Study 32 ABR Final Report
App
endi
x 1.
(Con
tinue
d).
Site Code
Forest %
Agriculture %
Urban %
Roads %
EIA (%)
Reach Length (m)
Valley Type
Channel Type
Reach Gradient (%)
Wetted Width (m)
Bankfull Width (m)
Bankfull Height (m)
Mean Water Depth (cm)
% Riffles
% Pools
% Glides/Runs
Dominant Eros Material
Dominant Depositional Material
% Coarse Substrate
% Fine Gravel/Sand/Fines
% Sand/Fines
HTM
1 22
%
74%
0%
3%
0
50
1 E6
1
3.0
3.5
0.7
39.1
0
100
0 3
3 0.
0 97
.8
97.8
JN
M1
18%
12
%
52%
18
%
33
50
1 E6
1.
5 1.
6 2.
3 0.
6 13
.8
10
30
60
3 1
0.0
88.9
71
.1
JSM
1 14
%
13%
61
%
13%
30
50
4
E6
1.5
0.3
0.5
0.3
4.2
5 30
65
0
1 4.
4 94
.4
77.8
JS
M2
7%
3%
59%
21
%
43
50
4 E6
1
3.2
4.3
0.4
7.4
0 10
90
3
1 36
.7
62.2
26
.7
JSM
3 2%
5%
75
%
18%
43
50
4
E6
1 2.
8 3.
9 0.
7 35
.0
0 50
50
1
1 0.
0 10
0.0
100.
0 M
FM2
25%
72
%
0%
4%
0 50
4
F6
1 7.
8 9.
0 1.
3 46
.8
0 10
0 0
3 3
0.0
95.6
94
.4
MK
M2
17%
81
%
0%
2%
0 60
4
F5
1 6.
6 8.
1 1.
1 37
.7
0 50
50
3
2 0.
0 64
.4
64.4
M
KM
3 11
%
59%
21
%
8%
24
60
1 E6
1
6.3
9.5
0.8
12.1
10
20
70
1
1 18
.9
56.7
51
.1
RLM
1 10
%
15%
64
%
11%
51
90
4
F6
0.5
8.8
10.8
1.
2 45
.3
5 10
85
0
1 0.
0 67
.8
66.7
R
MM
1 6%
24
%
58%
13
%
44
60
4 F6
1.
5 5.
1 7.
0 1.
1 34
.0
10
30
60
0 1
0.0
85.6
85
.6
RU
M2
60%
36
%
0%
4%
8 50
4
E6
1 3.
8 4.
9 0.
6 30
.0
10
0
3 3
0.0
100.
0 10
0.0
SAM
1 17
%
24%
32
%
27%
15
30
4
E6
1 2.
5 3.
1 0.
5 11
.8
0 20
80
4
4 0.
0 93
.3
88.9
SC
M2
57%
33
%
0%
4%
0 80
4
F4
1.5
8.1
8.8
1.3
38.6
20
20
60
5
2 24
.4
75.6
34
.4
SCM
3 41
%
52%
0%
7%
0
100
4 F6
1
10.1
11
.6
1.5
67.5
10
40
50
3
1 13
.3
43.3
43
.3
SMM
1 9%
11
%
63%
18
%
32
50
1 E6
1
2.3
3.5
0.8
16.9
0
10
90
4 4
3.3
96.7
94
.4
SMM
2 7%
10
%
67%
15
%
46
50
4 E6
1
3.6
4.3
0.9
23.5
0
40
60
4 3
23.3
60
.0
58.9
SV
M1
21%
7%
56
%
16%
40
50
1
E6
1.5
0.8
4.0
0.3
11.8
0
50
50
7 1
0.0
100.
0 10
0.0
WLM
2 3%
10
%
69%
18
%
44
50
4 E6
0.
5 2.
2 3.
4 0.
8 14
.6
10
10
80
0 1
0.0
45.6
45
.6
ASM
1 3%
2%
80
%
16%
43
50
4
E4
1.5
0.9
1.5
0.4
10.3
30
20
50
4
3 11
.1
83.3
78
.9
AY
M1
37%
62
%
0%
2%
0 50
1
B3
2.5
1.9
3.1
0.5
7.2
50
10
40
4 3
56.7
40
.0
23.3
B
AM
1 44
%
24%
27
%
5%
12
50
1 C
4 2
1.0
3.0
0.6
15.5
40
30
30
4
4 7.
8 91
.1
52.2
B
IM1
50%
50
%
0%
0%
0 50
2
A1
5.5
1.5
4.3
0.3
2.6
70
30
0 3
1 10
.0
17.8
8.
9 B
KM
1 46
%
54%
0%
0%
3
50
2 B
3 5
2.2
3.4
0.3
2.4
80
10
10
3 2
82.2
17
.8
4.4
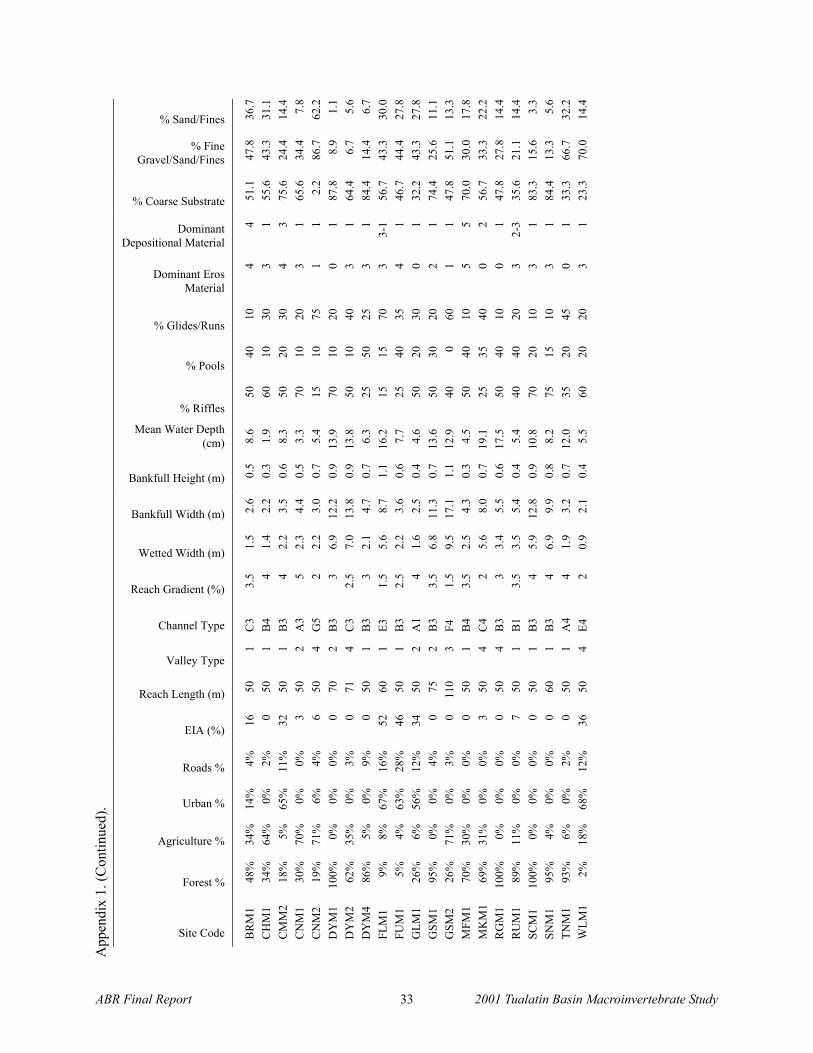
ABR Final Report 33 2001 Tualatin Basin Macroinvertebrate Study
App
endi
x 1.
(Con
tinue
d).
Site Code
Forest %
Agriculture %
Urban %
Roads %
EIA (%)
Reach Length (m)
Valley Type
Channel Type
Reach Gradient (%)
Wetted Width (m)
Bankfull Width (m)
Bankfull Height (m)
Mean Water Depth (cm)
% Riffles
% Pools
% Glides/Runs
Dominant Eros Material
Dominant Depositional Material
% Coarse Substrate
% Fine Gravel/Sand/Fines
% Sand/Fines
BR
M1
48%
34
%
14%
4%
16
50
1
C3
3.
5 1.
5 2.
6 0.
5 8.
6 50
40
10
4
4 51
.1
47.8
36
.7
CH
M1
34%
64
%
0%
2%
0 50
1
B4
4
1.4
2.2
0.3
1.9
60
10
30
3 1
55.6
43
.3
31.1
C
MM
2 18
%
5%
65%
11
%
32
50
1 B
3 4
2.2
3.5
0.6
8.3
50
20
30
4 3
75.6
24
.4
14.4
C
NM
1 30
%
70%
0%
0%
3
50
2 A
3 5
2.3
4.4
0.5
3.3
70
10
20
3 1
65.6
34
.4
7.8
CN
M2
19%
71
%
6%
4%
6 50
4
G5
2 2.
2 3.
0 0.
7 5.
4 15
10
75
1
1 2.
2 86
.7
62.2
D
YM
1 10
0%
0%
0%
0%
0 70
2
B3
3 6.
9 12
.2
0.9
13.9
70
10
20
0
1 87
.8
8.9
1.1
DY
M2
62%
35
%
0%
3%
0 71
4
C3
2.5
7.0
13.8
0.
9 13
.8
50
10
40
3 1
64.4
6.
7 5.
6 D
YM
4 86
%
5%
0%
9%
0 50
1
B3
3 2.
1 4.
7 0.
7 6.
3 25
50
25
3
1 84
.4
14.4
6.
7 FL
M1
9%
8%
67%
16
%
52
60
1 E3
1.
5 5.
6 8.
7 1.
1 16
.2
15
15
70
3 3-
1 56
.7
43.3
30
.0
FUM
1 5%
4%
63
%
28%
46
50
1
B3
2.5
2.2
3.6
0.6
7.7
25
40
35
4 1
46.7
44
.4
27.8
G
LM1
26%
6%
56
%
12%
34
50
2
A1
4 1.
6 2.
5 0.
4 4.
6 50
20
30
0
1 32
.2
43.3
27
.8
GSM
1 95
%
0%
0%
4%
0 75
2
B3
3.5
6.8
11.3
0.
7 13
.6
50
30
20
2 1
74.4
25
.6
11.1
G
SM2
26%
71
%
0%
3%
0 11
0 3
F4
1.5
9.5
17.1
1.
1 12
.9
40
0 60
1
1 47
.8
51.1
13
.3
MFM
1 70
%
30%
0%
0%
0
50
1 B
4 3.
5 2.
5 4.
3 0.
3 4.
5 50
40
10
5
5 70
.0
30.0
17
.8
MK
M1
69%
31
%
0%
0%
3 50
4
C4
2 5.
6 8.
0 0.
7 19
.1
25
35
40
0 2
56.7
33
.3
22.2
R
GM
1 10
0%
0%
0%
0%
0 50
4
B3
3 3.
4 5.
5 0.
6 17
.5
50
40
10
0 1
47.8
27
.8
14.4
R
UM
1 89
%
11%
0%
0%
7
50
1 B
1 3.
5 3.
5 5.
4 0.
4 5.
4 40
40
20
3
2-3
35.6
21
.1
14.4
SC
M1
100%
0%
0%
0%
0
50
1 B
3 4
5.9
12.8
0.
9 10
.8
70
20
10
3 1
83.3
15
.6
3.3
SNM
1 95
%
4%
0%
0%
0 60
1
B3
4 6.
9 9.
9 0.
8 8.
2 75
15
10
3
1 84
.4
13.3
5.
6 TN
M1
93%
6%
0%
2%
0
50
1 A
4 4
1.9
3.2
0.7
12.0
35
20
45
0
1 33
.3
66.7
32
.2
WLM
1 2%
18
%
68%
12
%
36
50
4 E4
2
0.9
2.1
0.4
5.5
60
20
20
3 1
23.3
70
.0
14.4
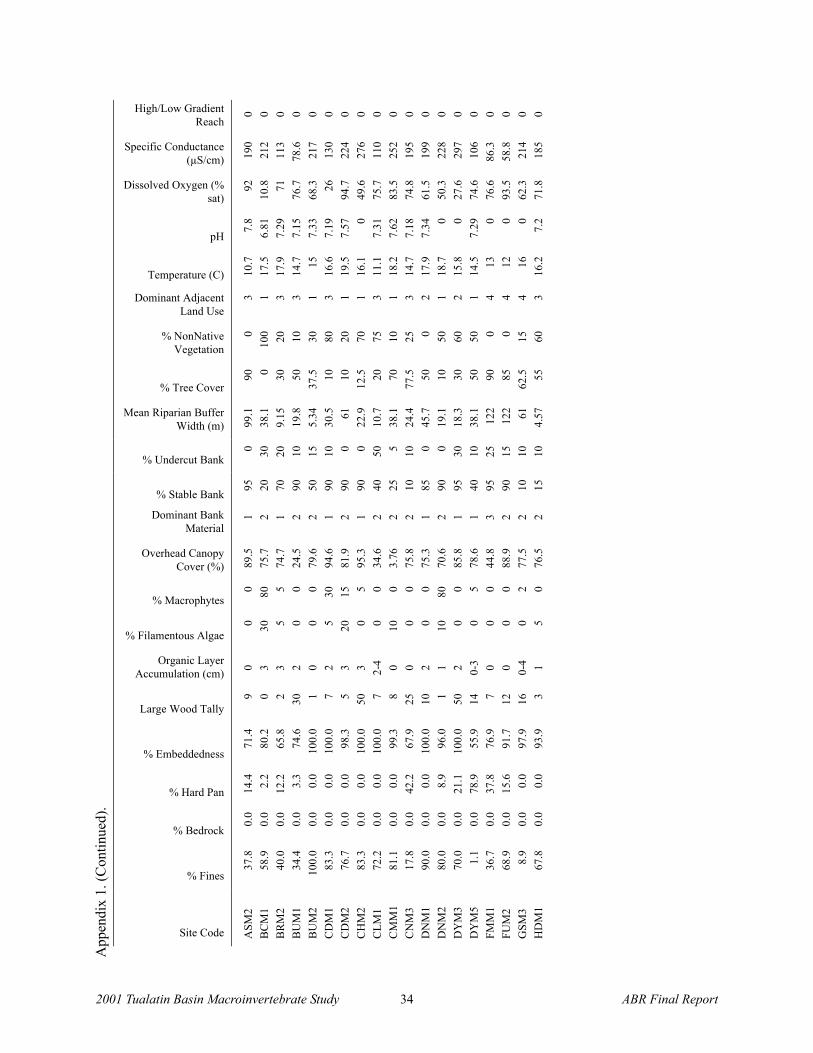
2001 Tualatin Basin Macroinvertebrate Study 34 ABR Final Report
App
endi
x 1.
(Con
tinue
d).
Site Code
% Fines
% Bedrock
% Hard Pan
% Embeddedness
Large Wood Tally
Organic Layer Accumulation (cm)
% Filamentous Algae
% Macrophytes
Overhead Canopy Cover (%)
Dominant Bank Material
% Stable Bank
% Undercut Bank
Mean Riparian Buffer Width (m)
% Tree Cover
% NonNative Vegetation
Dominant Adjacent Land Use
Temperature (C)
pH
Dissolved Oxygen (% sat)
Specific Conductance (µS/cm)
High/Low Gradient Reach
ASM
2 37
.8
0.0
14.4
71
.4
9 0
0 0
89.5
1
95
0 99
.1
90
0 3
10.7
7.
8 92
19
0 0
BC
M1
58.9
0.
0 2.
2 80
.2
0 3
30
80
75.7
2
20
30
38.1
0
100
1 17
.5
6.81
10
.8
212
0 B
RM
2 40
.0
0.0
12.2
65
.8
2 3
5 5
74.7
1
70
20
9.15
30
20
3
17.9
7.
29
71
113
0 B
UM
1 34
.4
0.0
3.3
74.6
30
2
0 0
24.5
2
90
10
19.8
50
10
3
14.7
7.
15
76.7
78
.6
0 B
UM
2 10
0.0
0.0
0.0
100.
0 1
0 0
0 79
.6
2 50
15
5.
34
37.5
30
1
15
7.33
68
.3
217
0 C
DM
1 83
.3
0.0
0.0
100.
0 7
2 5
30
94.6
1
90
10
30.5
10
80
3
16.6
7.
19
26
130
0 C
DM
2 76
.7
0.0
0.0
98.3
5
3 20
15
81
.9
2 90
0
61
10
20
1 19
.5
7.57
94
.7
224
0 C
HM
2 83
.3
0.0
0.0
100.
0 50
3
0 5
95.3
1
90
0 22
.9
12.5
70
1
16.1
0
49.6
27
6 0
CLM
1 72
.2
0.0
0.0
100.
0 7
2-4
0 0
34.6
2
40
50
10.7
20
75
3
11.1
7.
31
75.7
11
0 0
CM
M1
81.1
0.
0 0.
0 99
.3
8 0
10
0 3.
76
2 25
5
38.1
70
10
1
18.2
7.
62
83.5
25
2 0
CN
M3
17.8
0.
0 42
.2
67.9
25
0
0 0
75.8
2
10
10
24.4
77
.5
25
3 14
.7
7.18
74
.8
195
0 D
NM
1 90
.0
0.0
0.0
100.
0 10
2
0 0
75.3
1
85
0 45
.7
50
0 2
17.9
7.
34
61.5
19
9 0
DN
M2
80.0
0.
0 8.
9 96
.0
1 1
10
80
70.6
2
90
0 19
.1
10
50
1 18
.7
0 50
.3
228
0 D
YM
3 70
.0
0.0
21.1
10
0.0
50
2 0
0 85
.8
1 95
30
18
.3
30
60
2 15
.8
0 27
.6
297
0 D
YM
5 1.
1 0.
0 78
.9
55.9
14
0-
3 0
5 78
.6
1 40
10
38
.1
50
50
1 14
.5
7.29
74
.6
106
0 FM
M1
36.7
0.
0 37
.8
76.9
7
0 0
0 44
.8
3 95
25
12
2 90
0
4 13
0
76.6
86
.3
0 FU
M2
68.9
0.
0 15
.6
91.7
12
0
0 0
88.9
2
90
15
122
85
0 4
12
0 93
.5
58.8
0
GSM
3 8.
9 0.
0 0.
0 97
.9
16
0-4
0 2
77.5
2
10
10
61
62.5
15
4
16
0 62
.3
214
0 H
DM
1 67
.8
0.0
0.0
93.9
3
1 5
0 76
.5
2 15
10
4.
57
55
60
3 16
.2
7.2
71.8
18
5 0
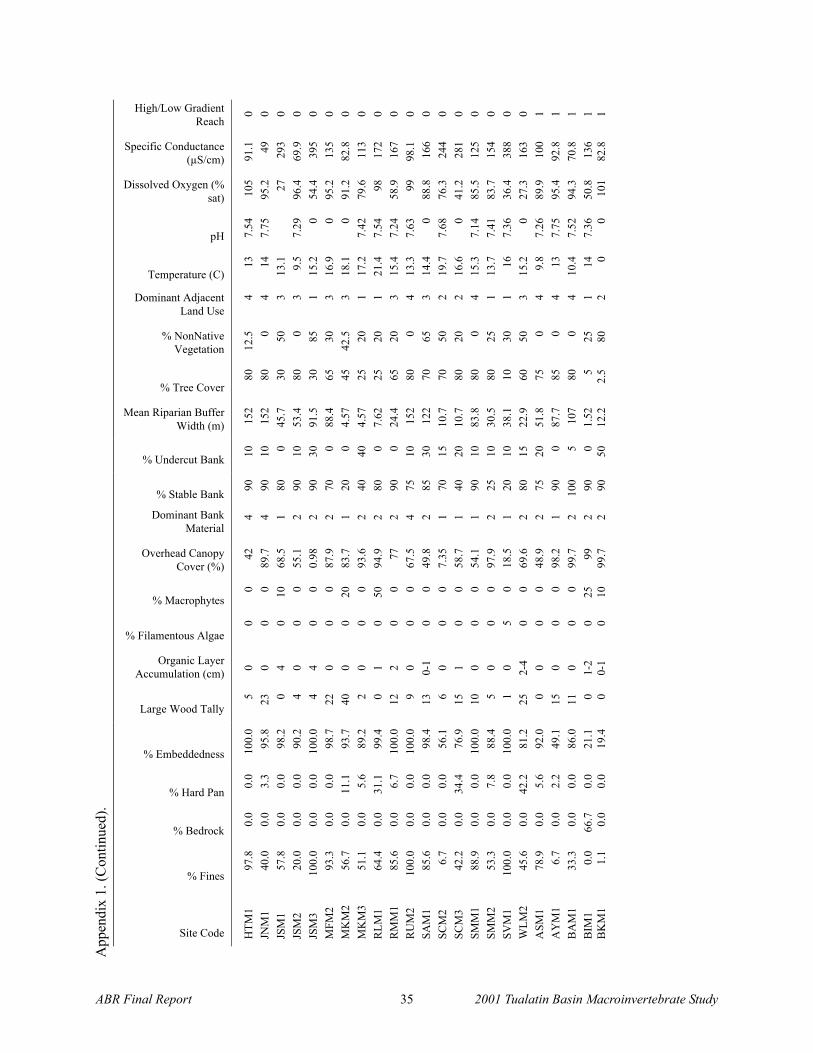
ABR Final Report 35 2001 Tualatin Basin Macroinvertebrate Study
App
endi
x 1.
(Con
tinue
d).
Site Code
% Fines
% Bedrock
% Hard Pan
% Embeddedness
Large Wood Tally
Organic Layer Accumulation (cm)
% Filamentous Algae
% Macrophytes
Overhead Canopy Cover (%)
Dominant Bank Material
% Stable Bank
% Undercut Bank
Mean Riparian Buffer Width (m)
% Tree Cover
% NonNative Vegetation
Dominant Adjacent Land Use
Temperature (C)
pH
Dissolved Oxygen (% sat)
Specific Conductance (µS/cm)
High/Low Gradient Reach
HTM
1 97
.8
0.0
0.0
100.
0 5
0 0
0 42
4
90
10
152
80
12.5
4
13
7.54
10
5 91
.1
0 JN
M1
40.0
0.
0 3.
3 95
.8
23
0 0
0 89
.7
4 90
10
15
2 80
0
4 14
7.
75
95.2
49
0
JSM
1 57
.8
0.0
0.0
98.2
0
4 0
10
68.5
1
80
0 45
.7
30
50
3 13
.1
27
29
3 0
JSM
2 20
.0
0.0
0.0
90.2
4
0 0
0 55
.1
2 90
10
53
.4
80
0 3
9.5
7.29
96
.4
69.9
0
JSM
3 10
0.0
0.0
0.0
100.
0 4
4 0
0 0.
98
2 90
30
91
.5
30
85
1 15
.2
0 54
.4
395
0 M
FM2
93.3
0.
0 0.
0 98
.7
22
0 0
0 87
.9
2 70
0
88.4
65
30
3
16.9
0
95.2
13
5 0
MK
M2
56.7
0.
0 11
.1
93.7
40
0
0 20
83
.7
1 20
0
4.57
45
42
.5
3 18
.1
0 91
.2
82.8
0
MK
M3
51.1
0.
0 5.
6 89
.2
2 0
0 0
93.6
2
40
40
4.57
25
20
1
17.2
7.
42
79.6
11
3 0
RLM
1 64
.4
0.0
31.1
99
.4
0 1
0 50
94
.9
2 80
0
7.62
25
20
1
21.4
7.
54
98
172
0 R
MM
1 85
.6
0.0
6.7
100.
0 12
2
0 0
77
2 90
0
24.4
65
20
3
15.4
7.
24
58.9
16
7 0
RU
M2
100.
0 0.
0 0.
0 10
0.0
9 0
0 0
67.5
4
75
10
152
80
0 4
13.3
7.
63
99
98.1
0
SAM
1 85
.6
0.0
0.0
98.4
13
0-
1 0
0 49
.8
2 85
30
12
2 70
65
3
14.4
0
88.8
16
6 0
SCM
2 6.
7 0.
0 0.
0 56
.1
6 0
0 0
7.35
1
70
15
10.7
70
50
2
19.7
7.
68
76.3
24
4 0
SCM
3 42
.2
0.0
34.4
76
.9
15
1 0
0 58
.7
1 40
20
10
.7
80
20
2 16
.6
0 41
.2
281
0 SM
M1
88.9
0.
0 0.
0 10
0.0
10
0 0
0 54
.1
1 90
10
83
.8
80
0 4
15.3
7.
14
85.5
12
5 0
SMM
2 53
.3
0.0
7.8
88.4
5
0 0
0 97
.9
2 25
10
30
.5
80
25
1 13
.7
7.41
83
.7
154
0 SV
M1
100.
0 0.
0 0.
0 10
0.0
1 0
5 0
18.5
1
20
10
38.1
10
30
1
16
7.36
36
.4
388
0 W
LM2
45.6
0.
0 42
.2
81.2
25
2-
4 0
0 69
.6
2 80
15
22
.9
60
50
3 15
.2
0 27
.3
163
0 A
SM1
78.9
0.
0 5.
6 92
.0
0 0
0 0
48.9
2
75
20
51.8
75
0
4 9.
8 7.
26
89.9
10
0 1
AY
M1
6.7
0.0
2.2
49.1
15
0
0 0
98.2
1
90
0 87
.7
85
0 4
13
7.75
95
.4
92.8
1
BA
M1
33.3
0.
0 0.
0 86
.0
11
0 0
0 99
.7
2 10
0 5
107
80
0 4
10.4
7.
52
94.3
70
.8
1 B
IM1
0.0
66.7
0.
0 21
.1
0 1-
2 0
25
99
2 90
0
1.52
5
25
1 14
7.
36
50.8
13
6 1
BK
M1
1.1
0.0
0.0
19.4
0
0-1
0 10
99
.7
2 90
50
12
.2
2.5
80
2 0
0 10
1 82
.8
1
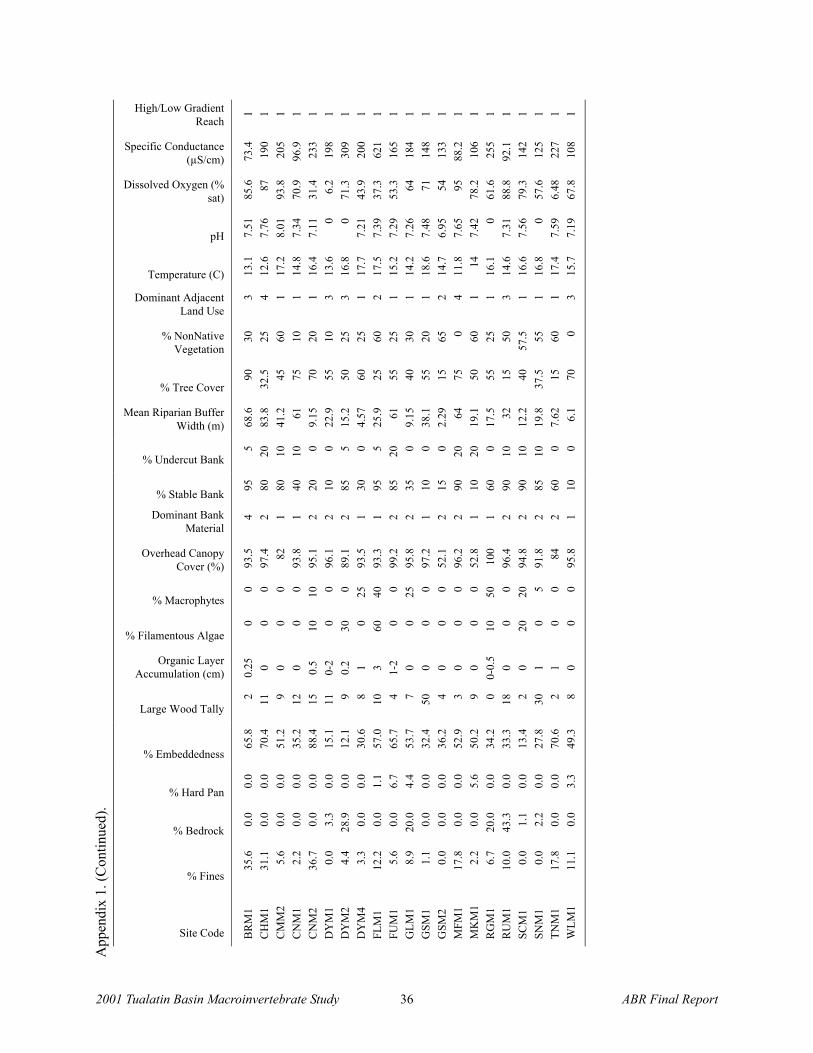
2001 Tualatin Basin Macroinvertebrate Study 36 ABR Final Report
App
endi
x 1.
(Con
tinue
d).
Site Code
% Fines
% Bedrock
% Hard Pan
% Embeddedness
Large Wood Tally
Organic Layer Accumulation (cm)
% Filamentous Algae
% Macrophytes
Overhead Canopy Cover (%)
Dominant Bank Material
% Stable Bank
% Undercut Bank
Mean Riparian Buffer Width (m)
% Tree Cover
% NonNative Vegetation
Dominant Adjacent Land Use
Temperature (C)
pH
Dissolved Oxygen (% sat)
Specific Conductance (µS/cm)
High/Low Gradient Reach
BR
M1
35.6
0.
0 0.
0 65
.8
2 0.
25
0 0
93.5
4
95
5 68
.6
90
30
3 13
.1
7.51
85
.6
73.4
1
CH
M1
31.1
0.
0 0.
0 70
.4
11
0 0
0 97
.4
2 80
20
83
.8
32.5
25
4
12.6
7.
76
87
190
1 C
MM
2 5.
6 0.
0 0.
0 51
.2
9 0
0 0
82
1 80
10
41
.2
45
60
1 17
.2
8.01
93
.8
205
1 C
NM
1 2.
2 0.
0 0.
0 35
.2
12
0 0
0 93
.8
1 40
10
61
75
10
1
14.8
7.
34
70.9
96
.9
1 C
NM
2 36
.7
0.0
0.0
88.4
15
0.
5 10
10
95
.1
2 20
0
9.15
70
20
1
16.4
7.
11
31.4
23
3 1
DY
M1
0.0
3.3
0.0
15.1
11
0-
2 0
0 96
.1
2 10
0
22.9
55
10
3
13.6
0
6.2
198
1 D
YM
2 4.
4 28
.9
0.0
12.1
9
0.2
30
0 89
.1
2 85
5
15.2
50
25
3
16.8
0
71.3
30
9 1
DY
M4
3.3
0.0
0.0
30.6
8
1 0
25
93.5
1
30
0 4.
57
60
25
1 17
.7
7.21
43
.9
200
1 FL
M1
12.2
0.
0 1.
1 57
.0
10
3 60
40
93
.3
1 95
5
25.9
25
60
2
17.5
7.
39
37.3
62
1 1
FUM
1 5.
6 0.
0 6.
7 65
.7
4 1-
2 0
0 99
.2
2 85
20
61
55
25
1
15.2
7.
29
53.3
16
5 1
GLM
1 8.
9 20
.0
4.4
53.7
7
0 0
25
95.8
2
35
0 9.
15
40
30
1 14
.2
7.26
64
18
4 1
GSM
1 1.
1 0.
0 0.
0 32
.4
50
0 0
0 97
.2
1 10
0
38.1
55
20
1
18.6
7.
48
71
148
1 G
SM2
0.0
0.0
0.0
36.2
4
0 0
0 52
.1
2 15
0
2.29
15
65
2
14.7
6.
95
54
133
1 M
FM1
17.8
0.
0 0.
0 52
.9
3 0
0 0
96.2
2
90
20
64
75
0 4
11.8
7.
65
95
88.2
1
MK
M1
2.2
0.0
5.6
50.2
9
0 0
0 52
.8
1 10
20
19
.1
50
60
1 14
7.
42
78.2
10
6 1
RG
M1
6.7
20.0
0.
0 34
.2
0 0-
0.5
10
50
100
1 60
0
17.5
55
25
1
16.1
0
61.6
25
5 1
RU
M1
10.0
43
.3
0.0
33.3
18
0
0 0
96.4
2
90
10
32
15
50
3 14
.6
7.31
88
.8
92.1
1
SCM
1 0.
0 1.
1 0.
0 13
.4
2 0
20
20
94.8
2
90
10
12.2
40
57
.5
1 16
.6
7.56
79
.3
142
1 SN
M1
0.0
2.2
0.0
27.8
30
1
0 5
91.8
2
85
10
19.8
37
.5
55
1 16
.8
0 57
.6
125
1 TN
M1
17.8
0.
0 0.
0 70
.6
2 1
0 0
84
2 60
0
7.62
15
60
1
17.4
7.
59
6.48
22
7 1
WLM
1 11
.1
0.0
3.3
49.3
8
0 0
0 95
.8
1 10
0
6.1
70
0 3
15.7
7.
19
67.8
10
8 1

ABR Final Report 37 2001 Tualatin Basin Macroinvertebrate Study
Appendix 2. Metrics calculated from macroinvertebrate communities sampled from 37 low-gradient stream reaches in the Tualatin River basin, Oregon, fall 2001. Reaches with two digits following the three-letter site code are duplicate samples.
Site Code
Taxa Richness
EPT Richness
%
Chironom
idae
% M
olluska
% O
ligochaeta
% D
ominant
% Tolerant
% Sedim
ent Tolerant
Modified H
BI
Overall R
ank
ASM2 15 1 24.5 62.5 10.6 34 93 73 6.6 13.3 BCM1 11 0 2.3 81.1 9.1 41 75 69 6.9 13.0 BRM2 22 2 29.1 36.9 19.9 20 80 57 6.6 8.0 BUM1 14 0 0.8 45.2 9.8 41 92 50 6.3 11.8 BUM2 10 0 47.5 7.9 27.1 38 92 35 7.4 12.5 CDM1 20 2 53.3 19.3 19.1 46 90 38 6.5 10.3 CDM2 16 0 25.5 56.6 15.4 45 95 71 6.4 14.2 CHM2 12 0 83.6 7.5 0.5 71 89 8 9.3 15.0 CLM1 14 0 7.6 32.6 29.9 30 74 63 6.9 10.3 CMM1 19 1 22.3 48.5 15.6 43 85 64 7.8 13.3 CNM3 16 2 31.0 17.0 21.0 21 42 37 6.4 5.3 DNM1 17 0 7.6 71.8 9.5 53 96 81 5.9 15.8 DNM2 14 0 26.4 48.4 18.3 45 96 67 7.1 15.3 DYM3 10 0 7.5 57.5 25.8 48 87 83 7.2 16.8 DYM5 17 4 25.7 43.2 3.9 33 70 48 5.1 6.7 FMM1 13 0 2.0 83.9 10.7 52 97 92 6.5 18.2 FUM2 13 0 8.4 82.2 7.6 67 90 90 5.6 16.7 GSM3 13 1 50.0 22.9 8.6 46 41 31 6.1 7.5 HDM1 25 1 7.2 59.4 12.3 44 87 72 7.2 12.7 HTM1 16 2 63.5 29.1 0.0 35 60 29 7.1 7.5 JNM1 16 1 48.2 11.0 38.2 38 50 49 5.0 7.0 JSM1 22 1 44.1 52.2 0.7 52 68 53 7.3 11.3 JSM21 15 0 47.3 26.0 6.2 38 79 32 8.2 11.0 JSM22 15 0 37.0 29.8 8.8 28 77 39 7.8 12.8 JSM3 9 0 23.0 38.5 31.1 31 85 57 7.5 14.5 MFM2 12 0 76.6 10.0 10.4 47 96 20 8.5 5.3 MKM2 18 2 37.7 23.8 20.0 27 59 43 5.7 11.5 MKM3 10 1 4.5 43.8 26.8 27 88 71 6.1 12.2 RLM1 15 0 7.4 30.9 28.7 32 94 59 6.7 17.2 RMM1 11 0 7.7 72.5 16.2 57 89 89 6.5 21.5 RUM2 9 0 4.2 76.9 13.5 77 96 91 7.7 9.2 SAM1 18 1 33.9 49.7 7.8 28 77 57 6.8 14.3 SCM21 20 1 10.9 79.1 1.0 64 83 80 6.4 4.8 SCM22 23 3 19.2 67.5 0.6 50 75 68 6.4 20.0 SCM3 24 7 13.5 44.6 0.5 30 61 45 5.7 16.7 SMM1 8 0 6.1 73.5 0.0 62 98 74 7.6 18.8 SMM2 12 0 9.3 69.2 10.3 53 92 78 6.8 15.2 SVM1 13 0 0.6 94.2 2.2 54 96 93 6.7 13.3 WLM2 15 1 6.6 58.2 28.2 39 93 86 6.8 13.0
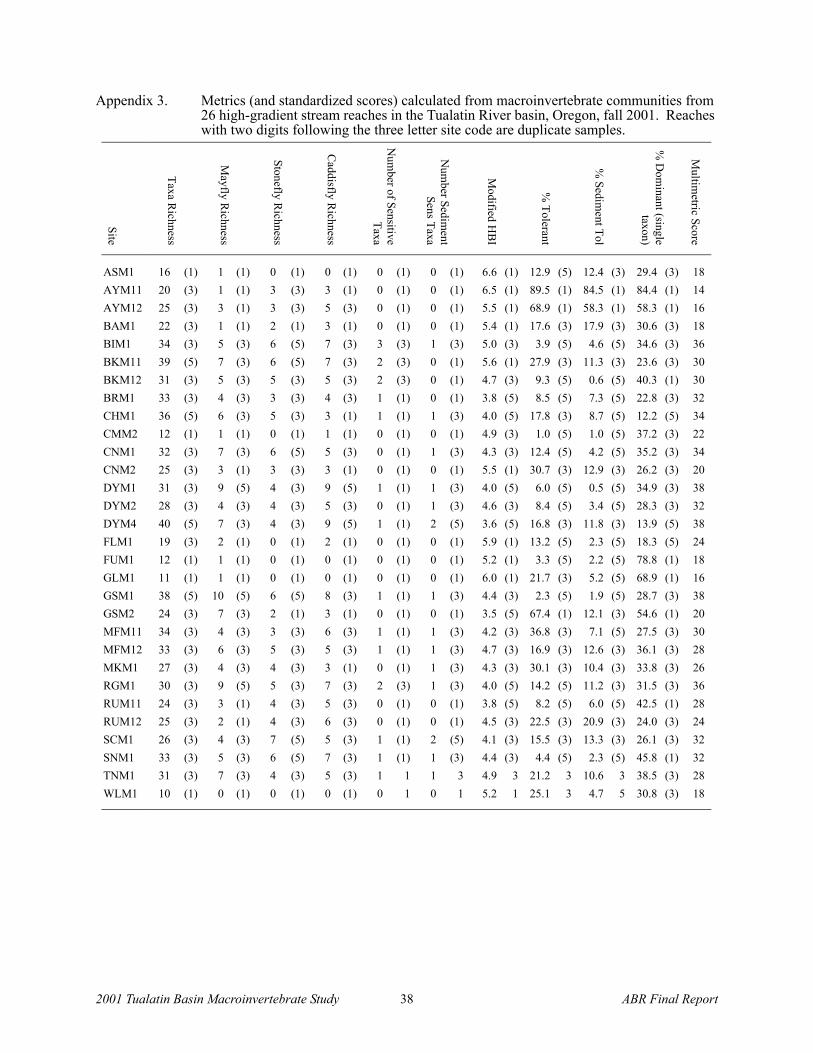
2001 Tualatin Basin Macroinvertebrate Study 38 ABR Final Report
Appendix 3. Metrics (and standardized scores) calculated from macroinvertebrate communities from 26 high-gradient stream reaches in the Tualatin River basin, Oregon, fall 2001. Reaches with two digits following the three letter site code are duplicate samples.
Site
Taxa Richness
Mayfly R
ichness
Stonefly Richness
Caddisfly R
ichness
Num
ber of Sensitive Taxa
Num
ber Sediment
Sens Taxa
Modified H
BI
% Tolerant
% Sedim
ent Tol
% D
ominant (single
taxon)
Multim
etric Score
ASM1 16 (1) 1 (1) 0 (1) 0 (1) 0 (1) 0 (1) 6.6 (1) 12.9 (5) 12.4 (3) 29.4 (3) 18 AYM11 20 (3) 1 (1) 3 (3) 3 (1) 0 (1) 0 (1) 6.5 (1) 89.5 (1) 84.5 (1) 84.4 (1) 14 AYM12 25 (3) 3 (1) 3 (3) 5 (3) 0 (1) 0 (1) 5.5 (1) 68.9 (1) 58.3 (1) 58.3 (1) 16 BAM1 22 (3) 1 (1) 2 (1) 3 (1) 0 (1) 0 (1) 5.4 (1) 17.6 (3) 17.9 (3) 30.6 (3) 18 BIM1 34 (3) 5 (3) 6 (5) 7 (3) 3 (3) 1 (3) 5.0 (3) 3.9 (5) 4.6 (5) 34.6 (3) 36 BKM11 39 (5) 7 (3) 6 (5) 7 (3) 2 (3) 0 (1) 5.6 (1) 27.9 (3) 11.3 (3) 23.6 (3) 30 BKM12 31 (3) 5 (3) 5 (3) 5 (3) 2 (3) 0 (1) 4.7 (3) 9.3 (5) 0.6 (5) 40.3 (1) 30 BRM1 33 (3) 4 (3) 3 (3) 4 (3) 1 (1) 0 (1) 3.8 (5) 8.5 (5) 7.3 (5) 22.8 (3) 32 CHM1 36 (5) 6 (3) 5 (3) 3 (1) 1 (1) 1 (3) 4.0 (5) 17.8 (3) 8.7 (5) 12.2 (5) 34 CMM2 12 (1) 1 (1) 0 (1) 1 (1) 0 (1) 0 (1) 4.9 (3) 1.0 (5) 1.0 (5) 37.2 (3) 22 CNM1 32 (3) 7 (3) 6 (5) 5 (3) 0 (1) 1 (3) 4.3 (3) 12.4 (5) 4.2 (5) 35.2 (3) 34 CNM2 25 (3) 3 (1) 3 (3) 3 (1) 0 (1) 0 (1) 5.5 (1) 30.7 (3) 12.9 (3) 26.2 (3) 20 DYM1 31 (3) 9 (5) 4 (3) 9 (5) 1 (1) 1 (3) 4.0 (5) 6.0 (5) 0.5 (5) 34.9 (3) 38 DYM2 28 (3) 4 (3) 4 (3) 5 (3) 0 (1) 1 (3) 4.6 (3) 8.4 (5) 3.4 (5) 28.3 (3) 32 DYM4 40 (5) 7 (3) 4 (3) 9 (5) 1 (1) 2 (5) 3.6 (5) 16.8 (3) 11.8 (3) 13.9 (5) 38 FLM1 19 (3) 2 (1) 0 (1) 2 (1) 0 (1) 0 (1) 5.9 (1) 13.2 (5) 2.3 (5) 18.3 (5) 24 FUM1 12 (1) 1 (1) 0 (1) 0 (1) 0 (1) 0 (1) 5.2 (1) 3.3 (5) 2.2 (5) 78.8 (1) 18 GLM1 11 (1) 1 (1) 0 (1) 0 (1) 0 (1) 0 (1) 6.0 (1) 21.7 (3) 5.2 (5) 68.9 (1) 16 GSM1 38 (5) 10 (5) 6 (5) 8 (3) 1 (1) 1 (3) 4.4 (3) 2.3 (5) 1.9 (5) 28.7 (3) 38 GSM2 24 (3) 7 (3) 2 (1) 3 (1) 0 (1) 0 (1) 3.5 (5) 67.4 (1) 12.1 (3) 54.6 (1) 20 MFM11 34 (3) 4 (3) 3 (3) 6 (3) 1 (1) 1 (3) 4.2 (3) 36.8 (3) 7.1 (5) 27.5 (3) 30 MFM12 33 (3) 6 (3) 5 (3) 5 (3) 1 (1) 1 (3) 4.7 (3) 16.9 (3) 12.6 (3) 36.1 (3) 28 MKM1 27 (3) 4 (3) 4 (3) 3 (1) 0 (1) 1 (3) 4.3 (3) 30.1 (3) 10.4 (3) 33.8 (3) 26 RGM1 30 (3) 9 (5) 5 (3) 7 (3) 2 (3) 1 (3) 4.0 (5) 14.2 (5) 11.2 (3) 31.5 (3) 36 RUM11 24 (3) 3 (1) 4 (3) 5 (3) 0 (1) 0 (1) 3.8 (5) 8.2 (5) 6.0 (5) 42.5 (1) 28 RUM12 25 (3) 2 (1) 4 (3) 6 (3) 0 (1) 0 (1) 4.5 (3) 22.5 (3) 20.9 (3) 24.0 (3) 24 SCM1 26 (3) 4 (3) 7 (5) 5 (3) 1 (1) 2 (5) 4.1 (3) 15.5 (3) 13.3 (3) 26.1 (3) 32 SNM1 33 (3) 5 (3) 6 (5) 7 (3) 1 (1) 1 (3) 4.4 (3) 4.4 (5) 2.3 (5) 45.8 (1) 32 TNM1 31 (3) 7 (3) 4 (3) 5 (3) 1 1 1 3 4.9 3 21.2 3 10.6 3 38.5 (3) 28 WLM1 10 (1) 0 (1) 0 (1) 0 (1) 0 1 0 1 5.2 1 25.1 3 4.7 5 30.8 (3) 18