assessment of methane hazards in an anomalous … of investigations 8861 assessment of methane...
TRANSCRIPT

Bureau of Mines Report of lnvestigations/l984
Assessment of Methane Hazards in an Anomalous Zone of a Gulf Coast Salt Dome
By A. T. lannacchione, R. H. Grau, Ill, A. Sainato, T . M . Kohler, and S. J. Schatzel
UNITED STATES DEPARTMENT OF THE INTERIOR

Report of Investigations 8861
Assessment of Methane Hazards in an Anomalous Zone of a Gulf Coast Salt Dome
By A. T. lannacchione. R . H. Grau, Ill, A. Sainato, T. M. Kohler, and S. J. Schatzel
UNITED STATES DEPARTMENT OF THE INTERIOR William P. Clark, Secretary
BUREAU OF MINES Robert C. Horton, Director

Library of Congress Cataloging in Publ icat ion Data:
A s s e s s m e n t of m e t h a n e h a z a r d s i n a n a n o m a l o u s z o n e o f a Gulf C o a s t s a l t dome ,
( R e p o r t of i n v e s t i g a t i o n s ; 886 1)
B ib l iog raphy : p. 26.
Supt. o f D o c s . no.: I 28.23:8861.
1. S a l t m i n e s a n d mining-Gulf S t a t e s - S a f e t y m e a s u r e s . 2. Meth- ane -Sa fe ty m e a s u r e s . 3. S a l t domes-Gulf S t a t e s . I. I a n n a c c h i o n e , Anthony T. 11. S e r i e s : Kepor t of i n v e s t i g a t i o n s ( U n i t e d S t a t e s . Bu- r e a u of Mines ) ; 8861.
TN23,U43 [TN902.A 11 622s [622'.8] 83-60037 1
*

CONTENTS
Abstract ....................................................................... 1 Introduction 7 ................................................................... Methane in domal salt mines .................................................... 2 Geologic and engineering considerations ...................................... 2 Occurrence of anomalous zones ................................................ 4 The outburst problem ......................................................... 5
Investigations of anomalous zone at Belle Isle Mine ............................ 4 Emissions from blasted faces in adjacent normal salt ......................... 5 Methane emission study through an anomalous zone ............................. 8
..................................... Exploratory drilling into anomalous zone 19 ............................ Discussions of potential methane control stl-atr-gies 23 Identification. delineation. and orientation of a gassy anomalous zone ....... 2 3
............................. Determining the severity of the potential hazard 2 3 ............................... Special mine-through procedures and techniques 2 4 Summary and conclusions ........................................................ 25 References ..................................................................... 26
ILLUSTRATIONS
Plan and cross-sectional view of study area within Belle Isle salt mine .. Sequence of events associated with typical outburst triggered by blasting . Pneumatically operated sequential gas sampler designed to collect ambient .................................... air samples during and after blasting Pneumatic gravity switch and gas-sampling unit ............................
............................. Location of sequential gas sampler test sites Gas concentrations from test site 1 ...................................Om.. Gas concentrations from test site 2 ....................................... Low-production-grade (wet-argillaceous) salt within anomalous zone of the decline . . . . . . . . . . . . . . . . . . . . . . . . . . . . . . . . . . . . . . . . . . . . . . . . . . . . . . . . . . . . . . . . . . Plan view of location of anomalous zone and various positions of decline face during emissions study .............................................. Cross-sectional view of advancing face of the decline with ventilation ............................. pattern and position of monitoring equipment Methane sensor and sonic anemometer within exhaust duct ................... Vacuum pump and methane sensor for collecting and measuring methane con- centration in exhaust duct ............................................... Intake-air methane sensor ................................................. Location and concentration of methane contents from salt samples collected in decline area ..........................................................
Amount of methane emitted per day for 47 production dates from March 30 to July 3 ................................................................... 13 Salt production rate from decline as a function of salt hauled versus pro- duction time ............................................................. 14 Strip chart recording from methane sensor and sonic anemometer within ex- haust duct . Notice the correlation between methane concentration and anomalous responses from the sonic anemometer ............................ 14 Calculated methane emission rates per ton of salt produced from the de- cline face from March 30 to July 3 . . . . . . . . . . . . . . . . . . . . . . . . . . . . . . . . . . . . . . . 15 .............. Area within the decline where banding is parallel with entry 16 ............. Plan view of face areas where methane emissions were detected 17

Page
Strip chart recordings from entry and exhaust duct sensors showing similar methane concentrations.................~~.................................. 18 Strip chart recording from a nonproduction weekend........ ................ 18 Strip chart recording of methane concentration measured at relative air velocities within exhaust duct ....................................... 19 Equipment assembly for exploratory drilling in study area................. 20 ..... Salt core recovered from exploratory drill holes..................... 20 Location of three exploratory drill holes on 1,400-ft level and their position relative to anomalous zone.......................... ............ 20 Gas flow from hole 2...... ................................................ 21 Gas-pressure buildup in holes 2 and 3 after encountering anomalous zone... 22
TABLES
- h - a ly s i s of gas samples collected from blasted faces... ................... 7 Average CH4 contents of cores from normal salt and transitional zone, and rib samples from anomalous zone.......................................... 21
Gas analysis from drill hole 2. ........................................... 21
UNIT OF MEASURE ABBREVIATIONS USED IN THIS REPORT
cm centimeter m3 cubic meter
cm3 cubic centimeter m/min meter per minute
cm3/100g cubiccentimeterper m3/d cubic meter per day one hundred grams
m3 /h cubic meter per hour f t foot
m3/t cubic meter per metric ton f t/min foot per minute
mi mile ft3 cubic foot
min minute f t3/d cubic foot per day
min/d minute per day f t3/h cubic foot per hour
kPa kilopascal ft3/ton cubic foot per short ton
PPm part per million g gram
Pet percent h hour
~ s i g pound per square inch, in inch gage
. km kilometer s second
m meter t metric ton

ASSESSMENT OF METHANE HAZARDS IN AN ANOMALOUS ZONE OF A G U L F COAST SALT DOME
By A. T. lannacchione, Re H. Grau A. ~ainato,~ T. M. Kohler, and S. J. Schatzel
ABSTRACT
This Bureau of Mines research study found gas emission rates from an advancing face, and flows and pressure of gas from an exploration drill hole were dependent upon the geology of salt encountered in a domal salt mine. Normal production-grade "pure" salt adjacent to an anoma- lous'zone was found to have a methane emission rate of less than 5 ft3/ ton (0.1 m3/t) of mined salt from a room advanced by a continuous miner. Extremely low gas flows [less the 4 ft3/h (0.1 m3/h)] and lack of pressure buildup were also observed from this normal salt in a 154- ft (47-m) exploration drill hole. These data indicate that methane emissions should not be a problem when mining in this type of salt.
In the adjacent anomalous zone, methane emission rates ranged from 15 to 70 ft3/ton (0.4 to 1.8 m3/t) of mined salt from an advancing face. Gas flows of approximately 42 ft3/h (1.2 m3/h), and pressures in excess of 900 psig (6,200 kPa) were observed in an exploration drill hole when the anomalous zone was encountered. This information suggests a great- er methane emission hazard from the anomalous zone than from the asso- ciated normal salt. If this trend of increasing emissions problems as- sociated with anomalous zones of salt is common with similar anomalous zones encountered or observed in other domal salt mines, then special control strategies should be employed to minimize this potential mining hazard.
l~eologist. inin in^ engineer. 3~ining engineering technician. Pittsburgh Research Center, Bureau of Mines, Pittsburgh, PA.

INTRODUCTION
T h i s Bureau of Mines s t u d y i s an a s - sessment of t h e p o t e n t i a l methane haza rd t o mining of an anomalous zone i n a L o u i s i a n a domal s a l t mine. D e t a i l e d geo- l o g i c mapping, emiss ions s t u d i e s , phys- i c a l p r o p e r t i e s t e s t s r e l a t e d t o g a s , and methane c o n t e n t of s a l t samples from an anomalous zone encoun te red a t t h e B e l l e I s l e Mine a r e p r e s e n t e d and p rov ide a b a s i s f o r d i s c u s s i o n of a c o n t r o l s t r a t - egy f o r t h i s p a r t i c u l a r problem a r e a ( f i g . 1) .
Although methane (CH4) has long been recogn ized a s a haza rd i n c o a l min- i n g , t h e danger i t poses i n domal s a l t mines h a s on ly r e c e n t l y become a p p a r e n t . Throughout t h e h i s t o r y of mining s a l t i n t h e Gulf Coast r e g i o n , hazardous meth-ane e m i s s i o n s have occur red a t i n f r e q u e n t in - t e r v a l s . The i n c o n s i s t e n t n a t u r e of t h e methane problem has d e t r a c t e d from t h e s e r i o u s n e s s of t h e haza rd and, conse- q u e n t l y , h indered t h e development of con- t r o l s t r a t e g i e s and p rocedures . Analo- g i e s can be drawn w i t h t h e e a r l y c o a l mining e x p e r i e n c e i n t h e Uni ted S t a t e s . P r i o r t o t h e F e d e r a l Coal Mine H e a l t h and S a f e t y Act of 1969, c o a l mines could be
c l a s s i f i e d a s e i t h e r gassy o r nongassy. However, h i s t o r y has shown some of t h e wors t coal mine methane-induced exp lo - s i o n s have occur red i n mines o r i g i n a l l y c l a s s i f i e d a s "nongassy" (1) .4
R e c e n t l y . new b l a s t i n g t e c h n i q u e s , deeper mining l e v e l s , and h i g h e r e x t r a c - t i o n r a t e s have i n c r e a s e d t h e f requency of hazardous methane occur rences . These occur rences have sometimes been mani- f e s t e d a s v i o l e n t o u t b u r s t s of methane and s a l t . O u t b u r s t s a r e g e n e r a l l y a sso- c i a t e d w i t h b l a s t i n g . but occur only i n a s m a i i f r a c t i o n of t h e t o t a i number of f a c e s . However, t h e s e hazardous methane emiss ions have o f t e n occur red i n groups and a r e sometimes a s s o c i a t e d w i t h i n r e g i o n s o r s p e c i f i c zones w i t h i n s e v e r a l of t h e domal s a l t mines.
T h i s r e p o r t shows an a s s o c i a t i o n of a methane occur rence w i t h c e r t a i n s a l t c h a r a c t e r i s t i c s . The r e c o g n i t i o n and p r e d i c t i o n of t h e s e a r e a s can reduce t h e p o t e n t i a l f o r hazardous methane emiss ion problems by deve lop ing s p e c i a l c o n t r o l p rocedures and t echn iques .
METHANE I N DOMAL SALT FiINES
The unique g e o l o g i c and p h y s i c a l char- a c t e r i s t i c s of domal s a l t mines have i n - f luenced t h e occur rence of hazardous methane c o n d i t i o n s . P rev ious i n v e s t i g a - t i o n s (2-6) have determined some of t h e - - c h a r a c t e r i s t i c s of a v i o l e n t o u t b u r s t of s a l t , which o f t e n r e s u l t s i n hazardous methane c o n d i t i o n s . Our i n v e s t i g a t i o n d e a l s w i t h t h e occur rence and c h a r a c t e r - i s t i c s of some t y p e s of g a s s y s a l t . The s e c t i o n s t h a t f o l l o w w i l l examine some of t h e g e o l o g i c and p h y s i c a l p r o p e r t i e s as- s o c i a t e d w i t h g a s s y s a l t and propose a c o n t r o l s t r a t e g y f o r t h i s p o t e n t i a l h a z a r d .
GEOLOGIC AND ENGINEERING CONSIDERATIONS
s t o c k s range i n d iamete r from 1 t o 5 m i (2 t o 8 kin). Dome f l a n k s vary from v e r t i c a l t o i n c l i n e d w i t h s h a r p t o grada- t i o n a l c o n t a c t s w i t h coun t ry rock ( 7 ) . -
S a l t bands w i t h t h i c k n e s s r ang ing from 0.5 i n ( i cm) t o 3 f t ( 1 m), r e v e a l t h e dominant o r i e n t a t i o n s of a d i a p i r i c s t r u c t u r e . The s a l t w i t h i n t h e domes has been s o i n t e n s e l y f o l d e d t h a t t h e bands a r e n e a r l y v e r t i c a l ( 5 , 8-9). T h e r e f o r e , - - a s t h e mine deve lops 6 o r i z o n t a l l y , it ad- vances through band a f t e r band of n e a r l y v e r t i c a l l y bedded s a l t . M u l t i p l e - l e v e l development should p e n e t r a t e s i m i l a r l ay - e r s of s a l t a t t h e same r e l a t i v e l o c a - t i o n (depending on t h e d i p of t h e bands) .
S a l t domes of t h e Gulf Coast r e g i o n 4 ~ n d e r l i n e d numbers i n p a r e n t h e s e s r e - have e l l i p t i c a l o r c i r c u l a r shapes and f e r t o i t e m s i n t h e l i s t of r e f e r e n c e s a t t a p e r a t dep th . Tops of i n d i v i d u a l s a l t t h e end of of t h i s r e p o r t .
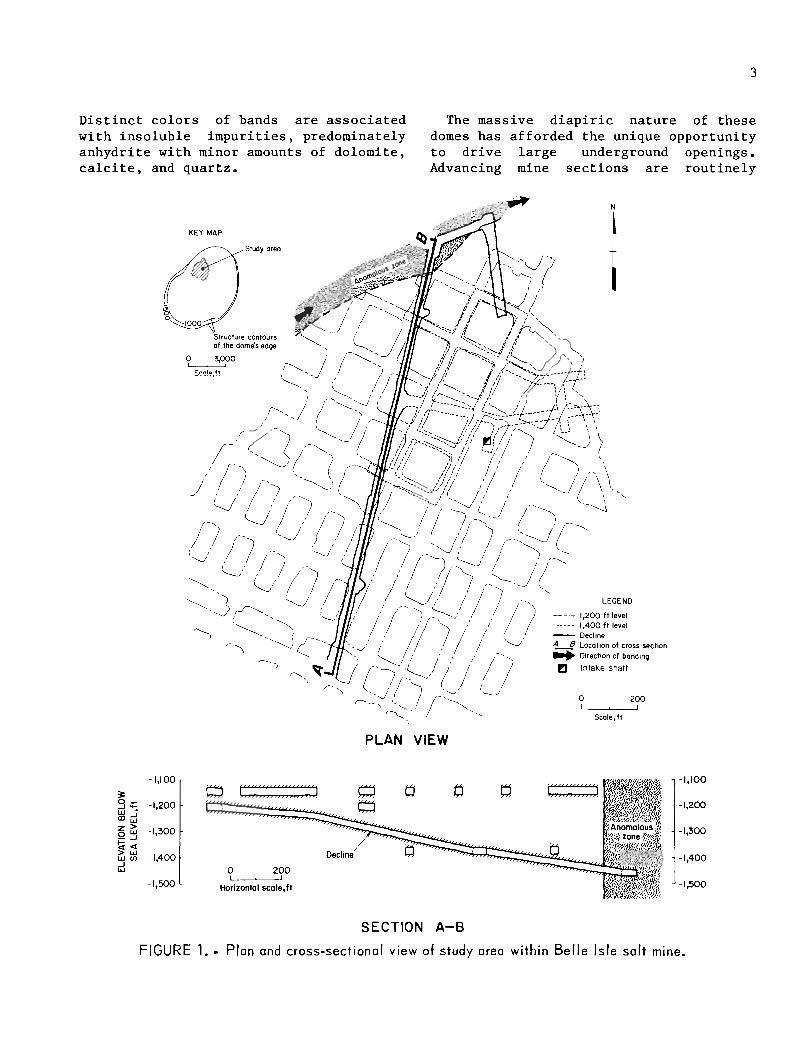
Distinct colors of bands are associated The massive diapiric nature of these with insoluble impurities, predominately domes has afforded the unique opportunity anhydrite with minor amounts of dolomite, to drive large underground openings. calcite, and quartz. Advancing mine sections are routinely
- 1,100 - c z z z 3 a u P
Decl~ne J W 200
O- -1,500 - Horizontol scale,ft
SECTION A-B
FIGURE 1. - Plan and cross-sectional view of study area within Bel le Isle salt mine.

developed by b l a s t i n g t o a h e i g h t of 35 domal s a l t mines opera ted i n sou the rn f t (11 m) and a width of 30 t o 100 f t (10 Louis iana. He has a l s o i n d i c a t e d t h a t t o 30 m). Benched a r e a s range from 60 t o o u t b u r s t s o f t e n occur a long l i n e a r zones 120 f t (20 t o 36 m) high. t h a t a r e a s s o c i a t e d wi th c l a s t i c s , l i q -
u i d s , g a s e s , f l u i d i n c l u s i o n s , shea r i ng , OCCURRENCE OF ANOMALOUS ZONES and abnormally dark s a l t .
Anomalous t ypes of s a l t , d i f f e r e n t i n THE OUTBURST PROBLEM composi t ion from normal s a l t (99 p c t pure h a l i t e ) , have been a s s o c i a t e d w i th min- Ou tbu r s t s , v i o l e n t exp los ions of s a l t - i n g problems. Zones of anomalous s a l t rock and gas r e l e a s e d under high pres - c an be i d e n t i f i e d from t h e more corn- s u r e , have been known t o occur w i t h i n mon normal s a l t by s e v e r a l of t h e fol low- domal s a l t mines f o r many years . The i n g c h a r a c t e r i s t i c s : ( 1 ) b r i n e and gas s e e p s , ( 2 ) presence of c l a s t i c mate r i - a l , ( 3 ) shea r i ng , ( 4 ) r e c r y s t a l l i z a t i o n , ( 5 j expansion j o i n t s , and ( 6 ) a s s o c i a t i o n w i t h o u t b u r s t s (10) . The anomalous s a l t zone of t h i s stu* i s c h a r a c t e r i z e d main- l y by f l u i d f l ows , predominently i n t h e form of methane gas and b r i n e , and t h e i n c r e a s e d occur rence of sands tone , s h a l e , and c l a y m a t e r i a l , caus ing t h e o v e r a l l s a l t mass t o appear dark i n co lo r .
The o r i g i n of t h e anomalous zones may be t i e d t o t h e concept t h a t s a l t domes c o n s i s t of many s t ocks o r s p i n e s of s a l t t h a t have r i s e n s e p a r a t e l y through t ime a t va ry ing r a t e s (10-11). -- The marginal a r e a s of t h e s e "sp ines" a r e de f i ned by c l a s t i c gouge m a t e r i a l , which is inc luded i n t o t h e s a l t core . It has been sug- g e s t e d t h a t t h e s p i n e s move upward a t d i f f e r e n t r a t e s , i n c o r p o r a t i n g t h e s p i n e s w i t h t h e i r a s s o c i a t e d anomalous zones i n t o t h e c e n t r a l p o r t i o n of t h e dome. Because many of t h e s e anomalous zones a r e comprised of count ry rock r i c h i n o rgan i c and i no rgan i c s o l i d s and l i q u i d s , they a r e recognized underground a s zones t h a t d i f f e r s i g n i f i c a n t l y from those of normal s a l t . Kupfer (11) has i d e n t i f i e d anomal- ous zones i n f o u r of t h e f i v e s i s t e r
a s s o c i a t i o n between o u t b u r s t s and l a r g e emiss ions of methane and o t h e r gases have been documented i n s e v e r a l r e p o r t s (2, 4-6). The hazard r e s u l t i n g from a r zp id - - r e l e a s e of l a r g e volumes of methane and t h e subsequent inunda t ion of an e n t i r e mine, which may l a s t s e v e r a l days , has induced much d i s c u s s i o n about t he r e s u l t - a n t danger and t h e p roper t echn iques t o s a f e l y and e f f e c t i v e l y d e a l w i t h i t .
It is g e n e r a l l y accepted t h a t o u t b u r s t s occur du r ing o r s h o r t l y a f t e r b l a s t i n g of a s a l t f a ce . Thoms (12) has implied t h a t t h e d r i v i n g f o r c e f o r a n o u t b u r s t i n s a l t i s entrapped gas . Other t h e o r i e s a t t r i - buted h igh rock s t r e s s e s a s t h e dominat- i n g f o r c e .
A s a l t o u t b u r s t c r e a t e s a c a v i t y i n t h e roof o r r i b a r e a t h a t g e n e r a l l y extends v e r t i c a l l y upward ( f i g . 2 ) . These open- i ngs range from 3 f t ( 1 m) t o 30 f t (10 m) i n d iamete r and 3 f t ( 1 m) t o g r e a t e r t han 70 f t (22 m) ' i n he igh t . Outburs t s observed a t t h e J e f f e r s o n I s l a n d Mine were i n t h e same r e l a t i v e p o s i t i o n a t both t h e 1 ,300-f t (400-m) and 1 ,500-f t (460-m) l e v e l s . Th is i s a t t r i b u t e d t o t h e nea r v e r t i c a l o r i e n t a t i o n of a very gassy zone of s a l t .
INVESTIGATIONS OF ANOMALOUS ZONE AT BELLE ISLE MINE
An anomalous zone w i t h i n t h e B e l l e and anomalous s a l t zones and (3 ) e v a l u a t e I s l e Mine was i n v e s t i g a t e d i n d e t a i l t o t h e u s e f u l n e s s of t h i s d a t a i n p r e d i c t i n g ( 1 ) c o r r e l a t e s p e c i f i c gas emiss ions w i th t h e l o c a t i o n of p o t e n t i a l problem a r e a s p a r t i c u l a r s a l t t y p e s , ( 2 ) compare physi- w i t h i n t h e mine. c a l p r o p e r t i e s r e l a t e d t o gas of normal

A B FIGURE 2. - Sequence of events associated
EMISSIONS FROM BLASTED FACES IN ADJACENT NORMAL SALT
Before presenting results of the emis- sions study conducted in the anomalous zone, we must understand the relative gas emissions experienced during typical pro- duction face advancement in the normal salt adjacent to the anomalous zone. Estimation of gas emissions from large blasted faces is complicated by the with- drawal of all personnel from the mine during blasting and lack of discernable persistent air currents within many face areas. Therefore, our results can be taken only as an indication of gas con- centrations after blasting. Two mine- face areas in normal salt adjacent to the anomalous zone were sampled immediately after a blast to determine the approxi- mate concentrations of gases present.
Gas sampling was accomplished by us- ing a permissible sequential gas sampler (fig. 3). This pneumatically operated device designed for this express purpose is actuated by the pressure wave from the face blast. The blast wave moves an air vane connected to a blast-operated switch (fig. 4) that initiates a timing sequence
wi th t yp ica l outburst tr iggered by blasting.
within a control box. Once the preset time is reached, a pneumatic signal is sent to the sampling unit (fig. 4 ) , which opens a pneumatically operated valve re- leasing liquid from the sample chamber so that ambient air can replace it. This system is designed to collect a series of gas samples at different time intervals. These samples can be analyzed at a later time . The sequential gas sampler was first
tested at a blasted face on the 1,400 ft (430 m) level approximately 650 ft (200 m) from the anomalous zone. Face dimen- sions were 26 ft (8 m) by 32 ft (10 m). Approximately 160 ft/min (49 m/min) of air was moving through the entry in which the sampler was placed (fig. 5). This entry is approximately 50 ft (15 m) from the blasted face area. During the face blast, the intake fan was deenergized to prevent damage by the overpressure wave from the blast. Approximately 5 to 10 s after the blast, the surface fan was turned on again. The blast caused the air to move from the face, up the intake shaft, then back down the shaft, and to recirculate past the sampler (fig. 6). The point of interest here is that

FIGURE 3. - Pneumatically operated sequen- tial gas sampler designed to collect ambient air samples during and after blasting.
maximum concentrations of methane de- tected in the air samples collected at the blasted face were less than 0.01 pct (table 1).
The second test of the sequential gas sampler was also conducted on the 1,400- ft (430-m) level but at a distance of ap- proximately 750 ft (230 m) from the anom- alous zone (fig. 5). The room dimensions were similar to those of test 1 [22 by 35 ft (7 by 11 m)], but the ventilating air currents were extremely slow. Smoke tube surveys at the sampling locations indi- cated a velocity of approximately 40 ft/ min (12 m/min). However, at other loca- tions within this face area, relative magnitudes and directions of air cur- rents varied. Analyses of the samples collected from the tests are shown in table 1. Figure 7 shows the change in
KEY
A Pneumotlcally operated actuator 6 Water f~lled sample chamber C Valve to recover sample for analysls D Valve for fllllng chamber w~th water E Blast-operated swltch F A I ~ vane G Support H Alr sw~tch 1 Pneurnat~cally operated valve J Alr supply llne K Alr control sqnal llne
J
FIGURE 4. - Pneumatic gravity switch and gas-sampling unit.
FIGURE 5. - Location of sequential gas sam- pler test sites.
concentrations of methane after the blast. The maximum methane concentration at the sampling location was found to be

0.004 p c t . The average methane concen- t r a t i o n f o r 30 min a f t e r t h e b l a s t was 0.003 p c t .
5 10 15 TIME, min
S u l f u r h e x a f l u o r i d e (SF6) was used a s a t r a c e r g a s i n bo th tests t o check t h e r e l i a b i l i t y of t h e sampl ing system. The
TABLE 1. - A n a l y s i s of gas samples c o l l e c t e d from b l a s t e d f a c e s
-- Sample I C H 4 , p c t I S F ~ , p c t I Time, s
TIME, min
TEST 1, NOV. 17, 1981
x 10-7 3.5 x 827
.0024 lo'9
FIGURE 6. - Gas concentrations from test s i te 1. FIGURE 7. - Gas concentrations from test si te 2.
4 5 6 7 8 9
1 0 11 12 13 14
.0024
.004
.002
.0019
.0028
.OO21
.0027 . 002
.0017
.001
.0009
5.57 x 10" 6.55 x 1 0 ' ~ 2.52 x lo'9 1.43 x 10" 5.65 x 10'1° 5.5 x 10"O 5 x 1.55 x 1 0 - l o 1.43 x 10-lo 1.1 x 10⁻¹° 3 . 0 5 ~ 10- lo
156 275 460 657 832 996
3,060 3,420 4,020 4,320 5,100

SF6 was placed i n p l a s t i c bags and se- cured t o t h e f ace before b l a s t i n g . The b l a s t rup tured the bags, r e l e a s i n g t h e t r a c e r gas . F igures 6 and 7 show corre- sponding peaks of SFs concen t r a t i on w i th methane concen t r a t i on a t both t e s t s i t e s . Th i s information is shown simply a s a check on t h e gas concent ra t ion da t a .
Although t h e s e two tests a r e not con- c l u s i v e , t he d a t a do show t h a t extremely low gas emissions were found during b l a s t i n g of normal s a l t loca ted ad j acen t t o t h e anomalous zone.
METHANE EMISSION STUDY THROUGH AN ANOMALOUS ZONE
I n v e s t i g a t i o n s conducted i n t h e Be l l e I s l e Mine d e c l i n e a r e a have shown t h a t much h igher methane emission r a t e s a r e a s s o c i a t e d w i th anomalous zones of s a l t t han those emission r a t e s determined f o r
normal s a l t . The d e c l i n e was advanced from normal product ion grade s a l t i n t o a "low product ion grade" (wet-argi l laceous) s a l t ( f i g . 8). then back aga in i n t o t h e normal s a l t ( f i g . 9 ) . This a r e a of low- grade s a l t has been i n t e r p r e t e d a s an anomalous zone, us ing t h e c h a r a c t e r i s t i c s def ined by Kupfer (10). This s tudy s i te , t h e r e f o r e , provided<n e x c e l l e n t opportu- n i t y t o determine s p e c i f i c changes i n emission r a t e s with changing geology.
Methane emission d a t a from advancing f aces i n domal s a l t mines a r e v i r t u a l l y nonexis tcn t because of t he g r e a t d i f f i - c u l t y i n measuring v e n t i l a t i o n p a t t e r n s i n l a r g e c ros s - sec t iona l rooms with low a i r v e l o c i t i e s . The advancing f ace i n t h e d e c l i n e possessed t h e advantages of a r e l a t i v e l y small room s i z e [13 f t by 30 f t ( 4 m by 9 m) 1 and a well-defined ven- t i l a t i o n p a t t e r n from a 30-in r i g i d ex- haus t duct ( f i g . 10) t o remove a i r from
FIGURE 8. - Lo~-~roduct ion-~rode (wet-argillaceous) salt within anomalous zone of the decline.

4-' Location of camera used in figures 7, /3, /4, /5, and /9
Direction of banding
FIGURE 9. - Plan view of location of anomalous zone and various positions of decline face during emissions study.
the face. Also, the face was driven by a continuous miner as opposed to a conven- tional mining system. Conventional min- ing, with the use of explosives to blast production faces, prevents emission-rate studies because of the short-term disrup- tion of low-velocity air currents by pressure waves from the blast. The use of the continuous-mining system did not disrupt ventilation patterns.
A monitoring system capable of record- ing velocity and methane concentrations was placed in the exhaust duct (fig. 11). An additional methane-sampling system, composed of a vacuum pump and methane sensor (fig. 12), withdrew a gas sample
from the duct for comparison with the methane concentration recorded by the other sensor located in the duct, Fresh air was sampled from a third position to determine intake-air quality (fig. 13). Periodically, gas samples were collected in evacuated tubes for chromatagraphic determination of gas concentrations. Al- so, numerous ventilation surveys were conducted to determine average velocities and air quantities within the study area.
The salt within the anomalous zone study area is dark, argillaceous, wet and gassy. Dissolution analysis conducted by Schatzel and Hyman (13) showed the meth- ane content to average approximately 0.33

,Rigid exhaust
/ Convey
belt
Methane sensor and sonic anemometer (installed within exhaust duct)
control box
0 50 Continuous/ '-y
Methane sensors
control box
0 50 Continuous/ '-y - miner Scale, f t LEGEND Advancing - Intake air face - Exhaust air
FIGURE 10. - Cross-sectional view of advancing face of the decline wi th ventilation pattern and
position of monitoring equipment.
FIGURE 11. - Methane sensor and sonic anemometer within exhaust duct.

i Mei , &_
FIGURE 12. - Vacuum pump and methane sensor for col lect ing and measuring methane concentration
in exhaust duct.
FIGURE 13. - Intake-air methane sensor.

ft3/ton (1.034 cm3/100 g) within the anomalous salt of the study area. Normal salt methane contents were found to be far less, averaging approximately 0.0015 f t3/tbn (0.0046 cm3/100 g) . Locations and analyses of these data are shown in figure 14.
This emission study was conducted from March 30, 1981, to September 9, 1981. Emissions occurring after July 3 will be referred to only in a general manner to explain certain interesting phenomena. However, the addition of a 30-in (76-cm) blowing duct and fan to the decline at the beginning of July complicated sam- pling procedures and prevented accurate measurements of air quantities. There- fore, only production days from March 30 to July 3 were used to calculate methane emission rates.
Emission-rate determinations were made during the first 47 production days. The amount of methane emitted during the 47 days ranged from 107,000 to 131,000 ft3 (3,030 to 3,710 m3) of methane. Approxi- mately 5,000 tons (4,540 t) of salt was hauled from the face during the 47 days. Daily totals of methane emitted during production are shown in figure 15.
\4- 5 . F' :;. = \?-
. -~,:-. , .';' - <.,:':3'.0 ,573, 1, I 0.0173 =$ $'-- ,-;,2 ' .< - - >
0.0 I 0 LEGEND
0.006 IZl Anomalous zone
Location of salt samples used ~n occluded gas measurements [ (Values In cubic foot per Ion STP);
b Direction of banding
0 40 80 - Scale. f l
FIGURE 14 - Locat ion and concentration of methane contents from salt samples collected in decl ine area.
Ninety percent of the production during this time was from the anomolous zone. The average methane emitted per produc- tion day within the anomalous zone was approximately 2,500 ft3 (71 m3), but the average for the transitional zone to nor- mal salt was generally less than 500 ft3 (14 m3). Because production rates varied significantly, the quantities of methane emitted per ton of salt mined per day is thought to be a more meaningful quali- tative indicator of methane emission. Methane emission rates in the normal salt after July 3 were generally undetectable.
Estimations of emission rates versus tonnage are based on reliable production data for salt mined from the face per shift. The procedure used is presented in greater detail in a previous study to estimate salt produced per day (14). By comparing the total amount of salrhauled from the face per day with the amount of production time per day, we were able to estimate a production rate for the ad- vancing face (fig. 16). Production times could be estimated by the abnormal read- ings from the sonic anemometer within the exhaust duct (fig. 17). Apparently, salt dust produced during mining causes er- ratic velocity measurements as compared to the consistent velocity measurement during nonproductive periods. Therefore, emission rates (ft3/ton; m3/t) were esti- mated by comparing the minimum and maxi- mum values of methane emitted per day (fig. 15) with the total estimated tons of salt produced per day (fig. 16). Fig- ure 18 shows the emission rates based on the estimated tons mined for each of the 47 production days for which reliable data were available.
Analyses of the data shows (1) a de- crease in the emission rate occurred be- tween March 30 to July 3 as the normal salt was approached, (2) an increase in emission rate when mining perpendicular to rather than parallel to the direction of banding, (3) and a correlation between emission rates with methane content data. The emission rate within the anomalous zone averaged 27.3 ft3/ton (0.7 m3/t) of mined salt, but the rate dropped to less

KEY I Range of data
Mar. Apr. May June July
PRODUCTION TIME, days
FIGURE 15. - Amount of methane emitted per day for 47 production dates from March 30 to July 3.
than 5 f t 3 / t o n (0.1 m3/t) of mined s a l t f o r t h e t r a n s i t i o n zone t o normal s a l t . Figure 9 shows t h e p o s i t i o n of t he f a c e dur ing the l a t e r p a r t of June and begin- ning of J u l y when t h e t r a n s i t i o n t o nor- mal s a l t was mined.
There was a 44-pct decrease i n emission r a t e s a s t he f a c e advanced p a r a l l e l t o t h e banding a s opposed t o when t h e f a c e advanced a t an angle t o banding. This may be caused by an enhanced dra inage of gas from t h e s t r a t a due t o permeabi l i ty where f r a c t u r e s i n t e r s e c t perpendicular r a t h e r than p a r a l l e l t o t he face. The average emission r a t e from March 30 t o May 19 was approximately 37.5 f t 3 / t o n
(1.0 m3/t) of mined s a l t . The angle be- tween t h e banding a t the s a l t f a c e and t h e o r i e n t a t i o n of f a c e advancement f o r t h i s f i r s t per iod was 40 t o 80 deg, while t h e o r i e n t a t i o n of the banding i n t h e s a l t and the f a c e advancement were ap- proximately p a r a l l e l f o r the second pe r i - od ( f i g . 19). The second period (May 20 t o J u l y 1) had an average emission r a t e of 20.9 f t 3 / t o n (0.5 m3/t) of mined s a l t . Figure 9 shows t h a t on approximately May 19 t h e f a c e made a sharp t u r n t o t h e e a s t and e s s e n t i a l l y followed t h e s a l t bands u n t i l a second t u r n occurred a t Ju ly 1. The a s s o c i a t i o n of anomalous s a l t wi th measurable methane emissions is shown i n f i g u r e 20.

@6-29 240 - -
220 - KEY - 6 - 1 0, e tc. Production date
200 - - 4-28. @4-9
180 - 6-23 -
160 - 4- 23 -
140 - 6-9 -
120 - -
100 - -
-
- 4-7
-
@4-1 -
1 1 1 , l l l I l I l I 1 1 .
100 200 300 400 500 600 700 800 900 1,000 1,100 1,200
PRODUCTION, min /d
FIGURE 16. - Salt production rate from dec l ine as a funct ion o f sa l t hauled versus production time.
Lunch Shift change Lunch
w- 1 1 I Production I ( Production I / Production I I ~roductionl Nonproduction I
z 0.2
:z I- Q
O
12 noon
10 12 2 midnight
FIGURE 17. - Strip chart recording from methane sensor and sonic anemometer w i th in exhaust
duct. Not i ce the correlat ion between methane concentrat ion and anomalous responses from the
sonic anemometer.
Comparison of t h e s e emiss ion d a t a w i th 0.7 m3 / t ) ] . Some of t h e reasons f o r t h i s t h e methane con ten t d a t a developed by can be a t t r i b u t e d t o t h e d i f f e r e n c e s i n Scha t ze l and Hyman (13 ) , - a l s o sugges t s sample s i z e and phys i ca l cond i t i ons under pe rmeab i l i t y w i t h i n t h i s anomalous zone. which t h e d a t a a r e es t imated . However, The d i f f e r e n c e between t h e methane con- t h e l a r g e d i f f e r e n c e s between t h e s e two t e n t and t h e average measured emiss ion s e t s of d a t a i n d i c a t e t h a t t h e methane r a t e s f o r t h e sampled a r e a is 80 t imes con ten t of s a l t a t t h e f a c e cannot ac- g r e a t e r I0.33 t o 27.3 f t 3 / t o n (0.009 t o count f o r a s i g n i f i c a n t p o r t i o n of t h e

KEY I Range of data
Mar. Apr. May June July
PRODUCTION TIME, days
FIGURE 18. - Calculated methane emission rates per ton of sa l t produced from the decl ine face
from March 30 to Ju ly 3.
methane emitted into the air exhausted from the face. Permeability would allow for a larger reservoir from which methane could drain during advancement of the face. This is an important consideration since domal salt is generally thought of as impermeable. Previous investigations by Thoms in an area of normal production grade salt at the Jefferson Island (12) Mine have shown in situ permeabilityto be nearly zero, with only some mining- induced permeability observed near free faces of salt pillars.
Reliable determination of emission rates were not possible after July 3 be- cause of the addition of a flexible blow- ing air duct in the decline. This addi- tion to the ventilation system disrupted the continuous, even flow of air down the decline, across the face, and back up the decline through the rigid exhaust duct. When the booster blowing air duct was forcing air down the decline, the entry itself probably had recirculation. There is some evidence that one current of air was moving down the decline along the

FIGURE 19. - Area w i th in the dec l ine where banding is para l le l w i t h entry.
bottom of t h e e n t r y while s imultaneously ano the r c u r r e n t of a i r was moving up the e n t r y along t h e roof . Also. the auxi l - i a r y v e n t i l a t i o n systems would reduce t h e o v e r a l l v e l o c i t y of t h e cu r r en t of a i r moving down the en t ry .
The i n t a k e a i r c u r r e n t s s p l i t a t t h e f a c e , wi th one p o r t i o n being exhausted
from t h e d e c l i n e through t h e r i g i d duct and another po r t i on moving away from t h e f a c e along t h e e n t r y roof . The l o c a t i o n of t h e e n t r y sensor is shown i n f i g u r e 20. During t h e s e v e r a l product ion days a f t e r J u l y 3 p r e c i s e ana lyses of gas sam- p l e s showed concent ra t ions of methane were s i m i l a r a t both t h e exhaust duct sensor and t h e e n t r y sensor . S t r i p c h a r t

Scale, f t
FIGURE 20. - P lan v iew of face areas where methane emiss ions were detected.
record ings from methane sensors during s e v e r a l of t h e product ion days show t h i s s i m i l a r i t y i n concen t r a t i ons ( f i g . 21). This d a t a confirms s p l i t a i r c u r r e n t s i n t h e d e c l i n e e n t r y a f t e r Ju ly due t o t h e a d d i t i o n of a u x i l i a r y v e n t i l a t i o n .
During another s h o r t per iod ( J u l y 25- 26) when t h e f a c e was advancing through t h e normal s a l t , an i n t e r e s t i n g methane emission phenomenon was observed. Over t h e weekend, when t h e r e was no product ion a t t h e f a c e , methane was measured by t h e
sensor i n t h e e n t r y and not by the sensor i n t h e exhaust duct ( f i g . 22). Since t h e sensor i n t h e exhaust duct was measuring t h e a i r d i r e c t l y from t h e f ace a r e a , we assume t h e emissions from t h e f a c e were c l o s e t o zero. However, during t h i s same per iod , t h e sensor i n t h e e n t r y , which was probably ana lyz ing t h e a i r moving up t h e d e c l i n e away from the f a c e , had a methane concen t r a t i on of approximately 0.05 pct . A p o s s i b l e explana t ion of t h i s phenomenon i s t h a t t h e r i b w i th in t h e anomalous zone away from the f ace a r e a

I I I I I 1
Methane in decline entry -
9 0.2 I I I I I I I- W Methane in exhaust duct
.I - -
FIGURE 21. - Strip chart recordings from entry and exhaust duct sensors showing similar methane concentrat ions.
L t-a ga
I I I I I I I I I - - Methane in exhaust duct
- - -
I I I I
Sonic anemometer I I 1 1 1 I
Voltage output I I I I I I I - I
r I 1 I 1 I 1 I I
L Methane in decline entry -
8 12 4 8 12 4 8 12 10 a.m. noon midnight noon p.m.
FIGURE 22. - Strip chart recording from a nonproduction weekend. was emitting methane that was being transported up the decline along the roof. The spike of methane from both sensors at approximately 12 p.m. (July 26, fig. 22) occurred because of a power outtage, which cut off the ventilation fans and allowed natural ventilation to develop. During this period of natural ventilation, there was a small build up of approximately 0.45 pct methane throughout the methane-monitoring area.
When the fan was turned on again, methane concentrations dropped rapidly to zero. A similar small build up of methane was observed when a fan was not in operation on June 2 (fig. 23). The maximum concen- tration of methane measured during this period was approximately 0.17 pct.
The data collected after July are of- fered only as observations because of the complication to the ventilation system.

I fan operating I h w L 2 f ons operating
I l am. I p.m. 3 5 7 9 I I FIGURE 23. - Strip chart recording of methane concentration measured at relative air velocities
within exhaust duct.
However, rib emissions probably occurred because of the permeability of the salt from this anomalous zone. It should also be pointed out that even without forced ventilation, methane emitted from the rib did not raise the concentrations in the entry above one-half of a percent.
EXPLORATORY DRILLING INTO ANOMALOUS ZONE
To further investigate some of the physical characteristics associated with the area of high emissions, an explora- tory drill hole was cored horizontally
characteristics and also to determine the methane content associated with the change from normal to anomalous salt (fig. 25).
Three exploratory drill holes were needed to investigate further the gas characteristics of this anomalous zone. Hole 1 was cored entirely through normal salt (fig. 26). This hole, which repre- sents typical salt from a normal nongassy face, was cored approximately 154 ft (47 m) at a bearing of 293" and an angle of 0.25" above the horizontal from the face
into the anomalous zone. The drill hole of room F. Methane flows were zero ex- yielded data pertaining to the flows, cept when pumping the inner core barrel pressure, and composition of the gas from down the hole. Even then, the methane the salt rock penetrated (fig. 24). concentration of the gases exiting the Twenty-seven NQ size (diameter of 2.75 drill hole reached only 0.1 pct (the re- in; 45 cm3) cores from the drill hole maining 99.9 pct consisted of air). No were collected to ascertain a descrip- other flows were measurable during the tion of the physical and compositional drilling of hole 1. Upon completion of

FIGURE 24. - Equipment assembly for exploratory dr i l l ing i n study area.
LEGEND
I, Direction of banding
Intake shall
FIGURE 25. - Salt core recovered from explor-
atory d r i l l holes. Cores were physical ly inspected
and bagged for methane content test.
drilling, the hole was shut-in for ap- proximately 20 h. During this time, no pressure buildup was observed within the hole. Methane contents of the cores were also consistently low (table 2).
FIGURE 26. - Location of three exploratory dr i l I holes on 1,400-ft level and theirposit ion relat ive
to anomalous zone.
Hole 2 was drilled from an area of normal nongassy salt into the edge of the anomalous gassy salt. The hole was drilled approximately 131 ft (40 m) at a bearing of 325' and an angle of 7" above

TABLE 2. - Average CH4 contents of cores from normal salt and transitional zone, and rib samples from the anomalous zone
TABLE 3. - Gas analysis from drill hole 2, percent
Salt type or source
Normal............. Transitional zone l . Anomalous zone.....
Time after encoun- (-1 tering anomalous 1 02 + N2 I Ar
l~ark bands adjacent to anomalous zone.
Number of samples
23 4 5
CHI 1 CHI I Location of sample
4 in (10 cm) inside end of driii pipe. Do. Do.
Exhaust from drill hole after pressure test. Do.
4 in (10 cm) inside end of drill pipe. Do.
Rel. conc. of CH4
1 4
220
l Other hydrocarbons. 2~low rate dropped to near zero. Air from entry began contaminating drill hole.
the horizontal plane from the face of room C (fig. 26). Methane emissions were zero from the first 120 ft (37 m) of the drill hole. The core from the first 120 ft (37 m) was found to be typical of the normal salt found in the study area. At approximately 125 ft (38 m), a distinc- tive odor signaled the penetration into a gassy zone of salt. This odor was later attributed to the presence o f a small concentration of mercaptans. Drilling was interrupted after approximately 5 ft (1.5 m) more of penetration so that gas concentrations and flows could be mea- sured. Methane concentrations of over 90 pct were round with a methanometer and later confirmed by gas chromatographic analysis (table 3).
Mean ( z ) , ft3/ton (cm3/100 g)
0.0015 (0.0046) -0066 (.0206) .3304 ( 1.0324)
only two observations of flow could be made (fig. 27). Approximately 500 ft3 (14.2 m3) of methane was estimated to
Std. dev. (01, ft3/ton (cm3/100 g)
0.0011 (0.0034) .0047 ( .0146) .3656 (1.1424)
Approximately 4 h after penetration, a gas flow of 42 ft3/h (1.2 m3/h) was mea- A
V sured. One hour later, the .flows dropped 2 4 6 8 10 12 14 16 18 20 to near zero [4 ft3/h (0.1 m3/h)]; how- ever, methane concentrations remained TIME, h
above 90 pct. Conditions were such that FIGURE 27. - Gas f l ow from ho le 2.

have been emitted from this hole 20 h after encountering the gas flow. This total flow is significantly less than that of another exploration hole drilled by the mine operator which had a total flow of 39,000 to 49,000 ft3 (1,104 to 1,388 m3) of methane. The hole was drilled from the decline face to a depth of approximately 150 ft (46 m) within this anomalous zone (14). -
Close examination of the salt core showed a change in the lithology of the salt where penetration of the gassy zone occurred. Two dark bands of salt, 1 to 2 ft (0.3 to 0.6 m) thick, were observed to occupy the interval from w-hich gas emis-
sions were first encountered. These dark bands are similar to those observed di- rectly adjacent to the dark argillaceous
salt of the anomalous zone approximate- ly 168 ft (51 m) away in the decline (fig. 26). The drill hole had just begun to encounter the anomalous zone, and the bands represent a transitional zone be- tween normal and anomalous salt. Core samples from the dark bands adjacent to the anomalous zone had an increase in methane content by a factor of 4 when compared to that of normal salt. Rib samples collected from the anomalous zone were approximately 220 times higher in methane content (table 2).
Hole 2 was extended from 131 ft (40 m) to 153 ft (47 m) 9 months after the ini- tial coring. In addition, a third hole was rotary drilled 163 ft (50 m) at a bearing of 320" and an inclination of 3" (fig. 26). In situ gas pressures were
May 1983
May 10
TIME, days FIGURE 28. - G a ~ - ~ r e s s u r e bui ldup i n holes 2 and 3 after encountering anomalous zone.

measured in both holes by packing the portions of the hole located in the anom- alous zone. Gas pressures in hole 3 rose to 903 psig (6,226 kPa) in a 6-day period (fig. 28). However, in hole 2, which had been partially drilled prior to hole 3, pressure did not exceed 10 psig (69 kPa) until the pressure in hole 3 exceeded 700 psig (4,830 kPa). At this point, hole 2 began to build up pressure over a 4-day period, reaching approximately 175 psig (1,210 kPa). These two holes were 24 ft (7 m) apart at their end points.
Information from the three drill holes, along with the other data previously
DISCUSSIONS OF POTENTIAL
A possible methane control strategy would include identification, delinea- tion, and orientation of the gassy anoma- lous zone; determination of the degree of severity of this potential hazard; devel- opment of special mine-through techniques and procedures; and, if it is believed the hazard may be too great, how to avoid the zone.
IDENTIFICATION, DELINEATION, AND ORIENTATION OF A GASSY ANOMALOUS ZONE
Before a methane control plan can be formulated, the potential problem area must be identified. The identification of a gassy anomalous zone can be ac- complished by geologic in-mine mapping investigations and an explorational drilling program.
Geologic in-mine mapping should include an inspection and description of salt types with emphasis on the presence of brine or gas seeps, fluid or gaseous in- clusions, grain size, striations, orien- tation of banding, and location and geom- etry of outburst. Once the mine has been sufficiently mapped, trends of anomalous zones of salt can be established for the entire mine. This will allow for projections of anomalous zones into un- mined portions of the salt dome close to the working sections. Also, because the domal salt is often nearly vertically bedded, projections of these trends can
discussed in this report, indicates that the normal salt adjacent to the anomalous zone presents a less significant methane hazard than does the anomalous zone it- self. It appears that higher methane emission rates are a result of localized permeability, increased methane contents, and excessive gas pressure of the salt within this anomalous zone. These char- acteristics will also increase the poten- tial for other methane hazards such as outburst. This implies the need for spe- cial control technologies for mining through a gassy anomalous zone such as that found in the study area.
METHANE CONTROL STRATEGIES
be made into superjacent and subjacent mining levels.
Exploratory drilling confirms projec- tions made from in-mine mapping near the working face areas. Core drilling is recommended for providing the most reli- able information, but examination and testing of cuttings from rotary drilling can supply some useful information. Be- cause of the great difficulty and poten- tial hazards associated with drilling into salt domes from the surface, this exploration program should be conducted from within the mine. The length and number of exploratory drill holes needed to successfully identify an anomalous zone cannot yet be established. Some mines have established procedures of drilling several 100- to 300-ft (30- to 90-m) holes from every face developing in unmined regions of the dome. The number and lengths of these holes should be de- pendent upon both projected conditions from in-mine mapping and results of ini- tial drilling from that particular face.
DETERMINING THE SEVERITY OF THE POTENTIAL HAZARD
Several combined techniques could be used to determine the degree of sever- ity to be expected when mining through a projected gassy anomalous zone. Accurate records of gas emission problems encoun- tered during development of the face

should be routinely collected. Detailed physical property tests related to gas of an anticipated anomalous zone with exploratory drilling that incorporates the dissolution techniques developed by Hyman (15) - will aid in evaluating the severity of the potential methane haz- ard. Although conditions within the anomalous zone may change rapidly (per- meability, pressure, methane content, etc.), previous mine-through data could be used to confirm results developed from these tests conducted during exploratory drilling.
Physical properties tests from explora- tional drill holes provide generalized gas flow and gas pressure data of proj- ected anomalous zone so that a comparison could be made with other anomalous zones and with normal production-grade nongassy salt. Additional test concerned with the permeability of the zone could be made to determine its effect on the flow and pressure of the gas. Also, the dominant gas type to be expected when mine-through occurs could be easily determined by gas sampling during drilling.
Methane content analysis of exploration cores will also provide information for comparison with other anomalous zones as well as the normal salt within the mine. To quantify the severity of the hazard, it is hoped that evaluation of a proj- ected anomalous zone can be made with re- liable results so that comparisons can be made with other anomalous zones that have been mined-through previously.
SPECIAL MINE-THROUGH PROCEDURES AND TECHNIQUES
After an anomalous zone has been iden- tif ied in an unmined portion of the salt dome and the degree of the emissions
hazard has been.estimated, special mine- through procedures and techniques should be planned. Mining systems to be af- fected by a control strategy would in- clude (1) selection of equipment (2) mine layout, (3) blasting techniques, (4) area methane monitoring systems, and (5) meth- ane drainage. When selecting equipment for potential methane hazard areas, spe- cial attention should be placed on avail- ability and maintenance of permissible equipment at the face areas. A continu- ous mining system would tend to emit gas steadily into the ventilation sys- tem instead of a rapid release like that which may accompany a blasted face. Mine layout should consider the location of these gassy zones so as to minimize their effect on high production areas and maxi- mize the potential for larger quantities of ventilating air currents. Many work- ing faces near a gassy zone would enable the blasting of a potentially hazardous face at a predetermined time, such as the last shift of a work week. If larger emissions did occur, the mine ventilation system would have an entire weekend to render the methane harmless, minimizing production stoppages. Investigations of blasting geometries and techniques may enable the mine operator to advance through a gassy zone with minimal danger of outburst. A sophisticated sensing system could be used to continuously mon- itor emissions during cutting or blast- ing. The system would consider and moni- tor every face as a potential emission problem. If the gassy zone is permeable, drainage holes drilled into high gas pressure areas will reduce the gas pressure locally, lowering the flow rates of methane from the salt into the face area. And finally, if conditions are se- rious enough, total avoidance of the gassy zone may be desired.

SLIMMARY AND CONCLUSIONS
The important characteristics associ- ated with the methane hazard assessment study are as follows:
1. Normal salt adjacent to the anom- alous zone studied in this report is considered to present minimal emission problems (<SO0 ft3/d, 14 m3/d).
2. Compared with normal salt, the anomalous zone in the study area pre- sented a much greater gas emission prob- lem (averaging 2,500 ft3/d; 71 m3/d).
3. Methane emission rates from the normal salt in the decline area were es- timated to contain 0 to 5 ft3/ton (0.1 m3/t) of methane.
4. Calculations of methane emission rates from the anomalous zone in the decline ranged from 10 to 70 ft3/ton (0.3 to 1.8 m3/t) and averaged approximately 27.3 ft3/ton (0.7 m3/t) over a span of 47 production days.
5. Emissions occurred mainly during or shortly after production from advanc- ing faces.
6. Rib emissions did occur in the anomalous zone, but they were generally far less significant than face emissions.
7. Emission rates can vary by as much as a factor of 2, depending upon the an- gle of face advancement to banding in an anomalous zone.
8. Comparison of emission rates with methane contents from the decline anoma- lous zone show the methane contents of the salt to be 83 times smaller than the emission data.
9. Pressure and flow of gas within the normal salt adjacent to the anomalous zone encountered in the explorational drilling were extremely low.
10. Pressures and flow properties of gas increased dramatically within the
anomalous zone. Gas flow of approximate- ly 42 ft3/h (1.2 m3/h) and gas pressures of approximately 900 psig (6,200 kPa) were measured when exploratory drilling encountered the anomalous salt.
Assumptions developed from this inves- tigation are as follows:
1. Compared with normal salt, anomal- ous zones may represent a higher poten- tial methane emission hazard. This is substantiated by previous information from various studies of anomalous fea- tures of Gulf Coast salt mines and by this study at the Belle Isle Mine.
2. The anomalous zone is permeable when compared with the generally imperme- able nature of the adjacent normal salt.
3. Permeability variations may depend on the orientation of banding and frac- ture planes within an anomalous zone.
If the characteristics of the anomalous zone investigated in this study are simi- lar to those of other anomalous zones within the Gulf Coast Salt Domes, and if the ideas developed herein are valid, the following conclusions can be drawn:
1. Anomalous zones can be observed, mapped, and projected within limited re- gions around working sections of under- ground domal salt mines.
2. Explorational drilling will aid in further identification of these anomalous zones away from the working sections. Orientation and projection of anomalous zones can be defined from trends of band- ing observed in salt cores.
3. Data from past mine-throughs and physical property tests related to gas of an approaching anomalous zone will aid in determining the severity of the potential hazard and will assist in developing an effective strategy for controlling meth- ane hazards in Gulf Coast salt mines.

REFERENCES
1. U.S. Senate . Hear ings Before t h e Subcommittee on Labor of t h e Committee on Labor and P u b l i c Welfare. Sec. i n Coal Mine H e a l t h and S a f e t y , 9 1 s t Congr., 1 s t s e s s . , p t . 5 , Appendix, 1969, pp. 1549- 1786.
2. Thoms, R. L. , and J. D. Mart inez . Blowouts i n Domal S a l t . Paper i n F i f t h Symposium on S a l t (Hamburg, West Germany, May 29-June 1 , 1978). North. OH Geol. Soc. , Cleveland, OH, v. 1 , 1980, pp. 119- 134.
3. B e l c h i c , H. C. The Winnf ie ld S a l t Dome, Winn P a r i s h , Louis iana . See. in I n t e r i o r S a l t Domes and T e r t i a r y S t r a t i g - raphy of Northern Louis iana . Shrevepor t Geol. Soc., Shrevepor t , LA, 1960, pp. 29- 47 .
4. Pl impton, H. G . , R. K. F o s t e r , J. S. Risbeck, R. P. R u t h e r f o r d , R. F. King, G. L. Buf f ing ton , and W. C. Tra- week. F i n a l Report of Mine Explosion D i s a s t e r , B e l l e I s l e Mine, C a r g i l l , I n c . , F r a n k l i n , S t . Mary P a r i s h , Louis iana . MSHA Accident I n v e s t . Rep., 1980, 156 pp.
5. Hoy, R. B . , R. M. Foose, and B. J. O ' N e i l , Jr. S t r u c t u r e of Winnf ie ld S a l t Dome, Winn P a r i s h , Louis iana . Am. Assoc. P e t . Geol. B u l l . , v. 46, No. 8 , 1962, pp. 1444-1459.
6. F ink , D. D m , S. C. Montgomery, P. W. K l e i n s t i v e r , M. H. Rober tson, J. C. McGregor, and W. R. Wilcox. Report of N o n f a t a l Outburs t of Flammable Gas Morton S a l t D i v i s i o n of Marton T h i e k o l , Inc . Weeks I s l a n d Mine New I b e r i a , I b e r i a Par- i s h , Lou is iana . MSHA Accident I n v e s t . Rep., 1983, 25 pp.
8. Kupfer , D. H. S t r u c t u r e of Morton S a l t Company Mine, Weeks I s l a n d S a l t Dome, Louis iana . Am. Assoc. Pe t . Geol. B u l l . , v. 46, No. 8 , 1962, pp. 1460-1467.
9. Muehlberger, W. R., and P. S. Cla- bauch. I n t e r n a l S t r u c t u r e and Pe t ro fab- r i c s of Gulf Coast S a l t Domes. Am. Assoc. Pe t . Geol. Memoir 8 , 1968, pp. 90- 98.
10. Kupfer, D. H. Problems Assoc ia ted With Anomalous Zones i n Louis iana S a l t S t o c k s , USA. Paper i n F i f t h Symposium on S a l t (Hamburg, West Germany, May 29-June 1, 1978). Northern Ohio Geol. Soz., Cleveland, OH, v. 1 , 1980, pp. 119-134.
11. . Shear Zones I n s i d e Gulf Coast S a l t S tocks Help t o Deline- a t e Spines of Movements. Am. Assoc. P e t . Geol. B u l l . , v. 60, No. 9 , 1976, pp. 1434-1447.
12. Thoms , R. L. , and R. M. Gehle. I n S i t u CAES T e s t f o r S a l t Reservo i r s . Paper i n I n t e r n a t i o n a l Conference on Seasonal Thermal Energy S torage and Com- p r e s s e d Air Energy S t o r a g e ( S e a t t l e , WA, Oct. 19-21, 1981). B a t t e l l e Memorial I n s t . , S e a t t l e , WA, v. 2 , 1981, pp. 553- 561; NTIS DE 82-012418.
13. S c h a t z e l , S. J . , and D. M. Hyman. Methane Content of Gulf Coast Domal Rock S a l t . BuMines RI 8889, 1984.
14. I annacch ione , A. T., G. L. F i n f i n - g e r , T. M. Kohler , and D m M. Hyman. In- v e s t i g a t i o n of Methane Emissions From an Advancing Face i n t h e B e l l e I s l e Domal S a l t Mine, Louis iana . RuMines RI 8723, 1982, 15 pp.
7. Halbouty, M. T. S a l t Domes: Gulf 15. Hyman, D. M. Methodology f o r De- Region, United S t a t e s and Mexico. Gulf t e rmin ing Occluded Gas Contents i n Domal Pub. Co., Houston, TX, 1967, 425 pp. Rock S a l t . BuMines RI 8700, 1982, 11 pp.
U.S. GPO. 1984-705-02015020