assessment of recreationally important finfish stocks in
TRANSCRIPT
Assessment of Recreationally Important Finfish Stocks in Rhode Island Waters
2019 Annual Performance Reports
F-61-R-21 Grant Number: F14AF00182
Jobs 1-14
Note: Jobs 5 and 7 have been completed
PERIOD: January 1, 2014 – December 31, 2019
Rhode Island Department of Environmental Management, Division of Marine Fisheries

1
ASSESSMENT OF RECREATIONALLY IMPORTANT
FINFISH STOCKS IN RHODE ISLAND WATERS
COASTAL FISHERY RESOURCE ASSESSMENT TRAWL SURVEY
2019
PERFORMANCE REPORT F-61-R SEGMENT 21
JOBS 1 AND 2
Christopher Parkins Principal Marine Biologist
Scott D. Olszewski Deputy Chief
Rhode Island Department of Environmental Management
Division of Marine Fisheries
March 2019
2
Annual Performance Report STATE: Rhode Island PROJECT NUMBER: F-61-R SEGMENT NUMBER: 21 PROJECT TITLE: Assessment of Recreationally Important Finfish Stocks in Rhode Island Waters JOB NUMBER: 1 TITLE: Narragansett Bay Monthly Fishery Resource Assessment JOB OBJECTIVE: To collect, summarize and analyze bottom trawl data for biological and fisheries management purposes. PERIOD COVERED: January 1, 2019 – December 31, 2019. PROJECT SUMMARY: Job 1, summary accomplished: A: 143 twenty-minute bottom trawls were successfully completed. B: Data on weight, length, sex and numbers were gathered on 69 species. Hydrographic data were gathered as well. Additionally, anecdotal notations were made on other plant and animal species. Although not previously discussed, these notations are in keeping with past practice. TARGET DATE: December 2019 SCHEDULE OF PROGRESS: On schedule. SIGNIFICANT DEVIATIONS: After the seasonal survey concluded in early May the research vessel was taking on water through the propeller shaft and rudder connection. Due to the emergency nature of this situation the vessel was immediately hauled out and repaired. The haul out and repair lasted until June and the monthly survey for May was not completed. JOB NUMBER: 2 TITLE: Seasonal Fishery Resource Assessment of Narragansett Bay, Rhode Island Sound and Block Island Sound JOB OBJECTIVE: To collect, summarize and analyze bottom trawl data for biological and fisheries management purposes. PERIOD COVERED: Spring (April – May)/ Fall (September – October) 2019 PROJECT SUMMARY: Job 2, summary accomplished:
A: 44, twenty-minute tows were successfully completed during

3
the Spring 2019 survey (26 NB. – 6 RIS – 12 BIS). B: 44, twenty-minute tow were successfully completed during the Fall 2019 survey (26 NB. – 6 RIS – 12 BIS)
C: Data on weight, length, sex and numbers were gathered on 69 species. Hydrographic data were gathered as well. Additionally, anecdotal notations were made on other plant and animal species. Although not previously discussed, these notations are in keeping with past practice. TARGET DATE: DECEMBER 2019. SCHEDULE OF PROGRESS: On schedule. SIGNIFICANT DEVIATIONS: None JOBS 1 & 2 RECOMMENDATIONS: Continuation of both the Monthly and Seasonal Trawl surveys into 2020, Data provided by these surveys is used extensively in the Atlantic States Marine Fisheries Commission Fishery Management process and Fishery Management Plans. RESULTS AND DISCUSSION: 143 tows were completed during 2019 Job 1 (Monthly survey). 69 species accounted for a combined weight of 4342.77 kgs. and 133,407 length measurements being added to the existing Narragansett Bay monthly trawl data set By contrast, 88 tows were completed during 2019 Job 2 (Seasonal survey) 69 species accounted for a combined weight of 3555.27 kgs. and 131,622 length measurements added to the existing seasonal data set. For the grant period between 2014 and 2019 a total of 1250 tows (880 monthly and 370 seasonal) and an additional 17 species were added to our database. With the completion of the 2019 surveys, combined survey(s) Jobs (1&2) data now reflects the completion of 7,127 tows with data collected on 149 species over the entire timeseries. PREPARED BY: _______________________ ______________________ Christopher J. Parkins Date Principal Marine Biologist Principal Investigator APPROVED BY: _______________________ ______________________ Jason McNamee Date Chief, Marine Resources RIDFW – Marine Fisheries

4
Coastal Fishery Resource Assessment – Trawl Survey Introduction:
The Rhode Island Division of Fish and Wildlife - Marine Fisheries Section, began monitoring finfish populations in Narragansett Bay in 1968, continuing through 1977. These data provided monthly identification of finfish and crustacean assemblages. As management strategies changed and focus turned to the near inshore waters, outside of Narragansett Bay, a comprehensive fishery resource assessment program was instituted in 1979. (Lynch T. R. Coastal Fishery Resource Assessment, 2007)
Since the inception of the Rhode Island Seasonal Trawl Survey (April 1979) and the Narragansett Bay Monthly Trawl Survey (January 1990), 7,127 tows have been conducted within Rhode Island territorial waters with data collected on 149 species. This performance report reflects the efforts of the 2019 survey year as it relates to the past 40 years. (Lynch T. R. Coastal Fishery Resource Assessment, 2007), (Olszewski S.D. Coastal Fishery Resource Assessment 2014) Methods: The methodology used in the allocation of sampling stations employs both random and fixed station allocation. Fixed station allocation began in 1988 in Rhode Island Sound and Block Island Sound. This was based on the frequency of replicate stations selected by depth stratum since 1979. With the addition of the Narragansett Bay monthly portion of the survey in 1990, an allocation system of fixed and randomly selected stations has been employed depending on the segment (Monthly vs. Seasonal) of the annual surveys. Sampling stations were established by dividing Narragansett Bay into a grid of cells. The seasonal trawl survey is conducted in the spring and fall of each year. Usually 44 stations are sampled each season; however, this number has ranged from 26 to 72 over the survey time series due to mechanical and weather conditions. The stations sampled in Narragansett Bay are a combination of fixed and random sites. 13 fixed during the monthly portion and 26, (14 of which are randomly selected) during the seasonal portion. The random sites are randomly selected from a predefined grid. All stations sampled in Rhode Island and Block Island Sounds are fixed. Depth Stratum Identification Area Stratum Area nm2 Depth Range (m) Narragansett Bay 1 15.50 <=6.09 2 51.00 >=6.09 Rhode Island Sound 3 0.25 <=9.14 4 2.25 9.14 – 18.28 5 13.5 18.28 – 27.43 6 9.75 >=27.43 Block Island Sound 7 3.50 <=9.14 8 10.50 9.14 – 18.28 9 11.50 18.28 – 27.43 10 12.25 27.43 – 36.57 11 4.00 >=36.57

5
At each station, an otter trawl equipped with a ¼ mesh inch liner is towed for twenty minutes. The Coastal Trawl survey net is 210 x 4.5”, 2 seam (40’ / 55’), the mesh size is 4.5” and the sweep is 5/16” chain, hung 12” spacing, 13 links per space. Figure 1 depicts the RI Coastal Trawl survey net plan.
The research vessel used in the Coastal Trawl Survey is the R/V John H. Chafee. Built in 2002, the Research Vessel is a 50’ Wesmac hull, powered by a 3406 Caterpillar engine generating 700 hp. Data on wind direction and speed, sea condition, air temperature and cloud cover as well as surface and bottom water temperatures, are recorded at each station. Catch is sorted by species. Length (cm/mm) is recorded for all finfish, skates, squid, scallops, Whelk lobster, blue crabs and horseshoe crabs. Similarly, weights (g/kg) and number are recorded as well. Anecdotal information is also recorded for incidental plant and animal species. Survey changes- Beginning January 2012 the Rhode Island Coastal Trawl Survey began using an updated set of trawl doors. Throughout 2012, a comparative gear calibration study was completed to determine if a significant change to the survey catch data is exists. The analysis of this calibration study was completed in 2013 and is available upon request.
RIDEM R/V John H. Chafee
Acknowledgements: Special thanks are again extended to Captain Patrick Brown and Assistant Captain Sean Fitzgerald, and the entire seasonal staff and volunteers. The support given over the years has been greatly appreciated.

6

7
Figure 1

8
Map 1: Monthly (fixed) and Seasonal (grid) Stations in Narragansett Bay

9
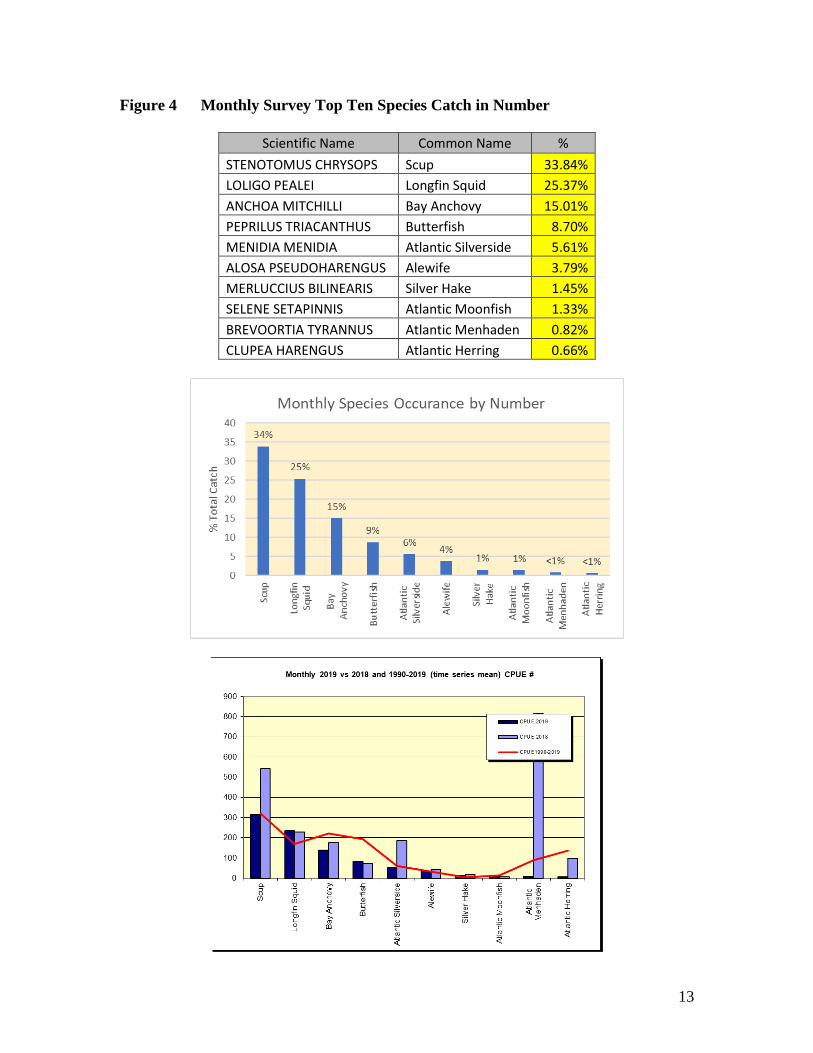
Results: Job 1. Monthly Coastal Trawl Survey; 12 fixed stations in Narragansett Bay and 1 in Rhode Island Sound. A total of 69 species were observed and recorded during the 2019 Narragansett Bay Monthly Trawl Survey totaling 133,407 individuals or 932.9 fish per tow. In weight, the catch accounted for 4342.77 kg. or 30.36 kg. per tow. (Figures 2 and 3) The top ten species by number and catch are represented in figures 4 and 5. The catch between demersal and pelagic species is represented in figures 6 and 7and shows a clear shift from demersal species to a more pelagic or multi-habitat species. Figure 2 (Total Catch in Number)
Scientific Name Common Name Total # STENOTOMUS CHRYSOPS Scup 45019 LOLIGO PEALEI Longfin Squid 33750 ANCHOA MITCHILLI Bay Anchovy 19977 PEPRILUS TRIACANTHUS Butterfish 11577 MENIDIA MENIDIA Atlantic Silverside 7460 ALOSA PSEUDOHARENGUS Alewife 5041 MERLUCCIUS BILINEARIS Silver Hake 1928 SELENE SETAPINNIS Atlantic Moonfish 1765 BREVOORTIA TYRANNUS Atlantic Menhaden 1094 CLUPEA HARENGUS Atlantic Herring 873 ALOSA AESTIVALIS Blueback Herring 660 CENTROPRISTIS STRIATA Black Sea Bass 569 POMATOMUS SALTATRIX Bluefish 558 UROPHYCIS REGIA Spotted Hake 361 LEUCORAJA ERINACEA Little Skate 337 UROPHYCIS CHUSS Red Hake 249 HOMARUS AMERICANUS American Lobster 179 PLEURONECTES AMERICANUS Winter Flounder 154 CANCER IRRORATUS Rock Crab 148 ALOSA SAPIDISSIMA American Shad 146 CYNOSCION REGALIS Weakfish 127 PRIONOTUS EVOLANS Striped Sea Robin 103 MUSTELUS CANIS Smooth Dogfish 97 PARALICHTHYS DENTATUS Summer Flounder 95 PRIONOTUS CAROLINUS Northern Sea Robin 90 TAUTOGA ONITIS Tautog 85 LEIOSTOMUS XANTHURUS Spot 69 GADUS MORHUA Atlantic Cod 67 MORONE SAXATILIS Striped Bass 60 PARALICHTHYS OBLONGUS Fourspot Flounder 55 MENTICIRRHUS SAXATILIS Northern Kingfish 35

10
BUSYCOTYPUS CANALICULATUS Channeled Whelk 34 TRACHURUS LATHAMI Rough Scad 32 RAJA EGLANTERIA Clearnose Skate 30 SCOPHTHALMUS AQUOSUS Windowpane Flounder 30 CALLINECTES SAPIDUS Blue Crab 18 ETROPUS MICROSTOMUS Smallmouth Flounder 15 AMMODYTES AMERICANUS Sand Lance 15 PRIACANTHUS ARENATUS Bigeye 14 LIMULUS POLYPHEMUS Horseshoe Crab 13 MYOXOCEPHALUS OCTODECEMSPINOS Longhorn Sculpin 12 SYNODUS FOETENS Inshore Lizardfish 11 SCOMBER SCOMBRUS Atlantic Mackerel 9 CARANX CRYSOS Blue Runner 9 BUSYCON CARICA Knobbed Whelk 8 CANCER BOREALIS Jonah Crab 8 PETROMYZON MARINUS Sea Lamprey 7 LEUCORAJA OCELLATA Winter Skate 7 MORONE AMERICANA White Perch 7 TAUTOGOLABRUS ADSPERSUS Cunner 6 UPENEUS PARVUS Dwarf Goatfish 4 SPHYRAENA BOREALIS Northern Sennet 4 DASYATIS SAY Bluntnose Stingray 3 ALOSA MEDIOCRIS Hickory Shad 3 SYNGNATHUS FUSCUS Northern Pipefish 2 TRINECTES MACULATUS Hogchoker 2 OPSANUS TAU Oyster Toadfish 2 GOBIIDAE Gobies 2 SQUILLA EMPUSA Mantis Shrimp 2 MYLIOBATIS FREMINVILLII Bullnose Ray 1 TORPEDO NOBILIANA Atlantic Torpedo Ray 1 CONGER OCEANICUS Conger Eel 1 POLLACHIUS VIRENS Pollock 1 BAIRDIELLA CHRYSOURA Silver Perch 1 MYOXOCEPHALUS AENAEUS Grubby 1 SPHOEROIDES MACULATUS Northern Puffer 1 DECAPTERUS PUNCTATUS Round Scad 1 ROSSIA MOELLERI Bobtail Squid 1 ILLEX ILLECEBROSUS Shortfin Squid 1

11
Figure 3 (Total Catch in Kilograms) Scientific Name Common Name Total Weight (kg) STENOTOMUS CHRYSOPS Scup 2519.094 PEPRILUS TRIACANTHUS Butterfish 262.723 LEUCORAJA ERINACEA Little Skate 198.674 LOLIGO PEALEI Longfin Squid 170.379 CENTROPRISTIS STRIATA Black Sea Bass 98.933 ALOSA PSEUDOHARENGUS Alewife 97.687 MERLUCCIUS BILINEARIS Silver Hake 92.491 TAUTOGA ONITIS Tautog 90.677 MORONE SAXATILIS Striped Bass 88.1 CLUPEA HARENGUS Atlantic Herring 83.155 MUSTELUS CANIS Smooth Dogfish 81.591 PARALICHTHYS DENTATUS Summer Flounder 65.874 HOMARUS AMERICANUS American Lobster 62.539 ANCHOA MITCHILLI Bay Anchovy 41.513 RAJA EGLANTERIA Clearnose Skate 41.357 PLEURONECTES AMERICANUS Winter Flounder 39.134 PRIONOTUS EVOLANS Striped Sea Robin 35.704 POMATOMUS SALTATRIX Bluefish 31.7 LIMULUS POLYPHEMUS Horseshoe Crab 31.395 MENIDIA MENIDIA Atlantic Silverside 22.155 CANCER IRRORATUS Rock Crab 19.763 BREVOORTIA TYRANNUS Atlantic Menhaden 14.794 ALOSA AESTIVALIS Blueback Herring 12.941 CYNOSCION REGALIS Weakfish 12.606 PARALICHTHYS OBLONGUS Fourspot Flounder 12.561 PRIONOTUS CAROLINUS Northern Sea Robin 12.303 LEIOSTOMUS XANTHURUS Spot 12.043 UROPHYCIS CHUSS Red Hake 10.231 UROPHYCIS REGIA Spotted Hake 10.095 TORPEDO NOBILIANA Atlantic Torpedo Ray 9.9 DASYATIS SAY Bluntnose Stingray 8.54 SCOPHTHALMUS AQUOSUS Windowpane Flounder 6.053 ALOSA SAPIDISSIMA American Shad 5.551 BUSYCOTYPUS CANALICULATUS Channeled Whelk 5.362 SELENE SETAPINNIS Atlantic Moonfish 5.114 LEUCORAJA OCELLATA Winter Skate 4.43 MYOXOCEPHALUS OCTODECEMSPINOS Longhorn Sculpin 3.874 CALLINECTES SAPIDUS Blue Crab 3.77 MYLIOBATIS FREMINVILLII Bullnose Ray 2.9 GADUS MORHUA Atlantic Cod 2.615 MENTICIRRHUS SAXATILIS Northern Kingfish 2.021

12
BUSYCON CARICA Knobbed Whelk 1.88 CANCER BOREALIS Jonah Crab 1.737 ALOSA MEDIOCRIS Hickory Shad 1.548 OPSANUS TAU Oyster Toadfish 1.412 SPHYRAENA BOREALIS Northern Sennet 0.795 CARANX CRYSOS Blue Runner 0.701 SYNODUS FOETENS Inshore Lizardfish 0.415 PRIACANTHUS ARENATUS Bigeye 0.31 TRACHURUS LATHAMI Rough Scad 0.267 SCOMBER SCOMBRUS Atlantic Mackerel 0.235 ETROPUS MICROSTOMUS Smallmouth Flounder 0.217 CONGER OCEANICUS Conger Eel 0.21 TRINECTES MACULATUS Hogchoker 0.174 MORONE AMERICANA White Perch 0.116 AMMODYTES AMERICANUS Sand Lance 0.108 UPENEUS PARVUS Dwarf Goatfish 0.075 PETROMYZON MARINUS Sea Lamprey 0.05 TAUTOGOLABRUS ADSPERSUS Cunner 0.04 BAIRDIELLA CHRYSOURA Silver Perch 0.035 SQUILLA EMPUSA Mantis Shrimp 0.035 SPHOEROIDES MACULATUS Northern Puffer 0.024 DECAPTERUS PUNCTATUS Round Scad 0.014 POLLACHIUS VIRENS Pollock 0.01 GOBIIDAE Gobies 0.006 ILLEX ILLECEBROSUS Shortfin Squid 0.005 SYNGNATHUS FUSCUS Northern Pipefish 0.004 MYOXOCEPHALUS AENAEUS Grubby 0.003 ROSSIA MOELLERI Bobtail Squid 0.002
13
Figure 4 Monthly Survey Top Ten Species Catch in Number
Scientific Name Common Name % STENOTOMUS CHRYSOPS Scup 33.84% LOLIGO PEALEI Longfin Squid 25.37% ANCHOA MITCHILLI Bay Anchovy 15.01% PEPRILUS TRIACANTHUS Butterfish 8.70% MENIDIA MENIDIA Atlantic Silverside 5.61% ALOSA PSEUDOHARENGUS Alewife 3.79% MERLUCCIUS BILINEARIS Silver Hake 1.45% SELENE SETAPINNIS Atlantic Moonfish 1.33% BREVOORTIA TYRANNUS Atlantic Menhaden 0.82% CLUPEA HARENGUS Atlantic Herring 0.66%

14
Figure 5 Top Ten Species Catch in Kilograms
Scientific Name Common Name % STENOTOMUS CHRYSOPS Scup 58.01% PEPRILUS TRIACANTHUS Butterfish 6.05% LEUCORAJA ERINACEA Little Skate 4.57% LOLIGO PEALEI Longfin Squid 3.92% CENTROPRISTIS STRIATA Black Sea Bass 2.28% ALOSA PSEUDOHARENGUS Alewife 2.25% MERLUCCIUS BILINEARIS Silver Hake 2.13% TAUTOGA ONITIS Tautog 2.09% MORONE SAXATILIS Striped Bass 2.03% CLUPEA HARENGUS Atlantic Herring 1.91%

15
Figure 6 and 7: Demersal vs. Pelagic Species Complex
Smooth Dogfish Hogchoker Atlantic Herring BluefishSpiny Dogfish Longhorn Sculpin Alewife Striped BassSkates Sea Raven Blueback Herring Black Sea BassSilver Hake Northern Searobin Shad ScupRed Hake Striped Searobin Menhaden WeakfishSpotted Hake Cunner Bay Anchovy Longfin SquidSummer Flounder Tautog Rainbow Smelt4-Spot Flounder Ocean Pout SilversideWinter Flounder Goosefish ButterfishWindowpane Flounder Lobster Atlantic Moonfish
Demersal Species Pelagic/Multi-Habitat Species

16
Monthly Survey Temperature Profile (Annual mean surface and bottom temperature) Surface and bottom temperatures are collected at every station. The bottom temperature was collected by Niskin bottle until June 2020 at the average or maximum depth for each station. From June 2020 onward bottom temperature is the average over an entire tow as record by a Starmon TD® temperature and depth sensor attached to the footrope of the net.

17
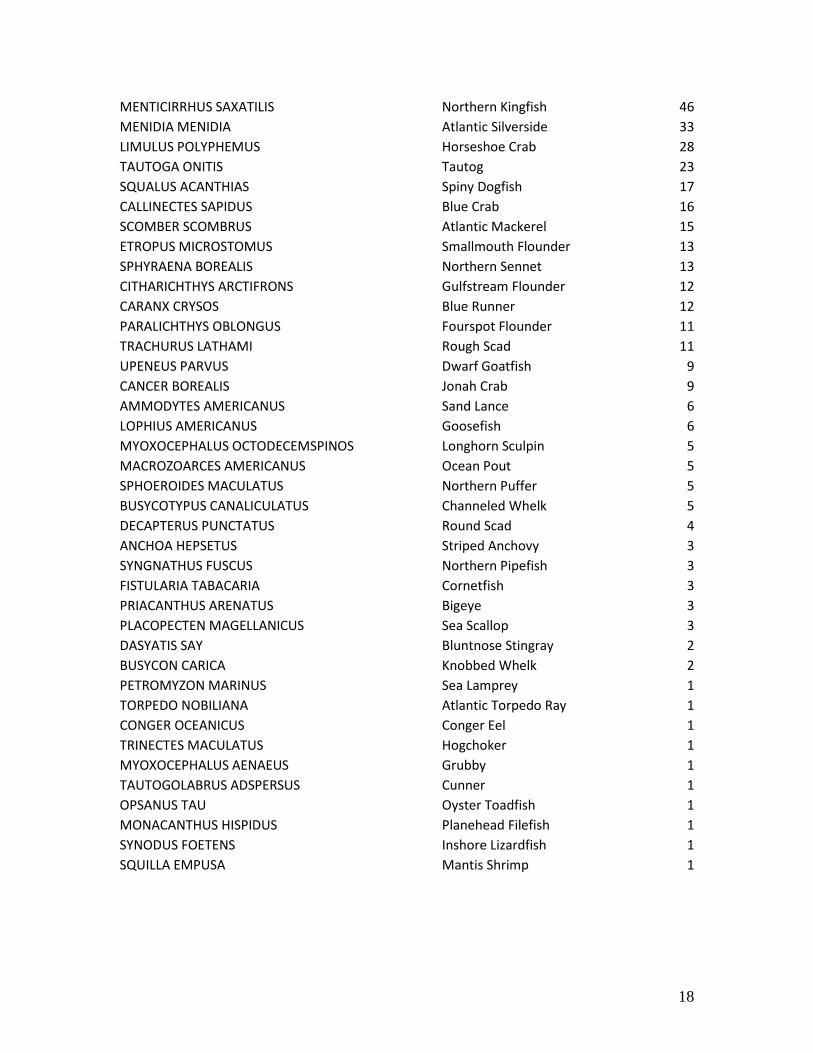
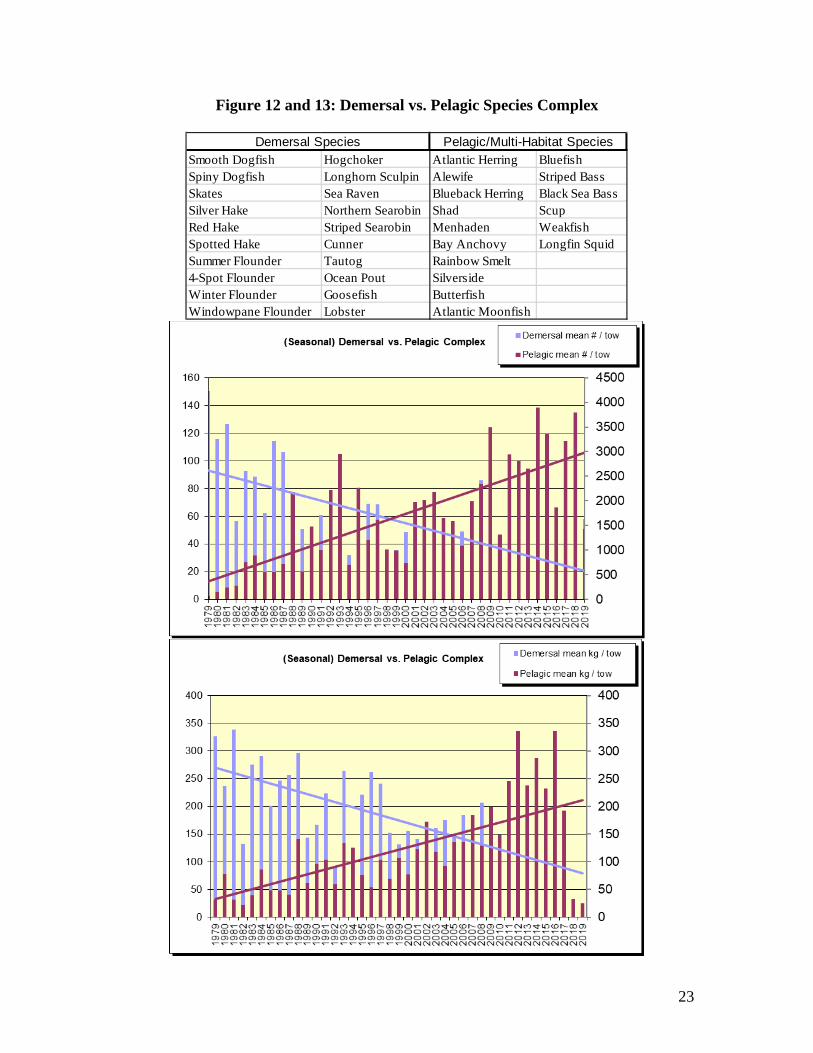
Results: Job 2. The Seasonal Coastal Trawl Survey is defined by 12 fixed stations in Narragansett Bay, 14 random stations in Narragansett Bay, 6 fixed stations in Rhode Island Sound, 12 fixed stations in Block Island Sound. 69 species were observed and recorded during the 2019 Rhode Island Seasonal Trawl Survey, totaling 131,622 individuals or 1495.7 fish per tow. In weight, the catch accounted for 3555.27 kg. or 40.4 kg. per tow. (Figures 8 and 9) The top ten species by number and catch are represented in figures 10 and 11. The change between demersal and pelagic species is represented in figures 12 and 13 and shows a clear shift from demersal species to a more pelagic or multi-habitat species. Figure 8 (Total Catch in Number) Scientific Name Common Name Total # STENOTOMUS CHRYSOPS Scup 47432 ANCHOA MITCHILLI Bay Anchovy 44952 LOLIGO PEALEI Longfin Squid 12704 PEPRILUS TRIACANTHUS Butterfish 9761 ALOSA PSEUDOHARENGUS Alewife 4919 MERLUCCIUS BILINEARIS Silver Hake 2051 SELENE SETAPINNIS Atlantic Moonfish 1547 POMATOMUS SALTATRIX Bluefish 1479 BREVOORTIA TYRANNUS Atlantic Menhaden 1167 ALOSA AESTIVALIS Blueback Herring 802 LEUCORAJA ERINACEA Little Skate 702 UROPHYCIS CHUSS Red Hake 525 PRIONOTUS CAROLINUS Northern Sea Robin 475 GADUS MORHUA Atlantic Cod 343 CYNOSCION REGALIS Weakfish 318 PLEURONECTES AMERICANUS Winter Flounder 275 CLUPEA HARENGUS Atlantic Herring 273 CENTROPRISTIS STRIATA Black Sea Bass 217 PARALICHTHYS DENTATUS Summer Flounder 192 UROPHYCIS REGIA Spotted Hake 171 LEUCORAJA OCELLATA Winter Skate 140 CANCER IRRORATUS Rock Crab 118 HOMARUS AMERICANUS American Lobster 111 MUSTELUS CANIS Smooth Dogfish 107 LEIOSTOMUS XANTHURUS Spot 103 PRIONOTUS EVOLANS Striped Sea Robin 92 SCOPHTHALMUS AQUOSUS Windowpane Flounder 88 MORONE SAXATILIS Striped Bass 88 RAJA EGLANTERIA Clearnose Skate 81 ALOSA SAPIDISSIMA American Shad 56
18
MENTICIRRHUS SAXATILIS Northern Kingfish 46 MENIDIA MENIDIA Atlantic Silverside 33 LIMULUS POLYPHEMUS Horseshoe Crab 28 TAUTOGA ONITIS Tautog 23 SQUALUS ACANTHIAS Spiny Dogfish 17 CALLINECTES SAPIDUS Blue Crab 16 SCOMBER SCOMBRUS Atlantic Mackerel 15 ETROPUS MICROSTOMUS Smallmouth Flounder 13 SPHYRAENA BOREALIS Northern Sennet 13 CITHARICHTHYS ARCTIFRONS Gulfstream Flounder 12 CARANX CRYSOS Blue Runner 12 PARALICHTHYS OBLONGUS Fourspot Flounder 11 TRACHURUS LATHAMI Rough Scad 11 UPENEUS PARVUS Dwarf Goatfish 9 CANCER BOREALIS Jonah Crab 9 AMMODYTES AMERICANUS Sand Lance 6 LOPHIUS AMERICANUS Goosefish 6 MYOXOCEPHALUS OCTODECEMSPINOS Longhorn Sculpin 5 MACROZOARCES AMERICANUS Ocean Pout 5 SPHOEROIDES MACULATUS Northern Puffer 5 BUSYCOTYPUS CANALICULATUS Channeled Whelk 5 DECAPTERUS PUNCTATUS Round Scad 4 ANCHOA HEPSETUS Striped Anchovy 3 SYNGNATHUS FUSCUS Northern Pipefish 3 FISTULARIA TABACARIA Cornetfish 3 PRIACANTHUS ARENATUS Bigeye 3 PLACOPECTEN MAGELLANICUS Sea Scallop 3 DASYATIS SAY Bluntnose Stingray 2 BUSYCON CARICA Knobbed Whelk 2 PETROMYZON MARINUS Sea Lamprey 1 TORPEDO NOBILIANA Atlantic Torpedo Ray 1 CONGER OCEANICUS Conger Eel 1 TRINECTES MACULATUS Hogchoker 1 MYOXOCEPHALUS AENAEUS Grubby 1 TAUTOGOLABRUS ADSPERSUS Cunner 1 OPSANUS TAU Oyster Toadfish 1 MONACANTHUS HISPIDUS Planehead Filefish 1 SYNODUS FOETENS Inshore Lizardfish 1 SQUILLA EMPUSA Mantis Shrimp 1
19
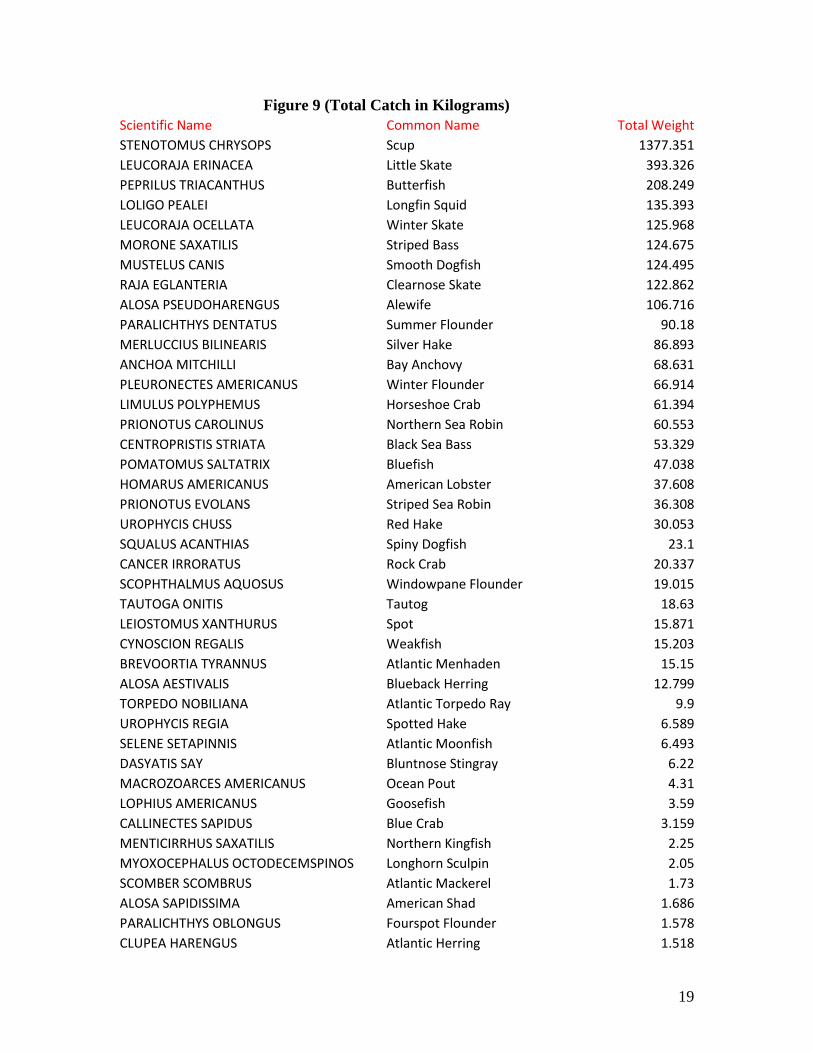
Figure 9 (Total Catch in Kilograms) Scientific Name Common Name Total Weight STENOTOMUS CHRYSOPS Scup 1377.351 LEUCORAJA ERINACEA Little Skate 393.326 PEPRILUS TRIACANTHUS Butterfish 208.249 LOLIGO PEALEI Longfin Squid 135.393 LEUCORAJA OCELLATA Winter Skate 125.968 MORONE SAXATILIS Striped Bass 124.675 MUSTELUS CANIS Smooth Dogfish 124.495 RAJA EGLANTERIA Clearnose Skate 122.862 ALOSA PSEUDOHARENGUS Alewife 106.716 PARALICHTHYS DENTATUS Summer Flounder 90.18 MERLUCCIUS BILINEARIS Silver Hake 86.893 ANCHOA MITCHILLI Bay Anchovy 68.631 PLEURONECTES AMERICANUS Winter Flounder 66.914 LIMULUS POLYPHEMUS Horseshoe Crab 61.394 PRIONOTUS CAROLINUS Northern Sea Robin 60.553 CENTROPRISTIS STRIATA Black Sea Bass 53.329 POMATOMUS SALTATRIX Bluefish 47.038 HOMARUS AMERICANUS American Lobster 37.608 PRIONOTUS EVOLANS Striped Sea Robin 36.308 UROPHYCIS CHUSS Red Hake 30.053 SQUALUS ACANTHIAS Spiny Dogfish 23.1 CANCER IRRORATUS Rock Crab 20.337 SCOPHTHALMUS AQUOSUS Windowpane Flounder 19.015 TAUTOGA ONITIS Tautog 18.63 LEIOSTOMUS XANTHURUS Spot 15.871 CYNOSCION REGALIS Weakfish 15.203 BREVOORTIA TYRANNUS Atlantic Menhaden 15.15 ALOSA AESTIVALIS Blueback Herring 12.799 TORPEDO NOBILIANA Atlantic Torpedo Ray 9.9 UROPHYCIS REGIA Spotted Hake 6.589 SELENE SETAPINNIS Atlantic Moonfish 6.493 DASYATIS SAY Bluntnose Stingray 6.22 MACROZOARCES AMERICANUS Ocean Pout 4.31 LOPHIUS AMERICANUS Goosefish 3.59 CALLINECTES SAPIDUS Blue Crab 3.159 MENTICIRRHUS SAXATILIS Northern Kingfish 2.25 MYOXOCEPHALUS OCTODECEMSPINOS Longhorn Sculpin 2.05 SCOMBER SCOMBRUS Atlantic Mackerel 1.73 ALOSA SAPIDISSIMA American Shad 1.686 PARALICHTHYS OBLONGUS Fourspot Flounder 1.578 CLUPEA HARENGUS Atlantic Herring 1.518

20
CANCER BOREALIS Jonah Crab 1.434 BUSYCOTYPUS CANALICULATUS Channeled Whelk 0.824 PETROMYZON MARINUS Sea Lamprey 0.686 CARANX CRYSOS Blue Runner 0.585 SPHYRAENA BOREALIS Northern Sennet 0.31 PLACOPECTEN MAGELLANICUS Sea Scallop 0.305 CITHARICHTHYS ARCTIFRONS Gulfstream Flounder 0.255 OPSANUS TAU Oyster Toadfish 0.252 ETROPUS MICROSTOMUS Smallmouth Flounder 0.239 CONGER OCEANICUS Conger Eel 0.21 TRACHURUS LATHAMI Rough Scad 0.165 UPENEUS PARVUS Dwarf Goatfish 0.143 GADUS MORHUA Atlantic Cod 0.142 MENIDIA MENIDIA Atlantic Silverside 0.11 SPHOEROIDES MACULATUS Northern Puffer 0.107 FISTULARIA TABACARIA Cornetfish 0.06 AMMODYTES AMERICANUS Sand Lance 0.05 SQUILLA EMPUSA Mantis Shrimp 0.048 DECAPTERUS PUNCTATUS Round Scad 0.044 PRIACANTHUS ARENATUS Bigeye 0.043 BUSYCON CARICA Knobbed Whelk 0.04 MONACANTHUS HISPIDUS Planehead Filefish 0.035 TRINECTES MACULATUS Hogchoker 0.02 SYNODUS FOETENS Inshore Lizardfish 0.015 ANCHOA HEPSETUS Striped Anchovy 0.01 SYNGNATHUS FUSCUS Northern Pipefish 0.008 TAUTOGOLABRUS ADSPERSUS Cunner 0.008 MYOXOCEPHALUS AENAEUS Grubby 0.005

21
Figure 10 Top Ten Species Catch in Number
Scientific Name Common Name % STENOTOMUS CHRYSOPS Scup 36.04% ANCHOA MITCHILLI Bay Anchovy 34.15% LOLIGO PEALEI Longfin Squid 9.65% PEPRILUS TRIACANTHUS Butterfish 7.42% ALOSA PSEUDOHARENGUS Alewife 3.74% MERLUCCIUS BILINEARIS Silver Hake 1.56% SELENE SETAPINNIS Atlantic Moonfish 1.18% POMATOMUS SALTATRIX Bluefish 1.12% BREVOORTIA TYRANNUS Atlantic Menhaden 0.89% ALOSA AESTIVALIS Blueback Herring 0.61%

22
Figure 11 Top Ten Species Catch in Kilograms
Scientific Name Common Name % STENOTOMUS CHRYSOPS Scup 38.74% LEUCORAJA ERINACEA Little Skate 11.06% PEPRILUS TRIACANTHUS Butterfish 5.86% LOLIGO PEALEI Longfin Squid 3.81% LEUCORAJA OCELLATA Winter Skate 3.54% MORONE SAXATILIS Striped Bass 3.51% MUSTELUS CANIS Smooth Dogfish 3.50% RAJA EGLANTERIA Clearnose Skate 3.46% ALOSA PSEUDOHARENGUS Alewife 3.0% PARALICHTHYS DENTATUS Summer Flounder 2.54%
23
Figure 12 and 13: Demersal vs. Pelagic Species Complex
Smooth Dogfish Hogchoker Atlantic Herring BluefishSpiny Dogfish Longhorn Sculpin Alewife Striped BassSkates Sea Raven Blueback Herring Black Sea BassSilver Hake Northern Searobin Shad ScupRed Hake Striped Searobin Menhaden WeakfishSpotted Hake Cunner Bay Anchovy Longfin SquidSummer Flounder Tautog Rainbow Smelt4-Spot Flounder Ocean Pout SilversideWinter Flounder Goosefish ButterfishWindowpane Flounder Lobster Atlantic Moonfish
Demersal Species Pelagic/Multi-Habitat Species

24
The following species represented are of high importance and are currently managed under fishery management plans through the Atlantic States Marine Fisheries Commission, New England Fishery Management Council, or the National Marine Fisheries Service. The seasonal portion of the Rhode Island Coastal Trawl Survey is an accurate indicator of relative abundance based on the biology and life history of a particular species. Values presented are expressed in either relative number or kilograms per tow. All data collected from both the Seasonal and Monthly Coastal Trawl Surveys are available upon request.

25
American Lobster Homarus americanus Stock Status: Southern New England Stock: overfished. Depleted Poor condition. Management: ASMFC Amendment III, Addendum XXVI

26
Atlantic Menhaden Brevoortia tyrannus Stock Status: Not Overfished and overfishing is not occurring. Management: ASMFC Amendment III, Addendum I
27
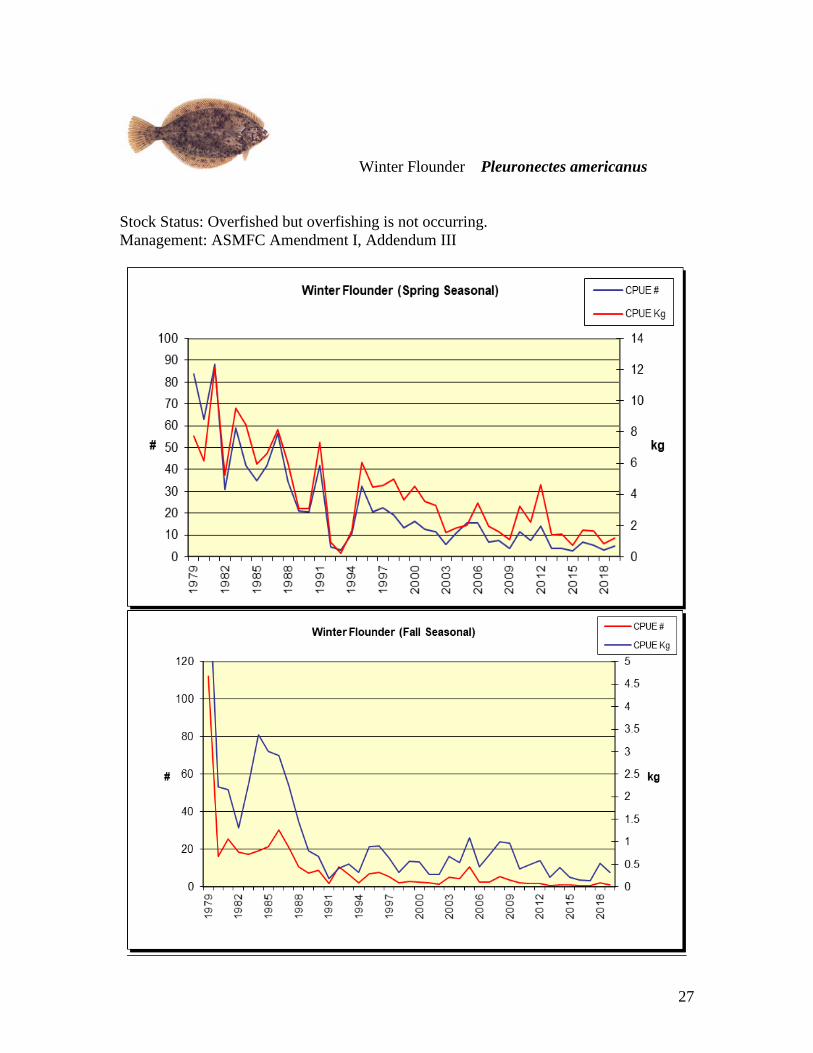
Winter Flounder Pleuronectes americanus Stock Status: Overfished but overfishing is not occurring. Management: ASMFC Amendment I, Addendum III

28
Summer Flounder Paralichthys dentatus Stock Status: Not overfished and overfishing is occurring. Management: ASMFC Amendment XIII Addendum XXXII

29
Tautog Tautoga onitis Stock Status: Not Overfished and Overfishing is not occurring based on Regional (Rhode Island and Massachusetts) Stock Assessment Management: ASMFC Amendment I, Addendum VI

30
Longfin Squid Loligo pealei Stock Status: Overfishing undetermined not overfished Management: NMFS, MAFMC, Atlantic Mackerel, Squid Butterfish FMP

31
Butterfish Peprlilus triacanthus Stock Status: Variable / Uncertain Management: Mid Atlantic Fishery Management Council, Atlantic Mackerel, Squid Butterfish FMP, ACL

32
Scup Stenotomus chrysops Stock Status: Rebuilt, not overfished and overfishing is not occurring Management: ASMFC Amendment XIII, Addendum XXXI, Summer Flounder, Scup Black Sea Bass FMP

33
Black Sea Bass Centropristis striata Stock Status: Rebuilt, not overfished overfishing is not occurring Management: ASMFC Amendment XIII, Addendum XXXI

34
References: ASMFC 2014.Current Fishery Management Plans; Stock Status Reports Bigelow and Schroeder 2002. Fishes of the Gulf of Maine; Third Edition NMFS 2014. Current Fishery Stock Status. Lynch, Timothy R. 2007. Assessment of Recreationally Important Finfish Stocks in Rhode Island Waters, Coastal Fishery Resource Assessment, Performance Report.

Assessment of Recreationally Important Finfish Stocks in Rhode Island Coastal Ponds
Young of the Year Survey of Selected Rhode Island
Coastal Ponds and Embayments
Katie Rodrigue
Principal Marine Biologist [email protected]
John Lake
Supervising Marine Biologist [email protected]
Rhode Island Department of Environmental Management Division of Marine Fisheries
3 Fort Wetherill Road Jamestown, RI 02835
Federal Aid in Sportfish Restoration
F-61-R
Performance Report – Job#3a Coastal Ponds in Washington County, RI
March 2020

Performance Report
State: Rhode Island Project Number: F-61-R Segment Number: 21 Project Title: Assessment of Recreationally Important Finfish Stocks in Rhode Island Waters. Period Covered: January 1, 2014 – December 31, 2019 Job Number & Title: Job 3 – Young of the Year Survey of Selected Rhode Island Coastal Ponds and Embayment’s Job Objectives: To collect, analyze, and summarize beach seine survey data from Rhode Island’s coastal ponds and estuaries for the purpose of forecasting recruitment in relation to the spawning stock biomass of winter flounder and other recreationally important species. Summary: In 2019, investigators caught 51 species of finfish representing 30 families. This number is fairly consistent with 2018, where 50 species from 36 families were collected. This is consistent with the average number of species caught per year over the last five years (52) representing an average of 34 families. The number of individuals caught in 2019 increased from the 2018 survey, with 79,928 collected in 2019 and 47,024 collected in 2018. This was also the highest number of individuals captured over the last five years. All 144 seine samples were completed in 2019 and 861 samples were completed over the last 6 years. Target Date: December, 2019 Status of Project: On Schedule Significant Deviations: There were no significant deviations in 2019. There was only one significant deviation in the last five years: due to mechanical issues with the boat used for sampling, the Pawcatuck River stations were not sampled in May of 2016. commendations: Continue into the next segment with the project as currently designed; continue at each of the 24 sample stations. Remarks:
During 2019, investigators successfully sampled all twenty-four traditional stations in eight coastal ponds from May through October: Winnapaug Pond, Quonochontaug Pond, Charlestown Pond, Point Judith Pond, Green Hill Pond, Potter Pond, Little Narragansett Bay and Narrow River (Figures 1-3). Since last year, the time series species indices for young of the year (YOY) winter flounder includes the data taken from the new stations added in 2011 (PP 1 and 2, GH 1 and 2, PR 1 through 3, PJ4). These stations were previously excluded due to potential unknown bias the new stations could introduce to the time series. From 2014-2019, 861 stations were sampled in all coastal ponds. Only three samples were not completed during this grant cycle due to mechanical issues with the boat.
The abundance indices for winter flounder targets only YOY individuals. For the purpose of consistency, only individuals with a total length (TL) less than 12 cm are included

in these analyses. Materials and Methods:
As in previous years, investigators attempted to perform all seining on an outgoing tide. To collect animals, investigators used a seine 130 ft. long (39.62m), 6 ft deep (1.67m) with ¼” mesh (6.4mm). The seine has a bag at its midpoint, a weighted foot rope and floats on the head rope. Figure 4 describes the area covered by the seine net. The beach seine is set in a semi-circle away from the shoreline and back again using an outboard powered 16' Polarkraft aluminum boat. The net is then hauled toward the beach by hand and the bag is emptied into a large water-filled tote. All animals collected are identified to species, measured, enumerated, and sub-samples taken when appropriate. Water quality parameters including temperature, salinity and dissolved oxygen are measured at each station. Figure 1 shows the location of the subject coastal ponds and embayments, while figures 2-3 indicate the location of the sampling stations within each waterbody. Results and Discussion: Winter Flounder (Pseudopleuronectes americanus)
Juvenile winter flounder were collected at all 24 stations over the course of the season. Winter flounder ranked seventh in overall species abundance (n=811) in 2019, with the highest mean abundance (fish/seine haul) occurring in July (Table 2, Total Pond Index=10.63). This is consistent with the usual expected pattern of highest index values occurring in July. However, Quonochontaug Pond, Pawcatuck River, Potter Pond, and Green Hill Pond showed peak winter flounder abundance in June (26.67, 7.67, 1.0, and 1.5 respectively) and Winnapaug in August (20.67).
Winter flounder abundance in 2019 was the second-lowest in the time series. A total of 811 winter flounder were collected, which was a 37% increase from the lowest total caught in the time series in 2018 (n=593). The juvenile winter flounder abundance index (YOY WFL index) for the survey measured using the mean fish/seine haul slightly increased from 4.06 fish/seine haul in 2018 to 5.63 fish/seine haul in 2019. Figure 5 displays the abundance indices by pond over the duration of the coastal pond survey. The peak of winter flounder abundance over the last grant cycle occurred in 2014 with 1506 fish (index value = 10.5 fish/haul). Table 2 and Figure 6 display the mean catch per seine haul (CPUE) of winter flounder for each month by pond during the 2019 survey. Figure 8 displays the annual winter flounder abundance index plotted over time, along with average recorded water temperature.
Winter flounder abundance increased from 2018 in all waterbodies except Pawcatuck River and Green Hill Pond. Pawcatuck River showed the largest decrease in abundance index, going from 4.1 in 2018 to 2.6 in 2019. Green Hill Pond remained relatively consistent with last year’s abundance (decreasing slightly from 0.67 to 0.25), although it is the third lowest abundance seen since this pond was added to the survey in 2011 (the lowest observed abundance was in 2015 when no winter flounder were caught).Winnapaug Pond showed the largest increase in abundance index value, going from 4.9 in 2018 to 9.9 in 2019. Overall, YOY winter flounder abundance peaked in the coastal ponds in July (index value=10.63), although the most individuals were caught in June in Quonochontaug Pond, with a CPUE of 26.67 fish/seine haul. No winter flounder were caught in Green Hill Pond or Potter Pond before or after June, or in Pawcatuck River after September. Figure 17 is a map showing the total number of YOY winter flounder collected at each station.
With increasing seasonal temperatures, Rhode Island waters have seen an ecological

shift from resident demersal species (including winter flounder) to a pelagic community dominated by more southern species (Collie et al. 2008, Oviatt 2004). Over the course of this survey, average water temperature of the coastal ponds has steadily increased, while winter flounder YOY CPUE has decreased (Figure 8). Average water temperature measured during the survey has not been below 20°C since 2006 (19.3°C). The highest average temperature was observed in 2016 at 22.5°C. These findings are consistent with the overall trend occurring in northeast region and the observed declines in winter flounder population.
In 2019, juvenile winter flounder ranged in size from 2.2 to 19.8 cm, representing age groups 0-1+ (Figure 7). The size range of animals collected is similar to those caught in previous years. Length-frequency distributions indicate that 99.0% of individuals collected during sampling season were group 0 fish (less than 12 cm total length). The size ranges of these fish agree with ranges for young-of-the-year winter flounder in the literature (Able & Fahay 1998; Berry 1959; Berry et al. 1965). Mean monthly lengths for winter flounder are presented in Table 3.
Two other RIDFW surveys target juvenile and adult winter flounder: the Narragansett Bay Spring Seasonal Trawl Survey (Spring Trawl) and the Narragansett Bay Juvenile Finfish Survey (NBS). A comparison of the Coastal Pond Survey (CPS) to these other projects reveals that despite some slight differences, they display similar trends (Figure 9). Similar to the CPS, the NBS observed a slight increase in winter flounder abundance from the all-time low of 2018 (1.55). The abundance index in 2019 was 3.63. The Spring Trawl Survey WFL index was also slightly up from 2018, increasing from 3.09 fish/tow to 5.07 fish/tow. These low numbers are relatively consistent with the past few years (2013 to 2018). This may in part reflect regulations which changed ending the prohibition on possession of winter flounder in federal waters of Southern New England in 2012. Federal possession limits were either unlimited or set to 5,000 lbs per trip depending on the permit category of the vessel. It is believed that these high limits encourage a directed fishery for winter flounder in the spring. NOAA Fisheries has changed their procedures for administration of common pool possession limit, restricting it to lower values during the year than allowed (typically 2,000 lbs per day) in 2013. Possession limits remain 50 pounds in State waters.
The Narragansett Bay Seine Survey collects the most YOY WFL in June (McNamee Pers Comm). It should be noted that the Narragansett Bay Survey does not begin sampling until June and may miss those juvenile fish which occur in May in the shallow coves. The Spring Trawl Survey collects the greatest number of winter flounder in April and May and is considered the best indicator for estimating local abundance, especially for post-spawn adults (Olszewski Pers Comm).
The time series of the survey shows that the ponds exhibit fluctuations of WFL abundance over time. One exception is Point Judith pond, which has experienced a significant decline since 2000 and bottomed out at 0.73 fish/seine haul in 2008. Between 2009 and 2017, the overall YOY WFL index in Point Judith pond increased slightly from the low 2008 value and since then (with the exception of the low abundances of 1.29 fish/haul in 2010 and 2.9 fish/haul in 2018) has remained relatively level with index values averaging approximately 5 fish/haul. This trend in abundance might reflect the no possession rule in the pond as well as the former coast wide closure. Despite this, the pond’s winter flounder population has not rebounded to historic levels. A winter fyke net survey (Adult Winter Flounder Tagging Survey) is also conducted targeting adult winter flounder that use the ponds to spawn. Currently, Point Judith and Potter Ponds are the only coastal ponds where both a juvenile survey and an adult winter flounder survey occur annually (winter fyke net stations do exist in Charlestown Pond and were sampled from 2012-2015 and continued in 2019). When relative abundance and number of WFL per seine haul of juvenile winter flounder are

compared to the relative abundance and number of WFL per fyke net haul of the Adult Winter Flounder Tagging Survey, an overall declining trend in relative abundance of winter flounder is observed in both surveys (Figure 10). The index value observed in the adult spawner survey was the lowest ever recorded at 0.8 WFL per net haul in 2014, recovering slightly in 2016-2018 (1.1 fish/haul-6 fish/haul). In 2019, the number of captured fish declined again, with an index value of 2.24 fish/haul (Table 16). Most fish caught were mature females (55%, 26 individuals). A total of 21 mature fish were tagged and released. The decline in adult spawner abundance and related decline in juvenile abundance does not support a fishery in the pond due to the lack of surplus production (Gibson, 2010). Given that winter flounder population shows an affinity for discrete spawning locations and the young of year tend to remain near the spawning location, the fish in this pond are in danger of depletion (Buckley et. al. 2008). A regulation was enacted on April 8, 2011 to close Point Judith Pond to both recreational and commercial fishing for winter flounder (RIMF Regulations Part 7 sec 8). Data from this survey and the adult winter flounder spawning survey was the evidence used for justification of this regulation. Bluefish (Pomatomus saltatrix)
A total of 42 bluefish were collected in 2019 (CPUE=0.29 fish/haul). The majority were caught in Winnipaug Pond in August, with small numbers in Pawcatuck River in August and September, and one bluefish each in Narrow River in May and Charlestown Pond in September. This is an increase from 2018 (CPUE=0.09 fish/haul) and consistent the previous few years, with 49 fish caught in 2017 (CPUE=0.34 fish/haul), 55 caught in 2016 (CPUE=0.39 fish/haul),124 during 2015 (0.86 fish/haul), and 53 in 2014 (0.37 fish/haul). Table 4 contains the abundance indices for the 2019 survey by month and pond. Bluefish ranged in size from 3 cm to 11 cm. No adult bluefish were caught in 2019. Figure 11 displays the annual abundance index of bluefish for all stations combined. Figure 18 is a map showing the total number of bluefish collected at each station. Tautog (Tautoga onitis)
From May to October of 2019, 448 (CPUE= 3.1 fish/haul) tautog were collected in all ponds. This is up from the 288 tautog caught in 2018 (CPUE=2.0 fish/haul). It is also an increase from the previous few years (CPUE=2.0 in 2018, 2.4 in 2017, 2.1 in 2016, 2.12 in 2015, and 0.94 in 2014). Table 5 contains the abundance indices for the 2019 survey by month and pond. The highest abundances in 2019 occurred in the Charlestown Pond in August. Tautog caught in 2019 ranged in size from 1.8 cm to 18.9 cm. Figure 12 displays the annual abundance index of tautog for all stations combined. Figure 19 is a map showing the total number of tautog collected at each station. Black Sea Bass (Centropristis striata) A total of 147 juvenile black sea bass were collected from June to October of 2019 from each of the ponds (CPUE=1.02 fish/haul). This is a decrease from 2018 in which the highest abundance of black sea bass in the history of the survey was recorded (CPUE=4.2). This is also the lowest abundance seen in the last five years (overall CPUE from 2014-2019=1.7 fish/haul). The second highest abundance was seen in 2012 at 403 fish (CPUE=2.8 fish/haul). The highest abundance in 2019 was seen in Narrow River in September (16.3 fish/haul). Despite this year’s decrease in black sea bass catch, the population in the ponds seems to be continuing to trend upwards (Figure 13). Table 6 contains the abundance indices for the survey by month and pond. Black sea bass caught in 2019 ranged in size from 1 cm to 9 cm.

Figure 20 is a map showing the total number of black sea bass collected at each station.
Scup (Stenotomus chrysops) In 2019, 254 scup were collected from July to September in all ponds except Green Hill
Pond and Point Judith Pond (CPUE=1.8 fish/haul). This is slightly down from the 393 collected in 2018 (2.7 fish/haul). 2017 saw the highest number caught since the inception of the survey, at 558 fish (CPUE=3.9). A large increase in scup caught has been seen since 2014 (CPUE=0.21). Table 7 contains the abundance indices for the 2019 survey by month and pond. Figure 14 displays the annual abundance index of scup for all stations combined. Scup caught in 2019 ranged in size from 1 cm to 10 cm. Figure 21 is a map showing the total number of scup collected at each station.
Clupeids: In 2019, four species of clupeids were caught in the coastal pond survey: Atlantic menhaden (Brevoortia tyrannus), Atlantic herring (Alosa harengus), Alewife (Alosa pseudoharengus), and Bay Anchovy (Anchoa mitchilli). The most prevalent clupeid caught in 2019 was by far Atlantic Menhaden, with 56,224 individuals captured from June to October in all ponds (CPUE=390.0 fish/haul). This is more than double the 25,341 menhaden caught in 2018. In multiple instances, high numbers of YOY menhaden were caught in a single seine haul, likely because a school was present at a given station upon sampling. This was the case at Pawcatuck River station 3 in August, when ~40,000 juvenile menhaden were captured. There were three instances in which over 1,000 individuals were caught in a single haul. The second most abundant clupeid observed in 2019 was Alewife. A total of 257 were captured from June to October in all ponds except Quonochontaug, Point Judith, and Charlestown (CPUE=1.78). This is slightly up from the 207 caught in 2018. No blueback herring were caught in 2019, compared to 97 individuals captured in 2018. Figure 22 is a map showing the total number of river herring collected at each station. From May to June, 171 Atlantic herring were captured (CPUE=1.19), an increase from 36 individuals in 2018 and only 2 in 2017. This is the most Atlantic Herring caught in this survey since 2010 (320 individuals, CPUE=2.8). Finally, only 32 Bay Anchovies were caught in 2018 (CPUE=0.22) compared to 1,373 in 2017 (CPUE=9.5). However, the majority of these fish were caught in a single station in Narrow River in October 2018, indicating that a school happened to be present at this station at the time of sampling. No large schools of Bay Anchovies were encountered in 2018. Figure 22 is a map showing the total number of river herring collected at each station. From May to June, 36 Atlantic herring were captured in five out of eight ponds (Point Judith, Quonochontaug, Winnapaug, Narrow River, and Potter Pond; CPUE=0.25), up from only 2 individuals caught in 2017. This is the most Atlantic Herring caught in this survey since 2010 (320 individuals, CPUE=2.8). Finally, only 11 Bay Anchovies were caught in 2019 (CPUE=0.08) compared to 32 in 2018 (CPUE=0.22) and 1,373 in 2017 (CPUE=9.5). However, the majority of the 2017 fish were caught in a single station in Narrow River in October, indicating that a school happened to be present at this station at the time of sampling. No large schools of Bay Anchovies were encountered in 2019. Table 8 contains the abundance indices for clupeids by month pooled across all 8 ponds. Figure 15 displays the annual abundance indices of clupeids for all stations combined. Menhaden are plotted on a separate axis due to scale issues.
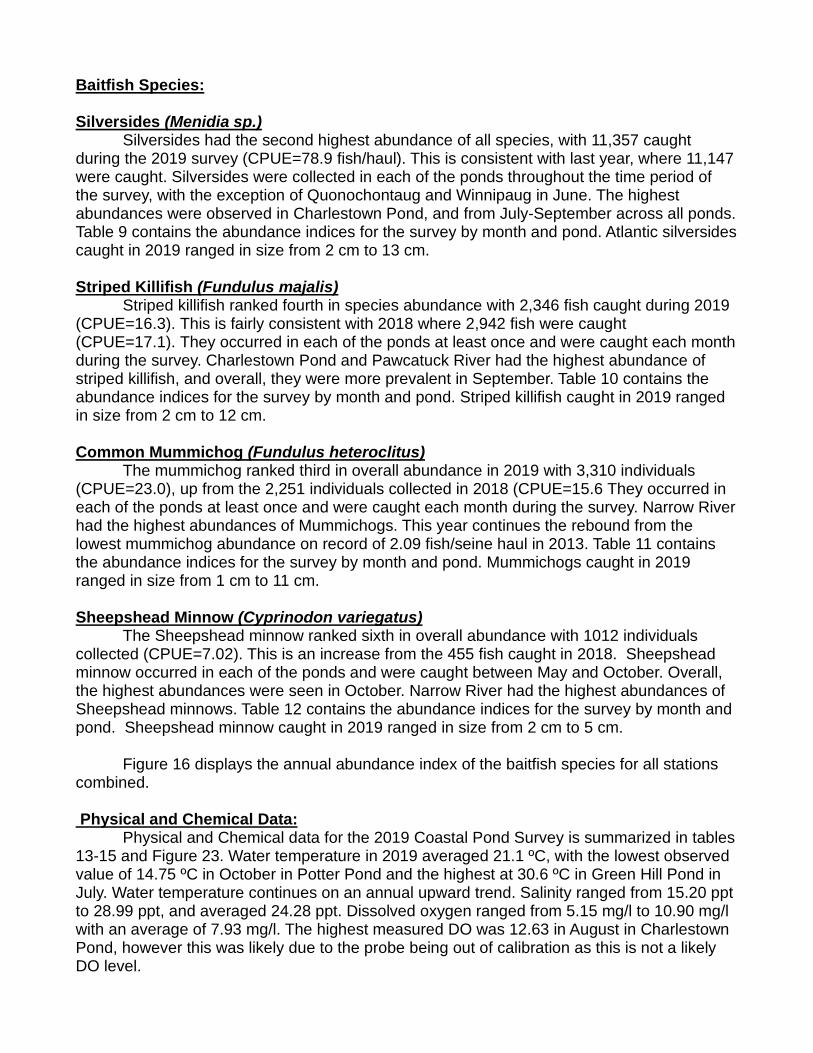
Baitfish Species: Silversides (Menidia sp.)
Silversides had the second highest abundance of all species, with 11,357 caught during the 2019 survey (CPUE=78.9 fish/haul). This is consistent with last year, where 11,147 were caught. Silversides were collected in each of the ponds throughout the time period of the survey, with the exception of Quonochontaug and Winnipaug in June. The highest abundances were observed in Charlestown Pond, and from July-September across all ponds. Table 9 contains the abundance indices for the survey by month and pond. Atlantic silversides caught in 2019 ranged in size from 2 cm to 13 cm. Striped Killifish (Fundulus majalis)
Striped killifish ranked fourth in species abundance with 2,346 fish caught during 2019 (CPUE=16.3). This is fairly consistent with 2018 where 2,942 fish were caught (CPUE=17.1). They occurred in each of the ponds at least once and were caught each month during the survey. Charlestown Pond and Pawcatuck River had the highest abundance of striped killifish, and overall, they were more prevalent in September. Table 10 contains the abundance indices for the survey by month and pond. Striped killifish caught in 2019 ranged in size from 2 cm to 12 cm. Common Mummichog (Fundulus heteroclitus)
The mummichog ranked third in overall abundance in 2019 with 3,310 individuals (CPUE=23.0), up from the 2,251 individuals collected in 2018 (CPUE=15.6 They occurred in each of the ponds at least once and were caught each month during the survey. Narrow River had the highest abundances of Mummichogs. This year continues the rebound from the lowest mummichog abundance on record of 2.09 fish/seine haul in 2013. Table 11 contains the abundance indices for the survey by month and pond. Mummichogs caught in 2019 ranged in size from 1 cm to 11 cm. Sheepshead Minnow (Cyprinodon variegatus)
The Sheepshead minnow ranked sixth in overall abundance with 1012 individuals collected (CPUE=7.02). This is an increase from the 455 fish caught in 2018. Sheepshead minnow occurred in each of the ponds and were caught between May and October. Overall, the highest abundances were seen in October. Narrow River had the highest abundances of Sheepshead minnows. Table 12 contains the abundance indices for the survey by month and pond. Sheepshead minnow caught in 2019 ranged in size from 2 cm to 5 cm.
Figure 16 displays the annual abundance index of the baitfish species for all stations combined. Physical and Chemical Data:
Physical and Chemical data for the 2019 Coastal Pond Survey is summarized in tables 13-15 and Figure 23. Water temperature in 2019 averaged 21.1 ºC, with the lowest observed value of 14.75 ºC in October in Potter Pond and the highest at 30.6 ºC in Green Hill Pond in July. Water temperature continues on an annual upward trend. Salinity ranged from 15.20 ppt to 28.99 ppt, and averaged 24.28 ppt. Dissolved oxygen ranged from 5.15 mg/l to 10.90 mg/l with an average of 7.93 mg/l. The highest measured DO was 12.63 in August in Charlestown Pond, however this was likely due to the probe being out of calibration as this is not a likely DO level.

New Station Preliminary Data
This year was the ninth year of sampling stations in the three additional ponds. On a whole, the samples were consistent with 2011-2018. Since last year, data from these additional stations has been included in the abundance indices for all species, including YOY winter flounder. This data will continue to be included in future analyses. A brief description of each pond follows. Green Hill Pond: Green Hill Pond is a small coastal pond located east of Charlestown Pond. It does not open directly to the ocean, but instead its only inlet is via Charlestown Pond and is thus not well flushed. Green Hill pond has water quality issues including high summer temperatures, high nutrient load, and a permanent shellfish closure. GH-1 is in the northeastern quadrant of the pond on a small island. The bottom substrate is mud with shell hash. GH-2 is in the southeastern quadrant of the pond on a sand bar. The bottom substrate is fine, muddy sand. WFL YOY have been caught in relatively high abundance in May, suggesting spawning activity within the pond. The WFL YOY decrease in abundance at the stations in July and August when the water is warm and are not caught frequently after it cools in the fall. Other species frequently present in the pond are the baitfish species, naked goby, and blue crabs. Potter Pond: Potter Pond is a small coastal pond located west of Point Judith Pond. Similarly to Green Hill Pond, it does not open directly to the ocean. Instead, its only inlet is via Point Judith Pond. However, the local geography is such that more tidal flushing occurs than in Green Hill Pond. The inlet to Potter Pond is closer to the inlet to Point Judith Pond, and its inlet is shorter. PP-1 is in the southwestern quadrant of the pond in a shallow cove. The bottom substrate is mud. PP-2 is in the northwestern quadrant of the pond adjacent to a deep (~25’) glacial kettle hole. The bottom substrate is fine sand with some cobble. WFL YOY have been caught at both stations but only PP-1 with high frequency. Also similar to Green Hill Pond, WFL YOY are highest in abundance in May and decrease in abundance as the season progresses. The water temperature in Potter Pond does not get as warm as Green Hill Pond, but still may be a factor at station PP-1. The geography of this station does not facilitate flushing and water quality may explain the lack of WFL YOY in mid-summer. Interestingly, all eight years had small catches of 1-year old flounder at station PP-1 during the late summer and early fall. Water temperatures are generally higher than the pond proper, while dissolved oxygen near this station is lower. The rest of the pond does not have the same water quality issues. Other species frequently caught in the pond include the baitfish species, American eel, oyster toad fish, naked goby, tautog, and blue crabs. Lower Pawcatuck River: The lower Pawcatuck River (also known as Little Narragansett Bay) is the mouth of a coastal estuary formed by the Pawcatuck River. It is different form the other stations on the survey in that it does not have a traditional barrier beach pierced by an inlet. Instead, it is relatively open to Block Island Sound. PR-1 is a small protected beach in a small cove surrounded by large boulders. The bottom substrate is fine sand. This station typically has the most consistent catch of WFL YOY which are present during all months of the survey. However, in 2018, WFL were only captured June-August. PR-2 is located on a sand bar island in the middle of Little Narragansett Bay on the protected (inland) side. This sand bar is all that is left of a larger barrier beach which existed prior to the 1938 hurricane. The bottom substrate is coarse sand. This station catches WFL YOY, but usually at lower frequencies

than PR-1. PR-3 was originally located in the southern part of Little Narragansett Bay on the protected side of Napatree Beach. After it was initially sampled in May 2011, the station was relocated because it was extremely shallow and a high wave energy area. PR-3 is now located in the northern section of Little Narragansett Bay at the mouth of the river near G. Willie Cove. The station is on a Spartina spp. covered bank at the head of G. Willie Cove. The bottom substrate is cobble. This station was selected to best characterize the species assemblage in the Lower Pawcatuck River as the majority of the shoreline consists of marsh grass covered banks. The station has been sampled in all 6 months since 2012. WFL YOY are not present in high frequencies at the station which is not unexpected due to the bottom substrate. Other species frequently caught in the river include juvenile tautog, the baitfish species, alewife, tomcod, menhaden, and bluefish. Point Judith Pond: The new station PJ-4 is located in the eastern section of the pond on Ram Island. The bottom substrate is silty sand with some large cobble. The station was selected because of its proximity to three fyke net stations sampled during the Adult Winter Flounder Spawner Survey. The station was added to better classify the species in the pond and to better document the decline of WFL YOY in the pond. The station has higher catch frequencies of WFL YOY than the other stations in the pond, but still is low in comparison to the other ponds.
The first six years of sampling the new stations successfully collected target species, notably WFL YOY. It is recommended that these stations be sampled into the future so as to continue to provide species assemblage information from these coastal ponds. The additional catch frequencies and distributions of WFL YOY will provide a better understanding of the population, notably in areas where the fish only occur in the spring/early summer. Moving forward, this data will be included in the time series abundance indices. Summary
In 2019, investigators caught 51 species of finfish representing 30 families. This number is fairly consistent with 2018, where 50 species from 36 families were collected. This is consistent with the average number of species caught per year over the last five years (52) representing an average of 34 families. The number of individuals caught in 2019 increased from the 2018 survey, with 79,928 collected in 2019 and 47,024 collected in 2018. This was also the highest number of individuals captured over the last six years. Appendix 1 displays the frequency of all species caught by station during the 2019 Coastal Pond Survey. Additional data is available by request.

References Able, K., and M.P. Fahay. 1998. The First Year in the Life of Estuarine Fishes in the Middle Atlantic Bight. Rutgers University Press. Berry, R.J. 1959. Critical growth studies of winter flounder, Pseudopleuronectes Americanus (Waldbaum), in Rhode Island waters. MS Thesis, Univ. of Rhode Island. 52 p. Berry, R.J., S.B. Saila and D.B. Horton. 1965. Growth studies of winter flounder,
Pseudopleuronectes americanus (Waldbaum), in Rhode Island. Trans. Amer. Fish.
Soc. 94:259-264.
Buckley, L., J. Collie, L. Kaplan, and J. Crivello. 2008. Winter Flounder Larval Genetic
Population Structure in Narragansett Bay, RI: Recruitment to Juvenile Young-of-the-
Year. Estuaries and Coasts. 31:745-754.
Collie, J.S., A.D. Wood, and H.P. Jeffries. 2008. Long-term shifts in the species composition
of a coastal fish community. Can. J. Fish. Aquat. Sci. 65:1352-1365.
Gibson, M. 2010. Salt Pond Winter Flounder Fishery Issue Paper, Internal document RI
Division of Fish and Wildlife, 11p. McNamee, Jason. 2012. Personal Communication Olszewski, Scott. 2012. Personal Communication Oviatt, C. A. 2004. The changing ecology of temperate coastal waters during a warming trend.
Estuaries. 27: 895-904.

Table 1: 2019 Coastal Pond Survey Winter Flounder Frequency by Station and Month
Station May Jun July Aug Sep Oct Totals Mean STD CP1 0 5 45 0 6 2 58 9.67 17.49 CP2 13 4 1 2 0 2 22 3.67 4.76 CP3 4 4 0 4 1 2 15 2.50 1.76 CP4 0 0 0 0 3 0 3 0.50 1.22 GH1 0 1 0 0 0 0 1 0.17 0.41 GH2 0 2 0 0 0 0 2 0.33 0.82 NR1 18 2 4 0 0 0 24 4.00 7.04 NR2 6 17 43 53 5 9 133 22.17 20.69 NR3 0 3 13 1 4 2 23 3.83 4.71 PJ1 0 1 0 0 0 0 1 0.17 0.41 PJ2 1 3 10 1 5 6 26 4.33 3.44 PJ3 0 18 4 4 3 0 29 4.83 6.71 PJ4 2 0 48 13 1 3 67 11.17 18.65 PP1 0 2 0 0 0 0 2 0.33 0.82 PP2 0 0 0 0 0 0 0 0.00 0.00 PR1 0 5 14 1 2 0 22 3.67 5.39 PR2 0 12 4 0 0 0 16 2.67 4.84 PR3 1 6 1 0 0 0 8 1.33 2.34 QP1 4 21 11 4 1 3 44 7.33 7.50 QP2 6 35 24 9 11 4 89 14.83 12.12 QP3 0 25 1 12 6 3 47 7.83 9.45 WP1 2 3 25 41 11 12 94 15.67 14.91 WP2 3 14 4 20 9 6 56 9.33 6.56 WP3 8 10 3 1 6 1 29 4.83 3.76 Totals 68 193 255 166 74 55 811 Mean 2.83 8.04 10.63 6.92 3.08 2.29 33.79 STD 4.60 9.21 15.23 13.50 3.57 3.17 34.37
Table 2: 2019 Coastal Pond Survey winter flounder abundance indices (fish/seine haul) by pond and month
Waterbody May June July Aug Sept Oct Charlestown Pond 4.00 3.25 11.50 1.50 2.25 1.50 Green Hill Pond 0.00 1.50 0.00 0.00 0.00 0.00 Narrow River 7.67 7.33 20.00 18.00 3.00 3.33 Pawcatuck River 0.33 7.67 6.33 0.33 0.67 0.00 Point Judith Pond 0.75 5.50 15.50 4.50 2.25 2.25 Potter's Pond 0.00 1.00 0.00 0.00 0.00 0.00 Quonochontaug Pond 2.67 26.67 12.00 8.33 6.00 3.33 Winnapaug Pond 4.00 9.00 10.67 20.67 8.67 6.33 Total Pond Index 2.63 8.00 10.63 6.92 3.04 2.25

Table 3: 2019 Coastal Pond Survey average lengths (cm) of juvenile winter flounder by pond and month
Waterbody May June July August September October Charlestown Pond 4.89 4.99 5.61 8.10 8.01 7.73 Greenhill Pond 0.00 7.67 0.00 0.00 0.00 0.00 Narrow River 4.95 6.09 5.48 5.48 6.66 9.18 Pawcatuck River 3.80 5.57 5.36 4.80 6.80 0.00 Point Judith Pond 3.87 5.91 5.31 5.91 6.16 8.16 Potter Pond 0.00 9.50 0.00 0.00 0.00 0.00 Quonochontaug Pond 6.25 5.43 5.43 5.47 6.29 7.55 Winnapaug Pond 3.92 4.62 5.17 5.22 5.88 6.37 Overall 4.86 5.51 5.41 5.52 6.42 7.59
Table 4: 2019 Coastal Pond Survey bluefish abundance indices (fish/seine haul) by pond and month
Waterbody May June July August September October Charlestown Pond 0.00 0.00 0.00 0.00 0.25 0.00 Green Hill Pond 0.00 0.00 0.00 0.00 0.00 0.00 Narrow River 0.33 0.00 0.00 0.00 0.00 0.00
Pawcatuck River 0.00 0.00 0.00 1.00 0.67 0.00
Point Judith Pond 0.00 0.00 0.00 0.00 0.00 0.00 Potter Pond 0.00 0.00 0.00 0.00 0.00 0.00 Quonochontaug Pond 0.00 0.00 0.00 0.00 0.00 0.00 Winnapaug Pond 0.00 0.00 0.00 11.67 0.00 0.00 Total Pond Index 0.04 0.00 0.00 1.58 0.13 0.00
Table 5: 2019 Coastal Pond Survey tautog abundance indices (fish/seine haul) by pond and month
Waterbody May June July August September October Charlestown Pond 0.25 0.00 7.75 30.25 14.75 2.00 Green Hill Pond 0.00 0.00 0.00 0.50 0.50 0.50 Narrow River 2.67 0.00 1.00 12.67 20.33 3.00 Pawcatuck River 0.33 1.33 0.67 9.67 6.33 0.33 Point Judith Pond 0.00 0.25 0.50 0.75 2.25 0.00 Potter Pond 0.00 0.00 1.00 2.50 4.00 1.00 Quonochontaug Pond 0.00 0.00 1.67 0.67 0.00 0.33 Winnapaug Pond 0.00 0.00 1.00 2.33 0.00 0.00 Total Pond Index 0.42 0.21 2.00 8.58 6.54 0.92

Table 6: 2019 Coastal Pond Survey black sea bass abundance indices (fish/seine haul) by pond and month
Waterbody May June July August September October Charlestown Pond 0.00 0.25 0.00 1.50 6.00 2.50 Green Hill Pond 0.00 0.00 0.00 0.00 0.00 0.00 Narrow River 0.00 0.00 0.33 3.33 16.33 1.67 Pawcatuck River 0.00 0.00 0.00 0.00 0.00 0.00 Point Judith Pond 0.00 0.00 0.00 0.00 3.50 0.00 Potter Pond 0.00 0.00 0.00 0.00 1.50 0.00 Quonochontaug Pond 0.00 0.00 0.00 0.33 1.33 0.33 Winnapaug Pond 0.00 0.00 0.00 2.00 3.33 0.67 Total Pond Index 0.00 0.04 0.04 0.96 4.33 0.75
Table 7: 2019 Coastal Pond Survey Scup abundance indices (fish/seine haul) by pond and month
Waterbody May June July August September October Charlestown Pond 0.00 0.00 10.25 26.75 12.00 0.00 Green Hill Pond 0.00 0.00 0.00 0.00 0.00 0.00 Narrow River 0.00 0.00 0.67 1.00 0.00 0.00 Pawcatuck River 0.00 0.00 3.67 2.33 1.67 0.00 Point Judith Pond 0.00 0.00 0.00 0.00 0.00 0.00 Potter Pond 0.00 0.00 0.00 3.50 1.50 0.00 Quonochontaug Pond 0.00 0.00 0.33 5.33 0.00 0.00 Winnapaug Pond 0.00 0.00 0.00 1.00 0.00 0.00 Total Pond Index 0.00 0.00 2.29 5.96 2.33 0.00
Table 8: 2019 Coastal Pond Survey Clupeid abundance indices (fish/seine haul) by month
Species May June July August September October Alewife 0.00 9.88 0.46 0.17 0.13 0.08 Bay Anchovy 0.25 0.00 0.00 0.00 0.21 0.00 Atlantic Herring 7.08 0.04 0.00 0.00 0.00 0.00 Blueback herring 0.00 0.00 0.00 0.00 0.00 0.00 Atlantic Menhaden 0.00 2.13 1.58 1847.17 388.25 103.54

Table 9: 2019 Coastal Pond Survey Silverside abundance indices (fish/seine haul) by pond and month
Waterbody May June July August September October Charlestown Pond 26.00 111.75 75.25 394.50 214.50 212.75 Green Hill Pond 25.50 2.50 38.50 78.00 274.00 69.00 Narrow River 2.33 1.67 9.00 54.00 30.67 17.33 Pawcatuck River 4.67 2.33 4.67 23.00 172.67 4.67 Point Judith Pond 0.75 18.00 215.00 43.00 34.00 31.75 Potter Pond 6.00 3.50 144.00 116.50 81.50 21.00 Quonochontaug Pond 9.33 0.00 27.00 33.00 29.33 23.00 Winnapaug Pond 7.00 0.00 25.00 618.67 188.00 88.67 Total Pond Index 10.00 22.63 71.79 180.21 123.63 64.96
Table 10: 2019 Coastal Pond Survey Striped Killifish abundance indices (fish/seine haul) by pond and month
Waterbody May June July August September October Charlestown Pond 3.25 1.00 1.75 25.25 65.00 27.50 Green Hill Pond 0.00 0.00 4.50 0.00 0.00 0.00 Narrow River 0.67 0.00 0.33 17.67 7.00 92.67 Pawcatuck River 8.00 0.00 15.00 36.33 103.33 1.00 Point Judith Pond 0.25 3.50 0.00 3.25 69.50 12.00 Potter Pond 0.00 0.00 0.00 1.00 5.00 1.50 Quonochontaug Pond 0.00 1.00 1.00 27.33 0.33 8.33 Winnapaug Pond 0.00 10.00 26.33 50.67 39.00 40.00 Total Pond Index 1.67 2.13 6.00 21.33 41.54 24.46
Table 11: 2019 Coastal Pond Survey Mummichog abundance indices (fish/seine haul) by pond and month
Waterbody May June July August September October Charlestown Pond 47.50 17.75 7.00 18.50 93.25 21.25 Green Hill Pond 14.00 17.50 76.50 86.00 18.50 23.00 Narrow River 60.00 206.33 26.67 56.00 8.00 2.67 Pawcatuck River 7.67 0.33 0.33 0.33 2.67 0.00 Point Judith Pond 11.00 1.75 4.75 3.25 23.00 12.75 Potter Pond 28.50 10.00 16.00 66.00 16.50 7.00 Quonochontaug Pond 0.00 0.00 2.00 9.33 0.00 3.33 Winnapaug Pond 0.00 6.67 16.00 10.67 50.67 31.67 Total Pond Index 21.75 32.21 15.29 25.83 29.96 12.88
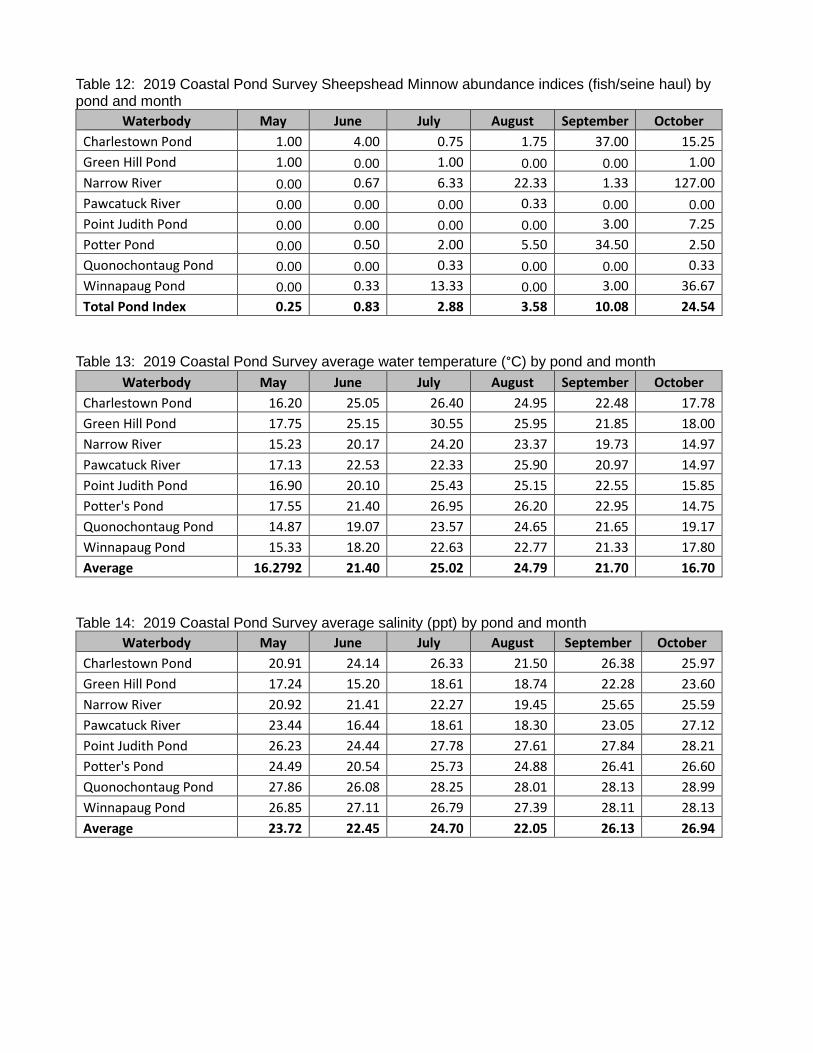
Table 12: 2019 Coastal Pond Survey Sheepshead Minnow abundance indices (fish/seine haul) by pond and month
Waterbody May June July August September October Charlestown Pond 1.00 4.00 0.75 1.75 37.00 15.25 Green Hill Pond 1.00 0.00 1.00 0.00 0.00 1.00 Narrow River 0.00 0.67 6.33 22.33 1.33 127.00 Pawcatuck River 0.00 0.00 0.00 0.33 0.00 0.00 Point Judith Pond 0.00 0.00 0.00 0.00 3.00 7.25 Potter Pond 0.00 0.50 2.00 5.50 34.50 2.50 Quonochontaug Pond 0.00 0.00 0.33 0.00 0.00 0.33 Winnapaug Pond 0.00 0.33 13.33 0.00 3.00 36.67 Total Pond Index 0.25 0.83 2.88 3.58 10.08 24.54
Table 13: 2019 Coastal Pond Survey average water temperature (°C) by pond and month
Waterbody May June July August September October Charlestown Pond 16.20 25.05 26.40 24.95 22.48 17.78 Green Hill Pond 17.75 25.15 30.55 25.95 21.85 18.00 Narrow River 15.23 20.17 24.20 23.37 19.73 14.97 Pawcatuck River 17.13 22.53 22.33 25.90 20.97 14.97 Point Judith Pond 16.90 20.10 25.43 25.15 22.55 15.85 Potter's Pond 17.55 21.40 26.95 26.20 22.95 14.75 Quonochontaug Pond 14.87 19.07 23.57 24.65 21.65 19.17 Winnapaug Pond 15.33 18.20 22.63 22.77 21.33 17.80 Average 16.2792 21.40 25.02 24.79 21.70 16.70
Table 14: 2019 Coastal Pond Survey average salinity (ppt) by pond and month
Waterbody May June July August September October Charlestown Pond 20.91 24.14 26.33 21.50 26.38 25.97 Green Hill Pond 17.24 15.20 18.61 18.74 22.28 23.60 Narrow River 20.92 21.41 22.27 19.45 25.65 25.59 Pawcatuck River 23.44 16.44 18.61 18.30 23.05 27.12 Point Judith Pond 26.23 24.44 27.78 27.61 27.84 28.21 Potter's Pond 24.49 20.54 25.73 24.88 26.41 26.60 Quonochontaug Pond 27.86 26.08 28.25 28.01 28.13 28.99 Winnapaug Pond 26.85 27.11 26.79 27.39 28.11 28.13 Average 23.72 22.45 24.70 22.05 26.13 26.94

Table 15: 2019 Coastal Pond Survey average dissolved oxygen (mg/L) by pond and month Waterbody May June July August September October
Charlestown Pond 10.90 9.13 8.22 12.63 8.23 8.68 Green Hill Pond 6.49 7.35 5.15 5.31 6.85 7.10 Narrow River 8.86 8.62 7.33 7.33 7.22 8.16 Pawcatuck River 10.39 8.23 8.50 8.05 8.44 9.46 Point Judith Pond 9.75 7.58 7.90 6.96 8.20 8.85 Potter's Pond 9.21 7.14 7.44 6.26 8.60 10.23 Quonochontaug Pond 8.43 7.07 6.80 8.34 6.45 7.96 Winnapaug Pond 9.59 6.40 6.25 8.43 7.62 7.40 Average 9.41 7.78 7.35 7.88 7.80 8.49
Table 16: 2019 Adult Winter Flounder tagging Survey (Fyke Net Survey) summary
Total WFL Caught Total CPUE
(fish/net hauls) Mature Males Mature Females Immature Unknown Maturity
47 2.24 17 26 2 2

Figure 1: Location of coastal ponds sampled by the Coastal Pond Juvenile Finfish Survey in Southern Rhode Island.
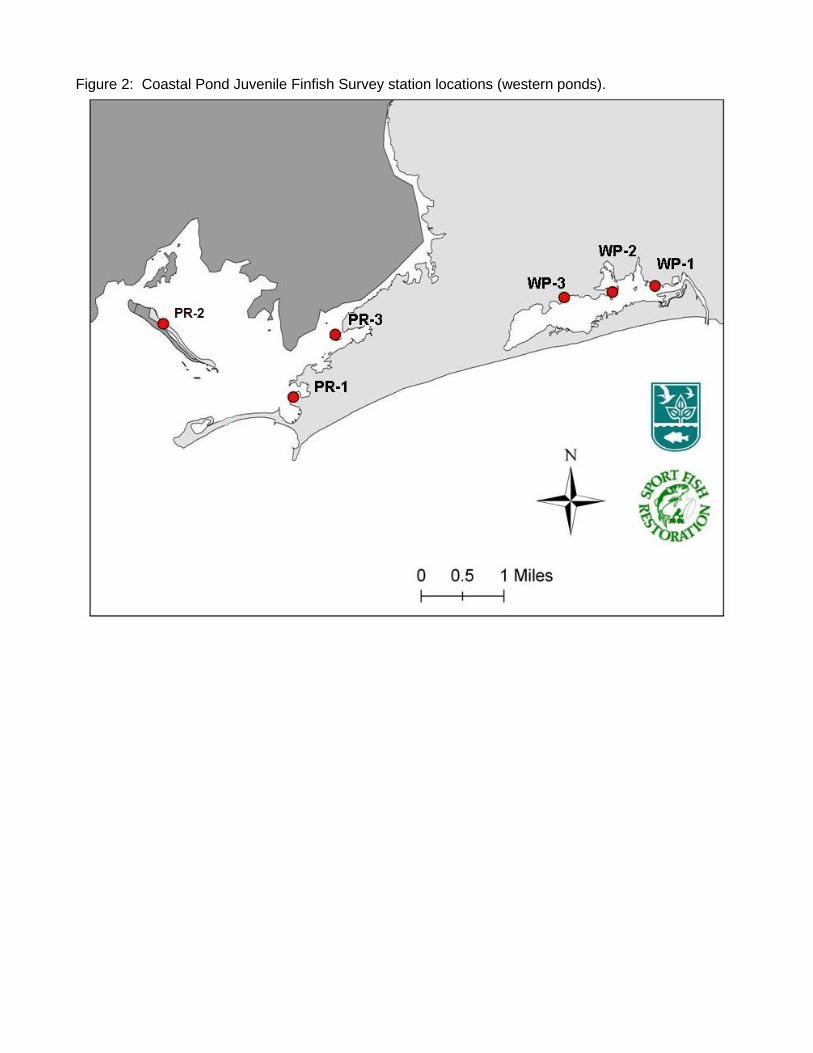
Figure 2: Coastal Pond Juvenile Finfish Survey station locations (western ponds).

Figure 2 (cont): Coastal Pond Juvenile Finfish Survey station locations (western ponds).

Figure 3: Coastal Pond Juvenile Finfish Survey station locations (eastern ponds).


Figure 5: Time series of abundance indices (fish/seine haul) for winter flounder YOY from all coastal ponds. Note: the vertical dashed line marks the addition of new stations in 2011.
0.00
10.00
20.00
30.00
40.00
50.00
60.00
CPU
E (fi
sh/h
aul)
Annual CPUE of YOY Winter Flounder by Pond
Narrow River
QuonochontaugPondPoint JudithPondCharlestownPondWinnapaugPondGreen Hill Pond
Potter's Pond
Pawcatuck River

Figure 6: 2019 abundance indices (fish/seine haul) for YOY winter flounder for each pond by month.
0
5
10
15
20
25
30
May June July Aug Sept Oct
CPU
E (fi
sh/h
aul)
2019 CPUE of YOY Winter Flounder by Pond and Month
Charlestown Pond
Green Hill Pond
Narrow River
Pawcatuck River
Point Judith Pond
Potter's Pond
Quonochontaug Pond
Winnapaug Pond

Figure 7: Length frequency of all winter flounder caught in Coastal Pond Survey during 2019. Note: YOY are to the left of the dashed line (<12cm TL)
0
5
10
15
20
25
30
35
40
45
0 1 2 3 4 5 6 7 8 9 10 11 12 13 14 15 16 17 18 19 20
Freq
uenc
y
Length (cm)
2019 Winter Flounder Length-Frequency from Coastal Pond Survey

Figure 8: Time series of annual abundance indices for winter flounder YOY from the coastal pond survey. Note: the vertical dashed line marks the addition of new stations in 2011.
Figure 9: Abundance indices (fish/haul) from the RIDMF Coastal Pond Survey, Narragansett Bay Seine Survey, and Spring Trawl Survey for winter flounder.
10
12
14
16
18
20
22
24
26
28
30
0
5
10
15
20
25
30
35
40
Aver
age
Tem
pera
ture
(°C)
CPU
E (fi
sh/h
aul)
Annual CPUE of YOY Winter Flounder vs Annual Average Water Temperature from the Coastal Pond Survey
WFL CPUE Average Water Temperature
0102030405060708090
100
CPU
E (fi
sh/h
aul)
Annual CPUE of Winter Flounder from the RIDMF Spring Trawl, Narragansett Bay Seine, and Coastal Pond Seine Surveys
CPS Spring Trawl NBS

Figure 10: Abundance indices (fish/haul) from the Coastal Pond Survey and the Adult Winter Flounder Tagging Survey for winter flounder.
Figure 11. Time series of annual abundance indices for bluefish from the coastal pond survey.
0
5
10
15
20
25
30
35
40
45
50
CPU
E (fi
sh/h
aul)
CPUE of Winter Flounder from RIDMF Adult WFL Fyke Net and Juvenile Seine Surveys in Point Judith Pond
CPS Fyke
0
0.5
1
1.5
2
2.5
3
3.5
4
CPU
E (fi
sh/h
aul)
Annual CPUE of Bluefish from the Coastal Pond Survey

Figure 12. Time series of annual abundance indices for Tautog from the coastal pond survey.
0
1
2
3
4
5
6
7
CPU
E (fi
sh/h
aul)
Annual CPUE of Tautog from the Coastal Pond Survey

Figure 13. Time series of annual abundance indices for Black Sea Bass from the coastal pond survey.
Figure 14. Time series of annual abundance indices for Scup from the coastal pond survey.
0
0.5
1
1.5
2
2.5
3
3.5
4
4.5
CPU
E (fi
sh/h
aul)
Annual CPUE of Black Sea Bass from the Coastal Pond Survey
0
0.5
1
1.5
2
2.5
3
3.5
4
4.5
CPU
E (fi
sh/h
aul)
Annual CPUE of Scup from the Coastal Pond Survey

Figure 15. Time series of annual abundance indices for Clupeids from the coastal pond survey (Atlantic Menhaden on left y-axis, all other species on right y-axis)
Figure 16. Time series of annual abundance indices for Baitfish from the coastal pond survey (Atlantic Silversides on left y-axis, all other species on right y-axis).
0
2
4
6
8
10
12
14
0
100
200
300
400
500
600
700
CPU
E (fi
sh/h
aul)
Annual CPUE of Clupeids from the Coastal Pond Survey
Atlantic Menhaden Atlantic Herring Alewife Blueback Herring Bay Anchovy
0
10
20
30
40
50
60
0
50
100
150
200
250
300
CPU
E (fi
sh/h
aul)
Annual CPUE of Baitfish from the Coastal Pond Survey
Atlantic Silverside Sheepshead Minnow Mummichog Striped Killifish

Figure 17: Map of total YOY WFL collected at each station in 2019.

Figure 18: Map of total Bluefish collected at each station in 2019
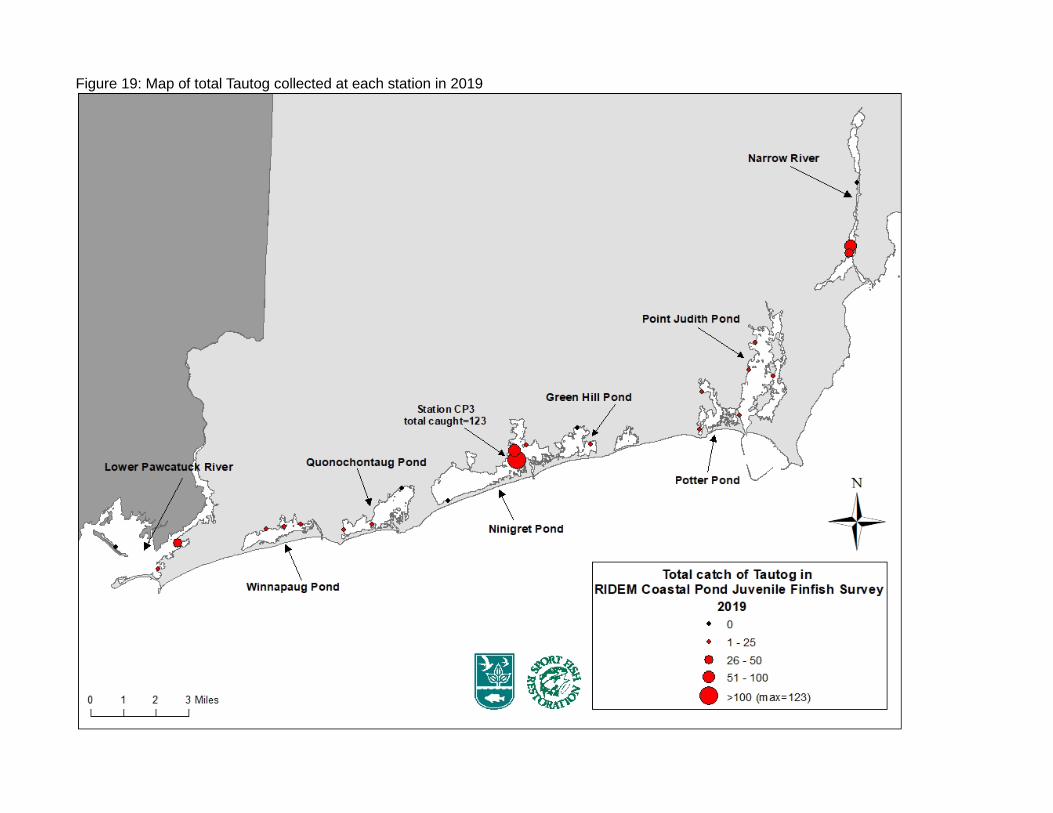
Figure 19: Map of total Tautog collected at each station in 2019

Figure 20: Map of total Black Sea Bass collected at each station in 2019

Figure 21: Map of total Scup collected at each station in 2019

Figure 22: Map of total River Herring collected at each station in 2019

Figure 23. Average recorded water temperature in the coastal ponds by month for 2019.
0.00
5.00
10.00
15.00
20.00
25.00
30.00
35.00
May June July August September October
Tem
pera
ture
(°C)
Month
Average Water Temperature by Pond and Survey Month
Charlestown Pond
Green Hill Pond
Narrow River
Pawcatuck River
Point Judith Pond
Potter's Pond
Quonochontaug Pond
Winnapaug Pond

Appendix 1: Catch frequency of all species by station for 2019 Coastal Pond Survey.
Species CP1 CP2 CP3 CP4 GH1 GH2 NR1 NR2 NR3 PJ1 PJ2 PJ3 PJ4 PP1 PP2 PR1 PR2 PR3 QP1 QP2 QP3 WP1 WP2 WP3
ALEWIFE (ALOSA PSEUDOHARENGUS) 3 80 1 4 2 11 155 1
ANCHOVY BAY (ANCHOA MITCHILLI) 6 5
BASS LARGEMOUTH (MICROPTERUS SALMOIDES) 1
BASS STRIPED (MORONE SAXATILIS) 2 2 2
BLUE CRAB (CALLINECTES SAPIDIUS) 2 1 1 2 1
BLUE CRAB FEMALE (CALINECTES SAPIDIUS) 6 6 2 12 17 15 38 24 17 5 2 13 15 3 3 1 2 10 6 1 1 13
BLUE CRAB MALE (CALINECTES SAPIDIUS) 5 7 13 22 26 30 51 33 38 4 4 25 41 5 1 2 3 7 5 4 1 2 21
BLUEFISH (POMATOMUS SALTATRIX) 1 1 3 1 1 35
BLUEGILL (LEPOMIS MACROCHIRUS) 1
BUTTERFLYFISH SPOTFIN (CHAETODON OCELLATUS) 1
COD ATLANTIC (GADUS MORHUA) 1 6
CORNETFISH BLUESPOTTED (FISTULARIA TABACARIA) 1 1
CUNNER (TAUTOGOLABRUS ADSPERSUS) 1 7 11 12 4 3 2 6 1 2 1 10
EEL AMERICAN (ANGUILLA ROSTRATA) 1 1 2 5 2 5 15 2 6 1
FLOUNDER SMALLMOUTH (ETROPUS MICROSTOMUS) 1 3 2 4 1 11
FLOUNDER SUMMER (PARALICHTHYS DENTATUS) 3 1 2 1 6 1 2 1
FLOUNDER WINTER (PSEUDOPLEURONECTES AMERICANUS) 58 22 15 3 1 2 24 133 23 1 26 29 67 2 22 16 8 44 89 47 94 56 29
GOBY NAKED (GOBIOSOMA BOSC) 2 1 3 3 2 4 5 1 1 16 4 1 1
GRUBBY (MYOXOCEPHALUS AENAEUS) 1 1 4 2 6 8 2 5 13 15 1
HERRING ATLANTIC (CLUPEA HARENGUS) 2 167 1 1
HORSESHOE CRAB FEMALE (LIMULUS POLYPHEMUS) 1 1 1 1 1
HORSESHOE CRAB MALE (LIMULUS POLYPHEMUS) 2 1 1 1
JACK CREVALLE (CARANX HIPPOS) 1 1 1 4 2
KILLIFISH STRIPED (FUNDULUS MAJALIS) 7 39 301 148 9 338 17 42 21 225 66 1 14 41 449 1 29 63 22 231 19 248
KINGFISH NORTHERN (MENTICIRRHUS SAXATILIS) 2 6 1 2
LIZARDFISH INSHORE (SYNODUS FOETENS) 3 1 2 1 2
LOOKDOWN (SELENE VOMER) 1
MENHADEN ATLANTIC (BREVOORTIA TYRANNUS) 865 1858 1 1194 1299 13 256 89 14 1 5 1 2 38214 4 12388 20
MINNOW SHEEPSHEAD (CYPRINODON VARIEGATUS) 15 79 121 24 6 1 461 11 22 10 9 84 6 1 1 1 17 90 53
MOJARRA SPOTFIN (EUCINOSTOMUS ARGENTEUS) 1 1 1 1 2
MOONFISH ATLANTIC (SELENE SETAPINNIS) 2 1
MULLET WHITE (MUGIL CUREMA) 1 8 27 3 192
MUMMICHOG (FUNDULUS HETEROCLITUS) 58 225 472 66 400 71 8 887 184 176 16 9 25 210 78 8 1 25 20 19 5 218 20 109
NEEDLEFISH ATLANTIC (STRONGYLURA MARINA) 1 3 3 1 1 1 1 2 3 1 2 4 6
PERCH WHITE (MORONE AMERICANA) 1 157 2
PERMIT (TRACHINOTUS FALCATUS) 1 1 3

Species CP1 CP2 CP3 CP4 GH1 GH2 NR1 NR2 NR3 PJ1 PJ2 PJ3 PJ4 PP1 PP2 PR1 PR2 PR3 QP1 QP2 QP3 WP1 WP2 WP3
PIPEFISH NORTHERN (SYNGNATHUS FUSCUS) 5 16 2 9 3 9 2 3 6 1 2 7 11 6 1 3 3 1 2 1
POLLOCK (POLLACHIUS VIRENS) 1
PUFFER NORTHERN (SPHOEROIDES MACULATUS) 1 1 4 2 3 3 2
RAINWATER KILLIFISH (LUCANIA PARVA) 64 230 161 4 16 47 45 5 32 2 34 221 3 2 2
SAND LANCE AMERICAN (AMMODYTES AMERICANUS) 2 1
SCAD MACKEREL (DECAPTERUS MACARELLUS) 1
SCUP (STENOTOMUS CHRYSOPS) 34 124 34 4 2 3 10 12 11 17 2 1
SEA BASS BLACK (CENTROPRISTIS STRIATA) 23 13 5 50 15 12 1 1 3 1 5 3 14 1
SEAHORSE LINED (HIPPOCAMPUS ERECTUS) 1 1
SEAROBIN NORTHERN (PRIONOTUS CAROLINUS) 1 5 1 1 2
SEAROBIN STRIPED (PRIONOTUS EVOLANS) 4 1 7
SENNET NORTHERN (SPHYRAENA BOREALIS) 3 1 3 1
SILVERSIDE ATLANTIC (MENIDIA MENIDIA) 358 940 1511 1330 822 153 30 131 184 754 130 356 130 119 626 248 312 76 77 87 201 1331 494 957
SNAPPER RED (LUTJANUS CAMPECHANUS) 1
SPOT (LEIOSTOMUS XANTHURUS) 2 2 6 70 2 7 2
STICKLEBACK FOURSPINE (APELTES QUADRACUS) 13 197 462 6 51 159 5 51 15 29 1 1 20 11 18 3 2 1
STICKLEBACK THREESPINE (GASTEROSTEUS ACULEATUS) 28 1 1
TAUTOG (TAUTOGA ONITIS) 18 79 123 3 70 49 8 4 1 2 1 16 24 32 7 1 2 7 1
TOADFISH OYSTER (OPSANUS TAU) 4 2 8 3 2 1 2 20 3
TOMCOD ATLANTIC (MICROGADUS TOMCOD) 9 2 1 1 1 1 4 1 4 1
1
ASSESSMENT OF RECREATIONALLY IMPORTANT FINFISH STOCKS IN RHODE ISLAND WATERS
NARRAGANSETT BAY JUVENILE FINFISH SURVEY
Anna Gerber-Williams Principal Marine Fisheries Biologist
M. Conor McManus
Deputy Chief
R. I. Division of Marine Fisheries
Ft. Wetherill Marine Laboratory 3 Ft. Wetherill Road
Jamestown, Rhode Island 02835
2019

2
PERFORMANCE REPORT STATE: Rhode Island PROJECT NUMBER: F-61-R SEGMENT NUMBER: 24 PROJECT TITLE: Assessment of Recreationally Important Finfish Stocks in Rhode Island Waters. PERIOD COVERED: 1 January 2014 - 31 December 2019 JOB NUMBER AND TITLE: IV - Juvenile Marine Finfish Survey JOB OBJECTIVE: To monitor the relative abundance and distribution of the juvenile life history stage of winter flounder (Pseudopleuronectes americanus), tautog (Tautoga onitis), bluefish (Pomatomus saltatrix), scup (Stenotomus crysops), weakfish (Cynocion regalis), black sea bass (Centropristis striata), alewife (Alosa pseudoharengus), blueback herring (Alosa aestivalis), Atlantic menhaden (Brevoortia tyrannus), Atlantic herring (Clupea harengus), striped bass (Morone saxatilis), and other selected species of commercial and recreational importance in Narragansett Bay. To use these data to evaluate short- and long-term annual changes in juvenile population dynamics, to provide data for stock assessments, and for the development of Fishery Management Plans. To collect fish community data that is used to continue to identify, characterize, and map essential juvenile finfish habitat in Narragansett Bay. SUMMARY: Eighteen fixed stations (Figure 1) around Narragansett Bay were sampled once a month from June through October 2019 with the standard 61 x 3.05 m beach seine. Adults and juveniles of seventy-five species were collected during the 2019 survey. For comparison eighty species were collected in 2015, the highest number of species and families collected since the survey began. For the entire survey time series (1988 – 2019), all individuals of the target species: winter flounder, tautog, bluefish, weakfish, black sea bass, scup, river herring, sea herring, and menhaden were enumerated and measured. With few exceptions (noted) all individuals of these species that were collected in the survey were juveniles. Adult and juveniles of other species collected were not differentiated for data analysis or descriptive purposes prior to 2009. Presence and relative abundance (few, many, abundant) of three forage species: Atlantic silversides (Menidia menidia), common mummichog (Fundulus heteroclitus) and striped killifish (Fundulus majalis) had been noted until 2009. Since 2009 all finfish species caught were enumerated and measured. Invertebrate species were noted and enumerated using the relative abundance scale as noted above (with the exception of blue crabs, horseshoe crabs and squid). Data on weather, water temperature, salinity, and dissolved oxygen were recorded at each station. TARGET DATE: December 31, 2019 SIGNIFICANT DEVIATIONS: There were no significant deviations to methodology in 2019. RECOMMENDATIONS: Continue standard seine survey at all eighteen stations. Continue to

3
provide comments and recommendations to other resource management and regulatory agencies regarding potential anthropogenic impacts to fisheries resources and habitat. Continue to analyze and provide data for use in fisheries stock assessments. A reassessment and characterization of the habitat at each station should be undertaken to see if any major changes have occurred since the original evaluation. REMARKS: Abundance trends derived from adult data collected from the RIDMF seasonal trawl survey since 1979 indicate a declining abundance of demersal species and an increasing abundance for pelagic species in Rhode Island waters. It should be noted that the trawl survey samples both adult and juvenile fish and invertebrates. This trend has also been observed in other estuaries along the Atlantic coast. Reasons for these shifts are attributed to a number of factors but may not be limited to these factors. These include the effects of climate change, warming coastal waters, water quality, habitat degradation and loss, overexploitation of some species leading to niche replacement by other species, and trophic level changes and shifts associated with all of these factors. Anthropogenic affects and the synergy between factors have no doubt led to changes in fish communities along the coast (Kennish, 1992). A non-parametric Mann-Kendall test for trend significance can be used to show annual abundance trends for species collected during this juvenile survey. Two iterations of this test were run on for a set of target species. The first iteration analyzed the entire dataset and then a second iteration of this non- parametric trend analysis was done using a shortened time period of 10 years. While most of the target species do not have any significant long-term trend, bluefish (p = 0.013) and winter flounder (p = 0.0001) are showing a decreasing trend (Table 1a). However, River Herring (p = 0.005), and Tautog (p = 0.0006) show a positive increasing trend in the shortened 10-year analysis (Table 1b). Other species, such as menhaden and striped bass, show no abundance trend for either the full dataset or the past ten years (Table 1a, b). Reductions and annual fluctuations in abundance of many species may be attributed to a number of factors outlined above. Any one or more of these factors and/or the synergy between them may be responsible for inhibiting populations of some species from returning to historic or in some cases sustainable levels. Continued monitoring of juvenile fish populations is necessary to document the abundance and distribution of important species as well as the interactions between species. Further, this data can be analyzed to evaluate the effectiveness of management actions, an example being a spawning closure enacted for tautog in 2006 and then lengthened in 2010. This spawning closure was in part supported by the data derived from this survey. Trends in abundance and shifts in fish community composition can also be evaluated with these data. While the primary purpose for conducting this survey is to provide data for making informed fisheries management decisions, these data are also used when evaluating the adverse impacts of dredging and water dependent development projects. METHODS, RESULTS & DISCUSSION: A 61m x 3.05m beach seine, deployed from a 22’ boat, was used to sample the juvenile life stage of selected fish species in Narragansett Bay. Monthly seine collections were completed at the eighteen standard survey stations (Figure 1) from June through October 2019.

4
Number of individuals and lengths were recorded for all finfish species. While both juveniles and adults were represented in the collections for many species, individuals collected for the target species were predominately young-of-the-year juveniles (YOY). Species and number of individuals (both juveniles and adults) of invertebrate species collected were also recorded with the use of a relative index of abundance (abundant, many, few). Tables 3 - 7 show the species occurrence and number caught at each station for June through October. Table 8 is a summary table for all stations and species collected during the 2018 survey. Tables 9-13 provide the number of fish/seine haul for each station along with the station mean, monthly mean, and annual abundance index for each target species. Figures 2 – 10 show the annual abundance index trends for a number of important species for both the original and standardized indices. It should be noted when interpreting these data, that the survey began in 1986 with fifteen stations. The data represented in the graphs begins in 1988 as the period of time when the survey began using consistent methodology with the 15 stations. Station 16 (Dyer Is.) was added in June 1990, station 17 (Warren R.) was added in July of 1993, and station 18 (Wickford) was added in July of 1995. The addition of the stations is standardized in the analysis, see appendix A. Table 15 provides bottom temperature, salinity, and dissolved oxygen data for each station by month. Winter flounder Juvenile winter flounder (Pseudopleuronectes americanus) were present in forty-two percent of the seine hauls for 2019. This is an increase from 2018 when they were present in thirty-two percent of the hauls. A total of 327 fish were collected in 2019 (three of the fish collected in 2019 would not be considered young-of-the-year (YOY) according to Table 2 winter flounder maximum size by month). This was a decrease from the 129 individuals collected during the 2018 survey. They were present at eighteen stations and were collected in all months (Table 9). The 2019 juvenile winter flounder standardized abundance index was 3.63 ± 1.46 fish/seine haul; this is higher than the 2018 index of 1.55 ± 0.45 S.E. fish/seine haul. Figure 2 shows the standardized annual abundance indices since 1988. The Mann-Kendall test showed no significant abundance trend for this species for the full dataset, but a decreasing trend in the last 10 years (Table 1a, b). June had the highest mean monthly abundance of 12.56 ± 10.54 S.E. fish/seine haul. Chepiwanoxet (Sta. 3), Spectacle Cove (Sta. 13), and the Warren River (Sta. 17) had the highest mean station abundance of 46.20 ± 37.02, 4.20 ± 3.01 S.E., and 3.60 ± 1.57 S.E., respectively. Overall upper and mid bay stations continue to have higher abundances than lower bay stations. This is expected since the primary spawning area for this species is believed to be in the Providence River followed by a secondary spawning area in Greenwich Bay where Station 3 is located. Winter flounder length frequency data from the 2019 survey indicate that all except three of the winter flounder collected were young-of-the-year (YOY). The maximum lengths by month for YOY winter flounder used for this report are supported by growth rates in Rhode Island waters as reported in the literature (Delong et al, 2001; Meng et al, 2000; Meng et al, 2001; Meng et al, 2008). See Table 2 for maximum YOY lengths by month.

5
Figure 2 shows the 2018 abundance index continues to be lower than most years since 2000, the survey high. The Division of Fish and Wildlife’s trawl survey data (sampling both adults and juveniles) saw a small increase in winter flounder from 2018 to 2019. Over the course of the Narragansett Bay Juvenile Finfish Seine Survey the abundance index rose between 1995 and 2000, but then decreased with variability to 2018. The Mann-Kendall trend analysis shows no trend in the abundance of juvenile winter flounder in Narragansett Bay over the entire time series, and the declining trend indicated for the shortened 10-year time series in the terminal year of 2012 has dissipated, now showing no trend as we move away from the peak years of the early 2000’s. The dramatic abundance fluctuations over the past ten years shown in Figure 2 and the declining trend over the last decade continue to be a concern to resource managers. Tautog During the 2019 survey 1689 juvenile and 8 adult (>26 cm length) tautog (Tautoga onitis) were collected. This is an increase from the 2018 survey when 902 juveniles were collected. The 2019 abundance index was 18.86 ± 5.00 S.E. fish/seine haul, an increase from the 2018 index 10.87 ± 3.11 S.E. (Figure 3). As indicated in the introduction, based on this survey data, it can be concluded that the spawning closure enacted in 2006 and then extended in 2010 may be having an impact on the number of juveniles produced during the spring as there appears to be an increasing trend since this time period. It may take some time for a slow growing species such as tautog to recoup its spawning stock biomass to levels that will have significant impacts and major increases in biomass; therefore, we will continue to monitor this species closely in the coming years. Juvenile tautog were collected in sixty-two percent of the seine hauls in 2019 (Table 10). This is an increase from 2018 when they were present in fifty-five percent of the seine hauls. August and September had the highest mean monthly abundances of 68.83 ± 41.19 S.E. and 11.17 ± 3.99 S.E. fish per seine haul, which corresponds to the majority of the survey time series data which indicates August as being the month with the highest abundance. Pojac Point (Sta. 4) had the highest mean station abundance of 156.40 ± 150.17 S.E. which was driven by high sampling numbers in August (757 fish). Patience (Sta. 5) and Hog Island (Sta. 9) had the next highest abundances with a mean station abundance of 44.00 ± 22.67 S.E. and 22.60 ± 13.79 S.E. fish/seine haul respectively. The Mann-Kendall test showed no long-term trend in juvenile abundance, but a short-term increase in abundance for juvenile tautog is present for the 10-year series (Table 1a, b). It is plausible that the spawning closure is positively impacting the juvenile tautog population, and the increasing trend in the Mann-Kendall test supports this. It should be noted that this survey data was used as a young of the year index for the benchmark stock assessment for tautog by the Atlantic States Marine Fisheries Commission (ASMFC 2016). Our Narragansett Bay trawl survey had an increase in abundance for tautog from 2018 to 2019. There would be a lag in time between when juveniles are caught in the seine survey and when the cohort shows up in the trawl survey, but the trends are worth monitoring. Bluefish During the 2019 survey 992 juvenile bluefish (Pomatomus saltatrix) were collected. This is an increase from the 112 juveniles collected in 2018. Juveniles were present in twenty-three

6
percent of the seine hauls and were collected at twelve of the eighteen stations (Table 11). They were present in all months except for June and October, with the highest abundance occurring in September. June and October 2019 had no juvenile bluefish collected during the survey, which is most likely due to the colder water temperatures (13.6 – 16.1° C in October and 16.4 – 24.3° C in June), with most sampling days occurring later in the month when temperatures fell below 16° C. Since this survey began and prior to 2016, only two hundred seventy-two juvenile bluefish have been collected in October, in seven different years (1990, 1997, 1999, 2005, 2011, 2012, 2015, 2016, and 2017), and only when water temperatures were 16 – 21° C. The abundance index for 2019 was 11.02 ± 1.41 S.E. fish/seine haul. This is higher than the 2018 abundance index of 1.35 ± 0.85 S.E. fish/seine haul (Figure 4). The Mann-Kendall test showed a significant decrease in long-term abundance, however there is no 10-year abundance trend for this species (Table 1a, b). September had the highest mean monthly abundance of 23.67 ± 15.94 S.E. fish/seine haul (Table 11). July and August are typically the months of highest juvenile abundance for this species. The only exception to this was in 2005 when September had the highest mean monthly abundance. This was probably due to the higher than normal water temperatures during September 2005. In 2019, Conimicut Point (Sta. 2) had the highest mean station abundances of 83.04 ± 53.29 S.E. (Table 11). This is driven by a large catch in July (283 fish). Length frequency data for 2019 indicates that all juveniles collected were young-of-the-year individuals. The spatial distribution and abundance of juvenile bluefish in Narragansett Bay is highly variable and is dependent on a number of factors: natural mortality, fishing mortality, size of offshore spawning stocks, spawning success, number of cohorts, success of juvenile immigration into the estuaries, and the availability of appropriate size prey species like Atlantic silversides (Menidia menidia) when juveniles enter the bay. The annual abundance indices since 1988 show dramatic fluctuations supporting a synergy of these factors affecting recruitment of this species to Narragansett Bay (Figure 4). Striped Bass During the 2019 survey 23 striped bass (Morone saxatalis) were collected. This is an increase from 2018 which had an abundance of 14 fish. Striped bass were present in eleven percent of the seine hauls and were collected at seven of the eighteen stations (Table 14). They were present in June, July, August, September, and October. The abundance index for 2019 was 0.24 ± 0.12 S.E. fish/seine haul. This is slightly higher than in 2018, which had an abundance index of 0.17 ± 0.08 S.E. fish/seine haul (Figure 8). The Mann-Kendall test showed no abundance trend for this species for the entire dataset or for the shortened 10-year series (Table 1a, b). September had the highest mean monthly abundance of 0.83 ± 1.95 S.E. fish/seine haul (Table

7
12). June had the second highest mean monthly abundance at 0.28 ± 0.75 S.E. fish/seine haul. September and October are usually the months with the highest abundance for the entire time series. In 2019, striped bass were only present at 7 stations, Patience (Sta. 5), Dutch Island (Sta. 7), Rose Island (Sta. 10), Kickimuit River (Sta. 11), Spar Island (Sta. 12), Dyer Island (Sta. 16), and Wickford (Sta. 18). The highest abundance was found at Dyer Island with 2.51 ± 1.12 S.E. fish/seine haul, which was driven by a single catch of 6 fish in September, 1 in July, and 1 in August. The station with the highest abundance each year is variable, though it does tend to be the lower bay stations in general for the entire time series. Length frequency data for 2019 indicates that a mix of juveniles and adults were collected. This is normal for the seine survey. The spatial distribution and abundance of striped bass in Narragansett Bay is highly variable and is most likely highly dependent on the availability of appropriate size prey species like Atlantic silversides (Menidia menidia) and juvenile menhaden (Brevoortia tyrannus) when fish enter the bay. The annual abundance indices since 1988 show fluctuations in abundance from year to year (Figure 8), but generally appears to have had an increasing trend during the late 90s to early 2000s, but now appears to be on a downward trajectory since 2008, although in recent years there seems to be a very slight upward trend. The standardized index, which accounts for some of these factors, follows a similar trend year to year as the straight catch per unit effort (CPUE) index. Clupeidae Four species of clupeids are routinely collected during the survey. Alewife (Alosa pseudoharengus) and blueback herring (Alosa aestivalis), collectively referred to as river herring, and Atlantic menhaden (Brevoortia tyrannus) are most common. Atlantic herring (Clupea harengus) have also been collected during the surveys time series but in very small numbers. River Herring Due to the large numbers of anadromous herring collected, and the difficulty of separating juvenile alewives from juvenile blueback herring without sacrificing them, both species are combined under the single category of river herring. Data collected from this survey and the Division of Fish and Wildlife’s Anadromous Fish Restoration Project show alewives to be the predominate river herring species collected, although both species are present and have been stocked as part of the Division’s restoration efforts. River herring were present in forty percent of the seine hauls and were collected at seventeen of the eighteen stations during 2019 and were present in all months. A total of 44,599 juveniles were collected in 2019, an increase from the number collected in 2018 (1,364 fish). The highest mean monthly abundance for 2019 occurred during July and was 2426.56 ± 2178.66 S.E. fish/seine haul. The Fogland (Sta 14), Third Beach (Sta. 15), and Hog Island (Sta. 9) had the highest mean station abundance of 7886.00 ± 7884.00 S.E., 285.80 ± 285.80 S.E., and 269.80 ± 251.95 S.E., respectively (Table 13). Fogland experienced a single large catch in July (39,422 fish), Third Beach experienced a single large catch in July (1,429 fish), and Hog Island

8
experienced a single large catch in July (1,276 fish), which drove their mean station abundances. Single large catches of these species are due to their schooling behavior and is the reason for the high standard error associated with the indices. The standardized abundance index for 2019 was 495.54 ± 41.18 S.E. fish/seine haul (Figure 5). The annual abundance indices since 1988 show dramatic fluctuations as is a common occurrence with schooling clupeid species. Due to these fluctuations, there was no significant trend in the Mann-Kendall test for the long-term abundance data (Table 1a), however, the short-term shows a significant increase over the past 10-year (Table 1b). Figure 6 shows the estimated spawning stock size of river herring as monitored by our Anadromous Fish Restoration Program at two fishways in Rhode Island. There may be some correlation between increasing numbers of returning adult fish (Figure 6) and the abundance index generated by this survey (Figure 5) as the recent small increases in juvenile abundance in the data corresponds to an increase in returning adults, and vise versa. Due to an extended period of low abundance of river herring in Rhode Island, the taking of either species of river herring is currently prohibited in all state waters. Menhaden Twenty-four thousand, six hundred and ten Atlantic menhaden (Brevoortia tyrannus) were collected during the 2019 survey, a decrease from 2018 when 37,229 fish were caught. The 2017 abundance is one of the highest in recent years; the last high abundance was 2007, when eight thousand two hundred fifty-three juveniles were collected. They were present in twenty-two percent of the seine hauls and were collected at eleven of the eighteen stations (Table 12). The highest mean monthly abundance for 2019 occurred during October and was 22,275.00 ± 901.47 S.E. fish/seine haul. Conimicut Point (Sta. 8) had the highest mean station abundance of 3,007.20 ± 3,007.20 S.E. (Table 14) which was driven by a single large catch in October of 15,036 fish. Single large catches of these species are due to their schooling behavior and is the reason for the high standard error associated with the indices. The standardized abundance index for 2019 was 107.04 ± 91.44 S.E. fish/seine haul. This is less than 2018 (448.54 ± 282.40 S.E. fish/seine haul, Figure 7). The standardized index indicates an increased abundance during the 2000s followed by lower numbers through the 2010s. In the most recent years an increasing abundance is evident. Our Narragansett Bay trawl survey showed a decrease in menhaden abundance from 2018 to 2019. The trawl survey catches juveniles as well as some age one fish. The Mann-Kendall test showed no long-term or 10-year abundance trend for this species (Table 1a and 1b). Similar to river herring, juvenile menhaden were also observed in very large schools around Narragansett Bay and as discussed earlier, this behavior often results in single large catches resulting in a high abundance index and large standard error. This schooling behavior also contributes to the variability of their spatial and temporal abundance from year to year. Because of these characteristics it is difficult to develop an abundance index that will accurately reflect the number of juveniles observed in the field rather than the number represented in the samples. The standardization techniques used for analysis this year are an effort to take in to account this

9
variability and high percentage of zero catches through the use of a delta lognormal model (Appendix A). Weakfish There were 6 weakfish, Cynocion regalis, collected during the 2019 survey. Weakfish were present in four percent of the seine hauls and were collected at four of the eighteen stations during 2019, an increase from the number collected in 2018 (0 fish). Station 3 in Greenwich Bay and Station 4 at the mouth of the Potowomut River, immediately south of Greenwich Bay, are the stations where this species is typically collected most frequently. The abundance trend over the past several years indicate the juvenile population of this species in Narragansett Bay fluctuates dramatically, a trend also reflected in our trawl survey. There, have been 11 years since 1988 where no fish have been caught. Seven of the 11 total zero catch years occur after 2004. Possible reasons for this high variability in abundance, other than fishing pressure, may be environmental and anthropogenic factors that affect spawning and nursery habitat. Survival rate at each life history stage may also be influenced by these factors. The literature indicates this species spawns in calm coves within the estuary and juveniles move up the estuary to nursery areas of lower salinity. These are the same areas of the bay where anthropogenic impacts are high, often resulting in hypoxic and/or anoxic events that may increase mortality of the early life history stages of this species. With the limited and sporadic juvenile data generated by this survey a juvenile population trend analysis is difficult. A nominal index was developed, but due to the sparse nature of the data, the index generated should be viewed with caution. Black Sea Bass Three hundred and two black sea bass (Centropristis striata) were caught in 2019, an increase from the 54 fish that were collected in 2018. The number of black sea bass has been highly variable from year to year during the time series of this survey, but the high abundance during 2012 and 2015 (Figure 10) stand out as unique. Black sea bass were caught in twenty-six percent of the seine hauls in 2019. The highest mean monthly abundances for 2019 occurred during August and September at 20.00 ± 4.10 S.E. fish/seine haul and 33.00 ± 0.65 S.E. fish/seine haul, respectively. Black sea bass were caught at 16 of the 18 stations; Patience Island (Sta. 5) and Spectacle Cove (Sta. 13) had the highest mean station abundances of 11.60 ± 9.00 S.E. and 26.00 ± 15.52 S.E. fish/seine haul, respectively (Table 15). The abundance index for 2019 was 11.02 ± 4.66 S.E. fish/seine haul. This was an increase to the 2018 index 0.65 ± 0.36 S.E. (Figure 10). Our Narragansett Bay trawl survey had a small increase in the abundance of black sea bass from 2018 to 2019. However, the abundance was still much greater than it has been since the survey began in 1979. The fall index dropped down from the high values in 2012 and 2013, but did show a small increase in abundance from 2016 to 2018. This recruitment signal in recent years was seen not only in RI waters, but all along the Northern Atlantic coast.

10
Both the trawl survey and the coastal pond survey seem to be better indicators for local abundances of black sea bass. The Narragansett Bay seine survey does not catch them in any consistent manner leading one to believe that they may be using deeper water and or the coastal ponds as their preferred nursery areas. There are no indications that there are any problems with the local abundance of black sea bass, information that is also corroborated by the coastwide stock assessment for black sea bass, which indicates no overfishing and a rebuilt stock (NEFSC 2016). Other important species Juveniles of other commercial or recreationally important species were also collected during the 2019 survey. These juveniles included scup (Stenotomus chrysops), and Northern kingfish (Menticirrhus saxatilis). One thousand, one hundred and forty-six juvenile and adult scup were collected in 2019 during June, July, August and September, an increase from 2018 when 162 scup were collected. Three hundred and sixty-nine Northern kingfish were collected in 2019, and were present in the greatest numbers during July and August. This is an increase from 2018 when 139 Northern kingfish were caught. Nine summer flounder were collected in 2019 in July, August, and September. Ten smallmouth flounder were caught in 2019. Relative to the sixty-eight smallmouth flounder that were caught in 2011, and the thirty-three that were caught in 2010, the decrease in abundance continued in 2019. This species will have to be monitored in future years to see if, due to changing habitat conditions or possible vacant niches, it is increasing its residency in the Bay. No juvenile Haddock were caught in 2019, unlike June 2016 when 44 juvenile haddock were caught, or June 2015 when 27 were caught. They were caught primarily in the lower portion of the bay. 2015 was the first recorded observance of juvenile Haddock in the history of the survey, this species will continue to be monitored in future years to see if there is an increasing abundance over time in Narragansett Bay. See Tables 3-8 for additional survey data on these species. Physical & Chemical Data Previous to 2010 a YSI 85 was used to collect water temperature, salinity and dissolved oxygen data from the bottom water at all stations on each sampling date. This meter was upgraded in 2010 to a YSI Professional Plus Multiparameter instrument 6050000. The instrument collects the same suite of information as the YSI 85 but is an improved meter with better functionality. The water quality data collected are shown in Table 15. Water temperatures during the 2019 survey ranged from a low of 13.6°C at Chepiwanoxset (Sta. 3) in October to a high of 26.8°C at Gaspee Point (Sta. 1) in July. Salinities ranged from 11.6 ppt at Conimicut Point (Sta. 2) in September to 29.6 ppt at Rose Island (Sta. 10) in October. Dissolved oxygen ranged from 3.7 ppm at Chepiwaxnoxset (Sta. 3) in August to a high of 11 ppm at Rose Island in June.

11
SUMMARY: In summary, data from the 2019 Juvenile Finfish Survey continue to show that a number of commercial and recreationally important species utilize Narragansett Bay as an important nursery area. Using the Mann Kendall test, tautog, river herring, menhaden and striped bass, showed no long-term abundance trends but indicated a significant long-term decrease in bluefish and winter flounder abundance. There are some species abundance trends from this survey that agree with those from our coastal pond survey and/or trawl survey, however, in some instances they do not relate. This outcome is probably influenced by the species-specific use of habitat and looking at appropriate data lags between the juvenile life stages and the adult stages. Hopefully, juvenile survey abundance indices will be reflected later in the abundance of adults in the trawl survey, but this is not always the case. Seventy-five species, both vertebrates and invertebrates, were collected in 2019. This is slightly higher than the survey mean for the past twenty-five years of sixty species. An initial audit of the earlier time series and information contained on the field logs was undertaken to determine if some of the species diversity was missing from the earlier time series. Some issues were resolved from this analysis, however there are still some unresolved issues contained in the historical field logs. These final issues will be addressed over the coming year. During 2019 one tropical species (Epinephelus niveatus) was collected during the survey. While tropical and subtropical species are collected during this survey every year, the number of species and individuals is dependent upon the course of the Gulf Stream, the number of streamers and warm core rings it generates, and the proximity of these features to southern New England. The survival and recruitment of juvenile finfish to the Rhode Island fishery is controlled by many factors: over-fishing of adult stocks, spawning and nursery habitat degradation and loss, water quality changes, and ecosystem changes that effect fish community structure. Any one of these factors, or a combination of them, may adversely impact juvenile survival and/or recruitment in any given year. An ongoing effort to increase populations of important species must embrace a comprehensive approach that takes into account the above factors, their synergy and the changing fish community in the Bay. A continued effort to identify and protect essential fish habitat (EFH) and improve water quality is essential to this effort. The Division through our permit review program does represent the interests of fish and habitat preservation and protection. As well, properly informed management decisions are tantamount to preserving spawning stock biomass in order to create and maintain sustainable populations. This survey’s dataset is used to inform the statistical catch at age models for both a regional tautog assessment as well as the coastwide menhaden assessment. In addition to the direct usage of the data in fisheries models, the other information collected by the survey helps to identify ancillary information such as abundances of forage species and habitat parameters, all important information for making good informed management decisions. These activities will all continue to be an important component of this project.

12
References Atlantic States Marine Fisheries Commission (ASMFC). 2016. 2016 Tautog Stock Assessment Update. http://www.asmfc.org/uploads/file/589e1d3f2016TautogAssessmentUpdate_Oct2016.pdf DeLong. A.K., Collie, J.S., Meise, C.J., and Powell, J.C. 2001. Estimating growth and mortality of juvenile Winter Flounder, Pseudopleuronectes americanus with a length-based model. Canadian Journal of Fisheries and Aquatic Sciences. 58: 2233-2346. Kennish, M.J. 1992. Ecology of Estuaries: Anthropogenic Effects. CRC Press. 495 pp. Lo, N.C., Jacobson, L.D., and Squire, J.L. 1992. Indices of relative abundance from fish spotter data based on delta-lognormal models. Canadian Journal of Fisheries and Aquatic Sciences. 49: 2515-2526. Meng, L., Taylor, D.L., Serbst, J., and Powell, J.C. 2008. Assessing habitat quality of Mount Hope Bay and Narragansett Bay using growth, RNA:DNA, and feeding habits of caged juvenile winter flounder (Pseudopleuronectes americanus Walbaum). Northeast Naturalist. 15(1): 35 – 56. Meng, L., Powell, J.C., and Taplin, B. 2001. Using Winter Flounder growth rates to assess habitat quality across an anthropogenic gradient in Narragansett Bay, Rhode Island. Estuaries. 24:576-584. Meng, L., Gray, C., Taplin, B., and Kupcha, E. 2000. Using Winter Flounder growth rates to assess habitat quality in Rhode Island's coastal lagoons. Marine Ecology Progress Series. 201:287-299. Northeast Fisheries Science Center (NEFSC). 2017. 62nd Northeast Regional Stock Assessment Workshop (62nd SAW) Assessment Summary Report. US Dept Commer, Northeast Fish Sci Cent Ref Doc. 17-01; 37 p. Zuur, AF, Ieno, EN, Walker, NJ, Saveliev, AA, Smith, GM. 2009. Mixed effects models and extensions in ecology with R. Springer Science and Business Media. 596 pp.
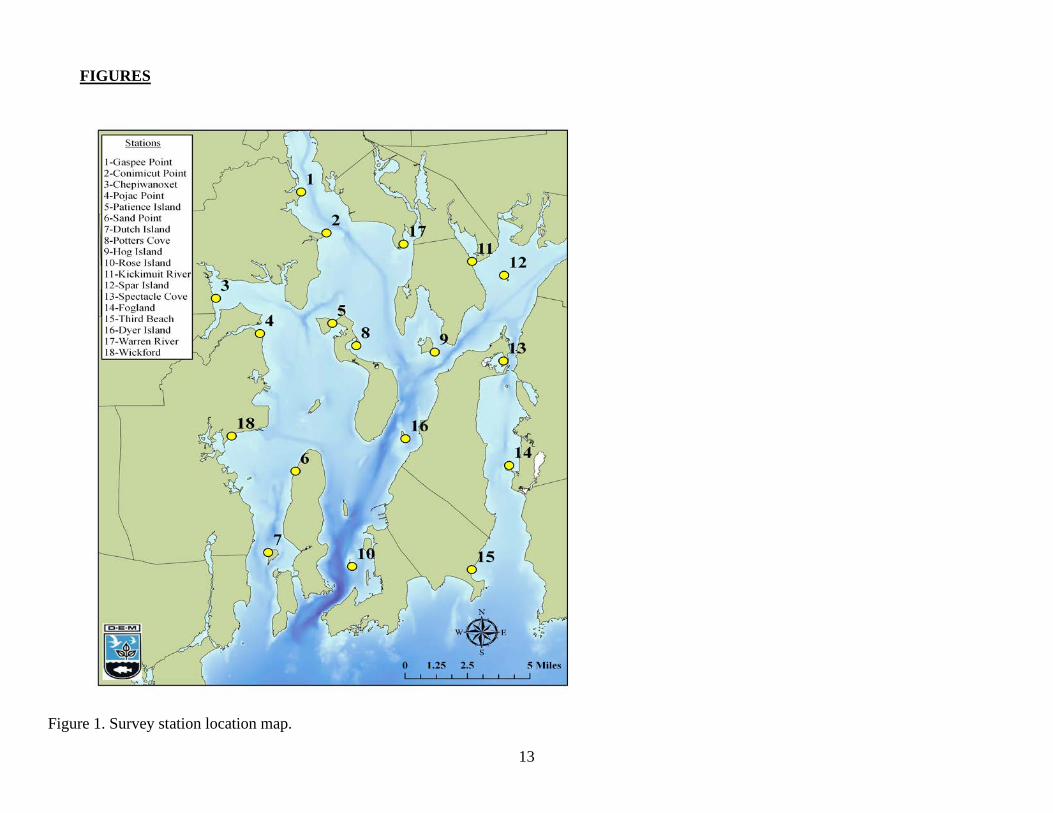
13
FIGURES
Figure 1. Survey station location map.

14
Figure 2. Juvenile winter flounder standardized abundance index 1988 – 2019 (see appendix A for standardization methodology).

15
Figure 3. Juvenile tautog standardized annual abundance index 1988 – 2019 (see appendix A for standardization methodology).

16
Figure 4. Juvenile bluefish standardized annual abundance index 1988 – 2019 (see appendix A for standardization methodology).

17
Figure 5. Juvenile river herring standardized annual abundance index 1988 – 2019 (see appendix A for standardization methodology).

18
Courtesy - Phil Edwards, RIF&W Anadromous Fish Restoration Program Figure 6. River herring spawning stock size from monitoring at two locations 1999 – 2019.

19
Figure 7. Juvenile menhaden standardized annual abundance index 1988 – 2019 (see appendix A for standardization methodology).

20
Figure 8. Striped bass standardized annual abundance index 1988 – 2019 (see appendix A for standardization methodology).

21
Figure 9. Weakfish annual abundance index 1988 – 2019.

22
Figure 10. Black sea bass annual abundance index 1988 – 2019.

23
TABLES Table 1a. Mann-Kendall test for target species abundance trend analysis (Full dataset; 1988 - 2019).
Mann-Kendall test Winter Flounder Tautog Bluefish River Herring Menhaden Striped Bass S -240 -21 -154 40 96 22 n Observations 32 32 32 32 32 32 Variance 3802 3802 3802 3802 3802 3802 Tau -0.484 -0.382 -0.31 0.0806 0.194 0.0444 2-sided p value 0.00011 0.11947 0.013097 0.5271 0.12342 0.73345 α 0.05 0.05 0.05 0.05 0.05 0.05 Significant Trend Yes ↓ No Yes ↓ No No No
Table 1b. Mann-Kendall test for target species abundance trend analysis (2010 - 2019).
Mann-Kendall test Winter Flounder Tautog Bluefish River Herring Menhaden Striped Bass S -21 45 -13 37 19 -5 n Observations 10 10 10 10 10 10 Variance 165 165 165 165 165 165 Tau -0.382 0.818 -0.236 0.673 0.422 -0.111 2-sided p value 0.11947 0.00061 0.3502 0.0051 0.101 0.721 α 0.05 0.05 0.05 0.05 0.05 0.05 Significant Trend No Yes ↑ No Yes ↑ No No
Table 2. Young-of-the-Year (YOY) winter flounder - maximum total length for each month. * Month July August September October Max. YOY length (TL)
100 mm 107 mm 109 mm 115 mm
* data provided by L. Buckley, National Marine Fisheries Service, Narragansett Laboratory, Narragansett, R.I.

24
Table 3. Species presence by station for June 2019. JUNE
Species 1 2 3 4 5 6 7 8 9 10 11 12 13 14 15 16 17 18 Grand TotalAlosa aestivalis &/or pseudoharengus 22 280 1 303
Ammodytes americanus 2 2Anchoa mitchilli 1 1Anguilla rostrata 1 1
Apeltes quadracus 3 3Busycon carica 1 1
Calinectes sapidus 142 3 145Carcinus maenus 1 1Clupea harengus 5 3 8
Crangon septemspinosa x x x x x 0Ctenophora phylum x x 0
Etropus microstomus 1 1 1 3Fundulus heteroclitus 378 11 5 2 10 12 1 4 423
Fundulus majalis 1 47 267 11 37 6 1 96 466Gobiosoma bosc 1 1
Ilyanassa obsoleta x x 0Leiostomus xanthus 1068 1068Libinia emarginata x x x x x x x 4 4
Limulus polyphemus 2 1 3Menidia menidia 708 187 56 35 3 22 1 4 440 12 3 1 1472
Menticirrhus saxatilis 1 3 1 1 6Mercenaria mercenaria 2 2
Microgadus tomcod 1 2 3 7 1 5 40 2 61Morone saxatilis 3 1 1 5
Myoxocephalus aenaeus 1 1 12 7 4 25Nassarius obsoletus x x x x x 0
Opsanus tau 6 6Pagurus spp x x x x x 0
Palaemonetes vulgaris x x x x x x x x x x x x x 0Panopeus spp x x x x x 0
Prionotus evolans 1 1 2Pseudopleuronectes americanus 2 2 191 2 1 1 2 16 9 226
Scophthalmus aquosus 1 1Stenotomus chrysops 11 11Strongylura marina 1 1Syngnathus fuscus 4 2 4 10
Tautoga onitis 1 9 2 14 1 7 1 35 11 81Tautogolabrus adspersus 5 1 6
Urophycis chuss 2 1 3Urophycis regia 1 1 1 1 1 1 1 7
Station
* x indicates that the non-target species was collected at the station but abundance was recorded as abundant, many or few.

25
Table 4. Species presence by station for July 2019. JULY
Species 1 2 3 4 5 6 7 8 9 10 11 12 13 14 15 16 17 18 Grand TotalAlosa aestivalis &/or pseudoharengus 117 352 241 165 1276 3 665 39422 1429 2 6 43678
Amphipoda order x 0Anchoa mitchilli 3 2 5Anguilla rostrata 13 13
Apeltes quadracus 1 1Brevoortia tyrannus 558 635 1193
Busycotypus canaliculatus 1 1Calinectes sapidus 1 250 1 1 253
Caranx hippos 1 1Carcinus maenus x x 0
Centropristus striata 2 1 64 67Crangon septemspinosa x 0
Ctenophora phylum x x x x x x x x 0Cynoscion regalis 2 2
Etropus microstomus 2 2Fundulus heteroclitus 21 647 13 29 5 20 4 10 1 750
Fundulus majalis 91 35 43 3 1 68 5 7 59 6 2 24 15 256 615Gasterosteus aculeatus 1 1
Isopoda order x x 0Libinia emarginata x 0
Limulus polyphemus 1 1 2Lucania parva 3 1 1 1 1 1 8 1 17
Menidia menidia 729 281 42 95 220 400 38 53 20 319 302 607 104 243 56 493 1417 5419Menticirrhus saxatilis 27 3 1 3 90 7 41 172Microgadus tomcod 3 23 2 3 2 1 34
Morone saxatilis 1 1Mugil curema 1 1 2
Myoxocephalus aenaeus 2 2 1 1 14 10 30Nassarius obsoletus x x 0
Opsanus tau 1 1 2 4Ovalipes ocellatus 3 1 1 5
Pagurus spp x x x x x x x x x 0Palaemonetes vulgaris x x x x x x 0
Panopeus spp x 0Paralichthys dentatus 1 1 1 3Pomatomus saltatrix 18 283 2 26 5 1 335
Prionotus evolans 1 9 3 2 3 1 3 1 23Pseudopleuronectes americanus 1 2 40 1 5 2 4 4 2 4 2 67
Sphoeroides maculatus 5 6 4 4 8 1 3 2 4 2 39Squilla empus 1 1
Stenotomus chrysops 18 12 18 175 37 6 87 157 8 1 154 115 788Strongylura marina 3 1 3 7Syngnathus fuscus 2 2 1 10 1 1 1 1 6 1 26
Tautoga onitis 17 12 23 5 14 2 1 18 43 15 4 154Tautogolabrus adspersus 21 8 1 16 4 9 11 1 12 95 7 123 308
Station
* x indicates that the non-target species was collected at the station but abundance was recorded as abundant, many or few.

26
Table 5. Species presence by station for August 2019. AUGUST
Row Labels 1 2 3 4 5 6 7 8 9 10 11 12 13 14 15 16 17 18 Grand TotalAlosa aestivalis &/or pseudoharengus 4 22 4 1 1 8 1 3 44
Anchoa mitchilli 4 4Apeltes quadracus 1 5 6Brevoortia tyrannus 1 1 1 492 5 1 501Calinectes sapidus 6 181 13 1 1 2 3 207Carcinus maenus x x x x 0
Centropristus striata 3 1 7 4 47 1 1 16 8 64 17 18 10 8 205Crangon septemspinosa x 0
Crepidula fornicata x 0Ctenophora phylum x x x x x x x 0Cynoscion regalis 1 2 1 4
Cyprinodon variegatus 3 1 4Emerita talpoida x 0
Etropus microstomus 1 1Fistularia tabacaria 1 1
Fundulus heteroclitus 45 13 5 17 54 84 2 43 2 265Fundulus majalis 17 117 116 11 14 2 5 29 11 38 2 280 105 747
Hippocampus genus 1 1Leiostomus xanthurus 11 11
Libinia emarginata x x x x x 0Limulus polyphemus 1 1
Loligo pealei 1 1Menidia menidia 31 307 59 35 94 68 1120 388 13 570 204 2280 49 517 85 216 538 1382 7956
Menticirrhus saxatilis 11 4 6 1 1 5 5 5 1 52 1 3 73 168Microgadus tomcod 2 7 1 10
Morone saxatilis 1 1Myoxocephalus aenaeus 2 5 1 3 11
Nassarius obsoletus x x 0Opsanus tau 6 6 2 14
Ovalipes ocellatus 1 3 2 1 7Pagurus spp x x x x x 0
Palaemonetes vulgaris x x x x x 0Panopeus spp x x x 0
Paralichthys dentatus 1 1 1 1 4Pomatomus saltatrix 66 2 55 10 3 1 91 3 231Prionotus carolinus 3 3Prionotus evolans 3 2 5
Pseudopleuronectes americanus 3 2 1 4 1 3 1 1 4 20Sphoeroides maculatus 1 1 2 3 3 1 3 1 7 22Stenotomus chrysops 1 31 13 3 8 9 25 71 3 9 21 77 43 11 325Strongylura marina 2 1 3 7 3 16Syngnathus fuscus 1 9 1 3 6 20Synodus foetens 1 4 2 7Tautoga onitis 53 10 14 757 124 53 17 2 71 2 3 14 45 33 1 39 1 1239
Tautogolabrus adspersus 2 29 15 5 23 1 6 5 2 3 22 113
Station
* x indicates that the non-target species was collected at the station but abundance was recorded as abundant, many or few. Table 6. Species presence by station for September 2019.

27
SEPTEMBERRow Labels 1 2 3 4 5 6 7 8 9 10 11 12 13 14 15 16 17 18 Grand Total
Alosa aestivalis &/or pseudoharengus 5 4 22 1 1 3 2 38Aurelia aurita x x 0Brevoortia tyrannus 12 0 199 2 1 392 3 32 641Calinectes sapidus 34 2 1 2 39Cancer borealis 1 1Carangidae family 3 3Carcinus maenus x x x x x x x x x x 0Centropristus striata 9 6 5 5 2 1 28Cliona celata x x x 0Crangon septemspinosa x x x 0Crepidula fornicata x 0Ctenophora phylum x x x x x x x x x x x 0Cyprinodon variegatus 5 1 6Emerita talpoida x 0Fundulus heteroclitus 42 33 11 144 34 12 1 3 280Fundulus majalis 620 171 32 26 28 44 103 35 12 110 98 24 1 1304Hemigrapsus sanguineus x 0Libinia emarginata x x x 0Limulus polyphemus 1 1Lucania parva 1 1Menidia menidia 1536 2577 103 67 1003 241 30 301 40 3 67 1929 1974 741 30 665 117 221 11645Menticirrhus saxatilis 2 1 10 1 1 1 6 1 23Morone saxatilis 1 2 6 6 15Mugil curema 19 19Myoxocephalus aenaeus 2 1 1 14 18Mytilus edulis x 0Nassarius obsoletus x x x 0Opsanus tau 2 2Pagurus spp x x x x x x x x 0Palaemonetes vulgaris x x x x x x x x x 0Panopeus spp x x x x 0Paralichthys dentatus 1 1 2Pomatomus saltatrix 1 28 10 28 1 74 284 426Prionotus evolans 1 1 2Prionotus genus 1 1Pseudopleuronectes americanus 1 1 1 1 4Sphoeroides maculatus 1 1 1 3Stenotomus chrysops 12 2 1 7 22Strongylura marina 1 15 6 36 2 3 1 64Syngnathus fuscus 5 1 1 1 1 9Synodus foetens 1 2 1 4Tautoga onitis 1 12 63 35 12 36 11 7 1 8 8 7 201Tautogolabrus adspersus 16 2 12 23 2 3 6 64Trachinotus falcatus 1 2 3
Station
* x indicates that the non-target species was collected at the station but abundance was recorded as abundant, many or few.

28
Table 7. Species presence by station for October 2019. OCTOBERRow Labels 1 2 3 4 5 6 7 8 9 10 11 12 13 14 15 16 17 18 Grand Total
Alosa aestivalis &/or pseudoharengus 179 250 27 1 73 1 5 536Ammodytes americanus 1 1Brevoortia tyrannus 1 15036 34 7081 123 22275Calinectes sapidus 13 1 2 1 17Cancer borealis 2 2Carcinus maenus x x x x x x x x x x x 0Centropristus striata 2 2Cliona celata x 0Crangon septemspinosa x x x x x x x 0Crassostrea virginica 1 1Ctenophora phylum x x x x x x x x x x 0Cyprinodon variegatus 3 2 3 2 10Engraulis eurystole 1 1Epinephelus niveatus 1 1Etropus microstomus 1 3 4Fundulus heteroclitus 10 19 4 17 1 5 3 2 8 69Fundulus majalis 7 19 2 12 57 33 7 6 1 10 3 155 4 316Gobiosoma bosc 1 1Hemigrapsus sanguineus x 0Leucoraja ocellata 1 1Libinia emarginata x 0Lucania parva 2 2Menidia menidia 211 1 45 86 4 5 3 516 652 12 256 4 132 136 26 210 406 69 2774Mercenaria mercenaria x 0Morone saxatilis 1 1Nassarius obsoletus x x x x 0Opsanus tau 1 1Ovalipes ocellatus 1 1 2 4Pagurus spp x x x x x x x x 0Palaemonetes vulgaris x x x x x x 0Panopeus spp x x x x 0Prionotus carolinus 1 1 2Prionotus evolans 3 3Pseudopleuronectes americanus 5 2 1 1 1 10Squilla empusa 1 1Syngnathus fuscus 1 1Tautoga onitis 8 1 1 1 1 4 6 22Tautogolabrus adspersus 6 5 29 40Urophycis regia 4 2 6
Station
* x indicates that the non-target species was collected at the station but abundance was recorded as abundant, many or few.

29
Table 8. Summary of species occurrence by station in 2019.

30
* The units are number of times present at each station (maximum would be 18 times present for a species at all stations for the year).

31
Table 9. Numbers of juvenile winter flounder per seine haul in 2019.
Month 1 2 3 4 5 6 7 8 9 10 11 12 13 14 15 16 17 18 Mean St Dev SEJUN 2 2 191 2 0 0 0 1 0 0 1 2 16 0 0 0 9 0 12.56 44.72 10.54JUL 1 2 40 1 5 2 0 0 4 0 4 0 2 0 0 0 4 2 3.72 9.21 2.17AUG 0 0 0 3 2 1 0 0 4 0 1 0 3 0 1 1 4 0 1.11 1.45 0.34SEP 0 0 0 1 0 0 1 0 1 0 0 0 0 1 0 0 0 0 0.22 0.43 0.10OCT 0 0 0 5 2 0 0 0 1 1 0 0 0 0 0 0 1 0 0.56 1.25 0.29Mean 0.60 0.80 46.20 2.40 1.80 0.60 0.20 0.20 2.00 0.20 1.20 0.40 4.20 0.20 0.20 0.20 3.60 0.40
St Dev 0.89 1.10 82.78 1.67 2.05 0.89 0.45 0.45 1.87 0.45 1.64 0.89 6.72 0.45 0.45 0.45 3.51 0.89 Total FishSE 0.40 0.49 37.02 0.75 0.92 0.40 0.20 0.20 0.84 0.20 0.73 0.40 3.01 0.20 0.20 0.20 1.57 0.40 327
Number 3 4 231 12 9 3 1 1 10 1 6 2 21 1 1 1 18 2
Station
Table 10. Numbers of juvenile tautog per seine haul in 2019.
Month 1 2 3 4 5 6 7 8 9 10 11 12 13 14 15 16 17 18 Mean St Dev SEJUN 0 1 0 0 9 2 14 0 0 1 0 7 1 35 0 0 11 0 4.50 8.79 2.07JUL 0 0 17 12 23 5 14 0 2 1 18 43 0 0 0 15 4 0 8.56 11.59 2.73AUG 53 10 14 757 124 53 17 2 71 2 3 14 45 33 0 1 39 1 68.83 174.77 41.19SEP 1 0 0 12 63 35 12 0 36 11 0 7 1 8 0 8 7 0 11.17 16.95 3.99OCT 8 1 0 1 1 0 1 0 4 0 0 0 0 0 0 0 6 0 1.22 2.34 0.55Mean 12.40 2.40 6.20 156.40 44.00 19.00 11.60 0.40 22.60 3.00 4.20 14.20 9.40 15.20 0.00 4.80 13.40 0.20
St Dev 22.94 4.28 8.56 335.80 50.69 23.76 6.19 0.89 30.84 4.53 7.82 16.84 19.91 17.48 0.00 6.61 14.54 0.45 Total FishSE 10.26 1.91 3.83 150.17 22.67 10.63 2.77 0.40 13.79 2.02 3.50 7.53 8.90 7.82 0.00 2.96 6.50 0.20 1697
Number 62 12 31 782 220 95 58 2 113 15 21 71 47 76 0 24 67 1
Station
Table 11. Numbers of juvenile bluefish per seine haul in 2019.
StationMonth 1 2 3 4 5 6 7 8 9 10 11 12 13 14 15 16 17 18 Mean St Dev SEJUN 0 0 0 0 0 0 0 0 0 0 0 0 0 0 0 0 0 0.00 0.00 0.00JUL 18 283 2 26 0 0 0 0 5 0 0 0 0 0 1 0 0 0 18.61 66.37 15.64AUG 0 66 2 0 55 0 0 0 10 0 3 0 0 0 1 0 91 3 12.83 27.46 6.47SEP 1 28 10 0 0 0 0 0 0 28 0 1 0 0 0 0 74 284 23.67 67.61 15.94OCT 0 0 0 0 0 0 0 0 0 0 0 0 0 0 0 0 0 0 0.00 0.00 0.00Mean 5.68 83.04 3.50 6.50 11.00 0.00 0.00 0.00 3.75 7.00 0.75 0.25 0.00 0.00 0.50 0.00 41.25 71.75
St Dev 7.95 119.17 4.43 13.00 24.60 0.00 0.00 0.00 4.79 12.52 1.34 0.45 0.00 0.00 0.58 0.00 48.13 126.68 Total FishSE 3.56 53.29 1.98 5.81 11.00 0.00 0.00 0.00 2.14 5.60 0.60 0.20 0.00 0.00 0.26 0.00 21.53 56.65 992
Number 19 377 14 26 55 0 0 0 15 28 3 1 0 0 2 0 165 287

32
Table 12. Numbers of striped bass per seine haul in 2019.
Month 1 2 3 4 5 6 7 8 9 10 11 12 13 14 15 16 17 18 Mean St Dev SEJUN 0 0 0 0 0 0 3 0 0 0 1 1 0 0 0 0 0 0 0.28 0.75 0.18JUL 0 0 0 0 0 0 0 0 0 0 0 0 0 0 0 1 0 0 0.06 0.24 0.06AUG 0 0 0 0 0 0 0 0 0 0 0 0 0 0 0 1 0 0 0.06 0.24 0.06SEP 0 0 0 0 1 0 0 0 0 2 0 0 0 0 0 6 0 6 0.83 1.95 0.46OCT 0 0 0 0 0 0 0 0 0 0 0 0 0 0 0 0 0 1 0.06 0.24 0.06Mean 0.00 0.00 0.00 0.00 0.20 0.00 0.60 0.00 0.00 0.40 0.20 0.20 0.00 0.00 0.00 1.60 0.00 1.40
St Dev 0.00 0.00 0.00 0.00 0.45 0.00 1.34 0.00 0.00 0.89 0.45 0.45 0.00 0.00 0.00 2.51 0.00 2.61 Total FishSE 0.00 0.00 0.00 0.00 0.20 0.00 0.60 0.00 0.00 0.40 0.20 0.20 0.00 0.00 0.00 1.12 0.00 1.17 23
Number 0 0 0 0 1 0 3 0 0 2 1 1 0 0 0 8 0 7
Station
Table 13. Numbers of juvenile river herring per seine haul in 2019.
Month 1 2 3 4 5 6 7 8 9 10 11 12 13 14 15 16 17 18 Mean St Dev SEJUN 22 280 0 0 0 0 0 0 0 0 0 0 1 0 0 0 0 0 16.83 65.88 15.53JUL 117 0 352 241 0 0 165 0 1276 0 0 3 665 39422 1429 2 6 0 2426.56 9243.26 2178.66AUG 4 0 0 22 4 0 1 0 0 1 0 0 0 8 0 1 3 0 2.44 5.34 1.26SEP 0 5 4 22 1 0 0 0 0 1 0 0 3 0 0 0 0 2 2.11 5.20 1.23OCT 0 179 250 27 0 0 0 1 73 0 1 0 0 0 0 0 5 0 29.78 70.57 16.63Mean 28.60 92.80 121.20 62.40 1.00 0.00 33.20 0.20 269.80 0.40 0.20 0.60 133.80 7886.00 285.80 0.60 2.80 0.40
St Dev 50.25 129.81 168.06 100.39 1.73 0.00 73.68 0.45 563.37 0.55 0.45 1.34 296.95 17629.16 639.07 0.89 2.77 0.89 Total FishSE 22.47 58.05 75.16 44.89 0.77 0.00 32.95 0.20 251.95 0.24 0.20 0.60 132.80 7884.00 285.80 0.40 1.24 0.40 44599
Number 143 464 606 312 5 0 166 1 1349 2 1 3 669 39430 1429 3 14 2
Station
Table 14. Numbers of juvenile menhaden per seine haul in 2019.
StationMonth 1 2 3 4 5 6 7 8 9 10 11 12 13 14 15 16 17 18 Mean St Dev SE JUN 0 0 0 0 0 0 0 0 0 0 0 0 0 0 0 0 0 0 0.00 0.00 0.00JUL 0 0 558 635 0 0 0 0 0 0 0 0 0 0 0 0 0 0 1193.00 193.35 45.57AUG 0 0 0 0 0 0 0 1 0 0 1 1 0 492 5 0 0 1 501.00 115.85 27.31SEP 12 0 0 199 0 0 0 2 0 0 1 392 0 0 0 0 3 32 641.00 100.48 23.68OCT 1 15036 34 7081 0 0 0 0 0 0 123 0 0 0 0 0 0 0 22275.00 3824.63 901.47Mean 2.60 3007.20 118.40 1583.00 0.00 0.00 0.00 0.60 0.00 0.00 25.00 78.60 0.00 98.40 1.00 0.00 0.60 6.60
St Dev 5.27 6724.30 246.18 3084.39 0.00 0.00 0.00 0.89 0.00 0.00 54.79 175.20 0.00 220.03 2.24 0.00 1.34 14.21 Total FishSE 2.36 3007.20 110.10 1379.38 0.00 0.00 0.00 0.40 0.00 0.00 24.50 78.35 0.00 98.40 1.00 0.00 0.60 6.35 24,610
Number 13 15036 592 7915 0 0 0 3 0 0 125 393 0 492 5 0 3 33

33
Table 15. Numbers of juvenile black sea bass per seine haul in 2019. Station
Month 1 2 3 4 5 6 7 8 9 10 11 12 13 14 15 16 17 18 Mean St Dev SEJUN 0 0 0 0 0 0 0 0 0 0 0 0 0 0 0 0 0 0 0.00 0.00 0.00JUL 0 0 0 0 2 0 0 0 0 0 1 0 64 0 0 0 0 0 1.00 15.05 3.55AUG 3 1 7 4 47 1 0 1 16 0 8 0 64 17 18 0 10 8 20.00 17.40 4.10SEP 0 0 0 0 9 0 6 0 5 5 0 0 2 1 0 0 0 0 33.00 2.75 0.65OCT 0 0 0 0 0 0 0 0 0 2 0 0 0 0 0 0 0 0 0.00 0.47 0.11Mean 0.60 0.20 1.40 0.80 11.60 0.20 1.20 0.20 4.20 1.40 1.80 0.00 26.00 3.60 3.60 0.00 2.00 1.60
St Dev 1.34 0.45 3.13 1.79 20.13 0.45 2.68 0.45 6.94 2.19 3.49 0.00 34.70 7.50 8.05 0.00 4.47 3.58 Total FishSE 0.60 0.20 1.40 0.80 9.00 0.20 1.20 0.20 3.10 0.98 1.56 0.00 15.52 3.36 3.60 0.00 2.00 1.60 302
Number 3 1 7 4 58 1 6 1 21 7 9 0 130 18 18 0 10 8

34
Table 15. Temperature, salinity, and dissolved oxygen by station and month – 2019 (NA indicates a day where batteries failed on the YSI).
Station JUN JUL AUG SEP OCT Total AverageTemperature (C) 24.3 26.8 21.3 21 14.9 108.30 Salinity 22 19.5 23.2 24.4 20.5 109.60Dissolved Oxygen 7.3 11 8.5 7.4 8.5 42.70Temperature (C) 23.4 26.3 21.5 21.4 15.3 107.90 Salinity 19.4 23.4 24.8 11.6 24.2 103.40Dissolved Oxygen 10.33 9.3 7.9 9.7 9.7 46.93Temperature (C) 21.5 25.4 26.7 20.2 13.6 107.40 Salinity 24.5 25.9 26.1 26.6 26.8 129.90Dissolved Oxygen 7 5.4 3.7 7.9 9 33.00Temperature (C) 19.8 24.6 23.7 19.1 14.6 101.80 Salinity 22.8 26.3 23.3 25.8 26.4 124.60Dissolved Oxygen 5.6 5.7 8.1 8.5 9.6 37.50Temperature (C) 19.2 22.9 24.9 18.9 14.2 100.10 Salinity 25.7 26.8 27 26.9 27.2 133.60Dissolved Oxygen 6.9 7.8 5.8 9.2 8 37.70Temperature (C) 18.2 23.5 23.2 20.7 15.5 101.10 Salinity 27.3 27 27.6 28.2 28.6 138.70Dissolved Oxygen 8.4 7.3 7.9 9.4 8.3 41.30Temperature (C) 17.7 25 23 20.3 15.7 101.70 Salinity 27.8 25.7 28 28.3 28.9 138.70Dissolved Oxygen 9.7 7.2 8.8 8.6 8.4 42.70Temperature (C) 19.9 25 24.4 22 15.8 107.10 Salinity 25.6 26.7 27 27.6 28.4 135.30Dissolved Oxygen 8.9 6.7 6.6 7.7 9 38.90Temperature (C) 19.6 23.9 23.3 21.4 15.8 104.00 Salinity 25.7 26.4 27.1 27.8 28.7 135.70Dissolved Oxygen 9.4 6.5 7 8.3 7.3 38.50Temperature (C) 16.4 19.9 20.4 19.1 17.1 92.90 Salinity 28 27.9 28.4 28.8 29.6 142.70Dissolved Oxygen 11 7.9 7.6 7.3 9.3 43.10Temperature (C) 20.4 26.6 23.8 20.6 15.2 106.60 Salinity 22.2 24.5 26.4 27.1 26.6 126.80Dissolved Oxygen 7.5 6.4 7.7 8.3 8.5 38.40Temperature (C) 20.5 25.4 23.2 22.5 15 106.60 Salinity 21.9 24.2 26.8 25.6 26.8 125.30Dissolved Oxygen 9 8.3 7.9 8 9.5 42.70Temperature (C) 20.5 22.9 23.6 20.6 15.7 103.30 Salinity 25.9 27.1 27.6 28 27.8 136.40Dissolved Oxygen 10.3 6.2 7.2 7.5 9.5 40.70Temperature (C) 19.7 23.1 22.4 20.2 14.8 100.20 Salinity 27 26.9 27.8 28.3 28.3 138.30Dissolved Oxygen 8 7.8 7.3 10.5 9.1 42.70Temperature (C) 19.5 22.1 21.3 18.9 14.3 96.10 Salinity 27.2 26.6 28.3 28.7 28.9 139.70Dissolved Oxygen 9.2 6.8 6.8 8.2 8.6 39.60Temperature (C) 18 21.3 22.4 20.2 16.1 98.00 Salinity 26.8 27.5 27.5 28.3 28.8 138.90Dissolved Oxygen 9.2 7.4 7.9 7.6 8 40.10Temperature (C) 20.4 24.4 22.2 21.5 15.9 104.40 Salinity 22 24.9 27 27.1 28.1 129.10Dissolved Oxygen 7.4 7.9 7.2 7.4 8.7 38.60Temperature (C) 19.5 25.7 23.8 19.8 15.5 104.30 Salinity 25.5 27.9 27.7 27.8 28.4 137.30Dissolved Oxygen 8.2 7.6 6.7 9.1 9.2 40.80
11
Month
1
2
3
4
5
6
7
8
9
10
18
12
13
14
15
16
17

35
APPENDIX A Standardized Index Development – Delta Lognormal Menhaden, Bluefish, River Herring The standardized indices for 2 of the main target species of the survey considered five factors as possible influences on the indices of abundance, which are summarized below: Factor Levels Value
Year 32 1988-2019
Month 5 June - October
Temperature (°C) Continuous
Salinity (ppt) Continuous
Station 18 18 fixed stations throughout bay
The delta lognormal model approach (Lo et al., 1992) was used to develop standardized indices of abundance for the seine survey data. This method combines separate generalized linear model (GLM) analyses of the proportion of successful hauls (i.e. hauls that caught winter flounder) and the catch rates on successful hauls to construct a single standardized CPUE index. Parameterization of each model was accomplished using a GLM procedure in the R statistical software package (dglm function see: http://www.sefsc.noaa.gov/sedar/download/SEDAR17-RD16%20User%20Guide%20Delta-GLM%20function%20for%20R%20languageenvironment%20(Ver.%201.7.2,%2007-06-2006).pdf?id=DOCUMENT). For each GLM procedure of proportion positive trips, a binomial error distribution was assumed, and the logit link was selected. The response variable was proportion successful trips. During the analysis of catch rates on successful trips, a model assuming lognormal error distribution was examined. The final models for the analysis of catch rates on successful trips, in all cases were:
Ln(catch) = Year + Month + Station + Temperature + Salinity
The final models for the analysis of the proportion of successful hauls, in all cases including menhaden, were:
Success = Year + Month + Station + Temperature + Salinity

36
Standardized Index Development – Negative Binomial Generalized Linear Model Winter Flounder, Tautog, Striped Bass The standardized indices for 3 of the main target species of the survey considered up to six factors as possible influences on the indices of abundance, which are summarized below:
Species Factor Levels Value
Winter Flounder
Year 32 1988-2019
Station Periods 4
Stations were added to the survey on 3 separate occasions (station 16 added June 1990, station 17 added July 1993, station
18 added July 1995) Temperature
(°C) Continuous
Salinity (ppt) Continuous
Station 18 18 fixed stations throughout bay
Tautog
Year 32 1988-2019
Station Periods 4
Stations were added to the survey on 3 separate occasions (station 16 added June 1990, station 17 added July 1993, station
18 added July 1995) Station 18 18 fixed stations throughout bay
Striped Bass
Year 32 1988-2019
Station Periods 4
Stations were added to the survey on 3 separate occasions (station 16 added June 1990, station 17 added July 1993, station
18 added July 1995) Temperature
(°C) Continuous
Salinity (ppt) Continuous
Station 18 18 fixed stations throughout bay
Month 5 June - October The negative binomial generalized linear model approach was used to develop standardized indices of abundance for the seine survey data. This method produces a generalized linear model (GLM) for the catch rates on all hauls to construct a single standardized CPUE index. Parameterization of each model was accomplished using a GLM procedure in the R statistical software package, the code of which was modified from Nelson and Coreia of the Northeast Fishery Science Center (personal communication). During the analysis of catch rates on hauls, a model assuming a negative binomial error distribution was examined. The linking function selected was “log”, and the response variable was abundance (count) for each individual haul where one of the three species was caught. A stepwise approach was used to quantify the relative importance of the factors. First a GLM model was fit on year. These results reflect the distribution of the nominal data. Next, each potential factor was
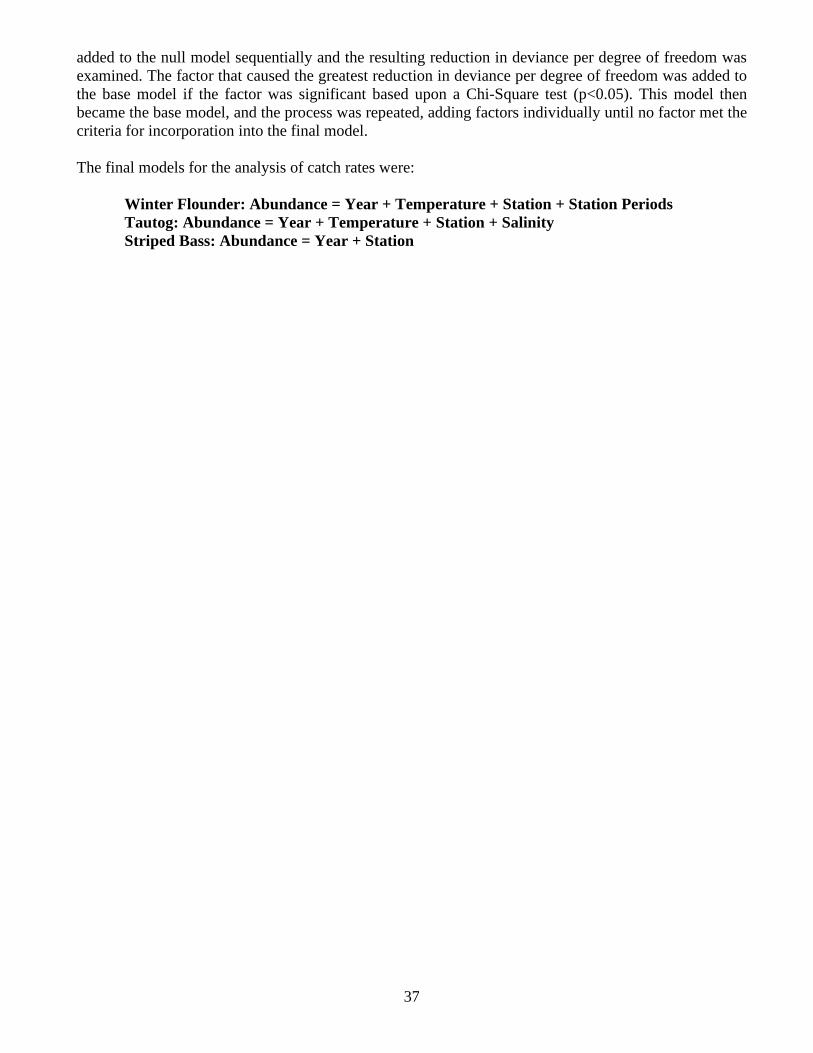
37
added to the null model sequentially and the resulting reduction in deviance per degree of freedom was examined. The factor that caused the greatest reduction in deviance per degree of freedom was added to the base model if the factor was significant based upon a Chi-Square test (p<0.05). This model then became the base model, and the process was repeated, adding factors individually until no factor met the criteria for incorporation into the final model. The final models for the analysis of catch rates were:
Winter Flounder: Abundance = Year + Temperature + Station + Station Periods Tautog: Abundance = Year + Temperature + Station + Salinity Striped Bass: Abundance = Year + Station

Assessment of Recreationally Important Finfish Stocks in Rhode Island Coastal Waters
2019 Annual Performance Report for Job VI, Part A:
Assessment, Protection, and Enhancement of Fish Habitat to Sustain Coastal and Marine Ecosystems and Healthy Stocks of Recreationally Important Finfish:
Assessing, Monitoring, and Minimizing Impacts to Marine Habitat
Prepared by: Eric G. Schneider, Pat Barrett, Katie Rodrigue, Anna Gerber-Williams, Julia
Livermore, and Conor McManus (Rhode Island DEM, Div. of Marine Fisheries), and William Helt and Heather Kinney (TNC RI Chapter)
Rhode Island Department of Environmental Management
Division of Marine Fisheries Fort Wetherill Marine Fisheries Laboratory
3 Fort Wetherill Road Jamestown, RI 02835
Federal Aid in Sportfish Restoration F-61-R
2019 Performance Report for Job VI, Part A March 9, 2020

2
PERFORMANCE REPORT STATE: Rhode Island PROJECT NUMBER: F-61-R SEGMENT NUMBER: 22 PROJECT TITLE: Assessing, Monitoring, and Minimizing Impacts to Marine Habitat PERIOD COVERED: January 1, 2014 - December 31, 2019 JOB NUMBER AND TITLE: VI, Part A: Assessment, Protection, and Enhancement of Fish Habitat to Sustain Coastal and Marine Ecosystems and Healthy Stocks of Recreationally Important Finfish: initial project area Providence-Seekonk Tidal Estuaries (head of Narragansett Bay)
STAFF: Eric G. Schneider, Pat Barrett, Katie Rodrigue, Anna Gerber-Williams, Julia Livermore, and Conor McManus (Rhode Island DEM, Div. of Marine Fisheries), and William Helt and Heather Kinney (TNC RI Chapter)
JOB OBJECTIVES: The goal of this project is to assess, protect, enhance, and restore important marine habitat to support healthy marine ecosystems and stocks of recreationally important finfish. We will obtain this goal by addressing the following objectives:
(1) Initiate a program to assess habitat conditions in these once “severely degraded” areas of the Bay and investigate potential opportunities to restore or enhance recreational fish habitat.
(2) Provide a comprehensive review of permit applications for projects that occur in RI waters and may directly or indirectly impact coastal and marine resources and their habitat, including economic development projects, such as energy, infrastructure, dredging, and dredge spoil disposal projects, as well as aquaculture and habitat restoration projects.
(3) Respond to major fish kills and assess habitat conditions, and in the event of a significant environmental incident, coordinate hazard mitigation, assessment of natural resource damages, and resulting habitat restoration.
SUMMARY: Objective 1: During the 2019 season, a total of 65 seines were hauled across 12 sites in May through October resulting in the enumeration of 112,004 individuals. Of the animals caught, 4,316 were measured and 44 species were identified (see Table 2). All five target species for the study were caught in the seines: black sea bass, scup, summer flounder, tautog, and winter flounder. Due to hazardous weather in the month of October, only 5 of the 12 sites were sampled. A total of 12 sites were sampled with fish traps in the 2019 season. In all, 65 deployments were completed May through October catching 17 species including 561 finfish and 849 invertebrates (Table 3). HOBO Saltwater Conductivity/Salinity and Dissolved Oxygen Data Loggers collected

3
data at 10 of 12 and 11 of 12 sites, respectively. A total of 139,141 instances were recorded across all loggers. Site summaries were created for 15 sampling sites that include benthic substrate and biotic descriptions. Relevant coastal setting descriptions based on geographic location and surveys were also included. An artificial reef project was installed on October 24th and 25th. Monthly pre-construction monitoring was performed at the artificial reef site and three comparison sites May through October with fish traps and eel traps. The eel pots caught 13 species including 249 finfish and 87 invertebrates. One pre-construction dive survey was completed as well at the artificial reef site and three comparison sites in September. Objective 2: This past year, DMF reviewed 77 projects and applications as part of its Environmental Review program, excluding aquaculture application reviews, which are reported separately. Verbal and/or written comments were provided on all general permit reviews through the monthly general permit meeting with the RI Coastal Resource Management Council (CRMC), RI DEM Office of Water Resources (OWR), U.S. Environmental Protection Agency (EPA), and U.S. Army Corps of Engineers (USACE). As part of these reviews, the DMF reviewed and provided comments, including time of year work windows for all dredge-related all projects. Table 1 contains a summary of the activities and/or potential impacts identified during the permit review process. This past year, the DMF participated in and formulated responses for 13 preliminary determination meetings with aquaculture applicants. DMF also created site maps for 5 prospective applicants by meeting with them prior to their full aquaculture application submissions; this practice serves to mitigate habitat and fisheries concerns by eliminating important biological areas from consideration. The meetings are designed to allow participants to voice any concerns, including those related to fish and fish habitat. We also provided formal, written responses for over 14 public noticed lease applications, and held RI Marine Fishery Council (RIMFC) Shellfish Advisory Panel (SAP) meetings to gain input from industry on aquaculture sites for and to provide scientific opinion to the RIMFC regarding the sites. We coordinated all responses with RI DEM Fish and Wildlife Program for waterfowl habitat and hunting concerns, and drafted DMF official response letters related to fish habitat impacts that were identified through a detailed review of applications for new and modifications to aquaculture leases starting in January 2019. Objective 3: Objective 3: DMF staff continued to participate in emergency response training, including oil spill response and boom deployment exercises, a Natural Resource Damage Assessment workshop, an Incident Command System course, and Shoreline Cleanup Assessment Technique training for sand beaches. In addition, RI DMF received a total of 11 reports of fish kill events. Nine of these reports required RI DMF to respond to and assess the scene. TARGET DATE: December 31, 2019
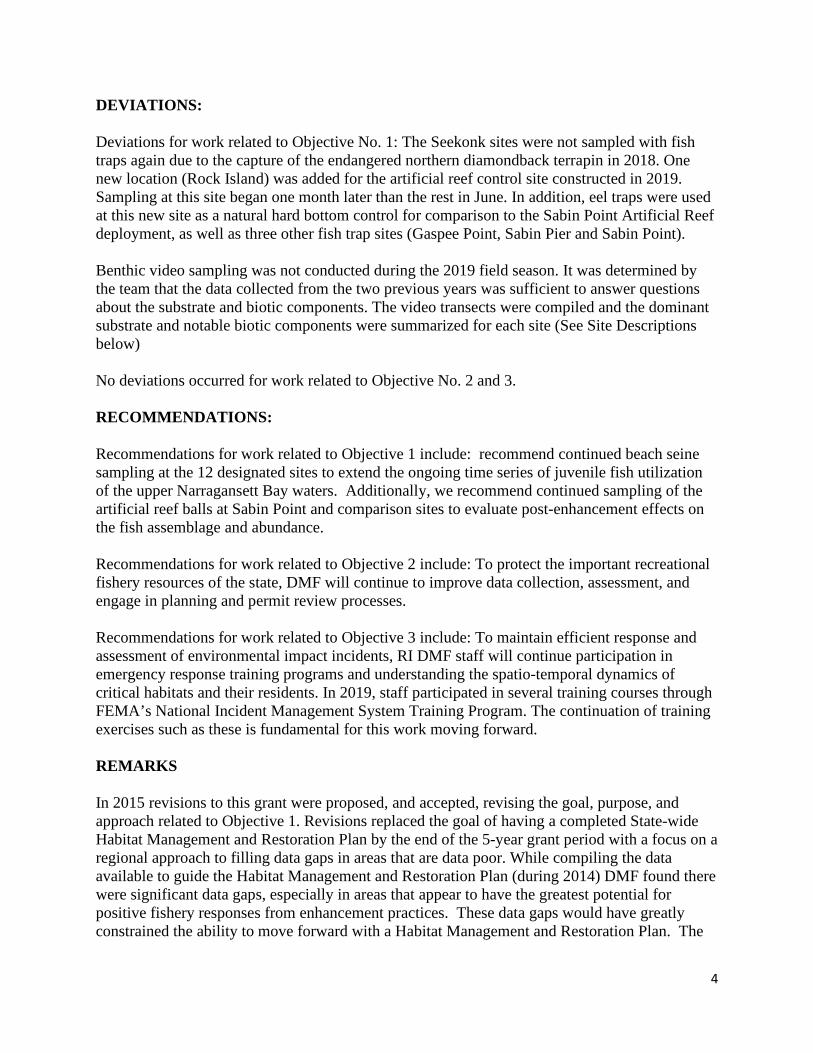
4
DEVIATIONS: Deviations for work related to Objective No. 1: The Seekonk sites were not sampled with fish traps again due to the capture of the endangered northern diamondback terrapin in 2018. One new location (Rock Island) was added for the artificial reef control site constructed in 2019. Sampling at this site began one month later than the rest in June. In addition, eel traps were used at this new site as a natural hard bottom control for comparison to the Sabin Point Artificial Reef deployment, as well as three other fish trap sites (Gaspee Point, Sabin Pier and Sabin Point). Benthic video sampling was not conducted during the 2019 field season. It was determined by the team that the data collected from the two previous years was sufficient to answer questions about the substrate and biotic components. The video transects were compiled and the dominant substrate and notable biotic components were summarized for each site (See Site Descriptions below) No deviations occurred for work related to Objective No. 2 and 3. RECOMMENDATIONS: Recommendations for work related to Objective 1 include: recommend continued beach seine sampling at the 12 designated sites to extend the ongoing time series of juvenile fish utilization of the upper Narragansett Bay waters. Additionally, we recommend continued sampling of the artificial reef balls at Sabin Point and comparison sites to evaluate post-enhancement effects on the fish assemblage and abundance. Recommendations for work related to Objective 2 include: To protect the important recreational fishery resources of the state, DMF will continue to improve data collection, assessment, and engage in planning and permit review processes. Recommendations for work related to Objective 3 include: To maintain efficient response and assessment of environmental impact incidents, RI DMF staff will continue participation in emergency response training programs and understanding the spatio-temporal dynamics of critical habitats and their residents. In 2019, staff participated in several training courses through FEMA’s National Incident Management System Training Program. The continuation of training exercises such as these is fundamental for this work moving forward. REMARKS In 2015 revisions to this grant were proposed, and accepted, revising the goal, purpose, and approach related to Objective 1. Revisions replaced the goal of having a completed State-wide Habitat Management and Restoration Plan by the end of the 5-year grant period with a focus on a regional approach to filling data gaps in areas that are data poor. While compiling the data available to guide the Habitat Management and Restoration Plan (during 2014) DMF found there were significant data gaps, especially in areas that appear to have the greatest potential for positive fishery responses from enhancement practices. These data gaps would have greatly constrained the ability to move forward with a Habitat Management and Restoration Plan. The

5
revisions to this project were designed to allow DMF to undertake a regional level of fish habitat assessment, especially where water quality has significantly improved, and use this data to help guide future efforts to initiate a state-water habitat restoration process, as well as inform the scoping and design of future fish restoration and enhancement projects in the Providence-Seekonk tidal rivers at the Head of Narragansett Bay. Thus, we revised the goal of Objective 1 to: Initiate a program to assess habitat conditions in these once “severely degraded” areas of the Bay and investigate potential opportunities to restore or enhance recreational fish habitat. Specifically, our efforts will focus on the Providence-Seekonk tidal rivers at the Head of Narragansett Bay and may extend to other potential tidal marine locations in Providence, East Providence, Pawtucket, Cranston, Warwick, and Westerly. This work will be conducted in collaboration with The Nature Conservancy (TNC) in accordance with the attached Scope of Work and cooperative agreement. In short, we will address the following tasks:
Task I. Identifying and studying locations of degraded coastal habitat in Rhode Island estuaries that have the greatest potential to benefit from shoreline and sub-tidal restoration techniques and improve fish production. Task II. Identify relevant and cost-effective coastal fishery habitat enhancement practices that have potential to make the greatest improvements to the degraded fish habitat sites that are selected for the study. Task III. Design pilot studies and obtain permitting necessary to begin evaluating fish habitat restoration techniques. Task IV. Implement and/or construct fish habitat improvement techniques.
OBJECTIVE No. 1 See Attached Report in Appendix I OBJECTIVE No. 2 Approach - Objective 2 To address Objective 2, the Division provides a comprehensive review of any project or activity, including economic development projects (e.g. energy and infrastructure), dredging and dredge spoil disposal projects, as well as other activities (e.g. recreational and commercial fishing, aquaculture, habitat restoration, etc.) that are proposed for Rhode Island waters and could pose potential direct or indirect impacts to coastal and marine resources and their habitat. Reviews include all available data and provided important information to permitting agencies to allow for more informed permitting decisions. As part of this effort, the DMF attends a monthly meeting of upcoming General Permit activities with staff representing the RI Coastal Resource Management Council (CRMC), RI DEM Office

6
of Water Resources (OWR), U.S. Environmental Protection Agency (EPA), and U.S. Army Corps of Engineers (USACE) on the first Thursday of the month. During that meeting, applications for pier expansions, new piers, dredging projects, as well as any other projects that may present concerns over impacts to natural resources were discussed by the agencies. Depending on the size, scope, and location of the proposed project or activity, the review process sometimes involves determining the living and non-living resources present at the project site and evaluating the potential adverse effects that the proposed work may have on fishery resources and marine habitat. More specifically, this process often requires a site visit and a review of fishery resource data and marine habitat data, including EFH, that were collected at or near the project site or in similar habitat conditions. These data may include data collected by RI DMF finfish surveys funded by the USFWS Sport Fish Restoration Program (e.g. Narragansett Bay Monthly and Seasonal Fishery Resource Assessment, Winter Flounder Spawning Stock Biomass Survey, Young of the Year Survey of Selected RI Coastal Ponds and Embayments, and the Juvenile Marine Finfish Survey) and surveys related to finfish, shellfish, and ichthyoplankton conducted by RI DMF pursuant to other funding sources or other originations and institutions (e.g. MA DMF, NEMAP, NEFSC, URI GSO, etc.). Habitat data, including EFH data, may require leveraging data collected previously by RI DMF or other organizations and institutions. In cases where site-specific habitat and marine resource data is limited, dated, or absent new data may be collected, analyzed, and summarized. When possible, this work takes advantage of collaborative efforts with other agencies. Data is assimilated and analyzed using statistical software, databases, imaging processing software, and GIS mapping and processing technologies where applicable. When necessary, DMF staff testify at CRMC hearings for permits where there is a significant objection by the Division. As the aquaculture industry continues to expand, there is an increasing concern about additional user conflicts arising from the leasing of marine waters for aquaculture, which may limit certain public uses (e.g., fishing & waterfowl hunting). The DMF has been active in reviewing aquaculture permits to ensure prospective sites do not pose a threat to marine fish and their habitats. The most frequent concern with aquaculture applications is the spatial overlap with recent (e.g., last 3-4 years) or historic presence of eelgrass within the footprint of the proposed lease site. Additional fish habitat concerns include certain bottom substrates that impact foraging or spawning activities, or those located in areas of high recreational fishing activity. Objective 2 – Results and Discussion As part of its environmental review program during 2019, DMF reviewed 72 permit applications that contained approximately 122 separate activities or potential impacts or concerns that could affect marine resources (Table 1). Verbal and/or written comments were provided on all general permit reviews through the monthly general permit meeting with CRMC, RI DEM OWR, U.S. EPA, and USACE. As part of these reviews, RI DMF reviewed and provided comments and time of year windows for all dredge-related all projects. The DMF continued to participate in the Manchester Street Power Station 316(b) review process, as well several additional large-scale projects. Examples of large-scale, complex projects included the dredging of Water Place Park in the Woonasquatucket River. Given the size and complexity of project, DMF worked closely with the project applicants (RI CRMC and TNC) to ensure the project was designed in a manner

7
that would not impact migrating anadromous species, would minimize impacts to benthic habitat and shellfish in the lower stretch of the river, and ensure that dredge spoils were properly handled to eliminate potential contamination of marine sediments. DMF also raised concerns and objections that led to significant revisions or withdrawal of applications. For example, in response to a maintenance dredging and marina expansion application in Jamestown, DMF required additional sampling and modifications to the dredge footprint, dock and pier locations, and extent of marina expansion to eliminate potential impacts to eelgrass beds. A separate project in Winnapaug Pond, which was proposed as an eelgrass restoration plan, included the dredging and deepening of an existing channel, as well as creating a new channel by removing several shoal and cobble areas. After reviewing the application, DMF objected to this project due to concerns related to direct habitat loss from removal of the shoal and cobble areas, scouring of salt marsh due to channel deepening and reconfiguration, and a complete lack of eelgrass restoration planning, including lack of habitat suitability analyses, eelgrass seeding and stock sourcing plan, and monitoring plan. In response to DMF concerns and objections, the project was withdrawn. Over the last six-years (2014-2019) DMF reviewed 448 permit applications that contained approximately 606 separate activities and potential impacts or concerns that could affect marine resources (Table 1). During this period DMF made several changes to the permit process, including seeking to engage applicants early in design process to discuss potential impacts and concerns, and explore approaches that could minimize or eliminate impacts. For example, during 2014 DMF reviews resulted in the modification to several dredge projects that were expected to decrease flushing in areas with poor water quality and low levels dissolved oxygen, as well as require additional projective measure for dredging of active piers at the US Navy Base in Newport. During 2015 DMF worked closely with USFWS to revise plans for the Coastal Resiliency Project in the Narrow River, designed to restore 68 acres of salt marsh, create cold-water refugia in a shoaled area of the river, and restore eelgrass along targeted stretches. During 2016 and 2017 there were issues with dredge permit applications being submitted late in the calendar year, which resulted in a compressed review process and challenged DMF’S ability to require additional pre-dredging survey and mitigation work. Subsequently, DMF worked with CRMC, OWR, and US ACE to ensure that permit applications are submitted earlier in the calendar year, allowing enough time for additional survey and mitigation work to be completed, if required, prior to dredging. Other projects, which were highlighted in previous performance reports include DMF engagement in the review of proposed dredging and breaching of Green Hill Pond (2017) and the Town of Swansea Desalination Discharge Permit (2017). The largest project, which has been active during the entire cycle is the review for the Manchester Street Power Plant RIPDES permit. Given this review is still ongoing, details will not be provided. As part of DMF’s responsivity to evaluate whether proposed aquaculture activities could impact recreational fisheries and the fish habitat, DMF participated in and formulated responses for 13 preliminary determination meetings with aquaculture applicants during 2019. DMF also created site maps for 5 prospective applicants by meeting with them prior to their full aquaculture application submissions; this practice serves to mitigate habitat and fisheries concerns by eliminating important biological areas from consideration. The meetings are designed to allow participants to voice any concerns, including those related to fish and fish habitat. We also

8
provided formal, written responses for over 14 public noticed lease applications, and held RI Marine Fishery Council (RIMFC) Shellfish Advisory Panel (SAP) meetings to gain input from industry on aquaculture sites for and to provide scientific opinion to the RIMFC regarding the sites. We coordinated all responses with RI DEM Fish and Wildlife Program for waterfowl habitat and hunting concerns, and drafted DMF official response letters related to fish habitat impacts that were identified through a detailed review of applications for new and modifications to aquaculture leases starting in Jan 2019. During 2019 the DMF created an aquaculture siting review protocol that provides general guidance and justification for siting recommendations for the DMF. Justification includes peer-reviewed and gray literature, conversations with topic-specific experts, and analysis of DEM survey data. Recommendations presented within the protocol are effective for applications currently under review or under future review, including proposed expansions to existing leases. Factors addressed within the aquaculture siting review protocol include; fish habitat, shellfish habitat, proximity to long-term monitoring and habitat restoration sites, proximity to seal habitats, shellfish densities, and commercial and recreational fishing densities, which are areas under the DMF purview. The document is undergoing internal review within DEM and will be presented to the shellfishing and aquaculture industries for further feedback before being made public. Over the last six-years (2014-2019) DMF participated in and/or formulated responses for approximately 98 aquaculture-related applications for modifications to existing leases and applications for new leases. During this time, DMF revised and improved its internal review processes and developed the state’s first spatial database of all active and proposed aquaculture sites in state waters in 2017. This database is used, along with other spatial use layers, by the DMF to better understand potential habitat and public use conflicts with newly proposed aquaculture locations. The Division has made the active sites layer public via an interactive map on the Department’s website: http://ridemgis.maps.arcgis.com/apps/webappviewer/index.html?id=8beb98d758f14265a84d69758d96742f. This interactive map features mapping tools for future applicants to aid in the site selection process and help them avoid areas of public use or historic eelgrass habitat. Several applicants utilized the interactive map since it was made available to the public and DMF plans to make further modifications and improvements during 2020. OBJECTIVE No. 3 Objective 3 - Approach The Division has the duty to provide available scientific information on sudden mass-die-off events such as fish kills in marine waters and identify important recreational fish habitat and pre-impact conditions in the event of a significant environmental incident classified as a Category 3 major environmental disaster incident (e.g., > 10,000-gal oil spill or wide coastal environmental impact likely). In addition, the DMF provides a staff member with recreational fishery habitat expertise for coordination of DMF responses related to assisting the Office of Emergency Response Incident Command in assessing any significant environmental impacts of a major oil spill or incident on recreational habitat and biota in Rhode Island marine waters. For moderate

9
incidents such as fish kills, the staff will follow the “Bay Response Team” (BART) protocols. We have been responding to all moderate and large kills and investigating habitat conditions to ascertain the role of severe hypoxia/anoxia in fish kills (the typical cause in summer months) in RI marine habitats. Objective 3 – Results and Discussion In 2019, RI DMF responded to 11 reports of fish kill events. Table 2 shows a summary of these events. Six of these kills affected Atlantic menhaden and were due to natural causes (hypoxic conditions, high water temperatures, driven into shallow waters by predators, or a combination of these factors). One kill involved striped bass in Narrow River and was ongoing for approximately two weeks in August. A sample was sent for pathology testing and results indicated an infection by the bacteria Photobacterium damselae, which the fish likely succumbed to due to unfavorable water conditions (high temperatures and possibly a combination of low DO). Other species affected by mortality events included scup, black sea bass, and smooth dogfish (all from fishing bycatch) as well as a minor horseshoe crab kill. From 2015-2019, RI DMF received 29 reports of fish kill events. The majority of these kills were due to hypoxic conditions during the warm late-summer months and affected Atlantic menhaden. Other reported kills were the result of fishing bycatch. In the event of an incident that causes significant environmental impact, it is imperative for RI DMF to be able to respond quickly and efficiently to assess the effects on fish habitat in Rhode Island waters. Coordination with other state agencies (including RI DEM Office of Emergency Response, OWR, and Office of Law Enforcement) has proven fundamental to this fast response time and impact assessment. A relatively high number of fish kill events were reported in 2018 and 2019 (i.e., 11 reported events in each year), and due to the diligence of staff throughout RI DEM, all events requiring action were responded to in a timely manner. The continuation of this coordinated effort is necessary to ensure that a fast and efficient response is maintained. Also, continued emergency response training will allow further improved response to these incidents. Trainings that RI DMF staff have participated in over the last grant cycle include oil spill response training including boom deployment and other geographic response protocols, Natural Resource Damage Assessment training, and FEMA’s Incident Command System. RI DMF staff will continue to take advantage of training opportunities as they become available in the future to further hone our skills in emergency response.

10
Table 1. Activities and potential impacts identified during the permit review process performed in 2019 by RI DMF for 72 separate projects. Aquaculture-related reviews are excluded from this table.
Activities & Potential Impacts 2014 2015 2016 2017 2018 2019 6-Year TotalPotential Impacts to SAV or Benthic Habitat 0 0 1 5 11 13 30Saltmarsh Restoration 4 5 3 3 6 4 25Eelgrass Restoration 1 0 0 1 4 0 6Artificial Reef 1 0 0 0 1 1 3Maintenance Dredging 8 8 10 17 6 8 57New Dredging 3 1 0 2 2 2 10New Marina 3 2 0 0 2 0 7Marina Expansion or Reconfiguration 0 1 3 2 2 5 13Restoration of Tidal Flow to Coastal Pond 1 0 0 2 5 0 8Residential Docks (new) 40 20 23 0 29 18 130Residential Docks (modification) 7 2 7 39 39 13 107Commercial/Municipal Piers or Docks 1 3 0 13 5 5 27Commercial/Municipal Mooring expansion 0 0 5 0 0 2 7Salt Marsh or Coastal Wetland Impacts 0 0 0 16 14 8 38Beach Nourishment or Coastal Feature Restoration 2 0 3 1 4 6 16Waterfront Bulkhead/Riprap 4 1 2 11 6 11 35Waterfront Development 1 0 0 0 1 4 6Public Works or Utility 1 0 1 1 6 7 16Fish Passage 0 0 0 0 0 0 0Potential Shellfish Impacts 0 0 0 4 4 4 12Channel Maintenance 0 0 0 5 1 4 10Boat Ramp (New or Repair) 1 1 0 2 1 2 7Oyster Restoration 0 4 0 2 4 0 10Recreational Use (Improve/Impacts) 0 0 0 0 7 3 10Impacts from Discharge 0 0 0 6 3 2 11Coastal Restoration Other 0 0 0 5 0 0 5Activities & Potential Impacts - Total 78 48 58 137 163 122 606Projects Reviewed - Total 85 68 51 77 95 72 448

11
Table 2 Summary of fish kill events in 2019.
Date Reported
Water Body Persons/Agencies Notified
Response Date of Response
Species Affected Approximate number affected/dead
Water Quality
Measured
Samples Taken
Photos Cause
6/19/2019 Providence River DEM DMF DEM DMF responded to the
scene
6/19/2019 Horseshoe crab Limulus
polyphemus
Minor (~20) N N N Likely natural stranding, possibly caused by storm
surge
6/26/2019 RI Sound RI DOH, DEM OWR, DEM DMF,
DEM DLE
DEM DMF responded to the
scene
6/27/2019 Scup Stenotomus chrysops
Minor (~100) N N Y (provided
by reporter)
Fishing bycatch from a trawling vessel or floating fish trap. No further action
needed.
6/28/2019 (first
observed 6/25/2019)
West Passage DEM DMF DEM DMF responded to the
scene
6/28/2019 Scup Stenotomus chrysops
Black Sea Bass Centropristis striata
Minor (~50), not observed during
response (eaten or washed off beach)
N N Y (provided
by reporter)
Fishing bycatch from a trawling vessel or floating fish trap. No further action
needed.
8/7/2019 Narrow River DEM DMF, Catalina Martinez
(NOAA), Marta Gomez-Chiarri
(URI)
DEM DMF responded to the
scene
8/07/2019 (initial
response and water quality
check) 8/14/2019
(striped bass sample
collected)
Striped Bass Morone saxatilis
Minor to moderate (event lasted ~2 weeks, multiple
mortalities in this time period. No more than a few dozen observed at a given time. Total
number dead not clear)
Y Y (whole fish)
Y For individual fish tested, pathogen Photobacterium damselae cause of death.
Likely succumbed to infection due to other stressors (high water
temps, low DO)
8/18/2019 Seekonk River DEM OWR, DEM DMF, DEM OER,
DEM DLE, RI DOH
DEM DMF responded to the
scene
8/19/2019 Atlantic menhaden Brevoortia tyrannus
Moderate (hundreds) Y N Y Natural - ongoing intermittent hypoxia combined with high
concentration of fish and predators chasing them
into shallow waters
8/24/2019 Seekonk River/Providence
River
DEM DLE, DEM DMF
DEM DMF responded to the
scene
8/24/2019 Atlantic menhaden Brevoortia tyrannus
Moderate (hundreds) Y N Y Natural - ongoing intermittent hypoxia combined with high
concentration of fish and predators chasing them
into shallow waters
8/25/2019 Sakonnet River DEM DMF Response not deemed
necessary
8/25/2019 juvenile Atlantic menhaden
Brevoortia tyrannus
Minor (<50) N N N Natural - chased on beach by predators
8/26/2019 Seekonk River DEM DMF, DEM OER, DEM DLE,
DEM OWR, RI DOH
DEM DMF responded to the
scene
8/27/2019 Atlantic menhaden Brevoortia tyrannus
Minor (~50 fish observed)
Y N Y Natural - ongoing intermittent hypoxia combined with high
concentration of fish and predators chasing them
into shallow waters

12
Date Reported
Water Body Persons/Agencies Notified
Response Date of Response
Species Affected Approximate number affected/dead
Water Quality
Measured
Samples Taken
Photos Cause
8/26/2019 Seekonk River DEM DMF Already investigated
similar fish kills in area during
same time period, likely from same
mortality event - response
deemed not necessary
NA Atlantic menhaden Brevoortia tyrannus
Minor (30-50) N N N Natural - ongoing intermittent hypoxia combined with high
concentration of fish and predators chasing them
into shallow waters.
9/13/2019 Pawtuxet River DEM DWF, DEM DMF
DEM DMF responded to the
scene
9/16/2019 Likely Atlantic menhaden
Brevoortia tyrannus
Minor (none observed)
Y N N Natural - ongoing intermittent hypoxia combined with high
concentration of fish and predators chasing them
into shallow waters.
10/22/2019 RI Sound DEM DLE, DEM DMF
DEM DMF responded to the
scene
10/23/2019 Smooth dogfish Mustelus canis
Minor (<10) Y N Y Fishing bycatch washed up on beach