assessment of remote sensing technologies for …...assessment of remote sensing technologies for...
TRANSCRIPT
Assessment of Remote Sensing
Technologies for Location ofHydrogen and Helium Leaks
NAG 10-0290
Phase 2 Final Report
31 October 2001
R. Glenn Sellar
Yongho SohnVarun Mathur
Peter Reardon
This research was supported by the NASA Kennedy Space Center
under grant # NAG10-0290
Florida Space Institute
https://ntrs.nasa.gov/search.jsp?R=20020088731 2020-04-24T18:34:42+00:00Z
TABLE OF CONTENTS
] EXECUTIVE SUMMARY ................................................................................................................... 2
1.1 PHASE 2 OBJECTIVES ....................................................................................................................... 2
I, I. l Advance Rayleigh Doppler technique fi.om TRL 1 to TRL 2 ................................................... 2
1.1.2 Plan to advance Rayleigh Doppler technique from TRL 2 to TRL 3 ....................................... 2
I. 1.3 Identify researchers and resources for further advancement .................................................. 21. I. 4 Extend diffusion model .......
1.2 PHASE 2 RESULTS ........................................................... 2............................................................................................................................
2 ADVANCE RAYLEIGH DOPPLER TECHNIQUE FROM TRL 1 TO TRL 2 ............................. 6
2.1 INTRODUCTION ................................................................................................................................ 6
2.2 THEORETICAL MODEL ...................................................................................................................... 6
3 PLAN TO ADVANCE RAYLEIGH DOPPLER TECHNIQUE FROM TRL 2 TO TRL 3 ........ 21
3.1 CONCEPTUAL DESIGNS .................................................................................................................. 21
3.2 TECHNOLOGY SURVEYS ................................................................................................................. 223.2, I
Laser Technologies. ............................................................................................................... 22
3.2.2 Detector technologies .............................................................................. 23
3,2.3 Modulator technologies ......................................................................................................... 24
3.2.4 Vapor filter technologies ....................................................................................................... 24
3.2, 5 Frequency discrimination technologies ................................................................................. 24
3.3 CONCEPTUAL DESIGNS .................................................................................................................. 24
3.4 PREDICTED SIGNAL-TO-NOISE RATIOS 25
3.5 EXPERIMENT DESIGN .......................................................................................................... 27
3.5.1 Homodyne experiment ........................................................................................................... 27
3.5.2 Direct detection experinlent .................................................................................................. 29
IDENTIFY RESEARCHERS AND RESOURCES FOR FURTHER ADVANCEMENT ........... 30
4.1 LIDAR AND RAYLEIGH SCATTERING .............................................................................................. 30
4,1.1 Dr. Richard Seasholtz ............................................................................................................ 304.1,2 Dr. Richard B. Miles ....................................................................4.1.3 Dr, Walter Lempert ...... "........................................ 31
......................................................................................................... 35
4.1,4 Dr, Dennis K. Killinger, ........................................................................................................ 364.1.5 Dr. David A Krueger ...........
4.1.6 Dr. Chiao-Yao (Joe) She ............................................................ 37....................................................................................................... 8
4.2 SONAR .............................. 394.2.1 Dr. Stanley E Dunn .....................................................................................
.............................................................................................................. 94.3 RAMAN
4.3.1 NASA'JSCIIIIIIIIIIIIII ................................................................................................................ 41................................................................................................................ 41
4.3.2 NASA GRC (V_ A, de Groot) ................................................................................................. 414.3.3 NASA Stennis ........................................................................................4.3,4 NASA MSFC (W. T, Powers) .................. "........................... 41
•.............................................................................. 414.3.5 Dr. Michael D Hampton ......................................... ............ 41
4.3.6 Myung K. Kim .................................... ................................... 42
4.4 SCHLIEREN ..................................................................................................................................... 44
4, 4. I Dr. Robert E. Peale ............................................................................................................... 44
4.4.2 Dr, De Von W. Griffin ............................................................................................................ 45
4.5 FOURIER TRANSFORM INFRARED ................................................................................................... 454.5,1 Thomas J, Kulp ...........................
........................................................................................... 45
EXTEND DIFFUSION MODEL'"" * °" _° °'°" "* °"" * °" * *"" ° * °"" * °"" °""""" *° °• •* •* "• •*'°•°'°• "" • •° *°°°• •• •* *" **" •"" • •• •-••-°, • •-,• • * • • ,. 46
5.1 BASIC MODEL ................................................................................................................................ 46
5.2 EXTENDED MODEL .............. 49
REFERENCE CITATIONS"• """ •""" """ * •"" "" "* "" "" °• *" •""" "" •""" •""" •" •"" •" *" • *"" "" *"" •""" *" •° ** *• *°""" ° •" • • • • *• •-,. ,• • ° • • •-• •..° •. • * 51
6

APPENDICES ..................................................................................................................................... 52
7.1 NASA TECHNOLOGY READINESS LEVELS ..................................................................................... 52
7.2 BIBLIOGRAPHY ............................................................................................................................... 53
7.2.1 References Included in the Appendix ..................................................................................... 53
7.2.2 Additional References ............................................................................................................ 54
1 EXECUTIVE SUMMARY
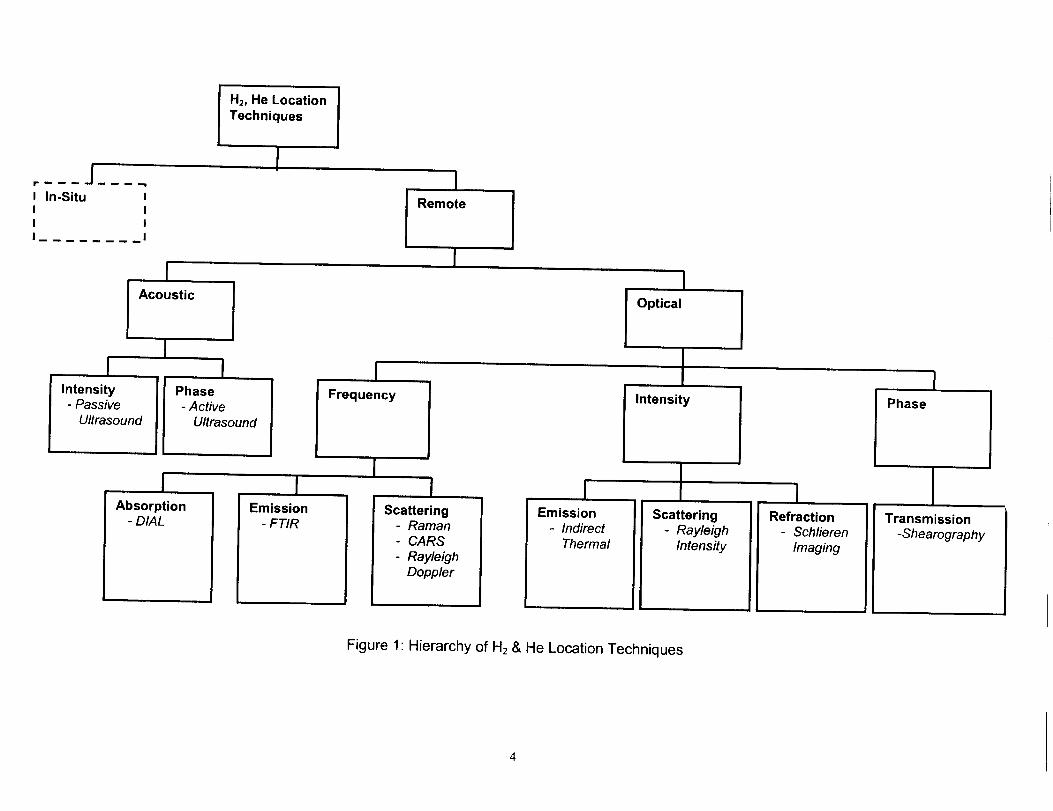
In Phase 1 of this project, a hierarchy of techniques for H2 and He leak location was
developed (see Figure 1). A total of twelve specific remote sensing techniques were
evaluated; the results are summarized in Table 1. A basic diffusion model was also
developed to predict the concentration and distribution of H2 or He resulting from a leak.
1.1 Phase 2 Objectives
The objectives of Phase 2 of the project consisted of the following four tasks:
1.1.1 Advance Rayleigh Doppler technique from TRL 1 to TRL 2
The first task was to advance the Rayleigh Doppler technique from TechnologyReadiness Level (TRL) 2 to TRL 3 by developing a theoretical model. The result of this
task is an interactive model that provides expected signal-to-noise ratio as a function ofkey design parameters.
1.1.2 Plan to advance Rayleigh Doppler technique from TRL 2 to TRL 3
The second task was to design and estimate the cost for an experiment intended to
advance the Rayleigh Doppler technique from TRL 2 to TRL 3. The result of this task is
a design for the experimental apparatus, and a parts list including costs.
1.1.3 Identify researchers and resources for further advancement
The third task was to identify researchers, facilities and other resources that couldcontribute to the further advancement of this research.
1.1.4 Extend diffusion model
The fourth task was to extend the diffusion model developed in Phase 1 to apply to thefollowing:
1) The case for diffusion into an enclosed volume;
2) Inclusion of the effect of forced convection; and
3) Inclusion of the effect of gravitational convection.
The result of this task is an interactive model of concentration as a function of position,for various leak parameters and environmental conditions.
1.2 Phase 2 Results
A theoretical model has been developed that predicts the signal-to-noise ratio as a
function of the key design parameters. This model includes both direct detection and
heterodyne detection.
Five approaches to the Rayleigh Doppler have been considered singly and in combination
as candidates for a proof-of-principle experiment.
1) Heterodyne
a) Homodyne
b) Offset Homodyne
c) Heterodyne
2) Vapor Absorption Filter
3) Fabry Perot
A survey of the key technologies for the laser, detector, modulator, filter, and frequency
discriminator has indicated that two approaches may be currently feasible within the
expected budget constraints for Phase 3: homodyne, and a combination of vapor
absorption filter and Fabry-Perot. Analyses using the model developed in this phase
indicate that both of these techniques are expected to provide signal-to-noise ratios
suitable for proof-of-principle experiments.
Designs for these two experiments have been outlined, and the required parts have been
listed. Several experts have been identified who may be helpful in pursuing further
research, and their curricula vim are included in the report.
The concentration model developed in Phase 1 has been successfully extended to include
the effects of gravitational convection and forced convection. This model is an essential
tool for relating concentrations to leak rates.
I H2, He LocationTechniques
r m m_Jmmm,,.t
i In-Situ iI I
I I
I_ I
IIntensity- Passive
I
" Acoustic
I
Ultrasound
II
Phase
- Active
Ultrasound
IAbsorption
- DIAL
IRemote
Frequency
i
II
Emission
- FTIR
IScattering
- Raman- CARS
Rayleigh
Doppler
IOptical
Intensity
IEmission
- IndirectThermal
IScattering
- Rayleigh
Intensity
IPhase
1Refraction
Schlieren
Imaging
]Transmission
-Shearography
Figure 1: Hierarchy of H2 & He Location Techniques
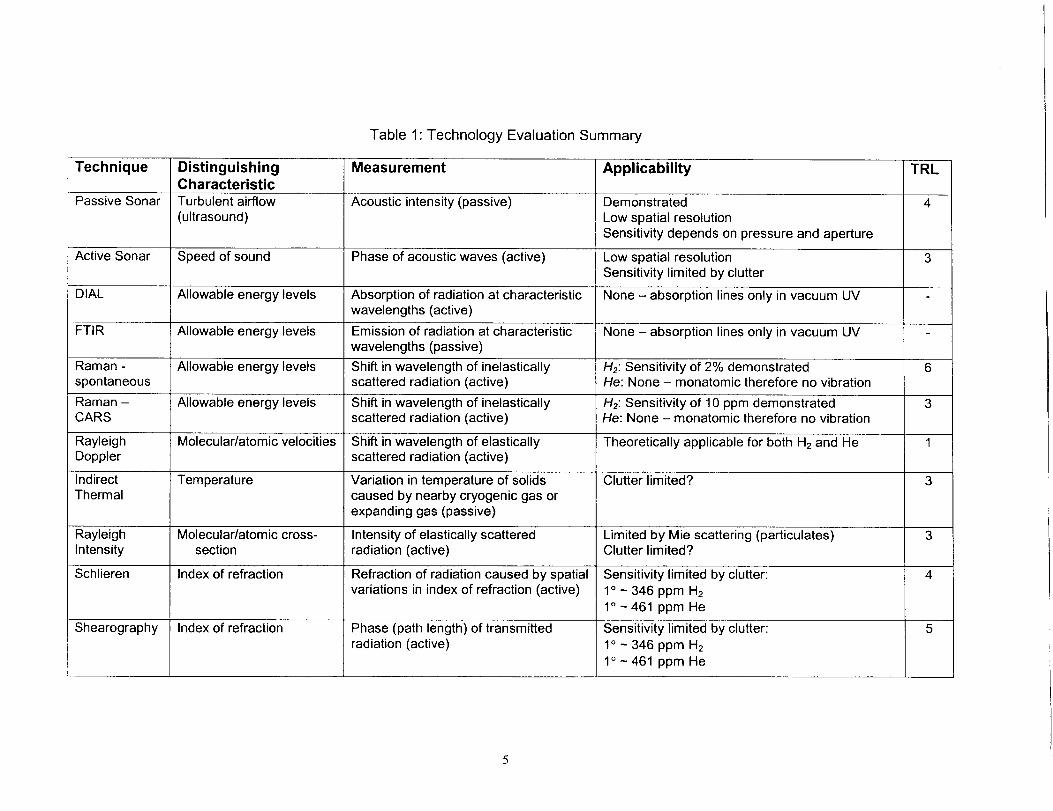
Table 1:TechnologyEvaluationSummary
Technique Distinguishing Measurement ApplicabilityCharacteristic
Passive Sonar Turbulent airflow Acoustic intensity (passive) Demonstrated
(ultrasound) Low spatial resolution
Sensitivity depends on pressure and aperture
Active Sonar Speed of sound Phase of acoustic waves (active) Low spatial resolutionSensitivity limited by clutter
DIAL Allowable energy levels Absorption of radiation at characteristic None - absorption lines only in vacuum UV
wavelengths (active)
FTIR Allowable energy levels Emission of radiation at characteristic None - absorption lines only in vacuum UVwavelengths (passive)
Raman - Allowable energy levels Shift in wavelength of inelastically H2: Sensitivity of 2% demonstrated
spontaneous scattered radiation (active) He: None - monatomic therefore no vibration
Raman - Allowable energy levels Shift in wavelength of inelastically H2: Sensitivity of 10 ppm demonstratedCARS scattered radiation (active) He: None - monatomic therefore no vibration
Rayleigh Molecular/atomic velocities Shift in wavelength of elastically Theoretically applicable for both H 2 and HeDoppler scattered radiation (active)
Indirect Temperature Variation in temperature of solids Clutter limited?
Thermal caused by nearby cryogenic gas or
expanding gas (passive)
Rayleigh Molecular/atomic cross- Intensity of elastically scattered Limited by Mie scattering (particulates)Intensity section radiation (active) Clutter limited?
Schlieren Index of refraction Refraction of radiation caused by spatial Sensitivity limited by clutter:
variations in index of refraction (active) 1° - 346 ppm H2
1° -461 ppm He
Shearography Index of refraction Phase (path length) of transmitted Sensitivity limited by clutter:
radiation (active) 1° _ 346 ppm H2
1°-461ppmHe
TRL
4
6
3
3
4
2 ADVANCE RAYLEIGH DOPPLER TECHNIQUE FROM TRL 1 TO TRL 2
2.1 Introduction
When electromagnetic radiation is emitted, scattered, or reflected from an object moving
toward or away from an observer, the observed wavelength is shifted in what is known as
the Doppler effect. The molecules of a gas will scatter electromagnetic radiation in what
is known as Rayleigh scattering. Thus radiation that is Rayleigh scattered from a gas maybe shifted in wavelength due to the velocity of the scattering molecules.
Mass m, speed v, and kinetic energy Ek, are related according to the following equation:
1Ek = -- my2
2
The distribution of kinetic energies of the molecules in a gas is independent of the
composition of the gas, and depends only (to first order) on the temperature of the gas.
But since different gases have different molecular masses, the distribution of speeds willvary with the composition of the gas.
Since the molecules in a gas move in a random distribution of velocities, when light of a
single frequency is scattered from a gas the frequency spectrum of the scattered light is
broadened in an effect known as Doppler broadening. The degree of broadening will be
dependent on the velocities of the molecules, which in turn depends upon the
composition of the gas. Thus it is possible to determine the composition of a gas bymeasuring the Doppler broadening of Rayleigh scattered light 1.
2.2 Theoretical model
The distribution of speeds is given by the Maxwell-Boltzmann distribution:
3
m-- V2e 2kT
wheref(v) is the probability density (i.e.f(v) 6v is the fraction of molecules with velocity
between v and v+rv), m is the mass of the molecule, k is the Stephan-Boltzmann
constant, and T is the absolute temperature. The speed distributions for H2, He, N2 and 02at 293 K (room temperature) are shown in Figure 2.

.2.135237.10-3.
fH2 (v)
fHe (v)
fN2 (v)
fo2 (v)
.3.020604.10- 36
0.01
1.10 -3
1,10 -4
1.10 -5
1.10 -6
1ol0 -7
1.10 -8
1.10 -9
1,10 -I0
i,10 -11
1,10 -12
1,10 -13
1,10 -14
1.10 -15
1,10 -16
1.10 -17
1.10 -18
1,10 -19
1,10 -20
1.10 -21
t.10 -22
1.10 -23
1,10 -24
1,10 -25
1,10 -26
1,10 -27
1.10 -28
1.10 -29
1,10 -30
1,10 TM
1.10 -32
1.10 -33
1,10 -34
1,10 -35
1.i0 -36
I I I I 1
k,
t
t
\
\
\
I I I I I I500 1000 1500 2000 2500 3000
,10. v
I
.... ._ 7 7
m
'r--
Figure 2: Distribution of speeds for H2, He, N2 and 02 at 293 K
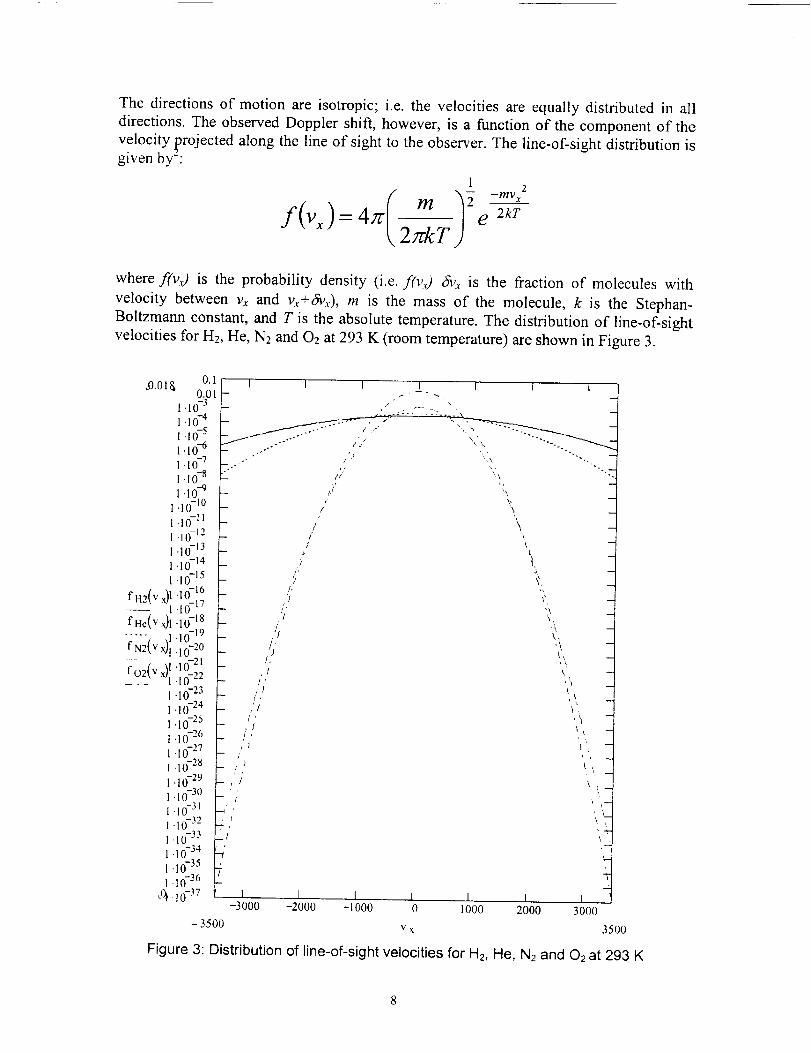
The directions of motion are isotropic; i.e. the velocities are equally distributed in all
directions. The observed Doppler shift, however, is a function of the component of the
velocity _rojected along the line of sight to the observer. The line-of-sight distribution isgiven bU:
1 2
t,.2rckT j
where f(vO is the probability density (i.e. f(vO dVx is the fraction of molecules with
velocity between Vx and Vx+&x), m is the mass of the molecule, k is the Stephan-
Boltzmann constant, and T is the absolute temperature. The distribution of line-of-sight
velocities for H2, He, N2 and 02 at 293 K (room temperature) are shown in Figure 3.
LO•OI& 0.10.01
.10-3
.10 -4
.1o--5
.10-6
.lo:
.io-8
.lo-9.10-.0.10-11
.io-12
.10-i3
.10--14
.10--i5
f l12(v×)1 '10 -16I .10 --17
f He(V x)l .10 -18
"iN2( v ,1"10"-19_Jl.l0-20
] ..... .10-2_fO(_2_vx) .l 0-22
.10- 23
• 10 -24
• 1( 25
•10-26.10- 27
.10-28
•10 -29
.10-30
.10- 31
•10-32
.10- 33
•10 -34
.10- 35
.10-36
,.0 . i 0 -37
I I t I I I I
7
i i-3000
-3500
. .-- /' - ",, \ -..
-- //
.._."*'" I?' "..k
--.- ,•, %.
"" :)" ',\ '7./ t,
- / \ -- / \
! t -
_-- f 'k,i --
i" & --
- 7 ¢[, ,!\ --
// t' -
], --
rl L -
- t j' ' <_ i
\
"T--2
I I I I I I-2000 -1000 0 1000 2000 3000
v x 3500
Figure 3: Distribution of line-of-sight velocities for H2, He, N2 and O2 at 293 K
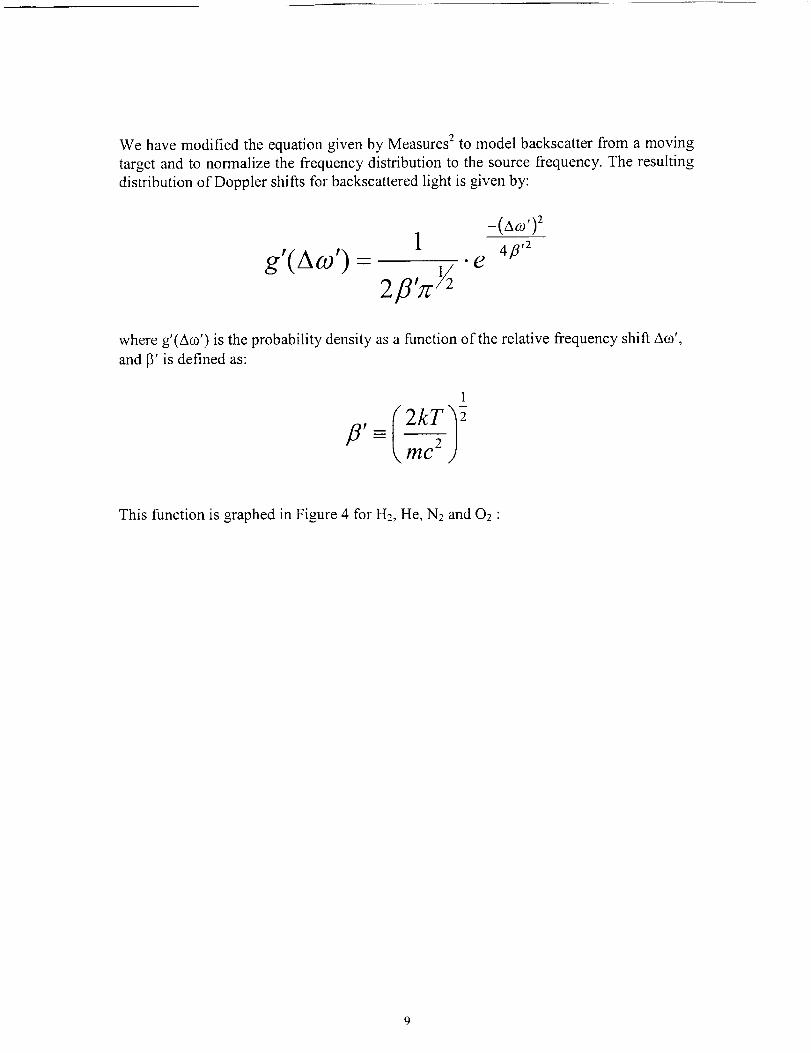
We have modified the equation given by Measures 2 to model backscatter from a moving
target and to normalize the frequency distribution to the source frequency. The resulting
distribution of Doppler shifts for backscattered light is given by:
-(Aog') 2
1 4fl,2
g'(Aco') - 2fl,7c_. e
where g'(A_o') is the probability density as a function of the relative frequency shift Am',
and 13' is defined as:
1
mc2This function is graphed in Figure 4 for H2, He, N2 and O2 "
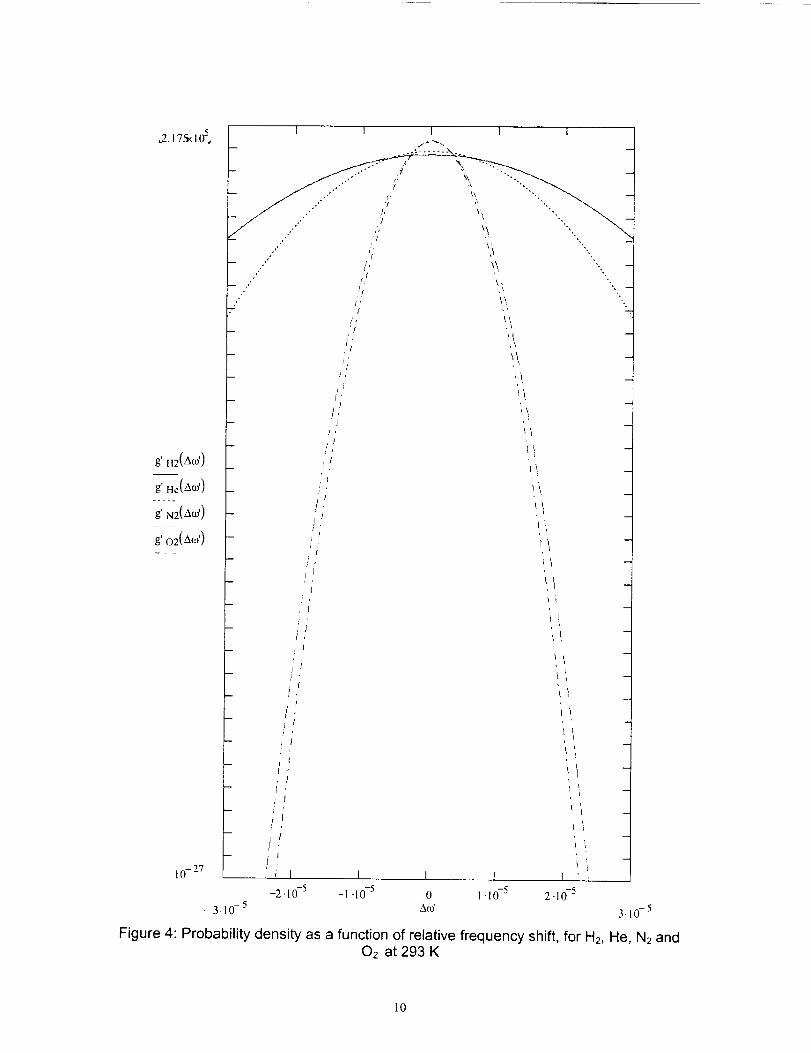
I I I
-1 .lO-5 0 1 .10-5
-3.10 -5 Am' 3.10-5
Figure 4: Probability density as a function of relative frequency shift, for H2, He, N2 andOz at 293 K
10

The four largest constituents of standard air 3 are shown in Table 2:
Table 2: Molar fractions for standard air
Constituent Molar Fraction
N2 0.78084
02 0.20946
Ar 0.00934
CO2 0.00033
Together, 02 and N2 make up a molar fraction of 0.9903 so in the model we have
neglected the Ar, CO2, and other minor constituents. The molar fractions of H2 or He are
inputs to the model, and the molar fractions of N2 and O2 in the resulting mixture are
given by:
N 2 = 0.78084. (1 - H 2 - He) 02 = 0.20946. (1 - H 2 - He)
where N2, 02, H2 and He are the molar fractions of the respective gasses.
The molecular densities are given by:
Ntg 2 = NairH 2 Nile = NoirHe NN2 = N.irN 2 No2 = NairO 2
where Nair = 2.55 x 1019 cm "3 is the molecular density of air at standard temperature and
pressure.
The Rayleigh cross-section for a wavelength of 694.3 nm are listed in Table 3:
Table 3: Rayleigh cross-sections
Constituent
N2
02
H2
He
Rayleigh Cross-section [cm z sr -t2.14 x 10 "28
1.80 x 10 -28
0.44 x 10 .28
0.03 x 10 .28
The system design parameters are inputs to the model. These include the length of the test
chamber R, and the transmitter design parameters:
• wavelength of the laser 2
• power of the laser _0
• bandwidth of the laser B
The Rayleigh cross-sections at the laser wavelength are given by:
11

ZI
N Z6Z ]e ZO pue zN 'e H 'zH JOj 'uJu _;ZZ'Z££ jo ql6ueleAeM Jose I
e aoj '[s/sue!peJ] ;j!qs Fouenbeaj Jeln6ue jo uo!loun j e se _l!suep ,{l!l!qeqoad :_; ean6!-I
60[" 0_; mV 601 • 0S -
Ol 0I. l, ol 0l. Z 0 01. Z-01 Oi OI- t'-
I I I I I Lc-OI [L_-OI
-- 9z_OI ' I
-- _;Z_ 01 + 1
-- t,Z_ 01 • 1
'l rE_ 01" 1
t - ZZ_ Of' I
4._ + ]
_ 7 iz_ol, Il\ _ ,t
-- \ _ ?', -- oz_Ol, I
_ _ "_ / (_v) zo, / -- 6t_Ol. I ....
+ , (my) ZN
J
- t '_ _ _l_o t. _ _v) _u
\ , , (_v) :u
, 1 -- LI_O [ . [
_\ t / , 91_01" I
-- \ " +' , -- 01"1
,< "_ # /
\ ) ,
-- _\"_ /'/ -- _1_01" I
\ "_ L 'x-
-- 'x .///
_ , , -- _l_Ol" l,\, t/
Jl• x
, J/
;.... "L'.\, ,;, ......_---,._ " +.. zi_Ol, t
"'- .t)_ "_
_ ...... _....--:r::=_'_ ll_O[" l.......... • °-.
I I "" "r-" __ i l r, ll -°IX 91'19_
01_01. i
:S oan_!d u! UA_OqS0.m ttm SEE'Z£S jo qlgUOlaAeA_, aOSeI e aoj so!l!sua p
gl!l[qeqoad polopom oql 'oldtuexo tre s V "lj!qs gouonbo.tj poz!letUaOU e se treq! aoqle._ s/pea
u[ possoJdxo oq treo _u!uopeoaq ._olddo o oql 'pou_op A_OUS! ql_uOIOAeA_ aose I oql o3u!S
•tuu Z'lz69 le uo!loos-ssoa3 oql si ft,69.o pue y ql_U0IOAeA,_ le uo!loos-ssoa3 oql sl o 0aoqA_
_Z 1 f'1_69"O = .0_, u_uc'l:'69
The spectral profile of the laser is assumed to be Gaussian, represented by a probability
density of:
1_" --°e
glaser(A09) B
where glase,.(A03) is the probability density as a function of the angular frequency shift Aco,
and B is the bandwidth of the laser (in angular frequency).
The receiver design is described by the following inputs to the model:
• diameter of the collecting lens Dr
• saturation limit for the detector Osot
• responsivity of the detectorResp
• noise-equivalent-power for the detector NEP
• sampling time r
The model assumes that the field-of-view of the receiver encompasses the entire
illuminated volume of air. It is up to the user to select a design that does not violate this
assumption.
The collected spectral flux from each constituent is given by:
(Aco) = q oN rRY2rg(Aco )
where (_2(Aco) is the collected spectral flux in watt. seconds [W's], _ is the laser flux in
watts [W], N is the molecular density of the constituent in molecules per cubic centimeter
[cm-3], o-is the Rayleigh cross-section in square centimeters per steradian [cm2/sr], .62ris
the solid angle subtended by the receiver lens in steradians [sr], R is the length of the
scattering volume in centimeters [cm], and g(Aco) is the probability density function in
units of seconds [s]. Note that the spectral units used here are in terms of angular
frequency, so the spectral flux and the probability densities are per unit angular
frequency.
Most of the laser flux will not be scattered by the gas mixture, but will instead continue to
propagate until it hits a solid surface, from which it will be reflected. We have assumed
that the point where the beam intersects the surface will be in the field-of-view of the
receiver. The surface is modeled as a Lambertian (diffuse) reflector with unit reflectance,
resulting in a spectral flux of:
, w(Aco) = 1 n,.g,a,e,.(Aco)2"(
where ¢3_w(Aco) is the collected spectral flux in watt. seconds [W's], _ is the laser flux in
13
watts [W], .(2r is the solid angle subtended by the receiver lens in steradians [sr], and
&_ser(Aco) is the probability density function of the laser in units of seconds [s].
The solid angle subtended by the receiver is given approximately by:
2
r_4 rR 2
The total spectral flux is the sum of the fluxes from the constituents and from the wall:
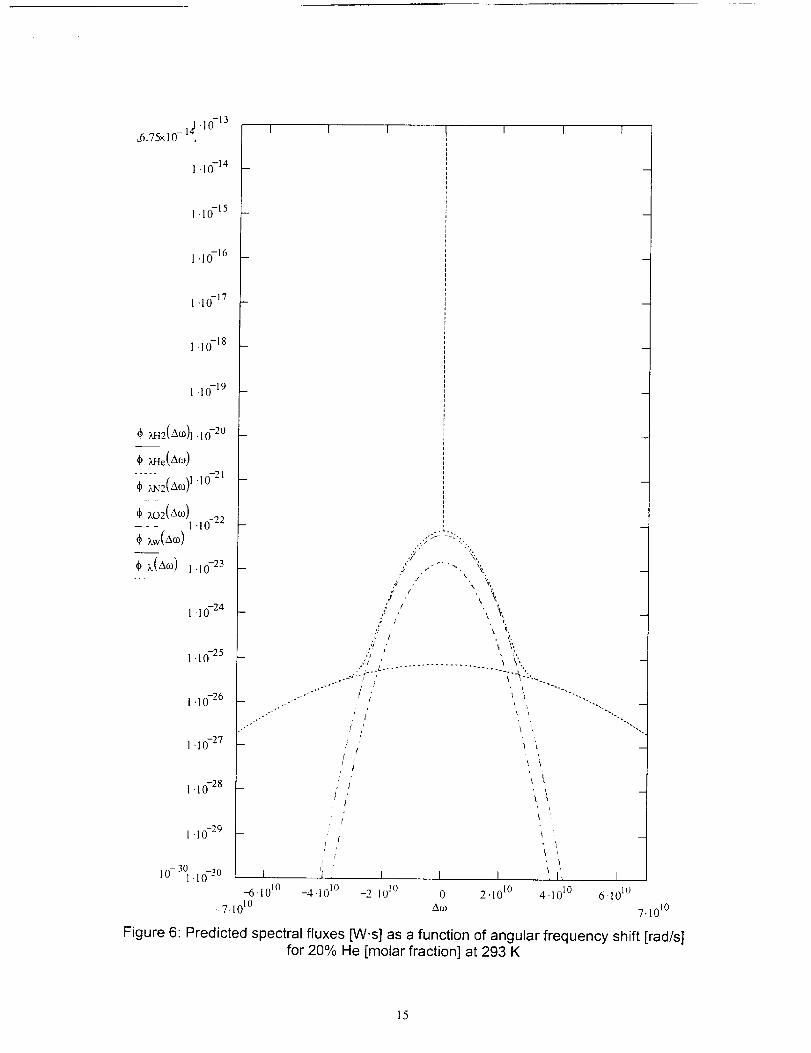
#2 (Ao))= #2.//2 (A(-O)-t-- _2/-/e (A(.o)Jr- #AN2 (A(.o)-Jr- _202 (a(_o)n u #2w (A(_o)
The predicted spectral fluxes are plotted on a logarithmic scale in Figure 6:
14
1.10-15
1.10-16
1.10 -17
1,1O-_8
1 .10 -19
_, _2(Am)1.1o-2°
¢ _2(A,_)1.lo-21
• 10 -22
¢ _(Am) .10-23
•10 -24
,IO- 25
• 10 -26
.10-27
.to-28
.°..°- , j• ,*-
_-, _ ['
1
•1o-29 -
10-301 .10 -30 I
-6-101°
_7.101o
•; / _.
. /
.:/ z
." .L . ................... ,°-...
..,:._--, "(%::.......
xt
•
I [ I
-4"10 l° -2.101° 0 2.101° 4.101° 610 I°
Am7,101o
Figure 6: Predicted spectral fluxes [W.s] as a function of angular frequency shift [rad/s]for 20% He [molar fraction] at 293 K
15
Two detection techniques are included in the model: homodyne and direct detection. For
homodyne detection the received flux is mixed with a local oscillator (flux picked off of
the transmit beam) to provide amplification. The practical limit for the local oscillator
flux is determined by the saturation limit of the detector. We have (arbitrarily) set thelocal oscillator flux to:
bLo = 0.9" bsat
where Os,,t is the saturation limit of the detector in Watts, and OLo is the selected flux for
the local oscillator in watts. As may be seen from Figure 6, most of the signal at the high
frequencies results from the He in this example. A spectrum analyzer or electronic filters
may be used to select the signal from the frequency range of interest, which in this
example is 30 - 60 GHz. The flux within this frequency band is given by:
Obc1nd- _°)min _(_°)d_"_(/)max _naXin _(_'_'_
where _,,nd is the in-band flux, _b_(co) is the collected spectral flux, and O_rninand COrnaxarethe limits of the desired band.
The homodyned signal is given by:
S = Resp_qjbanaqkLO
where S is the signal in amps, and Resp is the responsivity of the detector in amps/watt.
The detector noise is given by:
Nde = Resp.
where N,m is the detector noise in amps, NEP is the noise equivalent power of the
detector in amps/(Hz) v_ and r is the sampling time in seconds.
16
The shot noise (also called photon noise or quantum noise) is a function of the signal,
given by:
+f3.
hc
N' 4t_shot -"
,hc Nshot = Resp . Nshot 2,
where ¢_is the total flux in watts, h is Planck's constant, c is the speed of light, ¢'is the
flux in photons/s, N'_hot is the shot noise in photons, and N,t, ot is the shot noise in amps.
Finally, the signal-to-noise ratio (SNR) for homodyne detection is given by:
SSNR =
_X_e, + NsZhot
In the direct detection approach, we would use a vapor absorption filter to suppress the
flux that is reflected from the wall. The absorption line is assumed to have a Gaussianprofile, modeled as:
- _jOD(Aco)=ODma x .e
where OD(Aco) is the optical depth (exponential absorption coefficient) at a frequency
difference of A co from the center of the absorption line in rad/s, and Bf is the bandwidth ofthe absorption line in rad/s. The transmittance profile is then given by:
t(Ao ):10
where t(Aco) is the transmittance as a function of frequency difference relative to the laser
frequency, and c is the offset (error) between the center of the spectrum of the laser and
the center of the spectrum of the absorption line in rad/s.
17
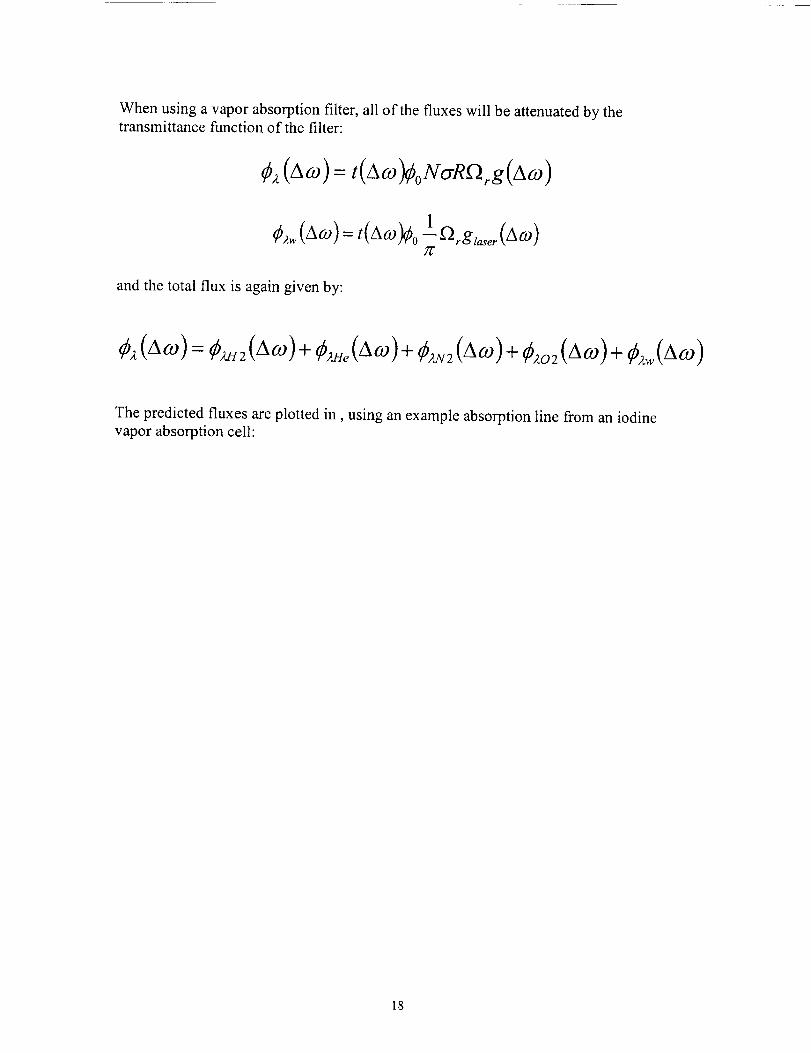
When using a vapor absorption filter, all of the fluxes will be attenuated by thetransmittance function of the filter:
_,t (AO))= t(AO))g/_oN_R_2rg(A09 )
"-- -- r glaser2r
and the total flux is again given by:
_A (m(.o) - _M-/2 (A(.o) at- _2He (A (-0) -ff _2N2 (A(_o) at- _d.02 (mo.)) nt- _2w (A(o)
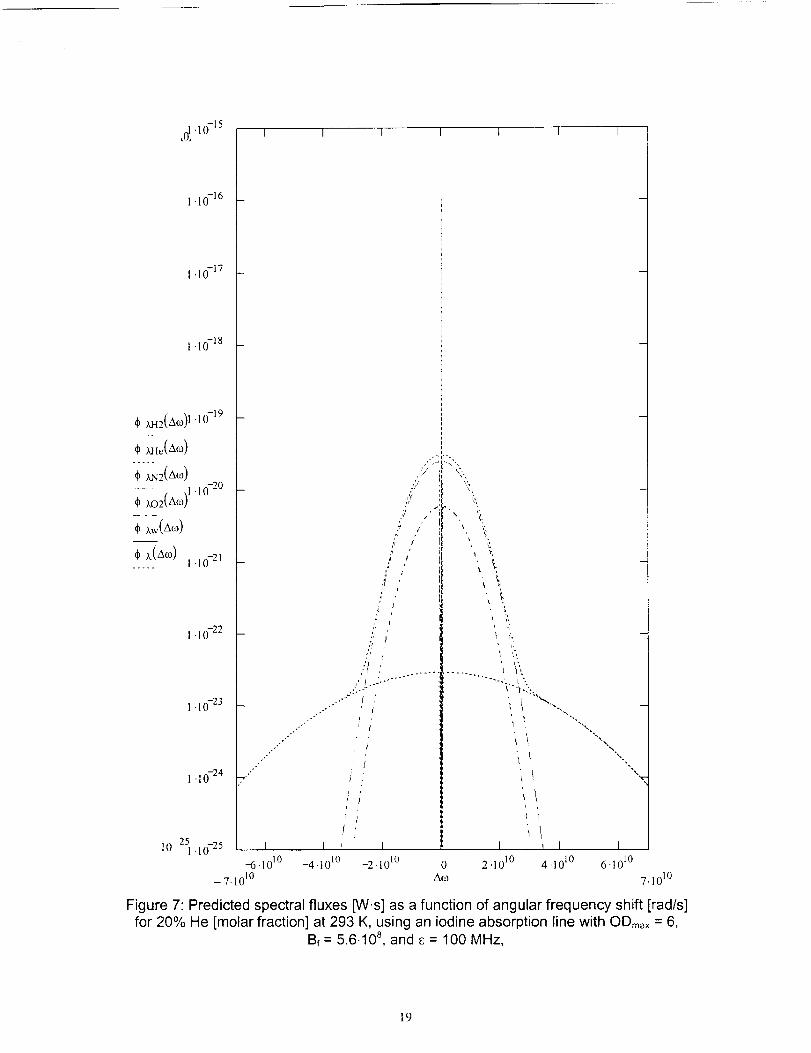
The predicted fluxes are plotted in, using an example absorption line from an iodinevapor absorption cell:
18
1.10 -16 D
I .10 -17 -
l .lO-Is -
I .10-22 --
1.10 -23 --
1 • 10 -24
10-251.10-25 I
-6 .lO 10
_7.101°
MA2(&CO) 1 '10 -19
, Zae(a,o)
* ?_02(zXm)1'10-20
L(Ao) l .10-21
,.'
°,
...¢ j;
t_
r
f
I '
-4 .l 010
:.;2 2_7.,
'?
,:7 /
,7I
yt
?
?1
;'f/'j
.°.----" ......,°
I
C,\k
i
i°,p
%%
%x
s
\,
4.10 Io
I i I-2.101° 0 2.10 I° 610 I°
Am 7.1010
Figure 7: Predicted spectral fluxes [W.s] as a function of angular frequency shift [rad/s]for 20% He [molar fraction] at 293 K, using an iodine absorption line with ODm_× = 6,
B¢ = 5.6-10 a, and c = 100 MHz,
19
For direct detection, the in band flux is simply:
and the signal is simply:
S = Resp. _bband
The detector noise, shot noise and SNR remain the same as for homodyne detection.
20
PLAN TO ADVANCE RAYLEIGH DOPPLER TECHNIQUE FROM TRL 2
TO TRL 3
3.1 Conceptual Designs
We have considered three basic approaches to implementing a Rayleigh Doppler
technique. These differ in the techniques used to discriminate between frequencies and
the techniques used to detect the signal. The first of these approaches has three variations,
resulting in five individual techniques:
1) Heterodyne
a) Homodyne
b) Offset Homodyne
c) Heterodyne
2) Vapor Absorption Filter
3) Fabry Perot
These techniques are not mutually exclusive; they may be used in combination, thus
providing a large number of potential conceptual designs to be considered.
The heterodyne approach uses a local oscillator (a laser) to both amplify the signal on the
detector and shift the frequency from optical frequencies (which are -100's of THz)
down to 10's of GHz. The amplification is proportional to the square root of the local
oscillator flux, but the local oscillator flux must be limited to below the saturation limit of
the detector.
The heterodyne family of approaches is subdivided into three variations: homodyne,
offset homodyne, and heterodyne. In the homodyne variation, the local oscillator is
extracted from the transmit beam using a pick-off mirror. The frequencies of the
homodyne signal are then equal to the difference between the transmit frequency and the
received frequencies. In order to respond to these frequencies, the detector must have abandwidth of 10's of GHz.
For offset homodyne, the local oscillator is also picked off from the transmit laser, but the
transmitted beam is frequency shifted by an electro-optic modulator (EOM) at a point
after the pick-off mirror but before the beam enters the test cell. The offset would in
principle be chosen to be close to the frequencies of interest, thus reducing the bandwidth
required for the detector, but this variation requires a high-frequency EOM.
For a true heterodyne approach, two separate lasers are used: one for the transmitter, and
the other for the local oscillator. This allows the center frequency to be offset without the
need for an EOM, but it requires two lasers, both of which must be highly stable in
frequency, and one of which must be tunable in frequency.
21
3.2 Technology Surveys
The feasibility and affordability of any of these techniques depends upon the technologies
that are currently available, particularly in regards to lasers, modulators, detectors,filters, and frequency discriminators.
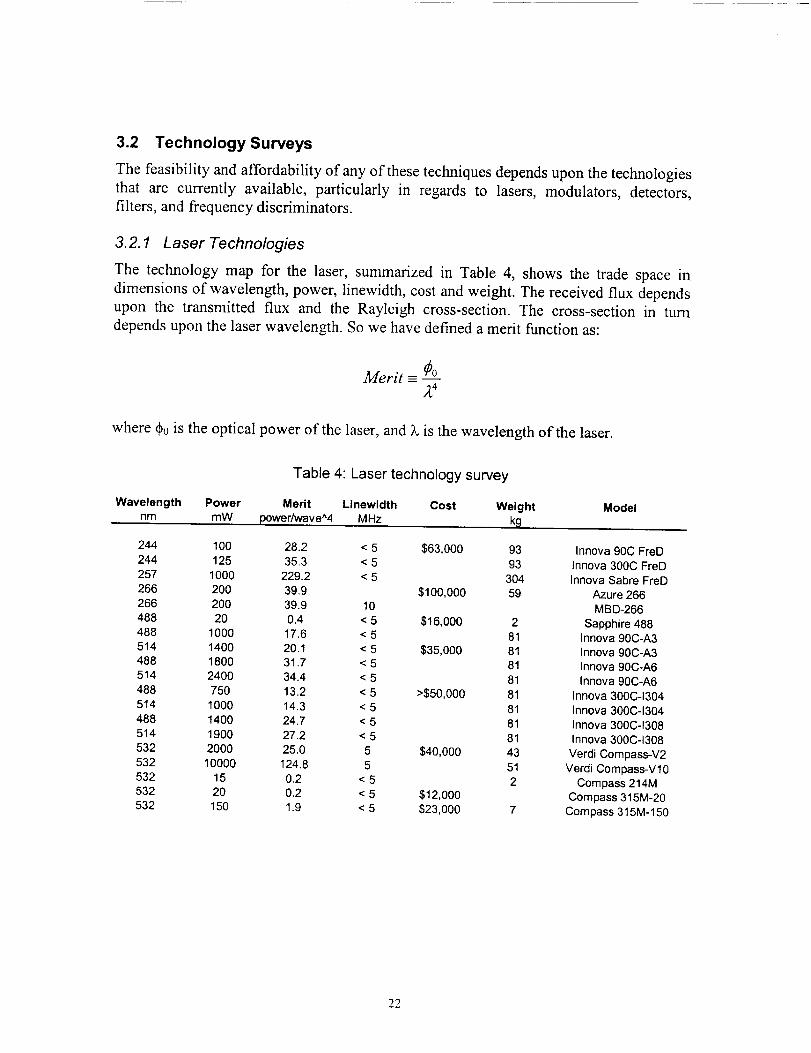
3.2. 1 Laser Technologies
The technology map for the laser, summarized in Table 4, shows the trade space in
dimensions of wavelength, power, linewidth, cost and weight. The received flux dependsupon the transmitted flux and the Rayleigh cross-section. The cross-section in turn
depends upon the laser wavelength. So we have defined a merit function as:
where dp0is the optical power of the laser, and )_ is the wavelength of the laser.
Wavelength Powernm mW
Table 4: Laser technology survey
Merit Linewidth Cost Weight
power/wave^4 MHz k_l
244 100 28.2 < 5
244 125 35.3 < 5
257 1000 229.2 < 5266 200 39.9
266 200 39.9 10
488 20 0.4 < 5
488 1000 17.6 < 5
514 1400 20.1 < 5
488 1800 31.7 < 5514 2400 34.4 < 5
488 750 13.2 < 5
514 1000 14.3 < 5488 1400 24.7 < 5
514 1900 27.2 < 5
532 2000 25.0 5
532 10000 124.8 5
532 15 0.2 < 5
532 20 0.2 < 5532 150 1.9 < 5
$63,000 93
93
304
$100,000 59
$16,000 2
81
$35,000 81
81
81>$50,000 81
8181
81$40,000 43
51
2$12,OOO
$23,O00 7
Model
Innova 90C FreD
Innova 300C FreD
Innova Sabre FreD
Azure 266
MBD-266
Sapphire 488Innova 90C-A3
Innova 90C-A3
Innova 90C-A6
Innova 90C-A6
Innova 300C-1304
Innova 300C-1304
Innova 300C-1308
Innova 300C-1308
Verdi Compass-V2
Verdi Compass-V10Compass 214M
Compass 315M-20
Compass 315M-150
22
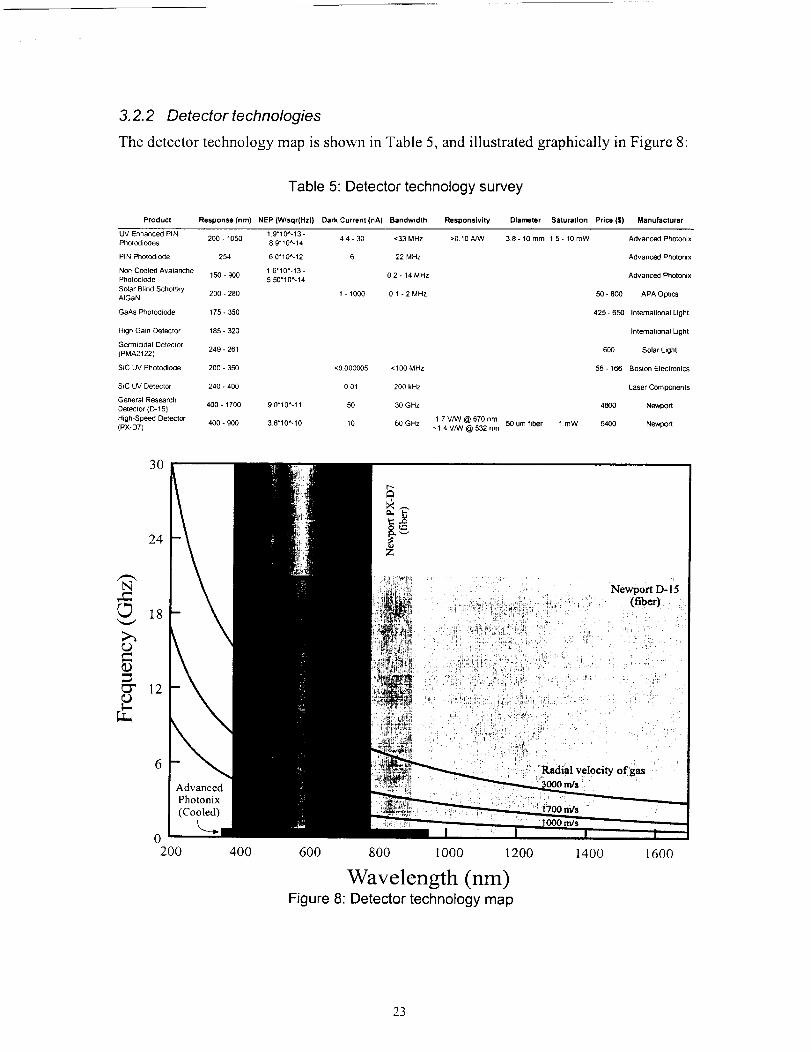
3.2.2 Detector technologies
The detector technology map is shown in Table 5, and illustrated graphically in Figure 8:
Product
Table 5: Detector technology survey
Response (nm) NEP (W/sqr(Hz)) Dark Current (hA) Bandwidth Responstvity Diameter Saturation Price ($) Manufacturer
UV Enhanced PIN 1 9"10^-t3-200 - 1050 44 - 30 <33 MHz >0.10 A/W 3.8 - 10 mm 15 o 10 mW Advanced Photonix
Phetodiodes 8 g" 10 ^- 14
PIN Phetodiode 254 6 0"10^-12 6 22 MHz Advanced Photonix
Non-Cooled Avalanche 1 6" I 0 ^- 13 -150 - 900 0 2 - 14 MHz Advanced Photonix
Pholodiode 5 50°10^-14
So_ar Blind SchottkyAIGaN 200 - 280 1 - 1000 0 1 - 2 MHz 50 - 800 APA Optics
GaAs Photodiede 175 - 350 425 - 650 International Light
High Gain Detector 185 - 320 International Light
Germicidal Detecter249 - 261 600 Solar Light(PMA2122)
SiC LIV Photodiode 200 - 350 <0000005 <100 MHz 55- 166 Boston Electronics
SiC UV Detecter 240 - 400 001 200 kHz Laser Components
General Research400 - 1700 9 0"10^-11 50 30 GHz 4800 Newport
Detector (D-t5}
High-Speed Detector 17 VAN @ 670 nm
(PX-DT) 400 - 900 3 6"10^-10 10 60 GHz -1 4 V/W @ 532 nm 50 um fiber 1 mW 6400 Newport
>-,_J
(L)
LT.
30
24
18
12
6
AdvancedPhotonix(Cooled)
0200 400
Newport D- ! 5
E
- " Radial velocity of gas
600 800 1000 1200
Wavelength (nm)Figure 8: Detector technology map
1400 1600
23
3.2.3 Modulator technologies
No modulators were found that could provide the required frequency shift of l O's ofGHz.
3.2.4 Vapor filter technologies
Only one commercial source was found for vapor absorption filters. Innovative Scientific
Solutions Incorporated sells sealed iodine molecular vapor absorption filter cells with
prices starting at - $ 2 K. No commercial sources were found for mercury atomic
absorption filter cells, but some researchers are open to the idea of providing one toorder.
3.2. 5 Frequency discrimination technologies
Heterodyne techniques shift the frequencies down to 10's of GHz, a range for which
electronic spectrum analyzers are widely available. For the direct detection technique a
tunable vapor filter, tunable laser, or a Fabry-Perot etalon could provide frequency-
scanning capability. Frequency tunability for lasers is feasible but expensive. Frequency-
tunability for vapor filters is affordable, but very slow and limited in range. Fabry-Perot
etalons designed for determining the spectral profiles of lasers are commercially availableand affordable.
3.3 Conceptual Designs
The technology maps have provided information that constrains the design options:
The primary driver for laser selection is the cost. The primary trade-off in laser
technology is price versus the merit function (based on power and wavelength). Higher
powers and shorter wavelengths drive the cost upwards. Only a few of the lasers in Table
4 fit within projected budget constraints for Phase 3. The heterodyne technique istherefore a poor candidate for Phase 3 since it requires two lasers, both of which must be
highly stable and one of which must be tunable. The ultraviolet lasers are outside the
budget constraints; as are all but the lowest power blue lasers, so green wavelengths seemoptimum for Phase 3.
The lack of suitable modulators implies that offset homodyne is not currently feasible.
Detectors are not a cost driver but they are a key performance driver. Two classes of
detectors are available: those with high bandwidth but very small sensitive area, and
those with moderate bandwidth and relatively large area. The former are appropriate forthe heterodyne family of techniques, and the latter for direct detection.
Iodine vapor cells are appropriate for use at green wavelengths, commercially available,
and affordable. Such a filter could provide substantial reduction in the background from
flux reflected from the wall, so there seems worthwhile to include one in an experiment.
The theoretical model (see section 2) shows that the width of the iodine absorption lines
24

is too narrow to block the unwanted signal from the 02 and N2. The survey of frequency
discrimination technologies (see section 3.2.5) shows that a Fabry-Perot etalon would be
appropriate for Phase 3.
Thus, based on the technology surveys, the design options for a Phase 3 experiment were
narrowed down to two conceptual designs:
1) Homodyne, at a green wavelength, with a fast detector; and,
2) Direct detection, at a green wavelength, with a large-area detector, an iodine
absorption cell, and a Fabry-Perot etalon.
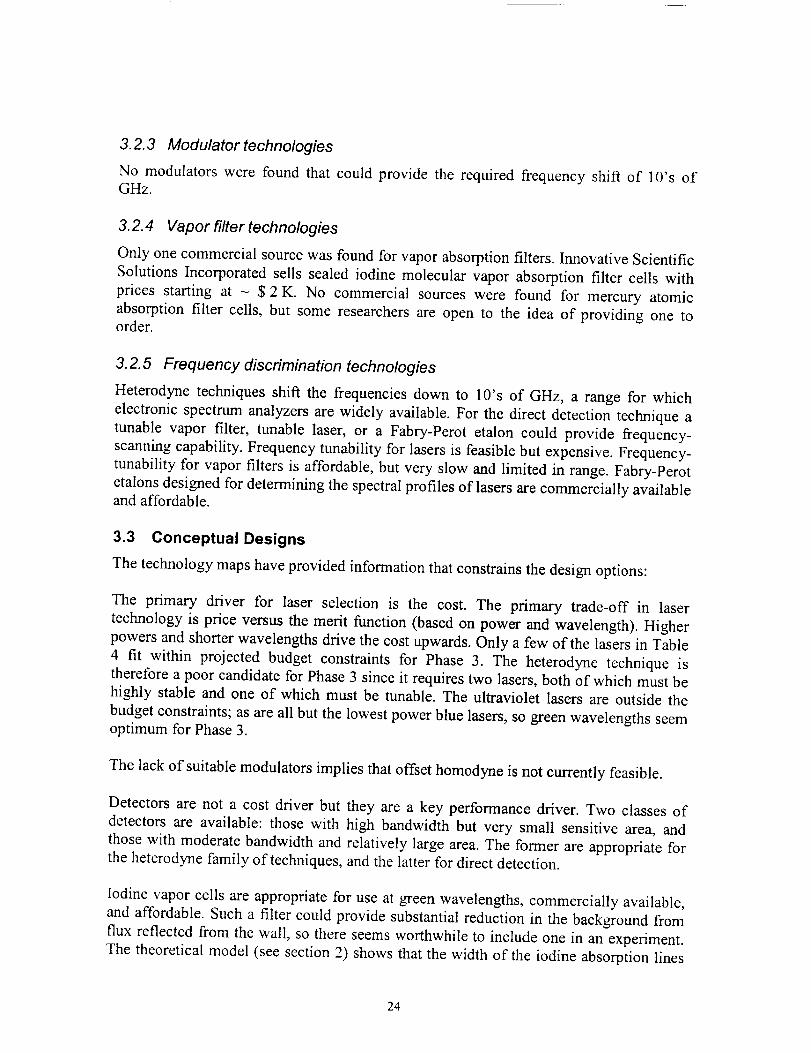
3.4 Predicted Signal-to-Noise Ratios
While the technology surveys constrained the feasible approaches, it was also necessary
to determine whether the SNR's are expected to be sufficient to be used to validate the
theoretical model and prove the principle of the Rayleigh Doppler technique. This section
present the results of four designs evaluated using the model developed in section 2.
Designs la and lb both use homodyne detection while designs 2 and 3 are based on
direct detection incorporating vapor absorption filters. Designs l a and 2 fit within the
budget constraints for Phase 3, while designs 1b and 3 illustrate what would be possible
in a future phase, employing currently available lasers. These results are summarized inTable 6:
25
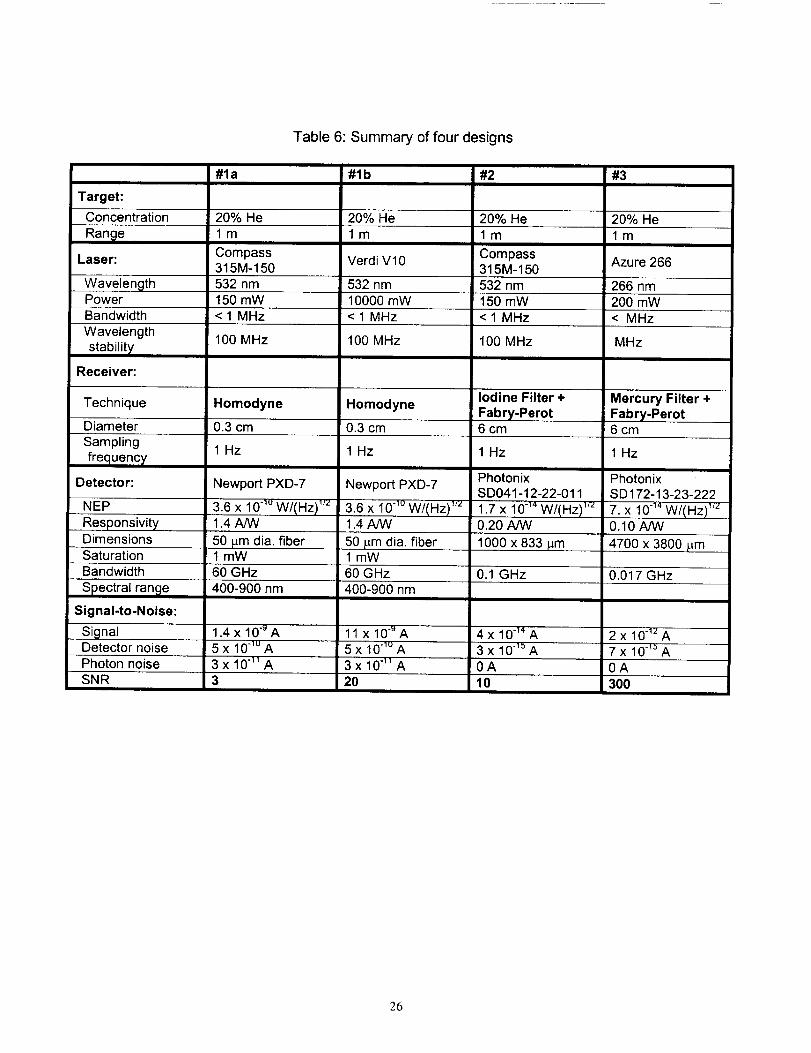
Table 6: Summary of four designs
Target:
Concentration
Range
Laser:
WavelengthPowerBandwidthWavelengthstability/
Receiver:
Technique
DiameterSamplingfrequency,
Detector:
NEP
ResponsivityDimensionsSaturationBandwidth
Spectral range
Signal-to-Noise:
SignalDetector noisePhoton noiseSNR
#1a
20% Helm
Compass315M-150532 nm150 mW<1 MHz
100 MHz
Homodyne
0.3 cm
1 Hz
Newport PXD-7
3.6 x 10"lu W/Hz) TM
1.4 A/W
50 p.m dia. fiber1 mW60 GHz400-900 nm
1.4 x 10"_A5 x 10-lu A3 x 10"1_A
#1b
20% Helm
Verdi V10
532 nm10000 mW< 1 MHz
100 MHz
Homodyne
0.3 cm
1 Hz
Newport PXD-7
3.6 x 10"lUW/(Hz) l'z1.4 ANV
50 p.mdia. fiber1 mW60 GHz400-900 nm
11 x 10-"A5 x 10"_UA3 x 10"1_A2O
#2
20% Helm
Compass315M-150532 nm150 mW< 1 MHz
100 MHz
Iodine Filter +
Fabry-Perot6 cm
1 Hz
PhotonixSD041-12-22-011
1.7 x 101" W/(Hz) TM
0.20 A/W
1000 x 833 p.m
0.1 GHz
4 x 10-14A3 x 10_= A0A10
#3
20% Helm
Azure 266
266 nm200 mW< MHz
MHz
Mercury Filter +Fabry-Perot6 cm
1 Hz
PhotonixSD172-13-23-222
7. x 10-14W/(Hz) l/z0.10 A/W
4700 x 3800 }_m
0.017 GHz
2x 10_z A7 x 10-1=A0A300
26

3.5 Experiment Design
Advancement of the Rayleigh Doppler technique from TRL 2 to TRL 3 requires a proof-
of-concept experiment. The objectives of this experiment would be to validate the
theoretical model and to demonstrate the principle of operation for this technique. As
shown in Table 6, the predicted SNR's are reasonable for both the homodyne and the
direct detection approaches. Since the cost of the detectors and iodine vapor cell are a
relatively small part of the budget, we recommend experimentation with both approaches.
It is important to note that the minimum detectable concentration for this technique is
limited by sensitivity, while all the other techniques for He are limited by clutter. The
other techniques all ultimately measure density, which is affected by temperature
variations. Therefore we expect that technological improvements in sensitivity will
improve the performance achievable with this technique, but will not improve the
performance of any other technique applicable to He.
In both experiments the plan is to vary the concentration of He in the test cell and
measure the signal. A beam dump may be used initially to minimize the background flux,
followed by backgrounds that are representative of the intended operational environment.
Other parameters such as the frequency range, FOV, local oscillator flux, etc., may bevaried in order to validate the theoretical model.
3.5.1 Homodyne experiment
The small area of the high-bandwidth detector required for the homodyne approach
severely limits the field-of-view (FOV) of the receiver. A monostatic configuration must
therefore be used to enable this narrow FOV to encompass the volume illuminated by the
laser. In a monostatic configuration, the transmitter and receiver use the same aperture.
Isolation of the transmitted flux from the receiver is achieved by the use of a quarter
wave plate and polarization beamsplitter. This configuration is illustrated in Figure 9 and
the required parts are listed in Table 7.
27

Waveplate \ Test Cell
Beamsplitter \ \ x,
Pick-off mirror _ \ "_ _----
, _ Combiner Attenuator\
Detector
Beam trap or target
m
jSpectrum analyzer
or low-pass filterand current meter
Figure 9: Homodyne experiment
28
3.5.2 Direct detection experiment
The large-area detectors available for the direct detection approach allow the use of a
bistatic configuration, in which the receiver aperture is separate from the transmitter
aperture. This allows the use of a relatively large receiver aperture. This configuration is
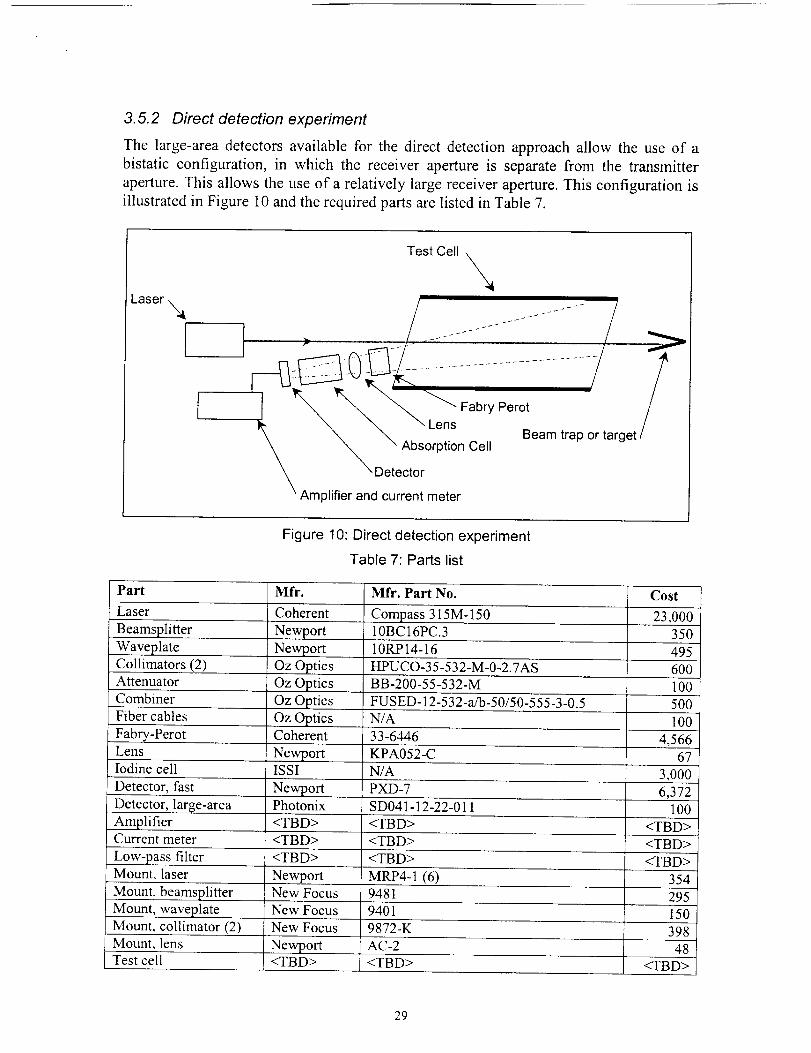
illustrated in Figure 10 and the required parts are listed in Table 7.
Test Cell
i/ /_ Absorption Cell Beam trap or target
__De_i meter
Figure 10: Direct detection experiment
Table 7: Parts list
Part
Laser
Beamsplitter
Waveplate
Collimators (2)Attenuator
Combiner
Fiber cables
Fabry-PerotLens
Iodine cell
Detector, fast
Detector, large-areaAmplifierCurrent meter
Low-pass filterMount, laser
Mount, beamsplitter
Mount, waveplate
Mount, collimator (2)Mount, lensTest cell
Mfr.
Coherent
Newport
Newport
Oz Optics
Oz Optics
Oz Optics
Oz OpticsCoherent
Mfr. Part No. Cost
Compass 315M- 150 23,00010BC16PC.3 350
10RP14-16 495HPUCO-35-532-M-0-2.7AS 600BB-200-55-532-M t00
FUSED- 12-532-a/b-50/50-555-3-0.5 500
N/A 100
33-6446 4,566Newport KPA052-C 67ISSI N/A
NewportPhotonix
<TBD>
<TBD>
<TBD>
PXD-7
SD041-12-22-011
<TBD>
<TBD>
<TBD>
MRP4-1 (6)NewportNew Focus 9481
New Focus 9401
New Focus 9872-K
AC-2
<TBD>Newport<TBD>
3,000
6,372100
<TBD>
<TBD>
<TBD>
354
295
150
398
48
<TBD>
29

4 IDENTIFY RESEARCHERS AND RESOURCES FOR FURTHER
ADVANCEMENT
4.1 Lidar and Rayleigh Scattering
4.1.1 Dr. Richard Seasholtz
Glenn Research Center
3O
4.1.2 Dr. Richard B. Miles
Professor of Mechanical and Aerospace Engineerinl_ (MAE), School of
Engineering and Applied Science (SEAS), Princeton University.
• Email address: miles(_,prineeton.edu
• Office phone: 609-258-5131
• Departmental fax phone: 609-258-1139
• Regular mail address:
D414 Engineering Quad,
Princeton University, Princeton, NJ 08544
Research Interests
Research interests include the development of new laser-based capabilities for
quantitative imaging of flow fields and combustion phenomena. Other research includes
laser-based diagnostics such as pollution monitoring and optical air data systems for
high-speed aircraft. This work involves the use of nonlinear optics and precision laser
spectroscopy together with the development of new laser sources. Some examples ofrecent work are:
• the development of a new capability for writing lines and patterns into air in
order to track air motion;
• imaging of time-evolving supersonic structure by Rayleigh scattering;
• measurement of high-speed velocity, temperature and density fields by Filtered
Rayleigh Scattering;
• two-photon, laser-induced fluorescence imaging of molecular hydrogen;
• the capability of writing lines and patterns into water.
• the possibility of using high power electron beams and lasers as drivers for
hypersonic ground test facilities.
• the use of plasmas for high speed air control and electromagnetic protection.
Curricula Vita
PROFESSIONAL BACKGROUND
1982- Professor, Dept. of Mechanical & Aerospace Engineering, Princeton University
1994-2000 Director of Graduate Studies, Dept. of Mechanical & Aerospace Eng.,
Princeton Univ.
1980-1996 Chairman, Engineering Physics Program, Princeton University
1978-1982 Associate Professor, Dept. of Mechanical & Aerospace Engineering,Princeton Univ.
1972-1978 Assistant
Princeton Univ.
Summer 1972 Research
University
Professor, Dept. of Mechanical & Aerospace Engineering,
Associate, Department of Electrical Engineering, Stanford
31
EDUCATION
1972 Ph.D.
1967 M.S.
1966 B.S.
Stanford University, Electrical Engineering
Stanford University, Electrical Engineering
Stanford University, Electrical Engineering
PROFESSIONAL SOCIETIES
American Institute of Aeronautics and Astronautics, Fellow
Optical Society of America, Fellow
Institute of Electrical and Electronic Engineers, Senior Member
American Physical Society, Member
PROFESSIONAL ACTIVITIES
Member, Board of Directors, Fannie & John Hertz Foundation
Executive Committee, Princeton Univ., Photonics & Opto-Electronics Center
Member, NASA New Millenium Interferometer Project Independent Assessment Team
Chairman, AIAA Aerodynamic Measurement Technology Technical Committee, '92-'94
Chairman, DoE Basic Energy Sciences Combustion Diagnostics Program Review, Oct.'92
Chairman, 1986 Gordon Conference on Vibrational Spectroscopy
Member, Board of Directors, Ice Cap, Inc., Hamilton, New Jersey
(212 Refereed Conference Manuscripts and Journal Articles; 5 U.S. Patents)
Invited Lectures (2000-200 I)
Mar 28, 2000 "MHD--Air Plasma Processes for Hypersonics," Briefing to the USAF
Scientific Advisory Board Study Team "Why and Whither Hypersonics Research in theUSAF," Arlington, VA.
Apr. 5-7, 2000"The MARIAH II Radiatively Heated/MHD-Driven Hypersonic Wind
Tunnel Concept," Second Workshop on Magneto and Plasma Aerodynamics for
Aerospace Applications, Institute Of High Temperatures, Russian Academy of Sciences,Moscow, Russia.
Apr. 19, 2000 "Review of Princeton Air Plasma Ramparts MURI Program," AFOSRMURI Project Review, Columbus, OH.
Jun 19-20, 2000 "Flow Control by Energy Addition into High-Speed Air," Fluids2000, Denver, CO.
July 18, 2000 "RDHWT/MARIAH II Program (An R&D Program for an Advanced
M=8-15 Hypersonic Wind Tunnel)," Briefing to DDR&E, Washington, DC.
Aug. 19, 2000 "MARIAH II--Solution, Technology Status, and Future Plans," Briefing toSenator Conrad Bums, Butte, MT.
Sept. 6-7, 2000 "Microwave-Driven Air Plasma Studies for Drag Reduction and
Power Extraction in Supersonic Air," AFOSR 2000 Contractors' Meeting in UnsteadyAerodynamics & Hypersonics, Monterey, CA.
32
Sept.19-222000 "La Methode RELIEF de Marquage des Ecoulementset sesApplicationsdansL'EtudedesPhenomenesdeTransportet deMelange,"Presentedatthe7thCongresFrancophonedeVelocimetrieLaser,Marseille,France(KeynoteSpeaker).
March8, 2001 "RDHWT/MARIAH II Program," The Ohio State University,Columbus,OH.
April27,2001 "Flow Field Diagnostics by Filtered Rayleigh and RamanScattering,"GeorgiaTech,Atlanta,Georgia.
June27,2001 "Novel Trends in Nonlinear Laser Spectroscopyand OpticalDiagnostics," XVII International Conference on Coherent and Nonlinear Optics(ICONO), Belarus Cultural Center, Minsk, Belarus, June 26-July 1, 2001 (InvitedKeynoteSpeaker).
July4,2001 "A Renaissancein Raman Imaging Using Dispersive andFluorescentAtomic Filers," 2001 GordonResearchConferenceon LaserDiagnosticsinCombustion,MountHolyokeCollege,SouthHadley,MA.
Publicationsin RefereedJournalsandReviewArticles (2001)
1. R.B. Miles, A. Yalin, Z. Tang, S. Zaidi, and J. Forkey, "Flow Field ImagingThrough Sharp-EdgedAtomic and Molecular Notch Filters," J. MeasurementScienceTechnologyVol. 12(2001)pp. 442-451.2. S.O. Macheret, M.N. Shneider, and R.B. Miles, "Modeling of DischargesGeneratedby ElectronBeamsin DenseGases: 'Fountain'and'Thunderstorm'Regimes,"Physicsof Plasmas,Vol. 8, May 2001,pp. 1518-1528.3. R.B. Miles, W. Lempert, and J. Forkey, "Laser Rayleigh Scattering," J. ofMeasurementScience& Technology,Vol. 12,(2001)R33-R51Invited (Publishedby theInstituteof PhysicsPublishing,Bristol, England).4. S.O. Macheret, M.N. Shneider, and R.B. Miles, "Electron Beam GeneratedPlasmasin HypersonicMagnetohydrodynamicChannels,"AIAA Journal,Vol. 39,No. 6,June2001,pp. 1127-1138.
PublishedConferenceProceedings(2001)
1. S. Zaide, Z. Tang, A. Yalin, P. Barker, and R. Miles, "Filtered ThomsonScatteringin an Argon Plasma," Paper #AIAA-2001-0415, 39th AIAA AerospaceSciencesMeeting& Exhibit, Reno,NV, Jan.8-11,2001.2. S.Macheret,M. Shneider,andR. Miles, "MHD Control of ExternalSupersonicFlow with ElectronBeamIonization," Paper#AIAA-2001-0492,39th AIAA AerospaceSciencesMeeting& Exhibit, Reno,NV, Jan.8-11,2001.3. P.Barker,A. Meschanov,andR. Miles, "TemperatureMeasurementsin PlasmasUsing CoherentRayleigh Scattering,"Paper#AIAA-2001-0416,39th AIAA AerospaceSciencesMeeting& Exhibit, Reno,NV, Jan.8-11,2001.4. S. Macheret,M. Shneider,and R. Miles, "Potential Performanceof SupersonicMHD Power Generators,"Paper#AIAA-2001-0795, 39th AIAA AerospaceSciencesMeeting& Exhibit, Reno,NV, Jan.8-11,2001.
33
5. R. Miles and P. Wu, "Three-DimensionalImaging of HypersonicFlow at MHzRate,"Paper #AIAA-2001-0846,39th AIAA AerospaceSciencesMeeting & Exhibit,Reno,NV, Jan.8-11,2001.6. V. Chiravalle,R. Miles, andE. Choueiri, "Numerical Simulationof MicrowaveSustainedSupersonicPlasmasfor Applicationto SpacePropulsion,"Paper#AIAA-2001-0962,39thAIAA AerospaceSciencesMeeting& Exhibit,Reno,NV, Jan.8-11,2001.7. I.G. Girgis, G.L. Brown, R.B. Miles, and R.J. Lipinski, "Fluid Mechanicsof aMach 7-12 ElectronBeamDriven, Missile-Scale,HypersonicWind Tunnel: Modelingand Predictions,"Paper#AIAA-2001-2777, 31stAIAA Fluid DynamicsConference&Exhibit,Anaheim,Ca,Junet 1-14,2001.8. S.O.Macheret,M.N. Shneider,and R.B.Miles, "Energy-EfficientGenerationofNonequilibrium Plasmasand their Applications to hypersonicMHD Systems,"PaperAIAA-2001-2880,32ndAIAA PlasmadynamicsandLasersConferenceand 4th WeaklyIonizedGasesWorkshop,Anaheim,CA, June11-14,2001.9. S.O.Macheret,M.N. Shneider,andR.B.Miles, "Modeling of PlasmaGenerationin RepetitiveUltra-short DC, Microwave, and Laser Pulses,"PaperAIAA-2001-2940,32nd AIAA Plasmadynamicsand LasersConferenceand 4th Weakly Ionized GasesWorkshop,Anaheim,CA, June11-14,2001.10. R.B. Miles, S.O.Macheret,L. Martinelli, R. Muray, M. Shneider,Yu.Z Ionikh, J.Koine andJ. Fox, "PlasmaControl of ShockWavesin Aerodynamicsand SonicBoomMitigation," Paper AIAA-2001-3062, AIAA Plasmadynamicsand LasersConferenceand4th WeaklyIonizedGasesWorkshop,Anaheim,CA, June11-14,2001.11. B. McAndrew, R. Murray, M. Shneider, R. Miles, J. Kline and J. Fox,"Comparisonof NumericalandExperimentalResultsfrom LocalizedMicrowave-DrivenPlasma Energy Addition into a Mach 3 Flow," Paper AIAA-2001-3061, AIAAPlasmadynamicsand Lasers Conferenceand 4th Weakly Ionized GasesWorkshop,Anaheim,CA, June11-14,2001.12. R.B.Miles, S.O.Macheret,andM.N. Shneider,"High Efficiency,NonequilibriumAir PlasmasSustainedby High EnergyElectrons,"Paper#869,PPPS-2001,ICOPS2001,LasVegas,NV, June17-22,2001.13. S.O.Macheret,M.N. Shneider,andR.B.Miles, "Dynamicsof PlasmasSustainedby RepetitiveUltrahigh VoltageDC or SubpicosecondLaserPulses,"Paper#766,PPPS-2001,ICOPS2001,LasVegas,NV, June17-22,2001.14. S. Zaidi, Z. Tang, and R.B. Miles, "Rubidium Filtered Thomson ScatteringMeasurementin anAtmosphericPressureArgon Arc," Paper#339,PPPS-2001,ICOPS2001,LasVegas,NV, June17-22,2001.15. X. Pan.L. Qian, M.N. Shneider,andR.B. Miles, "PlasmaMeasurementsUsingPonderomotiveForcesto Perturb the TranslationalMotion of Particles,"Paper#340,PPPS-2001,ICOPS2001,LasVegas,NV, June17-22,2001.16. M.N. Shneider,S.O. Macheret,and R.B. Miles, "Propertiesof Electron BeamGenerated,Steady-State,Weakly Ionized Plasmasin Air," Paper#682, PPPS-2001,ICOPS2001,LasVegas,NV, June17-22,2001.
34
4.1.3 Dr. Walter Lempert
Degrees
Senior Research Scientist
Mechanical and Aerospace Engineering Department
Phone:609-258-2875 1FAX:609-258-11391Email:
B.S. (Chemistry), Lehigh University, 1975
Ph.D. (Physical Chemistry), University of Utah, 1981
Research Interests
Studies of fundamental spectroscopic phenomena and development of associated optical
diagnostics. Laser development and nonlinear optics. Influence of collisional dynamics
on spectral lineshapes. Optical propulsion. Recent activities include: Stimulated Raman
scattering in oxygen and nitrogen; flow tagging velocimetry measurements in
compressible and incompressible flow; spectrally filtered Rayleigh scattering
velocimetry; development of pulse-burst Nd:YAG and robust injection-locking of
Ti:Sapphire; use of high-power lasers for optical propulsion.
Selected Publications
1. J.H. Grinstead, N.D. Finkelstein, and W.R. Lempert, "Doppler Velocimetry in a Supersonic Jet
Using Frequency-Modulated Filtered Light Scattering," Opt. Lett., Submitted, October 1996.
2. R.B. Miles and W.R. Lempert, "Quantitative Flow Visualization in Unseeded Flows," Annual
Review of Fluid Mechanics, (Invited), Submitted, May 1996.
3. A. Noullez, G. Wallace, W. Lempert, R.B. Miles, and U. Frisch, "Transverse Velocity Increments
in Turbulent Flow Using the RELIEF Technique," J. Fluid Mechanics, Submitted, May 1996.
4. W.R. Lempert, K. Magee, P. Ronney, K.R. Gee, and R.P. Haugland, "Flow Tagging Velocimetryin Incompressible Flow Using Photo-Activated Nonintrusive Tracking of Molecular Motion
(PHANTOMM)," Expts in Fluids, 18, pp. 249-257, 1995.
Principal Research Efforts
• The Radiatively-Driven hypersonic Wind Tunnel
• Flow tagging in air and water for fundamental studies of unsteady and turbulent flow
• Spectrally resolved scattering measurements using atomic and molecular vapor filters
• Development of high-power, pulse-burst laser sources for MHz rate imaging of high-speed
phenomena
• Development of high power, single frequency laser sources for quantitative imaging diagnostics
35
4.1.4 Dr. Dennis K. Killinger
Professor, Physics, University of South Florida
Telephone: (813) 974-3995
E-mail: [email protected]
Publications
P. Mamidipudi and D.K. Killinger, "Optimal Detector Selection for a 1.5-micron KTP
OPO Atmospheric Lidar," SPIE Aerospace Pub. 3707, Laser Radar Technology andApplications (1999).
"Manufacturing Process Controls for the Industries of the Future," NRC Panel on
Manufacturing Profcess Controls, Committee on Industrial Technology Assessments,National Academic Press (1998).
"Harnessing Light: Optical Science and Engineering in the 21 st Century," NationalAcademy Press (1998).
T. Taczak and D.K. Killinger, "Development of a tunable, narrow-linewidth CW 2.06-
micron Ho:YLF laser for remote sensing of atmospheric CO2 and H20," Applied Optics,37, 8460 (1998).
G.W. Hagen, R.B. Streeter, D.K. Killinger, W.E. Swartz, "Florida's Teeh Deployment
Offsets Defense Downturn," Forum for Applied Research and Policy, volume II, p.75(1996).
C. He and D.K. Killinger, "Dual-Polarization Modes and Self-Heterodyne Noise in a
Single-Frequency 2.1 um Microchip Ho, Tm:YAG Laser," Optics Letters, 19, 396(1994).
Y. Saito, K.P. Chan amd D.K. Killinger, "Development of an Eye-Safe LIDAR System
Using 2.1 um Ho Laser," The Review of Laser Engineering, 22, 197 (1994).
M. Vaidyanathan and D.K. Killinger, "Absorption Strenght and Pressure Broadened
Linewidth Measurements of the 1.73 um (2-0) Band of HC1 at High Temperatures," J.
Quant. Spect. and Radiative Transfer, 49, 659 (1993).
D.K. Killinger and R. Menzies, "Recent Advances in LIDAR/Laser AtmosphericSensing," IEEE LEOS Newsletter, 7, 18 (1993).
M. Vaidyanathan and D.K. Killinger, "Tunable 1.7 um Laser Spectrometer for Optical
Absorption Measurements of CH4, C2, H4 and High Temperature HCI," Applied Optics,32, 847 (1993).
36

4.1.5 Dr. David A Krueger
Professor, Department of Physics, Colorado State University
B.S., Montana State University, 1961
Ph.D., University of Washington, 1967
[email protected] (970) 491-7381
Research Interests
Lidar techniques have proven very versatile in the study of the space and time variation
of atmospheric properties such as wind speeds and concentrations of ozone, pollutants,
and aerosols. More recently interest has turned to developing techniques to measure air
temperatures and densities. The basic difficulty is in separating the effects of aerosols
from those of the air molecules. In our experiments shown schematically in the figure, a
pulse (10 nsec) of nearly monochromatic light (- 0.1 GHz ) is sent into the atmosphere,
and the spectrum of the scattered light is shown schematically as the heavy line. The light
scattered by the aerosols is slightly Doppler-broadened due to the relatively low speeds of
the aerosols (few m/sec) characteristic of the wind. The light scattered by the molecules
has a much larger Doppler-broadening ( - 2.7 GHz) due to the relatively high speeds of
the molecules ( - 500 m/sec). This Doppler-broadening is roughly proportional to the
square root of the air temperature. The method utilizes three signals. The first two signals
(shown in the figure) depend on the molecular scattering only and allows the
determination of the air temperature and the air density if the atmosphere is assumed to
be in hydrostatic equilibrium. This signal is obtained by using a band-stop vapor filter
which will block essentially all of the light scattered by the aerosols. A typical
transmission function is shown for an atomic vapor filter. Two slightly different vapor
filters are used in channels 1 and 2. The third signal depends on both the molecular
scattering and the aerosol scattering and is obtained by measurements without the filter.
Subtracting the molecular scattering from the third signal allows determination of the
aerosol scattering and thus properties such as aerosol density and shape distribution. In
addition to providing a useful tool to atmospheric science in general, these air
temperature and density profiles and the characterization of the aerosol properties are
important in the analysis of other experiments on the processes of ozone depletion in the
atmosphere.
37
4.1.6 Dr. Chiao-Yao (Joe) She
Research Interests
Professor, Colorado State University
B.S., Taiwan University, 1957
Ph.D., Stanford University, 1964
Fellow, Optical Society of America
(970) 491-626 i, [email protected]
The research interests of Prof. She have been broad and often interdisciplinary. Over the pastthirty years, he has been interested in the development of new laser techniques for specific
applications on basic as well as applied problems. These included photon-burst fluorescence
spectroscopy for single atom detection, coherent Raman spectroscopy for supersonic velocity and
temperature measurements, Raman studies of surfaces and thin films. In 1980's, he initiatedcoherent Rayleigh-Brillouin gain spectroscopy, and pioneered the development of two types of
narrowband lidars. Since the existing lidar technique for temperature measurements at the time
relies on Rayleigh scattering for measuring air-density profiles from which the atmospherictemperatures are calculated, this approach fails for altitudes below 20 km and above 80 km due,
respectively, to the interference of aerosol particles and to the lack of Rayleigh signal. His groupremedies these short-comings by inventing new lidar techniques. For altitudes below 20 km, he
uses a narrowband laser and a narrowband atomic vapor filter to separate molecular scatteringfrom aerosol scattering so that air temperatures can be measured directly. For altitudes above 80km, he uses a narrowband tunable laser to induce fluorescence emission of natural Na atoms
existed in the mesopause region (between 80 to 110 kin, a region too high for airplane andballoon and too low for satellite) for temperature measurements. Both systems are now capable of
making atmospheric measurements. The narrowband Rayleigh-Mie lidar recently has providedthe first simultaneously measured tropospheric temperature and aerosol extinction coefficient
profiles at the popular doubled-YAG laser wavelength (532 nm). The Na temperature lidar based
on a narrow-band dye laser system is being reproduced by other research groups. In addition, hehas conceived and developed a single frequency coherent source at 589 nm based on sum-
frequency generation, along with Na vapor Faraday filter, and acoustooptic frequency shifterpermitting Na wind and daytime measurements.
Professor She's technical inventions have led to decade-long observation of the mesopause regionin Fort Collins, Colorado which not only confirmed and detailed the predicted bizarre thermal
structure with cold summer and warm winter, but also led to unexpected discoveries, linking
climate change in this region to the Mt. Pinatubo eruption and solar flux variations, providing the
first direct experimental evidence for the fact that different atmospheric layers and planetary
space environment are strongly coupled as an integrated climatic system. To gain a basicunderstanding of this unique thermal structure, measurements of temperatures and winds, as well
energy and momentum fluxes should be made from space as well as from the important polarregion. For these reasons, Prof. She's lidar group has begun collaborative ground-based
measurements in support of the TIMED (Thermosphere, Ionosphere, Mesosphere andElectrodynamics) satellite to be launched by NASA in 2001, and the deployment of a state-of-
the-art Sodium lidar in ALOMAR (Arctic Lidar Observatory for Middle Atmospheric Research),
Norway based on the Na fluorescence technology developed at Colorado State over the years
with NSF support. In the latter case, the unique Faraday filter capable of rejecting sky lightbackground is a must for observation in sunlit Arctic summer.
38
4.2 Sonar
4.2.1 Dr. Stanley E. Dunn
Professor
Department of Ocean En_ineerin_Florida Atlantic University
Boca Raton, FL 33431
Boca Raton Campus: (561)297-3437
SeaTech Campus: (954)924-7265
Fax: (561)297-3885E-mail: dunn_oe.fau.edu
EDUCATION
• Ph.D. - M.E., North Carolina State University, 1970.
• B.S. - M.E., North Carolina State University, 1965.
RELATED EXPERIENCE
• 1988-1990: Acting Dean, College of Engineering, Florida Atlantic University,
• Chairman, NSF Joint USAJK Program in Ocean Engineering - Underwater Vehicles.
• NSF-NOAA Oceans 2000 Workshop - 1992.
• NSF Workshop on Science Applications for AUV's - 1991.
• NSF Workshop on AUV Technology Advancement - 1992.
• NOAA Committee in AI Technology for Sea Grant Program.
• Editor, 1992 Symposium on Autonomous Underwater Vehicle Technology.• Reviewer for National Science Foundation (OEID), National Sea Grant Program,
• Transportation Research Board, ABET, UNH UUV Symposium.
• 1992 USJNR Organizer and Coordinator for South Florida (FAU).• Board of Directors, 3rd International Submarine Races -June 1993.
• National Ocean Resource Technology Development Committee.
• Co-Chairman, USAJK Workshop on Ocean Technology - March 1994.
• NSF US/Taiwan Workshop on Ocean Resources - 1995.
• DOD Laboratory Infrastructure Capabilities Study, Ships, Submarines, and Watercraft,
• Phase I & II, Co-Chair - 1994-1995.
• Naval Surface Ship Technology Program, HM&E Integration Workshop- 1996.
•IOS Sensors and Platforms Review Group - 1996.
• National Research Council Naval Studies Board Panel, Technology for Future NavalForces- 1996.
• NSF Russia-US Workshop on Oceans and Oceans/Atmosphere - 1996.
• Engineering Accreditation Commission - 1996-97.
Consulting:
• FHWA, U.S. Navy, USEPA and a variety of other governmental and private parties.
HONORS AND AWARDS
• College Nominations for University Teacher of the Year - 1986.
• Engineer of the Year Award/Palm Beach County FES - 1990.
• Fellow, Florida Engineering Society - 1990.
39
RECENT PUBLICATIONS
Principal Publications of Last Five Years: 22 publications, of which the following aremost recent:
• "Ocean Engineering Systems for Ocean Resources in Deep Sea Water",US/Taiwan Workshop, Taipei, Taiwan, 1995.
"The Ocean Explorer AUV: A Modular Platform for Coastal Sensor
Development", with S. Smith, Autonomous Vehicles in Marine Countermeasure
Symposium, Naval Postgraduate School, Monterey, CA, April 4-7, 1995.
"Integrated Sensor of UUV Technologies for Coastal Ocean Application", with
S. Smith, P. Betzer and T. Hopkins, COSU'95, Yokohama, Japan, May 1995.
"Ocean Engineering at Florida Atlantic University: A Program Expanding to
Meet New Challenges", with S. Smith, MTS Journal, Vol. 26, No. 1, pp. 7-13,Spring 1992.
"Intelligent Systems Design in Ocean Engineering", with S. Smith and P.
Ananthakrishnan, Proceedings of 1995 ASEE Annual Conference, Anaheim, CA,June 1995, pp. 2840-2846.
"A Quantitative Measure of Sea-State Effect on Small Autonomous Underwater
Vehicle Motion in Shallow Water", P.E. An, G. Leavitt, S. Smith, and S. Dunn,Oceanology Int. 96, pp. 211-233, Brighton, UK, March 1996.
• "Data Collection with Multiple AUVs for Coastal Oceanography", S. Smith, S.Dunn, and E. An, Oceanology Int. 96, pp. 263-279, Brighton, UK, March 1996.
• "Multi-Sensor Data Fusion for AUV Navigation in Shallow Water", P. E. An, A.Healey, S. Smith, and S. Dunn, IEEE AUV '96, Monterey, CA, June 1996.
• "Strategies for Simultaneous Multiple AUV Operation and Control", S. Smith, K.Ganesan, S. Dunn, and P. An, IARP 96, France, 1996.
"Development of Autonomous Underwater Vehicles Based Survey and SamplingCapabilities for Coastal Exploration", with S. Smith, K. Ganesan, and E. An,Oceans '96 MTS/IEEE, 23-26 September 1996, Ft. Lauderdale, FL.
• Book Chapter: "Design of AUVs for Coastal Oceanography", with S. Smith, P.Betzer, T. Hopkins, Chapter 12, Underwater Robotic Vehicles, J. Yuh, Ed., TSIPress, pp. 299-326, 1995.
SCIENTIFIC AND PROFESSIONAL SOCIETIES
• American Society of Electrical Engineers (ASEE)
• Acoustical SocietyofAmerica (ASA)
• Institute of Noise Control Engineering (INCE)
• Society of Naval Architects and Marine Engineers (SNAME)
• American Society of Mechanical Engineers (ASME)
• Institute of Electrical and Electronic Engineers (IEEE)
40

4.3
4.3.1
4.3.2
4.3.3
4.3.4
4.3.5
Raman
NASA JSC
NASA GRC (W. A. de Groot)
NASA Stennis
NASA MSFC (W. T. Powers)
Dr. Michael D. Hampton
Associate Professor, Department of Chemistry, University of Central Florida
Education:
Ph.D. Analytical Chemistry, Texas Tech University, 1980
B.S. Chemistry, University of Florida, 1975
Research Interests:
Hydrogen storage systems, ion selective electrodes, piezoelectric oscillators as chemical
oscillators, materials (inorganic).
Selected Publications:
Michael D. Hampton and Janice K. Lomness, "Water Activation of Mg2Ni for Hydrogen
Uptake", International Journal of Hydrogen Energy, (submitted Sept. 5,1997) accepted
Jan., 1998, in press.
Michael P. McCann and Michael D. Hampton, Detection of Molecular Hydrogen by
Stimulated Raman Emission, Applied Spectroscopy, 48(4), 537 (1994).
B. J. Lockhart, M. D. Hampton, C. J. Bryan, Symposium on Flammability and Sensitivity
of Materials in Oxygen-Enriched Atmospheres: Fourth Volume, ASTM STP 1040, J. M.
Stoltzfus, F. J. Benz, and J S. Stradling Ed., American Society for Testing and Materials,
Philadelphia, PA, 1989.
M. D. Hampton, W. Rees, S. Hall, and J. L. Mills, "Trimethyl Borane." Inorganic
Syntheses, 29, (1989).
M.D. Hampton, C.A. Peters, and L. Wellington, "Response of Poly(Vinyl Chloride)
Electrodes Based on the Neutral Carrier 1,4,7,10-Tetraoxacyclododecane", Analytica
Chimica Acta, 194, 171(1987).
Contact:
Phone: (407) 823-2136
E-mail: mhampton_,ucflvm,cc.ucf.edu
41
4.3.6 Myung K. Kim
Associate Professor, Department of Physics, University of South Florida
Areas of Expertise
• digital holography; holographic microscopy
• nonlinear optics; coherent optical transient phenomena; photon echo; laser
spectroscopy; quantum interference in atomic systems
• applications of photon echo in optical memory and optical processing; associativeoptical memory; pattern recognition
Education
• Ph.D. in Physics, Jun. 1986, University of California, Berkeley, CA
• B.S. in Physics and Mathematics, May 1979, Cure Laude, University ofCalifornia, Los Angeles, CA
Employment History
• Associate Professor, Aug. 1995 - present, Dept. of Physics, University of SouthFlorida, Tampa, FL
• Assistant Professor, Aug. 1988 - May, 1995, Dept. of Physics and Astronomy,Wayne State University, Detroit, MI
• Postdoctoral Fellow, Jan. 1986 - Aug. 1988, Chemical Physics Laboratory, SRIInternational, Menlo Park, CA
Refereed Journal Publications
• C.A. Cattel, M.K. Kim, R.P. Lin, and F.S. Moser, "Observations of large electric
fields near the plasmasheet boundary by ISEE-I", Geophys. Res. Lett. 9, 539(1982).
• M.K. Kim and R. Kachru, "Long-term image storage and phase conjugation by a
backward-stimulated echo in Pr3+:LaFY', J. Opt. Soc. Am. B 4, 305 (1987).
• M.K. Kim and R. Kachru, "Storage and phase conjugation of multiple images
using backward-stimulated echo in Pr3+:LaF3", Opt. Lett. 12, 593 (1987).
• M. Mitsunaga, M.K. Kim, and R. Kachru, "Degenerate photon echoes:
simultaneous storage of multiple optical data", Opt. Lett. 13,536 (1988).
• M.K. Kim and R. Kachru, "Multiple-bit long-term data storage by backward
stimulated echo in Eu3+:YA10Y', Opt. Lett. 14, 423 (1989).
• M.K. Kim and R. Kachru, "Many-bit optical data storage by backward stimulated
echo", Appl. Opt. 28, 2186 (1989).
• M.K. Kim and R. Kachru, "Hyperfine measurements of 1D2 - 3H4 transition in
Pr3+:YAG using photon echo", Phys. Rev. B 40, 2082 (1989).
• M. Mitsunaga, R. Kachru, E. Xu, and M.K. Kim, "cw photon echo", Phys. Rev.Lett 63,754 (1989).
• E.Y. Xu, S. Kr611, D.L. Heustis, R. Kachru, and M.K. Kim, "Nanosecond image
processing using stimulated photon echoes", Opt. Lett. 15, 562 (1990).
• S. Kr611, E.Y. Xu, M.K. Kim, M. Mitsunaga and R. Kachru, "Intensity-dependent
photon echo relaxation in Pr3+:YAG", Phys. Rev. B 41, 11568 (1990).
42

M.K. Kim and R. Kachru, "Hyperfine structures of praseodymium ions in solids
using stimulated photon echo modulation", Phys. Rev. B 44, 9826 (1991).
D. Manganaris, P. Talagala and M. K. Kim, "Spatial mixed binary multiplication
by photon echoes", Appl. Opt. 31, 2426 (1992).
R.A. Breitenbach, P.K. Swisher, M.K. Kim, and B. S. Patel, "The photic sneeze
reflex as a risk factor to combat pilots", Military Medicine 158, 806 (1993).
Y. Zhao, C. Wu, P. Shah, M.K. Kim, and L.R. Dawson, "Experimental
observation of optical phase conjugation in InGaAs/GaAs multiple quantum wells
at 1.06 gm wavelength", Appl. Phys. Lett. 63,281 (1993).
P.R. Hemmer, S.M. Shahriar, M.K. Kim, K.Z. Cheng, and J. Kierstead, "Time
domain optical data storage using Raman coherent population trapping", Opt.
Lett. 19, 296 (1994).
B.S. Ham and M.K. Kim, "Photon-echo amplification by an external-cavity
amplifier", Appl. Opt. 33, 4472 (1994).
P. Talagala, S.H. Ling, and M.K. Kim, "Photon echoes using broadband cw
laser", J. Mod. Opt. 43, 253 (1996).
P.R. Hemmer, M.S. Shahriar, B.S. Ham, M.K. Kim, and Yu. Rozhdestvensky,
"Optical spectral holebuming with Raman coherent population trapping",
Molecular Crystals and Liquid Crystals 291,287 (1996).
Y. Zhao, C. Wu, B.S. Ham, M.K. Kim, and E. Awad, "Microwave induced
transparency in ruby", Phys. Rev. Lett. 79, 641 (1997).
B.S. Ham, M.S. Shahriar, M.K. Kim, and P.R. Hemmer, "Frequency-selective
time-domain optical data storage by electromagnetically induced transparency in
a rare-earth doped solid", Opt. Lett. 22, 1849 (1997).
H. Sonajalg and M.K. Kim, "Perturbation analysis of Raman echo", J. Opt. Soc.Am. B 15, 1780 (1998).
B. S. Ham, M. S. Shahriar, M. K. Kim, and P. R. Hemmer, "Spin coherence
excitation and rephasing with optically shelved atoms", Phys. Rev. B 58, R11825-
R11828 (1998).
B.S. Ham, P.R. Hemmer, M.K. Kim, and S.M. Shahriar, "Quantum interference
and its potential applications in a spectral hole-bumign solid", Laser Physics 9,(3) (1999).
M.K. Kim, "Wavelength scanning digital interference holography for optical
section imaging", Opt. Lett. 24, 1693 (1999)
M.K. Kim, B.S. Ham, P.R. Hemmer, and M.S. Shahriar, "Observation of sub-
kilohertz resonance in rf-optical double resonance experiment in rare earth inos in
solids", J. Mod. Opt. 47, 1713-1728 (2000)
43
4.4 Schlieren
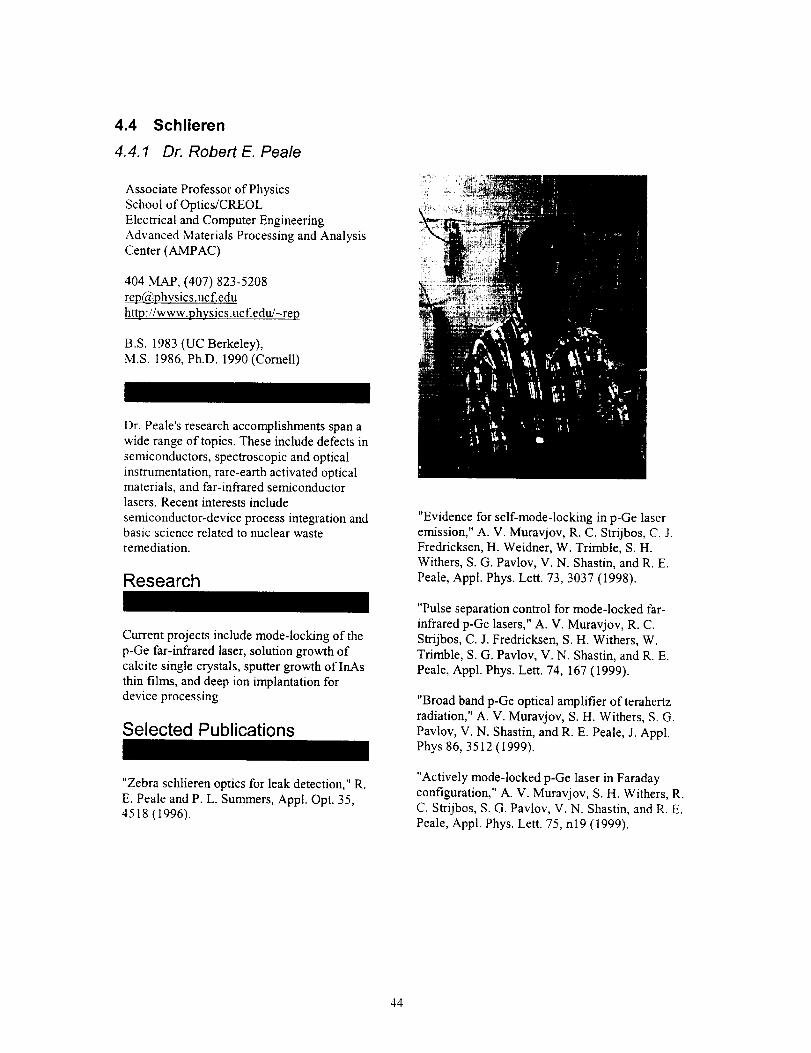
4.4.1 Dr. Robert E. Peale
Associate Professor of Physics
School of Optics/CREOLElectrical and Computer Engineering
Advanced Materials Processing and AnalysisCenter (AMPAC)
404 MAP, (407) [email protected] f.edu
http://www.phTsic s.uc f.edtv'-rep
B.S. 1983 (UC Berkeley),
M.S. 1986, Ph.D. 1990 (Cornell)
Dr. Peale's research accomplishments span awide range of topics. These include defects in
semiconductors, spectroscopic and optical
instrumentation, rare-earth activated opticalmaterials, and far-infrared semiconductorlasers. Recent interests include
semiconductor-device process integration andbasic science related to nuclear wasteremediation.
Research
Current projects include mode-locking of thep-Ge far-infrared laser, solution growth of
calcite single crystals, sputter growth of InAsthin films, and deep ion implantation fordevice processing.
Selected Publications
"Zebra schlieren optics for leak detection," R.
E. Peale and P. L. Summers, Appl. Opt. 35,4518 (1996).
"Evidence for self-mode-locking in p-Ge laseremission," A. V. Muravjov, R. C. Strijbos, C. J.Fredricksen, H. Weidner, W. Trimble, S. H.Withers, S. G. Pavlov, V. N. Shastin, and R. E.
Peale, Appl. Phys. Let/. 73, 3037 (1998).
"Pulse separation control for mode-locked far-
infrared p-Ge lasers," A. V. Muravjov, R. C.
Strijbos, C. J. Fredricksen, S. H. Withers, W.Trimble, S. G. Pavlov, V. N. Shastin, and R. E.
Peale, Appl. Phys. Let/. 74, 167 (1999).
"Broad band p-Ge optical amplifier of terahertzradiation," A. V. Muravjov, S. H. Withers, S. G.
Pavlov, V. N. Shastin, and R. E. Peale, J. Appl.Phys 86, 3512 (1999).
"Actively mode-locked p-Ge laser in Faradayconfiguration," A. V. Muravjov, S. H. Withers, R.C. Strijbos, S. G. Pavlov, V. N. Shastin, and R. E.
Peale, Appl. Phys. Lett. 75, n19 (1999).
44
4.4.2 Dr. De Von W. Griffin
NASA GRC
Fourier Transform Infrared
Thomas J. Kulp
Sandia National Laborarories, Combustion Research Facility
Phone: (925) 294-3676
Email: [email protected]
Fax: (925) 294-2595
Mail Stop: 9056
45

5 EXTEND DIFFUSION MODEL
5.1 Basic Model
In order to evaluate the various technologies for leak location, it is desirable to have a
model (or map) of concentration of H2 or He as a function of leak rate, distance from the
leak, and time since the leak initiated. For the case of a leak into an open area, diffusion
follows Fick's first law, expressed in one dimension as:
where, Jx refers to the molar flux in the x-direction in mol m 2 s q, C is the molar
concentration in tool m 3 and, D is the diffusion coefficient or diffusivity in m 2 sl. In
three dimensions in polar coordinates, this leads to the differential equation:
OC(r,t)
Ot
1 O OC(r,
= DT_r(r2 Or t).)
where r is the radius from the leak, and t is the time since initiation of the leak. With
appropriate boundary conditions:
C(r,t)=O for t<0
C(r,O) = 6(r)
C(oo, t) = 0
where 6 is the Kronecker delta function, the solution 4 is:
qb efrc [ rC(r,t)- 4zcDr _]
where _ is the leak rate in molls, and erfc is the complimentary error functionS:
2
erfc(x) = -_ ._ e-¢2d¢
An interactive version of this model has been provided in the form ofa MatkCADworksheet.
For the steady state case t--+ oo and the concentration reduces to:
46
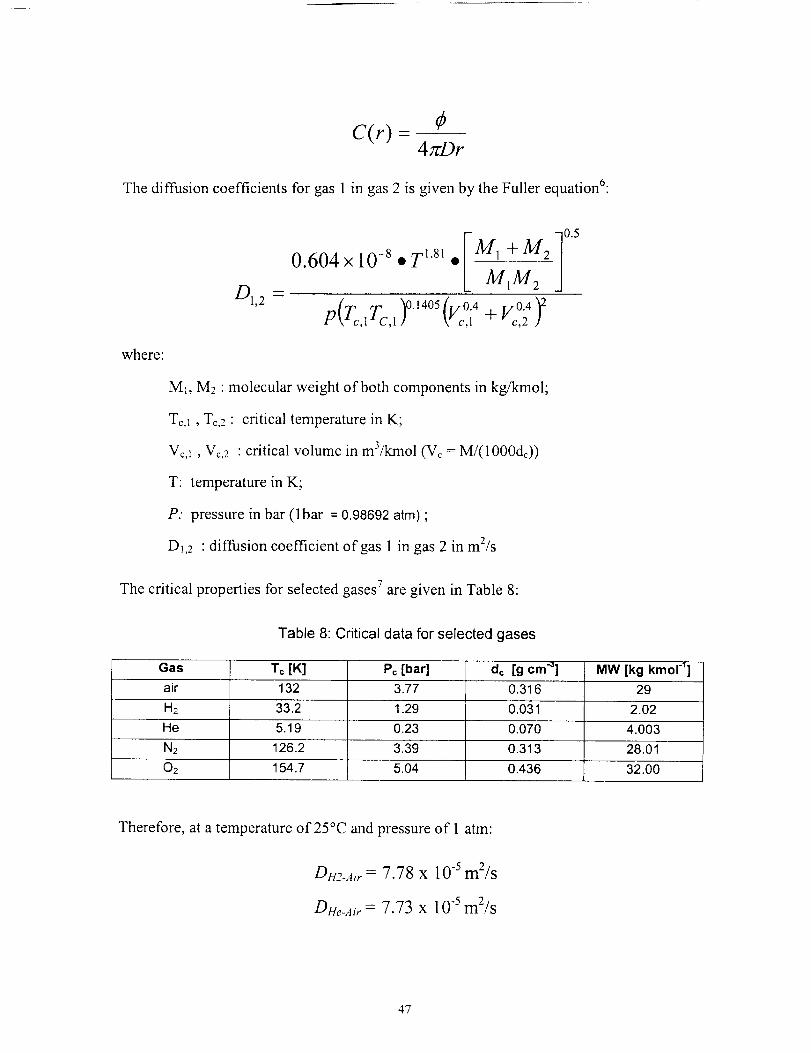
c(,') =4 7cDr
The diffusion coefficients for gas 1 in gas 2 is given by the Fuller equation6:
where:
E 10.50.604 x 10 -s • T lsl • M1 + M2
M1M2
p(rc,,r, v°4 C,1] X, c,1 "+" c,2 ]
M1, M2 : molecular weight of both components in kg/kmol;
Tc,1, To,2 : critical temperature in K;
Vca , Vc,2 : critical volume in m3/kmol (Vc = M/(1000dc))
T: temperature in K;
P: pressure in bar (lbar = 0.98692 arm) ;
D1,2 : diffusion coefficient of gas 1 in gas 2 in mZ/s
The critical properties for selected gases 7 are given in Table 8:
Table 8: Critical data for selected gases
Gas Tc [K] Pc [bar] dc [g cm "_] MW [kg kmol "_]
air 132 3.77 0.316 29
H2 33.2 1.29 0.031 2.02
He 5.19 0.23 0.070 4.003
N2 126.2 3.39 0.313 28.01
02 154.7 5.04 0.436 32.00
Therefore, at a temperature of 25°C and pressure of 1 atm:
D_r_-A,,-= 7.78 x 10 5 mZ/s
DEe-Air= 7.73 X 10-Sm2/s
47
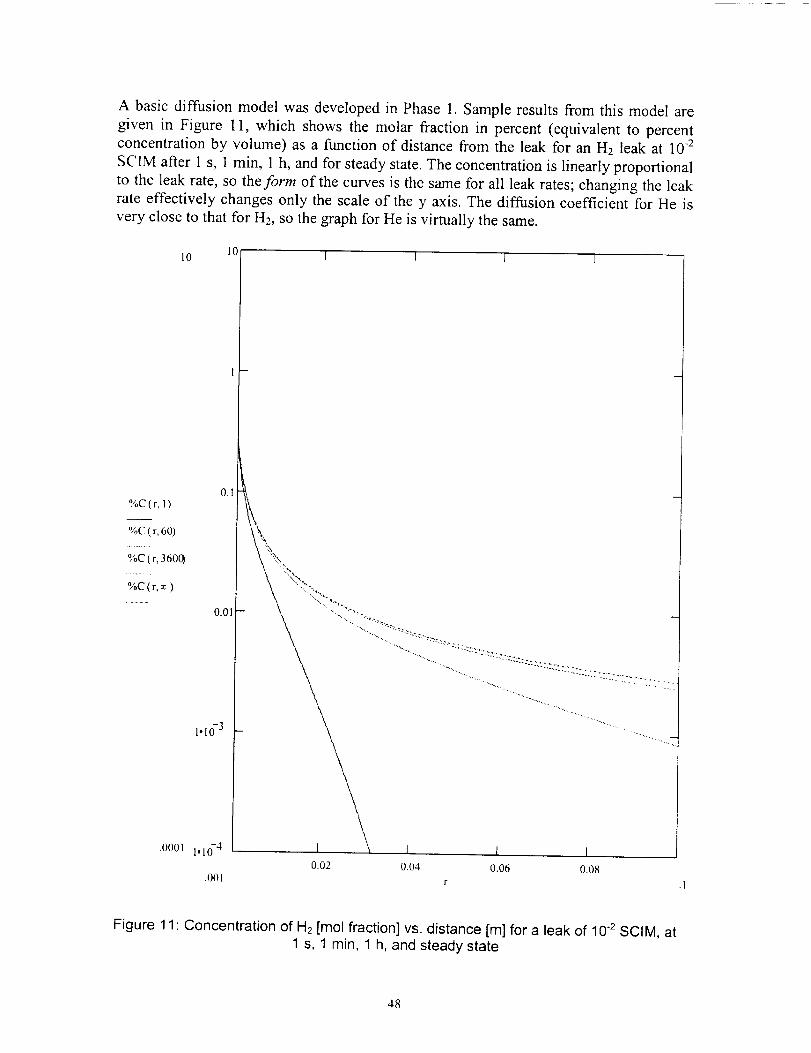
A basic diffusion model was developed in Phase 1. Sample results from this model are
given in Figure 11, which shows the molar fraction in percent (equivalent to percent
concentration by volume) as a function of distance from the leak for an H2 leak at 10 -2
SCIM after 1 s, 1 rain, 1 h, and for steady state. The concentration is linearly proportional
to the leak rate, so the form of the curves is the same for all leak rates; changing the leakrate effectively changes only the scale of the y axis. The diffusion coefficient for He is
very close to that for H2, so the graph for He is virtually the same.
1010
I -
I I 1 [
%C(r, 1)
%C (r, 60)
%C (r, 360C_
%C(r,_)
0.01
1.10-3
.0001 i.10-4 1 I I I0.02 0.04 0.06 0.08
.001 r
Figure 11 Concentration of H2 [mol fraction] vs. distance [m] for a leak of 10.2 SCIM, at1 s, 1 min, 1 h, and steady state
48
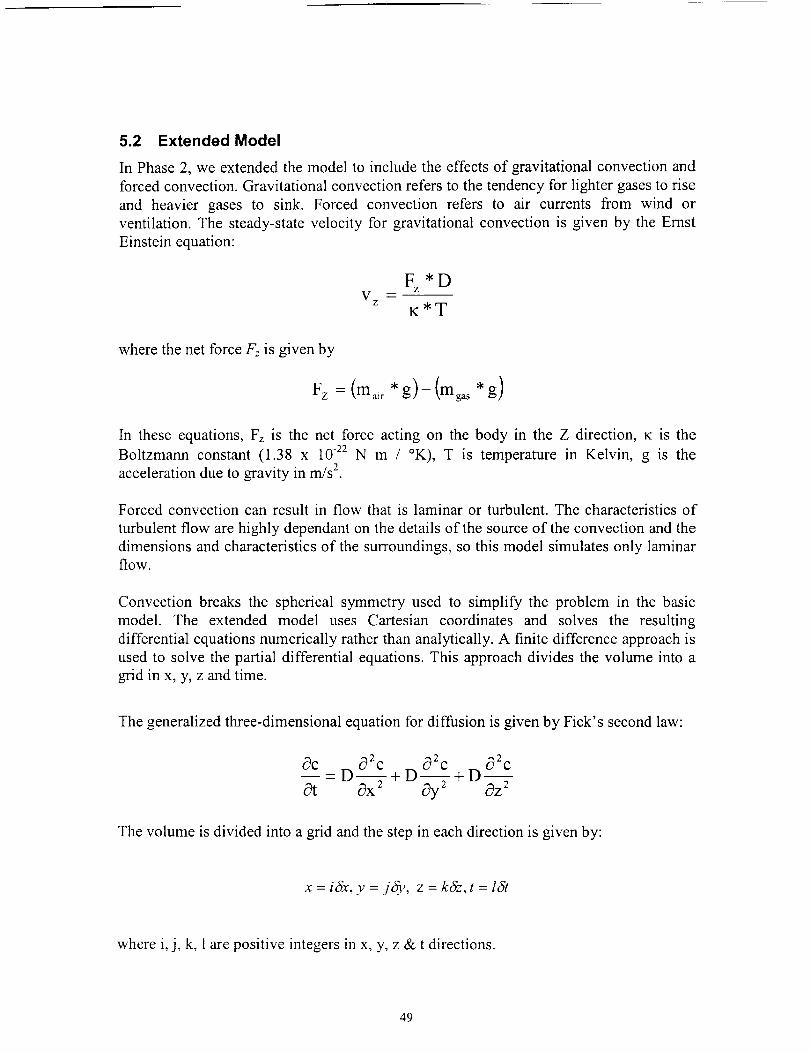
5.2 Extended Model
In Phase 2, we extended the model to include the effects of gravitational convection and
forced convection. Gravitational convection refers to the tendency for lighter gases to rise
and heavier gases to sink. Forced convection refers to air currents from wind or
ventilation. The steady-state velocity for gravitational convection is given by the Ernst
Einstein equation:
Fz *DV Z _ --
K*T
where the net force F= is given by
Fz = (mair *g)--(mga s *g)
In these equations, Fz is the net force acting on the body in the Z direction, K is the
Boltzmann constant (1.38 x 10 .22 N m / °K), T is temperature in Kelvin, g is the
acceleration due to gravity in m/s 2.
Forced convection can result in flow that is laminar or turbulent. The characteristics of
turbulent flow are highly dependant on the details of the source of the convection and the
dimensions and characteristics of the surroundings, so this model simulates only laminarflow.
Convection breaks the spherical symmetry used to simplify the problem in the basic
model. The extended model uses Cartesian coordinates and solves the resulting
differential equations numerically rather than analytically. A finite difference approach is
used to solve the partial differential equations. This approach divides the volume into a
grid in x, y, z and time.
The generalized three-dimensional equation for diffusion is given by Fick's second law:
8c _ D 82c-- D 82G 02G- + +D--Ot Ox 2 _ 8z:
The volume is divided into a grid and the step in each direction is given by:
x = ic_x, y = j&_, z = kfz, t = l&
where i, j, k, 1 are positive integers in x, y, z & t directions.
49
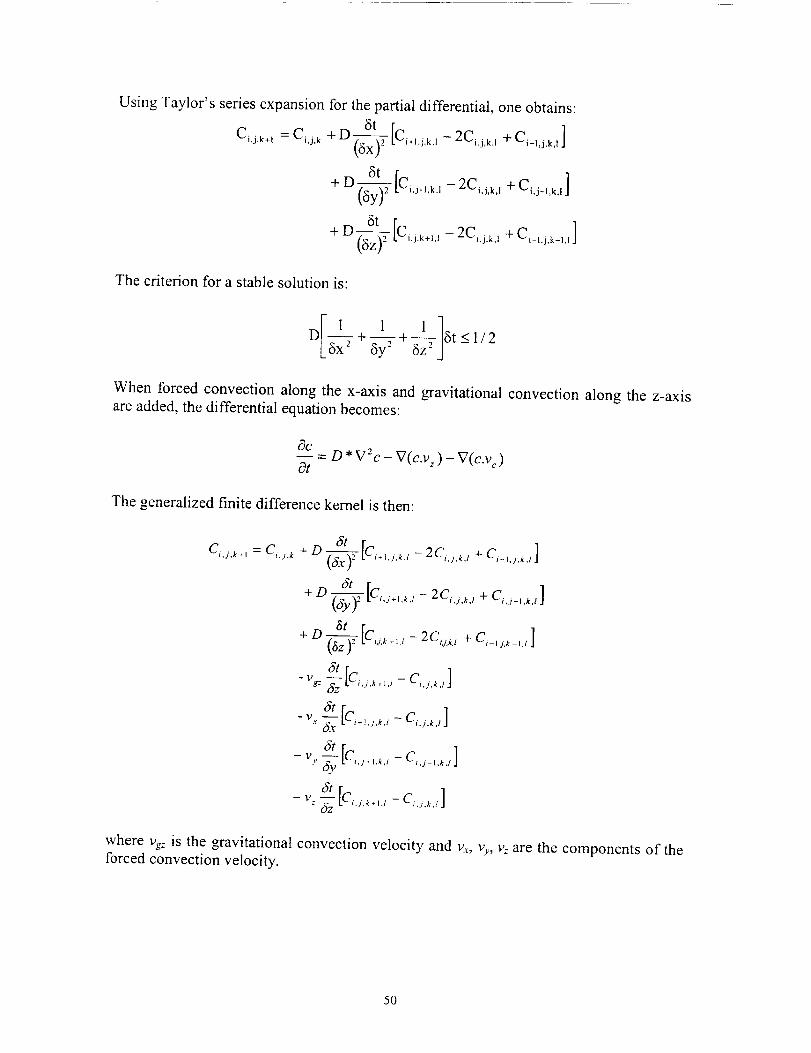
Using Taylor's series expansion for the partial differential, one obtains:
Cij.k+l = Ci.j, k + D i+l.j.k,l -- 2Ci,j.kj + Ci_l,j,kj ]
6t
+ D _-y-_-[Ci.j+l.k,l- 2C,.j,k.I + C,j_l,k., ]
+D 8t-(_[C,,j,k+,.,- 2C,,j,k,, + Ci_,,j.k_,.,]
The criterion for a stable solution is:
D +--_-+ 6t<1/2
When forced convection along the x-axis and gravitational convection along the z-axisare added, the differential equation becomes:
c_c
-- = D * VZc - V(c.v ) - V(c.v c)Ot
The generalized finite difference kernel is then:
D 6t [cC'4.k+' = C,.J.k + (8x)2 t ,+,.j.k., - 2Ci.j._., + C,_,4._., ]
+D 6t [C_-_2-t i.j+,,k.t--2Ci.j,kj +Ci,j_,.kd ]
3t
+ D _z-z-z_[Cu.k.,., - 2Cu.k., + C,_,s.k_,.,]
6t-v,,Tzz[c,j,.,,-
'_t[C-v,_ ,.,.l.,.,-c,_.,.,]
5t _ Ci.j__.,j ]-v,,v[Ci.;...,,,
_fc
where Vg- is the gravitational convection velocity and v,., Vy, v: are the components of theforced convection velocity.
50
6 REFERENCE CITATIONS
1 Robert Youngquist, private communication.
2 R. M. Measures, Laser Remote Sensing Fundamentals and Applications, pp.98-99,
Wiley- Interscience, New York (1984).
3 D.R. Lide, ed., Handbook of Chemistry and Physics, 71st ed., p. 14-19, CRC Press
(1991)
4 H.S.Carslaw and J.C. Jaeger, Conduction of Heat in Solids, 2 na ed., p. 261, Oxford
(1959).
5 j. Crank, The Mathematics Of Diffusion, p. 19 & Table 2.1, Oxford (1964).
6 http://chemengineer.about.com/science/chemengineer/library/weekly/aa072197.htm
7 H.W. Liepmann and A. Roshko, Elements of Gasdynamics, John Wiley & Sons (1957).
51
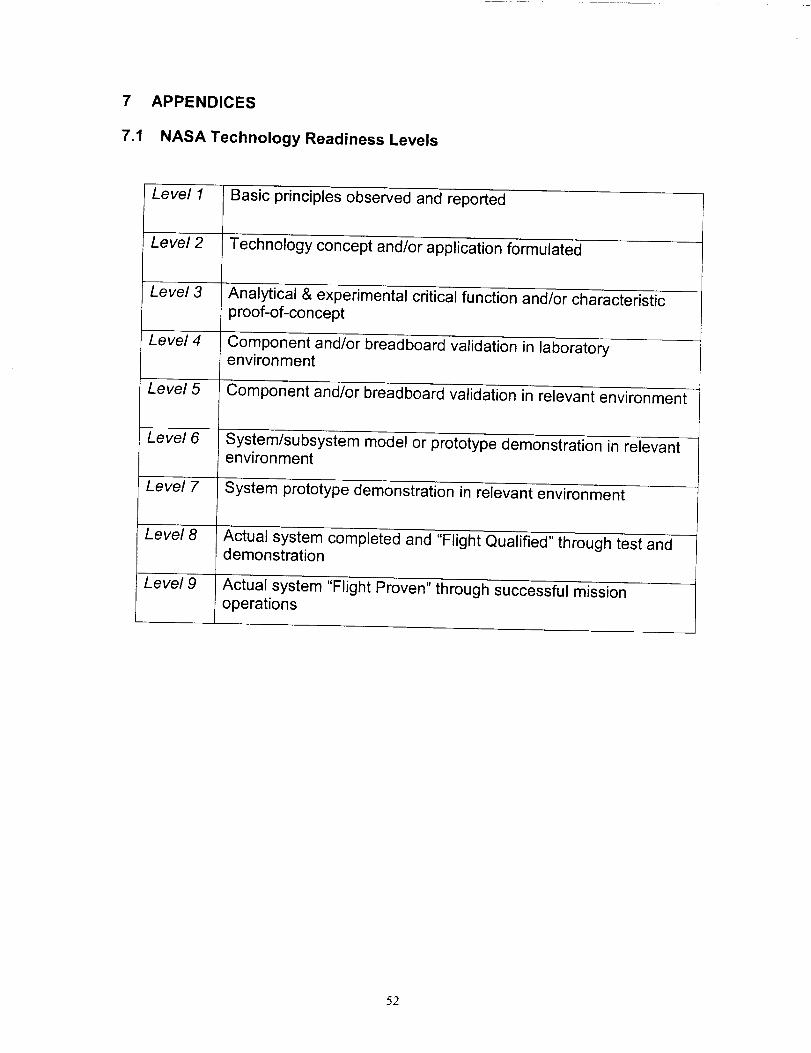
7 APPENDICES
7.1 NASA Technology Readiness Levels
Level 1
Level 2
Level 3
Level 4
Level 5
Level 6
Level 7
Level 8
Level 9
Basic principles observed and reported
Technology concept and/or application formulated
Analytical & experimental critical function and/or characteristicproof-of-concept
Component and/or breadboard validation in laboratoryenvironment
Component and/or breadboard validation in relevant environment
System/subsystem model or prototype demonstration in relevantenvironment
System prototype demonstration in relevant environment
Actual system completed and "Flight Qualified" through test anddemonstration
Actual system "Flight Proven" through successful missionoperations
52
7.2
7.2.1
1.
Bibliography
References Included in the Appendix
R. G. Seasholtz and L. C. Greer III, "Rayleigh Scattering Diagnostic for Measurement of
Temperature and Velocity in Harsh Environments," NASA/TM- 1998-206980 (1998).2. R. G. Seasholtz and A. E. Buggele, "Improvement in Suppression of Pulsed Nd:YAG
Laser Light With Iodine Absorption Cells for Filtered Rayleigh Scattering
Measurements," NASA Teehnical Memorandum 11317 (1997).3. R. G. Seasholtz, A. E. Buggele, and M. F. Reeder, "Technical Support package -
Measuring Flow Using Spectrally Resolved Rayleigh Scattering," NASA Teeh BriefsLE W- 16425.
4. P. G61z and P. Andresen, "Atomic vapor filer for two-dimensional Rayleigh imaging
experiments with a narrow-band KrF excimer laser," Applied Optics 35(30), 6054-6061
(1996).5. G. Tenti, C. D. Boley, and R. C. Desai, "On the Kinetic Model Description ofRayleigh -
Brillouin Scattering from Molecular Gases," Canadian Journal of Physics 52(4), 285-290
(1974).6. R.B. Miles, W. R. Lempert, and J. N. Forkey, "Laser Rayleigh Scattering," Measurement
Science and Technology 12, R33-R51 (2001).7. J.N. Forkey, N.D. Finkelstein, W. R. Lempert, and R. B. Miles, " Demonstration and
Characterization of Filtered Rayleigh Scattering for Plannar Velocity Measurements,"
AIAA Journal 34(3), 442-448 (1996).
8. R.G. Seasholtz and A. E. Buggele, "Study of Injection of Helium Into Supersonic Air
Flow Using Rayleigh Scattering," NASA Technical Memorandum 107409 AIAA-97-O155
(1997).9. R. G. Seasholtz, A. E. Buggele, and M. F. Reeder, " Flow Measurements Based on
Rayleigh Scattering and Fabry - Perot Interferometer," Optics and Laser in Engineering27, 543-570 (1997).
10. R. G. Seasholtz, A. E. Buggele, and M. F. Reeder, "Instantaneous Flow Measurements in
a Supersonic Wind Tunnel Using Spectrally Resolved Rayleigh Scattering," NASA
Technical Memorandum 107042 (1995).11. R. G. Seasholtz, F. J. Zupanc, and S. J. Schneider, " Spectrally Resolved Rayleigh
Scattering Diagnostic for Hydrogen - Oxygen Rocket Plume Studies," Journal of
Propulsion and Power, 8(5), 935-942 (1992).12. Shardanand and A. D. Prasas Rao, " Absolute Rayleigh Scattering Cross Sections of
Gases and Freons of Stratospheric Interest in the Visible and Ultraviolet Regions," NASATechnical Note NASA TN D-8442 (1977).
13. H. E. Kourous and R. G. Seasholtz, "Fabry - Perot Interferometer Measurement of Static
Temperature and Velocity for ASTOVL Model Tests," NASA Technical Memorandum
107014 (1994).14. Z. Liu, I. Matsui, and N. Sugimoto, "High-spectral-resolution lida using an iodine
absorption filter for atmospheric measurements," Optical Engineering, 38(10), 1661 -1670
(1999).15. L. D. Reynolds and C. B. Shaw, "Experimental method for gas kinetic tempture
measurements in a thermal plasma," SPIE, 1554B, 622-631 (I 991 ).
16. K. P. Chan and D. K. Killinger, "Short pulse coherent Doppler Nd:YAG lidar," Optical
Engineering, 30(1), 49-54 (1991).
17. W. A. de Groot and F. J. Zupanc, "Laser Rayleigh and raman diagnostics for small
hydrogen/oxygen rockets," SPIE, 1862, 98-112 (1993).
53
7.2.2 Additional References
• R.G. Sellar and D. Wang, Assessment of Remote Sensing Technologies forLocation of Hydrogen and Helium leaks, Phase 1 Final Report, NAG 10-0290(2000).
• R.M. Measures, Laser Remote Sensing Fundamentals and Applications, Wiley -Interscience, New York (1984).
• J.N. Forkey, Development and Demonstration of Filtered Rayleigh Scattering -
A Laser Based Flow Diagnostic for Planar Measurement of Velocity,Temperature, and Pressure, Final Technical Report for NASA Graduate Student
Researcher Fellowship Grant NGT-50826 (1996).
• J. Crank, The Mathematics of Diffusion, Oxford Science Publication, secondedition (1989)
• D.R. Poirier and G.H. Geiger, Transport Phenomenon in Materials Processing,TMS Publication (1994)
• R.E Cunningham and R.J.J. Williams, Diffusion in Gases and Porous Media,Plenum Press (1980)
• J.C. Strikwerda, "Finite Difference Schemes and Partial DifferentialEquations ", Wadsworth & Brooks/Cole.
• R. Taylor and R. Krishna, "Multi-component Mass Transfer", John Wiley Series(1993)
• R.L. Burden and J. D. Faires, "NumericalAnalysis: Fourth Edition ", PWSKent(1988)
• R.W. Fox and A.T. McDonald, "Introduction to Fluid Mechanics: ThirdEdition ", Wiley (1985)
• R.B. Bird, W.E. Stewart and E. N. Lightfoot, "Transport Phenomena ", Wiley,(1960)
• M. Zhu, H. Miyata and H. Kajitani, " Finite difference simulation of a viscous
flow about a ship of arbitrary configuration", The Proceedings: Fifth
hzternational Conference on Numerical Ship Hydrodynamics, pp. 119-132 (1990)
54