assessment of reproductive isolation between yellowstone montana
TRANSCRIPT

ASSESSMENT OF REPRODUCTIVE ISOLATION BETWEEN YELLOWSTONE
CUTTHROAT TROUT AND RAINBOW TROUT IN THE YELLOWSTONE RIVER,
MONTANA
by
James Nicholas De Rito, Jr.
A thesis submitted in partial fulfillment of the requirements for the degree
of
Master of Science
in
Fish and Wildlife Management
MONTANA STATE UNIVERSITY Bozeman, Montana
August 2004

© COPYRIGHT
by
James Nicholas De Rito, Jr.
2004
All Rights Reserved

ii
APPROVAL
of a thesis submitted by
James Nicholas De Rito, Jr.
This thesis has been read by each member of the thesis committee and has been found to be satisfactory regarding content, English usage, format, citations, bibliographic style, and consistency, and is ready for submission to the College of Graduate Studies. Alexander V. Zale
Approved for the Department of Ecology
David W. Roberts
Approved for the College of Graduate Studies
Bruce R. McLeod

iii
STATEMENT OF PERMISSION TO USE
In presenting this thesis in partial fulfillment of the requirements for a master’s
degree at Montana State University, I agree that the Library shall make it available to
borrowers under the rules of the Library.
If I have indicated my intention to copyright this thesis by including a copyright
notice page, copying is allowable only for scholarly purposes, consistent with “fair use”
as prescribed in the U. S. Copyright Law. Requests for permission extended quotation
from or reproduction of this thesis in whole or in parts may be granted only by the
copyright holder.
James Nicholas De Rito, Jr.
August 18, 2004

iv
ACKNOWLEDGEMENTS
I sincerely thank the four technicians that worked on this project. Shane Keep,
Kevin Duffy, Andy Godtel, and Tim Helwick spent many days radio-tagging and
tracking fish on the river, their dedication greatly enhanced this project. In addition,
about forty volunteers provided valuable assistance with work on the river. Numerous
landowners are to be thanked for their permission to access the river and its tributaries.
I thank Joel Tohtz, Gary Senger, Scott Shuler, David Schmetterling, and Patrick
Clancey for assistance and equipment. Jere Folgert provided guidance with data
formatting procedures for GIS. Nathan Olson assisted with overlap indices and all things
related.
I’d like to thank my major advisor, Dr. Al Zale, for support in all aspects of this
study, especially for his keen editorial eye and patience in overseeing this thesis. I’m
grateful to have worked with my project advisor, Brad Shepard, for his fisheries insight,
database expertise, and boundless enthusiasm and ideas. My committee members, Drs.
Tom McMahon and Carter Kruse, provided valuable input into the implementation of this
study and preparation of this thesis.
Funding for this project was provided by the Montana Department of Fish,
Wildlife and Parks, the National Fish and Wildlife Foundation, the Gallatin and Custer
National Forests, the US Fish and Wildlife Service, the Jackson Hole One Fly
Foundation, and the Yellowstone Cutthroat Trout Coordinating Committee.

v
TABLE OF CONTENTS
LIST OF TABLES............................................................................................................. vi LIST OF FIGURES .......................................................................................................... vii ABSTRACT..................................................................................................................... viii 1. INTRODUCTION ......................................................................................................... 1 2. STUDY AREA .............................................................................................................. 6 3. METHODS .................................................................................................................... 8
Radio telemetry............................................................................................................... 8 Spatial and temporal spawning variables...................................................................... 12 Environmental variables ............................................................................................... 13 Statistical analysis......................................................................................................... 14 Genetic testing .............................................................................................................. 14
4. RESULTS .................................................................................................................... 18
Spatial assessment......................................................................................................... 21 Temporal assessment .................................................................................................... 27 Environmental variables ............................................................................................... 34 Spatial versus temporal assessment .............................................................................. 37 Genetic testing .............................................................................................................. 37
5. DISCUSSION.............................................................................................................. 41
Temporal separation and spatial overlap ...................................................................... 41 Genetic testing .............................................................................................................. 48 Status of radio-tagged fish ............................................................................................ 49 Management implications............................................................................................. 51
LITERATURE CITED ..................................................................................................... 54

vi
LIST OF TABLES
Table Page
1. Number of radio-tagged trout (the number that subsequently spawned is within parentheses) from each river sampling section by year .................................................................................................. 9
2. Pianka overlap index values of spawning-area and spawning-reach overlap between taxa by year and for all years combined.......................................................................................24 3. Mean migration and spawning time variables of rainbow trout (N = 15), hybrids (N = 14), and cutthroat trout (N = 44) in the Yellowstone River drainage, Montana, 2001 through 2003. ........................... 28
4. Pianka overlap index values of spawning-period overlap between taxa by year and for all years combined .............................................33
5. Mean daily discharge and temperature of the Yellowstone River at Livingston during migration and spawning start dates of rainbow trout (N = 15), hybrids (N = 14), and cutthroat
trout (N = 44), 2001 through 2003……………………………………………36 6. Genetic compositions of cutthroat trout spawning aggregations, as determined by PINE, from four tributaries in 2003.................................... 40

vii
LIST OF FIGURES
Figure Page
1. The upper Yellowstone River drainage showing all tributaries where spawning was observed by telemetered fish. .......................................... 7
2. Spawning areas of radio-tagged fish in the upper Yellowstone River drainage, 2001 through 2003 ................................................................ 19
3. Distribution of spawning by radio-tagged trout among the five most heavily used spawning areas in the Yellowstone River system, 2001 to 2003 ...................................................................................... 23
4. Spawning reaches of individual fish within the Yellowstone River drainage, 2001.……………………………………………………….. 25
5. Spawning reaches of individual fish within the Yellowstone River drainage, 2002....................................................................................... 26
6. Spawning reaches of individual fish within the Yellowstone River drainage, 2003....................................................................................... 27
7. Distributions of weeks that radio-tagged trout were present in
spawning areas in the Yellowstone River drainage, 2001 to 2003………….. 30
8. Comparison of rainbow trout and hybrid spawning end dates versus cutthroat trout spawning start dates...……………………………….. 31
9. Spawning periods of 73 individual fish: 44 cutthroat trout (solid lines), 15 rainbow trout (dotted lines), and 14 hybrids (dash-dot lines) during 2001 to 2003............................................................... 32
10. Annual migration start date ranges of taxa compared to the Yellowstone River hydrograph and thermograph at Livingston, 2001 through 2003 ........................................................................................... 35 11. Comparison of spawning reaches versus spawning periods of radio-tagged fish within the five most-used spawning areas of the Yellowstone River drainage, 2001 to 2003 ................................. 38
12. Spawning-reach overlap index values versus spawning-period
overlap index values by year and for all years combined .................................. 39

viii
ABSTRACT
The genomic extinction of Yellowstone cutthroat trout (Oncorynchus clarki bouvieri) has occurred throughout many parts of its historic range because of displacement and introgression with introduced rainbow trout (O. mykiss). However, fluvial cutthroat trout still retain their genetic integrity while co-existing with rainbow trout in the Yellowstone River drainage, Montana. I assessed whether spatial or temporal reproductive isolation, or both, occurs between these taxa. Time and place of spawning was determined by radio-telemetry of a total of 164 trout (98 cutthroat, 37 rainbow, and 29 cutthroat x rainbow hybrids) over three spawning seasons, from 2001 to 2003. Fish were telemetered in four areas of a 140-km segment of the mainstem Yellowstone River. Of the 164 radio-tagged fish, 73 (44 cutthroat trout, 15 rainbow trout, and 14 hybrids) were assumed to have spawned. Fifty-five (75.3%) of 73 radio-tagged fish that spawned used 16 tributaries, 17 (23.3%) used 7 river side channels, and 1 (1.4%) used the main channel of the Yellowstone River. The majority of fish that spawned (62%) used five spawning areas. These were used by 79% (N = 11) of hybrids, 61% (N = 27) of cutthroat trout, and 47% (N = 7) of rainbow trout that spawned. Spawning-area and spawning-reach overlap index values were high among all taxa. In contrast, mean migration and spawning dates of rainbow trout and hybrids were 5 to 9 weeks earlier than of cutthroat trout. Rainbow trout and hybrids began migrating and spawning in April and May when Yellowstone River discharges were lower and water temperatures were colder than discharges and temperatures during cutthroat trout migration and spawning in June and July. Spawning-period overlap index values between rainbow trout and hybrids versus cutthroat trout were typically less than half the spatial overlap index values. Therefore, difference in time of spawning is likely the predominant mechanism eliciting reproductive isolation. Management actions focused on later spawning cutthroat trout in tributaries may enhance temporal reproductive isolation from rainbow trout and hybrids.

1
INTRODUCTION
Hybridization of native fishes has become widespread because of the introduction
of non-native fishes (Krueger and May 1991; Epifanio and Nielsen 2001) and may lead to
outbreeding depression, loss of evolutionary adaptability (Leary et al. 1995), and
genomic extinction of the native taxa (Allendorf et al. 2003). Hybridization may present
the greatest threat to conservation of the inland subspecies of cutthroat trout Oncorynchus
clarki (Allendorf and Leary 1988), but the limits and constraints of hybridization and
introgression within salmonid populations are not well understood (Utter 2001; Hitt et al.
2003).
Yellowstone cutthroat trout O. c. bouvieri evolved as the only trout within the
Yellowstone River drainage, as well as in the Snake River drainage above Shoshone Falls
(Behnke 1992). This distribution has been reduced and the subspecies was petitioned for
listing under the Endangered Species Act in 1998. Although listing was not warranted,
an evaluation was made of factors that effected the decline (USFWS 2001). Among
these factors were hybridization and displacement by introduced rainbow trout O. mykiss.
Extirpation or introgression of Yellowstone cutthroat trout has occurred in over 75% of
their historical stream habitat, including most mainstem rivers (May et al. 2003).
However, Yellowstone cutthroat trout still co-exist with introduced rainbow trout in the
mainstem of the upper Yellowstone River, Montana (Clancy 1988; Shepard 1992; Tohtz
1999). Mechanisms averting the complete displacement and hybridization of cutthroat
trout by rainbow trout in the Yellowstone River are unknown. My goal was to assess

2 whether reproductive isolation permits co-existence between cutthroat trout and rainbow
trout in the Yellowstone River.
Rainbow trout were stocked in the upper Yellowstone River, Montana, from the
early 1900s until 1972 (Clancy 1988) and are the most abundant trout in the river (Tohtz
2003). Rainbow trout have hybridized with resident cutthroat trout in many tributaries of
the Yellowstone River (Leary et al. 1989). In contrast, fluvial cutthroat trout spawning
runs in several tributaries are composed of putatively unhybridized fish (Clancy 1988;
Byorth 1990; Shepard 1992) and relatively few fluvial cutthroat x rainbow trout hybrids
have been detected in the mainstem river by genetic analysis. For example, six hybrids
were identified among 39 Yellowstone cutthroat trout or rainbow trout in 1983 (Leary
1983) and hybrids detected among Yellowstone cutthroat trout from three sections of the
Yellowstone River were 5 of 30 (Corwin Springs), 1 of 34 (Mill Creek Bridge), and 1 of
19 (Springdale) in 1998 (Tohtz 1999). Apparently unhybridized cutthroat trout spawning
populations and low numbers of hybridized fish in the Yellowstone River suggested the
existence of some mechanism of reproductive separation between fluvial Yellowstone
cutthroat trout and rainbow trout.
Reproductive isolation was still uncertain because hybrid individuals may be
difficult to identify. Field identification of hybrids may be unreliable (Weigel et al.
2002), because phenotypic characteristics of hybrids may be similar to either parental
species (Leary et al. 1984; Leary et al. 1996). Genetic tests of individual fish may be
ineffective, because of the limited number of diagnostic markers available for testing
(Boeklen and Howard 1997; Allendorf et al. 2001). Therefore, genetic testing of

3 populations is a more reliable method of determining hybridization and introgression
(Leary et al. 1984). Genetic testing of putative fluvial adult cutthroat trout spawning
aggregations, i.e., populations, had never been done in the Yellowstone River drainage.
Previous surveys and sampling of fluvial trout were not designed to assess
reproductive isolation. Populations should first be demarcated to assess genetic
composition and potential reproductive separation within sympatric populations (Olsen et
al. 2002, May et al. 2003). Genetic testing and assessment of reproductive separation of
fluvial trout should occur when and where genetic exchange occurs, i.e., during spawning
and within spawning areas. All previous genetic samples of fluvial adult trout from the
Yellowstone River drainage had been taken when and where individuals of multiple
populations were present in the mainstem river. The power to detect hybridization within
samples is then based on the limited number of diagnostic available to test for an
individual fish rather than the sum of all individuals from a population. Fluvial fish of
multiple populations may occupy the same summer and winter habitat, but spawn in
different areas (Clancy 1988; Brown and Mackay 1995; Henderson et al. 2000) because
habitat used for spawning is typically distinct from habitats used for feeding and
protection (Northcote 1997). Migration to and aggregation within spawning habitat
typically occurs in April and May by rainbow trout within Intermountain West rivers
(Spoon 1985; Sandborn 1990; Henderson et al. 2000; Downing et al. 2002) and June and
July by cutthroat trout (Clancy 1988; Byorth 1990; Kaeding and Boltz 2001).
Hybridization potential has been assessed by comparing the time or place of
spawning of rainbow trout and cutthroat trout (Henderson et al. 2000) and could also be

4 used to demarcate populations and evaluate reproductive separation. Spatial or temporal
segregation during spawning between coastal cutthroat O. c. clarki and rainbow trout
within their native ranges may result in low levels of hybridization (Trotter 1989; Behnke
1992). Interbreeding may be minimized by differences in spawning times and the
preference of coastal cutthroat trout for spawning in smaller tributaries, whereas rainbow
trout use main river channels. Differences in timing of spawning may also minimize
interbreeding of Atlantic salmon Salmo salar and brown trout S. trutta within their native
ranges (Heggberget et al. 1988). Therefore, spatial or temporal reproductive isolation, or
both, has been suggested as mechanisms that can limit interbreeding between native
salmonid populations, and may potentially extend to nonnative populations. For
example, differences in run timing and spawning areas between wild steelhead and
introduced steelhead may minimize genetic and ecological interactions in Forks Creek,
Washington (Mackey et al. 2001).
My hypotheses for reproductive isolation in the upper Yellowstone River drainage
were based on either spatial or temporal separation. I hypothesized that spatial
reproductive separation occurs because rainbow trout will spawn predominantly within
side channels of the river, as occurs in other river systems (Henderson et al. 2000;
Downing et al. 2002), and cutthroat trout will spawn in tributaries (Clancy 1988). Spatial
separation may also occur within tributaries used for spawning if Yellowstone cutthroat
trout spawn further upstream than rainbow trout (Thurow 1982; Henderson et al. 2000). I
hypothesized that temporal reproductive separation may exist if rainbow trout spawn
earlier than Yellowstone cutthroat trout (Henderson et al. 2000), which was partly

5 documented by weirs, redd counts, or both in Yellowstone River tributaries (Roberts
1986; Byorth 1990; Shepard 1992). Different aspects of the spawning behavior or habitat
of either rainbow trout or cutthroat trout have been studied in the Yellowstone River
drainage (Roberts 1986; Clancy 1988; Byorth 1990), but no studies have systematically
compared the spawning locations and times between these taxa throughout the drainage.
My objective was to assess if, and to what degree, spatial or temporal
reproductive isolation occurs among Yellowstone cutthroat trout, rainbow trout, and their
hybrids in the Yellowstone River by comparing the time and place of spawning using
radio-tagged individuals of these three taxa. An understanding of isolating factors could
assist managers with preserving the genomic integrity of cutthroat trout through
management actions that promote reproductive separation between the taxa such as
selective fish barriers or spatially specific spawning habitat enhancement.

6
STUDY AREA
The Yellowstone River begins in northwestern Wyoming and flows north and
then northeast for a total of 1,113 km to its confluence with the Missouri River in North
Dakota. The Yellowstone is considered the longest “free-flowing” (not impounded) river
in the continental United States. My study area encompassed 140 km of the upper
Yellowstone River, from the Bear Creek confluence (elevation 1,603 m) near Gardiner,
Montana, downriver to Springdale, Montana (elevation 1,286 m; Figure 1). The river
gradient is 2.3 m/km and the river bed is predominantly cobble and gravel. The historical
mean annual discharge was 106 m³/s and the historical mean peak discharge was 597
m³/s at the US Geological Survey (USGS) gage site at Livingston, Montana (USGS
2004). Tributaries originate primarily within publicly-owned mountainous forest lands
and flow out onto the river valley bottom, which is predominantly privately-owned ranch
lands. Within the river valley bottom, most tributaries are diverted for irrigation and
many are dewatered and only flow to the river for a short period of time during peak run-
off in late spring or early summer.
Native fishes within the study area are Yellowstone cutthroat trout, mountain
whitefish Prosopium williamsoni, white sucker Catostomus commersoni, longnose sucker
C. catostomus, mountain sucker C. platyrhynchus, mottled sculpin Cottus bairdi, and
longnose dace Rhinichthys cataractae. Non-native fish species are rainbow trout,
rainbow trout x cutthroat trout hybrids (hereafter referred to as hybrids), brown trout
Salmo trutta, and brook trout Salvelinus fontinalis (rare occurrence). Angling within the

7 study area has been restricted to catch-and-release of Yellowstone cutthroat trout since
1984, whereas harvest of rainbow trout is allowed.
Figure 1. The upper Yellowstone River drainage showing all tributaries where spawning was observed by telemetered fish. Sections where trout were captured and implanted with radio transmitters are shown (names of sections based on Montana Department of Fish, Wildlife and Parks nomenclature).

8
METHODS
Radio telemetry
I radio-tagged a total of 164 trout in the Yellowstone River during March and
April of 2001, 2002, and 2003 (Table 1). Trout were captured in 5.2 to 12.9 km river
reaches associated with four long-term Montana Department of Fish, Wildlife and Parks
salmonid population abundance monitoring sections (Figure 1). Fish were radio-tagged
in the Corwin Springs and Mill Creek Bridge sections in 2001 and 2002, and in the Ninth
Street Bridge and Springdale sections in 2002 and 2003. During the first year of
sampling in each section, I attempted to radio-tag 25 trout in the proportion of 15
cutthroat trout, 5 rainbow trout, and 5 hybrids. Similar proportions of each taxa were
tagged in these sections during successive years. I radio-tagged a greater proportion of
cutthroat trout, versus either rainbow trout or hybrids, to better ensure a representative
sample of the specific spawning times and places of these putatively unhybridized trout.
Trout were captured by electrofishing (DC) with a Coffelt model VVP-15
rectifying unit from a jet boat (double-boom) in 2001 or a drift boat (single-boom) in
2002 and 2003. The drift boat was used in 2002 and 2003 because of low river
discharges. Trout were anesthetized (MS-222), measured (total length, mm), weighed
(g), and fin clipped (pelvic). The length at maturity of fluvial Yellowstone cutthroat trout
in the Yellowstone River is about 300 mm (Clancy 1988); therefore, only fish greater
than this length were radio-tagged. Lengths of radio-tagged fish ranged from 333 to 500
mm with mean lengths of 369 mm for cutthroat trout, 400 mm for hybrids, and 409 mm
for rainbow trout.

9
Table 1. Number of radio-tagged trout (the number that subsequently spawned is within parentheses) from each river sampling section by year. Yellowstone cutthroat trout are denoted as YCT, rainbow trout are denoted as RB, and hybrids are denoted as HY. Gender is denoted as M = male and F = female.
Year 2001 2002 2003 Total Section Taxa M F Total M F Total M F Total M F Total Corwin Springs
YCT RB HY
10 (3) 3 (1) 4 (3)
5 (2) 2 (0) 1 (0)
15 (5) 5 (1) 5 (3)
7 (5) 2 (1) 1 (1)
5 (0) 2 (1) 1 (0)
12 (5) 4 (2) 2 (1)
17 (8) 5 (2) 5 (4)
10 (2) 4 (1) 2 (0)
27 (10) 9 (3) 7 (4)
Mill Creek Bridge
YCT RB HY
9 (4) 3 (1) 3 (2)
7 (3) 2 (0)
1 (1)
16 (7) 5 (1) 4 (3)
6 (1) 2 (2) 4 (2)
7 (6) 3 (3) 0 (0)
13 (7) 5 (5) 4 (2)
15 (5) 5 (3) 7 (4)
14 (9) 5 (3) 1 (1)
29 (14) 10 (6) 8 (5)
Ninth Street Bridge
YCT RB HY
7 (5) 2 (1) 4 (2)
8 (2) 3 (1) 1 (0)
15 (7) 5 (2) 5 (2)
1 (1) 3 (0) 0 (0)
4 (3) 1 (1) 0 (0)
5 (4) 4 (1) 0 (0)
8 (6) 5 (1) 4 (2)
12 (5) 4 (2) 1 (0)
20 (11) 9 (3) 5 (2)
Springdale YCT RB HY
6 (4) 2 (-) 2 (-)
9 (1) 3 (1) 3 (1)
15 (5) 5 (1) 5 (1)
3 (1) 2 (0) 4 (2)
4 (3) 2 (2) 0 (0)
7 (4) 4 (2) 4 (2)
9 (5) 4 (0) 6 (2)
13 (4) 5 (3) 3 (1)
22 (9) 9 (3) 9 (3)
Total YCT RB HY
19 (7) 6 (2) 7 (5)
12 (5) 4 (0) 2 (1)
31 (12) 10 (2) 9 (6)
26 (15) 8 (4) 11 (5)
29 (9) 11 (6) 5 (1)
55 (24) 19 (10) 16 (6)
4 (2) 5 (0) 4 (2)
8 (6) 3 (3) 0 (0)
12 (8) 8 (3) 4 (2)
49 (24) 19 (6)
22 (12)
49 (20) 18 (9) 7 (2)
98 (44) 37 (15) 29 (14)
Grand Total
50 (20) 90 (40) 24 (13)
164 (73)

10
A surgical incision of about 2 cm was made in the abdominal cavity and gonads
were examined with the unaided eye or an otoscope to determine gender. Radio
transmitters were allocated about equally between genders within taxa. Radio
transmitters were implanted (Schmetterling 2001) and incisions were closed with surgical
staples (Swanberg et al. 1999). Surgery duration (time on surgery table until back in the
water) averaged about 3 min (range 1 to 6 min). Radio-tagged fish were held in a live
cage in the river until they recovered from the anesthetic and then were released near
their capture location in 2001, or at their surgery sites in 2002 and 2003. Transmitters
(Lotek Wireless Inc., 8.9 g in air and 430 mm external antenna) did not exceed 3% of the
body weight of radio-tagged fish (Brown et al. 1999). Twenty-five new transmitters were
used during the first year of tagging in each section in both 2001 and 2002. New
transmitters had a lifespan of 520 d with a monthly schedule of 37 weeks on (March 19
until December 3, 2001 and February 27 until November 13, 2002) and 12 weeks off
(December 3, 2001 until February 25, 2002 and November 13, 2002 until February 5,
2003). Transmitters had a daily schedule of 13 h on (0800 – 1900) at a 3 – 3.5 s burst
rate and were expected to be operable through two successive spawning seasons.
Recovered transmitters were implanted in fish captured within the same river section in
the subsequent year.
I attempted to relocate each radio-tagged fish from March through August once
per week when fish were not in potential spawning areas and twice per week when fish
were within potential spawning areas. Potential spawning areas were defined as all
tributary streams or mainstem river areas with suitable spawning habitat. Suitable

11 spawning habitat for all taxa was based on the criteria of gravel size, water depths, and
water velocities for Yellowstone cutthroat trout (Gresswell 1995) or my direct
observations of spawning fish. I attempted to visually identify radio-tagged fish within
potential spawning areas and observe spawning behavior (e.g., fish paired up over
gravels, defense of spawning sites, and redd building) if water conditions allowed to
confirm that spawning was occurring within places classified as spawning areas. Radio-
tagged fish were relocated by surveys conducted by float boat, vehicle, and on foot. The
observer homed in as close as possible to the position of each radio-tagged fish. Fish not
initially relocated during surveys by boat, vehicle, or foot, were searched for by airplane
within and outside the primary study area.
I recorded the date and field map location for each fish relocation. I used
1:24,000 aerial photos of the river (Gardiner to Springdale, Montana), 1:24,000 USGS
topographic maps, and the 1:126,720 Gallatin National Forest-East Half map. Global
Positioning System (GPS) coordinates were recorded for most locations. Field map
locations were subsequently digitized or GPS coordinates were projected into shapefiles
within a Geographic Information System: ArcView 3.2 (Environmental Systems
Research Institute, Inc. 1999). Digital orthophoto quadrangles, based on 1:24,000 USGS
topographic maps, were the primary layer used to plot points in ArcView. Waterway
kilometers of location points were calculated from the 1:100,000 Montana hydrography
layer (Montana National Resource Information System 2004). Stream distances were
measured by hand using 1:24,000 digital topographic maps if a waterway route was not
available for a location point within the 1:100,000 Montana hydrography layer.

12
Spatial and temporal spawning variables
Spatial resource variables were computed from radio-tagged fish that entered
spawning areas. The largest spatial category for a spawning fish was the entire spawning
area, i.e., the tributary, side channel, or mainstem location. The spawning reach of a fish
was defined as the distance between the downstream-most and upstream-most relocation
points within a spawning area. Spawning reaches were partitioned into 1-kilometer
segments within each spawning area by waterway kilometer.
Migration and spawning times were estimated from relocation dates, movement
patterns, and spawning locations. Migration was defined as a directional movement to a
spawning area. Migration start date was defined as the median date between the date a
migrating fish was first relocated moving to a spawning area and the previous relocation
date of that fish (Swanberg 1997). Spawning start date was defined as the median date
between the first date a fish was located in a spawning area and the prior relocation date
of the fish when it was not in a spawning area. The spawning end date was defined as the
median date between the last relocation in a spawning area and the first relocation outside
of the spawning area, except for four cutthroat trout that did not leave spring creeks after
spawning. Spawning end dates for these fish were defined as the dates when they had
reached their maximum upstream extent within the creeks and were no longer observed
spawning. The spawning period was defined as the time between the spawning start and
end dates (Henderson et al. 2000). Spawning periods were partitioned into seven-day
blocks, as spawning week(s).

13
Spatial and temporal overlap between taxa were assessed by computing Pianka’s
index of overlap (Pianka 1973) separately for each of the three spawning resource
categories, i.e., spawning area, spawning reach, and spawning period. Overlap values
ranged from 0 (no overlap) to 1 (complete overlap). Overlap values were calculated for
all pairs of taxa, as well as for rainbow trout and hybrids combined versus cutthroat trout,
and by individual year or aggregated over all years. Confidence intervals for all overlap
values were computed using the 5th and 95th percentiles of the distribution of 2,000
bootstrap replications (Efron and Tibshirani 1993) generated using the program R 1.9.0
for Windows (R Development Core Team 2004).
Environmental variables
Discharge of the Yellowstone River and water temperatures of the river and
within individual spawning areas were assessed to determine the potential influence of
these variables on the timing of migration and spawning of radio-tagged fish.
Yellowstone River discharge and water temperature data (measured at 15 minute
intervals) were obtained from the USGS gage site at Livingston, Montana (USGS 2004;
Figure 1) and used to calculate daily mean values. In addition, I installed thermographs
(HOBO® and StowAway®, Onset Computer Corp.) at 18 potential spawning areas (16
tributary streams and 2 side-channels). Thermographs were located within 200 m of the
mouths of tributary streams or in the middle of side-channel lengths. Thermographs were
deployed from March through May and retrieved in autumn. Water temperatures were
recorded every hour and daily mean temperatures were calculated.

14
Statistical analysis
One-way ANOVA (Neter et al. 1996) was used to test for significant differences
in mean number of days and dates of migration and spawning among taxa, as well as
mean daily discharges and water temperatures associated with these dates. Tukey’s
multiple comparison procedure was used to test for pairwise differences between mean
number of days, dates, discharges, and temperatures. Two-sample t-tests were used to
test for differences in mean spawn start date, spawn end date, and spawn period between
genders. For each significance test and Tukey’s multiple comparison family error rate, α
= 0.05. All statistical analyses were conducted with Minitab 13.1 (Minitab 2000).
Genetic testing
Radio-tagged fish and putative Yellowstone cutthroat trout spawning populations
were genetically tested to assess phenotypic classification, hybridization, and
introgression. All fish were identified to taxon in the field using morphological features
such as spotting pattern, coloration, jaw slash presence or absence, relative jaw length,
and scale size. A subsample of radio-tagged fish was genetically tested (n = 30),
composed of 25 fish (16 putative cutthroat trout, 5 rainbow trout, and 4 hybrids) from the
Mill Creek Bridge section in 2001 and 5 fish (four cutthroat trout and one hybrid) that
spawned in either Greeley or Big creeks in 2003.
Putative Yellowstone cutthroat trout spawning aggregations discerned by
telemetry in four tributaries were sampled in 2003 to assess potential rainbow trout
hybridization and introgression. Cedar and Mulherin creeks were selected because radio-
tagged cutthroat trout had spawned in these creeks during 2001 and 2002. Greeley and

15 Big creeks were selected because these spawning tributaries were used by radio-tagged
cutthroat in 2003. Side channels and spring creeks were not sampled because of the
potential presence of fluvial fish that were not spawning. Spawning aggregations were
sampled in either June (Greeley Creek) or July (all other streams). Sampling of spawning
fish began near the stream mouth and progressed upstream 0.31 to 1.43 km. Fish were
sampled with a backpack electrofishing unit (smooth DC) at the lowest possible voltage
to minimize injury to fish and eggs. In addition, four fish were captured with hook and
line from a deep pool and two spawning-mortality carcasses were sampled in Big Creek.
I tried to capture at least 20 spawning trout greater than 300 mm total length, regardless
of phenotype, from each stream. Captured fish were not anesthetized and were not
handled beyond that needed to take a pelvic fin clip to minimize stress. Spawning
aggregations of fish in each tributary were treated as populations. All fish captured from
each spawning aggregation were assessed collectively to determine genetic composition
and introgression of the population. The spawning aggregation samples from Greeley
and Big creeks each included one radio-tagged cutthroat trout.
Fin clips were analyzed with a PCR-based method, paired interspersed nuclear
DNA elements (PINE), at the University of Montana Wild Trout and Salmon Genetics
Lab (Spruell et al. 2001; Kanda et al. 2002). Each fish was analyzed to determine the
presence or absence of diagnostic DNA fragments, including ten for Yellowstone
cutthroat trout, six for rainbow trout, and four for westslope cutthroat trout. The presence
of a fragment indicates the individual is either heterozygous or homozygous for that
fragment (Spruell et al. 2001). First generation hybrids will have all fragments of both

16 taxa because they are heterozygous at all loci. Second generation and later hybrids
typically may be heterozygous for some fragments and homozygous for others.
Genotypes of the majority of radio-tagged Yellowstone cutthroat trout agreed
with field-classified phenotypes, whereas the genotypes of both rainbow trout and
hybrids varied in comparison to field-classified phenotypes. All individuals from the
genetically tested subsample of radio-tagged Yellowstone cutthroat trout (N = 20) had
diagnostic PINE fragments for Yellowstone cutthroat trout, but one also displayed a
single diagnostic PINE fragment of rainbow trout. The genetically tested subsample of
radio-tagged rainbow trout (N = 5) had three individuals with diagnostic PINE fragments
for rainbow trout, but only one individual with no Yellowstone cutthroat trout fragments.
Neither of the two putative rainbow trout with diagnostic PINE fragments for both
rainbow trout and Yellowstone cutthroat trout appeared to be a first-generation hybrid.
Only PINE fragments for Yellowstone cutthroat trout were detected in the remaining two
putative rainbow trout. The genetically tested subsample of radio-tagged hybrids (N = 5)
had two individuals with diagnostic PINE fragments for both rainbow trout and
Yellowstone cutthroat trout. One of these hybrids also had a PINE fragment for
westslope cutthroat trout. Of the remaining three putative hybrids, two had fragments for
only rainbow trout and one had fragments only for Yellowstone cutthroat trout.
Phenotypic classifications of radio-tagged fish were not changed based on genetic
results. Ninety-five percent of the subsample of radio-tagged Yellowstone cutthroat trout
did not have rainbow trout PINE fragments. A high percentage of putative rainbow trout
and hybrids that were radio-tagged may have been post-F1 hybrids. Two of five

17 genetically tested rainbow trout were genetically identified as post-F1 hybrids. Similarly,
rainbow trout with only PINE fragments for Yellowstone cutthroat trout were also likely
post-F1 hybrids. Later generation hybrids may have an absence of some PINE fragments
(Spruell et al. 2001) and given the limited number of rainbow trout diagnostic fragments
(N = 6), the ability to detect rainbow trout markers may be low. Similarly, the three
hybrids that had only PINE fragments for one taxon may have been later-generation
hybrids. Alternatively, putative hybrids may have been misclassified as such. Fish
visually classified as hybrids may have had higher levels of cutthroat trout genes than
those visually identified as rainbow trout, but which were genetically identified as
hybrids. Spatial and temporal reproductive overlap of cutthroat trout was compared
against rainbow trout and hybrids separately, because phenotypic differences may
correspond to behavioral differences, and collectively, because these fish both potentially
have rainbow trout alleles.

18
RESULTS
Seventy-three of 164 radio-tagged trout moved into spawning areas and were
assumed to have spawned there (Figure 2). These 73 spawning trout were composed of
44 cutthroat trout, 15 rainbow trout, and 14 hybrids, proportions which were similar to
the proportions of taxa that were radio-tagged (Table 1). I observed spawning activity
during the relocations of 33 (19 cutthroat trout, 8 rainbow trout, and 6 hybrids) of the 73
fish in spawning areas. Of the 100 fish implanted with new transmitters, only six were
tracked through two spawning seasons, all during 2002 and 2003; three of these spawned
during just one year, two did not spawn during either year, and one spawned in both
years. It spawned in Depuy’s Spring Creek during June 17 to July 26, 2002, remained in
the creek until October, and again entered the creek, presumably to spawn, during April
27 to June 3, 2003. Only the first year (2002) spawning locations and times of this fish
were used because of the lack of independence of the data from the successive year.
Radio-tagged spawning fish migrated from 0.1 to 51.7 km within the river to
spawning areas. Mean river migration distance and range of radio-tagged taxa was 11.4
km (0.1 to 51.7 km) for cutthroat trout, 12.9 km (0.26 to 48.4 km) for rainbow trout, and
13.7 km (0.35 to 40.5 km) for hybrids. Mean river migration distance and range of radio-
tagged fish by river section was 7.0 km (0.1 to 24.0 km) in Corwin Springs, 14.1 km
(0.35 to 44.2 km) in Mill Creek Bridge, 9.1 km (0.26 to 51.3 km) in Ninth Street Bridge,
and 18.0 km (0.98 to 51.7 km) in Springdale. Fish radio-tagged in the Corwin Springs
section exclusively used spawning areas adjacent to and upriver of this tagging section.
Radio-tagged fish in the three downriver sections used some of the same spawning areas.

19 Figure 2. Spawning areas of radio-tagged fish in the upper Yellowstone River drainage, 2001 through 2003. Numbers of each taxon greater than one within a spawning area are denoted by the number next to the taxon symbol. Taxon symbols within tributaries are ordered according to the mean upstream distance moved by a taxon.

20
Spawning information was not collected on 91 radio-tagged fish. Twenty-nine
fish did not spawn because of surgery mortality (N = 15) or pre-spawn mortality (N =
14). The percentage of surgery mortality by taxa was 7% (2 of 29) of hybrids, 8% (3 of
37) of rainbow trout, and 10% (10 of 98) of cutthroat trout. The percentage of pre-
spawning mortality by taxa was 3% (1 of 37) of rainbow trout, 13% (13 of 98) of
cutthroat trout, and none of the hybrids. Twenty-three fish made migrations during the
spring, but were never found in spawning areas. Sixteen of these fish (3 rainbow trout, 3
hybrids, and 10 cutthroat trout) may have spawned in unidentified mainstem river
spawning areas or perhaps their migration was not completed because of mortality.
These fish were not found in spawning areas despite a relatively short amount of time
between relocations (range 1 to 11 d, mean = 7 d). It is likely that the remaining 7 radio-
tagged fish (2 cutthroat trout and 5 rainbow trout) spawned in areas that were not covered
during relocation surveys because they were missing between relocations for 14 to 30 d
(mean = 22 d). The five rainbow trout migrated to spawn shortly after being radio tagged
and before weekly relocation surveys began of the full study area. Thirty-nine fish (10
rainbow trout, 10 hybrids, and 19 cutthroat trout) did not migrate. These fish were alive
in the river through the spawning season but made no discernable movements to spawn.
Apparent mortality of spawning and nonspawning fish was high during and after
the spawning season. Forty (55%) of 73 documented spawning fish died or expelled tags
as a result of spawning, including 60% of rainbow trout, 59% of cutthroat trout, and 36%
of hybrids. Nine fish died during the subsequent summer through winter period. Final
location or status of 17 fish that spawned was unknown. These fish were tracked after

21 spawning until the subsequent winter but survival was uncertain based upon the last
relocation. Seven fish survived either through a second year, until the end of the study
period, or until their transmitter batteries expired. Some nonspawning fish either died
during their applicable taxon spawning season (N = 25) or from the spawning season
through the first winter (N = 17). The final locations or status of 17 fish that did not
spawn was unknown and 3 survived through their second season, until the end of the
study period, or until transmitter batteries expired.
The majority of radio tags were recovered after apparent fish mortality. Most of
the recovered tags were no longer in the fish and tags were typically found within the
river or along its banks. Predation likely occurred on 15% (N = 24) of radio-tagged fish
based on recovery locations outside of waterways, i.e., below nests, perches, or in fields.
Predators of radio-tagged fish were primarily birds, including eagles, ospreys, and herons
(in order of the number of suspected predation events), but may have included mink and
otters. Four radio-tagged fish (three cutthroat trout and one hybrid) were entrained within
irrigation ditches originating from four different tributary streams. Three radio tags were
recovered within or adjacent to redds, indicating potential expulsion of tags during
spawning.
Spatial assessment
Fifty-five of 73 (76%) radio-tagged fish spawned in 16 tributaries, 17 (23%) in 7
river side channels, and 1 (1%) in the main channel of the Yellowstone River (Figure 2).
Spawning activity was noted during relocations of the 73 radio-tagged fish in 10
tributaries, 3 side channels, and the one main channel location. Some spawning areas

22 were used exclusively by one radio-tagged taxon, including 11 by cutthroat trout, 4 by
rainbow trout, and 2 by hybrids. However, the majority of fish that spawned (N = 45 or
62%) used five spawning areas. These were used by 79% (N = 11) of hybrids, 61% (N =
27) of cutthroat trout, and 47% (N = 7) of rainbow trout (Figure 3). All three taxa
spawned in Mulherin (N = 10), Mill (N = 10), and Depuy’s Spring (N = 8) creeks and the
Pine Creek side channel (N = 9), and cutthroat trout and a hybrid spawned in Greeley
Creek (N = 8). Rainbow trout spawned in side channels (8 of 15 or 53%) more than
cutthroat trout (7 of 44 or 16%) or hybrids (2 of 14 or 14%). However, of the fish that
spawned in side channels, 100% (2 of 2) of hybrids, 50% (4 of 8) of rainbow trout, and
43% (3 of 7) of cutthroat trout used the Pine Creek side channel. Use of the same
spawning areas by high proportions of all three taxa resulted in high spawning-area
overlap index values among taxa (Table 2). Spawning-area overlap between rainbow
trout and hybrids combined versus cutthroat trout ranged from 0.34 to 0.84 annually and
was 0.67 over all years in aggregate. Spawning-area overlap between hybrids and
cutthroat trout was greater (0.78) than between hybrids and rainbow trout (0.51) or
between rainbow trout and cutthroat trout (0.40).
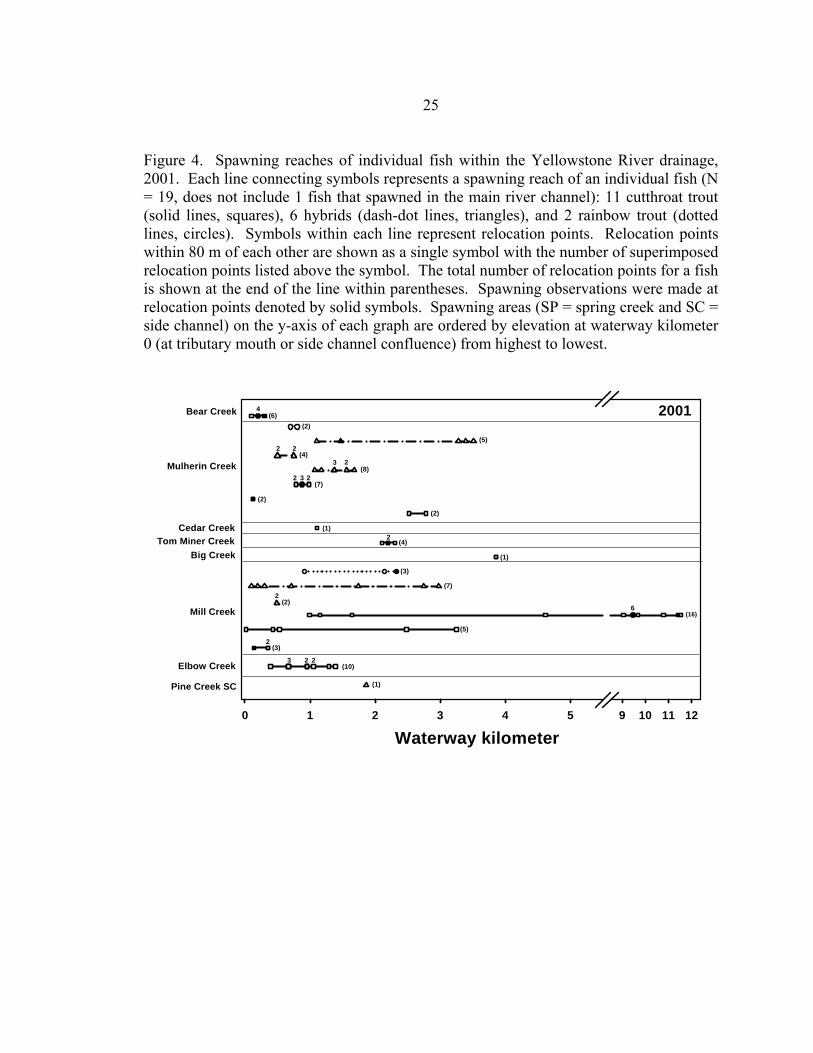
All three taxa consistently spawned within the same reaches of spawning areas.
Most tributary spawning reaches used by all taxa (45 of 55 or 82 %) were within 4 km of
the tributary mouths (Figures 4 through 6). Seven of the ten fish that spawned more than
4 km from a tributary mouth were in Depuy’s Spring Creek. The spawning reaches of

23 these seven fish (4 cutthroat trout and 3 hybrids) were a maximum of six kilometers from
the mouth. The same spawning reaches were also used by all three taxa in the Pine Creek
side channel.
Figure 3. Distribution of spawning by radio-tagged trout among the five most heavily used spawning areas in the Yellowstone River system, 2001 to 2003. Percentages were based on the total number of spawning fish of each taxon in all spawning areas: 15 rainbow trout, 14 hybrids, and 44 cutthroat trout.
Perc
ent
0
5
10
15
20
25
30 Rainbow trout (n = 7)
Perc
ent
0
5
10
15
20
25 Hybrids (n = 11)
Perc
ent
0
2
4
6
8
10
12
14
16
18 Cutthroat trout (n = 27)
MulherinCreek
MillCreek
Pine Creek SC
Depuy'sCreek
GreelyCreek
Spawning Areas

24
Table 2. Pianka overlap index values of spawning-area and spawning-reach overlap between taxa by year and for all years combined. The overlap value and 95% confidence interval (in parentheses) are followed by the numbers of fish of each taxon or taxa. Overlap values of zero do not have a bootstrapped confidence interval (denoted by a dash).
Comparison Taxa 2001 2002 2003 All years combined Spawning area Rainbow trout vs. hybrid 0.95 (0.00-1.00) 2, 6 0.43 (0.00-0.74) 10, 6 0.00 (-) 3, 2 0.51 (0.08-0.72) 15, 14 Rainbow trout vs. cutthroat trout 0.87 (0.15-0.94) 2, 12 0.25 (0.00-0.45) 10, 24 0.00 (-) 3, 8 0.40 (0.10-0.56) 15, 44 Hybrid vs. cutthroat trout 0.82 (0.19-0.92) 6, 12 0.38 (0.00-0.57) 6, 24 0.75 (0.00-0.97) 2, 8 0.78 (0.33-0.84) 14, 44
Rainbow trout and hybrid vs. cutthroat trout 0.84 (0.26-0.94) 8, 12 0.34 (0.05-0.54) 16, 24 0.40 (0.00-0.81) 5, 8 0.67 (0.31-0.77) 29, 44
Spawning reach Rainbow trout vs. hybrid 0.67 (0.00-0.92) 2, 6 0.27 (0.00-0.49) 10, 6 0.00 (-) 3, 2 0.35 (0.03-0.50) 15, 14 Rainbow trout vs. cutthroat trout 0.70 (0.00-0.79) 2, 12 0.24 (0.00-0.38) 10, 24 0.00 (-) 3, 8 0.36 (0.07-0.47) 15, 44 Hybrid vs. cutthroat trout 0.54 (0.04-0.70) 6, 12 0.58 (0.00-0.72) 6, 24 0.71 (0.00-0.90) 2, 8 0.70 (0.23-0.76) 14, 44
Rainbow trout and hybrid vs. cutthroat trout 0.65 (0.11-0.75) 8, 12 0.48 (0.03-0.61) 16, 24 0.48 (0.00-0.78) 5, 8 0.66 (0.24-0.70) 29, 44
25
Figure 4. Spawning reaches of individual fish within the Yellowstone River drainage, 2001. Each line connecting symbols represents a spawning reach of an individual fish (N = 19, does not include 1 fish that spawned in the main river channel): 11 cutthroat trout (solid lines, squares), 6 hybrids (dash-dot lines, triangles), and 2 rainbow trout (dotted lines, circles). Symbols within each line represent relocation points. Relocation points within 80 m of each other are shown as a single symbol with the number of superimposed relocation points listed above the symbol. The total number of relocation points for a fish is shown at the end of the line within parentheses. Spawning observations were made at relocation points denoted by solid symbols. Spawning areas (SP = spring creek and SC = side channel) on the y-axis of each graph are ordered by elevation at waterway kilometer 0 (at tributary mouth or side channel confluence) from highest to lowest.
Waterway kilometer0 1 2 3 4 5 9 10 11 12
Mulherin Creek
Cedar Creek
Big Creek
Mill Creek
Elbow Creek
Tom Miner Creek
Bear Creek
Pine Creek SC
2001(6)4
(2)
(5)
(4)
(8)
(7)2 3 2
(2)
(2)
(1)2
(4)
(1)
(3)
(7)
(2)6
(5)
(3)
3 2 2(10)
(1)
2 2
3 2
2
2
(16)

26
Figure 5. Spawning reaches of individual fish within the Yellowstone River drainage, 2002. Each line connecting symbols represents a spawning reach of an individual fish (N = 40): 24 cutthroat trout (solid lines, squares), 10 rainbow trout (dotted lines, circles) and 6 hybrids (dash-dot lines, triangles). See Figure 4 legend, for graph format details.
Waterway kilometer0 1 2 3 4 5 6 7
Bear Creek
Dry Creek
Ditch SC
Greeley Creek
Gardner River
Reese Creek
Mulherin Creek
Rock Creek
Big Creek
Fridley SC
Wan-I-Gan SC
Eightmile Creek
Mill Creek
Pine Creek SC
Mayors SC
HwY 89N SC
Lava Creek 2002(2)
(4)
(5)2
4(9)
(5)
(7)
(2)
(1)
(9)
(8)2 2
(2)
7 6(14)
(2)
3 3 5(16)
(2)
(2)
(4)2
(2)
(2)
(1)
(2)2
(6)2 2
2(3)
(1)4
(8)2
(2)
(2)2
(3)
(3)3
(5)
9(11)
2 3
7(10)
(2)
(1)
2(4)
2
(1)2 2
(5)
(10)
2
(6)
(3)
Depuy's SP Creek
Nelsons SP Creek

27
Figure 6. Spawning reaches of individual fish within the Yellowstone River drainage, 2003. Each line connecting symbols represents a spawning reach of an individual fish (N = 13): 8 cutthroat trout (solid lines, squares), 3 rainbow trout (dotted lines, circles) and 2 hybrids (dash-dot lines, triangles). See Figure 4 legend, for graph format details.
Spawning-reach overlap between rainbow trout and hybrids versus cutthroat trout
was 0.66 considering all years in aggregate (Table 2). Spawning-reach overlap between
hybrids and cutthroat trout (0.70) was greater than the overlap between hybrids and
rainbow trout (0.35) or between rainbow trout and cutthroat trout (0.36).
Temporal assessment
Rainbow trout and hybrids migrated before cutthroat trout. Mean dates of
migration start were all significantly different among taxa (P < 0.001; Table 3), and all
pairwise comparisons were significantly different. Mean dates of migration start of
hybrids and rainbow trout were about six to nine weeks earlier than the corresponding
date of cutthroat trout. Mean durations of migration were not different among taxa (P =
0.867).
Waterway Kilometer0 1 2 3 4 5 6 7
Big Creek
Pine Creek SC
Depuy's SP Creek
Ditch SC
Fleshman SC
Greeley Creek
20035(6)
2(3)
2(3)
3 22(7)
11
(1)
(1)
2(2)
2 2(4)
(2)
(2)
7(8)
(1)
(15)

28
Table 3. Mean migration and spawning time variables of rainbow trout (N = 15), hybrids (N = 14), and cutthroat trout (N = 44) in the Yellowstone River drainage, Montana, 2001 through 2003. Dates are presented as Julian day with calendar dates in parentheses. Significance values of one-way ANOVA are displayed.
Rainbow trout Hybrid Cutthroat trout
Variable Mean Range
Mean Range Mean Range P Migration start 101
(Apr 11) 86-118
(Mar 27-Apr 28) 117
(Apr 27) 91-187
(Apr 1-Jul 6) 161
(Jun 10) 110-187
(Apr 20-Jul 6) < 0.001
Migration period (d) 10 1-36 8 1-52 9 1-34 0.867
Spawning start 108 (Apr 18 )
94-156 (Apr 4-Jun 5)
126 ( May 6)
91-187 (Apr 1-Jul 6)
169 (Jun 18)
132-194 (May 12-Jul 13)
< 0.001
Spawning end 122 (May 2)
104-163 (Apr 14-Jun 12)
150 (May 30)
122-198 (May 2-Jul 17)
187 (Jul 6)
152-226 (Jun 1-Aug 14)
< 0.001
Spawning period (d) 14 4-55 24 7-40 17 2-75 0.170

29
Rainbow trout and hybrids spawned before cutthroat trout. Rainbow trout and
hybrids began spawning in April, whereas most cutthroat trout began spawning in June or
later (Figure 7). Most rainbow trout and hybrids spawned between mid April and late
May, whereas most cutthroat trout spawned from late June through mid July. Spawning
by rainbow trout and hybrids extended into June and July, respectively, whereas one
cutthroat trout spawned in August. Mean dates of spawn start and spawn end were all
significantly different among taxa (all P < 0.001; Table 3), and all pairwise comparisons
were significantly different. Mean dates of spawn start and spawn end of hybrids and
rainbow trout were about five to nine weeks earlier than the corresponding dates of
cutthroat trout. Mean spawn end dates of rainbow trout and hybrids were significantly
different from the mean spawn start date of cutthroat trout (P < 0.001; Figure 8). Radio-
tagged rainbow trout and cutthroat trout did not spawn at the same time within the same
spawning areas (Figure 9). Similarly, hybrids did not spawn at the same time as cutthroat
trout during the same year within four areas that were used by all three taxa (Mulherin
and Mill creeks in 2001, Pine side channel and Depuy’s Spring Creek in 2002). Hybrids
were present during cutthroat trout spawning during the same year within three areas
(Reese Creek in 2002, Depuy’s Spring and Greeley creeks in 2003). However, hybrids
left these spawning areas earlier than cutthroat trout, which were still spawning in June
and July. Mean durations of spawning periods were not different among taxa (P =
0.170). The mean number of days between relocations used to calculate migration start,
spawn start, and spawning end dates did not differ among taxa (P = 0.977, P = 0.300, and
P = 0.968, respectively).

30
Figure 7. Distributions of weeks that radio-tagged trout were present in spawning areas in the Yellowstone River drainage, 2001 through 2003.
Num
ber o
f Fis
h
0
2
4
6
8
10Rainbow trout
Num
ber o
f Fis
h
0
2
4
6
8
10Hybrid
Num
ber o
f Fis
h
0
5
10
15
20
25
30Cutthroat trout
April May June July August

31
Figure 8. Comparison of rainbow trout and hybrid spawning end dates versus cutthroat trout spawning start dates. Boxes represent the 25th to 75th percentile and the line within the box marks the mean. Lines extending from the box indicate the 10th and 90th percentiles and horizontal dashes represent outlying points.
Little overlap of spawning periods occurred between cutthroat trout and the two
other taxa. Spawning-period overlap index values between rainbow trout and hybrids
versus cutthroat trout were 0.09 to 0.19 for individual years and 0.20 considering all
years in aggregate. Spawning-period overlap index values between rainbow trout or
hybrids versus cutthroat trout were 0.04 and 0.30, respectively (Table 4). The highest
spawning-period overlap index value (0.66) was between hybrids and rainbow trout.
April May June July
Cutthroat trout
Hybrid
Rainbow trout

32
Figure 9. Spawning periods of 73 individual fish: 44 cutthroat trout (solid lines), 15 rainbow trout (dotted lines), and 14 hybrids (dash-dot lines) during 2001 to 2003. Spawning areas (SP = spring creek and SC = side channel) on the y-axis of each graph are ordered by elevation at waterway kilometer 0, from upriver (top of graph) to downriver.
Mulherin Creek
Cedar Creek
Main Channel Big Creek
Mill Creek
Elbow Creek
Tom Miner Creek
Bear Creek
Pine Creek SC
2001
MonthApril May June July
Big Creek
Pine Creek SC
Depuys SP Creek
Ditch SC
Fleshman SC
Greeley Creek
2003
Bear Creek 2002Lava Creek
Dry Creek
Ditch SC
Greeley Creek
Gardner River
Reese Creek
Mulherin Creek
Rock Creek Big Creek
Fridley SC Wan-I-Gan SC
Eightmile Creek
Mill Creek
Nelsons SP Creek
Depuys SP Creek
Pine Creek SC
Mayors SC HwY 89N SC

33
Table 4. Pianka overlap index values of spawning-period overlap between taxa by year and for all years combined. The overlap values and 95% confidence intervals (in parentheses) are followed by the numbers of fish of each taxon or taxa. Overlap values of zero do not have a bootstrapped confidence interval (denoted by a dash).
Comparison Taxa 2001 2002 2003 All years combined Spawning period Rainbow trout vs. hybrid 0.68 (0.32-0.82) 2, 6 0.70 (0.17-0.94) 10, 6 0.36 (0.00-0.71) 3, 2 0.66 (0.30-0.85) 15, 14 Rainbow trout vs. cutthroat trout 0.00 (-) 2, 12 0.01 (0.00-0.05) 10, 24 0.00 (-) 3, 8 0.04 (0.00-0.12) 15, 44 Hybrid vs. cutthroat trout 0.24 (0.01-0.50) 6, 12 0.18 (0.01-0.38) 6, 24 0.29 (0.00-0.56) 2, 8 0.30 (0.10-0.54) 14, 44 Rainbow trout and hybrid vs.
cutthroat trout 0.18 (0.01-0.41) 8, 12 0.09 (0.01-0.23) 16, 24 0.19 (0.00-0.46) 5, 8 0.20 (0.06-0.35) 29, 44

34
Mean spawning start dates and mean spawning end dates were not significantly
different between genders for rainbow trout and cutthroat trout. The sample size of
hybrid females (N = 2) was insufficient to calculate a representative mean to compare to
males. The mean spawning period of rainbow trout did not differ between genders (N =
9 females and 6 males). The mean spawning period of cutthroat trout males (22 d, N =
24) was significantly longer (P = 0.013) than cutthroat trout females (11 d, N = 20).
Environmental variables
Rainbow trout and hybrids began migrating and spawning at lower discharges and
colder temperatures than cutthroat trout (Figure 10 and Table 5). The annual peak mean
daily discharge at the Livingston gage station occurred on May 15, 2001, June 2, 2002,
and June 1, 2003. All 15 rainbow trout and 13 of 14 hybrids migrated prior to the these
dates, whereas 37 of 44 cutthroat trout migrated on or after the peak dates. Mean
discharges of the Yellowstone River at the start of migration and spawning of rainbow
trout (44 m³/s and 78 m³/s, respectively) and hybrids (76 m³/s and 110 m³/s, respectively)
were significantly lower (P < 0.001) than the mean river discharges (310 m³/s and 293
m³/s, respectively) during the migration and spawning start of cutthroat trout (Table 5).
Similarly, mean river temperatures during the migration and spawning start of rainbow
trout (8.1 ºC and 8.7 ºC, respectively) were significantly colder (P < 0.001) than the mean
river temperatures (11.3 ºC and 13.1 ºC) during the migration and spawning start of
cutthroat trout (Table 5). Mean river temperature during the mean migration start date of
hybrids was not significantly different from cutthroat trout, but mean river temperature

35
during the spawning start of hybrids (9.5 ºC) was significantly colder (P < 0.001) than the
mean river temperature during the spawning start of cutthroat trout (Table 5). No
significant differences existed between the mean river discharges or temperatures during
the migration or spawning start dates of rainbow trout and hybrids. The mean spawning
area temperature during cutthroat trout spawning start (N = 33) was 11.3 ºC. Sample
sizes of water temperatures collected within spawning areas during the spawning start of
rainbow trout (N = 2) and hybrids (N = 6) were insufficient to calculate a representative
mean for these taxa. These taxa spawned primarily before thermographs were installed
or in spawning areas where thermographs were not installed.
Figure 10. Annual migration start date ranges of taxa compared to the Yellowstone River hydrograph and thermograph at Livingston, 2001 through 2003.
Dis
char
ge (m
3 /s )
0
200
400
600
800
Tem
pera
ture
(C)
0
10
20
30
M M JJ AA S O N D J F M M JJA2001 2002 2003
M M JJ AA S O N D J F
DischargeWater Temperature Rainbow troutHybridCutthroat trout

36
Table 5. Mean daily discharge and temperature of the Yellowstone River at Livingston during migration and spawn start dates of rainbow trout (N = 15), hybrids (N = 14), and cutthroat trout (N = 44), 2001 through 2003.
Rainbow trout Hybrids Cutthroat trout
Variable Mean Range Mean Range
Mean Range P River discharge (m³/s) during migration start
44 31-106 76 31-206 310 50-702 < 0.001
River temperature (ºC) during migration start
8.1 6.1-11.7 9.7 5.5-18.7 11.3 7.3-19.8 < 0.001
River discharge (m³/s) during spawn start
78 31-450 110 31-242 293 75-702 < 0.001
River temperature (ºC) during spawn start
8.7 6.1-11.7 9.5 5.5-18.7 13.1 7.5-20.0 < 0.001

37
Spatial versus temporal assessment
Spatial distributions of spawning of rainbow trout and hybrids versus cutthroat
trout within the five most-used spawning areas were more similar than temporal
distributions. All three taxa primarily used the same spawning reaches (Figure 11), but
most rainbow trout and hybrids spawned in April and May and had left spawning areas
before most cutthroat trout began spawning in June. Similarly, annual or aggregated
spawning-period overlap index values between rainbow trout and hybrids individually or
combined versus cutthroat trout were less than spawning-reach overlap index values
(Figure 12). In contrast, spawning-period overlap values were greater than spawning-
reach overlap values for all years between rainbow trout and hybrids.
Genetic testing
Rainbow trout introgression was not detected in three of four spawning
aggregations of putative Yellowstone cutthroat (Table 6). Rainbow trout introgression
(2%) was detected in the Cedar Creek spawning aggregation, where one fish was
identified in the field as a hybrid and two fish had nonnative PINE markers. DNA
fragments representative of westslope cutthroat trout were detected in three of four
spawning aggregations. Genetic compositions of spawning aggregations were 97.5% to
100% Yellowstone cutthroat trout.

38
Figure 11. Comparison of spawning reaches versus spawning periods of radio-tagged fish during within the five most-used spawning areas of the Yellowstone River drainage, 2001 to 2003. Each line connecting symbols represents a spawning reach of an individual fish. Symbols within each line represent relocation points. Pine Creek Side Channel fish were assumed to have entered the side channel from either upriver or downriver, depending on their previous relocation positions in the main channel.
April May June July
Pine CreekSide Channel
Wat
erw
ay K
ilom
eter
0.0
0.5
1.0
1.5
2.0
April May June July
Mulherin Creek
Wat
erw
ay K
ilom
eter
0
1
2
3
4
April May June July
Mill Creek
0
2
4
6
8
10
12
14
Depuy's Spring Creek
0
1
2
3
4
5
6
Rainbow troutHybridCutthroat trout
April May June July
GreeleyCreek
Wat
erw
ay K
ilom
eter
0.0
0.5
1.0
1.5
April May June July

39
Figure 12. Spawning-reach overlap index values versus spawning-period overlap index values by year and for all years combined. Taxa pair symbols increase in size with year from 2001 through 2003 and solid symbols represent all years combined. The dashed diagonal line indicates equal temporal and spatial overlap. Points below the line indicate greater temporal overlap than spatial overlap, whereas points above the line indicate greater temporal than spatial overlap between a taxa combination. The vertical distance of a point from the diagonal line indicates the magnitude of difference between the two overlap values.
Spawning-reach overlap
0.0 0.2 0.4 0.6 0.8
Spaw
ning
-per
iod
over
lap
0.0
0.2
0.4
0.6
0.8
Rainbow trout vs. hybridRainbow trout vs. cutthroat troutHybrid vs. cutthroat troutRainbow trout and hybrid vs. cutthroat trout

40
Table 6. Genetic compositions of cutthroat trout spawning aggregations, as determined by PINE, from four tributaries in 2003. The number of individuals in a sample is N. The genetic composition of the samples is indicated as a percentage of cutthroat trout, rainbow trout, or other (either a false-positive or a true-positive DNA fragment for westslope cutthroat trout).
Genetic Percentage Individuals with non-
native markers
Stream N Cutthroat
trout Rainbow
trout Other Rainbow
trout Other
Mulherin 20 99.2 0.0 0.8 0 1 Cedar 24 97.5 2.0 0.5 1 1 Big 18 100 0.0 0.0 0 0 Greeley 16 99.2 0.0 0.8 0 1

41
DISCUSSION
Temporal separation and spatial overlap
Differences in time of spawning among salmonids may prevent genetic and
ecological interactions (Heggberget et al. 1988; Quinn et al. 2000; Mackey et al. 2001).
Migration and spawning dates of rainbow trout and hybrids were 5 to 9 weeks earlier
than cutthroat trout in the Yellowstone River and 2 to 4 weeks earlier in the South Fork
Snake River (Henderson et al. 2000). Introgressive hybridization from earlier spawning
rainbow trout or hybrids may be low because spawning-period overlap was low between
rainbow trout and hybrids versus cutthroat trout in the Yellowstone River. For example,
no fluvial rainbow trout and only two hybrids were collected during sampling of putative
cutthroat trout spawning aggregations during June and July. In South Fork Snake River
tributaries, Yellowstone cutthroat trout migrated four to six weeks after fish with rainbow
trout alleles had stopped migrating (Host 2003).
Yellowstone cutthroat trout spawn from late April through early August, depending
on latitude, altitude, water temperature, and runoff conditions (Gresswell and Varley
1988). Fluvial and adfluvial fish appear to have similar timing throughout the
Yellowstone River drainage. I observed cutthroat trout spawning from April 27 to
August 14, a range that others have observed spawning in this area. Cutthroat trout
spawning peaked from late June or early July in a mountain stream (Byorth 1990) and
spawning occurred from early June until late July in a spring creek (Roberts 1986).
Upriver of my study area, cutthroat trout began spawning in the Yellowstone River outlet
of Yellowstone Lake from May 23 to June 16 (mean = June 4) with durations of 30 to 45

42
days (mean = 37 d) (Kaeding and Boltz 2001). Mean date of peak spawning in 27
tributaries of Yellowstone Lake ranged from May 23 to July 3 with a mean of June 10
(Gresswell et al. 1997). Cutthroat trout spawned from April 30 to July 10 (median
spawning date of June 9) in the South Fork Snake River (Henderson et al. 2000).
The spawning time distributions of introduced rainbow trout in Intermountain
West rivers have earlier peak and end dates than Yellowstone cutthroat trout. I observed
rainbow trout spawning from April 4 through June 12. Fluvial rainbow trout spawned
from early April through mid June in the Bighorn River (Sanborn 1990), from March
through May in the Missouri River (Spoon 1985), from late March through early June
(median spawn dates of April 30 and May 1) in the Madison River (Downing et al. 2002),
and from early April through mid July (median spawn date of May 19th) in the South
Fork Snake River (Henderson et al. 2002). Rainbow trout typically spawn during spring
along the Pacific Coast of northern California, where many of the hatchery stocks for the
species originated (Fausch et al. 2001).
Differences in timing of spawning could be related to different responses to
environmental conditions for migration and spawning (Quinn and Adams 1996).
Rainbow trout spawn during stable flow periods within their native range (Fausch et al.
2001) and introduced rainbow trout may spawn during similar conditions, prior to the
spring peak in the hydrograph (Downing et al. 2002). Accordingly, all rainbow trout and
93% of hybrids migrated prior to the annual peak of runoff in the Yellowstone River
when river temperatures had yet to warm considerably. In contrast, I observed 84% of
cutthroat trout migrating during or after the annual peak in the hydrograph, at higher

43
discharges and warmer temperatures than rainbow trout and hybrids. Spawning cutthroat
trout generally move to spawning areas as water temperature rises and discharge
decreases after the spring runoff peak (Thurow 1982; Byorth 1990). Ninety-two percent
of cutthroat trout spawning migrations into Clear Creek, a tributary of Yellowstone Lake,
occurred after the peak discharge of the creek during ten years between 1979 and 1991
(Gresswell et al. 1997). Cutthroat trout migration during the descending limb of the
hydrograph may be an adaptation to migrate when the greatest amount of spawning
habitat is accessible (Gresswell 1995; Schmetterling 2001).
Species that segregate by breeding in response to different environmental
conditions may continue to do so if those conditions are maintained, whereas greater
overlap, interaction, and hybridization may occur when conditions are modified (Hubbs
1955; Carlson et al. 1985). Dams regulate the timing and magnitude of the flow regimes
of most mainstem rivers where Yellowstone cutthroat trout no longer co-exist with
rainbow trout (May et al. 2003), except in the regulated South Fork Snake River
(Henderson et al. 2000). If rainbow trout, hybrids, and cutthroat trout respond to
different river discharges and temperatures to begin migration and spawning, then the
unregulated flows of the Yellowstone River may provide a hydrologic regime that
maintains temporal reproductive separation. The degree of temporal separation between
rainbow trout and hybrids and cutthroat trout may vary annually depending on the river
hydrograph and thermograph. Spawning occurred 1-2 weeks earlier in Cedar Creek in
1988 than in 1989, probably in response to water temperature warming faster in 1988
(Byorth 1990). Water temperatures likely warmed sooner in the creek because discharge

44
had peaked earlier, as potentially indicated by the peak mean daily discharge for the
Yellowstone River occurring 11 days earlier in 1988 than 1989. Earlier discharge peaks
may indicate that cutthroat trout will migrate and spawn earlier (Thurow 1982),
increasing the likelihood of overlap with earlier spawning rainbow trout and hybrids.
However, spawning-period overlap between rainbow trout and hybrids in the 2001, the
year with the earliest annual river peak, was similar or greater than the overlap observed
in 2002 and 2003 when the annual peaks in the river hydrograph occurred 17 to 18 days
later.
In contrast to the low level of temporal reproductive overlap, all three taxa
spawned in the same places in the Yellowstone River drainage. Five spawning areas in
the study area were used by 62% of all radio-tagged fish that spawned. Spatial
reproductive overlap of the three taxa occurred primarily in tributaries in the Yellowstone
River, whereas the three taxa overlapped within mainstem locations of the South Fork
Snake River (Henderson et al. 2000). Some spawning areas were used exclusively by a
low number of individuals of the same taxon in the Yellowstone River drainage.
However, the majority of spawning areas used by a single radio-tagged taxon were used
by cutthroat trout, which may be attributable to the greater number of this taxon that was
radio-tagged and subsequently spawned versus either rainbow trout or hybrids. As
initially hypothesized, rainbow trout spawned in side channels to a greater extent than
cutthroat trout, but spatial overlap occurred because one side channel (Pine Creek) was
used by all three taxa.

45
Habitat constriction may increase hybridization (Leary et al. 1995). No
separation was observed among taxa within Yellowstone River tributaries, whereas
separation of the same taxa was documented within one tributary of the South Fork Snake
River (Henderson et al. 2000). Limited availability of spawning habitat among and
within Yellowstone River tributaries may cause high spawning-area and -reach overlap.
Irrigation water diversion occurs in almost all Yellowstone River tributaries and many are
inaccessible to spawning fluvial trout because of dewatering of their lower reaches
(Clancy 1988). Inaccessibility of most potential spawning tributaries forces spawning
adults to concentrate in the few remaining accessible tributaries. Dewatering of
Yellowstone River tributaries led Clancy (1988) to classify only a few tributaries as high-
quality spawning areas for cutthroat trout in the 1980s. These were the same tributaries
that were used for spawning by radio-tagged fish during my study. Spawning habitat
may also be limited within the accessible tributaries. For example, radio-tagged fish
moved upstream to nearly the maximum extent possible in Greeley, Depuy’s Spring
(temporary barrier from beaver dam), Mill, Cedar, Mulherin, Reese, and Lava creeks (the
only tributary of a tributary used for spawning). In these, radio-tagged fish migrated to
about the full extent upstream to natural barriers, i.e., waterfalls and cascades, except in
Mill and Reese creeks. In these two creeks, barriers constructed to prevent rainbow trout
introgression of resident headwater populations limit the accessible extent for migratory
fish.
Several study design factors may have affected estimates of spatial and temporal
reproductive overlap. Spatial overlap may have been underestimated because of the

46
unequal numbers of taxa that were radio-tagged. Higher spatial overlap would be
expected if all three taxa had been radio-tagged in equal numbers, given that high
spawning-area and spawning-reach overlap was exhibited among taxa with unequal
numbers. However, my conclusion of high spatial overlap would be strengthened by this
possible bias. Conversely, spatial overlap could have been overestimated because I could
not precisely estimate the actual length of stream used for spawning by all individual fish.
However, I believe this potential bias did not affect my conclusions because spawning
activity was noted throughout individual spawning reaches, spawning areas were used to
a limited extent, and salmonids can spawn in multiple locations with multiple partners
(Brown and Mackay 1995; Schmetterling 2001; Taggart et al. 2001). Temporal overlap
could have been overestimated between rainbow trout with either hybrids or cutthroat
trout, because early spawning rainbow trout may not have been adequately represented
by radio-tagged fish. There was evidence that some rainbow trout may have begun
migrating to spawning areas prior to initiation of radio-tagging. Fluvial rainbow trout
migrated into Mill Creek in mid March (Tohtz 2003) and prior to this time during all
years only 14% of rainbow trout were radio-tagged. In addition, Nelson and Depuy’s
spring creeks may support spawning rainbow trout in late winter (Roberts 1986; Shepard
1992) and this time period was not included in this study. These fish may be descendants
of a past stocking of the Arlee hatchery strain of rainbow trout that was cultured for fall
spawning (B. Shepard, Montana Department of Fish, Wildlife and Parks, personal
communication).
47
Hybrid spawning times overlapped more with rainbow trout than cutthroat trout,
whereas hybrid spawning areas and reaches overlapped more with cutthroat trout.
Similarly, spawning times of hybrids are nearer to rainbow trout than to cutthroat trout in
the South Fork Snake River (Henderson et al. 2000). Therefore, hybrids may be more
likely to interbreed with rainbow trout, potentially averting a potential source of rainbow
trout alleles from cutthroat trout. For example, genetically tested putative rainbow trout
and hybrids were likely post-F1 hybrids, indicating repeated interbreeding of hybrids with
rainbow trout. However, rainbow trout x cutthroat trout hybrids may be vectors of
introgression of cutthroat trout populations (Hitt et al. 2003). Hybrids, more so than
rainbow trout, overlapped cutthroat trout spawning locations and times in the
Yellowstone River drainage. For example, radio-tagged hybrids were observed spawning
within the same tributaries at the same time as radio-tagged cutthroat trout.
Mitochondrial DNA testing of hybrids indicates that females of both rainbow trout and
cutthroat trout may hybridize (Henderson et al. 2000) and that backcross hybrids are
produced from male hybrids mating with pure females (Young et al. 2001). Longer mean
spawn periods of cutthroat trout males versus females may indicate that male cutthroat
trout may have a greater probability of mating with hybrid females, rather than the
reciprocal combination. However, low numbers of hybrid females spawned in my study
and therefore prevented a meaningful sample to test for gender differences of spawning
variables within this taxon.

48
Genetic testing
Genetic confirmation of hybridization, or lack thereof, for an individual organism
is limited by the number of available diagnostic markers (Boeklen and Howard 1997).
Some hybridized individuals that are genetically tested will only show diagnostic markers
for a single taxon, because of the random reshuffling of alleles during sexual
reproduction (Allendorf et al. 2001). The relatively low incidence of DNA fragments
diagnostic for rainbow trout in fish I identified as Yellowstone cutthroat trout could be
related to my ability to correctly identify Yellowstone cutthroat trout or the relatively
limited power of genetic tests, or both. Ninety-five percent of the subsample of radio-
tagged Yellowstone cutthroat trout had no detectable rainbow trout markers, which was
comparable to other samples of putative cutthroat trout from the Yellowstone River
(Leary 1983; Tohtz 1999). Rainbow trout markers were not detected in 76 (99%) of 77
individual putative cutthroat trout in spawning aggregations. The presence of two radio-
tagged cutthroat trout in spawning aggregations with no rainbow trout introgression
provides further evidence that the radio-tagged cutthroat trout might not have been
hybridized.
Hybridization between taxa likely includes a wide range of recombinants (Barton
and Hewitt 1985). If most putative rainbow trout and hybrids were later-generation
hybrids, then these two taxa could be considered a single group. Spatial and temporal
reproductive overlap of cutthroat trout was assessed versus rainbow trout and hybrids
together, because these fish both have potential rainbow trout alleles. However,
phenotypic identification may have allowed for a more refined distinction in degree of

49
hybridization because hybrids had different spawning times and places than rainbow
trout.
Genetic testing of Yellowstone cutthroat trout spawning aggregations sampled
during the latter part of the cutthroat trout spawning period showed little or no evidence
of rainbow trout introgression. However, rainbow trout introgression of cutthroat trout
spawning aggregations may be higher during the earlier periods of cutthroat trout
spawning because of late-spawning hybrids. Putative rainbow trout spawning
aggregations should also be sampled to assess hybridization and introgression. Cutthroat
trout introgression of rainbow trout populations may be high because of the high
temporal overlap of hybrids with rainbow trout.
PINE fragments resembling those for westslope cutthroat trout were found in
three of four spawning aggregations of Yellowstone cutthroat trout and one radio-tagged
hybrid. These fragments may indicate that westslope cutthroat trout from a historical
stocking introgressed with Yellowstone cutthroat trout, or these fragments may actually
be non-diagnostic for westslope cutthroat trout. The future threat of westslope cutthroat
trout introgressive hybridization with Yellowstone cutthroat trout is low because parental
types of westslope cutthroat trout are not known to exist within the Yellowstone River.
Status of radio-tagged fish
Surgery mortality percentages were about the same among taxa, whereas cutthroat
trout had higher pre-spawn mortality than the other two taxa. Cutthroat trout had the
longest pre-spawning period for a taxon and this likely accounts for the higher pre-
spawning mortality of cutthroat trout versus the other two taxa. Despite high pre-

50
spawning mortality, there were greater numbers of cutthroat trout alive during the start of
the spawning period versus the other taxa because a greater number of cutthroat trout
were radio-tagged.
High apparent mortality of radio-tagged fish after surgeries and spawning was
similar to that observed in other studies. The combined percentage of surgery and pre-
spawn mortality (18%) was comparable to that among the same taxa in the South Fork
Snake River (22%; Henderson et al. 2000). About one-third of the surgery and pre-
spawn mortality occurred within the Corwin Springs section of the Yellowstone River in
2001. An irregularity during surgeries, e.g., ineffective procedures or contaminated
equipment is suspected. I found spawning mortality of cutthroat trout (59%) that was
higher than the 13-48% reported by Gresswell (1995), but my observed rainbow trout
spawning mortality (60%) was similar to estimates of 43 to 84% by Hartman et al.
(1962). My estimates of spawning mortality may be high, because transmitter expulsion
can occur without subsequent mortality or morbidity (Lucas 1989; Chisholm and Hubert
1985). Three transmitters that were in cutthroat trout were recovered in or near redds,
potentially indicating expulsion during spawning.
Radio transmitters may increase the predation risk of a fish (Adams et al. 1998).
Predation was indicated for 15% of the radio tagged fish in this study, mostly from birds.
Antennas were about 1.1 times the average length of radio-tagged fish and trailed an
average of 27 cm past the caudal fin. The plastic coated antenna may have allowed
radio-tagged fish to be more easily seen or captured by predators.

51
Migratory trout may spawn in alternate years (Gresswell 1995). This may
account for the twenty-four percent of radio-tagged fish that did not migrate to spawn
during this study. Alternate year spawning was suggested for cutthroat trout in the
Yellowstone River because the average growth of cutthroat trout is slower for fish that
spawn in consecutive years versus the cutthroat trout population as a whole (Clancy
1987).
Management implications
Temporal reproductive separation may be facilitated by management actions that
maintain and extend tributary conditions for cutthroat trout to spawn later than either
rainbow trout or hybrids. These management actions may include water leases, diversion
screening, selective barriers, and stream closure regulations.
Water rights leases on Mulherin, Cedar, Big, Mill, and Locke creeks are held by
the Montana Department of Fish, Wildlife, and Parks. Leases are intended to maintain
instream flows levels for fluvial cutthroat trout spawning and the emergence and
outmigration of their offspring (Hennessey 1998). Water is leased from April or May
through October. The critical time for the leases occurs when peak irrigation demands
are greatest, typically June through August when cutthroat trout are spawning or eggs are
incubating. Continuation of water leases on these streams, or the addition of water leases
on other streams, would continue or expand the opportunities for later spawning and
incubating cutthroat trout.
Preventing fish entrainment into tributary irrigation diversions would allow more
cutthroat trout adults and fry to successfully emigrate from tributaries. Entrainment of

52
radio-tagged trout, in addition to untagged fluvial fish, was observed in four different
tributary diversions. All fish were likely entrained when they attempted to migrate back
to the Yellowstone River after spawning. Entrainment rates ostensibly increase as the
amount of water diverted increases and stream runoff decreases during the summer.
Diversion screening would provide increased downstream passage of fluvial fish,
especially during the summer when cutthroat trout are spawning and their fry are
outmigrating.
Installation of fish barriers and selective passage of only cutthroat trout above the
barriers have shown promise of reducing introgression between rainbow trout and
Yellowstone cutthroat trout within tributaries of the South Fork Snake River (Host 2003).
Similarly, weirs could be used on Yellowstone River tributaries to prevent upstream
passage of earlier spawning rainbow trout and hybrids and then pass later spawning
cutthroat trout. Issues that need to be addressed when considering the feasibility of such
actions include weir construction and effectiveness, artificial selection of genotypes
based on phenotypic criteria, and genetic composition of resident trout upstream of the
barrier site (Host 2003).
Private lands and the waterways that run through them are critical to spawning
habitat for migratory fishes. Eighty-nine percent (65 of 73) of radio-tagged fish spawned
in waterways that were within privately-owned lands. Cooperative partnerships with
private land owners will be required for water leasing, diversion screening, and selective
barrier sites.

53
Yellowstone River tributaries in the study area are closed to fishing from
November 30 until the third Saturday in May. This closure covers the majority of time
when rainbow trout and hybrids are spawning but allows catch-and-release fishing when
cutthroat trout are spawning in tributary streams. Although tributary streams receive
relatively low angling pressure compared to the mainstem river, angling may disrupt
spawning and illegal take of cutthroat trout may occur by anglers unable to differentiate
between species (Schmetterling 2001). However, longer stream closures may need to be
balanced against the possibility of opening streams earlier in the year to promote harvest
of rainbow trout and hybrids.
Resistance of a native taxon to hybridization does not preclude its displacement
(Utter 2001) and hybridization may increase if introduced fish increase and the native
taxon continues to decline (Hubbs 1955; Krueger and May 1991). Rainbow trout are
currently the most abundant trout in the Yellowstone River. If rainbow trout continue to
increase and cutthroat trout further decline then hybridization may increase. Therefore,
hybridization and introgression between rainbow trout and cutthroat trout within
spawning aggregations should be monitored to determine the effectiveness of
management actions and long-term trends. Systematic sampling of key spawning
aggregations every 5 to 10 years may detect changes in hybridization and introgression.

54
LITERATURE CITED Adams, N. S., D. W. Rondorf, S. D. Evans, J. E. Kelly, and R. W. Perry. 1998. Effects of
surgically and gastrically implanted radio transmitters on swimming performance and predator avoidance of juvenile chinook salmon. Canadian Journal of Fisheries and Aquatic Sciences 55:781-787.
Allendorf, F. W., and R. F. Leary. 1988. Conservation and distribution of genetic
variation in a polytypic species, the cutthroat trout. Conservation Biology 2:170-184.
Allendorf, F. W., R. F. Leary, P. Spruell, and J. K. Wenburg. 2001. The problems with
hybrids: setting conservation guidelines. Trends in Ecology and Evolution 16:613-622.
Allendorf, F. W., R. F. Leary, N. P. Hitt, K. L. Knudsen, L. L. Lundquist, and P. Spruell.
2003. Intercrosses and the U.S. Endangered Species Act: should hybridized populations be included as westslope cutthroat trout? Division of Biological Sciences, University of Montana, Missoula, submitted to U.S. Fish and Wildlife Service, Bozeman, Montana.
Barton, N. H., and G. M. Hewitt. 1985. Analysis of hybrid zones. Annual Review of
Ecology and Systematics 16:113-148. Behnke, R. J. 1992. Native trout of western North America. American Fisheries Society,
Monograph 6, Bethesda, Maryland. Boeklen, W. J., and D. J. Howard. 1997. Genetic analysis of hybrid zones: number of
markers and power of resolution. Ecology 78:2611-2616. Brown, R. S., and W. C. Mackay. 1995. Spawning ecology of cutthroat trout
(Oncorhynchus clarki) in the Ram River, Alberta. Canadian Journal of Fisheries and Aquatic Science 52:983-992.
Brown, R. S., S. J. Cooke, W. G. Anderson, and R. S. McKinley. 1999. Evidence to
challenge the “2% Rule” for biotelemetry. North American Journal of Fisheries Management 19:867-871.
Byorth, P. A. 1990. An evaluation of Yellowstone cutthroat trout production in three
tributaries of the Yellowstone River. Master’s thesis, Montana State University, Bozeman.

55
Carlson, D. M., W. L. Pflieger, L. Trial, and P. S. Haverland. 1985. Distribution, biology and hybridization of Scaphirhynchus albus and S. platorynchus in the Missouri and Mississippi rivers. Environmental Biology of Fishes 14:51-59.
Chisholm, I. M., and W. A. Hubert. 1985. Expulsion of dummy transmitters by rainbow
trout. Transactions of the American Fisheries Society 114:766-767. Clancy, C. G. 1987. Southwest Montana fisheries investigations, inventory and survey of
waters of the project area. Progress report for Federal Aid Project F-9-R-35. Montana Department of Fish, Wildlife and Parks, Bozeman, Montana.
Clancy, C. G. 1988. Effects of dewatering on spawning by Yellowstone cutthroat trout in
tributaries to the Yellowstone River, Montana. Pages 37-41 in R.E. Gresswell, editor. Status and management of interior stocks of cutthroat trout. American Fisheries Society, Symposium 4, Bethesda, Maryland.
Downing, D. C., T. E. McMahon, and B. L. Kerans. 2002. Relation of spawning and
rearing life history of rainbow trout and susceptibility to Myxobolus cerebralis infection in the Madison River, Montana. Journal of Aquatic Animal Health 14:191-203.
Efron, B., and R. Tibshirani. 1993. An introduction to the bootstrap. Chapman and Hall,
New York, New York. Epifanio, N. C., and J. Nielsen. 2001. The role of hybridization in the distribution,
conservation and management of aquatic species. Reviews in Fish Biology and Fisheries 10:245-251.
Environmental Systems Research Institute, Inc. 1999. ArcView GIS software: release
3.2. Environmental Systems Research Institute, Inc, Redlands, California. Fausch, K. D., Y. Taniguchi, S. Nakano, G. D. Grossman, and C. R. Townsend. 2001.
Flood disturbance regimes influence rainbow trout invasion success among five holoarctic regions. Ecological Applications 11:1438-1455.
Gresswell, R. E. and J. D. Varley. 1988. Effects of a century of human influence on the
cutthroat trout of Yellowstone Lake. Pages 45-52 in R. E. Gresswell, editor. Status and management of interior stocks of cutthroat trout, American Fisheries Society, Symposium 4, Bethesda, Maryland.
Gresswell, R. E. 1995. Yellowstone cutthroat trout. Pages 36-54 in M. K. Young, editor.
Conservation assessment for inland cutthroat trout. U. S. Forest Service General Technical Report RM-GTR-256.

56
Gresswell, R. E., W. J. Liss, G. L. Larson, and P. J. Bartlein. 1997. Influence of basin-
scale physical variables on life history characteristics of cutthroat trout in Yellowstone Lake. North American Journal of Fisheries Management 17:1046-1064.
Hartman, G. F., T. G. Northcote, and C. C. Lindsey. 1962. Comparison of inlet and outlet
spawning runs of rainbow trout in Loon Lake, British Columbia. Journal of the Fisheries Research Board Canada 19:173-200.
Heggberget, T. G., T. Haukebø, J. Mork, and G. Stahl. 1988. Temporal and spatial
segregation of spawning in sympatric populations of Atlantic salmon, Salmo salar L., and brown trout, Salmo trutta L. Journal of Fish Biology 33:347-356.
Henderson, R., J. L. Kershner, and C. A. Toline. 2000. Timing and location of spawning
by nonnative wild rainbow trout and native cutthroat trout in the South Fork Snake River, Idaho, with implications for hybridization. North American Journal of Fisheries Management 20:584-596.
Hennessey, L. A. 1998. An evaluation of Yellowstone cutthroat trout fry recruitment
related to water leases on four tributaries of the Yellowstone River. Master’s thesis, Montana State University, Bozeman.
Hitt, N. P., C. A. Frissel, C. C. Muhlfeld, and F. A. Allendorf. 2003. Spread of
hybridization between native westslope cutthroat trout, Oncorhynchus clarki lewisi, and nonnative rainbow trout, Oncorhynchus mykiss. Canadian Journal of Fisheries and Aquatic Science 60:1440-1451.
Host, S. A. 2003. Reducing introgression with the use of a barrier in tributaries of the
South Fork Snake River, Idaho. Master’s thesis. University of Idaho, Moscow. Hubbs, C. L. 1955. Hybridization between fish species in nature. Systematic Zoology
4:1-20 Kaeding, L. R., and G. D. Boltz. 2001. Spatial and temporal relations between fluvial and
allacustrine Yellowstone cutthroat trout, Oncorhynchus clarki bouvieri, spawning in the Yellowstone River, outlet of Yellowstone Lake. Environmental Biology of Fishes 61:395-406.
Kanda, N., R. F. Leary, P. Spruell, and F. W. Allendorf. 2002. Molecular genetic
markers identifying hybridization between Colorado River-greenback cutthroat trout complex and Yellowstone cutthroat trout or rainbow trout. Transactions of the American Fisheries Society 131:312-319.

57
Krueger, C. C., and B. May. 1991. Ecological and genetic effects of salmonid introductions in North America. Canadian Journal of Fisheries and Aquatic Sciences 48 (supplement 1):66-77.
Leary, R. F. 1983. Letter to Chris Clancy; electrophoretic results obtained from sample of
Salmo collected November 1, 1983 from the Yellowstone River. Department of Zoology, University of Montana, Missoula.
Leary, R. F., F. W. Allendorf, S. R. Phelps, and K. L. Knudsen. 1984. Introgression
between westslope cutthroat trout and rainbow trout in the Clark Fork River drainage. Proceedings of the Montana Academy of Science 43:1-18.
Leary, R. F., F. W. Allendorf, and K. L. Knudsen. 1989. Genetic divergence among
Yellowstone cutthroat trout populations in the Yellowstone River drainage, Montana: update. Population genetics laboratory report 89/2. Division of Biological Sciences, University of Montana, Missoula.
Leary, R. F., F. W. Allendorf, and G. K. Sage. 1995. Hybridization and introgression
between introduced and native fish. Pages 91-101 in H. L. Schramm, Jr., and R. G. Piper, editors. Uses and effects of cultured fishes in aquatic ecosystems. American Fisheries Society, Symposium 15, Bethesda, Maryland.
Leary, R. F., W. R. Gould, and G. K. Sage. 1996. Success of basibranchial teeth in
indicating pure populations of rainbow trout and failure to indicate pure populations of westslope cutthroat trout. North American Journal of Fisheries Management 16:210-213.
Lucas, M. C. 1989. Effects of implanted dummy transmitters on mortality, growth, and
tissue reaction in rainbow trout, Salmo gairdneri Richardson. Journal of Fish Biology 35:577-587.
Mackey, G., J. E. McLean, and T. P. Quinn. 2001. Comparisons of run timing, spatial
distribution, and length of wild and newly established hatchery populations of steelhead in Forks Creek, Washington. North American Journal of Fisheries Management 21:717-724.
May, B., W. Urie, and B. B. Shepard. 2003. Range-wide status of Yellowstone cutthroat
trout (Oncorhynchus clarki bouvieri): 2001. Yellowstone Cutthroat Trout Interagency Coordination Group, Bozeman, Montana.
Minitab. 2000. Minitab Statistical Software: release 13.1. Minitab, State College,
Pennsylvania

58
Montana National Resource Information System. Geographic Information Systems (GIS). Major streams – 1:100,000 scale. Available: http://nris.state.mt.us. (March 2004).
Neter, J., M. H. Kutner, C. J. Nachtsheim, and W. Wasserman. 1996. Applied linear
statistical models. 4th Edition. McGraw-Hill. United States. Northcote, T. G. 1997. Potamodramy in Salmonidae – living and moving in the fast lane.
North American Journal of Fisheries Management 17:1029-1045. Olsen, J. B., S. E. Merkouris, J. E. Seeb. 2002. An examination of spatial and temporal
genetic variation in walleye pollock (Theragra chalcogramma) using allozyme, mitochondrial DNA, and microsatellite data. Fishery Bulletin 100:752-764.
Pianka, E. R. 1973. The structure of lizard communities. Annual Review of Ecology and
Systematics 4:53-74. Quinn, T. P., and D. J. Adams. 1996. Environmental changes affecting the migratory
timing of American shad and sockeye salmon. Ecology 77:1151-1162. Quinn, T. P., M. J. Unwin, and M. T. Kinnison. 2000. Evolution of temporal isolation in
the wild: genetic divergence in timing of migration and breeding by introduced chinook salmon populations. Evolution 54: 1372-1385.
R Development Core Team. 2004. R: A language and environment for statistical
computing. R Foundation for Statistical Computing. Vienna, Austria. Available: http://www.R-project.org. (May 2004).
Roberts, B. C. 1986. Potential influence of recreational use on Nelson Spring Creek.
Master’s thesis. Montana State University, Bozeman. Sanborn, B. W. 1990. The ecology of rainbow trout in the Bighorn River. Master’s thesis.
Montana State University, Bozeman. Schmetterling, D. A. 2001. Seasonal movements of fluvial westslope cutthroat trout in
the Blackfoot River Drainage, Montana. North American Journal of Fisheries Management 21:507-520.
Shepard, B. B. 1992. Fisheries of the upper Yellowstone River including tributary
recruitment: report for years 1989, 1990, and 1991. Progress report for Federal Aid Project F-46-R-2, 3, and 4. Montana Department of Fish, Wildlife and Parks, Bozeman, Montana.

59
Spoon, R. L. 1985. Reproductive biology of brown trout and rainbow trout below Hauser Dam, Missouri River, with reference to proposed hydroelectric peaking. Master’s thesis. Montana State University, Bozeman.
Spruell, P., M. L. Bartron, N. Kanda, and F. W. Allendorf. 2001. Detection of hybrids
between bull trout (Salvelinus confluentus) and brook trout (Salvelinus fontinalis) using PCR primers complementary to interspersed nuclear elements. Copeia 2001:1093-1099.
Swanberg, T. R. 1997. Movements of and habitat use by fluvial bull trout in the
Blackfoot River, Montana. Transactions of the American Fisheries Society 126:725-746.
Swanberg, T. R., D. A. Schmetterling, and D. H. McEvoy. 1999. Comparison of surgical
staples and silk sutures for closing incisions in rainbow trout. North American Journal of Fisheries Management 19:215-218.
Taggart, J. B., I. S. McLaren, D. W. Hay, J. H. Webb, and A. F. Youngson. 2001.
Spawning success in Atlantic salmon (Salmo salar L.): a long-term DNA profiling-based study conducted in a natural stream. Molecular Ecology 10:1047-1060.
Thurow, R. F. 1982. Blackfoot River fishery investigations. Idaho Department of Fish
and Game, Federal Aid in Sport Fish Restoration, Job Completion Report, Project F-73-R-3, Boise.
Tohtz, J. 1999. Fisheries investigations in the Yellowstone and Shields rivers basins, Park
County, Montana: Annual progress reports for 1999. Progress report for Federal Aid Project F-78-R-4. Montana Fish, Wildlife and Parks, Bozeman, Montana.
Tohtz, J. 2003. Fisheries investigations in the Yellowstone and Shields rivers basins, Park
County, Montana: Annual progress reports for 2003. Progress report for Federal Aid Project F-113-R-3. Montana Fish, Wildlife and Parks, Bozeman, Montana.
Trotter, P. C. 1989. Coastal cutthroat trout: a life history compendium. Transactions of
the American Fisheries Society 188:463-473. USFWS (U.S. Fish and Wildlife Service). 2001. 90-day finding for a petition to list
Yellowstone cutthroat trout as threatened. Federal Register 66: (23 February 2001) 11244-11249.
USGS (U.S. Geological Survey). Water Resources of Montana. Historical stream flow
data. Available: (http://mt.water.usgs.gov) (June 2004).

60
Utter, F. 2001. Patterns of subspecific anthropogenic introgression in two salmonid genera. Reviews in Fish Biology and Fisheries 10:265-279.
Weigel, D. E., J. T. Peterson, and P. Spruell. 2002. A model using phenotypic
characteristics to detect introgressive hybridization in wild westslope cutthroat trout and rainbow trout. Transactions of the American Fisheries Society 131:389-403.
Young, W. P., C. O. Ostberg, P. Keim, and G. H. Thorgaard. 2001. Genetic
characterization of hybridization and introgression between anadromous rainbow trout (Oncorhynchus mykiss irideus) and coastal cutthroat trout (O. clarki clarki). Molecular Ecology 10:921-930.