assessment of retinal vascular plexuses and
TRANSCRIPT
The Egyptian Journal of Hospital Medicine (January 2019) Vol. 74 (6), Page 1433-1447
1433
Received:23/10/2018
Accepted:12/11/2018
Assessment of Retinal Vascular Plexuses and Choriocapillaris in
Adult High Myopia Using Enhanced Depth Imaging Optical
Coherence Tomography Angiography Mohamed Anwar El-Massry, Hassan Metwaly Bayoumy, Atef Hassan Sayed Abdellatif*
Ophthalmology Department, Faculty of Medicine, Al-Azhar University *Corresponding author: Atef Hassan Sayed Abdellatif, E-mail: [email protected], Mobile: (+20) 01272229060
ABSTRACT
Background: High myopia is a common eye health problem due to its sight threatening complications. Using
the newly introduced noninvasive devices, it’s easier now to assess the morphological, anatomical and
pathological changes accompanied with high myopia.
Objectives: The aim of this study was to assess retinal vascular plexuses and choriocapillaris density and
measuring the FAZ in the SCP & DCP with also assessment of central macular and subfoveal choroidal
thickness in high myopia in adults using enhanced depth imaging optical coherence tomography angiography.
Patients and Methods: This prospective observational study was carried out from June 2018 to November
2018 on 75 eyes of patients attending outpatient clinic of Ophthalmology department of Research Institute of
Ophthalmology in Giza.
Results: The best corrective visual acuity in the normal group was statistically significantly higher than the
Myope group. The Macular thickness in the normal group was statistically significantly higher than the Myope
group. The choroidal thickness in the normal group was statistically significantly higher than the Myope group.
The FAZ DCP in the Myope group was statistically significantly higher than the normal group.
Conclusion: The OCTA is certainly able to take over other invasive imaging techniques and new researches
using this device might be able to study different pathologies affecting the posterior segment.
Keywords: High myopia, OCTA, DCP
INTRODUCTION
High myopia is associated with a refractive
error of at least 6 D and/or axial length greater than
25.5 mm. The latter leads to mechanical stretching
and rarefaction of the retina and choroid resulting in
various complications such as peripheral retinal
degeneration, retinal tears, posterior staphyloma,
lacquer cracks and choroidal neovascularisation (1).
In addition to the previously mentioned
complications, affection of retinal and choroidal
circulation due to decreased vessels density and flow
will lead to defective nourishment of the posterior
pole (2).
Fundus Fluorescein Angiography and
Indocynine Green have long been regarded the
benchmark imaging modalities for evaluation of
high myopic eyes. They provide two dimensional
image sets that allow for dynamic visualisation of
blood flow with a wide field of view. However, some
major drawbacks for these 2 types of investigations
will limit their usage in studying retinal and
choroidal vascular changes in high myopic
patients(3).
Firstly, achieving a detailed image of the
deep retinal capillary plexus (DCP) and the
choriocapillaris with these imaging techniques is not
possible due to scattering of light by nerve fibre layer
and in case of FFA; leakage of fluorescein dye that
obscures detailed visualisation of deeper layers.
Secondly, these are invasive techniques, using
intravenous dye to obtain images which make them
time consuming and annoying for the patients
undergoing this procedure for follow up (4,5).
Moreover, nausea and allergic reactions may
develop due to repetitive usage of the dye while
indocynine green is contraindicated in pregnancy
and patients with kidneys disease (6).
The recently introduced OCTA incorporated
in EDI-OCT provided many implements that
revolutionized retinal imaging. OCTA is based on
the split-spectrum amplitude-decorrelation
angiography (SSADA) algorithm and Segmentation
algorithm (7).
The former is based on detecting the
reflectance amplitude variation of blood flow over
time to distinguish vessels from static tissue while
the latter produces transversal slices of the retinal
and choroidal layer at any depth(11).
Acquired images are then projected as
separate en-face image for each layer for evaluation.
Compared to the above mentioned techniques, it’s a
non invasive procedure using motion contrast
instead of IV dye, making it more reliable and
hazard-free for follow up patients with no fears of
adverse effects or contraindications. Also it is less
time consuming as, beside the fact that it is non
invasive, it takes few seconds to obtain images for
the vascular plexuses (12).
The superficial vascular network is
composed of long, horizontal arterioles and venules,
Assessment of Retinal Vascular Plexuses…
1434
originating from the superior and inferior arcades
around the foveal avascular zone. An arteriole is
easily differentiated from a venule because the
arterioles are surrounded by a wider capillary-free
zone. Arterioles and venules are connected by
transverse capillaries, forming an interconnected
plexus (12).
The deep capillary plexus, unlike the
superficial capillary plexus, was organized into
capillary vortexes, that is, radial convergence of
capillaries toward an epicentre.
The limits of each capillary vortex unit had
a polygonal shape. Vertical anastomoses are present
between the DCP and the SCP as small, slanted,
interconnected anastomoses between the superficial
and deeper vessels but with no explicit mention to
venous drainage (13).
The two capillary plexuses have a different
pattern. In the SCP, capillaries are arranged as
transverse capillaries forming an interconnected
plexus between arterioles and venules. In the DCP,
the pattern is completely different: the DCP is
composed of polygonal units, in which the
capillaries converged radially toward an epicenter
that is called capillary vortex(14).
AIM OF WORK
The aim of this study is to assess retinal
vascular plexuses and choriocapillaris density and
measuring the FAZ in the SCP & DCP with also
assessment of central macular and subfoveal
choroidal thickness in high myopia in adults using
enhanced depth imaging optical coherence
tomography angiography.
PATIENTS AND METHODS
This prospective observational study was
carried out from June 2018 to November 2018 on 75
eyes of patients attending outpatient clinic of
Ophthalmology department of Research Institute of
Ophthalmology in Giza.
The study was approved by the Ethics
Board of Al-Azhar University.
Patients were divided into two groups:
Group 1: 35 eyes of 18 patients with high myopia
ranging from -6 to -25 D.
Group 2: 40 normal healthy emmetrope eyes as a
control group.
Inclusion criteria
Tw
o groups of patients were included in this study; a
control group composed of 20 normal
individuals with no significant error of refraction
were compared to a study group of 20 patients with
high myopia more than - 6D.
Exclusion criteria
Patients with any retinal or choroidal disease
that might affect retinal vascular layers and/or the
choriocapillaris were excluded. Also the presence of
media opacities affecting quality of EDI OCT
images as: corneal opacities, dense cataract and
vitreous haemorrhage were excluded.
All study participants were submitted to:
1. Careful history taking to detect:
o Age of the patient.
o Mode of trauma if any.
o Previous ocular surgery (nature, date and place).
2. Full ophthalmological examination included:
A. BCVA measurement using Snellen’s chart with
conversion to log. MAR notation for statistical
analysis.
B. Anterior segment examination using slit lamp
biomicroscopy:
o Assessment of media clarity (cornea and
crystalline lens i.e. no corneal opacity or cataract).
o Excluding anterior segment diseases or surgeries
that could affect study results.
C. Intraocular pressure (IOP) measurement using
Goldmann applanation tonometer.
D. Posterior segment examination using binocular
indirect ophthalmoscope and indirect slit lamp
biomicroscopy (+90 volk lens) for detailed
evaluation of macula to detect:
o Preexisting macular pathology as diabetic
retinopathy or macular hole.
o Retinal detachment.
o Retinal features of pathological myopia.
Image Acquisition:
OCT:
Standard Optical coherence tomography of
the macula was done using (Heidelberg
engineering, OCT spectralis, Germany).
This SD-OCT with "OCT2 Module" can
record up to 85,000 A-scans per second with
transverse section 6 um resolution.
TruTrack Active Eye Tracking is a feature
enable this platform simultaneously images the eye
with two beams of light.
One beam captures an image of the retina
and maps over 1,000 points to track eye movement.
Using the mapped image as a reference, the
second beam is directed to the desired location
despite blinks or saccadic eye movements. TruTrack
Mohamed El-Massry et al.
1435
dual beam technology mitigates eye motion artifact
and ensures point to-point correlations between OCT
and Confocal Scanning Laser Ophthalmoscope
(cSLO) images without post-processing of the data.
The following imaging protocol was applied:
Macula radial:
To detect single point central foveal
thickness (SCFT) and any anatomical abnormalities.
The center of the radial scanning
line was adjusted on the fovea identified by both the
steepest foveal excavation and the highest foveal
bulge (if visible). The protocol consisted of a
sequence of 6 radial sections covering central 15°
recorded in the high-resolution mode (768 A-scans)
with a spaced by 30.0° between individual sections.
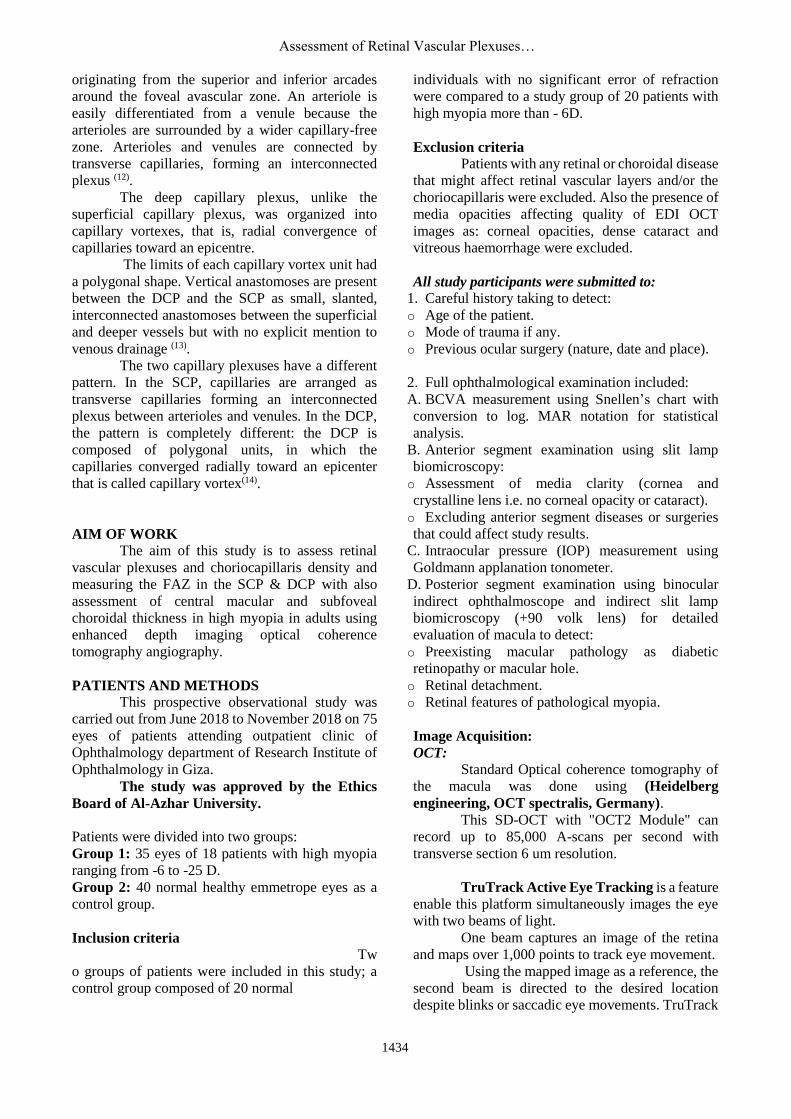
Macular thickness map:
For measurement of Central
Macular Thickness CMT among all retinal Layers,
the central scanning line was on the fovea. The
protocol consisted of a sequence of 19 horizontal
sections covering central 15° recorded in the high-
resolution mode (768 A-scans) with a distance of
approximately 240 um between individual sections.
These measurements were calculated automatically
by the software in all retinal Layers. The central
macular thickness was measured from inner border
of the (ILM) to the inner border of the RPE (figure
1).
Figure 1: Shows OCT macular thickness map of all
retinal layers measured from inner border of the
(ILM) to the inner border of the RPE. While the subfoveal choroidal
thickness was measured accurately from just below
the RPE to the sclera. In cases where the software
had difficulty recognizing the landmarks, the
operator was able to manually correct the
automatically generated borders.
OCTA:
Optical coherence tomographyangiography
of the macula using (Heidelberg engineering, OCT
spectralis, Germany).
The following protocol was applied:
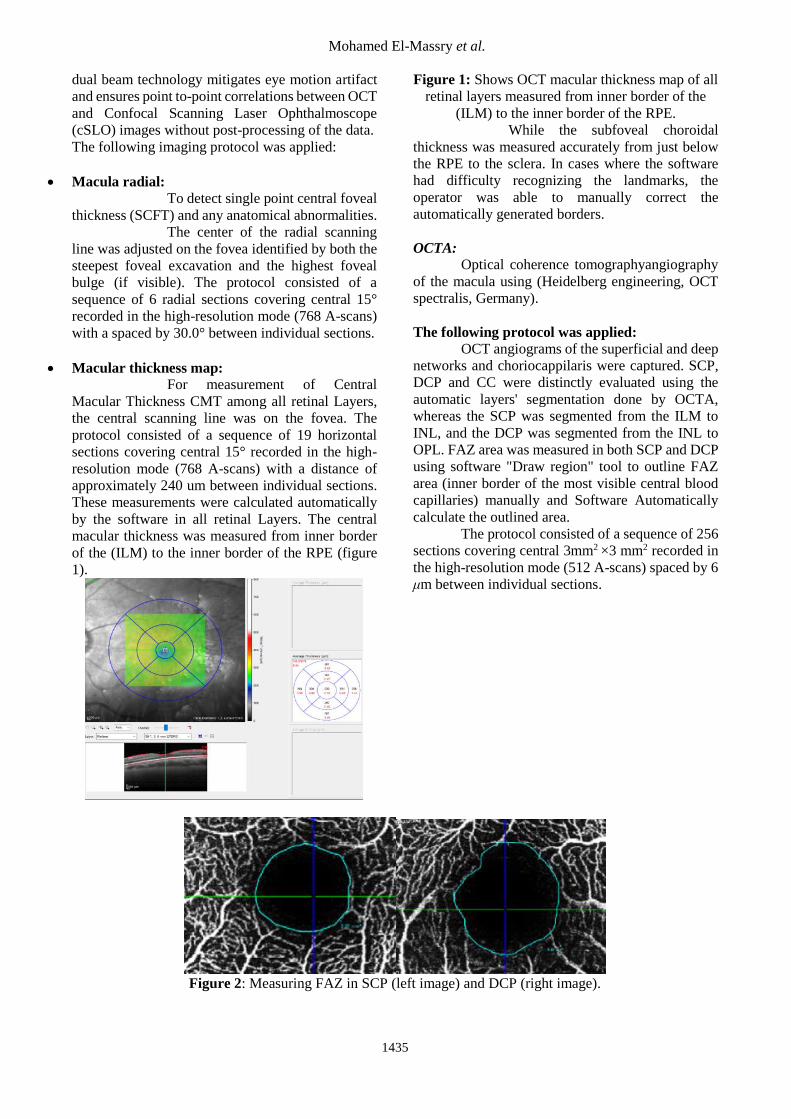
OCT angiograms of the superficial and deep
networks and choriocappilaris were captured. SCP,
DCP and CC were distinctly evaluated using the
automatic layers' segmentation done by OCTA,
whereas the SCP was segmented from the ILM to
INL, and the DCP was segmented from the INL to
OPL. FAZ area was measured in both SCP and DCP
using software "Draw region" tool to outline FAZ
area (inner border of the most visible central blood
capillaries) manually and Software Automatically
calculate the outlined area.
The protocol consisted of a sequence of 256
sections covering central 3mm2 ×3 mm2 recorded in
the high-resolution mode (512 A-scans) spaced by 6
μm between individual sections.
Figure 2: Measuring FAZ in SCP (left image) and DCP (right image).

Assessment of Retinal Vascular Plexuses…
1436
The results obtained were tabulated & statistically analyzed using specific analytical program.
The study was conducted in accordance with the ethical standards stated in the Faculty of Medicine, Al-Azhar
University and the Research Institute of Ophthalmology Ethical Committee. Also, informed consent was
obtained from each participant.
Statistical methodology:
Analysis was done using SPSS statistical software.
Variables were described by using mean, standard deviation and ranges.
The dependent variables; “Error of Refraction, Best Corrected Visual Acuity, Macular thickness,
Choroidal Thickness, FAZ SCP, FAZ DCP”, are compared in the two techniques.
Normality assumption is checked for continuous variables “Error of Refraction, Best Corrected Visual
Acuity, Macular thickness, Choroidal Thickness, FAZ SCP, FAZ DCP”) using Shapiro-Wilk test because of
small sample size (N=35).
Within the Myope population, statistical significance was determined by testing correlations between
either continuous variables or continuous and ordinal variables “using spearman rho’s correlation coefficient”
while between both ordinal variables using “Somer’s d test”.
Statistical significance was determined using Mann Whitney U test for comparing the not normally
distributed continuous variables “error of refraction, Best Corrected Visual Acuity, Macular thickness,
Choroidal Thickness, FAZ SCP, FAZ DCP”) in the Myope group and Emmetrope group.
RESULTS
Number of patients with high Myope =18 patients, therefore 36 eye measurements.
Patients included are high Myope with error of refraction ranging from -6 to -25 D, therefore 1 right eye was
excluded due to refraction error of +1 D.
Number of eye measurements included is 35 eyes.
Descriptive Analysis for Myopic Patients:
Mean age of patients (n=18) is 32 ± 9.7 (SD) years old, Ranging from 20 to 54 years old.
Mean error of refraction in eyes (n=35) is -15.3 ± 6.6 (SD), Ranging from -25 to -6 D.
Mean best corrective of visual acuity of eyes (n=35) is 0.34 ± 0.2 (stdev), Ranging from 0.02 to 0.8.
Mean Macular thickness of the eyes (n=35) is 155.2 ± 58.1 (stdev), Ranging from 76 to 380.
Mean Choroidal thickness of the eyes (n=35) is 140.4 ± 112.9(stdev), Ranging from 19 to 454.
Mean FAZ SCP of the eyes (n=35) is 434 ± 129.4 (stdev), Ranging from 250 to 890.
Mean FAZ DCP of the eyes (n=35) is 301 ± 90.4(stdev), Ranging from 70 to 479.
The SCP density, DCP density and CC density are described as the number and percentage of eyes
measurements seen in each quadrant as the following:
SCP Density Grade No of Eyes Percentage
0 6 17.14%
1 14 40.00%
2 12 34.29%
3 2 5.71%
NA 1 2.86%
Grand Total 35 100.00%
DCP Density Grade No of Eyes Percentage
0 4 11.43%
1 11 31.43%
2 18 51.43%
3 1 2.86%
NA 1 2.86%
Grand Total 35 100.00%
CC Density Grade No of Eyes Percentage
0 2 5.71%
1 3 8.57%
2 22 62.86%
Mohamed El-Massry et al.
1437
3 6 17.14%
4 1 2.86%
NA 1 2.86%
Grand Total 35 100.00%
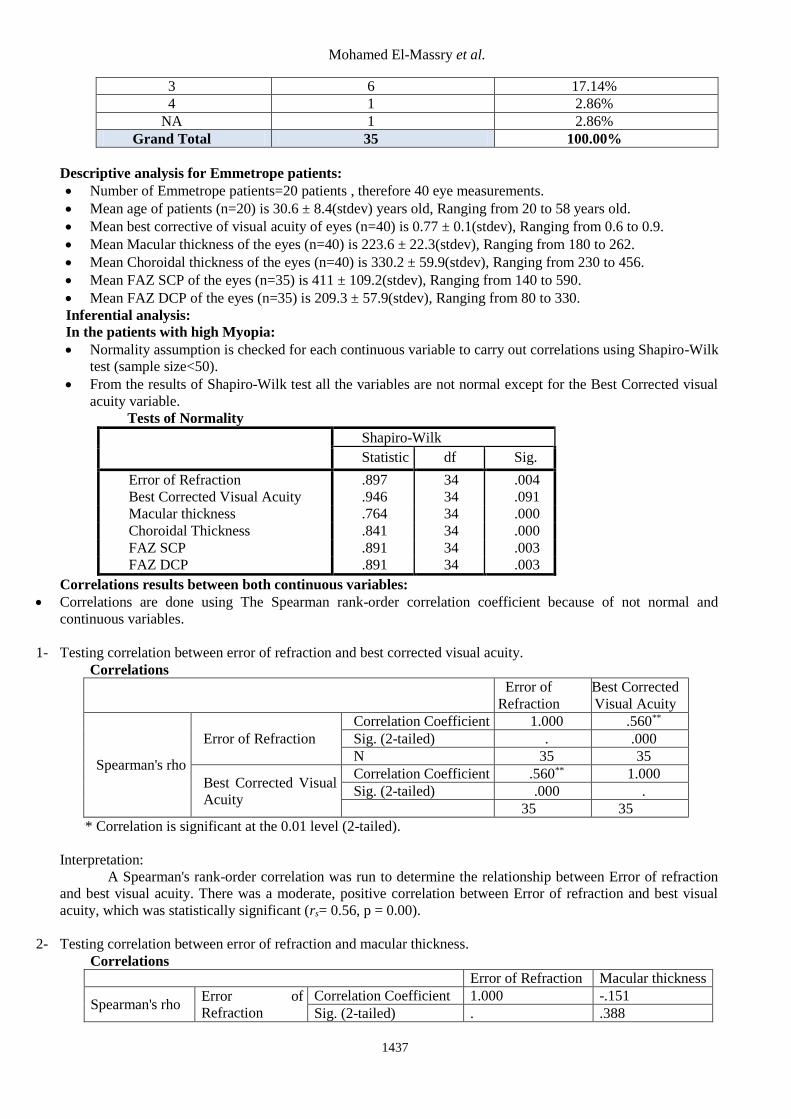
Descriptive analysis for Emmetrope patients:
Number of Emmetrope patients=20 patients , therefore 40 eye measurements.
Mean age of patients (n=20) is 30.6 ± 8.4(stdev) years old, Ranging from 20 to 58 years old.
Mean best corrective of visual acuity of eyes (n=40) is 0.77 ± 0.1(stdev), Ranging from 0.6 to 0.9.
Mean Macular thickness of the eyes (n=40) is 223.6 ± 22.3(stdev), Ranging from 180 to 262.
Mean Choroidal thickness of the eyes (n=40) is 330.2 ± 59.9(stdev), Ranging from 230 to 456.
Mean FAZ SCP of the eyes (n=35) is 411 ± 109.2(stdev), Ranging from 140 to 590.
Mean FAZ DCP of the eyes (n=35) is 209.3 ± 57.9(stdev), Ranging from 80 to 330.
Inferential analysis:
In the patients with high Myopia:
Normality assumption is checked for each continuous variable to carry out correlations using Shapiro-Wilk
test (sample size<50).
From the results of Shapiro-Wilk test all the variables are not normal except for the Best Corrected visual
acuity variable.
Tests of Normality
Shapiro-Wilk
Statistic df Sig.
Error of Refraction .897 34 .004
Best Corrected Visual Acuity .946 34 .091
Macular thickness .764 34 .000
Choroidal Thickness .841 34 .000
FAZ SCP .891 34 .003
FAZ DCP .891 34 .003
Correlations results between both continuous variables:
Correlations are done using The Spearman rank-order correlation coefficient because of not normal and
continuous variables.
1- Testing correlation between error of refraction and best corrected visual acuity.
Correlations
Error of
Refraction
Best Corrected
Visual Acuity
Spearman's rho
Error of Refraction
Correlation Coefficient 1.000 .560**
Sig. (2-tailed) . .000
N 35 35
Best Corrected Visual
Acuity
Correlation Coefficient .560** 1.000
Sig. (2-tailed) .000 .
N 35 35
** Correlation is significant at the 0.01 level (2-tailed).
Interpretation:
A Spearman's rank-order correlation was run to determine the relationship between Error of refraction
and best visual acuity. There was a moderate, positive correlation between Error of refraction and best visual
acuity, which was statistically significant (rs= 0.56, p = 0.00).
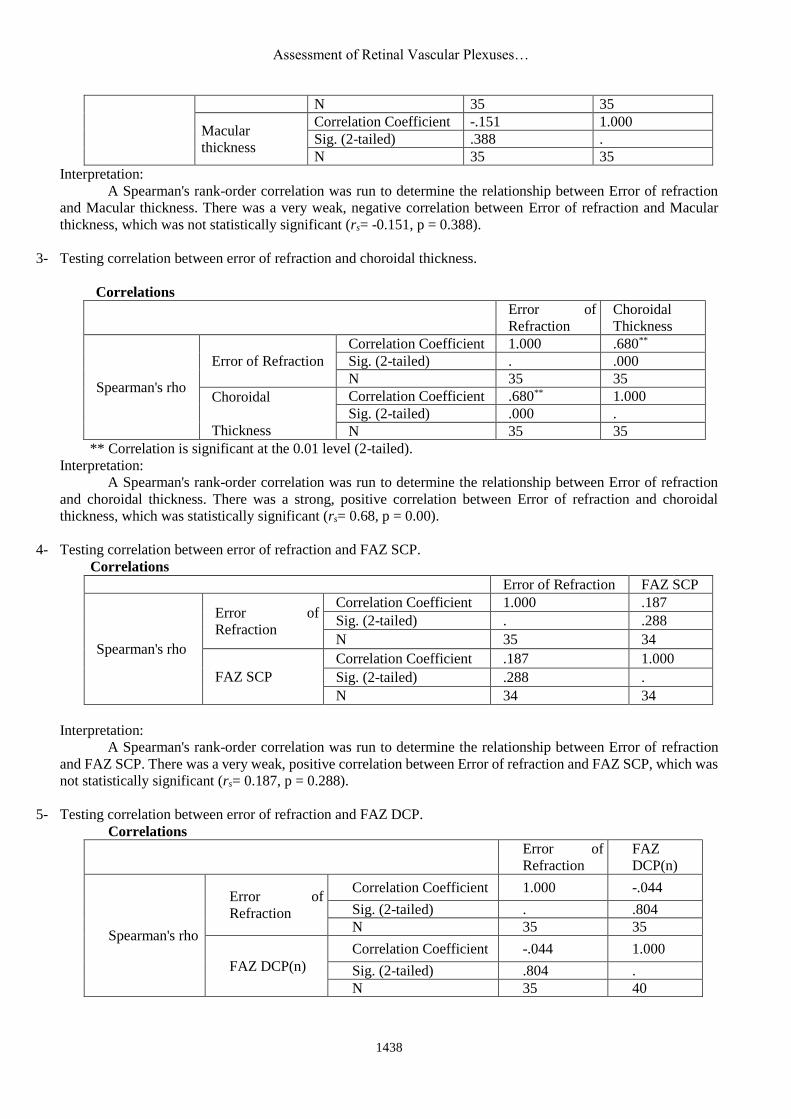
2- Testing correlation between error of refraction and macular thickness.
Correlations
Error of Refraction Macular thickness
Spearman's rho Error of
Refraction
Correlation Coefficient 1.000 -.151
Sig. (2-tailed) . .388
Assessment of Retinal Vascular Plexuses…
1438
N 35 35
Macular
thickness
Correlation Coefficient -.151 1.000
Sig. (2-tailed) .388 .
N 35 35
Interpretation:
A Spearman's rank-order correlation was run to determine the relationship between Error of refraction
and Macular thickness. There was a very weak, negative correlation between Error of refraction and Macular
thickness, which was not statistically significant (rs= -0.151, p = 0.388).
3- Testing correlation between error of refraction and choroidal thickness.
Correlations
Error of
Refraction
Choroidal
Thickness
Spearman's rho
Error of Refraction
Correlation Coefficient 1.000 .680**
Sig. (2-tailed) . .000
N 35 35
Choroidal
Thickness
Correlation Coefficient .680** 1.000
Sig. (2-tailed) .000 .
N 35 35
** Correlation is significant at the 0.01 level (2-tailed).
Interpretation:
A Spearman's rank-order correlation was run to determine the relationship between Error of refraction
and choroidal thickness. There was a strong, positive correlation between Error of refraction and choroidal
thickness, which was statistically significant (rs= 0.68, p = 0.00).
4- Testing correlation between error of refraction and FAZ SCP.
Correlations
Error of Refraction FAZ SCP
Spearman's rho
Error of
Refraction
Correlation Coefficient 1.000 .187
Sig. (2-tailed) . .288
N 35 34
FAZ SCP
Correlation Coefficient .187 1.000
Sig. (2-tailed) .288 .
N 34 34
Interpretation:
A Spearman's rank-order correlation was run to determine the relationship between Error of refraction
and FAZ SCP. There was a very weak, positive correlation between Error of refraction and FAZ SCP, which was
not statistically significant (rs= 0.187, p = 0.288).
5- Testing correlation between error of refraction and FAZ DCP.
Correlations
Error of
Refraction
FAZ
DCP(n)
Spearman's rho
Error of
Refraction
Correlation Coefficient 1.000 -.044
Sig. (2-tailed) . .804
N 35 35
FAZ DCP(n)
Correlation Coefficient -.044 1.000
Sig. (2-tailed) .804 .
N 35 40
Mohamed El-Massry et al.
1439
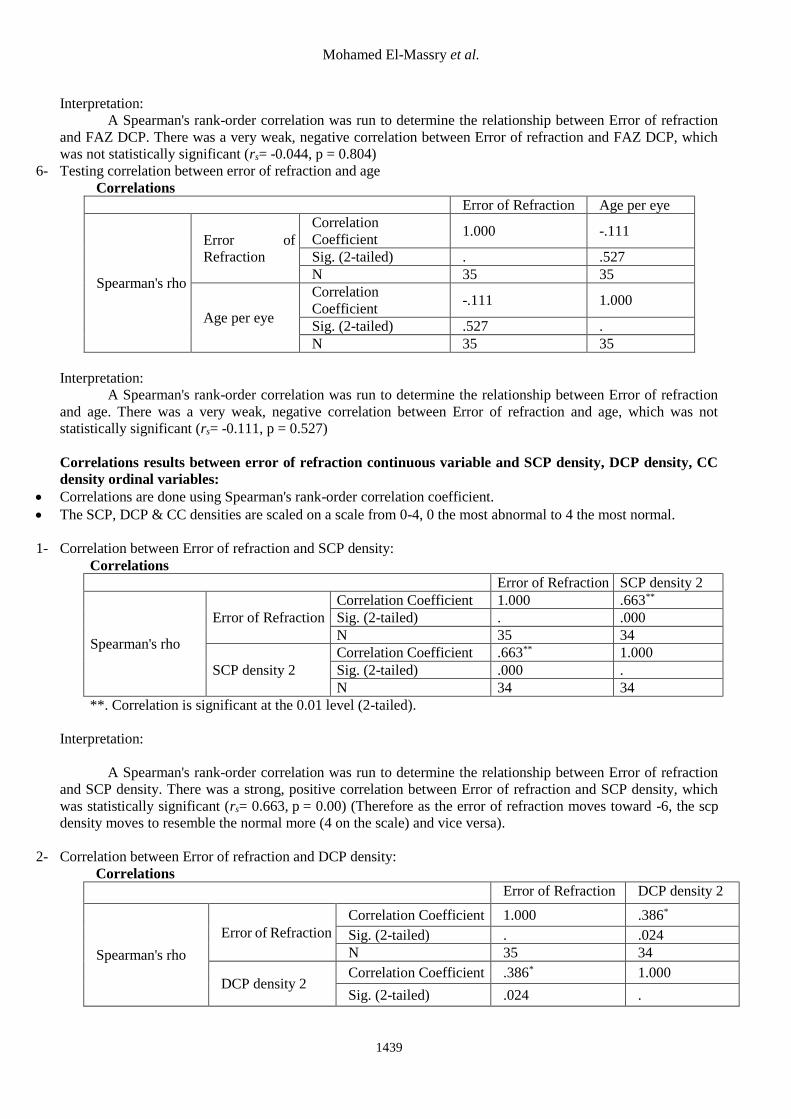
Interpretation:
A Spearman's rank-order correlation was run to determine the relationship between Error of refraction
and FAZ DCP. There was a very weak, negative correlation between Error of refraction and FAZ DCP, which
was not statistically significant (rs= -0.044, p = 0.804)
6- Testing correlation between error of refraction and age
Correlations
Error of Refraction Age per eye
Spearman's rho
Error of
Refraction
Correlation
Coefficient 1.000 -.111
Sig. (2-tailed) . .527
N 35 35
Age per eye
Correlation
Coefficient -.111 1.000
Sig. (2-tailed) .527 .
N 35 35
Interpretation:
A Spearman's rank-order correlation was run to determine the relationship between Error of refraction
and age. There was a very weak, negative correlation between Error of refraction and age, which was not
statistically significant (rs= -0.111, p = 0.527)
Correlations results between error of refraction continuous variable and SCP density, DCP density, CC
density ordinal variables:
Correlations are done using Spearman's rank-order correlation coefficient.
The SCP, DCP & CC densities are scaled on a scale from 0-4, 0 the most abnormal to 4 the most normal.
1- Correlation between Error of refraction and SCP density:
Correlations
Error of Refraction SCP density 2
Spearman's rho
Error of Refraction
Correlation Coefficient 1.000 .663**
Sig. (2-tailed) . .000
N 35 34
SCP density 2
Correlation Coefficient .663** 1.000
Sig. (2-tailed) .000 .
N 34 34
**. Correlation is significant at the 0.01 level (2-tailed).
Interpretation:
A Spearman's rank-order correlation was run to determine the relationship between Error of refraction
and SCP density. There was a strong, positive correlation between Error of refraction and SCP density, which
was statistically significant (rs= 0.663, p = 0.00) (Therefore as the error of refraction moves toward -6, the scp
density moves to resemble the normal more (4 on the scale) and vice versa).
2- Correlation between Error of refraction and DCP density:
Correlations
Error of Refraction DCP density 2
Spearman's rho
Error of Refraction
Correlation Coefficient 1.000 .386*
Sig. (2-tailed) . .024
N 35 34
DCP density 2 Correlation Coefficient .386* 1.000
Sig. (2-tailed) .024 .

Assessment of Retinal Vascular Plexuses…
1440
N 34 34
*. Correlation is significant at the 0.05 level (2-tailed).
Interpretation:
A Spearman's rank-order correlation was run to determine the relationship between Error of refraction
and DCP density. There was a weak, positive correlation between Error of refraction and DCP density, which
was statistically significant (rs= 0.386, p = 0.024)
3- Correlation between Error of refraction and CC density:
Interpretation:
A Spearman's rank-order correlation was run to determine the relationship between Error of refraction
and CC density. There was a moderate, positive correlation between Error of refraction and CC density, which
was statistically significant (rs= 0.487, p = 0.003)
- The error of refraction is divided to three categories: (1) less than -15, (2) less than -10 to -15, (3) -6 to -10.
- Correlations between the ordinal variable (error of refraction ranges) and the continuous variables (Best visual
acuity, macular thickness, choroidal thickness and age) are done using Spearman’s rho correlation coefficient.
1- Correlation between error of refraction ranges and best visual acuity:
Correlations
error of refraction
ranges
Best Corrected
Visual Acuity
Spearman's rho
error of refraction ranges
Correlation Coefficient 1.000 .559**
Sig. (2-tailed) . .000
N 35 35
Best Corrected Visual
Acuity
Correlation Coefficient .559** 1.000
Sig. (2-tailed) .000 .
N 35 35
Interpretation:
A Spearman's rank-order correlation was run to determine the relationship between Error of refraction ranges and
Best visual acuity. There was a moderate, positive correlation between Error of refraction ranges and best visual
acuity, which was statistically significant (rs= 0.559, p = 0.000)
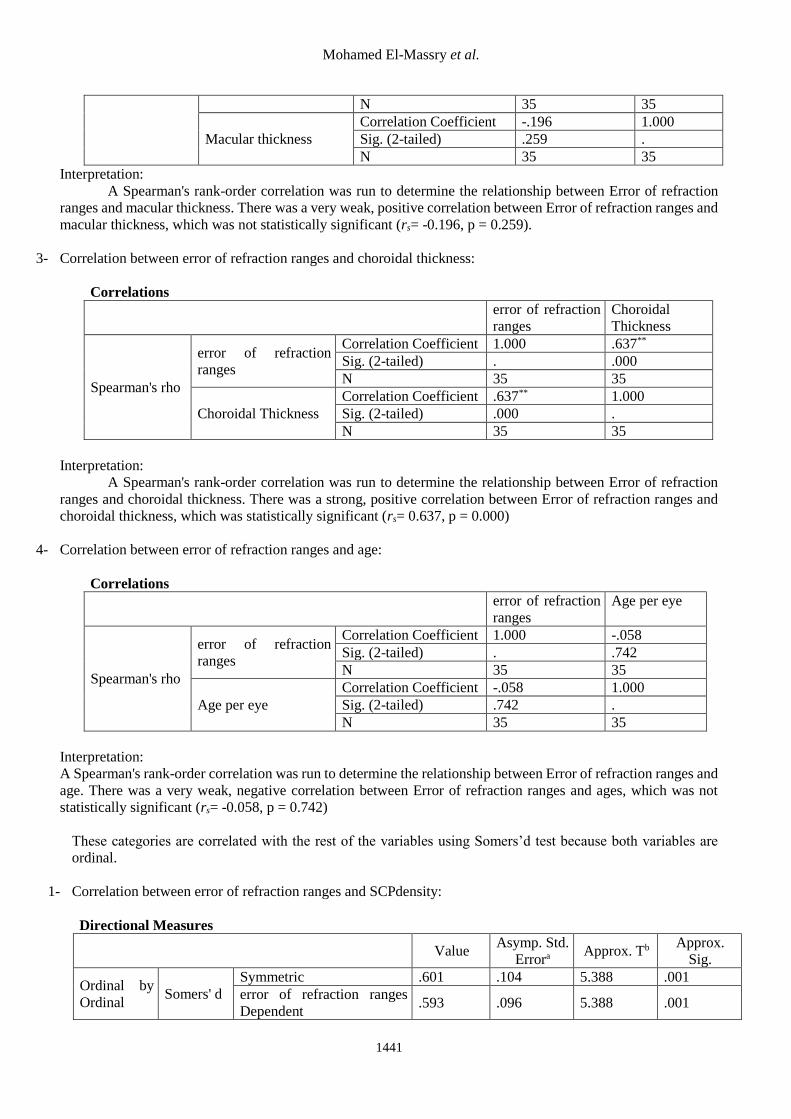
2- Correlation between error of refraction ranges and macular thickness:
Correlations
error of refraction
ranges
Macular
thickness
Spearman's rho error of refraction ranges Correlation Coefficient 1.000 -.196
Sig. (2-tailed) . .259
Correlations
Error of Refraction CC density 2
Spearman's rho
Error of Refraction
Correlation Coefficient 1.000 .487**
Sig. (2-tailed) . .003
N 35 34
CC density 2
Correlation Coefficient .487** 1.000
Sig. (2-tailed) .003 .
N 34 34
Mohamed El-Massry et al.
1441
N 35 35
Macular thickness
Correlation Coefficient -.196 1.000
Sig. (2-tailed) .259 .
N 35 35
Interpretation:
A Spearman's rank-order correlation was run to determine the relationship between Error of refraction
ranges and macular thickness. There was a very weak, positive correlation between Error of refraction ranges and
macular thickness, which was not statistically significant (rs= -0.196, p = 0.259).
3- Correlation between error of refraction ranges and choroidal thickness:
Correlations
error of refraction
ranges
Choroidal
Thickness
Spearman's rho
error of refraction
ranges
Correlation Coefficient 1.000 .637**
Sig. (2-tailed) . .000
N 35 35
Choroidal Thickness
Correlation Coefficient .637** 1.000
Sig. (2-tailed) .000 .
N 35 35
Interpretation:
A Spearman's rank-order correlation was run to determine the relationship between Error of refraction
ranges and choroidal thickness. There was a strong, positive correlation between Error of refraction ranges and
choroidal thickness, which was statistically significant (rs= 0.637, p = 0.000)
4- Correlation between error of refraction ranges and age:
Correlations
error of refraction
ranges
Age per eye
Spearman's rho
error of refraction
ranges
Correlation Coefficient 1.000 -.058
Sig. (2-tailed) . .742
N 35 35
Age per eye
Correlation Coefficient -.058 1.000
Sig. (2-tailed) .742 .
N 35 35
Interpretation:
A Spearman's rank-order correlation was run to determine the relationship between Error of refraction ranges and
age. There was a very weak, negative correlation between Error of refraction ranges and ages, which was not
statistically significant (rs= -0.058, p = 0.742)
These categories are correlated with the rest of the variables using Somers’d test because both variables are
ordinal.
1- Correlation between error of refraction ranges and SCPdensity:
Directional Measures
Value Asymp. Std.
Errora Approx. Tb
Approx.
Sig.
Ordinal by
Ordinal Somers' d
Symmetric .601 .104 5.388 .001
error of refraction ranges
Dependent .593 .096 5.388 .001
Assessment of Retinal Vascular Plexuses…
1442
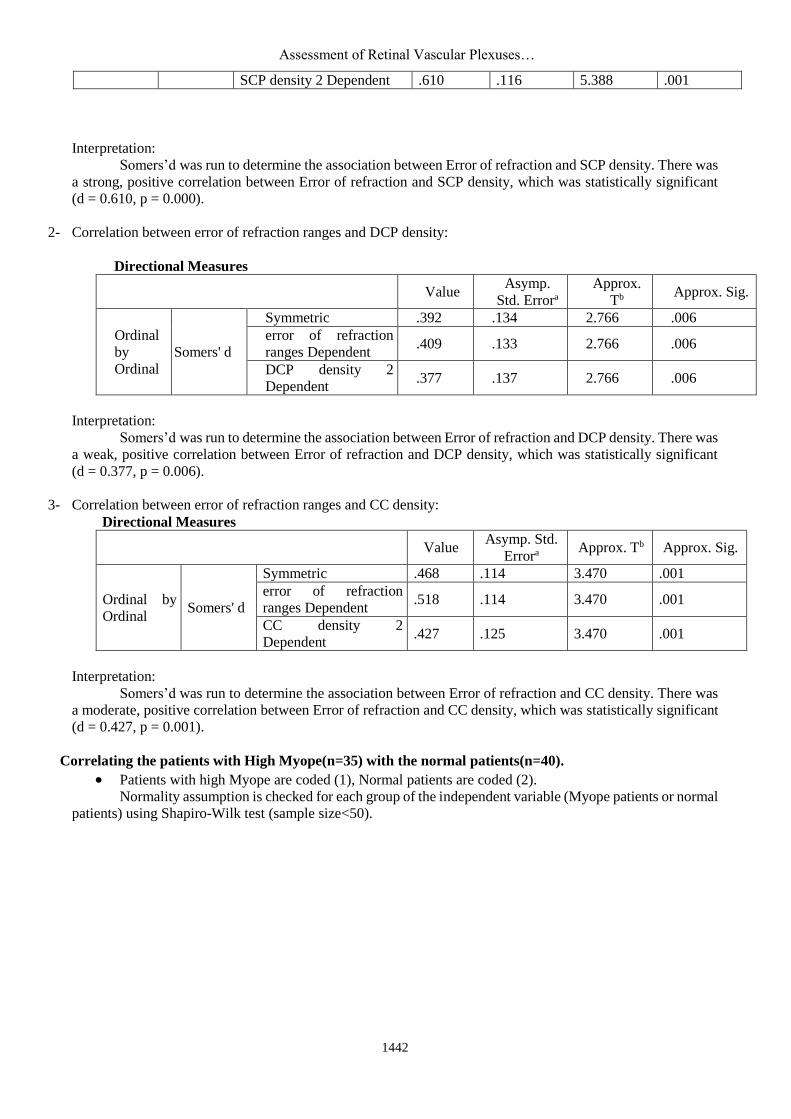
SCP density 2 Dependent .610 .116 5.388 .001
Interpretation:
Somers’d was run to determine the association between Error of refraction and SCP density. There was
a strong, positive correlation between Error of refraction and SCP density, which was statistically significant
(d = 0.610, p = 0.000).
2- Correlation between error of refraction ranges and DCP density:
Directional Measures
Value Asymp.
Std. Errora
Approx.
Tb Approx. Sig.
Ordinal
by
Ordinal
Somers' d
Symmetric .392 .134 2.766 .006
error of refraction
ranges Dependent .409 .133 2.766 .006
DCP density 2
Dependent .377 .137 2.766 .006
Interpretation:
Somers’d was run to determine the association between Error of refraction and DCP density. There was
a weak, positive correlation between Error of refraction and DCP density, which was statistically significant
(d = 0.377, p = 0.006).
3- Correlation between error of refraction ranges and CC density:
Directional Measures
Value Asymp. Std.
Errora Approx. Tb Approx. Sig.
Ordinal by
Ordinal Somers' d
Symmetric .468 .114 3.470 .001
error of refraction
ranges Dependent .518 .114 3.470 .001
CC density 2
Dependent .427 .125 3.470 .001
Interpretation:
Somers’d was run to determine the association between Error of refraction and CC density. There was
a moderate, positive correlation between Error of refraction and CC density, which was statistically significant
(d = 0.427, p = 0.001).
Correlating the patients with High Myope(n=35) with the normal patients(n=40).
Patients with high Myope are coded (1), Normal patients are coded (2).
Normality assumption is checked for each group of the independent variable (Myope patients or normal
patients) using Shapiro-Wilk test (sample size<50).

Mohamed El-Massry et al.
1443
Tests of Normality
Patients
Shapiro-Wilk
Statistic df Sig.
Best corrective visual acuity 1 .946 34 .091
2 .846 40 .001
Macular thickness 1 .764 34 .001
2 .961 40 .175
Choroidal thickness 1 .841 34 .001
2 .959 40 .157
FAZ SCP 1 .895 34 .003
2 .891 40 .001
FAZ DCP 1 .947 34 .102
2 .968 40 .313
From the results of Shapiro-Wilk test all the variables are not normal for each group of the
independent variable.
Therefore, Mann-Whitney U test is used to correlate the continuous variables in both groups.
Ranks
Patients N Mean Rank Sum of Ranks
Best corrective visual
acuity
1 35 19.57 685.00
2 40 54.13 2165.00
Total 75
Macular thickness
1 35 21.57 755.00
2 40 52.38 2095.00
Total 75
Choroidal thickness
1 35 21.44 750.50
2 40 52.49 2099.50
Total 75
FAZ SCP
1 34 37.21 1265.00
2 40 37.75 1510.00
Total 74
FAZ DCP
1 34 50.46 1715.50
2 40 26.49 1059.50
Total 74
The table above indicates that the normal patients group has a higher mean rank of the Best corrective
visual acuity, Macular thickness, choroidal thickness and FAZ SCP but the Myope patients have higher mean
rank of the FAZ DCP.
Test Statisticsa
Best corrective
visual acuity
Macular
thickness
Choroidal
thickness FAZ SCP FAZ DCP
Mann-Whitney U 55.000 125.000 120.500 670.000 239.500
Wilcoxon W 685.000 755.000 750.500 1265.000 1059.500
Z -6.908 -6.112 -6.156 -.109 -4.780
Asymp. Sig. (2-tailed) .000 .000 .000 .914 .001
a. Grouping Variable: patients
From this data, it can be concluded that:
- The Best corrective visual acuity in the normal group
was statistically significantly higher than the Myope
group (U = 55, p = 0.000).
- The Macular thickness in the normal group was
statistically significantly higher than the Myope
group (U = 125, p = 0.000).
Assessment of Retinal Vascular Plexuses…
1444
- The choroidal thickness in the normal group was
statistically significantly higher than the Myope
group (U = 120.5, p = 0.000).
- The FAZ SCP in the normal group was not
statistically significantly higher than the Myope
group (U = 670, p = 0.914).
- The FAZ DCP in the Myope group was statistically
significantly higher than the normal group (U =
239, p = 0.000).
DISCUSSION
This prospective study is concerned with
observing retinal and choroidal changes in high
myopia. Using EDI-OCT, macular thickness and
choroidal thickness were assessed, whereas the SCP,
DCP and CC density were assessed using OCT
angio. 40 normal eyes and 35 high myopic eyes were
examined and the findings were statistically
compared to the error of refraction of each eye.
One of the parameters assessed in our study
is the subfoveal choroidal thickness SFCT. This was
measured using EDI-OCT measuring from the outer
layer of the RPE to the choroido scleral junction.
Results showed that the mean Choroidal thickness of
the high myopic eyes (n=35) is 140.4 um± 112.9 um
(stdev), Ranging from 19um to 454um. While in
emmetrope eyes Mean Choroidal thickness of the
eyes (n=40) is 330.2um ± 59.9 um (stdev), ranging
from 230um to 456um. There was a strong, positive
correlation between Error of refraction and choroidal
thickness, denoting that the choroidal thickness
decreases as the degree of error of refraction
increases. The choroidal thickness in the normal
group was statistically significantly higher than the
Myope group (U = 120.5, p = 0.000).
Teberik et al.(12) concluded that the
subfoveal CT was significantly lower in the high
myopia group (mean, 218 um) than the control group
(mean, 331um) It had 65 individuals (30 patients
with high myopia, 35 healthy subjects).
In highly myopic eyes, excessive axial
elongation of the eyeballs can cause biomechanical
stretching and thinning of the choroid, retina, and
sclera(13) . Ikuno et al.(14) showed significant
associations between choroidal thickness, error of
refraction, CT, and posterior staphyloma height but
not AL. The tessellated group in a study by Wang et
al. showed no correlation between AL/error of
refraction and CT, despite the fact that the diffuse
chorioretinal atrophy group (with higher AL and
error of refraction) showed strong correlations with
both variables. Takahashi et al.(15) observed a
correlation between CT and AL, and Chen et
al.(16) found one between CT and error of refraction.
Guptaet al.(17) stated that the CT at the subfovea was
significantly thinner (mean 225 um) for high myopes
compared to emmetropes (375.15 um) based on a
case-control study of 648 young, male subjects,
including 520 high myopes and 128 emmetropes.
Ignacio et al.(18) concluded that mean
macular choroidal thickness was 115.5 um (range,
6.9-436.0) after examination of a total of 120 eyes of
83 patients with high myopia (error of
refraction≥−6 diopters or axial length ≥26 mm) and
96 eyes of 62 healthy patients. They reported that the
relationship between age and CT in patients with
high myopia was similar to that of a control group
after they accounted for the effects of AL. They also
suggested that AL has the strongest effect on CT in
highly myopic eyes. Also they found out that BCVA
(logMAR) was significantly correlated with thinner
SFCT.
El-Shazly et al.(19) found Choroidal
thickness was significantly lower in myopic eyes
compared to controls. Regardless of the degree of
myopia, nasal regions showed the lowest CT with
decremental pattern with advance of myopia (low
myopia 279.00 ± 24.50 µm, moderate myopia
269.58 ± 20.69 µm, high myopia 189.58 ± 25.95 µm,
advanced myopia 96.75 ± 24.83 µm).240 patients
with myopia and 60 emmetropes as controls.
Another assessed parameter is the central
macular thickness CMT. Using also EDI-OCT
thickness was measured first manual from the inner
layer of the ILM to the inner layer of the RPE then
reassured by the value obtained by the macular
thickness map. Mean Macular thickness of the
myopic eyes (n=35) is 155.2 um ± 58.1 um(stdev),
Ranging from 76 um to 380 um. Mean Macular
thickness of the emmetrope eyes (n=40) is 223.6 um
± 22.3 um (stdev), Ranging from 180 um to 262 um.
There was a very weak, negative correlation between
error of refraction and macular thickness, denoting
that increase in the error of refraction is not
accompanied by decrease in macular thickness.
However the Macular thickness in the normal group
was statistically significantly higher than the Myope
group. Consistent with our results, Abdulwaris et
al.(20), found out that the overall mean macular
thickness in the myopic groups and control were
262.98 um and 290.92 um respectively. The total
macular thickness was less in myopic eyes as
compared to emmetropic eyes. Minghui et al. (21)
also showed that error of refraction was negatively
correlated with central macular thickness, which is
also approved by Barrio-Barrio et al.(22) and Al-
Haddad et al.(23). Using OCT-angio, assessment of the foveal
avascular zone FAZ was performed, in both SCP &

Mohamed El-Massry et al.
1445
DCP. Results showed that in myopic eyes the mean
FAZ in SCP is 434um2 ± 129.4um2 (stdev), Ranging
from 250um2 to 890um2. While the mean FAZ in
DCP is 301um2 ± 90.4um2 (stdev), Ranging from
70um2 to 479um2. On the other hand, in emmetrope
eyes the mean FAZ area in SCP is 411um2 ±
109.2um2 (stdev), Ranging from 140um2 to 590um2.
While the mean FAZ in DCP is 209.3um2 ± 57.9um2
(stdev), Ranging from 80um2 to 330um2. To date,
there are only a few articles describing FAZ area
measured with OCT-angio (24), with the mean area of
the superficial FAZ ranging from 250 to 304 um2,
while the deep FAZ ranges from 340 to 495 um2(25).
In our study, despite following the exact same
method used in the above mentioned studies, our
results showed that the FAZ in SCP is larger in both
myope and emmmetrope eyes than the DCP FAZ.
This is likely due to difference in the device used as
in these studies AngioVue OCT-A system (Optovue,
Fremont, CA, USA) was used while in our study
Heidelberg engineering, OCT spectralis, Germany
device is used. The official Heidelberg website
displays an image of the FAZ area in SCP & DCP of
a normal eye showing clearly that the FAZ in SCP
larger than the FAZ in DCP.It is also important to
note that FAZ size among normal individuals
appears to vary greatly at both the superficial and
deep levels(24).
In this study, results showed negative
correlation between error of refraction and the FAZ
size. This is consistent with Colin et al.(26)In an
earlier study on FAZ size using FA, Bresnick et
al.(27) reported that there is no relationship between
error of refraction and the circumference or diameter
of the FAZ. Similarly, Chui et al.(28) and Dubis et
al.(29)have reported no significant association
between FAZ size and axial length.
Also this study showed that the FAZ in SCP
in emmetrope eyes was slightly larger than in
myopic eyes while FAZ IN DCP was larger in
myope. The latter finding is consistent with MI SUN
SUNG et al study which concluded that superficial
and deep FAZ were larger compared to emmetropic
eyes .(30)
Previous studies perfomed to assess the
vascular density in the SCP , DCP and CC used
OCTA with RTVue XR OCT Avanti system
(Optovue Inc., Software Version 2015.1.0, Fremont,
California, USA).(31) While one study used The Zeiss
HD-OCT with AngioplexTM OCTA device (Carl
Zeiss Meditec, Dublin, CA).(32)
The device used in this study is the
Heidelberg engineering, OCT spectralis, Germany
didn’t have the option to provide a quantitative value
of the vascular density like the previously mentioned
studies. Moreover there isn’t any published study
using the abovementioned device in assessment of
the vascular plexus. To overcome this challenge,
enface OCTA scans acquired over a 3 mm × 3 mm
area over the macula to obtain images of the SCP
DCP and CC like the previous studies. Then for each
eye of the control group and the high myopia group,
the 3 clearly detailed images were assessed
morphologically. In myopic eyes the images were
assessed compared to the images of the control eyes.
The image is divided into 4 quadrants and the density
of the vascular plexus is assessed compared to the
normal control group, then a grade from 0 to 4 is
given with 4 is the best unaffected density (which
was the case with all of the 40 emmetropic eyes) and
0 is the worst. If one quadrant is affected
morphologically a grade of 3 is given, if 2 quadrants
are affected a grade of 2 is given and so on with a
grade of 0 if all 4 quadrants are affected. The extent
of vascular density in all three layers SCP, DCP
&CC was clearly visible in the acquired images
ensuring an accurate grading of all myopic eyes
investigated and precisely compared to the control
group eyes density. This method was used by Coscas
et al.(33) in their study where they evaluated SCP and
DCP in retinal vein occlusion morphologically using
OCTA.
Our results, consistent with previous study (31), showed a positive correlation between degree of
myopia and vascular density in all the 3 layers. All
40 emmetropic eyes, have normal morphological
appearance of the vascular plexus density. On the
other hand the 35 myopic eyes showed clearly a
decrease in vascular density which increased as the
degree of myopia increased. Regarding the SCP
density, the majority of the eyes (40%) were of grade
1 meaning that 3 quadrants of the image were clearly
morphologically affected compared to a normal eye,
while (34%)of the eyes were of grade 2 and
(17.14%) grade 0 and (5.71%) of grade 3. Regarding
the DCP density the majority of the eyes (51.43%)
were of grade 2, (31.43%) grade 1, (11.43%) grade
0 and (2.86%) grade 3. Regarding CC density, the
majority of patients (62.86%) were of grade 2 while
(17.14%) grade 3, (8.57%) grade 1 and (5.71%)
grade 0. There was a positive correlation between
error of refraction and density in SCP, DCP and CC.
This denotes that as the error of refraction increases
the vascular density in these 3 layers significantly
decreases.
Al-Sheikh et al.(31) assessed fifty eyes with
myopia and 34 age-matched healthy eyes were
included in this study. The vessel density and the
vessel branching complexity using fractal dimension
Assessment of Retinal Vascular Plexuses…
1446
of the retinal capillary microvasculature were
significantly lower in myopic eyes.
The mechanism of decreased retinal and
choroidal vascular plexus density and perfusion in
high myopic eyes is still unclear. Studies
demonstrated that retinal and choroidal thickness
decreased in high myopia.(30). Sun Sung et al.(30)
highlighted how longer eyes had decreased retinal
function and oxygen consumption. Moreover, the
structural elongation of the eyeball mechanically
stretches the retinal tissue, resulting in the decrease
of the retinal microvascular density. It was
commonly thought that in pathologically myopic
eyes excessive elongation of the eyeball could cause
thinning of the retina and choroid, and the thinning
of these tissues might decrease the oxygen demand
and consequently decrease the blood circulation.
Also it is possible that, with the progress of
myopia, the thinned retina due to the elongated axial
length can cause degeneration of retinal vascular
endothelial cells and retinal pigment epithelium
(RPE) cells, resulting in consequential decreases in
VEGF production and microvessel density. VEGF
produced by vascular endothelial cells and retinal
pigment epithelium (RPE) cells, may play a key role
in the development of retinal vasculature by
stimulating the vessel growth(34). The decreased
aqueous VEGF level found in high myopia may also
contribute to the possible loss of capillary
network(35).
CONCLUSION
After assessing the images obtained from
the 35 high myope eyes and 40 emmetrope eyes
using EDI-OCTA, results showed that the choroidal
thickness decreases significantly with increase in the
error of refraction. Most likely this happens due to
axial elongation of high myopic eyes leading to
stretch and thinning of the retina. Also, macular
thickness decreased in the myopic eyes, which is
most likely due to the same theory but there was no
relation with error of refraction.
This study is one of the first few studies that
assessed FAZ area in high myopia using OCTA. No
positive correlation was found between error of
refraction and FAZ area but the FAZ area in DCP
was larger in myopic eyes compared to the normal
group. This might be due to stretching and
elongation of the retina and decrease in the vascular
density. The vascular density in SCP, DCP & CC
was clearly assessed using OCTA , showing a
significant decrease in high myopia and positive
correlation with error of refraction.
The OCTA is certainly able to take over
other invasive imaging techniques and new
researches using this device might be able to study
different pathologies affecting the posterior
segment.
REFERENCES 1. Novotny HR, Alvis DL (1961): A method of
photographing fluorescence in circulating blood in the
human retina. Circulation, 24:82–6.
2. Novotny HR, Alvis DL (1960): A method of
photographing fluorescence in circulating blood of the
human eye. Tech Doc Rep SAMTDR USAF Sch
Aerosp Med., 82:1–4.
3. Kogure K, Choromokos E (1969): Infrared
absorption angiography. J Appl Physiol., 26(1):154–7.
4. Yannuzzi LA, Slakter JS, Sorenson JA, Guyer DR,
Orlock DA(1992): Digital indocyanine green
videoangiography and choroidal neovascularization.
Retina,12(3):191–223.
5. Mendis KR, Balaratnasingam C, Yu P et al. (2010): Correlation of histologic and clinical images to
determine the diagnostic value of fluorescein
angiography for studying retinal capillary detail.
Invest Ophthalmol Vis Sci., 51(11): 5864–5869.
6. Staurenghi G, Bottoni F, Giani A (2013): Clinical
Applications of Diagnostic Indocyanine Green
Angiography. In: Ryan SJ, Sadda SR, Hinton DR
(editors), Retina. London: Elsevier Saunders.
7. Bailey ST, Wilson DJ, Tan O et al. (2014): Quantitative optical coherence tomography
angiography of choroidal neovascularization in age-
related macular degeneration. Ophthalmology,
21(7):1435–44.
8. de Carlo TE, Bonini Filho MA, Chin AT et al. (2015): Spectral-domain optical coherence
tomography angiography of choroidal
neovascularization. Ophthalmology, 122(6):1228–38.
9. Weinhaus RS, Burke JM, Delori FC et al. (1995):
Comparison of fluorescein angiography with
microvascular anatomy of macaque retinas. Exp Eye
Res., 61:1–16.
10. Yu PK, Balaratnasingam C, Cringle SJ et al. (2010): Microstructure and network organization of
the microvasculature in the human macula. Invest
Ophthalmol Vis Sci., 51:6735–6743.
11. Chan G, Balaratnasingam C, Yu PK et al. (2012): Quantitative mor- phometry of perifoveal capillary
networks in the human retina. Invest Ophthalmol Vis
Sci., 53:5502–5514.
12. Teberik K, Kaya M (2017): Retinal and Choroidal
Thickness in Patients with High Myopia without
Maculopathy. Pak J Med Sci., 33(6):1438-1443.
13. Wu PC, Chen YJ, Chen CH et al. (2008): Assessment of macular retinal thickness and volume
in normal eyes and highly myopic eyes with third-
generation optical coherence tomography. Eye
(Lond), 22(4):551–555.
14. Ikuno Y, Tano Y (2009): Retinal and choroidal
biometry in highly myopic eyes with spectral-domain
optical coherence tomography. Invest Ophthalmol Vis
Sci., 50(8):3876–3880.
Mohamed El-Massry et al.
1447
15. Takahashi A, Ito Y, Iguchi Y et al. (2012): Axial
length increases and related changes in highly myopic
normal eyes with myopic complications in fellow
eyes. Retina, 32(1):127–133.
16. Chen FK, Yeoh J, Rahman W et al. (2012): Topographic variation and interocular symmetry of
macular choroidal thickness using enhanced depth
imaging optical coherence tomography. Invest
Ophthalmol Vis Sci., 53(2):975–985.
17. Gupta P, Saw SM, Cheung CY et al. (2015): Choroidal thickness and high myopia: a case-control
study of young Chinese men in Singapore. Acta
Ophthalmol., 93(7):585-92.
18. Ignacio F, Francisco L, Jay S et al. (2013): The
relationship between axial length and choroidal
thickness in eyes with high myopia. American Journal
of Ophthalmology, 155(2): 314-319.
19. El-Shazly AA, Farweez YA, ElSebaay ME et al. (2017): Correlation between choroidal thickness and
degree of myopia assessed with enhanced depth
imaging optical coherence tomography. Eur J
Ophthalmol., 27(5):577-584.
20. Abdul W, Mousami M, Askari SN et al. (2015): Optical coherence tomography assisted macular
thickness profile in high myopia Indian Journal of
Basic and Applied Medical Research, 4(2): 159-166.
21. Minghui Z, Qiang W, Ping H u et al. (2015): Macular thickness assessed with optical coherence
tomography in young Chinese myopic patients. J
Ophthalmol., 2015: 715798.
22. Barrio-Barrio J, Noval S, Galdõs M et al. (2013):
Multicenter Spanish study of spectral-domain optical
coherence tomography in normal children. Acta
Ophthalmologica., 91(1):56–63.
23. Al-Haddad C, Antonios R, Tamim H et al. (2014): Interocular symmetry in retinal and optic nerve
parameters in children as measured by spectral domain
optical coherence tomography. British Journal of
Ophthalmology, 98(4):502–506.
24. Kim DY, Fingler J, Zawadzki RJ et al. (2012): Noninvasive imaging of the foveal avascular zone
with high-speed, phase-variance optical coherence
tomography. Invest Ophthalmol Vis Sci., 53:85–92.
25. Takase N, Nozaki M, Kato A et al. (2015):
Enlargement of foveal avascular zone in diabetic eyes
evaluated by en face optical coherence tomography
angiography. Retina, 35:2377–2383.
26. Colin ST, Louis WL, Vernon SC et al. (2016):
Optical coherence tomography angiography
evaluation of the parafoveal vasculature and its
relationship with ocular factors. Invest Ophthalmol
Vis Sci., 57: 224– 234.
27. Bresnick GH, Condit R, Syrjala S et al. (1984): Abnormalities of the foveal avascular zone in diabetic
retinopathy. Arch Ophthalmol., 102:1286–1293.
28. Chui TY, Van Nasdale DA, Elsner AE et al. (2014): The association between the foveal avascular zone and
retinal thickness. Invest Ophthalmol Vis Sci.,
55:6870–6877.
29. Dubis AM, Hansen BR, Cooper RF et al. (2012): Relationship between the foveal avascular zone and
foveal pit morphology. Invest Ophthalmol Vis Sci.,
53:1628– 1636.
30. Sung MS, Lee TH, Heo H et al. (2018): Association
between optic nerve head deformation and retinal
microvasculature in high myopia. Am J Ophthalmol.,
188:81-90.
31. Al-Sheikh M, Phasukkijwatana N, Dolz-Marco R et
al. (2017): Quantitative OCT angiography of the
retinal microvasculature and the choriocapillaris in
myopic eyes. Invest Ophthalmol Vis Sci., 58:2063–
2069.
32. Min Li, Ye Yang, Hong J et al. (2017): Retinal
microvascular network and microcirculation
assessments in high myopia. Am J Ophthalmol., 174:
56–67.
33. Coscas F, Glacet-Bernard A, Miere A et al. (2016): Optical Coherence Tomography Angiography in
Retinal Vein Occlusion: Evaluation of Superficial and
Deep Capillary Plexa. Am J Ophthalmol., 161:160-71.
34. Noma H, Funatsu H, Yamasaki M et al. (2008): Aqueous humour levels of cytokines are correlated to
vitreous levels and severity of macular oedema in
branch retinal vein occlusion. Eye (Lond), 22(1):42–
48.
35. Landa G, Rosen RB (2010): New patterns of retinal
collateral circulation are exposed by a retinal
functional imager (RFI). Br J Ophthalmol., 94(1):54–
58.