assessment of solid waste management at wakulima market in
TRANSCRIPT

ASSESSMENT OF SOLID WASTE MANAGEMENT AT WAKULIMA
MARKET IN NAIROBI CITY, KENYA
SUSAN WAMBUI MUGO
A THESIS SUBMITTED TO THE UNIVERSITY OF NAIROBI IN PARTIAL
FULFILLMENT OF THE REQUIREMENT OF THE MASTER OF SCIENCE
DEGREE IN ENVIRONMENTAL GOVERNANCE AT WANGARI MAATHAI
INSTITUTE FOR PEACE AND ENVIRONMENTAL STUDIES
JUNE, 2019

ii
DECLARATION
This thesis is my original work and has not been presented for an award of a degree in
any other university.
Sign………………………………………. Date…………………………
Name: Susan Wambui Mugo Reg. No: A60/80548/2015
This research thesis has been submitted for examination with our approval as university
supervisors
Sign………………………………………. Date…………………………….
Dr.Thuita Thenya, PhD
University of Nairobi
Department of Geography and Environmental Studies
Sign………………………………………. Date…………………………….
Dr. John Muthee, PhD
University of Nairobi Department of Clinical Studies

iii
DEDICATION
This thesis is dedicated to my parents Mr. and Mrs. Mugo, my husband Eric and my entire
family members. Special thanks to my siblings for all their tireless support during the
entire process.

iv
ACKNOWLEDGEMENT
I would like to thank all those who have helped me in one way or another in the course
of my studies. First I would like to thank my supervisors Dr. Thuita Thenya and Dr
John Muthee for their invaluable advice at all stages of this thesis.My classmates in
Environmental Governance deserve special mention for the teamwork they have shown
during the entire course. These were; Benson Ouma, Sylvia Rotich, Grace Uwamwezi,
Natalie Waithera, Alexander Dunbar, Melody Kariuki, Patricia Nzano and Abida
Buoro. I would also like to thank the Nairobi City County-Environmental Department
for the immense support offered during my data collection.

v
TABLE OF CONTENTS
DECLARATION.......................................................................................................... ii
DEDICATION.............................................................................................................iii
ACKNOWLEDGEMENT .......................................................................................... iv
LIST OF TABLES ....................................................................................................... x
LIST OF FIGURES .................................................................................................... xi
LIST OF PLATES ..................................................................................................... xii
LIST OF ACRONYMS ............................................................................................xiii
ABSTRACT ............................................................................................................... xiv
CHAPTER ONE: INTRODUCTION ........................................................................ 1
1.1 Background of the study .......................................................................................... 1
1.2 Statement of the Research Problem ......................................................................... 3
1.3 Research Questions .................................................................................................. 4
1.4 Overall Objective ..................................................................................................... 5
1.4.1 Specific Objectives ............................................................................................. 5
1.5 Justification of the study .......................................................................................... 5
1.6 Scope and limitations ............................................................................................... 5
CHAPTER TWO: LITERATURE REVIEW ........................................................... 6
2.0 Introduction .............................................................................................................. 6
2.1 Market Place Waste.................................................................................................. 6
2.1.1 Solid Waste ........................................................................................................ 6
2.1.2 Organic Waste .................................................................................................... 7
2.1.3 Municipal Solid Waste ....................................................................................... 9
2.2 Waste Management in Developing Countries.......................................................... 9
2.3 Market Waste Management in Developing Countries ........................................... 10
2.3.1 Market Waste Management in Nairobi .......................................................... 11

vi
2.3.2 Market Waste Management Practices ............................................................ 13
2.4 Challenges Facing Market Waste Management in Nairobi ................................... 13
2.4.1 Poor Market Design ......................................................................................... 14
2.4.2 Waste Storage .................................................................................................. 15
2.4.3 Waste Disposal................................................................................................. 15
2.5 Processes in Market Waste Management ............................................................... 15
2.5.1 Waste Generation ............................................................................................. 16
2.5.2 Waste storage ................................................................................................. 16
2.5.3 Processing and Recovery ................................................................................ 16
2.5.4 Transfer and Transport and Final Disposal of Waste ..................................... 17
2.6 Actors in Waste Management ................................................................................ 17
2.7 Sustainable municipal Waste Management ........................................................... 18
2.8 Solid Waste Management Hierarchy ..................................................................... 19
2.8.1 Waste prevention and Reduction ..................................................................... 19
2.8.2 Re-use ............................................................................................................. 21
2.8.3 Recycle ............................................................................................................. 21
2.8.4 Composting ...................................................................................................... 21
2.8.5 Energy Recovery .............................................................................................. 22
2.8.6 Land Filling ...................................................................................................... 22
2.9 Integrated Solid Waste Management ..................................................................... 23
2.10 Solid Waste Generation ....................................................................................... 24
2.11 Solid waste collection .......................................................................................... 25
2.12 Solid waste disposal ............................................................................................. 25
2.13 Waste Management Regulation and Policy ......................................................... 26
2.14 Theoretical Framework ........................................................................................ 27
2.15 Conceptual Framework ........................................................................................ 28

vii
CHAPTER THREE: METHODS ............................................................................ 30
3.0 Study Area .............................................................................................................. 30
3.1 Location and size of Wakulima Market ................................................................. 30
3.2 Layout of Wakulima Market .................................................................................. 31
3.3 Produce sold in the market ..................................................................................... 32
3.4 Demographic Characteristics ................................................................................. 32
3.5 Ownership of the Market ....................................................................................... 33
3.6 Research Design ..................................................................................................... 33
3.7 Data Sources .......................................................................................................... 33
3.7.1 Secondary data ................................................................................................. 33
3.7.2 Primary data ..................................................................................................... 33
3.8 Target Population. .................................................................................................. 34
3.9 Sampling Design .................................................................................................... 34
3.10 Data Collection Tools .......................................................................................... 35
3.10 Field Observations ............................................................................................... 36
3.11 Data Analysis ....................................................................................................... 36
CHAPTER FOUR: RESULTS AND DISCUSSION .............................................. 37
4.1 Introduction ............................................................................................................ 37
4.2 Trader Characteristics in Wakulima Market .......................................................... 37
4.2.1 Products sold in the market .............................................................................. 38
4.2.3Source of produce ............................................................................................. 40
4.2.4 Packaging Material .......................................................................................... 41
4.2.5 Proposed Plastic ban ........................................................................................ 43
4.2.6 State of produce brought to the market ............................................................ 43
4.2.7 Method of sale of produce ............................................................................... 44
4.2.8 Storage of unsold goods ................................................................................... 45

viii
4.3 Refrigeration in the market ................................................................................. 45
4.2.9 Components of waste at Wakulima Market ..................................................... 46
4.2.10 Produce going bad.......................................................................................... 47
4.2.10.1 Methods of vegetable waste disposal .......................................................... 49
4.2.11 Methods of Storage of Fruit Waste ................................................................ 50
4.2.12 Methods of disposal of plastic bags Plastic Waste Disposal ......................... 51
4.2.12.1 Methods of disposal of sack waste.............................................................. 52
4.3 Factors contributing to waste increase in the market ............................................. 53
4.4 Product with the highest increase in waste ............................................................ 53
4.5 Product which had reduced waste .......................................................................... 54
4.6 Waste management system .................................................................................... 55
4.6.1 Availability of dustbins and skips ....................................................................... 55
4.6.2 Payment for waste collection .............................................................................. 56
4.6.3 Disposal of vegetable waste ................................................................................ 57
4.7: Methods of vegetable waste disposal.................................................................... 57
4.7.1 Disposal of fruits waste .................................................................................... 57
4.7.2 Waste Separation ............................................................................................. 58
4.7.3 Collection of solid waste .................................................................................. 58
4.7.4 Regularity of waste collection ......................................................................... 59
4.7.5 Final Disposal of waste .................................................................................... 59
4.7.6 Cost of Waste management ............................................................................. 60
4.8 Discussions ............................................................................................................ 60
CHAPTER FIVE; SUMMARY OF FINDINGS, CONCLUSION AND
RECOMMENDATIONS ........................................................................................... 65
5.0 Summary of findings.............................................................................................. 65
5.2 Conclusion ............................................................................................................. 66

ix
5.3 Recommendations .................................................................................................. 66
5.3.1. Solid waste management education and information project ........................ 65
5.3.2 Solid waste management education and information with improvement of
solid waste management equipment ..................................................................... 67
REFERENCES ........................................................................................................... 68
APPENDICES ............................................................................................................ 73
Appendix I: Market Waste Management Questionnaire ............................................. 73

x
LIST OF TABLES
Table 2.1: Waste characterization at immediate source and at communal waste
collection points for Business, Commercial and Institutional generators...................... 8
Table 4.1: Type of produce sold in the market ........................................................... 38
Table 4.2: Factors contributing to sale of various products ........................................ 40
Table 4.3: State of produce brought to the market ...................................................... 43
Table 4.4: Method of sale of produce ......................................................................... 44
Table 4.5: Method of storage of unsold goods............................................................ 45
Table 4.6 Methods of vegetable waste disposal .......................................................... 49
Table 4.7 Method of Storage of Fruit Waste ............................................................... 50
Table 4.8: Methods of disposal of plastic bags ........................................................... 51
Table 4.9: Disposal of sack waste ............................................................................... 52
Table 4.10: Mode of waste collection ......................................................................... 59

xi
LIST OF FIGURES
Figure 2.1: Trends in Solid Waste Generation in Nairobi .......................................... 12
Figure 2.2: Hierarchy of management of solid waste ................................................. 19
Figure 2.3: Integrated solid waste management Source: UNEP (2008) ..................... 24
Figure 2.4: Conceptual Framework ............................................................................ 28
Figure 2.5: Location of Wakulima Market ................................................................. 30
Figure 2.6 Layout of Wakulima Market ..................................................................... 32
Figure 4.1: Age of respondents ................................................................................... 37
Figure 4.2: Source of produce..................................................................................... 40
Figure 4.3: Types of packaging materials ................................................................... 41
Figure 4.4: Components of Waste .............................................................................. 46
Figure 4.5: Frequency of produce going bad .............................................................. 48
Figure 4.6: Product with the highest Waste increase .................................................. 54
Figure 4.7: Produce with reduced amounts of waste .................................................. 54
Figure 4.8: Methods of vegetable waste disposal ....................................................... 57
Figure 4.9: Methods of disposal of fruit waste ........................................................... 58

xii
LIST OF PLATES
Plate 4.1: Traders selling different types of produce in the market ............................ 39
Plate 4.2: Produce packaged in sacks.......................................................................... 42
Plate 4.3: Components of waste at the market ............................................................ 47
Plate 4.4: Skips used in waste storage ......................................................................... 49
Plate 4.6: Disposal of plastic waste in the market ....................................................... 51
Plate 4.7: Disposal of sacks in the market .................................................................. 52
Plate 4.8: Skips at Wakulima market .......................................................................... 56

xiii
LIST OF ACRONYMS
EMCA - Environmental Management and Coordination Act
ISWM - Integrated Solid Waste Management
JICA - Japan International Cooperation Agency
KAP - Knowledge Attitude and Practice
MSW - Municipal Solid Waste
NEMA - National Environment Management Authority
NCC - Nairobi City County
NGO - Non-Governmental Organization
SWM - Solid Waste Management
UN - United Nations
UNEP - The United Nations Environmental Program
UNESCO - United Nations Education Scientific and Cultural
Organization
UNPFA - United Nations Populations Fund Agency
USEPA - United States Environmental Protection Agency
WMD - Waste Management Department

xiv
ABSTRACT
The market place is one of the most important places where trade of goods occurs
among the general public. Wakulima market is characterized by heaps of unattended
sites of solid waste. Poor waste disposal practices have resulted in an unsightly and
unsanitary market. The purpose of this study therefore was to assess solid waste
management at Wakulima market in Nairobi City County. The overall objective of this
thesis was to analyse the factors hindering effective solid waste management at
Wakulima market. The research adopted a descriptive design and data was collected
using preliminary field observations, face-to-face interviews and questionnaire survey.
Data was collected from the sellers, buyers and other stakeholders in the market.
Stratified sampling along products was used to interview 100 respondents from the
market. Results of the study indicated that the factors hindering effective waste
management at Wakulima market were: lack of enough skips for storage of waste
(88%), lack of regular waste collection from the market (85%), poor waste management
methods (74%) and lack of enough resources for institutions mandated to collect waste
generated from the market (65%). From the findings, 78% of the respondents disposed
their waste in undesignated areas such as near the roads, in drainage areas as well as
leaving the waste in the market hall. Only 22% of the respondents placed their waste in
skips and bins. Results indicated that most of solid waste in the market was organic
according to 65% of the respondents which was followed by plastic bags at 27% and
sacks at 8%. The study findings indicated that the methods of storage of produce left
unsold in the market was a key determinant towards reducing waste at Wakulima
market. The research recommendations include: need to supply enough bins and skips
in the market, regular waste collection from the market of and incorporation of the
Integrated Solid Waste Management

1
CHAPTER ONE
INTRODUCTION
1.1 Background of the study
Management of waste is done to minimize its adverse effects on the health of humans,
the environment and for aesthetic purposes. Improper waste disposal and accumulation
results in increase of environmental diseases, environmental pollution, emission of foul
smells and an unattractive environment (Muniafu and Otiato, 2010). A study conducted
by the UN-Habitat and the Imperial College London in 2010 came up with a conclusion
that organic waste is on average the most common type of waste produced in 20 cities
in the world. Results from the study indicated that in high income areas, organic waste
was about 29% of the total waste generated while in areas with middle-income earners,
organic waste was about 54% of total waste generated and in low-income areas, organic
waste contributed to 63% of total waste generated (UN-Habitat, 2010).According to the
2012 report on Global solid waste management, by 2025 the cities and urban centers in
the world will generate over 2.8 billion tons of waste. This is more than twice the current
amount of 1.3 billion tones especially in low income generating nations.
In Kenya, food waste contributes to the highest percentage of solid waste generated in
markets (NCC, 2002). Private companies as well as the Nairobi City County provide
services for solid waste management to high income areas, middle income areas also
get relatively good waste collection services from both the private and public waste
collectors compared to low-income areas where waste collection services are very
irregular and in other places they are non- existent.

2
Waste management is the process of gathering the waste, storage, separation of waste
and finally transporting it to the final disposal point (UNEP, 2014). With this in mind,
management of solid waste is crucial in maintaining a healthy environment and is a
fundamental part of basic urban services. Waste collection, transportation and final
disposal have generally been ignored by county governments in the developing world.
Solid waste in most urban areas is done by the government itself or by private collectors.
Despite spending around 20 to 40 per cent of their revenues on management of waste,
developing countries have not been able to completely deal with the problem of waste
(Zerbock, 2003). The World Health Organization (WHO) made a request to African
countries to state the problems they were facing with regards to maintaining healthy
environment. The outcome from the study showed that solid waste was an important
problem as it was ranked second after the water quality problem (Senkoro, 2003 in
Zerbock, 2003).
Evidence reveal that urban waste is mainly composed of 68% from domestic sources,
14% is from industrial sources, 8% from roads, 2% from hospitals, 3% from education
institutions/schools,1% from markets and the remaining 4% from other sources
(UNFPA, 2001). Packaging material such as plastic constitute a large proportion of
waste. For example, more than 260,000,000 tons of plastics are produced every year
globally, which accounts for almost 8% of all production in the world (Oyake, 2016).
The same report indicated that almost 1 trillion plastic bags are manufactured and
utilized in one year globally. This points to the importance of the use of plastic materials
above all others by the packaging sector. The urban waste streams end up being the
recipient of nearly a half of these produced plastic bags constituting something between
5% and 10% of the solid waste stream. This is also the case in most Kenyan cities
(NEMA, 2003). Although plastic bags were banned in Kenya, the clogging of drainage

3
systems has not stopped and it will take time to clear water ways coupled with illegal
dumping of plastic waste.
The burden of managing waste is negatively impacted by the high rate of population
growth in cities like Nairobi. Less than 26% of all solid wastes are collected on a daily
basis in Nairobi (Ikiara et al., 2014). The challenges that complicate waste management
centers encompass poor sanitation, regulation implementation, limited financial support
and in urban areas, lack of appropriate methods to manage wastes according to
Troschinetz and Mihelcic, (2009). The wetlands and low lying lands form majority of
the dumping site locations in many nations according to global solid waste management
report (2012). In developing countries, these sites are not protected from human access.
They are left open and unfenced hence increasing the risk of human exposure to
environmental and public health hazards (Oyake, 2016).
1.2 Statement of the Research Problem
Developing countries face more problems in management of waste compared to the
developed countries (Zerbock, 2003). Lack of financial resources and infrastructure to
deal with solid waste creates a vicious cycle of; lack of resources which leads to low
quality of service provision which leads to fewer people willing to pay for the services,
which in turn further erodes the resource base and so on (Kuniyal et al., 1998; Zerbock,
2003). The problem is further complicated by rapid growth in population and
urbanization, which adds greatly to the volume of waste being generated and to the
demand for waste retrieval service in municipal areas. An increase in population is not
matched with an equal increase in revenue for the local municipalities for waste
management (Zerbock, 2003). Another significant factor that contributes to the problem
of solid wastes in a developing country scenario is the lack of proper collection and

4
transportation facilities. Improper planning coupled with rapid growth of population
and urbanization serves to add congestion in streets and as a result the waste collection
vehicles cannot reach such places, thus allowing filth to build up over time. Lack of
monetary resources at times results in improper or no transportation vehicles for waste
disposal thus adding another dimension to the ever rising cycle of problems (Jain et al.,
1994; Zerbock, 2003). In any developing country, the threats posed by improper
handling and disposal of solid wastes (though often ignored) contribute to the high level
of mortality and morbidity (Medina, 2002).
Effective waste management is a major problem at Wakulima market in Nairobi. This
is occasioned by irregular collection of waste generated, lack of proper systems for
handling the waste, lack of adequate solid waste management laws and lack of
knowledge on proper waste disposal methods. It is estimated that 4000 tons of wastes
is produced from the market place every day. Out of this, only a fraction of it is collected
and this means that there is a deficit which is left uncollected. This has resulted in
littering, heaping and overflowing of wastes in the market places which has made the
markets unattractive and filthy for carrying out business. In addition, the traders sell their
wares on heaps of garbage. The study will enable generation of information on
problems faced by waste managers and the approaches that could be adopted.
1.3 Research Questions
i. What types of waste is generated at Wakulima market?
ii. How do people dispose of waste from the market?
iii. How often is the waste collected?
iv. What resources are available for collection of wastes disposed at the
market?

5
v. What can be done to achieve a cleaner and healthier market?
1.4 Overall Objective
To assess dynamics of waste generation and management at Wakulima market, Nairobi
City.
1.4.1 Specific Objectives
i. Identify different categories of solid wastes produced from the Wakulima
market.
ii. Analyse the current solid waste management system.
iii. Assess opportunity for improved waste management.
1.5 Justification of the study
Nairobi is home to over 4 million people (Kenya Bureau of Statistics, 2017). Wakulima
market is located in the central business district and is the largest fresh produce market
in Nairobi. The persistent negligence of proper waste management raises a great
concern in the market. The choice of this subject area therefore stems from the need to
urgently come up with a solution to the prevailing situation, where market waste has
continued to accumulate in various open dumpsites and the existing formal waste
management institutions have failed.
1.6 Scope and limitations
The study was conducted at Wakulima Market in Nairobi County. This thesis focused
on the waste generated in the market both organic and inorganic. The study also focused
on the role of traders and the county government in waste management. It also focused
on the current status of waste management in the market. The busy schedules of the
traders were a limitation with erroneous and biasness due to human nature forming
additional factors that limited the study.

6
CHAPTER TWO
LITERATURE REVIEW
2.0 Introduction
This chapter entails a review of various literatures on waste management particularly
in the market place. The chapter highlights the type of wastes in the market places and
how the waste is handled.
2.1 Market Place Waste
Waste is defined as something that is no longer useful to the owner or something that has
already been used but does not fulfill its intended purpose (Gourlay, 1992 in Freduah,
2004). Wastes may be generated during raw material extraction, processing of the raw
materials into intermediate and final products, the use of final products and other human
activities. Goods that are reused or recycled at the place of generation are excluded (UN
Statistics Division, Glossary of Environmental Statistics 2014). Market waste is any
material that is produced from the market place for which the initial user has no further
use in terms of his/her own purposes of production, transformation or consumption, and
of which he/she wants to dispose (UNEP, 2008).
2.1.1 Solid Waste
Solid wastes are materials that arise as a result of humans or animals’ activities that are
often thrown out as they are regarded useless (Tchobanoglous et al., 1993). These solid
waste materials fall outside of liquid nature, gaseous and non-hazardous and consist of
both organic and non-organic material. These materials are generated from commercial
establishments, markets places, institutions such as schools and industries (Arukwe,
2012). The characteristics of solid waste depend on its source and nature (USEPA,
2009). Solid waste can be made up of different things. Some are:1) industrial waste-
which is waste that has been generated from industries that can either be hazardous or

7
non-hazardous 2) residential waste- which is waste generated from households and may
include refuse, trash and other forms of hazardous waste such as plastics, batteries and
even electronics 3) municipal waste- which is waste generated from clean-up of streets,
parks and open spaces 4)commercial waste-which is waste generated from business
places such as hotels, malls and even market places 5) Agricultural Waste- which is
waste that has been generated as a result of farming activities.
Solid waste can either be combustible or non-combustible. The components of solid
waste that are combustible include plastics, papers, sacks, food waste, and other
organics. Non- combustibles components of solid waste include bones, glass and metals
(Denison and Ruston 1990; Kreith 1994, Zerbock 2003). The composition of waste in
an area is determined by factors such as the population of the area, climate, production
from industries, social behavior as well as the level of income of the population
(Baldisimo, 1988). The amount of solid waste generated in Nairobi’s municipalities is
estimated at about 4016 tones on a daily basis with about 45% of this being composed
of organic waste (Allison, 2010).
2.1.2 Organic Waste
Organic waste is anything that comes from plants or animals that is biodegradable.
Biodegradable waste is a type of waste which can be disintegrated into its base
compounds by micro-organisms and other living things within a short time regardless
of what those compounds may be (Ngera, 2014). Biodegradable waste can be used for
making compost manure for agricultural purposes, as a resource for production of heat,
fuel and electricity through incineration or anaerobic digestion to produce biogas,
(Ngera, 2014). Organic waste accounts for the highest waste produced in Nairobi city
at about 45.9%, paper waste comes in second at 20.7% followed by plastic waste 14.2%

8
then glass at 2.7% metals are fifth at 2.1% (Table 2.1). Other types of waste account for
14.4%.
Table 2.1: Waste characterization at immediate source and at communal waste
collection points for Business, Commercial and Institutional generators.
Waste
Type
Source of Waste
Retail
Shop
Office and
Workplace
Institutions Hotels Business
Areas
Waste collection
points adjacent
to markets
Average
Organic 43.6 25.9 48.9 69.2 36.4 51.3 45.9
Paper 22.0 42.1 19.8 10.2 18.9 11.1 20.7
Plastics 19.8 17.1 10.9 8.7 14.3 14.3 14.2
Glass 2.3 0.0 3.7 1.4 5.5 3.1 2.7
Metal 2.1 0.8 2.7 1.6 3.4 2.2 2.1
Other 10.2 14.0 14.0 8.9 21.5 18.0 14.4
Source: NCC, (2010)
According to the Nairobi City County, organic matter in the County accounts for the
highest content and therefore more emphasis needs to be put in place on the
management of this kind of waste. Organic waste is composed of both fruit and
vegetable waste.

9
2.1.3 Municipal Solid Waste
According to a study conducted by JICA in Nairobi County, (1998) municipal waste is
defined as solid waste and consists of: business waste, household wastes of small
amount less than 50kgs, wastes produced from institutions such as markets, schools and
hospitals that do not need to be treated and dead animals with an exception of
domesticated animals. According to Syagga, (1992), about one half of the solid waste
generated in Nairobi is made up of organic matter. Toxic materials are estimated to be
0.2 percent of the total. For markets alone, it is estimated that more than three-quarters
of the waste is organic material. The daily generation of solid wastes from the city is
estimated as a whole range from 19,000-24,000 tonnes (NCC, 2010). The volumes of
solid wastes generated in Nairobi has increased as the population increases in the city.
With the large amounts of municipal refuse generated daily, there is need for a highly
efficient system to manage its collection and disposal. The Environmental Management
Coordination Act (1999) advocates for adequate solid and hazardous waste disposal
from households as well as institutions.
2.2 Waste Management in Developing Countries
Numerous researchers have documented that the collection of solid waste (SW) in most
African cities does not exceed 25% (UNEP, 2016). Due to the high level of uncollected
garbage, this has an effect on the environment as well as human health. There are
different forms of waste management and collection in different parts of the world. In
Latin American cities, waste collectors use carts, donkeys, bicycles to collect waste.
They sort the waste and pick out recyclables before disposing off the waste that remains
(Beall et al., 2010). This is a big contrast to what happens in African Cities where waste
is hardly segregated and this makes recycling very difficult. In Mexico City’s low
income areas, informal waste handlers collect waste on behalf of the municipalities.

10
The municipalities on the other hand carry out street sweeping and cleaning of public
places (Weiner and Mathews, 2003). Dumping of solid waste is a common phenomenon
in developing countries and thus street sweeping is carried out to manage the waste.
Wastes from households are usually put in plastic bags and waste collectors pick up the
waste on a regular basis. Solid waste management is treated as a local government
responsibility in Sri Lanka (EPA, 2009). However, municipal solid waste management
continues to be a challenge as there are no well laid down structures for management of
solid waste. Rapid urbanization and industrialization have also aggravated the problem
of waste management due to an influx of people in urban areas and lack of proper waste
management structures. Solid waste management is treated as a local government
responsibility in Sri Lanka (EPA, 2009).
2.3 Market Waste Management in Developing Countries
The market place is one of the most important areas where trade of goods occurs in
developing countries. According to Yhdego and Majura (1998), the main cause of
mortality and morbidity in these countries is a result of infectious diseases. Various
factors have contributed to this the main one being lack of proper waste management
practices as well as poor sanitation in the market places. In developing countries, most
markets lack basic facilities for waste disposal (Barnmeke and Sridhar 1989). The
market designs are also not appropriate and often market corridors are too narrow hence
waste collectors cannot pass freely. This situation contributes to indiscriminate dumping
of waste in undesignated areas in the market which leads to breeding of various pests
such as flies, rats and cockroaches. According to Omotara (1985), flies are major
disease vectors especially in tropical countries and they transmit diseases such as
salmonellosis, shigellosis, cholera and hepatitis. Flies are also major food contaminants
in the market, while rats are known carriers of human plague.

11
2.3.1 Market Waste Management in Nairobi
Waste management is a process whereby various methods are used to effectively and
efficiently regulate waste from the point of generation to the final disposal point. The
main aim of waste management is to have a clean, safe and healthy environment at the
lower cost (Igbinomwanhia, 2011). In Nairobi County, waste from the market places is
not being managed effectively (Gakungu, 2011). The systems of waste collection and
disposal that have been put in place are not friendly to the environment. More than 30%
of solid waste generated in Nairobi’s market places is left uncollected (Otieno, 2010).
According to Allison (2010) only about 4% of waste produced is reused or recycled.
This situation has been aggravated by the breakdown of about 80% of the trucks that
are used to transport the waste. The County government of Nairobi does not treat the
problem of waste management with the seriousness it deserves and this has resulted in
the pilling of waste in different areas across the city (Kibwage, 2009).
Reliable information on the composition of waste generated is important in order to
formulate effective strategies to meet the waste management targets. Kenya has made
strides in waste management by reviewing the laws and policies related to waste
management such as the Environmental Management and Coordination Act (EMCA,
2016). This Act states that every Kenyan has the right to live in a clean and healthy
environment. It also states that it is the duty of every Kenyan to safeguard and enhance
the environment for the benefit of the current generation as well as that of the future
generation (UNEP, 2010). These laws have not been effectively implemented in Kenya
and thus the problem of solid waste persists. Efficient and effective waste management
can be expensive when time and resources are factored in and therefore it is useful to
know the options that are available for waste management in a safe, effective and
sustainable manner (El-Haggar, 2007).

12
The population of Nairobi County has been growing at a steady rate and so has solid
waste generated. Over the last decade increase in waste generated from the city has
been recorded at 7% (NCC, 2010). As shown in figure 2.1, waste collection by the City
Council of Nairobi has almost stagnated despite the increasing population and
quantities of waste produced.
Source NCC, (2010)
Figure 2.1: Trends in Solid Waste Generation in Nairobi
Private waste collection from the city has increased tremendously from the year 1986
to date (NCC, 2010). The private collectors collect waste and transport it to final
disposal sites. Most people have taken up the job of waste collection though they charge
city residents a higher waste collection fee compared to what the city council charges.
The emergence of community based organizations at around 1998 also helped in waste
collection though most of them did not transport waste to designated areas (NCC, 2002).
Combined on the collection front, the joint effort of private collectors and community
based organizations (green line in Fig 2.1) have experienced similar growth rates as the

13
overall growth in waste whereas the council operated system of waste collection has
been lagging behind in terms of waste collection with only minimal growth. Overall, the
average waste composition at source was estimated to be 51% biodegradable, 38%
recyclable (metal, glass, plastic and paper) and 11% residual (NCC, 2010). The analysis
of composition of waste from the point of collection indicated that there was a decrease
in organic fraction and paper (down to 43%), this was a clear indication that more than
50% of the organic fraction of waste decomposes or rots or is disposed of between
source and collection points (NCC, 2010).
2.3.2 Market Waste Management Practices
Municipal market waste is usually organic in nature and thus can be composted
(Mshelia, 2015). Many youth groups have taken up making compost from market waste
and collecting recyclable materials from the waste. They are however facing numerous
challenges with the most important one being acquisition of land where they undertake
their composting business. Another challenge that they are facing is lack of a proper
market for the sale of their goods especially the compost manure and the waste paper.
An example of one such project is one that was established in Mukuru slums in 1998
(NCC, 2002). It generated about Ksh.1.55 million in 1998 from the recovery of 1018
tons of reusable and recyclable materials from waste. This revenue was however not
enough to finance the projects of the self-help group which had 60 members as well as
finance the investments required to improve efficiency (NCC, 2002).
2.4 Challenges Facing Market Waste Management in Nairobi
The Nairobi City County is required through the Environmental Management and
Coordination Act (EMCA) to provide Solid Waste Management services to all citizens.
The Nairobi City County has the capacity to dispose off only about 400 tonnes of waste

14
generated on a daily basis (JICA, 1998); this represents only a small fraction of the total
waste generated. The amount of waste disposed off by private companies in a month is
about 50 tonnes. Waste collection services are rarely provided to market areas due to
very high amounts of wastes generated in these areas, which overwhelm the available
vehicles and equipment. Other problems encountered include: lack of finances, not
acknowledging the importance of an effective waste management system by the policy
makers and lack of trained personnel on waste management (Kim-Peters, 1998). As a
result of the poor performance by the Nairobi City County and failure of private
services to extend their services into low-income unplanned settlement, there was
an emergence of community based organizations (CBOs). Majority of these CBOs
are engaged in waste composting although the primary activity of about 44% of them
is cleaning of urban neighborhoods (Ikiara et al., 2004). In Nairobi, about 55.6% of the
CBOs report having been sponsored or facilitated by local and international NGOs and
United Nations Agencies such as the UNFPA and UNCHS (HABITAT) to run their
activities of composting (Ikiara et al., 2004). Some of the challenges in Wakulima
market are discussed below.
2.4.1 Poor Market Design
Generally, the design of Wakulima market lacks onsite waste bins and skips. The
market also lacks proper waste corridors which waste collectors can use during waste
collection. There is also lack of stalls for displaying of goods and hence the traders
place their goods on the floor which makes the goods susceptible to rodents and other
pests (Yhdego, 1987).
15
2.4.2 Waste Storage
Traders who sell their goods near skips often place their wastes in the skips. However,
traders who are not near skips often dump their waste by the roadside, in water drainages
or leave their waste on the market floor. This makes waste collection from the market
very difficult as waste collectors have to gather all the waste from undesignated waste
disposal sites using wheelbarrows (NCC, 2002).
2.4.3 Waste Disposal
Market waste contributes to a huge amount of waste that is disposed of at the Dandora
dumpsite (NCC, 2010). At the disposal site, waste is disposed off without prior sorting
and this in turn leads to environmental diseases and health hazards. At the Dandora
dumpsite, there is a lot of smoke from burning of waste as well as bad odour from waste
decay. There are no proper waste management practices such as recycling and
composting in place.
2.5 Processes in Market Waste Management
The main elements in the management of market waste include: waste generation,
storage, gathering, transporting, processing of the waste and recovery of useful
components and final disposal (UNEP, 2008). Waste generated is placed in either
dustbins or skips before it is collected and taken to its final disposal point which can be
a landfill. Waste can also be collected and put in small waste collection equipment such
as carts, then transferred to tracks which transport the waste to the final disposal point.
Waste collected can also be recovered and processed. Waste management elements are
further elaborated in the next section.

16
2.5.1 Waste Generation
It involves the process in which materials are seen as having no value and are therefore
discarded or compiled for disposal (Momoh and Oladebeye, 2010). According to UNEP
(2008), in 2006 municipal solid waste (MSW) generated in total about 2.02 billion tones
globally, this represented an annual increase of 7% since 2003.According to the UNEP
(2008) report, global municipal waste generation is set to rise by 37.3% between 2007
and 2017 which is equal to about 8 per cent increase per year (UNEP, 2008).
2.5.2 Waste storage
According to Tchobanoglous et al., (1977), waste storage site is where waste is kept
before it is finally collected. Waste can be stored in a dustbins or skips and not thrown
away indiscriminately. According to them, waste storage is very important first because
of the aesthetic purposes as well as for environmental purposes. In Nairobi, market
waste is stored in heaps near roads before it is collected and taken to the final disposal
area.
2.5.3 Processing and Recovery
Processing and recovery is an element that includes all the equipment, technology and
facilities used both to enhance the efficiency and recover materials that are usable, as
well as the conversion of solid waste to other products or energy (Tchobanoglous et al.,
1977). Resources that are of value have been recovered from the solid waste in waste
transfer stations and plants for processing solid waste (Tchobanoglous et al., 1977).
Waste disposal is the final stage in waste management. In Nairobi, most of the waste
that is collected is usually disposed of at the Dandora dumpsite.

17
2.5.4 Transfer and Transport and Final Disposal of Waste
According to Kreith (1994), transfer and transport of waste is done in two steps: one is
the transfer of wastes from the smaller collection vehicles such as carts and
wheelbarrows to the larger transport equipment and two the transportation of the
collected waste mostly over long distances to the final waste disposal sites. The most
common method of waste management in markets in Kenya is through open dumpsites.
Waste that is disposed of in open dumpsites is neither treated nor segregated. Many
people in Africa consider open dumping of waste as the cheapest method of handling
waste and that is why this method is the most common (UNEP, 2005). In Kenya, other
than the temporary dumpsite at Kayole which was started in 2009, the Dandora
dumpsite remains the only place where solid waste is finally disposed in Nairobi.
Dandora dumpsite can hold up to 1.8 million m3 of solid waste. With rapid population
growth in Nairobi as a result of urbanization, the dumpsite is nearly full. There are other
dumpsites not authorized by the CCN that are scattered all over the city where most
private waste collectors dump their waste. This has made the management of solid
waste in the city a big challenge.
2.6 Actors in Waste Management
Waste management in Nairobi is carried out by various stakeholders. The stakeholders
include; Ministry of Environment and Forestry, Nairobi City County, Ministry of
Lands, Housing and Urban development, Community based organizations, Non-
Governmental Organizations and private operators. The National government is
mandated with the responsibility of coming up with legal and institutional framework
for management of solid waste. County governments on the other hand have the
responsibility of providing services for collection and disposal of waste.

18
Community based organizations are mostly found in informal settlements such as
Kayole and Kibera where solid waste is dumped near roads, drainage systems and other
undesignated areas. Non-Governmental Organizations act as the connection between
the government and the private sector. Private sector operators can either be large
enterprises or individuals contracted to collect waste in places where people live. In
total, there are around 120 private companies that have been licensed by the former
Nairobi City County and another 140 that are privately owned by individuals who
participate in the management of waste (Ngau and Kahiu, 2009).
2.7 Sustainable municipal Waste Management
The sustainable solid waste management concept is aimed at constantly improving the
environment, support economic productivity and growth, provide health benefits and
provide dignified, safe, and secure employment to the people. Many developing
countries have not succeeded well with the implementation of sustainable solid waste
management due to different factors acting as barriers to municipal solid waste
management (Ezeah, 2010). Sustainable solid waste management can be achieved
through; providing clear functions to relevant agencies and enhancing their
coordination, coming up with adequate and qualified human resources, developing self-
financing schemes, supporting strategic planning and follow-up implementations and
raising awareness of the public and decision makers.

19
2.8 Solid Waste Management Hierarchy
The solid waste management hierarchy (Fig 2.2) is used to indicate the order that should
be followed for the management system to be successful. The purpose of the waste
management hierarchy is to ensure that maximum benefits are extracted from the waste.
Source: AESSL: 2001
Figure 2.2: Hierarchy of management of solid waste
2.8.1 Waste prevention and Reduction
According to Denison and Ruston (1990), waste reduction is defined as any actions that
decrease the quantity or toxicity of solid waste before the waste is processed and disposed
in landfills or burnt in incinerators. This definition concurs with the one given by Kreith,
(1994) who states that the focus of source reduction is on decreasing the volume and
/or toxicity of waste generated. Source reduction involves a transition to use products
and packaging that are reusable. The most common example is the use of returnable
soda bottles. Reduction of waste from the point of generation will help solve waste
problems in the future, (NEMA, 2014). Reduction at consumption level includes; better

20
buying habits, reuse of containers (including bags) and reducing on the use of
disposable products and packaging material (USPS, 2000).
Source separation and resource recovery are very important in management of waste.
Waste may be of no value to the person who is disposing it. According to Tsiboe and
Marbel (2004),
Denmark, Austria and the Netherland developed a process for waste management in
2004 to effectively deal with the problem of solid waste disposal. They did this by
encouraging the citizens in their countries to carry out separation of their domestic waste
into paper, plastic, and glass categories; this enhances easy waste collection and reuse
(Tsiboe and Marbel, 2004). Waste prevention involves changing people’s consumption
patterns, redesigning the use of products and waste generation and reduces the toxicity
of waste that is produced (USEPA, 1995).
The main issue that leads to a lot of waste in Wakulima market is oversupply of
foodstuffs into the market. This often happens especially when a certain product is in
season. In order to curb the problem of waste in the market, adequate measures need to
be put in place. First is to ensure that what is brought in the market is what is actually
needed. Second is to better understand the barriers to opportunities, potential partners
and actors to minimize food wastage. Prevention could put more emphasis on product
demand, products wastefulness during production, or actual product disposal. With
regards to consumers, effort should be placed on trying to minimize the sale of certain
products for example imposing tax on plastic taxes on plastic bags (Convery et al.,
2007).

21
2.8.2 Re-use
It is often possible to make use of a product multiple times without changing it and for
the same purpose for which it was originally intended; this is known as reuse (USEPA,
1995). Some of the items that can be reused include: plastic bags and sacks which are
used for packaging in the market. Once reused there is no need to buy other products
and this helps to reduce waste. Advantages of reusing include prevention of pollution
which arises as a result of reducing the need to get new raw materials. It also helps to
save energy that would have been used to manufacture the product as well as reducing
the emission of greenhouse gases which contributes to climate change and helps to
ensure environmental sustainability for future generations among other benefits
2.8.3 Recycle
The process of recycling entails the collection, separation and processing of waste so
that it can have a high productive value (Pattnik and Reddy, 2009). Theoretically, the
components of waste that can be recycled include: plastic bags, plastic containers,
gunny bags, glass, metals and organic materials which can be fed to animals or used to
make compost manure for use in agriculture (William, 2005).
2.8.4 Composting
Composting is a process that takes up organic matter and converts it into nutrients that are
useful for plants. Organic farmers make use of organic waste which is usually made by
letting organic materials decompose for several days or months until they are
decomposed by microbes. Composting is a very good method of disposal of waste as it
converts organic materials that are unsafe into safe compost. As waste generated in
developing countries is mostly organic in nature, composting may be a good method of
waste disposal as it is easy, cheap and very beneficial as the compost manure generated

22
can be used in farms to enhance crop production. (Troschinetz and Mihelcic, 2008).
2.8.5 Energy Recovery
The US Energy Protection Agency defines energy recovery from waste as the
conversion of materials that cannot be recycled into electricity, usable heat, or fuel
through various processes. These processes include combustion, pyrolization,
gasification, landfill gas recovery and anaerobic digestion. This process is usually
referred to as waste to energy (US Energy Protection Agency). The process of energy
recovery also helps to produce a fuel that is combustible. These fuels include
combustible: methanol, methane, or synthetic fuels.
2.8.6 Land Filling
Land filling involves placing waste in confined areas, compressing and compacting and
then placing soil on the waste to cover it. This process is repeated over on over until the
landfill is filled to capacity. Landfills help to reduce burning of garbage which leads to
production of air pollutants and also helps in land reclamation. The landfill can be
converted into land for valuable use such as planting of trees or establishment of
recreational parks and gardens. (Centre for Environment and Development, 2003).
Zerbock, (2003) states that the use of landfills for waste disposal is one of the most
ancient and the most prevalent method of disposal of solid waste. He also states that
“landfills are also open dumps though they are controlled. According to him landfills
can be differentiated from open dumps by the level of planning, engineering, and
administration involved. Zerbock, (2003) states that open dumps can be characterized
by lack of engineering controls, no management of leachate, no management of landfill,
and very few measures on operation such as user’s registration, control of the number
of “tipping fronts” or waste compaction. Landfills are considered as a method of wastes

23
management that nobody wants but beneficial to everybody (Kreith, 1994). According
to Kreith (1994), there are no waste management techniques that can work without the
use of landfills. They are considered as the only waste management method that is
sufficient and also necessary. According to Kreith (1994) some form of waste cannot
be recycled. However, a lot of waste that can be recycled eventually gets to a point
where its value is completely used and it cannot be converted into anything useful. He
states that the use of modern landfills can help protect both human health as well as the
environment.
Although landfills are considered a good method of waste disposal, they have some
disadvantages which include: high construction and maintenance costs; can lead to
ground water pollution through leaching, lack of land availability particularly in the
cities (Kreith, 1994).
2.9 Integrated Solid Waste Management
Integrated solid waste management is the strategic approach to the management of solid
waste in a sustainable manner (Fig 2.3). It covers all aspects of waste management which
include: generation, separation, transfer, treatment, sorting, recovery of useful products
and final disposal in an integrated manner, while emphasizing more on maximizing
efficiency in the use of resources (UNEP, 2008).

24
Figure 2.3: Integrated solid waste management Source: UNEP (2008)
There are many benefits that come about as a result of the use of integrated solid waste
management. Some of these benefits include: neighborhoods that are safer and cleaner,
efficiency in the use of resource, augmentation of resources and reduced costs of waste
management which leads to savings among others (UNEP, 2008). With efficient use of
waste recycling and segregation, a lot of waste can be converted into useful resources
instead of being taken to landfills (UNEP, 2005).
2.9.2 Solid Waste Generation
The main type of waste generated at Wakulima Market is biodegradable waste.
According to a recent survey conducted by the UNEP in 2016, Nairobi has a population
of about 4.0 million people and produces about 3,200 tons of waste on a daily basis.
Most of the waste generated is unaccounted for as only 850 tons reach Dandora
dumpsite. In an effort to deal with the problem, in 2013, the Nairobi City County in
collaboration with JICA and UNEP came up with a Solid Waste Management Plan
which would be implemented in the city to try and deal with the problem of waste
management. The solid waste management plan would involve doing away with the
Dandora dumpsite and in turn building a sanitary landfill in Ruai as well as two other

25
transfer stations. The solid waste management plan would also involve educating
various people in the food value chain in the market which would in turn help cut down
on the amount of waste that goes bad in transit to the market as well as within the
market. Another strategy which the Nairobi City County plans to adopt is further
building public-private-partnerships (PPP) with private waste collectors as well as
adopting the use of community based organizations (CBOs) (NCC, 2015).
2.9.3 Solid waste collection
Market waste is mostly biodegradable and therefore dumping of waste in undesignated
areas makes the market an unpleasant site to look at. There is also bad odour that comes
from the decomposition of the biodegradable waste which makes the market unsanitary.
Waste that is often dumped in drainages leads to blockages and this causes flooding in
the market especially during the rainy season. The use of open bins and skips for holding
waste is a big threat as flies and other animals transfer the waste to the foodstuffs in the
market. These types of storage facility need to be replaced with bins that are covered
(UNEP, 2009).
2.10 Solid waste disposal
The means for dumping solid waste collected from the Wakulima market area is open
dumping (NCC, 2010). Most of the solid waste in Nairobi is handled by the private
sector as well as NGOs. The Nairobi City County solid waste department has few
facilities for waste transportation. The few vehicles that are available often break down
as they are poorly serviced.
Lack of skilled workforce in the environment department as well as understaffing is
also a big challenge to effective management of waste. Lack of proper control leads to
waste disposal in undesignated sites. The waste generated from the market areas is

26
usually dumped on open fields such as the Dandora dumpsite. The residents of Dandora
are at a threat of suffering from environmental diseases as they are often exposed to
environmental hazards from the dumpsite. Burning of plastics at Dandora dumpsite
produces very toxic fumes, such as furans and dioxins, which are very harmful to human
beings and the environment. Uncontrolled dumpsites are some of the major sources of
greenhouse gases contributing to global climate change. (UN Habitat, 2007).
2.11 Waste Management Regulation and Policy
There are very few legal frameworks that deal with solid waste at the national level.
They are spread through a number of Acts and NCC’s by-laws (JICA, 1998). The act
of Parliament provides for the establishment of an appropriate legal and institutional
framework for the management of the environment and for the matter connected
therewith and incidental thereto. The Environmental Management and Coordination
Act, (1999) (revised 2016) provides guidance on waste management in Kenya.
Institutions under EMCA: National Environmental Management Authority (NEMA)
whose mandate is to exercise general supervision and co-ordination over all matters
relating to the environment and to be the principal instrument of Government in the
implementation of all policies relating to the environment. National Environment
Council is responsible for policy formulation directions for the purposes of the Act. The
Council also sets national goals and objectives, and determines policies and priorities
for the protection of the environment and the regulations that guide waste disposal is
the waste management. The waste management regulations apply to all categories of
waste. These include Industrial wastes; Hazardous and toxic wastes; Pesticides and
toxic substances; Biomedical wastes; Radio-active substances. These regulations
outline requirements for handling, storing, transporting, and treatment/ disposal of all
waste categories.

27
2.11.2 Theoretical Framework
Theory of Diffusion of Innovations (DOI on KAP Model)
The Diffusion of innovations theory by Rogers (1962) states that new methods and
concepts develop with the passing of time by spreading in other areas. The time factor
in this theory is instrumental as it accounts to the diffusion of the different
methodologies and waste management concepts across the country and to a greater
extent the world. Innovation diffusion theory have formed the basis of various
researches in the recent past, integrating innovation into knowledge, attitude, and
practice stages of innovation adoption as indicated by Hubbard and Hayashi,
(2003).Continuous environmental awareness to the public is a key concept to this theory
because it consists of creating awareness to the members of the public on environmental
management through cultivating K (knowledge) to perception, A (attitude) to affective,
and P (practice) to behaviour actions. Behaviour actions are a result of the public
learning some skills while P (practice) leads to behaviour change and better practices
(Wang et al., 2009). A great variety of studies about attitudes and knowledge have
procured a positive and significant relationship between the above two variables.
Bowman and Roth (1984) studied how levels of knowledge and attitude towards nature
conservation could be raised to positively affect visitor education. For all measured
concepts, the findings indicate a positive correlation knowledge test scores as well as
on attitude test scores. The other norm that is more subjective holds that a person’s
financial/economic status is a great determinant of his action and motivation in
accomplishing a given task. Owing to this norm, in his/her financial affluence can be
more motivated to undertake a task which he/she would otherwise decline from doing
when he/she is financially emaciated. To achieve this, a carefully evaluated education
and awareness strategy must be developed in order to change people’s habits, behaviour

28
and traditions. However, other theories have indicated that having environmental
awareness doesn’t necessarily mean having better environmental attitude and practices.
There is a need for the traders at the Wakulima market to identify gaps in these three
parameters.
2.12 Conceptual Framework
The conceptual framework is guided by the integrated solid waste management system
that promotes reduction, recycling and reuse of solid waste at all levels of waste
management that is from when waste is generated until its disposal. The main emphasis
of the framework is on management of waste from the Wakulima market as shown in
figure 2.4. In the solid waste management stream, the issues that need to be considered
include: Type of waste generated, various methods adopted in solid waste management
(separation of waste at source, waste reuse, recycling, composting and landfill) and the
role played by stakeholders in waste management.
Independent Variables Dependent Variables
Source: Researcher (2018)
Figure 2.4: Conceptual Framework
Type of Waste
Organic Waste
Inorganic Waste
Categories of Waste
Methods of Disposal
Waste Practices
Waste Collection
Waste Transportation
Disposal Method
Waste Management
Proper Disposal
Methods
Designation
Collection
Points
Source
Reduction,
Reusing and
recycling
Regulatory
Compliance
Infectious /
Hazardous
Waste

29
Proper waste disposal can only be achieved with the availability of adequate skips and
bins and a change in the attitude of the people with regards to waste management. Waste
produced from the market has to be transferred to landfills for final disposal and this is
heavily dependent on availability of resources such as waste collection trucks and also
the availability of workers in waste management. From the literature review, an
effective methodology has to be developed to enable proper data collection with an aim
of filling the gaps identified from the theoretical framework. Waste management should
be approached from the perspective of the entire cycle of material use which includes
production, distribution, and consumption as well as waste collection and disposal.
Priority should be given to effective collection and disposal while waste reduction and
recycling should be considered for implementation in future. The principles of
sustainable waste management should therefore be to: minimize waste generation,
maximize waste recycling and reuse and ensure environmentally sound disposal of
waste.

30
CHAPTER THREE
METHODS
3.0 Study Area
3.1 Location and size of Wakulima Market
Wakulima market is located in Muthurwa along Haile Selassie Avenue in Nairobi city
(Figure 2.5). Nairobi is located on a high altitude of 1°18'S, 36°45'E, 1798 m. It
experiences moderate climate. The annual rainfall averages 925 mm. Nairobi has two
rainy seasons, between March and June and between October and December. Daily
temperatures range between 12 and 26 degrees Celsius. The soils in Nairobi are as a
result of weathering of volcanic rocks with resultant varying drainage. The city center,
southern and eastern part of the city have clay soils with poor drainage, while the
western side has red soils that are well drained. Nairobi has a population of about 4
million people with a population density of Nairobi is 4850 residents per square Kilometer
(Kenya Bureau of Statistics 2017).
Source: Nairobi City County (2016)
Figure 2.5: Location of Wakulima Market

31
3.2 Layout of Wakulima Market
Wakulima market covers an area of about 0.9 ha with four buildings (designated as A,
B, C, D) and an open enclosure (designated as E). Building A is close to the markets
main offices and is separated from the record office at the entrance gate by a railway lane.
Building B joins building A and the two are separated by an aisle. Building C, is the
main building situated at the center of the market. Building D is situated to the western
end of the market. Between this building and the fortification of the market is found an
enclosed area E. In each of these buildings are to be found aisle ways originally intended
to be used by produce shoppers. Building A, B, C and D have a total roofed area of
24,100 sg ft. between buildings A, B, C and D is a continuous pavement with parking
bays alongside it, enough for a maximum of 70 vehicles. The market has three gates,
two of which are used by vehicles and the third one is used by train wagons. Distinct
commodity allocation is also apparent in this market. The items traded outside building
A are sold on retail. This is one of the areas in the market where overcrowding is
particularly serious. Similarly, the commodities being traded outside building D and
area E are on retail. In general, commodities listed as being traded outside any of these
buildings are stacked in the spaces originally designed for parking (NCC, 2016).

32
Figure 2.6 Layout of Wakulima Market
3.3 Produce sold in the market
The market has two gates one along Haile Selassie avenue while the other in on
Muthurwa Market road. The market operates between 6 a.m. and 12 noon. The vendors
in the market operate both on open air and under the shelter. More than 50% of Nairobi
residents get their fresh produce from Wakulima market. Some of the fresh produce
sold at the market include: Maize, peas, fresh potatoes, fruits, vegetables, garlic.
Bananas, cassava, spices, groundnuts, rice beans and other cereals
3.4 Demographic Characteristics
According to the Nairobi City County statistics (2016), Wakulima market has a
population of about 5000 traders. This is a huge increase from the 300 traders who were
there when the market was built in 1966 (NCC, 2002). The growth in the number of
traders has resulted from various factors. One is due to rapid urbanization, which has
resulted in too many people moving to urban areas in search of jobs and business
opportunities. Another factor is the location of the market, which is very attractive to
many traders due to the large number of customers visiting the market on a daily basis
(NCC, 2016).

33
3.5 Ownership of the Market
Wakulima market is solely owned by the Nairobi City County. The City Council was
the one that constructed the market and they are mandated with the duty of waste
management, collecting revenue from the market and offering waste collection
services.
3.6 Research Design
The research design employed in this study is the descriptive one which refers to a
systematic and empirical investigation where the researcher has no or little control of
independent variables due to their inherent nature, thus non-manipulated (Mugenda and
Mugenda, 2003). Systematic investigation is an activity that involves a prospective plan
that incorporates data collection, either quantitative or qualitative, and data analysis to
answer a question while empirical research is research that is based on observation and
measurement of phenomena, as directly experienced by the researcher.
Methodology
3.7 Data Sources
3.7.1 Secondary data
Secondary data was obtained from newspapers, books, journals, as well as from the
internet. Data was also collected from the city county offices.
3.7.2 Primary data
Primary data was collected directly from the field. Collection of primary data was done
through conducting field investigation, face to face interviews and the use of
questionnaires.

34
2
3.7.3 Field Observations
Preliminary field observations were conducted in the market.
3.8 Target Population.
The target population for the purpose of this research was traders at Wakulima market
and the city county officials who were in the department of solid waste. Wakulima
market has approximately five thousand traders (CCN, 2016).
3.9 Sampling Design
Data was collected using systematic random sampling where every 5th trader was
interviewed. Simple random sampling technique was used for questionnaire
distribution. Prior to data collection, the reconnaissance study was conducted a few
days prior to the day of data collection. It involved walking around the market
identifying key features that would be useful in the overall data collection process.
Sample Size
The sample size of the area where the study was conducted was arrived at by use of
proportional allocation through the formula of (Kothari, 2011). The number of traders
in the market was used as a determinant to the sample size
Formula for Calculating a Sample size
Cochran formula was used
m = M
1+𝑀(𝑒)2
M=Population
m = Sample size

35
e = the desired level of precision (margin of error) (The margin of error is taken to be
10% for economical expediency purposes).
m = 5000
1+5000(0.1)
m = 95
m= sample size of 95
Procedure for sampling
The sampling design used in the study was cluster sampling where traders were
categorized based on the products that they sold. Data was collected from 35 traders
who sold fruits, 30 who sold vegetables, 20 who sold dry crops and rice and 10 who
sold other products such as packaging bags. Simple random sampling was used during
data collection.
3.10 Data Collection Tools
Questionnaire survey
In administering the questionnaire for the purpose of capturing the primary data, two
approaches were used: self-administered and the drop and pick approaches. In this
research the self-administered approach was used. The informants were purposely
selected for their ability to inform the study objectives. The questionnaires were issued
by the researcher with the help of one research assistant. Prior to issuing a questionnaire
to the respondent, a brief introduction was done. The introduction included the name of
the researcher and the purpose of the research. The questionnaire were issued to traders
between 12 noon and 1 p.m. when the traders were not too busy.
2

36
3.10 Field Observations
Field observations were made at all times when doing the field visits. Notes which
summarized the observation were recorded in a notebook directly after field
observations were made. The information included; time and place of the field
observation, a summary of what was observed as well as the category of the observation.
Observations included generation of waste, disposal and treatment, feature of the waste,
waste collectors and other informal workers. These categories were helpful in
highlighting the main items that needed to be observed during the field walks.
3.11 Data Analysis
Data obtained through questionnaires was processed through editing, coding and
entering it into SPSS for analysis. Data was analyzed using descriptive statistics such
as frequencies, mean and standard deviation and displayed using tables and figures.
Inferential statistics used included regression and correlation analysis. Results were
presented by use of charts, graphs and tables.

37
CHAPTER FOUR
RESULTS AND DISCUSSION
4.1 Introduction
This chapter is focused on the presentation of waste management at Wakulima market.
4.2 Trader Characteristics in Wakulima Market
Out of the 100 traders who were interviewed 39% were male while 61% were female.
There were varied age differences among the respondents as follows: those aged 20-29
were (27%) according to respondents, 30-39 (41%) 40-49 (22%) 50-59 (9%) and lastly
above 60years (1%) (Figure 4.1)
Figure 4.1: Age of respondents
60-69 50-59 40-19
Age range
20-29 30-39
1
9
22
27
Age of Respondents
41 45
40
35
30
25
20
15
10
5
0
Age
in y
ears

38
4.2.1 Products sold in the market
Among the products sold in the market, fruits were the most common type of products
sold in the market accounting for 43%. Vegetables followed closely at 41%. Other
products sold in the market included: plastic bags at 9%, sacks at 6% and clothes at 1%
(Table 4.1).
Table 4.1: Type of produce sold in the market
Type of Produce Percentage (%)
Clothes 1
Fruits 43
Plastic Bags 9
Sacks/ Gunny bags 6
Vegetables 41
Total 100
This showed that many traders used plastic bags to package food items from the market.
This further revealed why many plastic bags were seen scattered in and out of the
market. Sacks were at 6% while clothes came in last at 1%. The study showed a
significant positive correlation between the product sold and the type of waste produced
(r=0. 119, P=0.238 and r=0.262, P=0.126). This implied that products that were mostly
sold in the market produced the highest amounts of waste. The set level of significance
was p=0.05. Plate 4.1 below shows traders selling different products at Wakulima
market.

39
Plate 4.1: Traders selling different types of produce in the market
Source: Author’s fieldwork (2018)
4.2.2 Factors contributing to sale of various products
Traders provided various reasons as to why they decided to choose the specific produce
that they were selling. Most traders sold produce that they obtained from their farms
(Table 4.2). The traders who obtained the produce from their farms carried produce in
sacks and baskets to the market, which were later reused. On the other hand, traders
chose the produce to sell based on the availability of the produce for example most
traders would sell oranges if they are the ones in season. Other factors that led traders
to choose their various produce included ease of sale of products and also selling
products that require little capital to purchase.

40
Table 4.2: Factors contributing to sale of various products
Factors Percent (%)
Easily Available 26
Easy to sell 16
Get from farm 35
Profitable 21
Requires little capital to start 2
Total 100
4.2.3 Source of produce
According to 45% of respondents, traders in the market obtained produce from suppliers
(Figure 4.2). Most of the traders interviewed stated that it was cheaper to buy produce
from suppliers and this enabled them to get more profits from their businesses. While
31% got produce from their farms.
Figure 4.2: Source of produce
Own Farm Suppliers Other Farmers Other traders
Source of produce
6
18
31
45 50
40
30
20
10
0
SOURCE OF PRODUCE BROUGHT TO THE MARKET
Per
cen
tage

41
The traders who obtained produce from their farms were mostly farmers from the
outskirts of Nairobi. They had their farms in places such as Kinangop, Gatundu, Kiambu
and Muranga. From the traders interviewed, 18% of the traders bought produce from
other farmers while 6% bought produce from other traders. The study revealed that
there was non-significant positive correlation between the source of produce and
quantity of waste produced (r=0.100, p=0.495and r=0.189, p=.203). This implied that
the source of produce did not affect the quantity of waste produced in the market.
4.2.4 Packaging Material
Some of the traders in the market provided their customers with packaging materials.
From the traders interviewed, 51% stated that they provided their customers with
packaging material while 49% did not provide their customers with any form of
packaging material. As shown in Figure 4.3 below, the most common type of packaging
material provided to customers was plastic bags at 65%.
Figure 4.3: Types of packaging materials
Type of packaging material provided by traders
70 65
60
50
40
30 20
20 10
10 5
0
Plastic bags Sacks Nets Cartons
Type of packaging material
Per
cen
tage

42
The use of plastic bags contributed to the problem of waste pilling in the market as the
plastics are inorganic and most people discarded them in the market, by the roadside or
even in drainage systems. Sacks were the second most type of packaging material used
at 20%. Sacks did not contribute too much waste in the market as most traders reused
them over and over to carry goods to the market. Nets came a distant third at 5%. Nets
were mostly used to package goods such as onions and fruits. Nets contributed to the
problem of waste in the market as they are made of plastic material that is non-
biodegradable. The least used type of packaging material were cartons at 10%. Cartons
were mostly used to package goods such as apples and grapes. Cartons did not
contribute too much waste in the market as they are biodegradable. Traders who did not
provide their customers with any packaging materials were 49.4%. The use of plastic
bags as packaging material contributed to waste in the market as plastic bags as they
were commonly used and do not decompose. Plate 4.2 below shows some of the
packaging material used to package products in the market.
Plate 4.2: Produce packaged in sacks
Source: Author’s fieldwork (2018)

43
4.2.5 Proposed Plastic ban
The government of Kenya in collaboration with the Ministry of Environment and
NEMA has come up with a proposed ban on all plastic bags (NEMA, 2017). This is in
an effort to minimize the amount of inorganic waste produced in the country. Of all the
traders interviewed in the market 66% were aware of the proposed plastic bags ban by
the government while 34% of the traders were not aware of the plastic bag ban. The
traders who stated that the proposed plastic ban would affect their businesses were
59%. They stated that they were not aware of alternative packaging material which
they would provide for their customers. They also stated that the ban would reduce the
number of customers since most customers do not usually carry their own packaging
bags. The traders who stated that plastic bag ban would not affect their businesses were
41% of the people interviewed. Their reason was that they did not provide packaging
material to their customers anyway. Most of the traders who did not provide packaging,
material to their customers were mostly wholesale traders while those who provided
packaging material sold their produce in retail.
4.2.6 State of produce brought to the market
Traders who brought already ripe fruits to the market were 47% compared to 27% who
brought moderately ripe produce to the market and 16% who brought unripe produce
to the market (Table 4.3).
Table 4.3: State of produce brought to the market
State of Produce Percent
Moderately ripe 27.3
Ripe 47.5
Unripe 16.2
Total 100

44
Bringing ripe produce was a major contributor of organic waste into the market since
produce took very few days before it went bad. This was evident in the market as piles
of fruits such as mangoes, melons and avocadoes could be seen scattered in the market.
Traders who dealt with tomatoes stated that their suppliers would package very ripe
tomatoes at the bottom of the packaging boxes and pack the unripe ones on top of the
box and sell to unsuspecting customers. Most of the very ripe tomatoes had a shelf life
of only one day and so most of it often went bad especially on days when there were few
customers in the market. There was positive correlation between state of produce
brought to the market and the quantity of waste produced (r= 0.546, p=0.005 and
r=0.349, p=0.005). The traders who brought produce that was already ripe to the market
had more of their produce going bad compared to those who brought produce that was
unripe.
4.2.7 Method of sale of produce
Selling goods in retail led to production of a lot of waste as most traders would provide
each of their customers with packaging material. The traders who sold their produce in
wholesale used sacks and nets as packaging materials. This helped reduce the amounts
of waste in the market as shown in table 4.4.
Table 4.4: Method of sale of produce
Method of Sale Percent
Retail 39
Wholesale 19
Both 45
Total 100
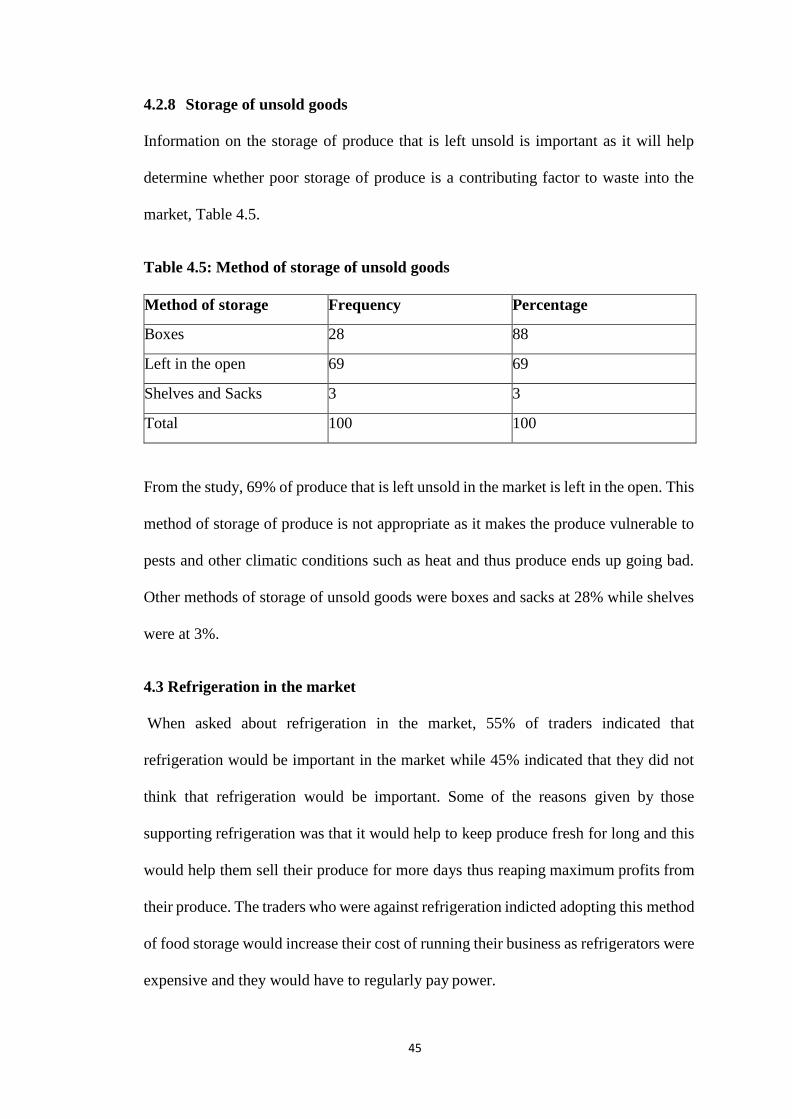
45
4.2.8 Storage of unsold goods
Information on the storage of produce that is left unsold is important as it will help
determine whether poor storage of produce is a contributing factor to waste into the
market, Table 4.5.
Table 4.5: Method of storage of unsold goods
Method of storage Frequency Percentage
Boxes 28 88
Left in the open 69 69
Shelves and Sacks 3 3
Total 100 100
From the study, 69% of produce that is left unsold in the market is left in the open. This
method of storage of produce is not appropriate as it makes the produce vulnerable to
pests and other climatic conditions such as heat and thus produce ends up going bad.
Other methods of storage of unsold goods were boxes and sacks at 28% while shelves
were at 3%.
4.3 Refrigeration in the market
When asked about refrigeration in the market, 55% of traders indicated that
refrigeration would be important in the market while 45% indicated that they did not
think that refrigeration would be important. Some of the reasons given by those
supporting refrigeration was that it would help to keep produce fresh for long and this
would help them sell their produce for more days thus reaping maximum profits from
their produce. The traders who were against refrigeration indicted adopting this method
of food storage would increase their cost of running their business as refrigerators were
expensive and they would have to regularly pay power.

46
4.2.9 Components of waste at Wakulima Market
The product with the highest amount of waste was Fruit waste at 34%, followed closely
by vegetable waste 33% then plastic bags 24% and finally sacks at 9 % (Figure 4.4).
Figure 4.4: Components of Waste
Organic waste accounted for the largest percentage of waste from the market. This
explains why a lot of stale fruit and vegetables were seen scattered in the market. Sacks
accounted for the least waste from the market as many traders reused their sacks or sold
them to other traders. Sacks were also reused over and over again. Plate 4.3 shows the
components of waste at Wakulima market.
Components of waste in the Market
9%
33% 24%
34%
Vegetable waste
Fruit Waste
Plastic bags
Sacks

47
Plate 4.3: Components of waste at the market
Source: Author’s fieldwork (2018)
As shown in plate 4.3, there was indiscriminate dumping of waste in the market. There
was no separation of the various components of waste. This made proper waste
handling increasingly difficult
4.2.10 Produce going bad
From the traders that were interviewed, it was evident that a certain percentage of the
produce they bring to the market goes bad. Of all the traders interviewed 77% indicated
that some of the produce they brought to the market went bad while 23% stated that
their produce did not go bad. Various reasons were given as to what contributes to
produce going bad. Some of the reasons included bringing goods to the market when
they are already ripe. This reduced the life span of the goods and after one day some of
the produce already starts going bad. Another factor that contributed to produce going
bad was poor storage of goods in the market. When fresh produce is not properly
stored it is affected by weather conditions and this led to the produce going bad.

48
Rodents were also highlighted as another factor that contributed to waste in the market.
There were so many rats in the market and they fed on the produce that is left unsold in
the market. The rodents not only led to produce going bad but also posed a danger to
human health as they are disease vectors. Unpredictable market trends also led to the
problem of waste in the market. This was so as traders are not able to approximate the
number of customers that they expect and thus they oversupply goods to the market.
The extra produce is left unsold for several days and it ends up as waste.
Figure 4.5: Frequency of produce going bad
As shown in figure 4.5 above, from the traders who were interviewed, 4% stated that
their produce went bad at least once every month, 25% stated that their produce went
bad at least twice every month, 39% stated that their produce went bad at least three
times in a month while 32% stated that their produce went bad at least for times in a
month.

49
4.2.10.1 Methods of vegetable waste disposal
The most common place for waste disposal was in market corners at 29%. This could
be as a result of lack of enough bins and skips in the market where traders can place
their waste. The next most common place for waste disposal is by the roadside at 25%
followed by leaving waste in the market at 24%. Only a few traders put their waste in
bins and skips at 22%. (Table 4.6 and plate 4.4).
Table 4.6 Methods of vegetable waste disposal
Methods of vegetable waste disposal Percentage
Heaped at a corner 29
Left by the roadside 25
Left in the market 24
Put in skips 22
Total 100
Plate 4.4: Skips used in waste storage
Source: Author’s fieldwork (2018)

50
4.2.11 Methods of Storage of Fruit Waste
Table 4.7 Method of Storage of Fruit Waste
Method of fruit waste disposal Percentage
Heaped at a corner 27
Left by the roadside 28
Left in the market 22
Put in skips 23
Total 100
From table 4.7 above, 28% of the respondents indicated that they left fruit waste by the
roadside, 27% indicated that they heaped the fruit waste at a corner, 23% put fruit waste
in skips while 22% of the traders left the fruit waste in the market. Plate 4.5 below
shows fruits left by the roadside
Plate 4.5: Fruit waste disposed in the market
Source: Author’s fieldwork (2018)

51
4.2.12 Methods of disposal of plastic bags Plastic Waste Disposal
As shown in table 4.8, 33% of the respondents indicated that they heaped plastic waste
at a corner, 25% indicated that they left their plastic waste by the roadside.23% left the
plastic waste in the market while only 19% put their waste in skips.
Table 4.8: Methods of disposal of plastic bags
Methods of plastic waste disposal Percent
Heaped at a corner 33
Left by the roadside 25
Left in the market 23
Put in skips 19
Total 100
Plate 4.6: Disposal of plastic waste in the market
Source: Author’s fieldwork (2018)

52
4.2.12.1 Methods of disposal of sack waste
Sacks contribute to the least amount of waste from the market as most of the traders
reused them. The sacks that were too old for reuse were the ones that were often
discarded. Table 4.9 shows the various methods of disposal of sack waste.
Table 4.9: Disposal of sack waste
Methods of sack waste disposal Percent
Heaped at a corner 23
Left by the roadside 31
Left in the market 27
Put in skips 19
Total 100
Of the traders interviewed, 31% of them indicated that they left their sack waste by the
roadside, 27% left sack waste in the market, and 23% of the respondents heaped the
waste at a corner while only 19% put their waste in skips (Table 4.9).
Plate 4.7: Disposal of sacks in the market
Source: Author’s fieldwork (2018)

53
4.3 Factors contributing to waste increase in the market
Factors that led to an increase of fruit and vegetable waste in the market included,
Oversupply of fruits to the market, poor storage of fruits that are left unsold, poor
transportation of the fruits, rodents that feed on the fruits and lack of customers. Factors
that led to an increase in plastic bag waste were that most buyers did not want to carry
their own storage bags and hence traders have to package the goods in plastic bags. The
traders also indicated that compared to sacks and nets of plastic bags were cheap and
that why they opted for the cheaper option.
4.4 Product with the highest increase in waste
Factors that led to increase of waste were that most traders brought their produce to the
market when they were already ripe and therefore they had a shorter shelf life. Some
of the products brought to the market got spoilt during transportation. This was as a
result of breakdown of trucks bringing produce to the market thus they take more days
to get to the market. The trucks used for transporting fruits to the market were also not
well designed and lacked refrigeration facilities. The product waste which had increased
the most in the last ten years was fruits 65%. Vegetables were second at 22% while
plastic bags were third at 13% (Fig 4.6).
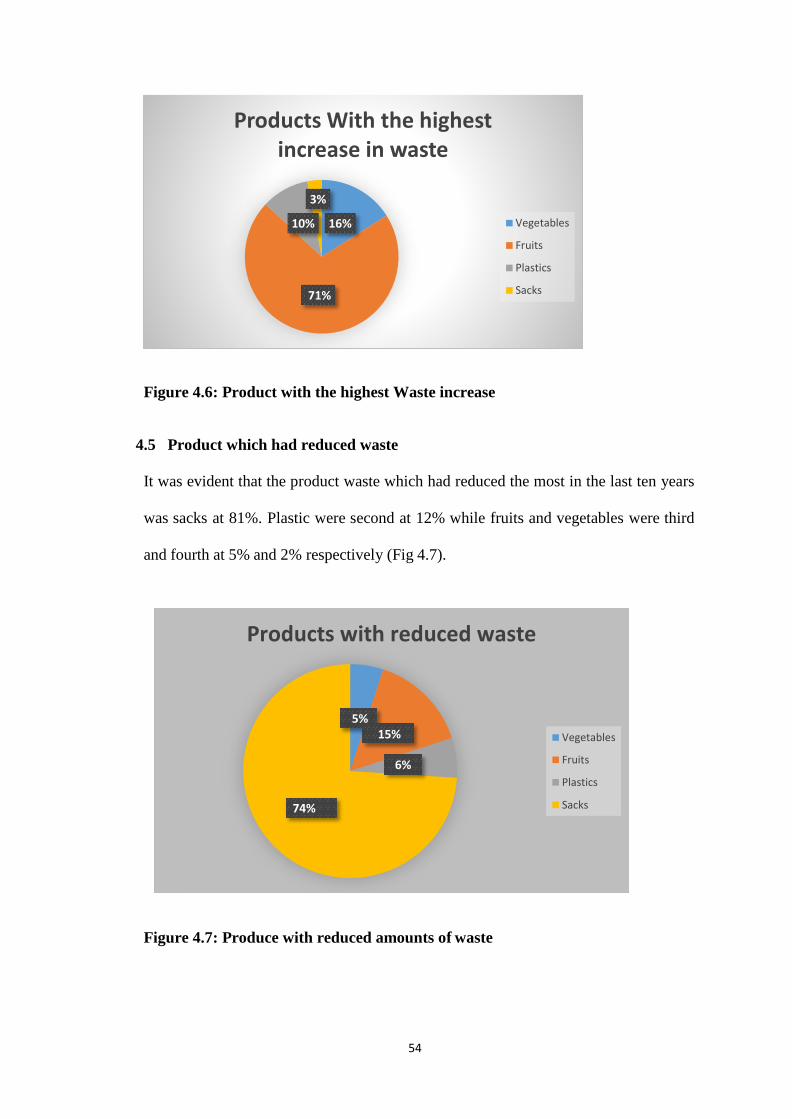
54
Figure 4.6: Product with the highest Waste increase
4.5 Product which had reduced waste
It was evident that the product waste which had reduced the most in the last ten years
was sacks at 81%. Plastic were second at 12% while fruits and vegetables were third
and fourth at 5% and 2% respectively (Fig 4.7).
Figure 4.7: Produce with reduced amounts of waste
16%
71%
10%
3%
Products With the highest increase in waste
Vegetables
Fruits
Plastics
Sacks
Products with reduced waste
5%
15%
6%
74%
Vegetables
Fruits
Plastics
Sacks

55
Factors that led to a reduction of sack waste was that most traders reused their sacks
and when they could no longer reuse the sacks they sold them to other traders who use
the sacks to make tents and baskets. A reduction in waste from plastic bags had been
contributed by the campaigns by the government and NEMA on the ban of plastic bags
and hence some traders were already looking for alternative ways of carrying their
produce.
4.6 Waste management system
Among the traders interviewed, 65% of them stated that there was a waste management
system in the market while 35% of them stated that there was no waste management
system. The ones who stated that they were aware of a waste management system stated
that it was implemented in 2010 and the Nairobi county government was the institution
mandated with the responsibility of waste management from the market. They stated
that the city council sweeps and collects waste from the market. To ensure effective
waste collection, the market is usually closed from 12 p.m. The traders stated that
despite there being a waste management system, waste was not effectively collected
from the market and this led to pilling of waste in the market. The traders stated that
before 2010 there was no waste management system in the market. This contributed to
pilling of waste in the market as no one was concerned with collecting the waste. The
market was very filthy and acted as a breeding ground for rats and other rodents.
4.6.3 Availability of dustbins and skips
Lack of this essential facility led to littering of waste by the roadside, in open spaces
and other undesignated areas. The ratio of skips to traders is 1:800. This low number of
skips has also made it impossible to separate waste as there aren’t enough skips where
different types of waste can be put. The ratio of bins to traders is 1:100. This was a very
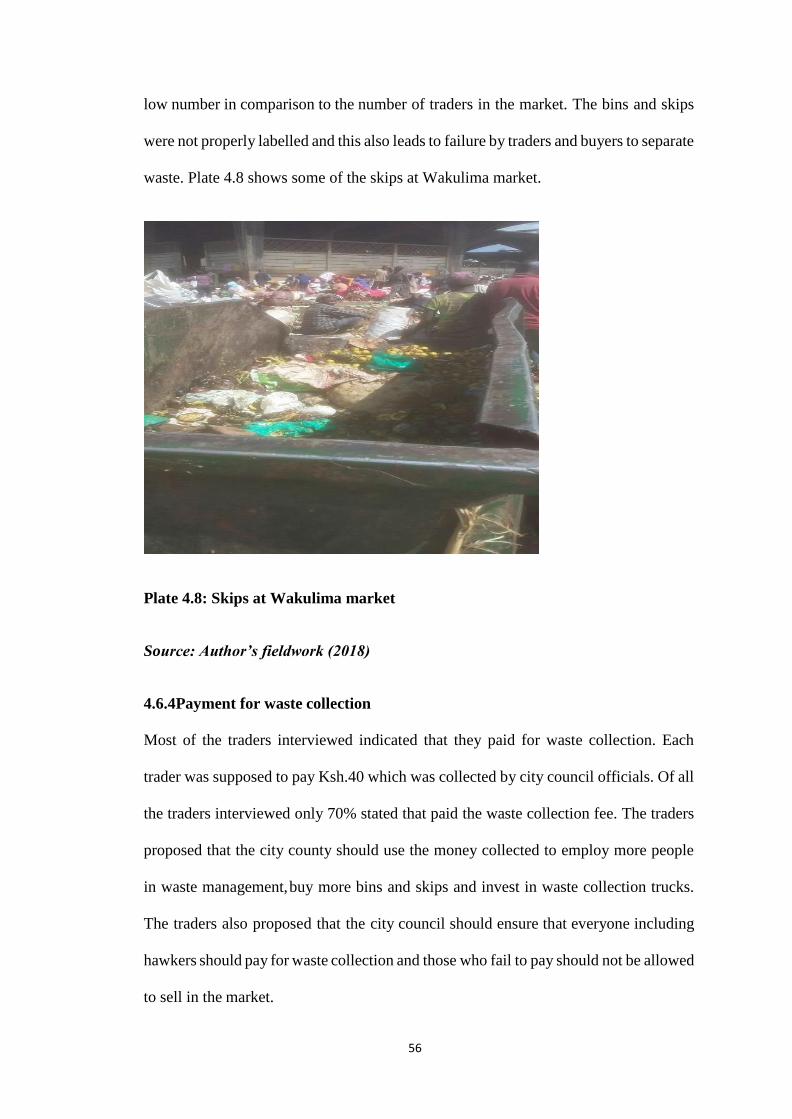
56
low number in comparison to the number of traders in the market. The bins and skips
were not properly labelled and this also leads to failure by traders and buyers to separate
waste. Plate 4.8 shows some of the skips at Wakulima market.
Plate 4.8: Skips at Wakulima market
Source: Author’s fieldwork (2018)
4.6.4 Payment for waste collection
Most of the traders interviewed indicated that they paid for waste collection. Each
trader was supposed to pay Ksh.40 which was collected by city council officials. Of all
the traders interviewed only 70% stated that paid the waste collection fee. The traders
proposed that the city county should use the money collected to employ more people
in waste management, buy more bins and skips and invest in waste collection trucks.
The traders also proposed that the city council should ensure that everyone including
hawkers should pay for waste collection and those who fail to pay should not be allowed
to sell in the market.

57
4.6.5 Disposal of vegetable waste
Vegetables accounted for the second highest type of waste in the market. Products that
produced this type of waste included: spinach, kales, carrots, maize peelings and all
root tubers such as potatoes and yams. The method used by the traders for disposal of
vegetable waste included: Putting in skips at 46%, feeding to animals 32%, composting
14% and incineration 6% (Fig 4.8).
Figure 4.8: Methods of vegetable waste disposal
4.8: Methods of vegetable waste disposal
4.8.1 Disposal of fruits waste
Fruit waste was the most common type of waste at Wakulima market. The types of
fruits at Wakulima market included mangoes, water melons, avocadoes, oranges,
pineapples and apples.

58
Figure 4.9: Methods of disposal of fruit waste
Of all the traders interviewed, 50 % indicated that they disposed their fruit waste in
skips, 45% of them indicated that they feed their waste to animals while only 5% used
the fruit waste to make compost manure (Fig 4.9).
4.8.2 Waste Separation
Waste separation is important as it makes it easy to use the waste produced for various
purposes. Plastic papers can be recycled while organic waste can be used to make
compost. Of the trader’s interviewed, 82% said that they did not separate waste. Lack
of enough bins and skips was stated as the main reason why the traders did not separate
their waste. Only 18% stated that they separated their waste by placing different types
of waste in separate bins
4.8.3 Collection of solid waste
The main method of waste collection from the market is through the use of trucks and
wheelbarrows as shown in table 4.10. The waste is then transported to Dandora
dumpsite. Most of respondents interviewed mentioned that the trucks used for waste
collection were inadequate.
Method of disposal
Incineration Skips Composting Feeding to animals
60 50
40
30
20
10
0
Disposal of Fruit waste
Per
cen
tage
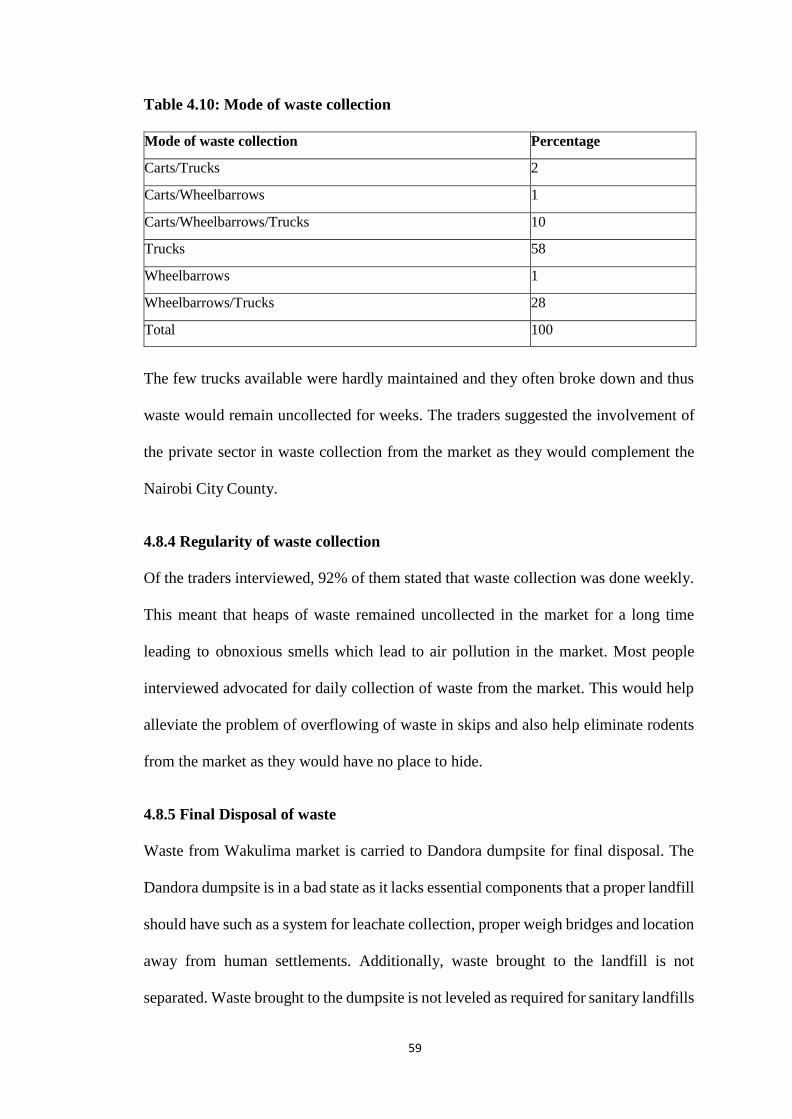
59
Table 4.10: Mode of waste collection
Mode of waste collection Percentage
Carts/Trucks 2
Carts/Wheelbarrows 1
Carts/Wheelbarrows/Trucks 10
Trucks 58
Wheelbarrows 1
Wheelbarrows/Trucks 28
Total 100
The few trucks available were hardly maintained and they often broke down and thus
waste would remain uncollected for weeks. The traders suggested the involvement of
the private sector in waste collection from the market as they would complement the
Nairobi City County.
4.8.4 Regularity of waste collection
Of the traders interviewed, 92% of them stated that waste collection was done weekly.
This meant that heaps of waste remained uncollected in the market for a long time
leading to obnoxious smells which lead to air pollution in the market. Most people
interviewed advocated for daily collection of waste from the market. This would help
alleviate the problem of overflowing of waste in skips and also help eliminate rodents
from the market as they would have no place to hide.
4.8.5 Final Disposal of waste
Waste from Wakulima market is carried to Dandora dumpsite for final disposal. The
Dandora dumpsite is in a bad state as it lacks essential components that a proper landfill
should have such as a system for leachate collection, proper weigh bridges and location
away from human settlements. Additionally, waste brought to the landfill is not
separated. Waste brought to the dumpsite is not leveled as required for sanitary landfills

60
and this leads to large heaps of waste. Burning of waste also takes place at the Dandora
landfill. Waste separation before transportation to Dandora dumpsite would help
reduce the volume and toxicity of waste. Segregation would also help get useful
products from the waste that can be reused and generally reduce the quantity of waste
finding its way to Dandora dumpsite.
4.8.6 Cost of Waste management
Each trader from the market gives Ksh.40 to the City council for waste collection. This
money is mostly used to pay the people involved in collection of waste. From the
survey, no action is taken to the people who fail to pay for waste collection since most
of them are hawkers. This has been a challenge especially in waste management since
the hawkers produce the largest quantity of waste. In addition to the revenue collected
from the traders for waste collection, the City Council also get money from the county
government for waste collection.
4.9 Discussions
According to Harvey et al., (2002), waste generation is defined as the point at which
materials are considered as having no value to the owner and hence they need to be
discarded. However, things that are of no value to one person may be of value to another
(Iboro, 2007). From the study findings, results indicated that the most common type of
waste at Wakulima market was organic waste as a result of food items that were the
main commodity sold in the market. The second most common type of waste was
plastic bags which were the main type of packaging material used in the market. Sacks
and cartons were third and fourth respectively.
61
The type of produce sold in the market was a big indicator to the type of waste produced
in the market. Packaging materials provided to the customers also contributed to waste
in the market. Most traders provided their customers with plastic bags followed by
sacks, nets and cartons. The solid wastes produced at Wakulima Market were similar to
market wastes generated in other parts of the world. Links (2006) indicates the type of
solid wastes from municipalities in America as paper, food, plastics metals, glass and
wood which, compares well or contrast with Wakulima market.
Practices adopted to deal with waste at Wakulima market included putting waste in
bins and skips, open dumping, incineration, feeding to animals, landfill site and
composting waste. There were very few bins and skips in the market in comparison to
the number of people in the market. This explains why waste was being dumped by the
roadside and in other undesignated areas in the market. From the analysis it was evident
that waste disposal in Wakulima market was similar to that -in Ado-Akiti in Nigeria by
Momoh and Oladebeye, (2010), whereby waste was also dumped in drainage systems,
by the roadside and in other undesignated areas. The waste disposal method would be
determined by the type and nature of waste collected in the market. Adeyemi and
Adeyamo (2006) studied waste management practices at the Bodija abattoir, Nigeria
and found that the main waste disposal practice at Bodija abattoir was dumping. In
addition, other management options included control of waste generation, separation
of waste, waste collection, storage practices and transportation of waste in the most
appropriate way.
Amdt (2001) stated that solid waste ought to be kept in containers made of firm and
rigid material that have a well-fitting lid or a structure that is well ventilated with a door
that allowed for easy accessibility. The door also helped to prevent spillage of solid and

62
liquid waste. The solid waste structure ought to be well secured to hold waste until the
local authorities came to pick the waste. This was a big mismatch with the types of bins
that had been installed by the city council at the Wakulima market for waste storage.
The study revealed that waste from the market was often collected once or twice in a
month. Keeping solid waste for long had the potential to cause harm to the people in
the market. As per Harvey (2002), organic waste provided a breeding site for insects
and other animals that could potentially spread diseases to people in the market.
For a solid waste management system to be termed as successful it must conclusively
cover waste collection, treatment and disposal. The county government of Nairobi has
been given the responsibility of providing solid waste management services to the
traders at Wakulima market. The city of Nairobi has experienced tremendous
population growth from around 300,000 people in 1960 to 4,000,000 people in 2016
(Kenya Bureau of Statistics 2017) and thus dumping sites have been moved further away
from the city. This challenge has necessitated employment of more workers and
deployment of garbage trucks. This has however not been the case as there are very
few trucks for waste collection in the city. The few trucks available are also not well
maintained hence they often breakdown and this leads to a lot of delays in waste
collection resulting to waste pilling in the market. Generally, there was lack of a proper
waste management plan for the market due to several factors which included;
Inadequate capacity in terms of both personnel and technical expertise to deal with the
problem of waste management, lack of incorporation of market vendors in the process
of waste management and inadequate finances for the establishment and running of a
proper waste management system.

63
Cointreau, (2005) indicates that waste collection is a significant expense for cities in
developing countries. It often amounts to about 20% to 50% of revenue collected by
the county government. In Nairobi city this is hardly the case as only a small portion of
revenue collected is used for waste management the traders at Wakulima market paid
for waste collection services as required by the county government. Despite this the
traders at the market indicated that the city county did very little to ensure that waste
was effectively handled in the market. Most traders preferred the services that were
offered by the private waste collectors.
Harvey, (2002) classified safe waste disposal as the final stage of waste management
process that would often be associated with minimization of risk. He gives several
options for safe solid waste disposal which include land filling, burning or incineration,
composting and recycling. The final disposal site of waste collected from Wakulima
was the Dandora dumpsite which is a landfill site that is used for waste disposal by
most Nairobi residents. The dumpsite was not in good shape.
According to Anamanyo, (2004), a standard sanitary landfill ought to have the
following: a weigh bridge, an internal access, a treatment plant, gas recovery area,
leachate collection system and it should be located far away from human settlement.
The landfill at Dandora dumpsite did not have these essential features. Some of the
facilities mentioned above such as a weigh bridge were present but most other facilities
were not functional. In addition, the sanitary landfill lacked an internal access and the
site was too close to human settlements. The dumpsite was also almost filled to capacity
and this left a mountain of waste which was not appealing to look at. Burning of waste
was done at the site which caused a lot of air pollution especially to people who lived
near the site.

64
According to Bull, (2006), the waste hierarchy is now universally accepted as the
guideline for making solid waste management systems internationally. The hierarchy
encourages the notion that prevention is better that cure. From the findings at Wakulima
market, it was evident that the traders were not aware of this fact. The respondents
stated that they reused some of their products especially packaging materials such as
sacks. However, they were not aware of ways which would help them reduce waste
from the point of generation. The County government of Nairobi can borrow a leaf
from The United States Environmental Protection Agency which created a guideline to
help shopping areas improve their waste management practices and identify ways in
which they would reduce waste generation.

65
CHAPTER FIVE
SUMMARY OF FINDINGS, CONCLUSION AND RECOMMENDATIONS
5.0 Summary of findings
Insufficient bins and skips was a major factor affecting proper waste disposal. From the
survey, almost 80% of the traders lacked access to bins and skips and this led to disposal
of waste by the roadside, in open spaces and leaving waste in the market. The lack of
enough bins and skips also affected waste segregation greatly as traders had no place
to put different categories of waste hence recycling of waste from the market was close
to impossible.
There was no regular system of waste collection from the market. Waste was mostly
collected weekly but in some instances it remained uncollected for up to a month. This
led to people dumping waste by the roadside and in other undesignated places as the
few skips and bins available was already full. Clean up of own spaces by individual
traders helped to solve the problem of waste collection to some extent of skips and bins
to put their waste the problem of waste collection was only half solved.
The Dandora dumpsite does not meet the requirements of a standard sanitary landfill. It
is more of an open dumpsite. People live so close to the landfill and this greatly
compromises their health. The landfill also lacks leachate collection system and proper
functioning weigh bridges hence the waste brought to the landfill cannot be properly
accounted for. Waste is hardly separated before it gets to the landfill and thus useful
components which would otherwise have been reused are buried or burnt in the landfill
(UN-Habitat).

66
5.2 Conclusion
The first objective was to identify the different categories of solid wastes from the
market. It can be concluded that the most common type of waste at Wakulima market
was organic waste from fruits and vegetables followed by plastic bags and containers
and finally sacks and cartons.
The second objective was to assess the factors hindering effective solid waste
management at the Wakulima market. It can be concluded that lack of enough bins and
skips, lack of enough waste collection equipment as well as lack of knowledge on
proper waste management were the main hindrances to effective solid waste
management at the market.
The third objective was to analyse the current solid waste management system at the
Wakulima market. It can be also be concluded that that the Wakulima market lacks a
proper waste management system and that is why waste was scattered all over the
market. More options for composting of organic waste should be considered in the
market. More bins and skips should also be installed in the market and waste should be
collected on a regular basis.
5.3 Recommendations
5.3.1 Solid waste management education and information Project
From the study finding it was noted that most traders lacked knowledge on proper
handling of waste from the market. An educational project on appropriate waste
management should be launched in the market. This would help to enlighten traders on
appropriate waste management practices, and also to increase their participation
towards achieving a cleaner healthier market. The project should be aimed at:
promoting solid waste reductions well as encouraging reusing and recycling behaviour.

67
Purchasing of additional bins and skips should be the number one priority for the City
council of Nairobi as this would help solve other problems such as illegal dumping as
well as encourage waste segregation. At least 400 traders for one skip and 30 traders
for one bin should be adequate. The skips and bins should be placed within 10 Meters
radius so that each trader can easily access them. When providing the equipment, the
Council should consider the following:
(1) The types of container to be used
- A small container with a capacity of around 30 – 40 litters can be placed at each stall
which is suitable for small quantities of solid waste.
- Waste should be stored separately in three types of bins, which will separately store
solid waste of each type. Green garbage bins should be used to store organic waste,
yellow garbage bins should be used to stored saleable waste and blue garbage bins
should be used to stored general waste.
(2) The container location
- Blue and green waste bins should be located at each stall. The yellow bins could be
located near every block.
- The waste bins should be labelled appropriately so as to aid the traders place waste in
the right bins.
5.3.2Solid waste management education and information with improvement
of solid waste management equipment
The purpose is to minimize solid waste from the market through source reduction, then
through reuse and recycling to further cut down the quantity of waste being transported
to landfills. In this context, it should include both educating the traders and providing
them with appropriate solid waste management equipment

68
REFERENCES
Adeyemi, P and Adeyamo, O. (2006) Waste management practices at the Bodija
abattoir, Nigeria ‘International Journal of Environmental Studies, 64:1, 71 – 82
Allison M. (2010) Material efficiency: A white paper. Resources, Conservation and
Recycling, 55(3), 362-381. Elsevier B.V. doi: 10.1016/j.resconrec.2010.11.002
Amdt, C. (2007). Organic Waste Recycling: Technology and Management. 3rd ed. London:
IWA Publishing. 9-16.
Arora, L and Agarwal, s. (2011) Knowledge, Attitude and Practices regarding Waste
Management in Selected Hostel Students of University of Rajasthan, Jaipur,
International Journal of Chemical, Environmental and Pharmaceutical
Research Vol. 2, No.1, 40-43
Bammeke, A. O. and Sridhar, M. K. C. (1989), Market wastes in Ibadan, Nigeria,
Waste Management and Research, 7, 115-120.
Bell et al. (2010), Strengthening markets for recyclables: A worldwide perspective
Cointreau S.(2005), Private Sector Participation in Developing Countries ;
http://go.worldbank.org/A5TFX56L50; 2009 The World Bank Group
Cointreau, S.J (1975), Environmental Management of Urban Solid Waste in
Developing Countries Indicators Programme: Monitoring the City Volume 2
Urban Indicators Review: The survey Instrument, Final worksheet February
1995. A joint Programme of UN-centre for UNCHS Human Settlements and
the World Bank, and Cheremis in off, P. N. (1995). Hazardous materials and
waste management: Nairobi Kenya
El-Haggar, S. M. (2007), Sustainable industrial design and waste management:
Ezeah H. (2010), Sustainable waste management: Cradle-to- cradle for sustainable
development (p. 424). Oxford: Elsevier/Academic Press. Cradle for sustainable
development (p. 424). Oxford: Elsevier/Academic Press.
Gakungu P.M (2010), The benefits and costs of alternative solid waste management
policies.Resources, Conservation and Recycling, 13(3-4), 183-213. doi:

69
10.1016/0921- 3449(94)00021-V.
Harvey P., Baghri S., and Reed B. (2002), Emergency Sanitation: Assessment and
Programme Design. Water Engineering and Development Centre.
Loughborough University UK
Iboro, N., (2007), The Situation of Solid Waste in Ghana. Accra, Ghana
Ikiara, M. M., Karanja, A. M. and Davies, T. C. (2004), “Collection, Transportation
and Disposal of Urban Solid Waste in Nairobi”, JICA.
Japan International Cooperation Agency (JICA), (1998), Solid Waste Management
in Nairobi (1997); The study on Solid Waste Management in Nairobi City in
the Republic of Kenya. Japanese International Cooperation Agency (JICA); CTI
Engineering Co. Ltd, Environmental Technology Consultants Co. Ltd. Nairobi
City County, Ministry of Local Authority, and the Government of Kenya; Final
Report August 1998 Nairobi
Japan International Cooperation Agency (JICA), (2007), The study of Solid Waste
Management in Nairobi City in the Republic of Kenya, Interim Report, CTI
Engineering Co. LTD Environmental Technology Consultants Co; LTD.
Nairobi City County, Ministry of Local Government, The Republic of Kenya
(1997)
Kibwage (2009), Solid Waste Management and its Environmental Impact in Kenya.
In: Solid Waste management:
Kothari, C. (2004), Research Methodology: Methods and Techniques, 2nd edition.
New age International Publishers, New Delhi, India
Kreith, F. (1994), Handbook of Solid Waste Management. McGraw Hill, USA.
Kumah, A.M. (2007), The Situation of Solid Waste in Ghana. Accra, Ghana.
Links J. M. PHD; 2006 Lecture Program for the Short Course on Integrated Solid
Waste Management (John Hopkins University)
Momoh, J.J. and Oladebeye, D.H. (2010), Assessment of Awareness of Attitude and

70
Willingness of People to Participate in Household Solid Waste Recycling
Programme in Ado-Eketi, Nigeria, in the Journal of Applied Sciences in
Environmental Sanitation.Jakarta, Indonesia.
Mshelia A.D. (2015), Solid waste management: An urban environmental sanitation
problem in Nigeria, Sky Journal of Soil Science and Environmental
Management.
Muniafu M.J and Otiato, D.M 2010, Solid Waste in Ghana. Accra, Ghana
Nairobi City County (NCC), (2010), Solid Waste Management in Nairobi: A
Situation Analysis Technical Document ac- companying the Integrated Solid
Waste Management Plan.
Nairobi City County, (2002) A survey on medical waste in Nairobi. Final Report 2002
Department of Environment
National Environment Management Authority (N.E.M.A) (2005), Ban Plastics?
NEMA News Nairobi; NEMA
National Environment Management Authority (N.E.M.A) (2005), Characteristics
of Urban Settlements in Kenya; NEMA News Nairobi
Ngera, J. K. (2014), Challenges and opportunities of Inorganic solid waste re use and
recycling in Thika Town, Kiambu County. Unpublished Master’s Thesis KU.
Omotara, B. A. (1985), Epidemiology in the market place. Postgraduate Doctor and
m dash; Africa, August,247-252.
Oyake-Ombis. L., (2016), Innovations on plastic waste management in Kenya and
role of universities, Prentice-Hall, Upper Saddle River, New Jersey.
Sandra Cointreau- Levine and Maggie Thurgood; (1994), Decision Makers’ Guide
to Solid Waste Landfills. The World Bank Urban Management Programme:
Private Sector Participation in Municipal Solid Waste services in Developing
Countries Volume 1 The formal sector Published for the Urban Management
programme by the World Bank, Washington DC 1994

71
Senkoro, H. (2003), Solid Waste Management in Africa: A WHO / AFRO Perspective.
Paper 1, presented in Dar es Salaam at the CWG Workshop, March
2003.Available:http://www.skat.ch/sf-web/activities/ws/cwg/pdf/cwg-01.Pdf
[Date accessed 14th Sept, 2010].
Syagga, P. (1992), Problems of Solid Waste Management in Urban Residential Areas
in Kenya Proceedings of Africa Research Network for Urban Management
(ARNUM) Workshop: Urban Management in Kenya, Joyce Malombe (ed.).
University of Nairobi. August 20th, 1992.
Tamale Metropolitan Assembly (2007), Medium-Term Development Plan (2006-
2009) under the Growth and Poverty Reduction Strategy. Tamale, Northern
Region.
Tchobanoglous, G., Theisen, H. and Eliason, R. (1977), Solid Wastes: Engineering
Principles and Management issues. McGraw-Hill Publishing Company, USA.
Tchobanoglous, G., Theisen, H. and Vigil, S. (1993), Integrated Solid Waste:
Engineering principles and management issues. McGraw-Hill Publishing
company, USA.
Technical University of Denmark: Centre for Developing Countries. Yhdego, M. and
Majura, P. (1988), Malaria control in Tanzania. Environmental International, 14,
Troschinetz and Mihelcic.(2009), Research Methods
http://www.socialresearchmethods.net/kb/sampling.php
Tsiboe, I.A. and Marbell, E. (2004), A Look at Urban Waste Disposal Problems in
Accra. Roskilde University, Denmark
UN-Habitat (2007); Housing in Informal Settlements; http://www.unhabitat.org/
UN-Habitat (2010); Housing in Informal Settlements; http://www.unhabitat.org/
United Nations Environment Programme (UNEP) (2005), Selection Design and
Implementation of Economic Instruments in the Kenyan Solid Waste
Management. Sector (Online) Available http;//www.org/PDF Kenya Waste
Management Sector/ appendix.pdf (2005, May 10th)

72
United Nations Environment Programme (UNEP) (2008), Waste Management
http://www.unep.org/sport_env/Documents/BeijingReport07/chapter9.pdf
United Nations Population Fund (UNFPA) (2001); Management of Municipal Solid
Waste http://www.epa.gov/epaoswer/non- hw/muncpl/reduce.htm..
United States Environmental Protection Agency (USEPA) (1999). “State and Local
Solutions to Solid Waste Management Problems”. (http://www.epa.gov).
Accessed on 18th July,2013 USPS (2000). “Solid Waste Management Plan for
Thimphu City”, Bhutan, Draft version, April 2000. Bhutan: Urban Sector
Programme Support Secretariat
United States. Environmental Protection Agency (EPA), and International Council
of Shopping Centers (ICSC), A Guide to Waste Reduction at Shopping Centers;
America ‘s Marketplace Recycles
Yhdego, M. (1987), Composting of organic refuse. Case study: Kariakoo market and
Ardhi Institute. Research report. Dar es Salaam.
Yhdego, M. (1988), Urban solid waste management in Tanzania. Waste Management
and Research,6, 175-180.
Yhdego, M. (1990), Environmental epidemiology in squatter settlements in Tanzania.
Zerbock, O. (2003). Urban Solid Waste Management, Waste Reduction in Developing
Countries. Available http://www.cee.mtu.educ/peacecorps/documents-
uly03.wastereduction FINAL. pdf. [Accessed 14th Sept, 2010]

73
APPENDICES
Appendix I: Market Waste Management Questionnaire
Questionnaire Number………………
Date of survey: / ___ / 2017
Section A: Trader Characteristics
Name
Market
Business Type
Age 20-30
30-40
40-50
50-60
60-70
70 and above
Gender Male
Female
Number of
people per
business
Where from

74
B. BUSINESS CHARACTERISTICS /PRODUCT CATEGORY
1. When did you start this business?
………………………………………………………………………….
2. Do you run the business alone or as a group?
Alone
As a group
3. What products do you deal with?
Vegetables
Fruits
Plastic bags
Sacks
Others specify………………………………………………………..…………
4. Why did you choose to sell this products?
……………………………………………………………………..………………
5. How long have you dealt with this product?
…………………………………………………………………………………….
6. Since you started operation here have you dealt with other products?
Yes No

75
If yes, which ones ………………………………………………………………
7. Where do you get your produce from?
Own farm
Buying from other farmers
From Suppliers
Other traders
8. If from farm, where is your farm located?
…………………………………………………………………….…………….
9. What do you grow on your farm?
……………………………………………………………………….………….
10. Who delivers the produce to the market?
Self
Others
If other, specify………………………………………………………..……
11. How often do you bring goods to the market?
Product Quantity Brought into the
market(Kgs)
Quantity Sold (Kgs)
Vegetables Daily Daily
Weekly Weekly
Monthly Monthly
Fruits Daily Daily
Weekly Weekly
Monthly Monthly

76
Potatoes Daily Daily
Weekly Weekly
Monthly Monthly
Others (Specify)
12. How do you package your goods before bringing them to the market?
In sacks (gunny bags)
Plastic bags
Cartons
Others
13. Do you provide packaging material for customers?
Yes, No
If yes, which kind of packaging, material do you provide your customers with?
……………………………………………………………………………..
14. Are you aware of the proposed plastic packaging policy?
Yes No
15. How is the proposed plastic packaging policy likely to affect your business?
Yes N0
If yes, how?
..................................................................................................................................
What is usually the status of the produce that you bring to the market?
Ripe Unripe Moderately ripe
Other…………………………………………..…………………………………
…

77
16. How many other traders in this market sell products that are similar to yours?
1-4
5-9
10-19
20-29
30-40
If other, specify……………………………………………………………………
17. How do you sell your goods on a daily basis?
Retail Wholesale Both
If both specify how many kilograms you sell in retail and how many in wholesale
……………………………………………………………….…………………..
18. How do you store the produce that is left unsold in a day?
In refrigerators
Left in the
open Boxes
Shelves
Other, specify……………………………………………………..…………….
19. Is refrigeration important in the market?
Yes No

78
ic
20. In your opinion, would refrigerators help reduce the amount of foodstuffs that
go to waste from the market?
Yes No
Please explain your answer ……………………………………………………
Section C: Different Categories of wastes produced from the
market
21. Which types of wastes are generated from the market?
Vegetable wastes Food Wastes Plastic
Bags
Others, specify…………………………………….……..…………………..…
…………………………………………………………………..……………….
22. Between organic (food) and inorganic, which contribute more waste in the
market?
Organic In-organic
23. Which are the most common types of waste in the market?
Plastic bags
Stale fruits and
vegetables Fruit and
vegetable peelings
Others, please specify……………………………………………………….
Indicate approximately how many Kgs in a week.

79
……………………………………………………………..…..……………
………………………………………………………………………….……
………………………………………………………………………….……
Which products generate the least amount of waste per week? Indicate
approximately how many Kgs in a week?
……………………………………………………………………………………
…………………………………………………………………..………………
……………………………………………………………………………………
Do some of your produce go to bad and have to be thrown away?
Yes No
If yes, which products often go to waste, please list them.
……………………………………………..…………………………………..
……………………………………………………………..………………….
24. How often does this happen per month?
Once Twice Thrice
Other, please specify………………………………………………….………
25. Why do products end up going to waste?
………………………………………………………………………………..
………………………………………………………………………….……..
…………………………………………………………………………..……
26. Which products waste have increased in the last 10 years?
Plastic bags Vegetables Fruits Sacks

80
Other, please specify……………………………………….…………………
………………………………………………………………………………..
27. What has led to an increase in waste from this products, please explain
……………………………………………………………………………….…
………………………………………………………………………………….
28. Which products waste have reduced in the last 10 years?
Plastic bags Fruits
Vegetables Sacks
Other,
specify…………………………………………………………………………….
………………………………………………………………,…………………….
29. What has led to a reduction in waste from this products, please
explain…………………………………………………………………………
…………………………………………………………………………………
30. Are packaging materials responsible for generating waste?
Yes No
31. If yes, please explain which ones and how they contribute to generation of
waste
……………………………………………………………………………………
……………………………………………………………………………………
…………………………………………………………..………………………

81
32. How are waste products from the market stored?
Waste Method of storing waste Amount per
day (KGS)
Reason for choosing the
method of storage
Vegetables Heaped at a
corner
Put in skips
Put in bins
Left by the
roadside
Left in the
market
Fruits Heaped at a
corner
Put in skips
Put in bins
Left by the
roadside
Left in the
market
Plastics Heaped at a
corner
Put in skips
Put in bins
Left by the
roadside
Left in the
market
Sacks Heaped at a
corner
Put in skips
Put in bins
Left by the
roadside
Left in the
market
Section D: Waste Management
33. Is there a waste management system in this market?
Yes No
If YES, please describe it

82
……………………………………………………………………………………
………………………………………………………………………..………......
If NO, why is there no system?
……………………………………………………………………………………
…………………………………………………………………………..............
34. When did the waste management system start?
.................................................................................................................................
……………………………………………………………….................................
35. How has the waste management system been since 1970s, 80s, 90s, 2000s,
and 2010s?
………………………………………………………………..………………
…………………………………………………………….…………………
36. Who is responsible for waste management in the market?
………………………………………………………………..………………
…………………………………………………………….…………………
37. Do you individual traders pay for the waste management?
Yes No
38.. If YES, how much……………………………………………………………
39.Are there people who fail to pay? Yes No
40. If yes, what happens to the waste generated by the people who fail to pay?
……………………………………………………………………….…………
………………………………………………………………………..…………

83
…………………………………………………………………………………
41. How is waste handled before being removed from the market?
Product Method of handling waste Reason for Choosing the
method of waste handing
Vegetables Recycling
Composting
Incineration
Feeding to animals
Reusing
Fruits Recycling
Composting
Incineration
Feeding to animals
Reusing
Fruits Recycling
Composting
Incineration
Feeding to animals
Reusing
42. Do you separate your waste before disposing it off?
Yes No
43. If yes, please indicate which waste you separate and how you do it
………………………………………………………………….

84
If no, please state why………………………………………………………
44. What happens to the waste after it is has been gathered from the market?
Removed by the city
council
Removed by private waste handlers
Burnt
Left there
Do not know
If other, please specify …………………………………………….
45. Do you retain any packaging material so that you can use it another time?
Yes, No
If yes which ones? ......................................................................
D. Availability of Resources for Managing waste
46. Is there adequate equipment for handling waste?
Equipment Capacity(Kgs) Number
Available
per
trader
Ideal
Number
needed
Who provides
Dust bins
Skips
Brooms
Wheelbarrows
Council
Trucks
Private trucks

85
47. Are the bins and skips properly labelled (For organic and non-organic
waste)?
Yes, No
48. Are the Skips adequate?
Yes No
If the skips are not adequate, what happens to the extra waste that
cannot be held in the skip?
……………………………………………………………………………………
Are the bins adequate?
Yes, No
If the bins are not adequate, what happens to waste generated from the market?
……………………………………………………………………………………
49. When the bin is filled, who empties it to the skip?
Trader
Market cleaners
Others, Specify
50. How frequently are the skips emptied?
Daily
Weekly
Monthly
51. Are bins and skips properly maintained?
Yes No
If yes, how ………………………………………………………………….
52. Are wheelbarrows, brooms and trucks adequate?
Yes No

86
53. Which waste management institution is responsible for collecting waste
from the market?
(If more than one mention all)
1………………………………………………………………….
2………………………………………………………………….
3…………………………………………………………………
4………………………………………………………………
54. How many times is waste collected from the skips and the market at large?
Daily
Weekly
Monthly
Other, Specify………………………………………………….
55. What is the mode of collection (If more than one, indicate all)?
Carts
Wheelbarrows
Trucks
Other, Specify………………………………………………….
56. In your view, what are some of the factors affecting effective waste management
at Wakulima market? (List at most four)
……………………………………………………………………………………
……………………………………………………………………………………
……………………………………………………………………………………

87
E. Options for improvement in waste management
1. What has worked in waste management in the market?
……………………………………………………………………………………
……………………………………………………………………………………
……………………………………………………………………………………
……………………………………………………………………………………
2. Why has it worked?
……………………………………………………………………………………..
……………………………………………………………………………………
……………………………………………………………………………………..
……………………………………………………………………………………
3. What has failed to work and remains a challenge?
……………………………………………………………………………………
……………………………………………………………………………………
……………………………………………………………………………………
4. Why do you think this has been the case?
……………………………………………………………………………………
…………………………………………………………………………………….
……………………………………………………………………………………
.
5. What challenges would be attributed to 1. Traders
……………………………………………………………………………………
……………………………………………………………………………………
……………………………………………………………………………………

88
Suppliers
……………………………………………………………………………………
……………………………………………………………………………………
……………………………………………………………………………………
Customers
……………………………………………………………………………………
……………………………………………………………………………………
……………………………………………………………………………………
Waste collectors
……………………………………………………………………………………
……………………………………………………………………………………
……………………………………………………………………………………
In your opinion, what could be done to improve waste management at Wakulima
market?
……………………………………………………………………………………
……………………………………………………………………………………
……………………………………………………………………………………
What would be the role of the following stakeholders in with regards to waste
management
Stakeholder Role
Traders
Suppliers

89
Customers
County Government
National Government
6. In your views how many times should waste be collected from the market?
Daily Weekly Monthly
7. In your views who should have the responsibility for
collecting waste from the market?
Private
collectors
City Council
Both
Others…………………………………………………
Provide reason for each
8. Are there enough personnel for managing solid waste at Wakulima market?
No Yes

90
9. In your views what should be done to the waste once it has been
collected from the market?
Type of waste Method of treatment
-----------------------Thank you-------------------