assessment of stage 2 chemistry using … · chemistry using sace performance standards ... a2...
TRANSCRIPT

CHEMISTRY INVESTIGATIONS MANUAL
Version 1
ASSESSMENT OF STAGE 2 CHEMISTRY USING SACE
PERFORMANCE STANDARDS
TEACHING NOTES
Lynton Hall, Ian McMahon & Clive Nikkerud
Published by the South Australian Science Teachers’ Association

2
TEACHING NOTES
Version 1
TABLE OF CONTENTS SECTION Page INTRODUCTION 4 MATERIALS OVERVIEW 4 DETAILED NOTES ON EACH INVESTIGATION 5 Practical Investigations A1 Determination of the identity of a food acid by volumetric analysis. 5 A2 Determination of the concentration of commercial ammonia solution. 5 A3 Determination of the concentration of ethanoic acid in vinegar. 6 O1 Preparation, isolation and purification of an ester. 6 E1 Comparison of enthalpies of neutralisation for strong base with a 7
weak and a strong acid. D1 The rate of reaction at the electrodes of an electrolytic cell. 7 D2 Experimental design (rates/electrochemistry) – choice of topic. 8 SOME ADVICE REGARDING ANALYSIS AND EVALUATION 13 Discussion of Errors PRECISION, ACCURACY and RESOLUTION 14 Significant Figures 15 Multi-step calculations 15 ISSUES INVESTIGATIONS and COMMUNICATION 15 Writing the Report 16 Some advice taken from SACE Assessment Reports 17 ASSESSING FOR BIAS 17 ASSESSING FOR CREDIBILITY 19

3
Publishing Information This Investigations Manual is designed to support the teaching of stage 2 Chemistry in South Australia. Also available is the Stage 2 SASTA Chemistry Study Guide that suits the requirements of the SA course © SACE Board 2012. Distributed by SASTA, 249 Henley Beach Road, Torrensville, SA 5031 Ph: 8354 0006 Fax: 8354 0008 Email: [email protected] Website: www.sasta.asn.au Authors: Hall L., McMahon I. and Nikkerud C. Library catalogue: 1. Chemistry 2. Investigations 3. Manual 4. Teaching Notes ISBN 978-0-9873999-3-9 The authors Lynton Hall is senior Chemistry teacher and Deputy Principal at Murray Bridge High School. He is highly experienced in moderation of Chemistry investigations. Clive Nikkerud is a senior Chemistry teacher at Marryatville High School. He is highly experienced in moderation of Chemistry investigations. Ian McMahon is senior Chemistry teacher at Thebarton Senior College and member of the Chemistry CLG for SACE. He is highly experienced in Chemistry moderation. All 3 authors are members of the RACI Chemical Education Group and have presented ideas for hands-on investigations to SA Chemistry teachers at annual conferences. Acknowledgements The production of these materials has taken 12-15 months and we thank the following for their contributions:
• Greg Cole and Kristy Cummins at SASTA for their active involvement • The SACE Board of SA for permission to use extracts from the Chemistry Subject outline in
the investigations manual • Helen Brown for assisting in aspects of a design practical • Peter Turnbull for comments on OHS aspects • The image on p.1 has been used on https://elfordchemistry.wikispaces.com

4
CHEMISTRY INVESTIGATIONS MANUAL TEACHING NOTES INTRODUCTION The teaching notes accompany the investigations manual. These are provided to assist the chemistry teacher and laboratory manager where applicable to maximise the preparation and readiness for the practical investigations which are selected for use during the teaching and learning program. The practicals have been written such that each and any could be used for summative purposes for SACE moderation however they serve well as formative exercises. Materials for each of the practicals should be requested at least 48 hours before the investigation is carried out by the students. In general there is little in the required materials that would need preparation prior to this time frame. Current practice in schools suggests that a risk assessment should accompany each request for a practical. Of course these assessments do not need to be prepared from scratch each time a particular practical is requested but should be updated. Schools may have their own well-functioning system of risk assessment and are encouraged to continue with its use however the authors can recommend the convenience of the risk assessment program from www.riskassess.com.au which can produce the risk assessment document including hazards from the program database and also order the practical online from within or outside the school if needed. It is assumed that schools will have available sufficient quantities of volumetric and other glassware, quickfit apparatus, calorimeters, stopwatches, thermometers (-10 to 110oC and 0 to 250oC) to enable the conduct of these practicals. The authors understand that the resolution of the balances used in different schools is an issue. In each case the materials and methods should be carefully consulted some time before deciding whether to use the practical so replacements or alternatives can be obtained. MATERIALS OVERVIEW [to be sourced by Lab Manager before the day] A1 identity of a food acid oxalic acid, citric acid and tartaric acid reagents from a scientific supplies company (not a supermarket)
A.R. sodium hydroxide which is prepared as approximately 0.1 mol L-1 solution for practical (300 mL per group) Phenolphthalein A2 determination of ammonia cloudy ammonia cleaner obtained from supermarket or hardware store A.R. sodium carbonate (anhydrous), methyl orange
10 mL volumetric pipettes A3 ethanoic acid in vinegar commercial vinegar solution from supermarket or similar source
Oxalic acid A.R. reagent, bulk 0.1 mol L-1 sodium hydroxide solution approximate concentration (300 mL per group) Phenolphthalein indicator O1 ester preparation butan-1-ol, glacial ethanoic (acetic) acid, conc. H2SO4, Clean quickfit apparatus including separating funnel preferably 50 mL but 100 mL will suffice.

5
E1 heat of neutralisation 2.00 mol L-1 hydrochloric acid, 2.00 mol L-1 sodium hydroxide, 2.00 mol L-1 acetic acid
Polystyrene calorimeter (coffee/tea containers to go) D1 design: electrolysis rates electrodes (graphite, copper, stainless steel or lead) Vessel to collect gas from chosen electrode (allows quantification of volume), plastic coated copper wiring
Conducting solutions of concentration greater than 2.0M (can include sodium chloride, hydrochloric acid, sulphuric acid or other suitably endorsed solutions) D2 design: redox reactions hydrogen peroxide solution, manganese dioxide, other catalysts, conducting solutions, electrodes (choice), metals for galvanic cell, voltmeters, ammeters, electronic balance More detailed notes on this design practical are found later in this document. DETAILED NOTES ON EACH INVESTIGATION A1 Determination of the Identity of a Food Acid by Volumetric Analysis This investigation involves a number of different tasks.
• Preparation of a standard solution from a primary standard. Oxalic acid of high purity (purchased from a scientific supply company) should be used. Students should measure the mass of oxalic acid used to prepare the standard solution using a balance with high resolution.
• Standardisation of a solution of approximately 0.1 mol L-1NaOH solution. The sodium hydroxide should be prepared beforehand using AR solid sodium hydroxide. The solution does not need to be standardised prior to the commencement of the investigation.
• Dilution of a 0.5000 mol L-1 solution of an unknown food acid (tartaric acid or citric acid). The “unknown” food acid should be prepared beforehand. The accuracy of the final result achieved by students is dependent on this solution being prepared very accurately. Use oxalic acid or tartaric acid which is very pure. Measure the exact mass of solid required to prepare your solution using a balance with high resolution. The concentration of the solution should be exactly 0.5000 mol L-1. A suitable dilution factor is 1:10. Students should show reasoning as to why this is suitable. The dilution can be achieved using a 25.0mL analytical pipette and 250.0mL volumetric flask.
• Titration of the diluted food acid against the standardised sodium hydroxide solution. The number of moles of the unknown food acid and the number of moles of the standard oxalic acid used in this titration can then be calculated and the ratio no. moles NaOH : no. moles of unknown food acid can be determined.
A2 Determination of Cloudy Ammonia Cleaner Concentration by Volumetric Analysis This practical includes 2 titrations and a dilution as well as preparation of a standard. Ideally the titrations and the dilution should be performed in the same period although the standard can be prepared beforehand. One common supermarket shelf cloudy ammonia product displays on its label a concentration of 42 g/L as NH4OH. When students as individuals are ready to consider the dilution of the commercial ammonia solution, they need to try to prepare a dilution of similar concentration of the hydrochloric acid that has been previously standardised which is approximately 0.1 mol L-1.

6
Hence the conversion of g/L to mol/L is 42/35 = 1.17 so the most logical dilution is 1:10 or 20 mL of the original ammonia plus 180 mL distilled water to make a 200 mL solution in the volumetric flask ( or 25 mL plus 225 ml for a 250 mL flask) The use of a fume hood or very well-ventilated area is essential for dealing with the commercial ammonia solution. A 3 Determination of Household Vinegar Concentration by Volumetric Analysis This investigation involves a number of different practical tasks and subsequent calculations using the data produced, followed by an evaluation of the experiment. Each student should carry out these tasks individually.
• Part A - Preparation of a standard solution from a primary standard. Analytical Reagent, (AR) grade oxalic acid is recommended. Students should measure the mass of oxalic acid used to prepare the standard solution using a balance with high resolution. Teachers have the opportunity to check on the precision of this preparation by matching the level of the solution against the calibration mark on the volumetric flask.
• Part B - Standardisation of a solution of approximately 0.1 mol L-1 NaOH solution. There is opportunity for teachers to assess the student’s manipulative skills, especially their effectiveness in titrating and pipetting.
• Part C – This titration is best done in the same period as part B, as the NaOH solution may absorb CO2 from the air causing a reduction in concentration. Normal pale or colourless household (white wine) vinegar is recommended. Only one titration is completed to fit within time constraints and to keep the calculation simpler. Obviously, repeating and averaging in Part C would minimise random errors, and students would be expected to comment on this in their evaluation.
• If time allows, the calculation and evaluation should be completed within the period. If not, the Investigation Manual can be handed in and the activities completed under supervised conditions at a later date.
O1 Preparation, Isolation and Purification of an Ester Mixing the butan-1-ol, ethanoic acid and concentrated sulfuric acid in a pear shaped flask. The addition of sulfuric acid to the mixture of butan-1-ol and ethanoic acid is exothermic. The acid should be added slowly, drop by drop. If added too quickly, it may cause the other liquids to boil, reducing the final yield of ester. It may also cause decomposition of the organic liquids. If this occurs, the bottom layer of the mixture will turn dark violet or black. Washing with sodium carbonate solution. Each time sodium carbonate solution is added, the mixture should be gently shaken. Students should avoid the build-up of carbon dioxide under pressure by frequently inverting the separating funnel and opening the tap to release the gas. 5mL aliquots of sodium carbonate can be added, with shaking, until there is no more effervescence. The aqueous layer can then be removed. If the separating funnel becomes close to full because of the addition of several 5mL aliquots, the aqueous layer can be tapped off at any time and additional aliquots added if necessary. Distillation Prior to the final distillation, the quick-fit apparatus should be thoroughly dried. Any droplets of water in the T- piece, condenser or the collecting vessel will affect the purity of the product. The product should be transparent, clear and colourless. Cloudiness indicates the presence of water in the ester. When students are carrying out any separation, they should deliver the bottom layer into a clean receptacle. If they make an error with their separation, they can return the mixture to the separating funnel and repeat the separation.

7
E1 Comparison of Enthalpies of Neutralisation for Strong Base with Weak and Strong Acid For students to achieve valid results, the solutions used must be very accurately prepared. The hydrochloric acid and ethanoic acid must both be 2.00 mol L-1. Once prepared, their concentrations should be checked by titration against a standard. If the concentrations are not exactly 2.00 mol L-1 the solutions should be adjusted accordingly. The sodium hydroxide solution must not be less than 2.00 mol L-1. If it is slightly more than 2.00 mol L-
1, sodium hydroxide will be present in slight excess when 50mL of 2.00 mol L-1 acid and 50mL of the sodium hydroxide are mixed. This will not affect the temperature change. For the other trials, sodium hydroxide is present in excess. The temperature changes should be measured accurately using an instrument of high resolution. A temperature probe attached to a data-logger or a computer is recommended. D1 The Rate of Reaction at the Electrodes of an Electrolytic Cell (Design) Some factors that students may test include
• Concentration of the electrolyte • Distance between the electrodes • Surface area of the electrodes • Nature of the electrolyte • Nature of the electrodes • Temperature of the electrolyte
The setup that is indicated in the investigations manual works well on a larger scale. The electrolysis reaction was carried out in a plastic ice cream container (2L). Rectangular electrodes made from thin but rigid copper plate with dimensions approximately 50mmx30mm are suitable for many of the investigations. If the effect of the nature of the electrodes on reaction rate is being tested, then electrodes of exactly the same dimensions made from different materials (metals) will need to be prepared. If the effect of surface area on reaction rate is being tested, a number of electrodes of varying sizes made from the same material will need to be prepared. Suitable electrolytes are 0.1 mol L-1 sulfuric acid and 0.1 mol L-1 potassium sulfate. If sulfuric acid of a concentration of 1 mol L-1 or greater is used, the gas is produced too quickly to be measured accurately within a given time. Using electrolytes of high concentration may also result in the overload switch on the power pack being tripped. One way of holding the electrodes in place in the cell is by using a thin layer of plasticine on the bottom of the ice cream container. Students plan and design their investigation beforehand. When they commence their investigation, it may be necessary for them to modify their plan based on their early results. For many investigations of this type, a reliable way of measuring the rate of reaction is by measuring the rate of formation of the gas generated at the cathode (hydrogen). There can be a range of setups for the electrode and this can add to the complexity of the design process.

8
D2 - Experimental Design (choice of topic) This design practical has three parts, a design phase, a practical phase and the written report.
In the design phase students will discuss the possible variables they could investigate from the chosen list. A group of six or more students may be allocated a question from the list provided in the Manual. After the students discuss the possible investigable variables the teacher can allocate to each student pair a particular variable to investigate. The teacher should ensure that the variable allocated to the student group would allow them to get data which can be used to create a line graph. Students write their design independently and pass this up at the end of the lesson for assessment. In assessing this section students should describe a clear way of changing and measuring the independent variable and a clear way of measuring the dependent variable and the instruments used. The method should be able to be carried out in a laboratory.
In the practical phase the assessed design component is handed back to students. Students may also be given an outline of a broad procedure that they may follow. They will not necessarily do the experiment as they designed it, but they will still investigate the same variable. This is done to ensure that students use a method that should provide results that can be graphed, interpreted and evaluated. The added advantage is that all materials can be prepared beforehand. In this practical phase students should have a choice of equipment and solutions and be encouraged to have a trial run of their activity to gauge quantities of materials and the time needed to obtain reasonable results.
The students can complete the final practical report at home if each student pair investigated different variables and have their own unique set of data. This can be easily achieved even for large classes by using a number of the investigation questions from the list as a number of variables can arise for each question. The practical report can be handed up as an insert in the student’s practical manual.
Another electrode design is the use of graphite (or stainless steel) electrodes [scavenged from Norwood electrodes] placed in the hole of a one-holed stopper and plastic coated copper wiring placed in the bottom of the hole and wedged into contact with the graphite rod. Modelling clay can be used to seal the bottom of the stopper and at times can be used to adhere the setup to the glass bottom of beaker. Due to the smaller surface area provided by this electrode setup, higher electrolyte concentrations should be used to get decent gas amounts produced in reasonable time e.g. 2M or 4M HCl or NaCl works well. Students should be made aware of the evolution of chlorine at the anode whether this is the gas to be measured or not. Anode and cathode can have same construction but will necessitate use of a larger beaker and larger volumes of electrolyte. Gas collection is by downward displacement of electrolyte inside inverted measuring cylinder

9
Prior Student Learning
Students should have experienced a broad range of laboratory techniques. They should understand that the rate of a reaction can be measured either by how much change occurs in a certain time or how long it takes for a certain change to occur. In particular, to effectively design and perform these practicals they should have knowledge of:
• collecting and measuring gas evolved from a reaction. • preparing a diluted solutions from a solution of known concentration. • using a water bath to change and control the temperature of a reaction. • setting up galvanic and electrolytic cells • measuring voltage and current using a multimeter. • using Norwood electrodes to collect gasses from an electrolytic reaction.
Experiments
1. Decomposition of hydrogen peroxide.
Investigable variables:
• H2O2 concentration • mass of MnO2 • temperature
For this practical 1.5% H2O2 (5 vol) is used but it must be relatively fresh and should be checked before the practical. There are a number of effective ways to measure the production of the oxygen produced. An easy way is to use detergent to trap the gas and another is to use a side arm test tube with a long kinked tube (see diagram in Method Outline 1B).
2. Production of a gas from an electrolytic cell.
Investigable variables:
• electrolyte concentration • voltage
• • surface area or depth of electrodes
A number of electrolytes are effective. The production of hydrogen at the cathode is most effective as it has a very low solubility in water and is produced at twice the rate, if oxygen is the anodic gas. These include first or second group sulfates and carbonates. Dilute sulfuric acid and sodium chloride are also effective electrolytes. Different student groups could perhaps choose or be allocated a different electrolyte. Electrolyte concentrations of around 0.1 M are effective. Graphite is a suitable electrode but stainless steel or an electrode cut from a metal sheet can also be used for the anode if surface area or depth is the variable.
3. Voltage from a galvanic cell.
There is only one investigable variable which can give a line graph for this practical. Other variables such as depth or surface area of the electrode are non-functioning. A student response of this practical is given on the SACE website. In this practical the voltage remains fairly constant with only a slight change, even at very low dilutions. In this practical, students should be able to continue with their own design.
4. Electroplating
Investigable variables:
• electrolyte concentration • temperature • voltage

10
Electroplating copper works effectively. This can be a relatively long practical requiring care. The electrodes can be cut from a copper sheet to size and must be cleaned. However if the container holding the electrolyte is small or the voltage is large, the temperature of the electrolyte can rise, introducing errors. Voltage from the power source is not accurate and the voltage will need to be independently measured. The mass change of both electrodes can be measured but if only one is measured, the mass loss at the anode is probably more accurate
5. Current flow in an electrolyte
Investigable variables:
• electrolyte concentration • voltage • electrolyte temperature • surface area or depth of electrodes • distance apart of electrodes
Check the multimeters to ensure that they will measure current. The fuse that protects that circuit is small and can easily be blown if too much current flows. This can easily happen if the leads short circuit or electrodes accidently touch when the power is on.
Method Outlines can be given to the students after the design phase and at the start of the practical phase
Method Outline 1A
Decomposition Of Hydrogen Peroxide
Equipment:
• Hydrogen peroxide (5 vol - 1.5%) • Manganese dioxide • Distilled water • Thermometer • Measuring cylinders - choice of 10mL,
20mL, 50mL, 100mL • stopwatch
Directions:
1. Add a precise known mass of MnO2 catalyst (approximately 0.1g) to a reasonably large measuring cylinder.
2. Measure a set volume of 5 vol H2O2 in another measuring cylinder.
3. Add a small amount of detergent and swirl in gently.
4. Add the H2O2 mixture to the catalyst and immediately start stopwatch. (Show teacher).
5. Measure rate of gas given off.

11
Method Outline 1B
Decomposition Of Hydrogen Peroxide
Equipment:
• Hydrogen peroxide (5 vol – 1.5%) • Manganese dioxide • Side-arm test tube • Coloured water • Measuring cylinders - choice of
10mL, 20mL, 50mL, 100mL • Stopper(one hole to fit side- arm test-tube)
• Retort stands • clamps • Distilled water • stopwatch • Thermometer
Directions:
• Add a precise known mass of MnO2 catalyst (approximately 0.1g) to a side arm test tube secured on a retort stand.
• Use the small piece of plastic tubing to attach the bent glass tube to the side arm test tube. (refer diagram)
• Fill the lower portion of the glass tube with coloured water.
• Measure a set volume of 5 vol H2O2 in a measuring cylinder.
• Add H2O2 to the catalyst and quickly place the one-hole stopper in the test tube. (Show teacher).
• Place thumb over the stopper-hole and simultaneously start stopwatch to measure rate of gas production.
12
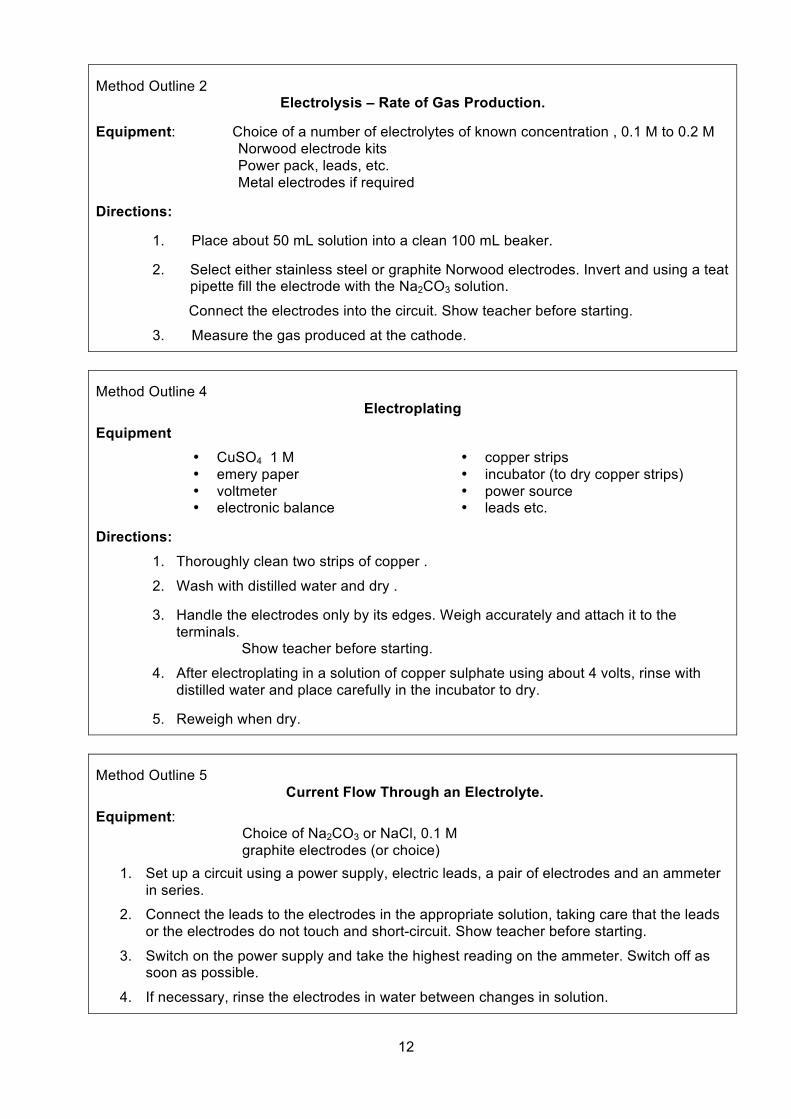
Method Outline 4
Electroplating
Equipment
• CuSO4 1 M • copper strips • emery paper • incubator (to dry copper strips) • voltmeter • power source • electronic balance • leads etc.
Directions:
1. Thoroughly clean two strips of copper .
2. Wash with distilled water and dry .
3. Handle the electrodes only by its edges. Weigh accurately and attach it to the terminals. Show teacher before starting.
4. After electroplating in a solution of copper sulphate using about 4 volts, rinse with distilled water and place carefully in the incubator to dry.
5. Reweigh when dry.
Method Outline 5
Current Flow Through an Electrolyte.
Equipment: Choice of Na2CO3 or NaCl, 0.1 M graphite electrodes (or choice)
1. Set up a circuit using a power supply, electric leads, a pair of electrodes and an ammeter in series.
2. Connect the leads to the electrodes in the appropriate solution, taking care that the leads or the electrodes do not touch and short-circuit. Show teacher before starting.
3. Switch on the power supply and take the highest reading on the ammeter. Switch off as soon as possible.
4. If necessary, rinse the electrodes in water between changes in solution.
Method Outline 2
Electrolysis – Rate of Gas Production. Equipment: Choice of a number of electrolytes of known concentration , 0.1 M to 0.2 M Norwood electrode kits Power pack, leads, etc. Metal electrodes if required Directions:
1. Place about 50 mL solution into a clean 100 mL beaker.
2. Select either stainless steel or graphite Norwood electrodes. Invert and using a teat pipette fill the electrode with the Na2CO3 solution.
Connect the electrodes into the circuit. Show teacher before starting.
3. Measure the gas produced at the cathode.

13
SOME ADVICE REGARDING ANALYSIS AND EVALUATION Discussion of errors 1. The more steps (measurements) in the overall practical present a greater scope for errors to creep in (as well as mistakes to be committed) 2. Students should recognise / identify these potential errors specific to their practical and their performance and “mentally list” them prior to any discussion of errors. 3. They should consider which potential or “actual” errors (identified after completion of the hands- on component) have the greatest impact on the purpose. Improvements to method should link to appropriately identified errors not the vague and throwaway “do it all better next time”. We the authors strongly suggest that teachers refer to the SACE Board 2010 assessment report for chemistry (p13-14) which makes lengthy comment on practical investigations and how students have approached the reporting. From this we endorse
• Designs which allow the student to “play” with variations of their chosen independent variable to establish the suitable range to be used for the final experiment.
• “Designs” which are limited to modification of a supplied procedure are much less likely to allow higher achievement in standard I1 (A = logical, coherent and detailed investigation).
• That blank tables should not be provided and that students wholly construct tables in the spaces provided (scaffolding is not summative standard)
• If the preparation of an ester is undertaken then requiring students to quantify aspects of the experiment is reasonable – such as measuring volume of isolated / purified ester and comparing to theoretical yield for a percentage yield. This value provides further discussion points – reasons for high / low production.
• Graphing – students need to understand that best fit lines are not always straight and that the line is not required to pass through the first and last point in determining linear best fit.
• Students selecting to use Excel to prepare a graph for a report need to be able to use all relevant functions including graph axes labelling (quantity and units), selection of appropriate scales and whether to use the trendline function for the line of best fit or applying a hand-drawn fit line. If these are not effectively dealt with, the achievement of performance in the features such as I4, A2 and KU3 cannot be demonstrated to the higher levels of A and B.
• Evaluation questions which ask how a procedure affects an experimental result imply that a description / explanation of the effect is provided not just that the result would be affected.
• A consistency in the use of significant figures throughout calculations should be rewarded. However the use of non-volumetric glassware such as measuring cylinders reduces the number of significant figures and should be recognised by students.
• On the other hand students should be penalised when they express concentrations of higher resolution as perhaps a single digit value.
• There is a difference between avoidable mistakes (e.g. selecting wrong apparatus), and random and systematic errors.

14
• Students need to have understandings of the relationship between random errors, the need to increase the number of trials, and the benefit of averaging the results before writing evaluations.
• In addition random errors cannot be reduced but their effects can by statistical averaging. This increases the reliability of the data.
• Students need to understand the relationship between precision, scatter of results, and random errors as well as the connection between reliability and reproducibility.
• Identification and discussion of systematic errors must relate to equipment used in the experiment and not generic and sometimes spurious suggestions. Such errors will not be reduced by statistical averaging.
• The language used in evaluation discussions should not be in absolute terms. Students should have had experience in previous science courses in writing discussions where the use of relative terms such as “may”, “probably” and “likely” was practised.
PRECISION, ACCURACY and RESOLUTION A precise measurement is often discussed. How appropriate is the use of that term? For the purposes of the investigations that are contained in this manual, the term precision refers to a series of repeated measurements and their consistency. The exactness with which a single measurement is made depends on the instrument and its resolution (the smallest increment between marks on the device). Thus the resolution is related to the uncertainty of the measurement. Uncertainty is defined as half the smallest possible measurement for the instrument. For a 100.00 mL measuring cylinder with a mark on the glass for each 1 mL, then its uncertainty is +/- 0.5 mL. A reading where the liquid meniscus is observed to coincide with the mark for 52 mL, then the volume is between 51.5 and 52.5 mL Hence any discussion of errors is about measurement and not procedural mistakes (blunders). If an experimenter takes a measurement ten times, it could be expected the 10 results differ slightly and the arithmetic mean would be calculated and expressed with same significant figures as the data used. Remember the mean is the most probable value but not necessarily the true value. A method which assists a student to assess whether random errors are featured in an experiment is to note the degree of scatter of plotted data points on graph. Systematic errors can be introduced by experimental conditions e.g. temperature fluctuations or faulty instruments viz. poorly calibrated devices which could include thermometers, balances, stopwatches, burettes and volumetric flasks. If the calibration error is known, then corrections can be made in the quantities being measured. Each individual experiment must be examined for possible sources of systematic error. Averaging many measurements will not reduce this type of error. When data is graphed, a systematic error may be noted when all data points are biased to one side of the line of best fit going through the origin. Attempts to select reasons for random and systematic errors need to be related to the method and equipment used, and quite specifically stated.

15
Significant figures Should be related to the uncertainty of measurement - one method to express the uncertainty is that the number you report has the number of digits that are known with certainty plus the first digit that is uncertain
When using a regular burette, you may note the meniscus bottom not in line with a marking on the glass barrel ; that is, the level is somewhere between 21.1 and 21.2 mL and may be estimated to be 21.13 mL.
The last digit ..3 is uncertain (which is acceptable as all measurements have inherent uncertainty however small that might be)
It is important volume and concentration values are stated as precisely as possible reflecting the degree of resolution of instrument used. Hence a volumetric flask stated as 250 mL has an uncertainty of +/-0.5 mL whereas the maker's intention is that the volume is 250.0 mL (hence uncertainty is much less at +/-0.05 mL). In terms of significant figures which might be used in calculations, 250 has only 2 significant figures (sig figs) but a volume stated as 250.0 has 4 sig figs
Whole numbers such as 340 and 600 are ambiguous with respect to the number of significant figures in that the zeros in these numbers may be significant - actually 340.0 or merely a location for the understood decimal point.
The use of scientific notation avoids the ambiguity in the following examples:
i. 340 has 3 sig figs if written as 3.40 X 10²
ii. 340 has 2 sig figs if written as 3.4 X 10²
iii. 600 has 1 sig fig if written as 6 X 10².
iv. 600.0 however has 4 sig figs. written as 6.000 X 10²
Multi-step calculations Particularly in volumetric analysis calculations but as a general principle single step calculations need to express the solution to the appropriate number of significant figures which relates the measurement value with the least number of significant figures This means rounding off the calculator answer displayed which is a mental exercise performed by you, the student. However if this answer is then needed for subsequent calculations in a multi-step calculation then the number shown in the display must be used NOT the rounded off number. Using rounded numbers from one step to the next can accumulate errors THEREFORE you must store and use the values in your calculator at each step and only round off after the final step. Penalties apply to the calculations which show early rounding off.
ISSUES INVESTIGATIONS and COMMUNICATION In issues investigations, students use information from different sources, which may include primary source data they generate themselves such as observations and measurements made in the laboratory. Students develop questions for investigation, undertake research approaches, and collect evidence to inform their investigations. They learn to think critically and reflectively when relating their evidence to the issue under investigation. They describe the different views people hold on an issue, based on their evidence.

16
A vast amount of information is available on a wide range of chemistry-related topics, and many means exist for obtaining that information. Students have opportunities to become proficient in a range of techniques for obtaining and evaluating information.
Students develop their literacy skills as they acquire knowledge of chemistry terminology and its appropriate application, gain understanding of contextual uses of data and concepts, and critically analyse information from different sources.
Writing the Report The most common form of issues investigation currently consists of part 1 – Article analysis (often 2 articles on the topic) taking about 400 words, and part 2 – Written report which provides up to 1100 words available to present the following aspects (as shown by the exemplar from stage 2 Chemistry support materials on the SACEBoard website). Commonly, the report will be written under supervision in a double lesson (or 80-100 minutes equivalent).
• In the report students will acknowledge their sources of information by citing references as they are referred to and including them in a reference list.(Harvard referencing)
• Students may bring with them their own articles, the additional material they have collected, their annotations and text book. The teacher will have discretion as to what materials are allowed – one of the issues investigations in the manual restricts students to just the annotated printed or photocopied articles.
• Students use appropriate chemical terms and conventions to explain links between chemical data, concepts, and issues.
Introduction 1. Briefly identify the chemistry issue and the relevant social and/or environmental context.
Chemical Background 2. Explain, including use of relevant diagrams, the chemistry concepts related to the issue,
using appropriate chemistry terms, conventions, formulae, and equations. It is vital to the quality of the report that a student can provide sufficient relevant and correct chemistry.
Social and/or Environmental Issues 3. Identify and explain at least two different social and/or environmental perspectives on
the issue (using separate paragraphs, preferably with topic sentences for each paragraph).
4. Evaluate the information gathered. Some aspects you might consider are: • are all viewpoints equally valid, e.g. do some viewpoints focus on economics at cost
of health of environment or society; • are some short term considerations and others long-term; • do some misunderstand the chemistry involved; • who gains, who loses; • can potential damage be repaired; • can risks be minimised; should risks be compromised?
Note: There may be other aspects that are relevant to your topic.
5. Summarise results or findings. 6. Write a conclusion, making relevant predictions and a recommendation. 7. Cite all sources of information appropriately.

17
8. The reference list should be annotated to reflect evaluation of the different sources. An example from the Student 1 Response which shows evaluation of references in a list looks like this:
http://www.epa.gov/magnesium-‐sf6/basic.html This site is provided by the United States Environment Protection Agency. It is a reliable site. It is a Government agency and is likely to be unbiased because it is required to collect and interpret evidence objectively. It gives details about SF6 in magnesium production and the environmental impact of the process. Students will need to have the different aspects of the report demonstrated to them – and be able to practice them with appropriate scaffolding. Some Advice taken from SACE Assessment Reports Word count should be detailed by the student when the final report is provided – evidence is required. References must be limited to those which are cited in the text of the report (no padding). In-text referencing is expected when using ideas or quoted material within the report and also when using a diagram or a graph Students should access references which are not the textbook or encyclopaedias (such as Wikipedia). Such sources can be used first up for background but clearly they rarely shed any light on an issue. It is expected that the most up to date resources are used by students as one means to show that it is the student’s own work. Articles that can be 15 to 20 years old can suggest in the minds of moderators that the student is resurrecting another’s work. Therefore teachers must impress upon their students that it is their responsibility to show that the submitted work is their own. One of the first things that a student researching an issue must do is establish that there is sufficient chemistry to discuss when presenting the report. Some health and environmental issues do not have much chemistry and students should take care. We recommend that students work on formative exercises that allow them to become experienced in assessing a source particularly websites and blogs for bias, relevance and credibility. The following pages offers some suggestions regarding assessing articles for bias and credibility. The information is taken from a number of websites linked to college libraries as well as Wiki-How. ASSESSING FOR BIAS
Look for at least two sides to every story. A good reporter will allocate adequate space in the story to present facts and figures supporting all sides of an issue. Ask yourself if all sides of this argument or dispute would agree that their views were represented fairly? If not, the story may show bias. [2]
If statistics are provided or studies are mentioned, dig a little deeper. Where did those statistics and studies come from? Who collected or conducted them? Who funded the research? The best articles will reveal this information.

18
While evaluating possible bias in an article, it is also useful to evaluate your own motives and personal biases that may influence your reaction to the article. Do you appreciate information that supports your world view and resent information that calls your view into question?
Watch for buzzwords. These are vaguely-defined terms ("the homosexual agenda" or "the Christian agenda") that are designed or tend to evoke an emotional reaction without giving you any real information. Investigate the article for undefined terms, especially when you come across a word that gives you a very strong feeling.
Who owns the newspaper or magazine company? It may be that editors and journalists are directed to take a certain line. With more scholarly articles an author may be allowed to hold and present a biased viewpoint provided there is evidence or argument which attempts to support that viewpoint.
Take notes as you read the article. Identify "who, what, when, where, why and how" and make a note of any missing information or extra analysis. M Missing information might equate to the failure to present the position of one or more involved parties or their opinions.
More specifically, closely looking at the structure and content of an article from any source should help reveal possibilities of bias. Some of the following headings may help.
Organization and Content: Is the material organized and focused? Is the argument or presentation understandable? Is this original research, a review of previous research, or an informative piece?
Date of Article: Some topics, such as those in the health sciences, require current information. Other subjects, such as geology, value older material as well as current. Know the time needs of your topic and examine the timeliness of the article; is it: up-to-date, out-of-date, or timeless? Bibliography: scholarly works always contain a bibliography of the resources that were consulted. The references in this list should be in sufficient quantity and be appropriate for the content. Look for:
If a bibliography exists If the bibliography is short or long If the bibliography is selective or comprehensive If the references are primary sources (ex. journal articles) or only secondary sources (ex. encyclopaedias)
If the references are contemporary to the article itself or much older, and Usefulness: Is the article relevant to the current research topic? A well-researched, well-written article is not going to be helpful if it does not address the topic at hand. Ask, “is the article useful to me?” If it is a useful article, does it: support an argument refute an argument give examples (survey results, primary research findings, case studies, incidents) provide "wrong" information that can be challenged or disagreed with productively Authority: Is the author an expert in this field? Where is the author employed? What else has he/she written? Has he/she won awards or honours? Coverage: Does the article cover the topic comprehensively, partially, or is it an overview?

19
Audience: For what type of reader is the author writing? This ties in with the type of journal, as popular magazines are geared to the general reader, while trade magazines are for the specialist and scholarly journals are directed at researchers, scholars or experts in the field. Is the article for: general readers, students (high school, college, graduate), specialists or professionals, researchers or scholars?
Illustrations: Are charts, graphs, maps, photographs, etc. used to illustrate concepts? Are the illustrations relevant? Are they clear and professional-looking? ASSESSING CREDIBILITY OF SOURCES In evaluating the credibility of an information source there are several key areas to consider:
the Authority of the author and the background of the publisher the Objectivity of the author the Quality of the work the Currency of the work the Relevancy of the work The website http://library.uoregon.edu/guides/findarticles/credibility.html has a page on the Credibility of sources with a comprehensive table including examples for each of the above 5 key areas to consider. For example, the table which can help evaluate the currency of a source is included. To evaluate currency:
Ask the Questions Find answers When was it published? Look for a publication or copyright date on the
Title page (books, journals) Reverse of the title page (books) Cover (journals, magazines, newspapers) Table of contents (journals, magazines) Bottom of the page (websites) Dates on webpages may indicate
- when the page was created - when the page was published on the web - when the page was last revised
Is your topic one that requires current information?
Topic areas requiring the most up-to-date information include Science Medicine Current events
Has this source been updated in a subsequent edition?
Search WorldCat for a more recent edition
RESEARCH THE AUTHOR!! INVESTIGATE THE PUBLISHER!! CHECK THE SOURCES USED BY THE AUTHOR!!

20
The Wiki-How website http://www.wikihow.com/Evaluate-the-Credibility-of-a-Source provides an easy to use Cheat Sheet to follow. Examples of sources that are often the most credible:
Official government websites • institutional sites that represent universities, regulatory agencies, governing bodies, and
respected organisations with specific expertise (e.g. CSIRO) • peer-reviewed journals • reputable news sources
Examples of sources that are often considered less credible:
• Blogs • Web forums • Individual or business websites • Materials published by an entity that may have an ulterior motive (e.g. energy company)
Factors to consider Least reliable Possibly reliable Most reliable
Type of source Unfamiliar website Published material Official websites, institutional sites, academic journals
Author’s background Uncredited Educated on topic Expert in the field
Date published None Outdated Recently revised
Depth of review Controversial reviews Good public response; general approval
Peer-reviewed by reliable sources
Sources cited None Credible sources Citations referencing other well-cited works
Objectivity Clearly biased Sponsored source Balanced, neutral
Beware of using Wikipedia as a source for academic or journalistic writing. While a scientific study has showed that Wikipedia is as accurate as professionally generated encyclopaedias, it is generally considered not credible enough for use in articles where accuracy is of extreme importance. The more radical the ideas presented in a particular source (in comparison to other sources on the same subject) the more carefully students need to scrutinise it. Teachers may in the first instance be able to help with advice on the level of scrutiny needed. We all need to remember that Gregor Mendel’s work was cited only three times, criticized, and ignored for 35 years before his discoveries in genetics were recognized in the field of science. So we cannot dismiss any source of ideas completely. The recommended referencing style is Harvard. Your school library / resources centre may have available The Harvard Reference Builder through its catalogue or otherwise within reach of all students. While the overall author-date-title-publisher style applies to all types of information sources, using the reference builder allows the student to correctly follow these conventions whether the source is an interview with an expert, a text book or a webpage.