assessment of surface water quality in the malaysian...
TRANSCRIPT

Sains Malaysiana 40(10)(2011): 1053–1064
Assessment of Surface Water Quality in the Malaysian Coastal Waters by Using Multivariate Analyses
( Penilaian Kualiti Air Permukaan di Perairan Pantai Malaysia Menggunakan Analisis Multivariat)
C.K. YAP*, M.W. CHEE, S. SHAMARINA, F.B. EDWARD, W. CHEW & S.G. TAN
ABSTRACT
Coastal water samples were collected from 20 sampling sites in the southern part of Peninsular Malaysia. Seven physico-chemical parameters were measured directly in-situ while water samples were collected and analysed for 6 dissolved trace metal concentrations. The surface water (0-20 cm) physico-chemical parameters including temperature, salinity, dissolved oxygen (DO), pH, total dissolved solids (TDS), specific conductance (SpC) and turbidity while the dissolved trace metals were Cd, Cu, Fe, Ni, Pb and Zn. The ranges for the physico-chemical parameters were 28.07-35.6ºC for temperature, 0.18-32.42 ppt for salinity, 2.20-12.03 mg/L for DO, 5.50-8.53 for pH, 0.24-31.65 mg/L for TDS, 368-49452 μS/cm for SpC and 0-262 NTU for turbidity while the dissolved metals (mg/L) were 0.013-0.147 for Cd, 0.024-0.143 for Cu, 0.266-2.873 for Fe, 0.027-0.651 for Ni, 0.018-0.377 for Pb and 0.032-0.099 for Zn. Based on multivariate analysis (including correlation, cluster and principal component analyses), the polluted sites were found at Kg. Pasir Puteh and Tg. Kupang while Ni and Pb were identified as two major dissolved metals of high variation in the coastal waters. Therefore, water quality monitoring and control of release of untreated anthropogenic wastes into rivers and coastal waters are strongly needed.
Keywords: Dissolved trace metals; physico-chemical properties; water quality
ABSTRAK
Sampel air telah diambil dari 20 lokasi persisiran pantai di bahagian selatan Semenanjung Malaysia. Tujuh parameter fiziko-kimia telah diukur in-situ manakala sampel air diambil untuk analisis kepekatan 6 logam surih terlarut. Parameter fiziko-kimia permukaan air (0-20 cm) yang diukur termasuk suhu, saliniti, oksigen terlarut (DO), pH, jumlah pepejal terlarut (TDS), konduktans spesifik (SpC) dan kekeruhan manakala, kepekatan logam surih yang telah diukur meliputi Cd, Cu, Fe, Ni, Pb, dan Zn. Julat parameter bagi fiziko-kimia yang diukur ialah 28.07-35.6ºC (suhu), 0.18-32.42 ppt (saliniti), 2.20-12.03 mg/L (DO), 5.50-8.53 pH, 0.24-31.65 mg/L (TDS), 368-49452 μS/cm (SpC) dan 0-262 NTU (kekeruhan). Manakala, julat kepekatan logam-logam terlarut (mg/L) ialah 0.013-0.147 (Cd), 0.024-0.143 (Cu), 0.266-2.873 (Fe), 0.027-0.651 (Ni), 0.018-0.377 (Pb) dan 0.032-0.099 (Zn). Kawasan persampelan tercemar telah ditemui di Kg. Pasir Puteh dan Tg. Kupang berdasarkan analisis multivariat termasuk analisis korelasi, kluster dan komponen prinsipal. Selain itu, Ni dan Pb telah dikenal pasti sebagai dua logam terlarut yang menunjukkan variasi tinggi dalam persisiran pantai. Oleh itu, pemantauan kualiti air dan kawasan sisa buangan antropogenik yang tidak dirawat ke sungai dan persisiran pantai adalah amat diperlukan.
Kata kunci: Ciri-ciri fiziko-kimia; kualiti air; logam surih terlarut
INTRODUCTION
The west coast of Peninsular Malaysia including the southern part of the peninsula is an area where industries and populations are concentrated (Yap et al. 2002). The southern part of Peninsular Malaysia becomes important when the Ninth Malaysia Plan covering the period 2006 to 2010 was launched in March 2006. It identified the newly named Iskandar Development Region (IDR) as one of the catalyst and high-impact development areas under the Plan. The IDR is a new main southern development corridor in Johore and it will greatly enhance the development of Malaysia.
Although monitoring water quality does not measure the environmental health on an ecosystem, it is argued that the water quality of an aquatic ecosystem can provide a rapid assessment of the environmental quality before it is manifested in living organisms (Connell 1981) and it is faster when compared to some other monitoring or biomonitors due to multiple and complicated steps involved in their analyses. These could be the reasons why several such water monitoring studies are reported in the literature (Azrina et al. 2006; Yap et al. 2005, 2006, 2009), signifying the significance of such routine monitoring work. Every living organism has a range of

1054
tolerance for all abiotic factors (water quality) in their surrounding habitats. Any parameter which is out of the tolerance range could be considered as being detrimental to living organisms. Thus, this would affect the distribution and abundance of organisms. Some physico-chemical properties such temperature, salinity, dissolved oxygen (DO), total dissolved solids (TDS), turbidity, pH and specific conductivity (SpC) can potentially affect the fate of any contaminant in the water, control their speciation and thus their distribution within the dissolved or particulate fractions (Nicolau et al. 2006). These parameters can be used to indicate the pollution level of the water body (Kamal et al. 2007). Statistical analysis of water quality parameters including trace metal speciation was undertaken with a view to seeing the interrelationship between different variables and also to identify probable sources in order to explain the pollution status (Kuppusamy & Giridhar 2006). In recent years, Principal Component Analysis (PCA) techniques have been applied to a variety of environmental applications (Ouyang et al. 2006). The objectives of this study were to determine the physico-chemical properties (temperature, pH,
conductivity, total dissolved solids, salinity, dissolved oxygen and turbidity) and dissolved trace metals (Cd, Cu, Fe, Ni, Pb and Zn) in coastal waters of the southern part of Peninsular Malaysia and to assess the pollution status based on statistical multivariate analyses. Multivariate analyses included cluster analysis, correlation analysis and principal component analysis on the present water quality data in order to understand the inter-relationships between different variables and also to identify the polluted sites as well as metals of high variations.
MATERIALS AND METHODS
Water samples were collected from 20 sampling sites in Southern Peninsular Malaysia (Figure 1) from 8 to 11 May 2007. These sampling sites included intertidal areas, estuaries, downstream of rivers, drainages, inshore and offshore. The positions, sampling dates, sampling time, weather and site descriptions are given in Table 1. The sampling locations included areas with different environmental backgrounds for examples fish aquaculture, agriculture, ports, recreational, industrial and urban areas.
FIGURE 1. Map showing the water samples collecting sites in Peninsular Malaysia. Numbering of sampling sites followed those detailed in Table 1

1055
TABLE 1. Sampling information with descriptions of sampling sites
No. Site Date Time/ Weather Location Site description1. Malacca1 May 8, 2007 2.07 p.m.
Sunny and clearN 02°10.686’E 101°46.769’
A fishing area with mussel aquaculture. Some restaurants in the vicinity.
2. Malacca2 May 8, 2007 3.25 p.m.Clear and Sunny
N 02° 10.726’E 102° 18.419’
A muddy shore with residential developmental area.
3. Malacca3 May 8, 2007 4.09 p.m.Clear and Sunny
N 02°10.796’E 102°18.268’
A drainage by a busy roadside. Some restaurants and stores in the vicinity.
4. Muar River (Muar)
May 8, 2007 7.00 p.m.Clear and Sunny
N 02°09.573’E102° 19.033’
A small jetty in the estuary and a wet market. A town centre.
5. Parit Jawa (PJawa)
May 9, 2007 10.06 a.m.Cloudy and Windy
N 01°57.013’E 102°37.967’
A fishing village, a jetty and Some restaurants in the vicinity.
6. Minyak Beku (MBeku)
May 9, 2007 12.57 p.m.Rainy and Windy
N 01°57.013’E 102°49.678’
A fishing site and some restaurants.
7. Tampok May 9, 2007 3.30 p.m.Rainy, Cloudy and Windy
N 01°37.539’E 103°11.977’
A mangrove area with a dam and an agricultural area
8. Pontian Besar (PontianB)
May 9, 2007 4.51 p.m.Rainy and Cloudy
N 01°30.469’E 103°11.977’
A small jetty, residential area. A wood processing factory and some construction were observed.
9. Kukup1 May 9, 2007 6.25 p.m.Rainy, cloudy and Windy
N 01°19.557’E 103°26.503’
RestaurantA jetty and many restaurants in the vicinity. A fish aquaculture site.
10. Kukup2 May 9, 2007 6.45 p.m.Rainy, cloudy and Windy
N 01°19.507’E 103°26.364’
Near mangrove area and a fish aquaculture site.
11. Tanjung Kupang 1 (TKup1)
May 10, 2007 10.50 a.m.Sunny
E 103°38.106’ A fishing village with restaurantsA fish aquaculture site.
12. Tanjung Kupang 2 (TKup2)
May 10, 2007 11.08 a.m.Sunny
N 01°22.766’E 103°38.106’
A fish aquaculture site.
13. Danga Bay (Danga)
May 10, 2007 12.44 p.m.Sunny
N 01°28.144’E 103°43.549’
A small jetty and a recreational site.
14. Pantai Lido (PLido)
May 10, 2007 1.28 p.m.Sunny
N 01°28.146’ E 103°46.895’
Town centre, restaurants and a small jetty.
15. Senibong May 10, 2007 2.15 p.m.Sunny
N 01°29.106’ E 103°49.020’
Restaurants, mussel aquaculture site, factories and dockyards and some construction activities
16. Kampung Pasir Puteh 1 (KPP1)
May 10, 2007 4.32 p.m.Sunny
N 01°29.108’ E 103°49.003’
A mussel aquaculture site with petrochemical plants in the vicinity. A heavy shipping lane and port in the nearby.
17. Kampung Pasir Puteh 2 (KPP2)
May 10, 2007 5.14 p.m. Sunny
N 01°29.108’ E 103°49.003’
A mussel aquaculture site with petrochemical plants in the vicinity. A heavy shipping lane and port in the nearby.
18. Mersing May 11, 2007 8.47 a.m. Sunny
N 02°25.936’ E 103°50.204’
A market with fishing and shipping activities.
19. Kuala Pontian (KPontian)
May 11, 2007 11.15 a.m. Sunny
N 02°45.636’ E 103°31.176’
Mussel aquaculture site in the estuary.
20. Nenasi May 11, 2007 2.20 p.m. Sunny
N 03°08.153’ E 103°26.598’
A fishing village, a small jetty and some restaurants.
1056
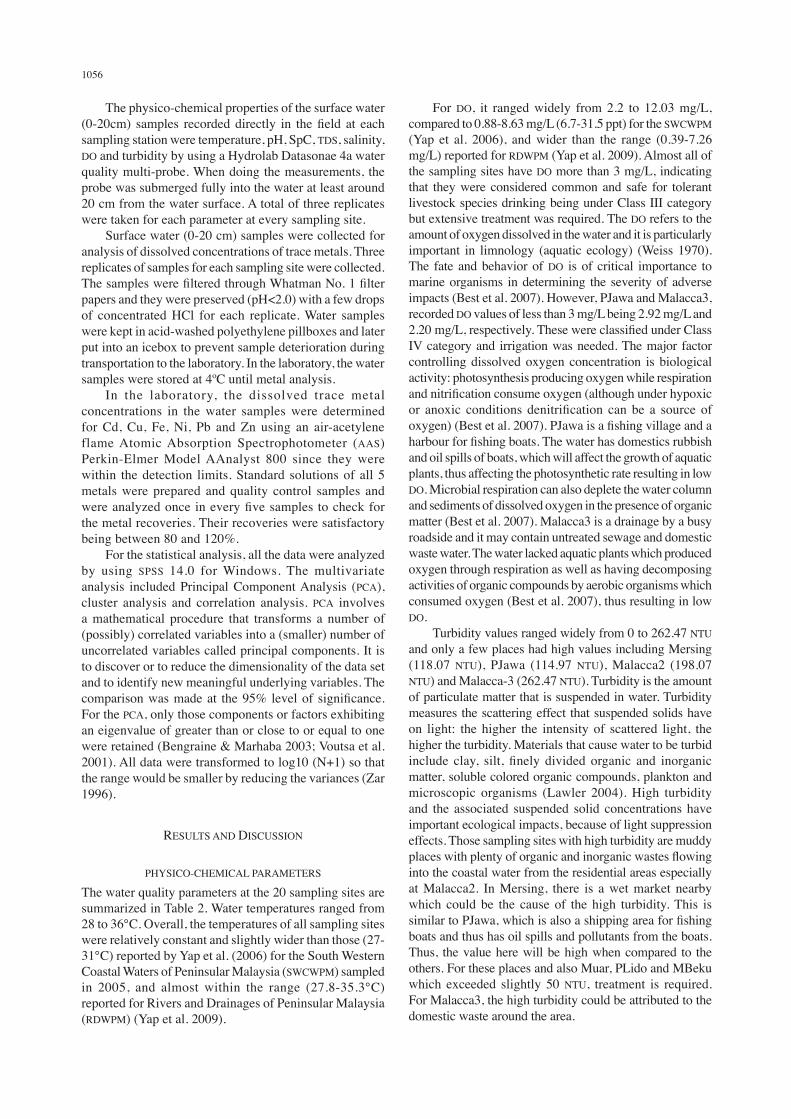
The physico-chemical properties of the surface water (0-20cm) samples recorded directly in the field at each sampling station were temperature, pH, SpC, TDS, salinity, DO and turbidity by using a Hydrolab Datasonae 4a water quality multi-probe. When doing the measurements, the probe was submerged fully into the water at least around 20 cm from the water surface. A total of three replicates were taken for each parameter at every sampling site. Surface water (0-20 cm) samples were collected for analysis of dissolved concentrations of trace metals. Three replicates of samples for each sampling site were collected. The samples were filtered through Whatman No. 1 filter papers and they were preserved (pH<2.0) with a few drops of concentrated HCl for each replicate. Water samples were kept in acid-washed polyethylene pillboxes and later put into an icebox to prevent sample deterioration during transportation to the laboratory. In the laboratory, the water samples were stored at 4ºC until metal analysis. In the laboratory, the dissolved trace metal concentrations in the water samples were determined for Cd, Cu, Fe, Ni, Pb and Zn using an air-acetylene flame Atomic Absorption Spectrophotometer (AAS) Perkin-Elmer Model AAnalyst 800 since they were within the detection limits. Standard solutions of all 5 metals were prepared and quality control samples and were analyzed once in every five samples to check for the metal recoveries. Their recoveries were satisfactory being between 80 and 120%. For the statistical analysis, all the data were analyzed by using SPSS 14.0 for Windows. The multivariate analysis included Principal Component Analysis (PCA), cluster analysis and correlation analysis. PCA involves a mathematical procedure that transforms a number of (possibly) correlated variables into a (smaller) number of uncorrelated variables called principal components. It is to discover or to reduce the dimensionality of the data set and to identify new meaningful underlying variables. The comparison was made at the 95% level of significance. For the PCA, only those components or factors exhibiting an eigenvalue of greater than or close to or equal to one were retained (Bengraine & Marhaba 2003; Voutsa et al. 2001). All data were transformed to log10 (N+1) so that the range would be smaller by reducing the variances (Zar 1996).
RESULTS AND DISCUSSION
PHYSICO-CHEMICAL PARAMETERS
The water quality parameters at the 20 sampling sites are summarized in Table 2. Water temperatures ranged from 28 to 36°C. Overall, the temperatures of all sampling sites were relatively constant and slightly wider than those (27-31°C) reported by Yap et al. (2006) for the South Western Coastal Waters of Peninsular Malaysia (SWCWPM) sampled in 2005, and almost within the range (27.8-35.3°C) reported for Rivers and Drainages of Peninsular Malaysia (RDWPM) (Yap et al. 2009).
For DO, it ranged widely from 2.2 to 12.03 mg/L, compared to 0.88-8.63 mg/L (6.7-31.5 ppt) for the SWCWPM (Yap et al. 2006), and wider than the range (0.39-7.26 mg/L) reported for RDWPM (Yap et al. 2009). Almost all of the sampling sites have DO more than 3 mg/L, indicating that they were considered common and safe for tolerant livestock species drinking being under Class III category but extensive treatment was required. The DO refers to the amount of oxygen dissolved in the water and it is particularly important in limnology (aquatic ecology) (Weiss 1970). The fate and behavior of DO is of critical importance to marine organisms in determining the severity of adverse impacts (Best et al. 2007). However, PJawa and Malacca3, recorded DO values of less than 3 mg/L being 2.92 mg/L and 2.20 mg/L, respectively. These were classified under Class IV category and irrigation was needed. The major factor controlling dissolved oxygen concentration is biological activity: photosynthesis producing oxygen while respiration and nitrification consume oxygen (although under hypoxic or anoxic conditions denitrification can be a source of oxygen) (Best et al. 2007). PJawa is a fishing village and a harbour for fishing boats. The water has domestics rubbish and oil spills of boats, which will affect the growth of aquatic plants, thus affecting the photosynthetic rate resulting in low DO. Microbial respiration can also deplete the water column and sediments of dissolved oxygen in the presence of organic matter (Best et al. 2007). Malacca3 is a drainage by a busy roadside and it may contain untreated sewage and domestic waste water. The water lacked aquatic plants which produced oxygen through respiration as well as having decomposing activities of organic compounds by aerobic organisms which consumed oxygen (Best et al. 2007), thus resulting in low DO. Turbidity values ranged widely from 0 to 262.47 NTU and only a few places had high values including Mersing (118.07 NTU), PJawa (114.97 NTU), Malacca2 (198.07 NTU) and Malacca-3 (262.47 NTU). Turbidity is the amount of particulate matter that is suspended in water. Turbidity measures the scattering effect that suspended solids have on light: the higher the intensity of scattered light, the higher the turbidity. Materials that cause water to be turbid include clay, silt, finely divided organic and inorganic matter, soluble colored organic compounds, plankton and microscopic organisms (Lawler 2004). High turbidity and the associated suspended solid concentrations have important ecological impacts, because of light suppression effects. Those sampling sites with high turbidity are muddy places with plenty of organic and inorganic wastes flowing into the coastal water from the residential areas especially at Malacca2. In Mersing, there is a wet market nearby which could be the cause of the high turbidity. This is similar to PJawa, which is also a shipping area for fishing boats and thus has oil spills and pollutants from the boats. Thus, the value here will be high when compared to the others. For these places and also Muar, PLido and MBeku which exceeded slightly 50 NTU, treatment is required. For Malacca3, the high turbidity could be attributed to the domestic waste around the area.

1057
The pH values which measure how acidic/basic water is, ranged from pH 5.5-8.5 for all sampling sites, satisfying the Interim National Water Quality Standards (INWQS) for Malaysia (DOE 2008), indicating neither a threat to biological life nor causing skin-eye irritation problems during contact due to water sports. The pH range was also wider than that (8.95-9.99) reported by Yap et al. (2006) for the SWCWPM and almost within the range (4.96-9.81) reported for RDWPM (Yap et al. 2009). There were exceptions for Malacca3, Muar, PJawa, MBeku, Tampok and TKupang. They had pH values between 5.4-5.8 and therefore extensive treatment might be required. Photosynthetic activity and microbial respiration as well as decomposing activities in the river will affect the pH value. In Muar, there is a market in the vicinity and many organic wastes flowed into the river. There is a restaurant at the TKup sampling site which discharged sewage. The photosynthetic activities of aquatic plants in all of these areas are hindered by the anthropogenic pollutants which lowered the pH. For MBeku, the low pH was due to the rainfall during our sampling time. Rainfall will cause the leaching of acid and metals concurrently into the water, which can have an immediate or a long-term effect by influencing the chemical composition and pH fluctuations of the water (Preda & Cox 2000). For Tampok, it is a river in a mangrove forest thus the respiration rate of the aquatic organisms will be higher thus causing the pH to be lowered. Only Malacca3 had the highest pH value of 8.53 because it is not coastal water but drainage water and it is strongly affected by the domestic waste. The salinity ranged from 0.18 to 32.42 ppt, indicating that some of the sampling sites were at drainages (far away from the sea) and some sites received major influence from river and oceanic waters. The salinity range was within those (6.7-31.5 ppt) for the SWCWPM (Yap et al. 2006) and had a wider range than that (0.00-8.93 ppt) reported for RDWPM (Yap et al. 2009). Salinity is an ecological factor of considerable importance, influencing the types of organisms that live in a body of water. Some places with the highest levels which exceeded 30 ppt included Malacca1, Kukup1, Kukup2 and KPontian. Compared to the salinity values of Nenasi, KPontian, Kukup and KPP as reported by Yap et al. (2005, 2006), 30.9 ppt, 26.5 ppt, 31.53 ppt and 27.57 ppt respectively, the mean values from this study were almost the same, being 15.18 ppt, 32.42 ppt, 30.3 ppt and 27.24 ppt, respectively, for the same sampling sites. From this comparison, we can conclude that the water condition is still stable except for Nenasi. This was due to the sampling site at Nenasi being located offshore in the reports by Yap et al. (2005, 2006) while the Nenasi site for this study was located at about 3 km to the estuary. Thus, a lower water salinity was expected since it received influx from the freshwater of the river. SpC ranged widely from 368-49452 μS/cm, within the range (12508-51289 μS/cm) reported by Yap et al. (2006) for the SWCWPM and wider than the range (3.33-17423 μS/cm) reported for RDWPM (Yap et al. 2009). Ionic
pollutants from anthropogenic sources also contributed to SpC (Arthur & Brandes 2007). The units used in this study was not the same as that used by the Malaysian Department of the Environment (DOE), thus they are not comparable, but some of the readings can be compared to the previous study of Yap et al. (2005, 2006). The mean SpC (μS/cm) values of Nenasi, Kuala Pontian, Kukup and K.P. Puteh recorded by Yap et al. (2005, 2006)’s studies were 55671, 47831.5, 50713 and 45261, respectively. In this study, the SpC (μS/cm) values were 24996, 49452, 46553 and 42344, respectively. From this comparison, those variations were not significant except for Nenasi, with the same reason as mentioned above. TDS, is a measure of the total ions in solution, ranging from 0.24-32 mg/L, almost within the range (7.7-31.5 mg/L) reported by Yap et al. (2006) for the SWCWPM and wider than the range (0.002-10.02 mg/L) reported for RDWPM (Yap et al. 2009). Dissolved solid concentrations in natural waters are the result of weathering and dissolution of minerals from local soil and bedrock (Freeze & Cherry 1979; Peters 1984; Arthur & Brandes 2007). Primary sources for TDS in receiving waters are agricultural runoff, leaching of soil contaminant and point source water pollution discharged from industrial or sewage treatment plants. The minimum reading of TDS obtained from the sites studied was 0.24 mg/L while the highest was 31.65 mg/L. Thus, according to the Malaysian DOE scale, they are under Class I and Class II categories of the water quality classification which is safe enough for use.
DISSOLVED TRACE METAL CONCENTRATIONS
The dissolved metal concentrations in the water samples are also presented in Table 2. The wide ranges of concentrations of trace metals found in all the sampling sites showed signs of trace metal pollution. For Cd, it ranged from 0.013 to 0.147mg/L, compared to 0.02-0.10 mg/L as reported by Yap et al. (2006) for the SWCWPM and 0.001-0.055 mg/L reported for RDWPM (Yap et al. 2009). Most of the sampling sites had more than 0.050 mg/L of Cd except for Malacca3, Muar, Danga and Mersing. The highest Cd concentration was found at KPP1 which was 0.147 mg/L followed by Senibong which was 0.131 mg/L and the rest of the sampling sites. From the Malaysian DOE report (DOE 2008), Cd concentration in the water should be around 0.010 mg/L, to be classified as Class II but all the sampling sites exceeded this value. Cd is actively extracted from its ores for commercial purposes and is also emitted in industrial processes such as metal smelting and refining, coal and oil-fired power stations, electroplating plants and others. It is spread by air and water (sewage sludge) far and wide over sea and land, but especially in the vicinity of heavy industrial plants. Thus, those sampling sites with industries had the highest levels of Cd such as KPP and Senibong. For Cu, it ranged from 0.024 to 0.143 mg/L, compared to 0.02-0.06 mg/L as reported by Yap et al. (2006) for the SWCWPM and 0.001-0.177 mg/L mg/L reported for RDWPM (Yap et al. 2009). All the sampling sites recorded more
1058
than 0.05 mg/L of Cu except for Malacca3, Muar and Nenasi. A few places were recorded with levels of almost 0.15 mg/L of Cu. These sampling sites included Kukup2, PLido, Senibong and KPP1, with KPP-1 being 0.143 mg/L. Apart from its function as a biocatalyst, Cu is necessary for body pigmentation in addition to Fe, the maintenance of a healthy central nervous system, prevention of anaemia, and is interrelated with the functions of Zn and Fe in the body. In our sampling sites, only the Muar River had a Cu concentration which belongs to Class II category while the others were more than 0.02 mg/L but less than 0.20 mg/L. Most of the sites had evidence of land-derived organic waste and Cu is generally mainly associated with the organic matter (Florence 1977) that is present in the dissolved fraction (Nicolau et al. 2006). Thus, a significant level of high Cu concentration was detected. Cu and Zn also play major roles in modern industry and, in the vicinity of extraction or processing plants, the emissions arising thereof are certainly capable of causing an undesirable contamination of agricultural products. Both KPP sites (Yap et al. 2004) and Senibong had the highest values for Cu because they are industrial and shipping areas which are the main sources of Cu as well as other trace metals (Yap et al. 2003). For dissolved Ni, it ranged from 0.027 to 0.651 mg/L, compared to 0.09-0.32 mg/L reported by Yap et al. (2006) for the SWCWPM and 0.001-0.246 mg/L reported for RDWPM (Yap et al. 2009). All the sampling sites recorded levels less than 0.50 mg/L except for Malacca1, Malacca2, Kukup1 and Kukup2. Interestingly, Kukup1 had the highest Ni concentration (0.377 mg/L), compared to the known metal-contaminated site at KPP1 (0.275 mg/L). The sources of Ni are metal-finishing, mining and chemical industries (Aziz et al. 2008). For Zn, it ranged from 0.032 to 0.099, compared to 0.03-0.095 mg/L as reported by Yap et al. (2006) for the
SWCWPM and 0.0001-0.609 mg/L reported for RDWPM (Yap et al. 2009). Only 2 sites at Muar and Mersing recorded levels less than 0.04 mg/L. Zn is an essential element for plants and animals, acting as an antioxidant and as an anticarcinogen element (Turkdogan et al. 2002) for human cellular functions. But slight increase in its levels may interfere with physiological processes. Luckily, all the sampling sites had low levels of Zn. Sufficient Zn is essential to neutralize the toxic effects of Cd (Radwan & Salama 2006). Zn content had been shown as an example of the evolution of toxic metals associated with mining contamination (Olias et al. 2006). Dissolved Fe concentrations ranged from 0.266 to 2.873 mg/L and almost all places had values of more than 0.50 mg/L, compared to 0.001-35.67 mg/L reported for RDWPM (Yap et al. 2009). There is a lack of studies on dissolved Fe in coastal waters mostly because the adverse effects of Fe on living organisms are still unknown. When compared to the INWQS (DOE 2008), the normal criterion is 1 mg/L for Fe. There were only a few places that exceeded this value including Malacca1, Malacca3 and TKup1. Malacca3, it is a roadside with high traffic volume and is a densely populated residential areas so the high Fe level was expected (Melidis et al. 2007). Malacca1 and TKup1 probably received urban runoff as well as waste water releases that contributed to the high Fe concentration because there is a restaurant at both sampling sites. Lastly for Pb, it ranged from 0.018 to 0.377 mg/L, compared to 0.001-1.523 mg/L as reported for RDWPM (Yap et al. 2009).
IDENTIFICATION OF IMPORTANT WATER QUALITY PARAMETERS BY PCA
From the first scree plot from PCA (Figure 2, Top), only three principal components (PC) which were larger than one that were used for further analysis. These three PCs
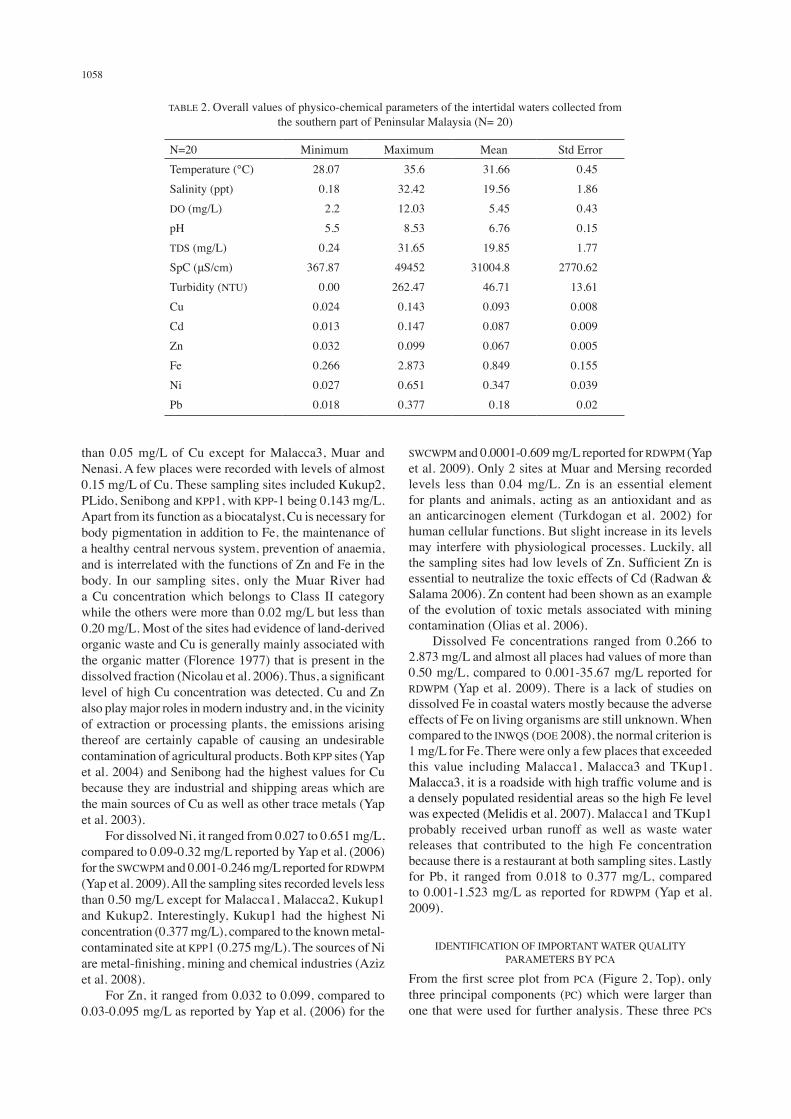
TABLE 2. Overall values of physico-chemical parameters of the intertidal waters collected from the southern part of Peninsular Malaysia (N= 20)
N=20 Minimum Maximum Mean Std ErrorTemperature (°C) 28.07 35.6 31.66 0.45Salinity (ppt) 0.18 32.42 19.56 1.86DO (mg/L) 2.2 12.03 5.45 0.43pH 5.5 8.53 6.76 0.15TDS (mg/L) 0.24 31.65 19.85 1.77SpC (μS/cm) 367.87 49452 31004.8 2770.62Turbidity (NTU) 0.00 262.47 46.71 13.61Cu 0.024 0.143 0.093 0.008Cd 0.013 0.147 0.087 0.009Zn 0.032 0.099 0.067 0.005Fe 0.266 2.873 0.849 0.155Ni 0.027 0.651 0.347 0.039Pb 0.018 0.377 0.18 0.02

1059
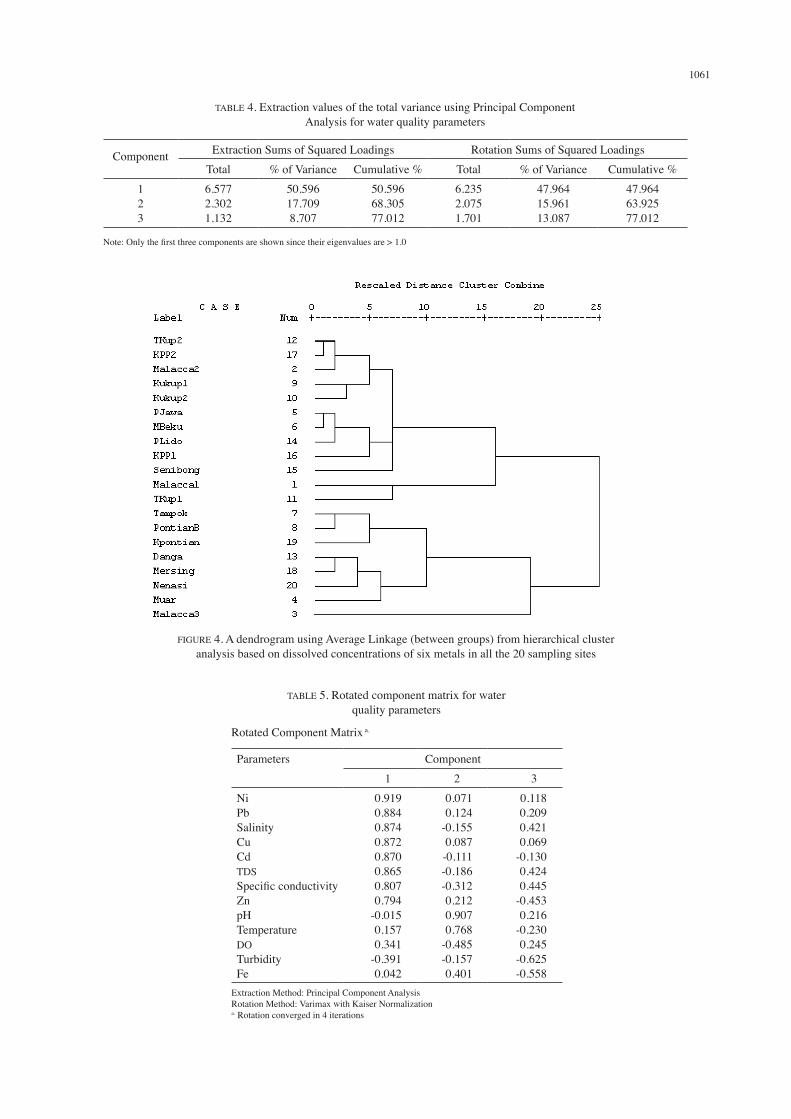
had eigenvalues greater than one or close to unity and explained 50.6%, 17.7% and 8.7% of the total variances of the information contained in the original dataset (Table 3). In Table 4, some of the parameters which loaded highly in the first component were Ni, Pb, salinity, Cu and Cd. This indicated that Ni and Pb are the major metal contaminants in the southern coastal waters of Peninsular Malaysia, followed by Cu, Cd, Zn and Fe. However, the second component had pH, temperature and Fe as the main parameters while the third component consisted of TDS and SpC. The second scree plot of PCA (Figure 3) only had two components for which eigenvalues were larger than one and further study was needed. Components 1 and 2 accounted for 89.10% and 9.97% of the total variance, respectively (Table 5). Some sampling sites including Malacca3, KPontian, Muar and TgKup1 had high loading in the first component and others including Kukup1, KPP2 and TgKup2 loaded into the second component (Table 6). The Pearson’s correlation coefficient analysis (Table 3) showed that there was a significant (P < 0.05) correlation within the physico-chemical parameters and concentrations of dissolved trace metals. The mineral-related parameters such as salinity, TDS and SpC were strongly and positively correlated with one another and they were also highly
positively correlated with the dissolved trace metal concentrations. From Table 4, PC1 was positively and largely contributed by all trace metal concentrations (except for Fe) (50.6%) and mineral-related parameters such as salinity, SpC and TDS but was negatively or less affected by physical parameters such as DO, temperature and turbidity. Therefore, this component seems to measure the preponderance of trace metal concentrations and mineral-related water quality parameters over the physical and organic-related water quality parameters. This component also revealed that the dissolved Fe concentrations, pH, temperature and turbidity were less important in accounting for coastal water quality variations since the loading (eigenvector) coefficients were low for these parameters. PC2 explained 17.7% (Table 4) of the total variance and was positively and largely contributed by pH, Fe concentration and turbidity and was negatively and largely due to DO, SpC, TDS and salinity (Table 4). This component distinguished the importance of trace metal inputs (e.g., Zn, Fe and Cd) and physical parameters (e.g., temperature and turbidity) over the natural inputs (e.g., DO and salinity). It also showed in the Pearson’s correlation coefficients (Table 3) that the physical parameters, although correlated with the concentrations of dissolved trace metals, were negatively correlated to the mineral-related parameters or the natural inputs. For PC3, this would explain the other 8.7% (Table 4) of the total variance, with high loading only on Fe concentration, turbidity, temperature and pH. Other parameters seemed to load in low levels or even negatively loaded in the component. This component seemed to reflect trace metal concentrations other than Fe and mineral-related parameters versus physical parameters. Based on the correlation analysis in Table 3, it was obvious that the mineral-related parameters and the trace metal concentrations were highly and positively correlated. In this study, any water quality parameter with correlation coefficient value >90% was considered to be an important parameter contributing to coastal waters. From the Table 5, it was clearly seen that Ni, Pb, salinity, Cu, Cd, TDS and SpC, would be the main parameters in contributing to water quality variations in coastal waters. The present correlation coefficients were supported by Kamal et al. (2007) who reported that the physical parameters were highly correlated to the dissolved trace metals but were negatively correlated to mineral-related parameters.
IDENTIFICATION OF SITES POLLUTED BY TRACE METALS THROUGH PCA
Figure 2 (bottom) is another scree plot obtained based on 6 dissolved trace metals. The plot illustrated that the first two components had eigenvalues greater than one. Both components 1 and 2 accounted for 99.1% of the total variance (Table 6). Therefore, the first two components were retained for further analysis.
Component Number
Component Number
Eige
nval
ueEi
genv
alue
FIGURE 2. Scree plot of the eigenvalues of principal components for water quality parameters (top)
and sampling sites (bottom)

1060
TAB
LE 3
. The
Pea
rson
’s c
orre
latio
n co
effic
ient
ana
lysi
s bet
wee
n ph
ysic
o-ch
emic
al p
rope
rties
and
con
cent
ratio
ns o
f dis
solv
ed tr
ace
met
als.
N=
20.
Te
mp
Salin
ity D
O p
H TD
S Sp
C Tu
r C
u C
d Zn
Fe N
i Pb
Tem
p1
-0.0
64-0
.193
0.59
2**
-0.0
87-0
.19
0.05
80.
147
0.16
90.
292
0.32
80.
148
0.12
Salin
ity1
0.43
8-0
.088
0.99
9**
0.97
8**
-0.5
68**
0.
738*
* 0.
683*
* 0.
458*
-0
.211
0.85
2**
0.83
5**
DO
1-0
.292
0.44
6*
0.47
3*
-0.2
140.
278
0.31
0.03
7-0
.224
0.31
20.
184
pH
1-0
.116
-0.2
31-0
.137
0.16
1-0
.139
0.10
10.
144
0.08
50.
155
TD
S1
0.98
5**
-0.5
61*
0.72
9**
0.68
3**
0.44
-0.2
270.
839*
* 0.
822*
*
SpC
1-0
.527
* 0.
669*
* 0.
653*
* 0.
346
-0.2
910.
771*
* 0.
754*
*
Tur
1-0
.356
-0.2
59-0
.12
-0.0
59-0
.374
-0.3
91
Cu
10.
846*
* 0.
667*
* -0
.083
0.70
3**
0.74
2**
Cd
10.
664*
* -0
.068
0.68
4**
0.65
1**
Zn
10.
359
0.68
9**
0.65
7**
Fe
10.
018
-0.1
16
Ni
10.
926*
*
Pb
1
** C
orre
latio
n is
sign
ifica
nt a
t the
0.0
1 le
vel (
2-ta
iled)
* C
orre
latio
n is
sign
ifica
nt a
t the
0.0
5 le
vel (
2-ta
iled)
1061
TABLE 4. Extraction values of the total variance using Principal Component Analysis for water quality parameters
Component Extraction Sums of Squared Loadings Rotation Sums of Squared LoadingsTotal % of Variance Cumulative % Total % of Variance Cumulative %
123
6.5772.3021.132
50.59617.7098.707
50.59668.30577.012
6.2352.0751.701
47.96415.96113.087
47.96463.92577.012
Note: Only the first three components are shown since their eigenvalues are > 1.0
TABLE 5. Rotated component matrix for water quality parameters
Rotated Component Matrix a.
Parameters Component 1 2 3
NiPbSalinityCuCdTDSSpecific conductivity ZnpHTemperatureDOTurbidityFe
0.9190.8840.8740.8720.8700.8650.8070.794
-0.0150.1570.341
-0.3910.042
0.0710.124
-0.1550.087
-0.111-0.186-0.3120.2120.9070.768
-0.485-0.1570.401
0.1180.2090.4210.069
-0.1300.4240.445
-0.4530.216
-0.2300.245
-0.625-0.558
Extraction Method: Principal Component AnalysisRotation Method: Varimax with Kaiser Normalizationa. Rotation converged in 4 iterations
FIGURE 4. A dendrogram using Average Linkage (between groups) from hierarchical cluster analysis based on dissolved concentrations of six metals in all the 20 sampling sites

1062
The loading plots of PCA based on six dissolved trace metals in water samples are presented in Figure 3. PC1 (Table 6) could explain 89.1% of the total variance, with the highest loadings on Malacca3, Muar, PontianB, Malacca1, Tampok and TKup1 (red circle in Figure 3; Table 7). Since these sites had low concentrations of dissolved trace metals according to the trace metal data, thus, they were considered ‘unpolluted’ sites. PC2 (Table 6) could explain 9.9% of the total variance, with high loading at Kukup1, KPP2, TKup2, Malacca2 and KPP1 (blue circle in Figure 3; Table 7). Based on by the metal data, the above mentioned sites were considered as ‘polluted’ sites. From the distribution of the plots in Figure 3 again, the rest of the sampling sites were considered as ‘semi-polluted’ sites. The cluster analysis (Figure 4) identified the sampling sites polluted by trace metals as well. Figure 4 demonstrates that there are two major clusters, one with Tampok,
PontianB, K.Pontian, Danga, Mersing, Nenasi, Muar and Malacca3, which clustered differently from the rest. These results are also similar to the PCA loading plots in Figure 3, representing the unpolluted sites. In Figure 4, it is noticeable that there is a smaller division of clusters in the bigger cluster. TKup2. KPP2, Malacca2, Kukup1 and Kukup2 formed one of the smaller cluster and this corresponded to the trace metal polluted sites. The other cluster would represent the semi-polluted sites. The cluster analysis results give further indication for identifying the metal polluted sites since the outcomes were almost similar to the PCA loading plots (Figure 3; Table 7). Generally, most of the pollutant sources in the polluted areas were from the manufacturing industries, agriculture and animal husbandry, agro-based industries and urbanization activities (Yap et al. 2002). But through PCA analyses, the main variations were due to Pb and Ni and this could be caused by the anthropogenic discharge
TABLE 6. Extraction values of the total variance using Principal Component Analysis for sampling sites, based on six dissolved trace metals
Component
Extraction Sums of Squared Loadings Rotation Sums of Squared LoadingsTotal % of Variance Cumulative % Total % of Variance Cumulative %
1 17.820 89.098 89.098 10.682 53.409 53.4092 1.994 9.968 99.066 9.131 45.656 99.066
Note: Only the first three components are shown since their eigenvalues are > 1.0
TABLE 7. Rotated component matrix for sampling sites, based on six dissolved trace metals
Rotated Component Matrix a.
Sites Component1 2
Malacca3PontianBMuarTKup1TampokMalacca1MersingPLidoMBekuPJawaKPontianSenibongKukup1KPP2TKup2Malacca2KPP1NenasiKukup2Danga
0.9810.9400.9360.9110.8920.8850.8630.8260.7940.7660.7630.7320.1740.3270.4280.4450.4860.5210.5470.680
0.1870.3370.3480.4080.4400.4650.4690.5580.6010.6410.6410.6690.9810.9440.9020.8930.8680.8460.8350.703
Extraction Method: Principal Component AnalysisRotation Method: Varimax with Kaiser Normalizationa. Rotation converged in 3 iterations

1063
due to the rapid industrialization especially by metal related industries and the use of leaded gasoline (Aziz et al. 2008). For these reasons, controlling the sources of Pb and Ni will greatly help to conserve the aquatic ecosystem as well as the health of living organisms because both of these metals are highly toxic and their excessive quantities will interfere with the many beneficial uses of water.
CONCLUSION
PCA analyses give us an idea about the contamination by trace metals and the physical parameters related to the water pollution status. The dissolved trace metals are influenced by the physical parameters and are correlated to mineral-related parameters. The multivariate analyses also suggest the use of dissolved trace metals and mineral-related parameters as important water quality parameters. Since trace metals will accumulate in living organisms and cause acute effects, thus adding them as water quality parameters is reasonable especially for Pb and Ni based on PCA. Therefore, the few places with high loadings of Pb and Ni associated with unfavorable levels of physical parameters such as KPP1 and KPP2, Kukup1, Kukup2, Malacca1, Malacca2 and TKup2 need more attention for effective pollution control measures.
ACKNOWLEDGEMENTS
The authors wish to acknowledge the financial support provided through the Research University Grant Scheme (RUGS), [Vote no.: 91986], by Universiti Putra Malaysia.
REFERENCES
Arthur, Kney, & Brandes, D. 2007. A graphical screening method for assessing stream water quality using specific conductivity and alkalinity data. Journal of Environmental Management 82(4): 519-528.
Aziz, H.A., Adlan, M.N. & Ariffin, K.S. 2008. Heavy metals (Cd, Pb, Zn, Ni, Cu and Cr(III)) removal from water in Malaysia: Post treatment by high quality limestone. Bioresource Technology 99(6): 1578-1583.
Azrina, M.Z., Yap, C.K., Rahim Ismail, A., Ismail, A. & Tan, S.G. 2006. Anthropogenic impacts on the distribution and biodiversity of benthic macroinvertebrates and water quality of the Langat River, Peninsular Malaysia. Ecotoxicology and Environmental Safety 64(3): 337-347.
Bengraine, K. & Marhaba, T.F. 2003. Using principal component analysis to monitor spatial and temporal changes in water quality. Journal of Hazardous Materials 100(1-3): 179-195.
Best, M. A., Wither, A.W. & Coates, S. 2007. Dissolved oxygen as a physico-chemical supporting element in the Water Framework Directive. Marine Pollution Bulletin 55(1-6): 53-64.
Connell, D.W. 1981. Water Pollution (2nd edition). Queensland: University of Queensland Press.
DOE (Department of Environment Malaysia) 2008. Malaysia Environmental Quality Report 2007. Petaling Jaya: Department of Environment, Ministry of Natural Resources and Environment, Malaysia.
Florence, T.M. 1977. Trace metal species in fresh waters. Water Research 11(8): 681-687.
Freeze, R.A. & Cherry, J.A. 1979. Groundwater, Englewood Cliffs, NJ: Prentice-Hall.
Kamal, D., Khan, A.N., Rahman, M.A. & Ahamed, F. 2007. Study on the physico chemical properties of water of Mouri River, Khulna, Bangladesh. Pakistan Journal of Biological Sciences 10(5): 710-717.
Kuppusamy, M.R. & Giridhar, V.V. 2006. Factor analysis of water quality characteristics including trace metal speciation in the coastal environmental system of Chennai Ennore. Environment International 32(2): 174-179.
Lawler, D.M. 2004. Turbidimetry and nephelometry. In: Townshend, A. (Ed.) Encyclopedia of Analytical Science, 2nd edition. London: Academic Press (pp. 343-351).
Radwan, M.A. & Salama, A.K. 2006. Market basket survey for some heavy metals in Egyptian fruits and vegetables. Food and Chemical Toxicology 44(8): 1273-1278.
Nicolau R., Galera-Cunha, A. & Lucas, Y. 2006. Transfer of nutrients and labile metals from the continent to the sea by a small Mediterranean river. Chemosphere 63(3): 469-476.
Olias, M., Cero´n, J.C., Moral, F. & Ruiz, F. 2006. Water quality of the Guadiamar River after the Aznalco´ llar spill (SW Spain). Chemosphere 62(3): 213-225.
Ouyang Y., Nkedi-Kizza, P., Wu, Q. T., Shinde, D. & Huang, C.H. 2006. Assessment of seasonal variations in surface water quality. Water Research 40(20): 3800-3810.
Melidis, P., Akratos, C.S., Tsihrintzis, V.A. & Trikilidou, E. 2007. Characterization of rain and roof drainage water quality in Xanthi, Greece. Environmental Monitoring Assessment 127(1-3): 15-27.
Peters, N.E. 1984. Evaluation of environmental factors affecting yields of major dissolved ions of streams in the United States. USGS Water-Supply Paper 2228.
Preda, M. & Cox, M.E. 2000. Sediment–water interaction, acidity and other water quality parameters in a subtropical setting, Pimpama River, southeast Queensland. Environmental Geology 39(3-4): 319-329.
Turkdogan M.K., Kilicel, F., Kara, K., Tuncer, I. & Uygan, I. 2002. Heavy metals in soil, vegetables and fruits in the endemic upper gastrointestinal cancer region of Turkey. Environmental Toxicology and Pharmacology 13(3): 175-179.
Voutsa, D., Manoli, E., Samara, C., Sofoniou, M. & Stratis, I. 2001. A study of surface water quality in Macedonia, Greece: speciation of nitrogen and phosphorus. Water, Air and Soil Pollution 129(14): 13-32.
Weiss, R.F. 1970. The solubility of nitrogen, oxygen and. argon in water and seawater. Deep Sea Research and Oceanographic Abstracts 17(4): 721-735.
Yap, C K., Choh, M.S., Edward, B.F., Ismail, A. & Tan, S.G. 2006. Comparison of heavy metal concentrations in surface sediment of Tanjung Piai wetland with other sites receiving anthropogenic inputs along the south western coast of Peninsular Malaysia. Wetland Science 4(1): 48-57.
Yap C.K., Ismail, A., Tan, S.G. & Omar, H. 2002. Concentration of Cu and Pb in the offshore and intertidal sediments of the west coast of Peninsular Malaysia. Environmental International 28(6): 467-479.
Yap C.K., Ismail A., Tan S.G. & Ismail, A.R. 2004. The Impact of Anthropogenic Activities on Heavy Metals (Cd, Cu, Pb and Zn) Pollution: Comparison of the Metals Levels in the Green-Lipped Mussel Perna viridis (Linnaeus) and in the Sediment from a high Activity Site at Kg. Pasir Puteh and

1064
a Relatively Low Acvity Site at Pasir Panjang. Pertanika Journal of Tropical Agricultural Science 27(1): 73-78.
Yap, C.K., Fairuz, M.S., Yeow, K.L., Hatta, M.Y., Ismail, A., Ismail, A.R. & Tan, S.G. 2009. Dissolved Heavy Metals and Water Quality in the Surface Waters of Rivers and Drainages of the West Peninsular Malaysia. Asian Journal of Water, Environment and Pollution 6(3): 51-59.
Yap, C.K., Ismail, A., Misri, K. & Tan, S.G. 2005. Nitrate concentration in the surface seawater of the Strait of Malacca. Asian Journal of Water, Environment and Pollution 2(2): 45-49.
Yap, C.K., Ismail, A. & Tan, S.G. 2003. Cd and Zn in the straits of Malacca and intertidal sediments of the west coast of Peninsular Malaysia. Marine Pollution Bulletin 46(10): 1348-1353.
Zar, J.H. 1996. Biostatistical Analysis. 3rd ed. NJ, USA: Prentice-Hall.
C.K. Yap*, M.W. Chee, S. Shamarina, F.B. Edward &W. ChewDepartment of Biology Faculty of ScienceUniversiti Putra Malaysia43400 Serdang, Selangor D.E.Malaysia
S.G. TanDepartment of Cell and Molecular Biology Faculty of Biotechnology and BiomolecularUniversiti Putra Malaysia43400 Serdang, Selangor D.E.Malaysia
*Corresponding author: email: [email protected]
Received: 7 July 2010Accepted: 29 November 2011