assessment of the economic impact of climate change on...
TRANSCRIPT

MARGAREE Consultants
145 King Street West, Suite 1000, Toronto, Canada M5H 3X6 Tel: 416 369 0900, Fax: 416 369 0922, E-mail: [email protected]
Assessment of the Economic Impact of Climate Change on CARICOM Countries
Prepared for:
Walter Vergara Environment and Socially Sustainable Development – Latin America and Caribbean
World Bank
Prepared by:
Erik Haites Margaree Consultants Inc.
in association with
Dennis Pantin Marlene Attzs
Sustainable Economic Development Unit Department of Economics
University of the West Indies.
James Bruce Jamie MacKinnon
Global Change Strategies International
July 2002

MARGAREE Consultants
Acknowledgements
The authors would like to thank Alejandro Deeb, John Dixon, Paulo L. Ortiz Bulto, Joel Smith, Walter Vergara, Jan Vermeiren and Ulrich Wagner for their help in providing information and comments on earlier drafts. The authors are solely responsible for the content of the report.
This report was funded by The World Bank. The authors are solely responsible for the content of the report. The report may be published as a World Bank Technical Paper.

MARGAREE Consultants
i
Table of Contents Executive Summary ........................................................................................................... iii 1. Introduction.....................................................................................................................1 1.1 Purpose...............................................................................................................1 1.2 Background........................................................................................................1 1.3 Methodology......................................................................................................3 2. Climate Scenarios ...........................................................................................................5 2.1 Observed trends .................................................................................................5 2.2 Model projections ..............................................................................................5 2.3 Climate scenarios ...............................................................................................6 2.3.1 Temperature and precipitation ............................................................6 2.3.2 Sea level rise .......................................................................................8 2.3.3 Extreme events....................................................................................9 3. Potential Economic Impacts of Climate Change ..........................................................12 3.1 Marine ecosystems...........................................................................................12 3.1.1 Coral reefs.........................................................................................12 3.1.2 Mangrove communities ....................................................................12 3.2 Terrestrial ecosystems......................................................................................13 3.3 Hydrology and water resources .......................................................................14 3.4 Agriculture .......................................................................................................14 3.5 Fisheries ...........................................................................................................15 3.6 Coastal infrastructure and settlement...............................................................15 3.7 Tourism............................................................................................................15 3.8 Human health ...................................................................................................16 3.9 Summary ..........................................................................................................17 4. Economic Impacts of Climate Change on CARICOM Countries ................................20 4.1 Hurricanes and tropical storms ........................................................................21 4.1.1 Hurricane damage to housing and infrastructure ..............................23 4.1.2 Hurricane damage to tourism............................................................24 4.1.3 Hurricane damage to agriculture and fisheries .................................24 4.1.4 Impact of climate change on damage due to tropical storms and hurricanes ............................................................................................25 4.2 Tourism............................................................................................................26 4.2.1 Tourism demand ...............................................................................26 4.2.2 Loss of facilities due to sea level rise ...............................................27 4.2.3 Loss of beaches and ecosystems .......................................................28 4.3 Infrastructure....................................................................................................30 4.3.1 Loss of land.......................................................................................30 4.3.2 Loss of housing and infrastructure due to sea level rise ...................31 4.3.3 Flood damage....................................................................................33

MARGAREE Consultants
ii
4.3.4 Reduced availability of potable water...............................................33 4.4 Agriculture .......................................................................................................35 4.4.1 Climate change and world agriculture ..............................................35 4.4.2 Loss of agricultural output ................................................................36 4.4.3 Flood damage to agricultural output .................................................37 4.5 Fisheries ...........................................................................................................38 4.6 Public health.....................................................................................................39 4.6.1 Health impacts of climate change .....................................................39 4.6.2 Health impacts of hurricanes and tropical storms.............................41 4.7 Historic and ecological resources ....................................................................41 4.8 Summary ..........................................................................................................43 5. Potential Adaptation Measures .....................................................................................49 5.1 Coastal protection ............................................................................................49 5.2 Reduction of hurricane damage .......................................................................50 5.3 Replacing reduced freshwater supplies............................................................51 5.4 Adaptive measures for flooding from heavy rainfall .......................................52 5.5 Adaptation in agriculture and fisheries ............................................................52 5.6 Restoration of ecosystems................................................................................53 5.7 Conclusions......................................................................................................53 References..........................................................................................................................54 Appendix A: Statistical Data .............................................................................................58

MARGAREE Consultants
iii
Executive Summary The purpose of this report is to assess the potential economic impact of climate change on the CARICOM countries -- Antigua & Barbuda, Bahamas, Barbados, Belize, Dominica, Grenada, Guyana, Jamaica, St. Kitts, St. Lucia, St. Vincent and the Grenadines, Trinidad & Tobago. It develops estimates of potential economic impacts due to climate change in the absence of adaptation actions. The study had a very tight schedule and limited budget and so was limited to economic impacts that could be estimated from readily available existing studies. No original research or data collection was undertaken. To be meaningful an estimate of the potential economic impact of climate change must relate to a specific climate change scenario. However, future changes to the climate in the Caribbean are uncertain. To address this uncertainty, two climate change scenarios -- a “low case” and a “high case” -- are specified. Climate change has numerous consequences that can have economic impacts. The potential economic impacts due to climate change are summarized in Chapter 3. Despite an extensive search, we found no estimates of the economic impacts of climate change for any sector or country in the region. We did find many useful pieces of information, such as estimates of losses due to specific hurricanes and estimates of land loss due to sea level rise in a specific country. The available information has been used to prepare rough estimates of the economic impacts of climate change in CARICOM countries in the absence of adaptation actions. The available data are sketchy so “low” and “high” values are used for most variables. The values are combined with the climate change scenarios to yield “low” and “high” estimates of the potential economic impacts due to climate change. Values for some categories of climate change impacts, such as the loss of agricultural and fisheries output and loss of some historical resources, could not be calculated. The climate change impacts are expressed as impacts on the current (2000) economy even though the climate change will occur gradually over 50 to 80 years. This is standard practice in the literature. The potential economic impact of climate change on the CARICOM countries is estimated at between 1999 US$1.4 to $9.0 billion for the impacts that could be estimated assuming no adaptation to climate change. The wide range for the estimate of potential economic impacts is due more to the uncertainty relating to the values and assumptions used than to the uncertainty about climate change. The estimate is based on limited data and numerous assumptions and hence is only a very rough initial estimate of the potential economic impact due to climate change. This estimate of the potential economic impact of climate change should be used with great care because it does not reflect possible adaptation to climate change and because of the uncertainty in the data and assumptions. Those cautions apply with even greater force to the estimates for specific categories of impacts and for individual countries. Estimates are often based on data for a single country, which may not be correct for other countries.

MARGAREE Consultants
iv
In the low scenario the total impact averages about 5.6% of GDP (ranging between 3.5% in Trinidad and Tobago and 16% in Guyana). In the high scenario the total impact averages over 34% of GDP (ranging between 22% in Trinidad and Tobago and 103% in Guyana). The relatively low impact in Trinidad and Tobago is due to its limited vulnerability to hurricanes and the relatively small size of its tourist industry. The relatively high impact in Guyana appears to be at least partly due to its relatively low per capita GDP. The largest category of impacts is the loss of land, tourism infrastructure, housing, other buildings and infrastructure due to sea level rise. Those losses represent 65% to 75% of the total economic impacts. Most of the remaining impacts are due to reduced tourism demand due to rising temperatures and loss of beaches, coral reefs and other ecosystems. Those impacts represent 15% to 20% of the total impacts estimated. Property damage due to the increased intensity of hurricanes and tropical storms accounts for 7% to 11% of the estimated impacts. The increased intensity of hurricanes and tropical storms may also lead to more injuries and deaths. The impacts that could not be estimated and the relative size of the impacts estimated suggest where efforts can be focused to improve the quality of the estimates. The impacts on agriculture are potentially significant for CARICOM countries. Since the main crops are exported, analysis of the impacts on agriculture requires the use of a global model. Country-specific information on the land and infrastructure vulnerable to different degrees of sea level rise would yield much better estimates of the potential losses due to sea-level rise, which dominate the estimated impacts. The estimates are useful as a starting point for an identification and assessment of potential adaptation measures. Adaptation measures may be planned; designing buildings to withstand stronger hurricanes, for example. Or adaptation may be unplanned; reconstructing buildings and infrastructure lost due to sea level rise. The CPACC project has been assisting each participating Caribbean country with the formulation of a National Climate Change Adaptation Policy and Implementation Plan. The Mainstreaming Adaptation to Climate Change (MACC) project would help Caribbean countries formulate and mainstream measures to adapt to anticipated impacts of climate change. Adaptation to climate change is possible, indeed unavoidable, in many cases. Adaptation measures, whether planned or unplanned, have costs. In principle, adaptation measures should be implemented where they cost less than the damage reduced. Coastal protection, for example, may be cost-effective for low-lying settlements but not for vacant land. Planning may also reduce adaptation costs; locating new buildings and infrastructure outside low-lying coastal areas can reduce the cost of adapting to sea level rise. It must be stressed that the above estimates, with one minor exception, assume no adaptation measures are implemented. The economic cost of climate change will be the cost of the adaptation measures implemented plus the value of the residual damage. The available information is not sufficient to support estimates of the cost-effective use of various adaptation measures and hence of the total cost of adaptation and the residual damages.

MARGAREE Consultants
v
The opportunities to adapt to climate change and the potential to reduce climate change damage vary by country. It is clear that adaptation will cost less than the potential damages for at least some of the impacts of climate change in all countries. Thus, the economic cost should be substantially lower than the high estimate of the potential economic impact in the absence of adaptation actions.

MARGAREE Consultants
1
1. INTRODUCTION 1.1 Purpose The World Bank is preparing a project (Mainstreaming Adaptation to Climate Change, MACC) that would help countries in the Caribbean formulate and mainstream measures to adapt to anticipated impacts of climate change. This report is an input to the preparation of that project. The purpose of this report is to assess the potential economic impact of climate change on the CARICOM countries. It develops estimates of potential economic impacts due to climate change in the absence of adaptation actions. The study had a very tight schedule and limited budget and so was limited to economic impacts that could be estimated from readily available existing studies. No original research or data collection was undertaken. Given the uncertainty of climate change, high and low climate change scenarios are specified. The information available from existing studies is adjusted to reflect these climate scenarios. The data and assumptions used to estimate the potential economic impacts of climate change are also uncertain. Again the uncertainty is addressed through the use of values that yield low and high estimates of potential impacts. The resulting low and high estimates span a very wide range; an indication of the very approximate nature of the estimates. The economic cost of climate change to CARICOM countries will be the cost of the adaptation measures implemented plus the value of the residual damages. Very little information on the costs of adaptation measures is available. The information is not sufficient to support estimates of the cost-effective use of various adaptation measures and hence of the total cost of adaptation and the residual damages. But the economic cost should be substantially lower than the high estimate of the potential economic impacts of climate change in the absence of adaptation actions. The report develops estimates of potential climate change impacts for each of the CARICOM countries -- Antigua & Barbuda, Bahamas, Barbados, Belize, Dominica, Grenada, Guyana, Jamaica, St. Kitts, St. Lucia, St. Vincent and the Grenadines, Trinidad & Tobago. The cautions relating to the very uncertain nature of the estimates apply with even greater force at the country level. 1.2 Background The Intergovernmental Panel on Climate Change (IPCC) concludes that emissions of greenhouse gases and aerosols due to human activities continue to alter the atmosphere in ways that will continue to affect the climate. Greenhouse gases remain in the atmosphere for a long time -- decades to millennia. Human actions to remove greenhouse gases from the atmosphere, such as planting trees, have only limited potential to reduce the atmospheric stock of these gases. So continued climate change is inevitable; only the magnitude of the change is in doubt.

MARGAREE Consultants
2
Climate change depends mainly upon the stock (concentration) of greenhouse gases in the atmosphere. Due to the long atmospheric life of the gases and the limited ability to remove them from the atmosphere, climate change persists for a long time and is effectively irreversible. Lags inherent in the climate system mean that changes may not occur until decades after the emissions occur and may persist long after concentrations stabilize. Sea level, for example, is expected to continue to rise for 1,500 years after concentrations are stabilized. Climate change involves a variety of changes including higher surface temperatures, changes to the hydrological cycle including more frequent heavy rains and less total precipitation in some regions, more intense and perhaps more frequent tropical storms, and more “El Niño-like” conditions. The warmer temperatures lead to thermal expansion of ocean waters and melting of glaciers and ice on land, which causes the sea level to rise. Higher sea levels and more intense tropical storms cause higher storm surges. These changes are beginning to lead to damage to natural ecosystems and man-made infrastructure. Beaches, mangrove stands, wetlands and other coastal lands will be lost to rising sea levels and higher storm surges. Coral reefs may be lost due to higher water temperatures. Fresh water supplies may be reduced, or increased, by long-term changes in rainfall patterns and evaporation. There is a risk of damage to buildings, roads, sewer and water systems, port facilities, and other infrastructure due to rising sea levels, higher storm surges, and more intense tropical storms. Damage due to flooding in heavy rains could also rise. In many cases, the impacts rise exponentially; a 10% increase in the intensity of a severe hurricane raises the property damage by about 75%.1 Caribbean countries will be disproportionately affected by climate change. The Intergovernmental Panel on Climate Change concludes that the adverse impacts of climate change are expected to fall on developing countries and that small island states are at particular risk of severe social and economic effects from sea-level rise and storm surges.2 The CARICOM countries are responsible for 0.16% of global CO2 emissions. Climate change in the Caribbean effectively depends upon greenhouse gas emissions by the rest of the world. Estimates of the CARICOM share of global climate change damages are not available. But estimates of damages due to climate change are generally higher for developing than developed countries. Most of the CARICOM countries are small islands, so coastal areas represent a relatively large share of the total area. Much of the infrastructure is also located along the coast. Consequently coastal areas will need to be protected or risk significant damage to infrastructure. Caribbean countries are also relatively more vulnerable to increased hurricane damage than richer, temperate countries. Tourism, which depends on the region's attractive climate and amenities, is a large sector of the economy in many of the Caribbean countries. Agriculture is another significant, climate-sensitive sector of the economy of many Caribbean countries. As a result a large share of the economy of most Caribbean countries is vulnerable to climate change.
1 See Table 2.5. 2 Houghton, et al., 2001, p. 12.

MARGAREE Consultants
3
The economic impact of to climate change is likely to be larger, in relative terms, than in many richer countries. Since global emissions and atmospheric concentrations are still rising, Caribbean countries will need to adapt and implement measures that minimize the impacts. Regardless of the measures to adapt and minimize the adverse impacts, some damage due to climate change will occur. 1.3 Methodology To assess the potential impact of climate change on CARICOM countries in the absence of adaptation actions we: • Specified low and high climate change scenarios based on the literature • Identified potential impacts of climate change in the Caribbean • Developed estimates of the potential economic impacts of climate change on CARICOM
countries assuming no adaptation measures are implemented • Collected available estimates of the costs of adaptation to climate change These steps are discussed below. Available information on the impacts of climate change is based on different projections of the climate change assumed. To be meaningful an estimate of the potential economic impact of climate change must relate to a specific climate change scenario. However, future changes to the climate in the Caribbean are uncertain. To address this uncertainty, two climate change scenarios -- a “low case” and a “high case” -- are specified. The climate change scenarios are presented in Chapter 2. Climate change has numerous consequences that can have economic impacts. Climate change leads to higher temperatures and specific humidity, higher sea surface temperature, changes to the hydrological cycle, sea level rise, and increased intensity of extreme weather events. These changes, in turn, affect the region's resource base. Higher sea surface temperatures cause coral bleaching and changes to fish stocks. Rising sea levels lead to coastal erosion, possible loss of infrastructure, salt water intrusion into fresh water supplies. These effects have economic consequences such as reduced value of dive tourism, changes to the value of fish landings, loss of coastal lands, reduced value of coastal infrastructure such as port facilities, and changes to fresh water supplies. The potential economic impacts due to climate change are summarized in Chapter 3. Despite an extensive search, we found no estimates of the economic impacts of climate change for any sector or country in the region. We did find many useful pieces of information, such as estimates of losses due to specific hurricanes and estimates of land loss due to sea level rise in a specific country. That information has been used to prepare rough estimates of the economic impacts of climate change in CARICOM countries in the absence of adaptation actions. The available data are sketchy and numerous assumptions are required to develop the estimates of potential economic impacts. Consequently, the results must be considered very rough initial estimates of potential economic impacts in the absence of adaptation actions.

MARGAREE Consultants
4
The data and assumptions used to prepare the estimates of potential economic impacts are described in Chapter 4. The economic impacts are expressed as impacts on the current (2000) economy even though the climate change will not reach its full potential for some decades. This is standard practice in the literature. The uncertainty in the data and assumptions is addressed through the use of values that yield low and high estimates of potential impacts. The values that yield low estimates are combined with the low climate change scenario and those that yield high estimates are combined with the high climate change scenario. The resulting low and high values span a very wide range; an indication of the very approximate nature of the estimates. Options for adaptation to climate change, estimates of the costs of the adaptation measures, and estimates of the avoided damages, where available, are presented in Chapter 5. The available information on the costs of adaptation measures is even more limited than that relating to potential economic impacts. The available information is not sufficient to support estimates of the cost-effective use of various adaptation measures and hence of the total cost of adaptation and the residual damages. The ultimate economic cost of climate change to CARICOM countries will be the cost of the adaptation measures implemented plus the value of the residual damage. This should be substantially lower than the high estimate of the potential economic impact in the absence of adaptation actions as estimated in Chapter 4. The estimates in Chapter 4 are useful as a starting point for an identification and assessment of potential adaptation measures.

MARGAREE Consultants
5
2. Climate Scenarios 2.1 Observed Trends Although there is much climatic variation between localities, some factors and characteristics are common to most small islands -- mainly as a result of their insular nature and tropical location. For instance, it is generally true that: • The ocean exerts a strong influence on the climate of islands. • Temperatures now are usually high, with mean annual values of 20oC and above. • Diurnal and seasonal variations in temperature are low, with ranges around 5oC and less. • Small island Caribbean states are strongly affected by tropical storms and hurricanes. Average annual temperatures have increased by at least 0.5oC over the period 1900-1995 and in some Caribbean countries by 1oC or more. Seasonal temperature data are consistent with the higher average temperatures. Rainfall data for the same period show much greater seasonal, interannual, and decadal-scale variability, although a declining trend in average annual rainfall -- on the order of 250 mm in some locations -- is evident.3 Annual rainfall varies considerably across the CARICOM countries from 750 to 1400 mm in Grenada to 1270 to 7620 in Dominica. High interannual and subdecadal variations of tropical storms are evident (See Section 2.3). 2.2 Model Projections Most small islands are too small to be identified with a grid point in global climate models. This limits the ability to generate future projections of climate change for individual small islands. However, some projected effects are regionally robust. Surface air temperatures can be expected to rise in the future. Because oceans are expected to warm in the future, albeit at a slower rate than land masses, small island states are also expected to experience moderate warming.4 Models do not all agree on the future changes to annual precipitation in the Caribbean, although most show drying conditions. Recent records show trends towards increasing precipitation in the northern Caribbean, e.g. northern Bahamian Islands and less in the southern Bahamas and in most countries as far south as Suriname. Evaporation generally rises with temperature, but also depends on other factors including vapour pressure, so evaporation rates will vary spatially and temporally within the region, but less so than rainfall. Several models project an increase in precipitation intensity and flash flooding for latitudes within which many small island states are located. Increases in droughts also has been projected (See Section 2.3).5 3 Nurse, et al., 1998, p. 339. 4 Nurse, et al., 1998, p. 340. 5 Nurse, et al., 1998, p. 341.

MARGAREE Consultants
6
Sea level rise varies with factors such as the rate of warming, the efficiency of ocean circulation, and local atmospheric effects, and currents, and hence is not uniform (See Section 2.3). 2.3 Climate Scenarios As noted, scenarios of future climate are based mainly on the output of atmospheric – ocean General Climate Models (or Global Circulation Models) AOGCM’s. These use mathematical descriptions of atmospheric and oceanic motions, energy fluxes and water fluxes to simulate past, present and future climates. Past and present climates are used to validate the models. Future climate is driven primarily by forcing due to greenhouse gases and aerosols, which tend to counteract the greenhouse effect. These human-induced influences now outweigh natural factors that affect global climate such as changes in solar radiation or volcanic emissions. The greenhouse gas and aerosol forcing is estimated by means of scenarios of future emissions. These can have a very wide range depending on the future evolution of world populations, economies, energy use, the sources of energy used, and extent of deforestation or afforestation. Our present (2002) atmosphere has about 30% more CO2 (the most abundant of the greenhouse gases) than in pre-industrial times. IPCC’s range of emission estimates suggest that CO2 concentrations could be as much as triple pre-industrial by 2100 or could be less than double pre-industrial concentrations by 2100. The outcome depends primarily on the rate of growth of economies and of fossil fuel use and the vigour of measures to reduce the latter. This creates the greatest uncertainty in projections of future climate. However, most climate model analyses have used simply a projection of greenhouse gas and aerosol forcing that increases at approximately the same rate as during the past decade. This also results in a range of outcomes because of the differences between models. Most of the available literature is based on such climate model analyses, and the following range of outcomes generally reflects these model differences, except as specifically noted. In cases where recent trends are consistent with projections, more confidence can be placed in the model outputs so some recent trends are cited. However where results are available using a broader range of future emission scenarios (the IPCC-SRES scenarios) these have been used (e.g. for sea level rise), and so reflect uncertainties in both future emissions and in the models. To address the uncertainty associated with future climate change, two climate change scenarios -- a ‘low case’ and a ‘high case’ scenario -- are specified. These two scenarios are estimates of the range of potential economic impacts due to climate change to 2050 and 2080. These scenarios are based on the third assessment report of the IPCC, Climate Change 2001. In particular, the increase in tropical cyclone (hurricane) peak wind and peak rainfall intensity are considered to be “likely” (65-90% confidence) by IPCC this century. 2.3.1 Temperature and Precipitation Temperature increases by season for the two scenarios are shown in Table 2.1. The temperature increase for the low scenario is 2oC and for the high scenario is 3.3oC. Night time temperatures
MARGAREE Consultants
7
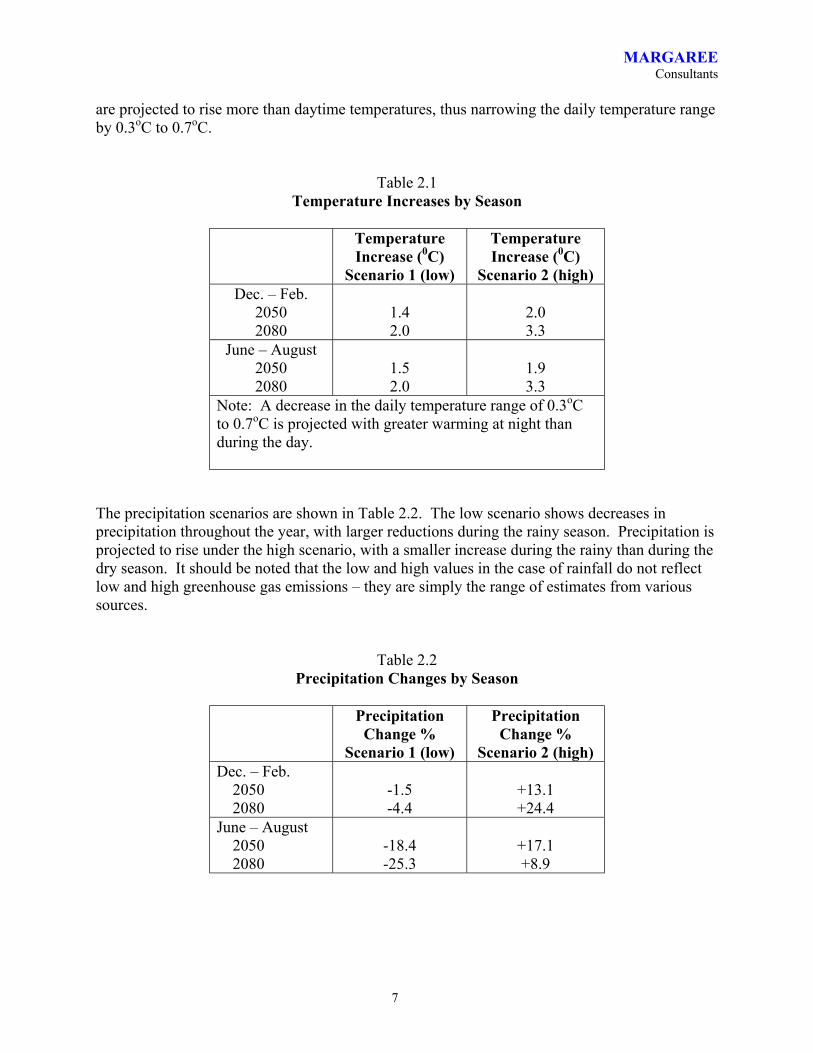
are projected to rise more than daytime temperatures, thus narrowing the daily temperature range by 0.3oC to 0.7oC.
Table 2.1 Temperature Increases by Season
Temperature Increase (0C)
Scenario 1 (low)
Temperature Increase (0C)
Scenario 2 (high) Dec. – Feb.
2050 2080
1.4 2.0
2.0 3.3
June – August 2050 2080
1.5 2.0
1.9 3.3
Note: A decrease in the daily temperature range of 0.3oC to 0.7oC is projected with greater warming at night than during the day.
The precipitation scenarios are shown in Table 2.2. The low scenario shows decreases in precipitation throughout the year, with larger reductions during the rainy season. Precipitation is projected to rise under the high scenario, with a smaller increase during the rainy than during the dry season. It should be noted that the low and high values in the case of rainfall do not reflect low and high greenhouse gas emissions – they are simply the range of estimates from various sources.
Table 2.2 Precipitation Changes by Season
Precipitation
Change % Scenario 1 (low)
Precipitation Change %
Scenario 2 (high) Dec. – Feb. 2050 2080
-1.5 -4.4
+13.1 +24.4
June – August 2050 2080
-18.4 -25.3
+17.1 +8.9

MARGAREE Consultants
8
The variation among model outputs for precipitation as reflected in Table 2.2 is very high. The median values for the scenarios suggest: • less rain in the rainy season (-6.9% for 2050 and -8.2% for 2080), and • more rain in the dry season (+5.9% for 2050 and +8.2% for 2080). Three points tend to reinforce the likelihood of reduced precipitation, in the rainy season at least: • In general, the Caribbean receives less rain in El Niño years and IPCC suggests that
future climate may be more “El Niño-like”. • Trends in rainfall over the past few decades have been mostly downward in the
Caribbean except for the northern islands of the Bahamas. • Increased evaporation losses with higher temperatures will tend to overcome
small increases in rainfall, with a net negative moisture balance especially in the rainy season.
2.3.2 Sea Level Rise Climate change causes sea levels to rise due to thermal expansion of ocean waters and melting of glaciers and ice on land. The range of mean sea level rise for the period 1990 to 2100 as estimated by five models is 0.18 to 0.77 metres. For the full range of economic and energy development in IPCC’s emission scenarios (SRES scenarios), mean sea level rise of 0.16 to 0.87 metres is anticipated by 2100. The mean sea level rise for earlier periods is shown in Table 2.3.
Table 2.3 Mean Sea Level Rise
SRES Mean Sea Level Changes
Scenario 1 (low)
Scenario 2 (high)
2050 2080 eventual
0.08m 0.13m
0.5 m
0.44m 0.70m
2.0m
There is a long lag time from greenhouse gas emissions to sea level rise, so that mean sea level would continue to rise for more than 1500 years. If emissions were held constant after 70 years at twice pre-industrial levels, sea level would eventually rise to between 0.5 and 2.0 metres above present levels.

MARGAREE Consultants
9
To compare to observed sea level rise to date, the longest observed record in the region is from Key West, Florida, where average increases of 0.17 m per decade have been observed since 1850. This is much more rapid than even the highest of the above projections for the Caribbean. The high projections thus seem more compatible with the observations to date. However, this should be tempered with the note that the northern Caribbean mean sea level increase, during the relatively short Topex/Poseidon satellite mission (1993-1998), was substantially greater than for the Southern Caribbean. 2.3.3 Extreme Events
Storm Surges It is not the mean sea level that damages beaches and shorelines and causes major floods, but the extreme high water under storm surges, tides, and waves. Probability analysis shows that for a location about one metre above present mean sea level and a sea level rise of 20 cm, storm surges and tidal flooding which now occur every 10 years on average, would occur twice per year -- a twenty-fold increase. To indicate the potential magnitude of storm surge inundation, model calculations for a category 5 (most severe) hurricane approaching the Bahamas from the east, indicate a “maximum envelope of water” (MEOW) 5.2 m deep moving on shore in the Nassau area. The observed MEOW in the Bahamas from hurricane Andrew (category 4) was 2.4 to 3.0 m.6
Tropical Storms and Hurricanes Will tropical storms and hurricanes become more frequent or severe in a changing climate? The historical record indicates that the: • Number of hurricanes plus tropical storms (that did not reach hurricane intensity) in Atlantic-
Caribbean basin has increased from 7 to 10 per year since 1886.7 • Number of hurricanes alone shows no long-term trend, but annual numbers are affected by
the state of ENSO (fewer during El Niño and more during La Nina conditions), so a more “El Niño-like” climate would mean fewer hurricanes and less precipitation.
• Number of hurricanes reached the unprecedented number of 4 during 1999. The climate change scenarios are presented in Table 2.4. The trend in the number of tropical storms and hurricanes is uncertain, so the number remains at 10 per year for both scenarios. The number of severe hurricanes (category 4 and 5 storms) is assumed to be 2 in the low case and to
6 Rolle, The Bahamas Meteorological Service, personal communication. 7 Martin and Weech, 2001.

MARGAREE Consultants
10
equal the 1999 level of 4 in the high case. The intensity (maximum wind speed) of the strongest hurricanes is projected to rise by 5% in the low scenario and by 15% in the high scenario.8
Table 2.4 Tropical Storms and Hurricanes
Scenario 1
(low) Scenario 2
(high) Number of tropical storms and hurricanes per year, 2050 and 2080
10
10
Number of severe hurricanes per year, 2050 and 2080
2
4
Increased wind speed of the strongest hurricanes, 2050 and 2080
5%
15%
Table 2.5 provides an estimate of the increase in insured losses with changes in hurricane intensity (maximum wind speed) for the United States. The losses increase exponentially -- a 5% increase in maximum wind increases damages by approximately 35% and a 15% increase in maximum wind speed increases damages by roughly 135%.
Table 2.5 Loss Potential in Future Hurricanes
Estimated 1990 Insured Losses
if Maximum Wind Speed Increases by
Storm
Class
Year
Estimated 1990
Insured Losses (000’s)
5%
10%
15%
Hugo
4
1989
$3,658,887
$4,902,705 34%
$6,514,172 78%
$8,542,428 133%
Alicia
3
1983
$2,435,589
$3,382,775 39%
$4,312,884 77%
$5,685,853 133%
Camille
5
1969
$3,086,201
$4,120,733 34%
$5,438,332 76%
$7,095,008 130%
Source: Clark, 1997.
8 Houghton, et al., 2001.

MARGAREE Consultants
11
Heavy Rains Despite a decline in total rainfall, there has been an increase in rain intensity on rain days in Guyana, Suriname and some islands. Such heavy rains are due to tropical waves and upper level troughs in the inter-tropical convergence zone and cause local flooding. There were 46 cases of such events between 1955 and 2000 (46 years) in Barbados, most of which caused floods and a few of which caused wind damage. Further increases in rain intensities are projected with one-day average rains increasing on average 0.5 mm (low) to 1.0 mm (high). The 20-year return period heavy one-day rainfalls over the Caribbean are approximately 80 mm/day on average (1973-93). These are expected to increase by an average over the region of 15 mm/day (20%) by 2050 and 35 mm/day (40%) by 2090. These estimates are used as the low scenario in Table 2.6. No other literature is available as the basis for the high scenario.9
Table 2.6 Heavy Rains
Scenario 1
(low) Scenario 2
(high) One day average rainfall, 2050 and 2080
+0.5 mm
+1.0 mm
20 year return period one-day rainfall 2050 2080
95mm 110 mm
The number of flooding events from short duration intense rainfalls and the amount of flooding per event are thus projected to increase, even though total rainy season rainfall is likely to continue to decline.
9 Zwiers and Kharin, 1998 and Kharin and Zwiers, 2000.

MARGAREE Consultants
12
3. Potential Economic Impacts of Climate Change This chapter summarizes the anticipated impacts of climate change on island ecosystems and socioeconomic sectors to identify the potential economic impacts.10 3.1 Marine Ecosystems 3.1.1 Coral Reefs Coral reefs represent one of the most important resources of tropical islands. They are sources of food, particles for beach sand, and building materials; function as natural breakwaters; and play a critical role in the formation and maintenance of reef islands, shores and beaches. They are habitats for a variety of marine communities and they serve as spawning and nursery grounds for numerous species of reef fish. Reefs also function as protective barriers for beaches and coasts by reducing incident wave energy. They also generate significant revenue for many island economies through avenues such as tourism. The climate change effect of greatest potential significance to coral reefs is likely to be an increase in seawater temperature. Corals have narrow temperature tolerances (approximately 25-29oC) and salinity tolerances (about 32-36 ppm). In some islands, some species of corals currently live at or near their threshold of temperature tolerance. Corals respond to the combined effects of irradiance and water temperature elevation by paling in colour, or bleaching. If the temperature elevation is substantial over an extended period (e.g., 3-4oC for over 6 months), significant coral mortality is likely. Projections suggest that the incidence of bleaching will rise rapidly within the next few decades, with the highest rate of increase occurring in the Caribbean. ENSO events already have been associated with extensive coral bleaching in the Caribbean in the 1990s. Human stresses (e.g., nutrient loading and other types of chemical pollution, sedimentation from land-based activities, damage due to anchoring of boats) limit the innate capacities of corals to adapt to climate change. Where reef structures have been weakened by anthropogenic stresses, as in the Caribbean, the ability of reefs to keep pace with sea-level rise is reduced. Rising atmospheric CO2 concentrations may reduce the ability of reef plants and animals to make the limestone skeletons that build the reefs. 3.1.2 Mangrove Communities Mangroves provide important functions as protection against storms, tides, cyclones, and storm surges and serve as more “filters” against the introduction of pests and exotic insects. Sediment flux is important in determining mangrove response to rising sea levels. Most islands in the Caribbean have microtidal, sediment-starved environments, so they are expected to suffer
10 The chapter is based on Nurse, et al., 1998 and Nurse, et al., 2001.

MARGAREE Consultants
13
reductions in the geographical distribution of mangroves. Where the rate of shoreline recession increases, mangrove stands are expected to become compressed and suffer reductions in species diversity. Since they require large amounts of fresh water to reach their full growth potential, mangroves in the Caribbean may be affected more by reduced seasonal precipitation than by higher temperatures and sea levels. 3.2 Terrestrial Ecosystems Some small islands still have substantial forests. The tropical forests on small islands have an important influence on local and regional climates. Forests are of socioeconomic importance as sources of timber, fuel and non-wood products. Forests also provide habitats for wildlife, reservoirs for conservation of biological diversity, reduce soil erosion, and provide a basis for ecotourism. Forests may be affected more by human activity, such as deforestation, than by climate change. Changes in soil water availability (the combined effects of temperature and rainfall) are more important than temperature change alone. Forests are particularly vulnerable to extremes of water availability -- droughts or floods -- and will decline rapidly if conditions move toward one of these extremes. On the other hand, increased CO2 concentrations may enable some forest species to use water and nutrients more efficiently and could even increase productivity – up to the point the CO2 fertilization effect saturates. The biodiversity of islands could be adversely affected by climate change. A wide range of changes might be expected, including alterations in population size, species distribution, species composition, and the geographical extent of habitants and ecosystems, as well as an increase in the rate of species extinction. Small islands are variable in their biodiversity. Some islands are very rich, while low-reef islands tend to have both low biodiversity and low endemism. In general, small islands in absolute figures tend to have high terrestrial diversity and endemism. One of every three known threatened plants is an island endemic. Approximately 23% of bird species found on islands are threatened. This situation is believed to be linked closely to increasing population pressure and habitat alteration. Additional stresses, such as the projected effects of climate change, could further adversely affect island biodiversity. Some species may not be able to tolerate higher temperatures and changes in precipitation (drier or wetter climate). Species higher on the food chain will be directly affected by the change in climate and indirectly affected by changes in their food sources. Establishment of terrestrial, marine, or coastal reserves helps to preserve endangered habitats and ecosystems and maintain biological diversity while increasing the resilience of these systems to cope with climate change.

MARGAREE Consultants
14
3.3 Hydrology and Water Resources Barbados, Antigua and Barbuda, and Grenada are among the driest countries per capita in the world. In the islands of the eastern Caribbean, the annual rainfall regime is characterized by wet and dry seasons. In some countries (e.g., Antigua and Barbuda, Barbados, Grenada), as much as 65% of the annual rainfall may occur during the wet season (June to December). There is growing evidence that hydrological variability might be associated with the occurrence of mega-scale climate anomalies, such as those associated with the ENSO phenomenon. If climate change results in a more “El Niño-like” climate, precipitation is likely to be lower, which could have serious consequences for water supplies and agriculture in many nations. Coral islands and atolls are particularly sensitive to changes in groundwater recharge because almost all of their water supply comes from groundwater sources. In Barbados groundwater recharge is restricted to the three wettest months of the year and only 15-30% of the annual rainfall reaches the aquifer. In The Bahamas and Barbados the freshwater lenses are affected periodically by salinity intrusions caused by overpumping and excess evapotranspiration. Sea-level rise increases the intrusion of saltwater into the freshwater lens. Salinity levels have increased in several coastal aquifers in Trinidad and Tobago due to rapid drawdown exacerbated by sea-level rise. Rivers are the main source of potable water in Dominica and are also harnessed for power generation. Declining flows due to more extended periods of drought have become a matter of serious national concern. Saltwater intrusion up the estuaries of rivers is also augmented by sea level rise. 3.4 Agriculture On many islands agricultural production is already stressed as a consequence of high population densities and growth rates. Few studies have been conducted specifically on the effects of climate change on agriculture in small islands. Climate change could cause heat stress, reduce soil moisture, increase soil temperature, increase evaporation, or change the rainfall patterns in ways that adversely affect agricultural production. Hurricanes, floods and droughts, which may become more intense and/or more frequent with climate change, can also affect crop agriculture adversely. Higher CO2 concentrations may have a beneficial effect on some crops, but the net effect of climate change is unlikely to be beneficial. Islands tend to produce and export a limited range of agricultural commodities and to import a wide range of food products. Rosenzweig and Parry and Reilly, et al. find that production of major crops will shift toward the poles. The “cooler” areas gain competitive advantage at the expense of “warmer” areas where the developing countries tend to be located. Reilly, et al. estimate that world prices for most crop commodities would fall relative to baseline prices. The commodities whose prices are projected to rise and fall, and the extent of the change, depend upon the climate model. Export revenues will vary with changes in output and world prices for export commodities. Import costs will vary with world prices for imported goods. Thus, the

MARGAREE Consultants
15
economic impact depends upon the effects of climate change on agriculture globally as well as domestically. 3.5 Fisheries Fishing on most islands is largely artisinal or small-scale commercial. The modest temperature increases projected are not anticipated to have a widespread adverse effect on island fisheries. Fish production would suffer if mangroves, seagrasses or coral reefs are lost or damaged due to sea-level rise and/or temperature change since those ecosystems function as nurseries and forage sites for a variety of commercially important species. 3.6 Coastal Infrastructure and Settlement Major coastal impacts will result from accelerated sea-level rise, including coastal erosion, saline intrusion and sea flooding. Islands will respond dynamically in variable and complex ways to sea-level rise and climate changes. For example, the extent to which relative sea-level rise affects coastal recession rates will depend on many factors, including (though not limited to) the rate of sediment supply relative to submergence; the width of existing fringing reefs; the rate of reef growth; whether islands are anchored to emergent rock platforms; whether islands are composed primarily of sand or coral rubble; the presence or absence of natural shore-protection structures; the presence or absence of biotic protection; the health of coral reefs; and, especially, the tectonic history of the island. In general, however, rising seas and more severe tropical storms will adversely affect shore regions due to erosion and flooding. In most of the eastern Caribbean states, more than 50% of the population resides within 2 km of the coast. Thus large populations and supporting infrastructure are located close to mean sea level. As a result critical infrastructure tends to be located in or near coastal areas. The projected sea-level rise will increase the vulnerability of that infrastructure, especially during extreme events. Due to the concentration of population in these areas, damage to important infrastructure would be disruptive to economic, social and cultural activities. The Caribbean region suffered considerable damage from severe hurricanes in the 1980s and 1990s. As a direct result, many insurance and reinsurance companies withdrew from the market. Those that remained imposed onerous conditions for coverage -- including very high deductibles; separate, increased rates for windstorms; and insertion of an “average” clause to eliminate the possibility of underinsurance. 3.7 Tourism Tourism is one of the most important sectors of the economies of many small island states in the Caribbean. It tends to be concentrated in the coastal zones. Tourism is so vital to many of the countries that when there is a contraction in the industry, the rate of national economic growth

MARGAREE Consultants
16
declines. In such circumstances, the budgetary allocations for essential services (e.g., health, education and welfare) may be reduced due to the decline in tourism earnings. Assessing the significance of tourism to a country's economy has been difficult because tourism is not one of the standard industries for which data are collected. In small countries tourism spending can exceed total GDP because a substantial share of the goods and services purchased by tourists are imported. The World Travel and Tourism Council recently developed the Travel and Tourism Satellite Accounts (TSA) to permit a better assessment of the contribution of tourism to a country's economy.11 This approach aggregates resident and visitor spending on lodging, travel, meals, etc. with investment spending by developers for facilities and public outlays for related transport infrastructure, promotion, sanitation and the like. Through input-output modeling, direct tourism industry impacts are calculated for comparative purposes with non-tourist sectors, and then direct and indirect impacts are aggregated to determine tourism’s overall economy-wide impact. TSA estimates for 2001 indicate the economic impact of tourism in the Caribbean region is greater than in any other region in the world. Tourism accounts for roughly 17% of total Caribbean GDP, over 21% of all Caribbean capital formation, nearly 20% of total regional exports, and roughly 16% of total employment, some 2.5 million jobs. In The Bahamas and the smaller islands of the Lesser Antilles tourism’s importance is significantly greater than these regional ratios indicate because the aggregate calculations are dominated by the influence of the larger more diversified economies of the Greater Antilles. In St. Lucia, for example, TSA estimates that tourism was responsible for 56% of GDP, 60% of total investment, 65% of total exports, and 44% of total employment in 2001. In The Bahamas tourism represented 50% of GDP and in Barbados the industry accounted for 47% of GDP in 2001. In the least tourist-developed CARICOM country, Trinidad and Tobago, tourism accounted for 12% of GDP, 13% of capital formation and exports, and 8% of total employment in 2001. Climate change will affect tourism in many ways, directly and indirectly. Loss of beaches to erosion; inundation; degradation of ecosystems (e.g., coral reefs); and damage to infrastructure could undermine the tourism resource base of island states. Since a high proportion of tourism in small island states is motivated by the desire of visitors to escape cold winters, milder winters in temperate zones due to climate change could reduce tourism. And warmer temperatures in the Caribbean could make it a less attractive destination. Tourism could also be hurt by measures, such as levies on greenhouse gas emissions by airlines, that increase air fares. Dislocation in the tourism sector would have severe repercussions for the economic, political, and sociocultural life of many small islands. 3.8 Human Health Researchers generally agree that most of the impacts of climate change on human health in low latitude countries are likely to be adverse on the whole. The relationship between climate change and potential impacts on human health is very complex. The actual impacts will depend on 11 WTTC, 2001.

MARGAREE Consultants
17
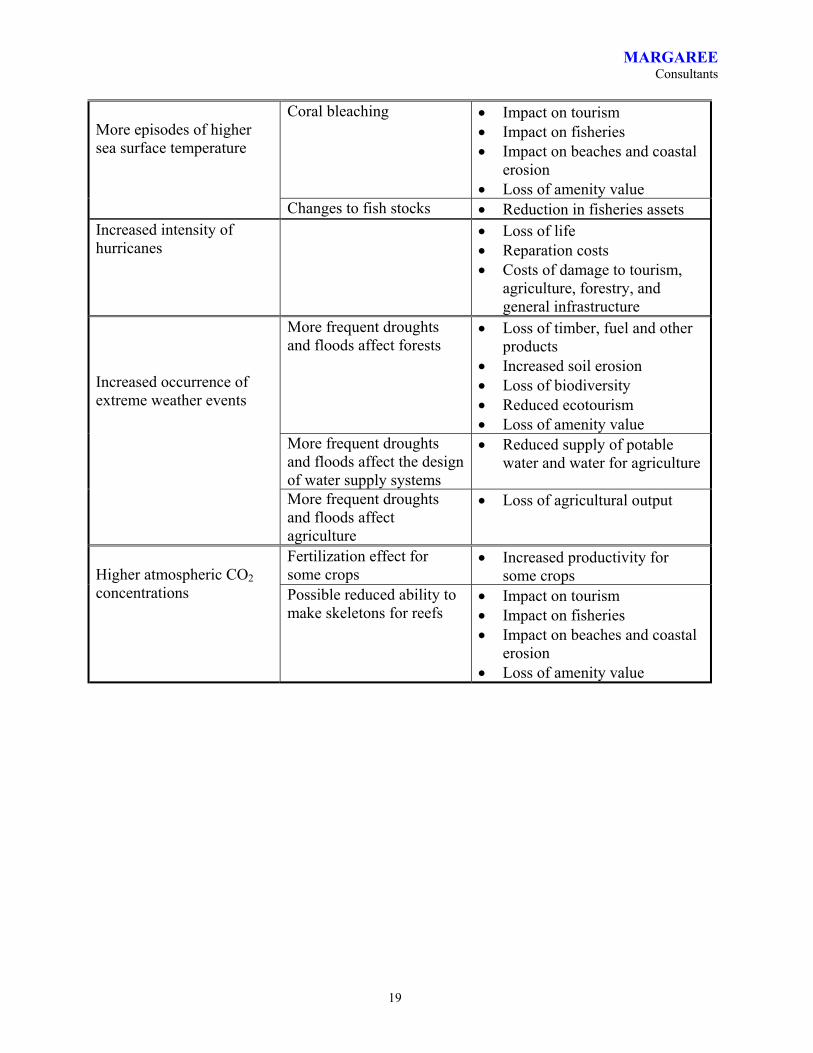
many factors, including present health status, quality of available health care services, and availability of financial and technical resources. Should climate change increase the frequency and/or severity of extreme weather events such as droughts, floods, landslides, and hurricanes, it is likely that more deaths, injuries, cases of infectious diseases, and psychological disorders would result. Elevated mean temperature also could lead to greater frequency of heat waves and higher incidence of heat stress with related illness and mortality. Climate change could increase the geographical range of disease agents; changes in the life-cycle dynamic of vectors and infective agents, in aggregate could result in more efficient transmission of many vector-borne diseases such as dengue fever and malaria. 3.9 Summary Caribbean countries must be classified as vulnerable to the effects of climate change and sea-level rise -- not simply because of their size or elevation alone but because of strong linkages between these and other physical characteristics, natural resources, and socioeconomic structures. While there may be some beneficial impacts on some crops and due to lower prices for imported food, the potential adverse impacts are more numerous and appear to be more significant. Many Caribbean countries face an annual threat from hurricanes. Most have extensive, vulnerable, low-lying coastal plains; some (e.g., Barbados, Antigua and Barbuda, St. Kitts, and Bahamas) are heavily dependent on groundwater supplies; and for many, tourism is the most vital economic sector. A higher incidence of flooding and inundation, beach and coastal land loss, reef damage, salinization of the freshwater lens, and disruption of tourism and infrastructure would create economic and social crises in a number of these islands. The relationship between climate change and economic impacts is summarized in Table 3.1. For some climate change impacts the relationship is quite simple -- infrastructure may be lost due to sea-level rise. Other relationships are very complex. The health of coral reefs is affected by periods of higher water temperatures, sea-level rise, and possibly atmospheric CO2 concentrations. Deterioration of coral reefs has impacts on fisheries, tourism, beaches, coastal erosion, and the amenity value of the reefs. Of course, adaptation to climate change is possible. Facilities damaged by hurricanes or floods can be repaired or replaced. Coastal regions can be protected. Freshwater supplies can be conserved and augmented through desalination. Farmers can adapt by growing heat- or drought-resistant crops and by irrigating crops. Natural ecosystems can be protected and, in some cases, restored. Such adaptation measures have costs, although they may be small relative to the damages avoided. In addition, per capita incomes are likely to rise significantly over the next 50 to 80 years so the adaptation measures will become more affordable.

MARGAREE Consultants
18
Table 3.1. Relationship between Climate Change and Economic Impact
Anticipated climate change impact
Induced impact on natural resource base
Economic impact
Health effects - heat stress, dengue, water-borne diseases
• Increased illness • Increased mortality • Loss of production • Higher public health
expenditures
Higher temperatures and humidity
Heat stress on crops • Loss of agricultural output Coastal erosion • Loss of land and ecosystems
• Loss of infrastructure • Impacts on tourism
Saline water intrusion • Reduced supply of potable water and water for agriculture
Loss of coral reefs • Impact on tourism • Impact on fisheries • Impact on beaches and coastal
erosion • Loss of amenity value
Sea level rise
Reduced mangrove stands • Less protection against storms, tides, storm surges
• Less protection against pests and exotic insects
• Loss of species diversity • Impact on fisheries • Loss of amenity value
Drier conditions and increased wind erosion
• Loss of agricultural output and assets
Drier conditions reduce freshwater supplies
• Reduced supply of potable water and water for agriculture
Drier conditions reduce mangrove stands
• Less protection against storms, tides, storm surges
• Less protection against pests and exotic insects
• Loss of species diversity • Impact on fisheries • Loss of amenity value
Precipitation - evaporation balance
Lower soil moisture leads to loss of forests
• Loss of timber, fuel and other products
• Increased soil erosion • Loss of biodiversity • Reduced ecotourism • Loss of amenity value
MARGAREE Consultants
19
Coral bleaching • Impact on tourism • Impact on fisheries • Impact on beaches and coastal
erosion • Loss of amenity value
More episodes of higher sea surface temperature
Changes to fish stocks • Reduction in fisheries assets Increased intensity of hurricanes
• Loss of life • Reparation costs • Costs of damage to tourism,
agriculture, forestry, and general infrastructure
More frequent droughts and floods affect forests
• Loss of timber, fuel and other products
• Increased soil erosion • Loss of biodiversity • Reduced ecotourism • Loss of amenity value
More frequent droughts and floods affect the design of water supply systems
• Reduced supply of potable water and water for agriculture
Increased occurrence of extreme weather events
More frequent droughts and floods affect agriculture
• Loss of agricultural output
Fertilization effect for some crops
• Increased productivity for some crops
Higher atmospheric CO2 concentrations Possible reduced ability to
make skeletons for reefs • Impact on tourism • Impact on fisheries • Impact on beaches and coastal
erosion • Loss of amenity value

MARGAREE Consultants
20
4. Economic Impacts of Climate Change on CARICOM Countries This chapter develops estimates of the potential economic impact of climate change on the CARICOM countries in the absence of adaptation actions. The estimates are based on data readily available existing studies; no original research or field work was undertaken. The available data are sketchy and numerous assumptions are required to develop estimates of the potential economic impacts. To address the uncertainty inherent in the data and assumptions, values that will yield low (high) estimates are applied to the low (high) climate change scenario. The resulting low and high estimates are very rough initial estimates of potential economic impacts in the absence of adaptation actions. The low and high estimates span a very wide range; an indication of the very approximate nature of the estimates. It must be stressed that the estimates in this chapter assume no adaptation measures are implemented. They are useful as a starting point for an identification and assessment of potential adaptation measures. The World Bank is preparing a project (Mainstreaming Adaptation to Climate Change, MACC) that would help countries in the Caribbean formulate and mainstream measures to adapt to anticipated impacts of climate change. The economic cost of climate change to CARICOM countries should be substantially lower than the high estimate developed in this chapter. It will be the cost of the adaptation measures implemented plus the value of the residual damage. Information on the costs of adaptation actions, where this is readily available from existing studies, is presented in Chapter 5. The available information is not sufficient to support estimates of the cost-effective use of various adaptation measures and hence of the total cost of adaptation and the residual damages. The estimates developed in this chapter are expressed as impacts on the current (2000) economy even though the climate change will occur gradually over 50 to 80 years. This is standard practice in the literature. It avoids the enormous uncertainties associated with projecting economic development 50 to 80 years into the future. Since the population and value of infrastructure are likely to be larger in the future, imposing the impacts on the current economy probably understates the future damages in dollar terms. But if climate sensitive sectors decline as a share of total economic activity, economic impacts as a percentage of GDP could decline. Estimates of the economic impacts of climate change on various sectors are developed in turn. The method used to estimate the economic impacts is described for each sector. Monetary values reported in the literature are converted to US dollars using the market exchange rate for the relevant year and are converted to 1999 US dollars using the US GDP implicit price index.12 12 Ideally, values would be converted to US dollars using purchasing power parity exchange rates, but we did not find purchasing power parity exchange rates for CARICOM currencies. Although purchasing power parity exchange rates are not available, the effect would probably be small relative to the range between the low and high estimates.

MARGAREE Consultants
21
4.1 Hurricanes and Tropical Storms All Caribbean countries are vulnerable to tropical storms and hurricanes. The number and intensity of the storms that hit a given country each year varies widely, with the more northerly islands generally experiencing storms more frequently. Most tropical storms and hurricanes pass to the north of St. Vincent.13 US data show 186 tropical storms and hurricanes over 129 years in the Bahamas (average of 1.44 per year of which 0.68 are hurricanes and 0.75 are tropical storms).14 Dominica averages a direct strike or close range hit (within 60 miles) by a cyclonic storm system every 3.82 years (0.26 storms per year).15 A country may incur damage due to heavy rains, high winds or storm surges even if it is not directly hit by a hurricane. While St Lucia has not had a direct hit since hurricane Allen in 1980, it experienced flooding due to tropical storm Debbie in 1994 and damage due to large waves and swells from hurricane Lenny even though the storm remained hundreds of miles away.16 Between 1980 and 1990, five tropical storm systems of varying intensity affected St. Vincent and the Grenadines, but none of the storms were direct hits.17 Data on damage due to hurricanes and tropical storms during the years 1982 through 2001 was compiled by country, converted to 1999 US dollars, extrapolated to cover missing data, and divided by 20 to get an estimate of the annual damage by country.18 The data are summarized in Table 4.1. The table also includes figures for all natural disasters for the 30 years from 1970 through 1999, originally from the same database, as reported by Auffret, in italics. The data on the total number of storms are quite consistent with those for total natural disasters given the different periods covered. This is not surprising since the basic source is the same database and the number of non-climate natural disasters is small in the Caribbean. However, the data for this study include several storms reported in national communications to the UNFCCC that are not included in the database. The deaths per year due to storms also are similar to those for natural disasters allowing for the different periods covered for the same reason. Differences could also be due to the adjustment for missing values if the data reported by Auffret did not incorporate such adjustments.
13 St. Vincent, 2000, p. 40. 14 Bahamas, 2001, pp. 13-14. 15 Dominica, 2001, p. xv. 16 St. Lucia, 2001, p. 42. 17 St. Vincent, 2000, p. 40. 18 Data on damages, deaths or injuries was missing for some storms. In such cases the average value for storms in that country was used. For example, damage data was available for 3 of 8 storms listed for Antigua and Barbuda. The average damage for those three storms was about 1999US$228,000. This average was used as the damages for the other five storms. The same procedure was applied to deaths and injuries although the number of missing values was smaller for those variables than for damages.

MARGAREE Consultants
22
Table 4.1. Damage due to Hurricanes and Tropical Storms 1982-2001
Ant
igua
&
Bar
buda
B
aham
as
Bar
bado
s
Bel
ize
Dom
inic
a
Gre
nada
Guy
ana
Jam
aica
St. K
itts
St. L
ucia
St. V
ince
nt
Tri
nida
d &
T
obag
o
CA
RIC
OM
Storms per year 0.40 0.25 0.15 0.35 0.25 0.10 0.25 0.70 0.35 0.35 0.35 0.20 3.70 0.23 0.13 0.17 0.23 0.13 0.63 0.23 0.27 0.30 0.27 2.60 Damage per year (1999 US$ million)
$87.2
$56.4
$20.2
$21.9
$2.4
$0.6
$7.4
$107.4
$27.0
$119.0
$2.7
$0.01
$452.2
(1998 US$ million) $3.5 $9.7 $4.9 $4.4 $1.0 $66.3 $10.4 $51.8 $1.6 $0.6 $154.2 Deaths per year 0.47 0.40 -- 3.85 0.30 -- 0.50 7.76 0.35 2.45 0.21 0.33 16.64 0.23 0.17 0.10 1.43 -- 9.03 0.20 1.80 0.17 0.30 13.43 Injuries per year 21 -- -- 67 -- -- -- -- 4 -- 2 -- 93 Source: EM-DAT: The OFDA/CRED International Disaster Database - www.cred.be/emdat - Université Catholique de Louvain, Brussels, with additional data from the Caribbean Development Bank and national communications to the UNFCCC. Figures in italics are calculated from Auffret, Table 1.5, p. 29. They are originally from the same database, but include all natural disasters (volcanoes as well as hurricanes) and are for the period 1970 through 1999. The average annual damages estimated are $452 million compared to $154 million for all natural disasters. This large difference in average damages is surprising given the similarity of the number of storms and deaths. The difference probably is due to mainly to the adjustment for missing data. Coverage of damage estimates is relatively low, so the treatment of missing values can have a significant impact.19 The process for adjusting to constant dollars and the storms added to the database would also contribute to the difference. The rain, wind and storm surges associated with hurricanes and tropical storms cause a variety of damages. They damage physical facilities, agricultural crops and forests; cause deaths, injuries and disease; and disrupt economic activity in some cases for several years. The damage estimates included in the database undoubtedly differ significantly in terms of their coverage of these damages. Some estimates are likely to be limited to the replacement costs for physical damage, where the replacement costs may or may not be discounted for the age of the damaged facilities. Coverage of private costs probably differs across estimates. Some estimates may include health care costs and loss of income due to disruption of business activity. 19 Of the 74 hurricanes and storms during the 20 years analyzed, the database included damage estimates for only 35. The missing values were obtained from other sources for 9 cases. The missing value estimation procedure was applied to the remaining 30 cases. If the figures reported by Auffret did not adjust for missing values, the average would be less than half the value calculated for this report.

MARGAREE Consultants
23
4.1.1 Hurricane Damage to Housing and Infrastructure Since 1989, eight storms have affected St. Kitts and Nevis - Hugo, Felix, Gilbert, Iris, Luis, Marilyn, Bertha and Georges. Damage from hurricane Hugo (1989) has been estimated at US$43 million, from hurricanes Luis and Marilyn (1995) at US$55 million, and from hurricane Georges (1998) at US$74 million. These costs do not account for private expenditures, nor do they account for the revenues lost to business, or lost tourist spending, and they do not reflect the costs in human suffering and grief that accompany major storms.20 The Inter-American Development Bank (IDB) estimated the damage caused by hurricane Floyd at US$153 million, excluding damage to housing and personal property.21 Hurricane Lenny affected 154 homes dispersed among 13 communities on the west coast of Dominica. Of these 47 were completely destroyed while the remaining 89 experienced varying degrees of damage. Total damage to residential buildings, commercial, tourist (hotels etc), boat houses/storerooms and government public infrastructure was estimated at approximately US$2.91 million. Estimated cost for restoration works for sea defences and associated road works was estimated at approximately US$1.27 million. The cost of remedial work at five seaports was estimated at US$1.61 million. In addition, the recommended permanent works including construction of seawalls, rock armouring and associated road works to protect against wave action was estimated at approximately US$41 million.22 Dominica's water utility, DOWASCO, incurred US$0.12 million in line repair, maintenance and relocation costs.23 Although St. Vincent and the Grenadines did not receive any direct impact of the triple storm systems of 1995--Iris, Luis, and Marilyn--coastal areas received considerable damage from storm surges associated with these systems. Tailwinds and waves from Iris caused more than US$350,000 damage to the port of Kingstown, including the deep-water pier.24 Similarly, although the country did not receive a direct impact, hurricane Lenny produced flooding in coastal areas of Kingstown, damaged a total of five houses, and washed away three houses and one shop. Total damage to houses, beaches, and the road network system was estimated at about US$140,000. The major damage was to the newly built US$18 million cruise ship complex in the capital.25
20 St. Kitts, p.8-9. 21 Bahamas, 2001, pp. 49-50. 22 Dominica, 2001, p 43. 23 Dominica, 2001, p xxiii. 24 St. Vincent, 2000, p. 40. 25 St. Vincent, 2000, p. 40
MARGAREE Consultants
24
4.1.2 Hurricane Damage to Tourism Hurricane and tropical storm activity have had major impacts on Antigua and Barbuda’s vital tourism industry. In 1995 Hurricanes Luis and Marilyn devastated coastal areas, causing severe damage to hotel and other tourism properties and leading to a 17% decrease in the number of tourist arrivals and adversely affecting employment and foreign exchange.26 Similar experiences occurred in 1998 and 1999 with the passage of Hurricanes Jose, Georges and Lenny.27 The cost associated with damage from Hurricane Gilbert in 1988 was in the region of J$25 million.28 The 1998 hurricane season was especially devastating to Jamaica with long lasting effects resulting from hurricanes Georges and Mitch.29 Hurricane Lenny in 1999 caused approximately US$250,000.00 damage to tourism infrastructure in Dominica, mainly along the west coast.30 Tourism arrivals in St. Kitts by air and sea have been negatively affected by the passage of hurricanes Luis and Marilyn (1995), Georges (1998) and Jose (1999).31 Lost stayover tourist days in St. Lucia were estimated at 50% due to hurricane Allen. Had the event happened at the current levels of tourism, it would have been a total estimated loss of US$500 million.32 4.1.3 Hurricane Damage to Agriculture and Fisheries A single hurricane of moderate intensity could reduce the nutmeg and cocoa industries by 80% to 90% as was the case of the 1955 Hurricane Janet. It would then take up to five to seven years for a recovery of these crops since this is the required time to reach economic yield.33 In 1995, hurricanes Luis and Marilyn are estimated to have resulted in a reduction in agricultural production in St. Kitts.34 In 1995, 100% of Dominica's economically important banana crop was lost to hurricanes Luis, Marilyn, and Iris.35 Estimated losses to the agricultural sector in Dominica caused by hurricane Lenny were over US$3.86 million.36
26 Antigua and Barbuda, 2001, p. 35. 27 Antigua and Barbuda, 2001, pp. 36-37. 28 Jamaica, 2001, p. 72. 29 Jamaica, 2001, p. 12. 30 Dominica, 2001, p. 51. 31 St. Kitts, p. 38. 32 St. Lucia, 2001, p. 42. 33 Grenada, 2000, p. 23. 34 St. Kitts, p. 36. 35 Dominica, 2001, p 10. 36 Dominica, 2001, p 48.
MARGAREE Consultants
25
Storm and hurricane damage has a major impact on the fishing industry. About 16% of the total fleet in Antigua and Barbuda was either destroyed or lost as a result of hurricane Luis, and another 18% was damaged. In addition to the cost of replacement and repair to fishing vessels and gear caused by a hurricane, there is a loss of revenue due to disruption of the fishing industry.37 Losses to the fishing industry in St. Lucia due to hurricane Lenny include 10 - 20% of the fleet valued at about US$135,000 and other fishing infrastructure valued at about US$150,000.38 In Dominica hurricane Lenny caused damage of US$2.8 million to the fishing industry. This includes damage to coral reefs and sea grass beds, beach landing sites, fishing gear and equipment and associated infrastructure.39 4.1.4 Impact of Climate Change on Damage Due to Tropical Storms and Hurricanes The climate scenarios assume the number of tropical storms and hurricanes remains at ten per year including two severe hurricanes (category 4 and 5 storms) in the low case and four in the high case. The total number of tropical storms and hurricanes per year for the CARICOM countries as shown in Table 4.1 is 3.7. This reflects the fact that CARICOM countries are not affected by all tropical storms and hurricanes in the Caribbean region. Since the climate scenarios assume no change in the total number of tropical storms and hurricanes, the average annual damages are not adjusted for a change in storm frequency. Climate change is expected to increase the intensity of storms in both the low and high case. The economic impact is estimated as the additional losses due to the increased intensity of hurricanes -- 35% for the low scenario (representing a 5% increase in wind speed) and 135% for the high scenario (representing a 15% increase in wind speed and including the larger number of severe hurricanes).40 These increases are assumed to apply in each country. The average annual damages due to hurricanes and tropical storms in CARICOM countries is US$452 million, so the impact of climate change is estimated at almost US$160 million in the low case and over US$610 million in the high case. These estimates are very crude. The reported damages probably differ significantly in scope and accuracy, so it is not clear what damages are covered. Damages are not reported for many storms and so are set equal to the average for the storms where damages have been estimated. Since damages are highly variable, this procedure could over- or under-estimate the missing values. 37 Antigua and Barbuda, 2001, p. 42. 38 Strand, et al., 2002. 39 Dominica, 2001, p. xxv. 40 Clark, 1997, see Table 2.5 above. Although these estimates were made for coastal U.S.A. the percentage changes should apply equally in well populated Caribbean countries.

MARGAREE Consultants
26
4.2 Tourism Tourism is a large sector of the economy of many CARICOM countries. Tourism has a major employment impact both because of the size of the industry and because it is a labour-intensive industry. Tourism may be affected by climate change in several ways. Climate change may make the Caribbean less attractive as a holiday destination. Loss of beaches, coral reefs and forest ecosystems would also reduce tourism. Tourist facilities could be lost due to sea level rise, storm surges and hurricane damage. Damage due to hurricanes or flooding could disrupt tourism temporarily. The impacts due to increased intensity of hurricanes and tropical storms -- damage and disruption -- are assumed to be covered by the estimates in the previous section; the remaining impacts are covered here. 4.2.1 Tourism Demand Tourists come to the Caribbean mainly to escape cold winter weather between mid-December and mid-May. The main attractions are the “sun, sand and sea”. Climate change could reduce tourist travel to the Caribbean because it: • reduces the demand for winter holidays in warm climates, or • leads to mitigation measures, such as a carbon tax on fuels, that increase the cost of travel; or • makes the Caribbean relatively less attractive as a destination. Lise and Tol analyse the impact of climate on tourist demand using data mainly for European countries. They conclude that climate is a very important consideration for the tourist’s choice of destination and that the ideal temperature is 21ºC (average of the hottest month of the year). Data on average monthly temperatures is not readily available for the CARICOM countries. In New Providence, Bahamas the mean daily temperature is 28ºC in July and 23ºC in January. The available data for other CARICOM countries, often the annual mean temperature, suggests that they are slightly warmer than the Bahamas. The temperature data suggest that the Caribbean is already warmer than the optimal temperature estimated by Lise and Tol. Climate change will increase the average temperature and so make the Caribbean less attractive as a tourist destination. Using the equation estimated by Lise and Tol, an average temperature increase of 2ºC for the low scenario and 3.3ºC for the high scenario would make the Caribbean less attractive as a tourist destination by 15 to 20% for the low case and by 25 to 30% for the high case.41 Annual visitor expenditures are estimated to be reduced by 15% for the low scenario and 30% for the high scenario. The annual reduction in tourist spending for the CARICOM countries is US$715 million in the low scenario and US$1,430 million in the high scenario. 41 The equations for tourists arriving from particular countries are given in Table 2. By assuming that all factors other than temperature remain constant, it is possible to calculate the impact of climate change from the coefficients for the temperature variables. The coefficients on temperature for tourist arrivals from the United States are: 1.24*T -2.9*T2, where T is the mean temperature during the warmest month in 0C. Assuming that the current mean temperature is 230C, yields a value of -1505.58 for these terms. With a temperature increase of 20C to 250C, the value of these terms becomes -1781.5, a reduction of 18%. With a temperature increase of 3.30C to 26.30C, the value of these terms becomes -1973.3, a reduction of 31%. The results for arrivals from other countries are similar.

MARGAREE Consultants
27
Since food and other items purchased by tourists are imported, the impact on GDP is smaller. It is estimated that 23% to 35% of tourist spending represents value added, so the impact of reduced tourist spending on GDP is almost US$165 million in the low scenario and US$500 million in the high scenario.42 The estimates of the impact of reduced tourism demand on the GDP of CARICOM countries are obviously very rough. They are based on equations estimated using limited data mainly for European countries. The data corresponding to the temperature variable in the equations are are not available for CARICOM countries. And the value added component of tourism spending is not accurately known for CARICOM countries. 4.2.2 Loss of Facilities due to Sea Level Rise Many hotels and other tourist facilities are located close to the shore. This makes them vulnerable to coastal erosion and to damage from hurricanes and storm surges. This section focuses on the loss of facilities due to sea level rise assuming no adaptation measures are implemented. In Barbados over 90% of the island’s hotels are within proximity to the beach, 70% of the hotels are located within 250 metres of the high water mark. This translates to the island’s hotels sitting almost exclusively within the 1 in 500 and 1 in 100 inundation zones, placing them at major risk of structural damage.43 All major hotels and (90%) of the 1,066 hotel rooms (1994) in Grenada are located in the coastal zone that represents 3% of the land area and is vulnerable to sea level rise.44 Data on the number of hotel rooms lying less than 0.15 m (low scenario) and 0.70 m (high scenario) above the high water mark are not available for any of the countries. It is assumed that the fraction of hotel rooms lost due to sea level rise in each country is equal to the fraction of total land lost due to sea level rise, as estimated in section 4.3.1 below. This is approximately 3% for the low scenario and 20% for the high scenario.45 The average cost per room of a new hotel is estimated at US$80,000 for the low scenario and US$100,000 for the high scenario.46 42 The figure of 23% is calculated by comparing tourist expenditures with GDP for hotels and restaurants in tables A-3 and A-2. It is the weighted average for the 6 countries where data are available and tourism expenditures exceed the value of GDP for this sector. The 35% figures is calculated from the income coefficients for various categories of tourist spending using data from Lindberg and Enriquez, 1993. 43 Barbados, 2001, p. 20. 44 Grenada, 2000, p. 24. 45 This is the share of rooms lost due to static sea level rise. Many more lying further from the shore will be damaged by hurricanes and storm surges. Those damages are assumed to be included in the damages due to increased intensity of hurricanes and tropical storms estimated in section 4.1.1 above. 46 Personal communication with architects that have been responsible for hotel projects in Barbados and Trinidad and Tobago.

MARGAREE Consultants
28
The total replacement cost of hotel rooms is almost US$140 million for the low scenario and US$1.3 billion for the high scenario. To be comparable with other costs, these replacement costs need to be expressed as an equivalent annual cost. To convert the capital cost to an annual cost a 5% real interest rate and a 30 year term are assumed. Then the conversion factor is 0.065. The annualized cost of replacing hotel rooms lost due to sea level rise then is US$9 million for the low scenario and US$80 million for the high scenario. The values are sensitive to the estimates of the fraction of land lost due to sea level rise, the estimated cost of new hotels and the real discount rate. 4.2.3 Loss of Beaches and Ecosystems Tourist expenditures could be reduced if loss of beaches or damage to ecosystems, such as coral reefs or forests, makes a country less attractive to tourists. Pinneys Beach in Nevis has experienced dramatic rates of coastal erosion with considerable economic costs to owners and the national economy.47 Tourism activity in Dominica and in St. Vincent and the Grenadines has lagged behind than other Caribbean destinations due in part to a lack of white sandy beaches.48 The beach area for most of the CARICOM countries is not readily available. The length of sand beach coastline is available for Antigua and Barbuda, Dominica, Grenada, St. Kitts and Nevis, St. Lucia and St. Vincent as well as several other Caribbean islands.49 For those islands an average of 29.5% of the coastline is sand beaches. Where data on the length of beaches is not available, 30% of the coastline is assumed to consist of beaches. In Barbados, several of the beaches are narrow, averaging between 12-15 m in width.50 In the low scenario, the beach area is estimated using a width of 12 m and in the high scenario the beach area is estimated using a width of 18 m. Application of the Bruun rule to beach erosion yields a low estimate that is roughly linear for cm of sea level rise and percent of beach lost -- 0% lost for 0 cm rise and 80% lost with 80 cm rise -- and a high estimate that is asymptotic with 90% lost with an 80 cm rise.51 With a 50 cm rise in sea level, up to 60% of Grenada’s beaches would disappear in some areas including Grand Anse, Morne Rouge, Harvey Vale and Paradise, all of which are important tourist attractions.52 The 47 St. Kitts, p. 32. 48 Dominica, 2001, p. 6 and St. Vincent, 2000, p. 12. 49 Leatherman, 1997, p.31. For countries where the information was not available, the beach coastline was estimated using the average ratio of beach coastline to total coastline for 13 Caribbean islands -- 30%. The data for the CARICOM countries are provided in Table A-1. 50 Barbados, 2001, p. ix. 51 Grenada, 2000, Figure 7, p. 33. 52 Grenada, 2000, p. xii.

MARGAREE Consultants
29
low scenario of 0.15 m sea level rise is assumed to lead to a loss of 15% of the beaches and the high scenario of a 0.70 m rise in sea level is assumed to result in loss of 80% of the beach area. A 1990 study estimated the value of beaches in Florida at US$8.8 million per acre per year (US$21.5 million/ha/year).53 This would put the annual value of the beach area lost at more than double the total annual tourism spending in the low scenario and more than 17 times the total annual tourist spending in the high scenario. These estimates are unrealistic. To value the beach area lost for tourism purposes, the share of the beach area lost is applied to “sun, sand and sea” tourism spending -- the reduced level of total tourism spending less dive- and eco-tourism spending.54 The annual value of the beach area lost for “sun, sand and sea” tourism is estimated at US$550 million in the low case and US$2.4 billion in the high case. The value of the beach area lost is the GDP contribution of this spending , just over US$80 million in the low scenario and almost US$720 million in the high scenario. Damage to coral reefs will reduce dive tourism and damage to forest ecosystems will reduce ecotourism. Divers from USA spend US$286 million annually in the Caribbean and Hawaii.55 Since 5% of total tourist spending in all CARICOM countries amounted to US$238 million in 1999, it was arbitrarily assumed that dive tourism represented 5% of total tourist spending in all CARICOM countries. Visitation to protected areas in Belize in the early 1990s was 110 - 130 thousand or approximately 50% of annual arrivals.56 Based on this information ecotourism is estimated to represent 50% of total tourist spending in Belize, Guyana and Dominica.57 After two tropical storms and a hurricane in 1995 Dominica found that overall damage to the reef surface by storm waves was between 20% and 30%.58 The loss of dive and ecotourism is estimated to be 15% for the low scenario and 30% for the high scenario. The impact on GDP of the lost dive- and eco-tourism is estimated at US$12 million in the low scenario and US$36 million in the high scenario. Thus the total reduction in tourist spending due to losses of beaches and ecosystems is estimated at US$95 million in the low case and US$755 million in the high case. These figures are dominated by the estimates of beach area lost, which are very crude. 53 Leatherman, 1997. 54 The value of the land and the amenity value for residents of the beach area lost are considered in subsequent sections. 55 Lindberg and Enriquez, 1993. 56 Lindberg and Enriquez, 1993. 57 Dominica's tourism is focused mainly on eco tourism (Dominica, 2001, p. xxv). 58 Dominica, 2001, p. 35.

MARGAREE Consultants
30
4.3 Infrastructure This category includes loss of land and infrastructure due to sea level rise, damage due to heavy rains, and reduced supplies of potable water due to salt water intrusion into the freshwater lens and changes to precipitation patterns. 4.3.1 Loss of Land Sea level rise will lead to coastal erosion -- loss of coastal land. The land lost will include beaches, urban areas, farm land, and natural areas. Some or all of these uses will move to lands that are currently used for agriculture or forestry or are in their natural state. The land lost will be valued at the average market price of land near, but inland from, the coast. The estimates do assume no protective measures are implemented to reduce coastal erosion. Antigua and Barbuda is expected to experience a retreat of 1 metre for every 10 mm of sea level rise or 10 m for each 0.1 m of sea level rise.59 Modeling (Bruun rule) for Guyana shows the same result -- shoreline retreat of approximately 10 m for each 0.1 m of sea level rise (range of 5 to 15 m per 0.1 m of sea level rise). In Barbados the land lost is estimated to be approximately 1 m for each 0.1 m of sea level rise.60 The rate of shoreline retreat is estimated to be 1 m per 0.1 m of sea level rise in the low scenario and 1.5 m per 0.1 m of sea level rise in the high scenario. By 2080 that represents about 3% of the total land area of most countries (range is 1% to 8%) in the low scenario and 21% of the total land area in the high scenario (range 8% to 53%). In The Bahamas 80% of the landmass is within 1.5 m of mean sea level, roughly double the projected sea level rise for the high scenario.61 The market price for vacant land inland from the coast that is currently unused or used for agriculture or forestry ranges between US$4 and US$10 per square foot (US$150,000 to US$500,000 per acre) in several countries. A value of US$400,000 per hectare is used in the low case and a value of US$1,000,000 per hectare is used in the high case.62 Thus the value of land lost is over US$400 million in the low scenario and US$7.2 billion in the high scenario. As an annual cost over 30 years the corresponding amounts are over US$25 million in the low scenario and almost US$470 million in the high scenario.
59 Antigua and Barbuda, 2001, p. 40. 60 Barbados, 2001, Table 2.1, p. 29 shows loss of 2.16 m of land (range for 9 sites 1.1 to 3.3 m) for sea level rise of 0.2 m and land loss is 5.75 m (range 3.4 to 8.0 m) for sea level rise of 0.5 m. 61 Bahamas, 2001, p. 15. 62 Personal communication yielded current market prices of US$4 to $10 per square foot in Tobago, US$57,000 per acre in St. Lucia, US$10 to $12 per square foot in Grenada, and US$19 to $134 per square metre for undeveloped land in Barbados. Converted to 1999US$ these values range from $400,000 to $1,000,000 per hectare.

MARGAREE Consultants
31
The estimates of the value of land lost due to sea level rise depend upon the estimated area of land lost and the value of undeveloped land. Both will differ significantly across countries and the value of land will vary by location within a country. The estimates do not reflect those variations and hence may be significantly too high or too low. 4.3.2 Loss of Housing and Infrastructure due to Sea Level Rise Much of the population of the CARICOM countries lives close to the coast. This means that housing, commercial buildings, and public infrastructure, such as roads, water and sewer systems, wharves, schools, and public buildings, are vulnerable to coastal erosion due to sea level rise. The land lost due to sea level rise was estimated above. To estimate the loss of housing and other infrastructure the population living on this land is estimated. The number of housing units for this population and the replacement value of those units are then estimated. The value of other infrastructure is estimated using data on the value of other infrastructure relative to the value of residential dwellings. The cost of replacing tourist facilities lost due to sea level rise was estimated in the previous section. In an assessment of the Antigua and Barbuda’s largest human settlements, 34% of the major settlements were classified as low vulnerability, 28% were classified as medium vulnerability, 19% were classified as high vulnerability, and other 19% were evaluated as very high vulnerability.63 In Grenada 29 settlements accounting for approximately 19% of the nation’s population are located on 3% of the land area along the seacoast.64 Since this area corresponds roughly to the land lost under the low scenario, it is assumed that 19% of the population lives on the land lost under the low scenario. The high scenario involves the loss of about 7 times as much land as the low scenario. It is assumed that 66% of the population (medium, high and very high vulnerability classes for Antigua and Barbuda) lives on the land lost under the high scenario. The main population centres in St. Vincent, housing 85 percent of the population, lie on a narrow coastal strip less than 5 m above sea level and less than 5 km from the high-water mark.65 Ninety percent (90%) of the population of Dominica is dispersed among coastal villages, the city and a town.66 Ninety percent (90%) of Jamaica’s GDP is produced within the coastal zone.67
63 Antigua and Barbuda, 2001, p. 38. 64 Grenada, 2000, p. 24. 65 St. Vincent, 2000, p. 39. 66 Dominica, 2001, p. xxiv. 67 Jamaica, 2001, p. 68.

MARGAREE Consultants
32
Data on the average household size is available for most countries and ranges from 3.0 to 5.07 persons.68 Where country-specific data are not available an average of 4.13, the average for the countries where data are available, is used. In the low scenario, a total of 1.1 million people representing roughly 281,000 households currently live on land at serious risk due to sea level rise. In the high scenario, a total of almost 4 million people representing about 980,000 households currently live on land at serious risk due to sea level rise. The average replacement cost of a house is estimated to be between US$15,000 and US$30,000.69 Then the replacement cost of the houses on land lost to sea level is about $4.2 billion in the low scenario and over $29 billion in the high scenario. On an annualized basis the cost of replacing the housing units is about $275 million in the low scenario and over $1.9 billion in the high scenario. The infrastructure to support this population -- roads, telephone and electricity lines, transmission centres, water lines, airports, and marine centres also lie on land that will be lost to sea level rise. In St. Vincent 85% of the total population, more than 80% of the island’s total infrastructure base accounting for 90% of the country’s economic investment is situated in the coastal zone.70 Data for selected areas on Barbados indicate that the value of commercial, industrial, fishing and recreational infrastructure is 195% of the value of housing. This does not include the value of roads, sewers and water lines. Then the replacement cost of other infrastructure on land lost to sea level is over $8 billion in the low scenario and over $57 billion in the high scenario. On an annualized basis the cost of replacing the other infrastructure is over $535 million in the low scenario and $3.7 billion in the high scenario. The replacement cost of roads, sewers, water line, electricity and telephone services is estimated at US$8,173 per household based on data for selected areas on Barbados. Using this value, the replacement cost for these facilities is estimated at US$2.2 billion in the low scenario and almost US$8 billion in the high scenario. On an annualized basis the cost of replacing this infrastructure is about $150 million in the low scenario and $520 million in the high scenario. The annualized replacement cost for buildings and infrastructure on land lost due to seal level rise is about US$960 million ($275 for housing, $535 for other buildings, and $150 for infrastructure) in the low scenario and about US$6.1 billion ($1.9 for housing, $3.7 for other buildings, and $0.5 for infrastructure) in the high scenario. These estimates are sensitive to the amount of land lost due to sea level rise and the population estimated to live on that land. The estimates assume that no protective measures are implemented. 68 See Table A-1. During 1994 the average size of households in Jamaica was 3.69 persons (Jamaica, 2001, p. 23) and in 1991 the mean household size in St. Kitts was 3.4 persons (and declining) (St. Kitts, p. 12). 69 Replacement costs for a 2 bedroom house in Georgetown range from US$10,000 to $60,000 and in Onverwacht range from $16,000 to $23,000. A typical house in many of the CARICOM countries is about 1,100 square feet and has a construction cost of US$21 per square foot for a total cost of US$23,100. 70 St. Vincent, 2000, p. 39.
MARGAREE Consultants
33
4.3.3 Flood Damage Climate change is projected to lead to increased rainfall on rain days, leading to more flooding. Most CARICOM countries have at least some areas that suffer flood damage as a result of heavy rains. For example, some parts of the main commercial center of St. George’s (Grenada) and the tourist areas in the southwest peninsula are also susceptible to flooding during periods of high seas and heavy precipitation.71 In Barbados fifty-eight (58) severe rainfall (flood) and wind events of a significant nature have been documented from 1955-2000 (1.29 per year). A tropical wave in combination with an upper level trough in August 1995, produced up to 225mm of rain in certain areas of the island, causing severe flooding and over US$2 million dollars in damage.72 The current damage per severe event is estimated to be between US$0.1 million and US$0.25 million. There is no basis for this range other than being substantially less than the US$2 million damage for the severe flood in Barbados in 1995. The number of severe events per year is assumed to be 1.29 for each country. Climate change is estimated to increase the rainfall during a heavy rain by 40% by 2090 for both the high and low scenarios. The damage due to the increased rainfall is assumed to rise by 40% as well. Then the climate change impact is estimated at 40% of US$0.1 per event for 1.29 events per year in the low scenario and 40% of US$0.25 per event for 1.29 events per year in the high scenario. The damages are assumed to be the same for each country, resulting in total annual damages of US$0.6 million in the low scenario and US$1.5 million in the high scenario. These estimates of damage due to increased rainfall during heavy rains are very arbitrary. Very little evidence is available to support any estimate of climate change impacts due to increased rainfall during heavy rains. It is unlikely, as well, that the increased damages would be the same for each country as is assumed. 4.3.4 Reduced Availability of Potable Water Climate change may reduce the supply of potable water due to salt water intrusion into the freshwater lens and lower recharge of the freshwater lens due to a combination of lower total rainfall and more heavy rains which run off quickly. Some of the CARICOM countries have abundant water supplies, while others are already experiencing shortages. Only 25% of the available groundwater and 11% of the available surface water are presently being utilised in Jamaica.73 St. Vincent boasts an abundance of surface water in rivers and
71 Grenada, 2000, p. xii. 72 Barbados, 2001, p. x. 73 Jamaica, 2001, p. 75.
MARGAREE Consultants
34
streams, while the Grenadines experience severe shortages due to the limited supply of surface or groundwater.74 The Bahamas extract water from shallow freshwater lenses within 1.5 m of the land surface. An increase in sea level rise along with indiscriminate extraction of freshwater from the well fields, will put this already threatened resource at even higher risk.75 St Kitts has considerable underground as well as significant surface water resources. Nevis is somewhat drier than St Kitts and prolonged periods of dry weather already present stresses to the water supply.76 Because St. Lucia is composed of impermeable rock, which does not readily permit the movement of water into underground reserves, it relies on surface water from rivers, wetlands, streams and springs.77 Antigua is heavily dependent upon desalinated water for domestic and other uses.78 Until February 2000 fresh groundwater accounted for almost all of Barbados’ potable water supply. Two desalination plants, capable of relieving approximately 12% of the stress on the nations water reserves, have been recently built in Barbados.79 Fresh water in the Grenadines is obtained mainly from rainwater runoff. Some water is imported, and the remainder is obtained from desalination plants.80 Although Grenada, along with Barbados and Antigua, is among the driest countries per capita in the world the groundwater potential on the main island is not yet fully developed.81 The availability of freshwater sometimes varies dramatically between islands in the same country (e.g., St. Vincent and the Grenadines). Of the 12 CARICOM countries only Antigua and Barbuda, the Bahamas, Barbados and Grenada are considered to be water stressed. For those countries it is assumed that climate change would reduce freshwater supplies by 8%, the median estimate of reduced precipitation during the rainy season in 2080. To estimate climate change impact due to reduced freshwater supplies in the absence of adaptation measures requires a value for freshwater where the supply is scarce. That information is not available from the literature for CARICOM countries. In this case, therefore, an estimate of the adaptation cost is used as a substitute for the damage.
74 St. Vincent, 2000, p. 46. 75 Bahamas, 2001, p. 31, 47. 76 St. Kitts, p. 33. 77 St. Lucia, 2001, p. 51. 78 Antigua and Barbuda, 2001, p. 40. 79 Barbados, 2001, p. ix. 80 St. Vincent, 2000, p. 46. 81 Grenada, 2000, p. 22.

MARGAREE Consultants
35
Specifically, the reduced supply of freshwater is assumed to be provided by desalination plants. The per capita water consumption is estimated at 130 litres/day.82 Then the additional desalination requirement for the four countries is about 2,800 million litres per year. The cost of producing desalinated water ($3.96 to $5.72/1000 l) is much higher than developing the surface water ($1.32 to $1.76/1000 l) and groundwater ($2.20 to $2.64/1000 l) supplies.83 Since climate change reduces the groundwater supplies in water stressed countries, the cost is the difference between the cost of desalination and the cost of groundwater -- $1.75/1000 l in the low scenario and $3.00/1000 l in the high scenario. The total cost due to climate change is US$4.9 million for the low scenario and $8.4 million for the high scenario. The estimates depend heavily on the per capita freshwater use, the estimated reduction in supplies due to climate change, and the cost of desalination, which has been declining. The estimates assume that freshwater supplies will decline by 8% in each of the four countries affected. In practice the magnitude of the impact is likely to vary by country and other countries could be affected. 4.4 Agriculture Agricultural commodities are internationally traded. Most CARICOM countries are exporters of a limited range of products and importers of a much wider range of food products.84 Climate change will affect production globally and hence have an impact on international prices. Climate change will also affect production levels, after adaptation, in the Caribbean and elsewhere. The economic impact on agricultural exports, then, depends on the changes in production levels and the changes in world prices, while the economic impact on food imports depends on the changes in world prices. 4.4.1 Climate Change and World Agriculture The US Department of Agriculture studied the impact of four climate change scenarios on world agriculture using the FARM model.85 The FARM model is a general equilibrium model with seven geographic regions that calculates changes in output of agricultural commodities and world prices of those commodities. The endowments of land, labour, and capital are assumed to be fixed for the purposes of determining the regional production possibilities. Water, the only
82 Grenada, 2000, p. 21. 83 Grenada, 2000, 60. 84 Some 90% of the food consumed in The Bahamas is imported (Bahamas, 2001, p. 21). Jamaica is reasonably self-sufficient in food but imports wheat, maize, meat, milk, dairy products, and fish (Jamaica, 2001, p. 79). An estimated 80% of Barbados commercial food is imported. (Ministry of Agriculture). 85 Darwin, et al., 1995.
MARGAREE Consultants
36
other primary factor determining the production possibilities curve is altered by the climate change scenarios. The study indicates that changes in agriculturally important land are expected to be negative in tropical areas and positive in high-latitude regions where soil moisture and water supplies remain adequate. Later studies suggest that this may not be so in parts of North American great plains.86 The Caribbean is part of the ‘Rest of the World’ region along with South America, non EU Europe, and the former Soviet Union. This broad classification does not allow us to apply the results of the ROW region to the Caribbean. The model produces a reduction in quantity supplied of total crops in the order of 0% to -1.1%. There is a clear correlation between higher latitudes and agricultural output, which suggests that tropical areas such as the Caribbean will experience losses in agricultural output. 4.4.2 Loss of Agricultural Output Climate change may lower agricultural output through a variety of impacts -- agricultural land may be lost due to coastal erosion; heavy rains and loss of forests may result in higher soil erosion; higher temperatures may cause heat stress; and lower total rainfall, more heavy rainfalls and increased evapotranspiration may lower soil moisture. On the other hand, higher levels of CO2 in the atmosphere may enhance growth of some crops. The main agricultural products of the CARICOM countries are listed in Table 4-2. The principal exports are bananas (Antigua and Barbuda, Belize, Dominica, Grenada, Jamaica, St. Lucia and St. Vincent) and sugar cane (Antigua and Barbuda, Barbados, Guyana, Jamaica, St. Kitts, Trinidad and Tobago). Other important export crops are coca (Belize, Grenada, Trinidad and Tobago), citrus fruit (Bahamas, Belize, Dominica), coconuts (St. Lucia, St. Vincent), cotton (Antigua and Barbuda, Barbados), rice (Guyana, St. Kitts, Trinidad and Tobago), arrowroot (St. Vincent), coffee (Jamaica), and nutmeg (Grenada). Yields of several of these crops are sensitive to precipitation. Banana production is very sensitive to precipitation levels. In Dominica when production in above average rainfall years is compared to production during drought years there was a 17- 37% difference in the 1970s and a 53-60% difference in the 1980’s.87 Production of sugar, nutmeg, and coffee is also sensitive to precipitation levels.88 Annual precipitation requirements for these crops are in the range of 1300 to 1800 mm per year.89 86 Bruce, et al., 2000. 87 Dominica, 2001, p. xxiv. 88 Both nutmeg and banana production are positively correlated to annual precipitation (Grenada, 2000, p. xi). 89 Jamaica, 2001, Table 3-8, p. 80.

MARGAREE Consultants
37
Table 4-2
Main Agricultural Products of CARICOM Countries
Agricultural Exports
(1999 US$ million)
Principal Crops
Antigua and Barbuda $1.1 cotton bananas sugarcane Bahamas $5.0 citrus fruit vegetables poultry Barbados $40.1 sugarcane vegetables cotton Belize $58.2 bananas coca citrus fruit Dominica $36.4 bananas citrus fruit Grenada $10.0 bananas coca nutmeg Guyana $86.0 sugarcane rise wheat Jamaica $195.9 sugarcane bananas coffee St. Kitts $10.7 sugarcane rice yams St. Lucia $70.3 bananas coconuts vegetables St. Vincent $57.6 bananas coconuts potatoes Trinidad and Tobago $135.0 cocoa sugarcane rice Climate change is expected to change the precipitation patterns with less rain during the rainy season and more rain during the dry season. In addition more of the rain is expected to fall during heavy rain days. Since production of all of the main crops of CARICOM countries is sensitive to precipitation, these changes could affect production. The impact could be to reduce or increase output depending upon the sensitivity of the crop to the timing of the precipitation. Climate change also implies higher atmospheric concentrations of CO2. Higher CO2 concentrations can increase growth for some plants. In contrast, doubling of carbon dioxide concentration in the atmosphere could see a 20 -40 % decrease in sugar yield.90 The literature reviewed did not provide a basis for estimating the loss of agricultural output due to climate change. An alternative approach is to estimate the added cost of irrigation to maintain output in the face of changes to precipitation patterns. The literature reviewed also did not include a basis for estimating the additional irrigation costs. 4.4.3 Flood Damage to Agricultural Output Climate change is projected to lead to increased rainfall on rain days, leading to more flooding. In Dominica the Layou/Carholm landslides in 1997 and 1998, in which approximately 16 ha of land were lost, caused social disruption and economic losses to farmers and other property
90 Barbados, 2001, p. x.

MARGAREE Consultants
38
owners in the area. The total loss to the agricultural sector (crops, livestock, equipment and infrastructure) was estimated at approximately US$217,000.91 The loss per severe event is estimated to be US$0.1 million in the low scenario and US$0.25 million in the high scenario. There is no basis for this range other than the value for the high scenario being comparable to the experiences in Dominica. As in section 4.3.3, the number of severe events per year is assumed to be 1.29 for each country. The damage due to the increased amount of rain on heavy rain days is assumed to increase by 40% for both the high and low scenarios. Then the climate change impact is estimated at 40% of US$0.1 per event for 1.29 events per year in the low scenario and 40% of US$0.25 per event for 1.29 events per year in the high scenario. The damages are assumed to be the same for each country, resulting in total annual damages of US$0.6 million in the low scenario and US$1.5 million in the high scenario. These estimates of losses to the agriculture sector due to increased rainfall during heavy rains are very arbitrary. Very little evidence is available to support any estimate of climate change damage due to increased rainfall during heavy rains. It is unlikely, as well, that the increased damages would be the same for each country as is assumed. 4.5 Fisheries Fishing on most islands is largely artisinal or small-scale commercial. Hurricanes often damage fishing vessels, port facilities and other fisheries related infrastructure. The economic impacts of increased intensity of severe hurricanes are estimated in section 4.1 above.92 The focus here is the impact of climate change on the harvesting sector.93 Climate change can have an impact on revenues or fishing costs. Climate change may affect revenues from fishing indirectly through stock abundance and stock availability. Both stock abundance and availability affect the catch per unit effort and thus, for constant prices, the revenues from that effort. Fishing costs could be affected by intensification of the seasonal cycle and by any increase in the frequency of storms. Worse weather conditions in the windy season will increase costs by increasing travelling times to fishing grounds, increasing fuel costs due to rough seas, increasing labour costs due to the working conditions, increasing maintenance costs due to damage of the vessel, equipment and fishing gear. Mahon did not find any estimates of the economic impact of climate change on the harvesting sector other than hurricane damage. 91 Dominica, 2001, p. 32. 92 Mahon, 2002, p. 16 reports that the estimated schedule of recovery after a hurricane as a percentage loss of landings is as follows: 80% loss in month one; 60% in month 2, 40% in month 3; 20% in month 4; 10% in month 5; and full recovery in month 6 for an overall loss of 24.2% of the revenues from fishing in the 12 month period following the hurricane. 93 Mahon, 2002, pp. 14-16.

MARGAREE Consultants
39
Fish production would suffer if mangroves, seagrasses or coral reefs are lost due to sea-level rise and/or temperature change since those ecosystems function as nurseries and forage sites for a variety of commercially important species. While such losses are expected, their impact on fish stocks and hence on revenues and/or fishing effort have not been quantified in the literature. Grenada has observed a link between fish landings and El Niño events. In the year preceding an El Niño event fish production was reduced by 25% to 60% of the average.94 Since the future climate is expected to be more “El Niño-like” average landings could be reduced and the variability of landings could be increased. A basis for quantifying the economic impacts of such a change has not been found. The literature reviewed did not provide a basis for estimating the economic impact of climate change on the fishing industry. However, the IPCC concludes that the impacts of climate change on fisheries resources of Caribbean islands will probably be relatively minor.95 In addition, the sector is a small part of the economy of most CARICOM countries, so the impact overall economy is likely to be small. 4.6 Public Health Climate change could increase the geographical range of disease agents leading to higher incidence of tropical diseases in the Caribbean. An increase in the frequency and/or severity of extreme weather events such as hurricanes and floods is likely to lead to more deaths, injuries, and cases of infectious diseases. 4.6.1 Health Impacts of Climate Change Cuba has extensively analyzed the relationship of some tropical diseases to climate change and variability. Climate change and variability are expressed as a series of indexes that incorporate maximum and minimum temperatures, atmospheric pressure, relative humidity, water vapor pressures, rainfall, ENSO influence, and other climatic variables over all climate time scales. Relationships have been found between these climate indexes and the epidemiological patterns of:
• acute respiratory infections (ARIs); • acute diarrhoeal diseases (ADDs); • bronchial asthma (BA); • dengue (D); • meningococcal meningitis (MM); • viral hepatitis (VH); • viral meningitis (VM); and • varicella (V).
94 Grenada, 2000, p. xi. 95 IPCC, 2001.

MARGAREE Consultants
40
The number of increased cases and of increased hospital admissions and the associated costs for selected diseases are presented in Table 4-3. The estimates in the table reflect the impacts of ENSOs on health and the associated economic costs. By studying the effects of warm, dry El Niño events on incidence of disease, the Cuban scientists were able to give estimates of potential impacts of conditions with climate change as projected by several models.
Table 4-3 Increased Cases Due to Climate Change and Associated Costs for Selected Diseases, Cuba
Disease
Increased Cases
Cost of Increased
Cases
(US$, 000)
Increased Hospital
Admissions
Cost of Increased Hospital
Admissions (US$, 000)
Total Cost Increase
(000 pesos) Acute respiratory infections (ARIs)
332,615 $1,468 99,784 $1,135 $2,603
Acute diarrhoeal diseases (ADDs)
137,378 $895 41,213 $302 $1,196
Viral hepatitis (VH) 11,027 $48 3,308 $66 $113 Varicella (V) 19,353 $85 - - $85 Meningococcal meningitis
3,001 - 3,001 $80 $80
Total cost $2,496 $1,582 $4,078 Source: Ortiz Bultó, et al., 2002 and personal communications. The total cost of US$4.078 million is clearly a low estimate of the cost, since other diseases whose incidence is known to be related to climate change have not been included. This cost is equivalent to US$0.36 per person. Dr. Ortiz indicated that the estimates in Table 4-3 would apply to the temperature increases for both the low and high climate change scenarios because the difference between the two scenarios (20C or 3.30C) is minimal.96 Important differences would become apparent if other factors, such as humidity, were included in the climate scenarios. The economic cost of health impacts due to climate change in CARICOM countries is estimated at US$0.36 per person per year for both the low and high climate change scenarios. Then the total cost of the health impacts of climate change is US$2.1 million for both scenarios.
96 Personal communication, Dr. Ortiz.

MARGAREE Consultants
41
4.6.2 Health Impacts of Hurricanes and Tropical Storms Hurricanes and tropical storms cause death and injuries. Grenada was last hit by a major hurricane in 1955 (Hurricane Janet), which brought very extensive damage and resulted in the loss of over one hundred (100) lives.97 Hurricane Lenny (category 4) caused a total of 13 deaths on several Caribbean islands in 1999.98 The average number of deaths and injuries due to tropical storms and hurricanes in CARICOM countries during the past 20 years are shown in Table 4-1. Tropical storms and hurricanes are responsible for an average of 16.6 deaths and 93 injuries per year. Since the intensity of hurricanes and tropical storms is expected increase due to climate change, deaths and injuries are assumed to increase by 35% (5.8 deaths and 32.5 injuries) in the low scenario and by 135% (22.4 deaths and 125.5 injuries) in the high scenario. There is an extensive literature on the economic costs of injuries and premature deaths. However, the literature reviewed did not include such values for CARICOM countries. Thus these impacts are not expressed as economic impacts. 4.7 Historic and Ecological Resources Climate change could result in the loss of significant historic sites and ecological resources. Some of these resources, such as coral reefs and forests, have economic value as generators of tourist traffic. That value has been estimated in section 4.2 above. But these resources also have value as amenities for residents and for the ecological services they provide. A relatively large share of the historic buildings, military sites, archeological sites, geological sites and other historic resources of the CARICOM countries are located in the coastal zone.99 They may be lost or damaged due to sea level rise or increased hurricane intensity. The Bahamas has one of the most diverse and extensive coral reef systems of the region, with over 2,300 km2 of healthy coral reefs.100 Barbados has an estimated 4.9 km2 of bank reefs and an estimated 1.4 km2 of fringing reefs located on the west, south west, south east, east and the north of the island.101 Data on coral reef area are provided in Table A-1.102 Coral reefs are currently 97 Grenada, 2000, p. xi. 98 NOAA, 1999. 99 Grenada, 2000, p. 26. 100 Bahamas, 2001, p. 46. 101 Barbados, 2001, p. xii. 102 Data, except for Guyana, are from Global Coral Reef Monitoring Network (GCRMN). For the other countries the reef area per km of shoreline is 0.90 km2. This ratio is used to estimate the reef area for Guyana. http://www.reefbase.org/threats/thr_climate.asp?country=IDN

MARGAREE Consultants
42
growing precariously close to their maximum temperature tolerance of 30oC. Therefore, even small increases in temperature are expected to have detrimental effects.103 An Indonesian study estimates the fraction of coral reefs at risk due to climate change at 0.30.104 The loss of coral reefs due to climate change is estimated to be 15% for the low scenario and 30% for the high scenario.105 The total reef area estimated to be lost due to climate change is almost 1,100 km2 in the low scenario and 2,200 km2 in the high scenario. The biodiversity value of coral reefs for Montego Bay was estimated at US$893,000 per ha per year or US$89.3 million per km2 per year.106 If applied to the area of coral reefs assumed to be lost in the twelve CARICOM countries, this would result in an annual value of approximately US$95 billion in the low scenario and US$195 billion in the high scenario. The annual GDP of the twelve countries is US$26 billion, so the estimated value of the coral reef damage would be several times larger than the total GDP. Because the value appears unrealistically large, it is not used. The annual value of coral reefs for Fiji and Kiribati has been estimated at US$145 to $290 per hectare.107 Using these values, the annual value of coral reef damage due to climate change is estimated at US$16 million for the low case and US$63 million for the high case. Over 150 bird species, 17 reptiles, 9 mammals and 4 amphibians are found in the terrestrial environment of St. Lucia.108 Dominica is host to the most diverse assemblage of wildlife species remaining in the eastern Caribbean.109 Under the high temperature scenarios elfin woodlands could disappear completely, and some species unique to Dominica could be lost.110 Under the climate change scenarios analyzed there would be little or no mangroves in Antigua by 2075.111
103 Antigua and Barbuda, 2001 p. 40. 104 Hopley and Suharsono, 2000. 105 The Global Coral Reef Monitoring Network reports the fraction of coral reefs at risk from all factors. All of the coral reefs are at risk in seven of the CARICOM countries while for the other four countries where data are available the fraction ranges from 0.49 to 0.99. 106 Ruitenbeek and Cartier, 1999. 107 Stratus Consulting, 2000, reports values of $333 to $660/ha in 1998 Fiji dollars, which are converted to 1999 US$145 to $290 per ha. 108 St. Lucia, 2001, p. 7. 109 Dominica, 2001, p. xiv. 110 Dominica, 2001, p. 31. 111 Antigua and Barbuda, 2001, p. 39.
MARGAREE Consultants
43
Sea grass has been valued at $86,000 per acre based in part on its protective processes as well as biodiversity values.112 Unfortunately, no estimates of the area of sea grass are available so it is not possible to estimate the fraction lost due to climate change and hence the loss of value. The value to St. Lucia residents of having free beach access for six months of the year has been estimated from the cost and time of transportation to and from the beach and frequency of use. The numbers vary widely according to the beach’s proximity to an urban area: EC$2,695,000 loss for beach closure close to urban population and EC$168,000 to 580,000 for others further away, (these are lower bound estimates). Upper bound estimates are EC$3,371,000 and between 78,000 and 217,000 respectively.113 These values correspond to approximately US$35,000 and $50,000 per hectare of beach in St. Lucia. When these values are applied to the area of beaches lost, the annual value to residents is over US$13 million in the low scenario and just over US$150 million in the high scenario (between $2 and $25 per capita). 4.8 Summary The estimates of the potential economic impact due to climate change for CARICOM countries are summarized in Table 4-4. The potential economic impact is estimated at between 1999 US$1.4 to $9.0 billion assuming no adaptation to climate change. In practice adaptation will occur, so the cost of climate change will be lower than the high end of this range. The estimate is based on limited data and numerous assumptions and hence is only a very rough initial estimate of the potential economic impact of climate change. The wide range for the estimate of potential impact ($1.4 to $9.0 billion) is due more to the uncertainty relating to the values and assumptions used than to the uncertainty about climate change. This estimate of potential economic impact of climate change should be used with great care because it does not reflect possible adaptation to climate change and because of the uncertainty in the data and assumptions. Those cautions apply with even greater force to the estimates for specific categories of impacts and for individual countries. Estimates are often based on data for a single country, which may not be correct for other countries. In the low scenario the total impact averages about 5.6% of GDP (ranging between 3.5% in Trinidad and Tobago and 16% in Guyana). In the high scenario the total impact averages over 34% of GDP (ranging between 22% in Trinidad and Tobago and 103% in Guyana). The relatively low impact in Trinidad and Tobago is due to its limited vulnerability to hurricanes and the relatively small size of its tourist industry. The relatively high impact in Guyana appears to be at least partly due to its relatively low per capita GDP. The impacts may appear high because (1) they do not consider, with one small exception, possible adaptation to climate change to reduce the damages, (2) future climate change impacts
112 Jamaica, 2001, p. 73. 113 Strand, et al. 2002, Table 3.4.

MARGAREE Consultants
44
are related to current GDP -- the future GDP may be less sensitive to climate change, and (3) some components of the economic impact, such as the value of land lost and amenity value of beaches for residents, are not part of GDP, which makes the estimated impacts appear higher relative to GDP. On the other hand, some categories of climate change impacts, such as the loss of agricultural and fisheries output and loss of some historical resources, could not be calculated. The largest category of impacts is the loss of land, tourism infrastructure, housing, other buildings and infrastructure due to sea level rise. Those losses represent 65% to 75% of the total economic damages. Most of the remaining impacts are due to reduced tourism demand due to rising temperatures and loss of beaches, coral reefs and other ecosystems. Those impacts represent 15% to 20% of the total impacts estimated. Property damage due to the increased intensity of hurricanes and tropical storms accounts for 7% to 11% of the estimated impacts. The increased intensity of hurricanes and tropical storms may also lead to more injuries and deaths. The impacts that could not be estimated and the relative size of the impacts estimated suggest where efforts can be focused to improve the quality of the estimates. The impacts on agriculture are potentially significant for CARICOM countries. To estimate these impacts requires information on the response of yields for each of the main crops to changes in precipitation and temperature. Since the main crops are exported, analysis of the impacts also requires a global model of demand and supply of agricultural products to estimate price changes for exports and imports. The estimates of potential impacts are dominated by land and infrastructure lost due to sea level rise. Country-specific information on the land and infrastructure vulnerable to different degrees of sea level rise would yield much better estimates of these potential losses.

MARGAREE Consultants
45
Table 4-4. Economic Impact of Climate Change in the Caribbean (1999 US$ million)
(components may not sum to the total due to rounding)
Economic impacts
Ant
igua
&
Bar
buda
Bah
amas
Bar
bado
s
Bel
ize
Dom
inic
a
Gre
nada
Guy
ana
Jam
aica
St. K
itts
St. L
ucia
St. V
ince
nt
Trin
idad
&
Toba
go
CA
RIC
OM
LOW CASE HURRICANE DAMAGE
$30.5
$19.8
$7.1
$7.7
$0.8
$0.2
$2.6
$37.6
$9.4
$41.7
$1.0
-
$158.3
TOURISM Reduced tourism $10.0 $54.6 $23.4 $3.9 $1.7 $2.1 $1.8 $44.2 $2.4 $10.7 $2.7 $6.9 $164.5 Loss of beaches $5.2 $28.5 $12.2 $0.8 $0.3 $1.1 $0.4 $23.0 $1.3 $5.6 $1.4 $3.6 $83.4 Facility replacement $0.9 $2.8 $1.2 $0.1 $0.1 $0.5 - $1.5 $0.7 $0.6 $0.3 $0.4 $9.1 Lost dive-, eco-tourism $0.5 $2.7 $1.2 $2.1 $0.9 $0.1 $1.0 $2.2 $0.1 $0.5 $0.1 $0.4 $11.9 Total $16.6 $88.6 $38.0 $6.9 $3.0 $3.8 $3.2 $70.9 $4.5 $17.4 $4.5 $11.3 $268.9 INFRASTRUCTURE Loss of land $0.6 $13.8 $0.4 $1.5 $0.6 $0.5 $1.8 $3.5 $0.5 $0.6 $0.3 $2.8 $26.8 Housing replacement $3.1 $11.1 $14.4 $10.6 $3.7 $4.1 $29.0 $113.8 $2.3 $9.6 $6.0 $66.5 $274.5 Other buildings $6.1 $21.6 $28.1 $20.8 $7.2 $7.9 $56.6 $222.0 $4.6 $18.8 $11.8 $129.7 $535.2 Roads, etc. $1.7 $6.0 $7.9 $5.8 $2.0 $2.2 $15.8 $62.0 $1.3 $5.2 $3.3 $36.2 $149.6 Reduced water supply $0.5 $2.0 $1.8 $0.6 $4.9 Flood damage $0.1 $0.1 $0.1 $0.1 $0.1 $0.1 $0.1 $0.1 $0.1 $0.1 $0.1 $0.1 $0.6 Total $12.1 $54.6 $52.7 $38.8 $13.6 $15.4 $103.3 $401.4 $8.8 $34.3 $21.5 $235.3 $991.6 AGRICULTURE Loss of production Flood damage $0.1 $0.1 $0.1 $0.1 $0.1 $0.1 $0.1 $0.1 $0.1 $0.1 $0.1 $0.1 $0.6 Total $0.1 $0.1 $0.1 $0.1 $0.1 $0.1 $0.1 $0.1 $0.1 $0.1 $0.1 $0.1 $0.6 FISHERIES Loss of production

MARGAREE Consultants
46
PUBLIC HEALTH Illness - $0.1 $0.1 $0.1 - - $0.3 $0.9 - $0.1 - $0.5 $2.2 Hurricane deaths (no.) 0.16 0.14 0 1.35 0.11 0 0.18 2.72 0.12 0.86 0.07 0.12 5.82 Hurricane injuries (no.) 7.28 0 0 23.28 0.02 0 0 0 1.23 0 0.74 0 32.54 Total - $0.1 $0.1 $0.1 - - $0.3 $0.9 - $0.1 - $0.5 $2.2 ECOSYSTEMS Beaches $0.8 $6.7 $0.2 $0.7 $0.2 $0.2 $0.8 $1.7 $0.2 $0.2 $0.2 $1.3 $13.3 Coral Reefs $0.5 $6.8 $0.2 $2.9 $0.2 $0.3 $0.8 $2.7 $0.4 $0.4 $0.3 $0.2 $15.8 Total $1.3 $13.5 $0.4 $3.6 $0.4 $0.5 $1.6 $4.4 $0.6 $0.6 $0.5 $1.5 $32.1 OTHER IMPACTS TOTAL IMPACT (US$1999)
$60.6 $176.7 $98.1 $57.0 $18.0 $20.2 $111.0 $515.2 $23.4 $94.2 $27.7 $248.7 $1,450.6
TOTAL IMPACT (US$2000)
$62.0 $180.8 $100.4 $58.3 $18.4 $20.5 $113.6 $526.9 $23.9 $96.3 $28.3 $254.4 $1,483.7
GDP (US$2000) $688 $4,800 $2,600 $826 $270 $$10 $712 $7,400 $314 $707 $333 $7,300 $26,360 Impact as % of GDP 9.0% 3.8% 3.9% 7.1% 6.8% 5.0% 16.0% 7.1% 7.6% 13.6% 8.5% 3.5% 5.6% Note: - indicates a value less than US$0.05 million
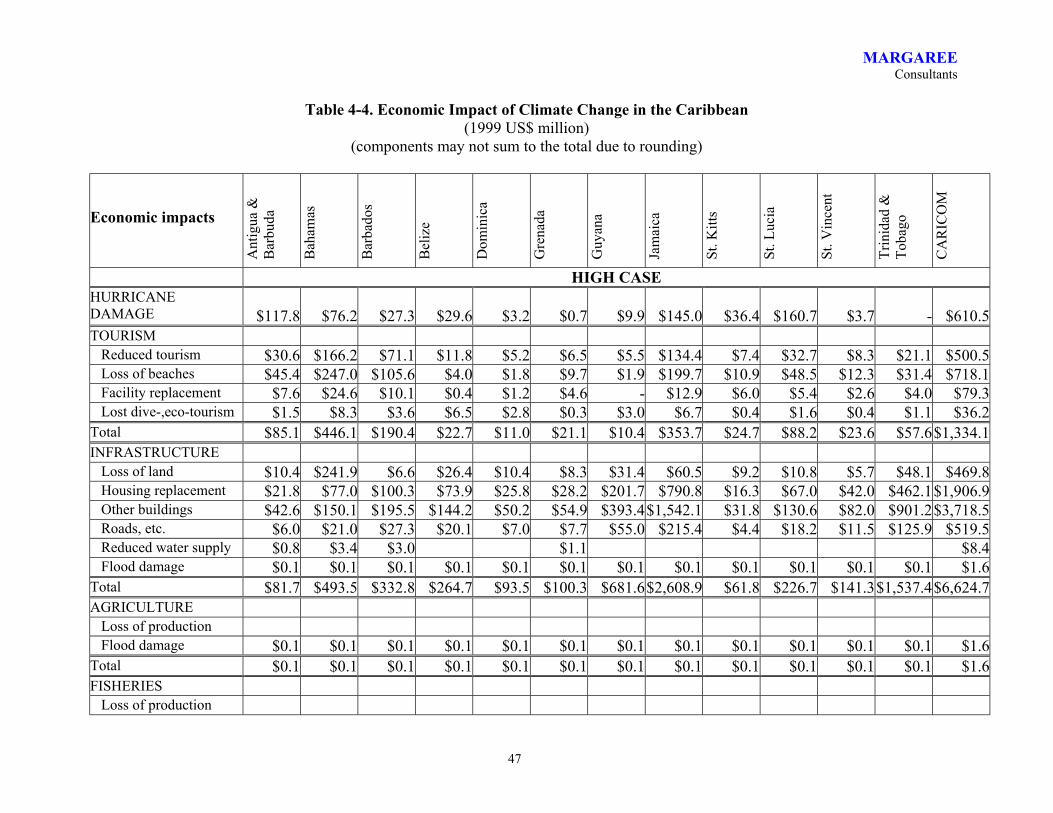
MARGAREE Consultants
47
Table 4-4. Economic Impact of Climate Change in the Caribbean (1999 US$ million)
(components may not sum to the total due to rounding)
Economic impacts
Ant
igua
&
Bar
buda
Bah
amas
Bar
bado
s
Bel
ize
Dom
inic
a
Gre
nada
Guy
ana
Jam
aica
St. K
itts
St. L
ucia
St. V
ince
nt
Trin
idad
&
Toba
go
CA
RIC
OM
HIGH CASE HURRICANE DAMAGE
$117.8
$76.2
$27.3
$29.6
$3.2
$0.7
$9.9
$145.0
$36.4
$160.7
$3.7
-
$610.5
TOURISM Reduced tourism $30.6 $166.2 $71.1 $11.8 $5.2 $6.5 $5.5 $134.4 $7.4 $32.7 $8.3 $21.1 $500.5 Loss of beaches $45.4 $247.0 $105.6 $4.0 $1.8 $9.7 $1.9 $199.7 $10.9 $48.5 $12.3 $31.4 $718.1 Facility replacement $7.6 $24.6 $10.1 $0.4 $1.2 $4.6 - $12.9 $6.0 $5.4 $2.6 $4.0 $79.3 Lost dive-,eco-tourism $1.5 $8.3 $3.6 $6.5 $2.8 $0.3 $3.0 $6.7 $0.4 $1.6 $0.4 $1.1 $36.2 Total $85.1 $446.1 $190.4 $22.7 $11.0 $21.1 $10.4 $353.7 $24.7 $88.2 $23.6 $57.6 $1,334.1 INFRASTRUCTURE Loss of land $10.4 $241.9 $6.6 $26.4 $10.4 $8.3 $31.4 $60.5 $9.2 $10.8 $5.7 $48.1 $469.8 Housing replacement $21.8 $77.0 $100.3 $73.9 $25.8 $28.2 $201.7 $790.8 $16.3 $67.0 $42.0 $462.1 $1,906.9 Other buildings $42.6 $150.1 $195.5 $144.2 $50.2 $54.9 $393.4 $1,542.1 $31.8 $130.6 $82.0 $901.2 $3,718.5 Roads, etc. $6.0 $21.0 $27.3 $20.1 $7.0 $7.7 $55.0 $215.4 $4.4 $18.2 $11.5 $125.9 $519.5 Reduced water supply $0.8 $3.4 $3.0 $1.1 $8.4 Flood damage $0.1 $0.1 $0.1 $0.1 $0.1 $0.1 $0.1 $0.1 $0.1 $0.1 $0.1 $0.1 $1.6 Total $81.7 $493.5 $332.8 $264.7 $93.5 $100.3 $681.6 $2,608.9 $61.8 $226.7 $141.3 $1,537.4 $6,624.7 AGRICULTURE Loss of production Flood damage $0.1 $0.1 $0.1 $0.1 $0.1 $0.1 $0.1 $0.1 $0.1 $0.1 $0.1 $0.1 $1.6 Total $0.1 $0.1 $0.1 $0.1 $0.1 $0.1 $0.1 $0.1 $0.1 $0.1 $0.1 $0.1 $1.6 FISHERIES Loss of production

MARGAREE Consultants
48
PUBLIC HEALTH Illness - $0.1 $0.1 $0.1 - - $0.2 $0.9 - $0.1 - $0.5 $2.2 Hurricane deaths (no.) 0.63 0.54 - 5.20 0.41 - 0.68 10.48 0.47 3.31 0.28 0.45 22.44 Hurricane injuries (no.) 28.08 - - 89.78 0.08 - - - 4.73 - 2.84 - 125.50 Total - $0.1 $0.1 $0.1 - - $0.2 $0.9 - $0.1 - $0.5 $2.2 ECOSYSTEMS Beaches $8.6 $76.5 $2.1 $8.3 $2.4 $2.4 $9.9 $19.1 $2.6 $2.2 $2.4 $15.2 $151.7 Coral reefs $2.1 $27.4 $0.9 $11.6 $0.9 $1.3 $3.2 $10.8 $1.6 $1.4 $1.2 $0.9 $63.2 Total $10.7 $103.9 $3.0 $19.9 $3.3 $3.7 $13.1 $29.9 $4.2 $3.6 $3.6 $16.1 $214.9 OTHER IMPACTS TOTAL IMPACT (US$1999)
$295.3 $1,119.9 $553.8 $337.2 $111.2 $126.0 $715.4 $3,138.6 $127.2 $479.4 $172.4 $1,611.6 $8788.0
TOTAL IMPACT (US$2000)
$302.1 $1,145.5 $566.4 $344.9 $113.7 $128.9 $731.7 $3,210.3 $130.1 $490.4 $176.3 $1,648.4 $8,988.7
GDP (US$2000) $688 $4,800 $2,600 $826 $270 $$10 $712 $7,400 $314 $707 $333 $7,300 $26,360 Impact as % of GDP 43.9% 23.9% 21.8% 41.8% 42.1% 31.4% 102.8% 43.4% 41.4% 69.4% 53.0% 22.6% 34.1% Note: - indicates a value less than US$0.05 million
MARGAREE Consultants
49
5. Potential Adaptation Measures The estimates developed in Chapter 4, with one small exception, assume no action is implemented to reduce the damage where this is possible. Adaptation to climate change will occur. Adaptation measures may be planned; providing coastal protection for low-lying areas or designing buildings to withstand stronger hurricanes, for example. Or adaptation may be unplanned; reconstructing buildings and infrastructure lost due to sea level rise. Adaptation to climate change is possible, indeed unavoidable, in many cases. Adaptation measures, whether planned or unplanned, have costs. In principle, adaptation measures should be implemented where they cost less than the damage reduced. Coastal protection, for example, may be cost-effective for low-lying settlements but not for vacant land. Planning may also reduce adaptation costs; locating new buildings and infrastructure outside low-lying coastal areas can reduce the cost of adapting to sea level rise. The specific manifestations of climate change impacts and their relative importance vary by country. Likewise the opportunities to adapt to climate change and the potential to reduce climate change impacts vary by country. The CPACC project has been assisting each participating Caribbean country with the formulation of a National Climate Change Adaptation Policy and Implementation Plan. Just as the focus of the previous chapter was quantitative estimates of climate change impacts, the focus of this chapter is quantitative estimates of adaptation measures. Very little quantitative information is available. Some information is available on the costs of coastal protection, reduction of hurricane damage, desalination to replace reduced freshwater supplies, and restoration of ecosystems. 5.1 Coastal Protection Strategies to deal with sea-level rise include shoreline protection, gradual replacement of infrastructure in non-threatened locations, mandatory building setbacks in coastal areas, geographic diversification of economic activities, and resettlement. When the combined effects of coastal land loss, increased flooding, salinization, and infrastructure damage are contemplated, some resettlement of coastal populations seems inevitable in many Caribbean island states. Antigua and Barbuda’s coastal zone adaptation strategies include protective measures to restore beach and/or protect property. These include periodic beach nourishing, dune restoration and, in some cases, replenishment of beach loss due to littoral drift.114 The cost of sea defences varies widely with the nature of the measures, ranging from about US$10,000 per km for beach nourishment, to US$75,000 for beach nourishment including groyne, to US$1,700,000 per km
114 Antigua and Barbuda, 2001, p. 41.

MARGAREE Consultants
50
for berm-type revetment sea wall, and to US$4,800,000 to $6,100,000 per km for submerged crest breakwaters.115 The IPCC estimated the cost to the Caribbean of protecting against a 1 m sea level rise by the year 2100 at US$11.1 billion in 1990 ($13.43 billion 1999 US$).116 This cost is approximately US$2,000 to US$2,500 per capita, but it varies widely across countries being US$197 per person in Jamaica for example.117 The IPCC also expressed the cost as 0.20% of GNP annually over the 110 years. If it is assumed that facilities have a 30 year life the annual cost is approximately 5% of current GDP. The value of land, buildings and infrastructure estimated to be lost due to sea-level rise is US$2.2 million per km of coastline in the low case and $15.0 million in the high case. Clearly, there will be sections of the coastline in many of the CARICOM countries where the cost of coastal protection is less than the value of the facilities at risk. And since sea-level rise will occur slowly over a very long time, measures such as gradual replacement of infrastructure in non-threatened locations, mandatory building setbacks in coastal areas can reduce adaptation costs significantly. 5.2 Reduction of Hurricane Damage Many CARICOM countries are vulnerable to damage due to the increased intensity of hurricanes and tropical storms. Buildings and infrastructure can be built stronger to minimize hurricane damage. This increases the initial cost. The incremental initial investment should be weighed against the cost of replacement in the rare case of major damage due to a hurricane. An ex post analysis of this approach has been prepared for Port Zante in St. Kitts and Nevis, which was severely damaged by hurricanes Georges and Lenny.118 The original construction cost of Port Zante was US$22.5M. The damage caused by hurricane Georges was US$10.1M of which insurance payments for material damage and business interruption amounted to US$8.1M. Reconstruction was begun but was interrupted by hurricane Lenny. Damage caused by that event amounted to US$14.1M, with the insurance paying out US$11.7M. The cost of reconstruction following Lenny is estimated at US$26.2M. Assuming a cost of reconstruction of US$4.0M after Georges, the government of St. Kitts & Nevis will have spent a total of US$32.9M on construction and reconstruction, net of insurance receipts. This amounts to US$10.4M more than the original construction cost. In addition, the Port could have attracted an additional 50 vessels per year, representing around US$0.3M in
115 EC$4500.00 per meter, Grenada, 2000, p. 63. 116 IPCC, 1990, Table 5. 117 Jamaica, 2001, p. 72. 118 World Bank, 2000, prepared by Jan C. Vermeiren.

MARGAREE Consultants
51
docking and landing fees, and at least US$2.0M in expenditures in the local economy by passengers and crew during the four years the port has been under reconstruction. Good practice in building port facilities in the Caribbean is to design the structures to withstand the 1 in 50 year storm. Information on the design standard used for the original construction of Port Zante is not available. The peak significant wave height at the location of Port Zante was estimated at 7.0m for hurricane Georges and 6.6m for hurricane Lenny.119 These estimates are within the range corresponding to a 50 year wave for the location.120 The pier in Plymouth, Montserrat, which was designed for a 50 year wave and was built in 1993, had some exposure to hurricanes Georges and Lenny has not suffered any damage to date. Thus if Port Zante had been built to withstand a 50 year wave, it is likely that it would not have suffered significant damage from either hurricane Georges or Lenny. Without a thorough review of the actual design specifications and original construction documents it is not possible to provide an accurate estimate of the incremental cost of designing the facility to withstand a 50 year wave, but experience in similar projects throughout the region puts this cost increase in the 10 to 15% range, or around US$3.0M. This is less than one third of the net additional cost for rebuilding the port, and only slightly more than the additional yearly income a fully operational Port Zante would have generated. The risk of significant hurricane damage varies widely throughout the region. Climate change is expected to increase the intensity of hurricanes, which increases the damage exponentially. This suggests that design standards should be reviewed to ensure that they are appropriate for more intense hurricanes. Since hurricanes are expected to become more intense, it is difficult to determine the design standard appropriate for future storms. However, where the incremental capital cost of buildings and infrastructure is small relative to the cost of replacement and loss of business they should be built to withstand more intense hurricanes. 5.3 Replacing Reduced Freshwater Supplies Climate change may reduce the supply of potable water due to saltwater intrusion into the freshwater lens and lower recharge of the freshwater lens due to a combination of lower total rainfall and more heavy rains, which run off quickly. While some of the CARICOM countries have abundant water supplies, others are already experiencing shortages. Various options have been suggested for minimizing the effects of climate change on freshwater resources. Options for small island states include: harvesting of rainwater, more efficient and extensive use of surface water, artificial recharge of aquifers with rainwater or treated wastewater, and more efficient management of existing supplies and associated infrastructure.
119 Results of a numerical model simulation of hurricanes Georges and Lenny carried out by Watson Technical Consulting for the OAS, 2001. 120 The 50 year significant wave height for the location of Port Zante is 5.99m MLE, or 8.91m at the 90% projection limit.

MARGAREE Consultants
52
Desalination, although expensive, is becoming an increasingly attractive option and is already being used in a few CARICOM countries. The economic impact of reduced fresh water supplies was estimated as the incremental cost of desalination because a value for freshwater was not readily available. In this case, then, the adaptation cost was used as an estimate of the economic impact. The incremental cost for desalination in the four countries affected is between US$4.9 and US$8.4 million per year depending upon the climate change scenario. Other options, such as harvesting rain water, recycling wastewater, and more efficient management of existing supplies might reduce the adaptation costs. 5.4 Adaptive Measures for Flooding from Heavy Rainfall The projected increase in variability of precipitation caused by climate change is expected to cause an increase in the frequency and severity of flooding due to heavy rainfall. The stormwater management system used in Brookswood, British Columbia is designed to provide adequate drainage of water for 5-100 year storm events.121 The system also provides water quality and recharge benefits through a stormwater infiltration process. Development costs for this particular project amounted to US$7,076 or $0.53 per capita. Extrapolation on a per-capita basis to all of the CARICOM countries leads to an estimated total cost of US$3.1 million. The damage estimate for the high scenario is roughly half this amount, although based on very limited data. In practice, flood damage due to heavy rains is likely to be concentrated is particular areas and stormwater management systems to reduce the damage are likely to be cost-effective in at least some of those areas. 5.5 Adaptation in Agriculture and Fisheries Yields for the main crops of CARICOM countries are sensitive to precipitation. Climate change may lower total rainfall and soil moisture and cause heat stress. Farmers can adapt by switching to drought- and heat-resistant varieties of these crops, switching to different crops, and by irrigating their crops. However, in some countries climate change may limit the freshwater supplies available for irrigation. The adverse effects of climate change on fish stocks can be minimized by focusing on conservation, restoration and enhancement of vital habitats such as mangroves, coral reefs and seagrass beds; establishment of marine reserves and protected areas for critical species.
121 Taylor, 2000.

MARGAREE Consultants
53
5.6 Restoration of Ecosystems Climate change is expected to damage many ecosystems in the Caribbean including coral reefs, mangroves, forests and sea grass. In many cases measures can be implemented to protect the ecosystems, help species migrate in response to climate change and habitat shifts, or restore damaged ecosystems. The only cost estimate uncovered for such actions is a $500 per acre estimate for restoration of sea grass in Jamaica where sea grass has been valued at $86,000 per acre based in part on its protective processes as well as biodiversity values.122 5.7 Conclusions A substantial part of the potential economic impact of climate change is due to loss of facilities due to sea level rise and hurricanes. Such losses would occur over decades. Adaptation will occur in response to, or in anticipation of, such damage. Adaptation incurs costs, but planned adaptation can reduce the costs. Since climate change will occur over several decades, this time can be used to reduce the risk of damage. The potential losses can be significantly reduced by building in locations not vulnerable to sea level rise and storm surges, by building facilities to withstand hurricanes and storm surges, and building sea defences. The adverse effects of climate change on agriculture can be mitigated by switching to drought- and heat-resistant varieties of the existing crops, switching to different crops, and by irrigating crops where sufficient freshwater supplies are available. The adverse effects of climate change on fish stocks can be minimized by focusing on conservation, restoration and enhancement of vital habitats. Damage to natural ecosystems can also be reduced by protecting the ecosystems, helping species migrate in response to climate change and habitat shifts, and restoring damaged ecosystems. The available information on the costs of adaptation measures for CARICOM countries is very sparse. It is clear that adaptation will cost less than the potential damages for at least some of the impacts of climate change, but it is not possible to calculate the reduction in damages and cost of adaptation measures from the available information. Thus, the cost of climate change will be lower than the high end of the range of potential damages estimated in Chapter 4.
122 Jamaica, 2001, p. 73.
MARGAREE Consultants
54
References Antigua and Barbuda, 2001. Antigua and Barbuda’s Initial National Communication on Climate Change, Office of the Prime Minister, St. John’s, Antigua and Barbuda, May. Auffret, Philippe, 2002. Catastrophe Insurance Market in the Caribbean Region: Market Failures and Recommendations for Public Sector Interventions, Report No. 22091-LAC, World Bank, Washington, D.C., June 28. Bahamas, 2001. First National Communication on Climate Change Submitted to the Secretariat of the United Nations Framework Convention on Climate Change for Presentation to the Conference of Parties, The Bahamas Environment, Science and Technology Commission, Commonwealth of Bahamas, Nassau, The Bahamas, April. Barbados, 2001. Barbados' First National Communication to UN Framework Convention on Climate Change, Government of Barbados, St. Michael, Barbados, October. Bruce, J.P., Burton, I., Martin, H., Mills, B., and Mortsch, L., June 2000. Canadian Water Sector: Vulnerability and Adaptation to Climate Change. CCAF-NRCan project, website: www.gcsi.ca Clark, K.M., 1997. Current and Potential Impact of Hurricane Variability on the Insurance Industry, in Hurricanes, Climate and Socio Economics Impacts, eds. Diaz, H.F., Pulwartry, R.S., Springer Publishing. Darwin, Roy, M. Tsigas, J. Lewandrowski, and A. Raneses, 1995, "World Agriculture and Climate Change, Economic Adaptations", Agricultural Economic Report Number 703, United States Department of Agriculture, Washington, D.C. Dominica, 2001. Initial National Communication Under the United Nations Framework Convention on Climate Change, Ministry of Agriculture and the Environment, Commonwealth of Dominica, Roseau, November. Douglas, B.C., Kearney, M.S., Leatherman, S.P., 2001. Sea level rise, history and consequences, International Geophysics Series #75, Academic Press 232 p. Gray, C.R., 1993. "Regional meteorology and hurricanes," in G.A. Maul, ed., Climatic Change in the Intra-Americas Sea, Edward Arnold, London, pp. 87-99. Grenada, 2000. Grenada’s Initial Communication to the UNFCCC, Department of Health and the Environment, Grenada, October. Hopley, D. and L. Suharsono, 2000. "The Status of Coral Reefs in Eastern Indonesia." mimeo. Houghton, J.T., Y. Ding, D.J. Griggs, M. Nouger, P.J. van der Linden, X. Dai, K. Maskell and C.A. Johnson, eds., (IPCC) 2001. Climate Change 2001: The Scientific Basis, Cambridge University Press, Cambridge.

MARGAREE Consultants
55
Intergovernmental Panel on Climate Change (IPCC), 1990. Strategies for Adaptation to Sea-level Rise - Report of the Coastal Zone Management Sub-group, Geneva, November. Intergovernmental Panel on Climate Change (IPCC), 2001. Climate Change 2001: Synthesis Report, Intergovernmental Panel on Climate Change, Geneva. Jamaica, 2001. Initial National Communication of Jamaica, Kingston, Jamaica. Kharin, V.V. and Zwiers, F.W., 2000. "Changes in extremes in an ensemble of transient climate simulations with a coupled atmosphere ocean GCM," Journal of Climate, 13:21, 3760-3788. Knutson, T.R., R.E. Tuleya, W. Shen and I Ginis, 2001. "Impacts of CO2 Induced Warming on Hurricane Intensities Simulated in a Hurricane Model with Ocean Coupling," Journal of Climate, 14, 11 pp. 2458-2468. Lal, M., Horawa, H., Takabashi, K., 2001. "Future climate change and its impact over small island states," Climate Research. Leatherman, S.P., (ed.), 1997. "Island states at risk," Journal of Coastal Research, Special Issue 24, 242 p. Lindberg, K. and J. Enriquez, 1993. "An Analysis of Ecotourism's Economic Contribution to Conservation and Development in Belize: Volume I, Summary Report," World Wildlife Fund , Belize Ministry of Tourism and the Environment, Belize, December. Lise, Wietze and Richard S.J. Tol, 2001. "Impact of climate on tourist demand," Nota di Lavoro 48.2001, Fondazione Eni Enrico Mattei, Milan, June. Mahon, Robin, 2002. "Adaptation of Fisheries and Fishing Communities to the Impacts of Climate Change in the CARICOM Region," Issues paper prepared for CARICOM Fisheries Unit, Belize City, Belize, May. Marland, Gregg, Tom Boden and Robert J. Andres, 2001. National CO2 Emissions from Fossil-Fuel Burning, Cement Manufacture, and Gas Flaring: 1751-1998, Carbon Dioxide Information Analysis Center, Oak Ridge National Laboratory, Oak Ridge, Tennessee, July. http://cdiac.esd.ornl.gov/ftp/ndp030/global98.ems Martin, H., and Weech, P., 2001. "Effects of climate change: hydrometeorological and land-based effects in the Bahamas," The Bahamas Journal of Science. NOAA, 1999. Hurricane Lenny. http://www.ncdc.noaa.gov/ol/climate/extremes/1999/november/extremes1199.html Nurse, L.A., R.F. McLean and A.G. Suarez, 1998. "Small Island States," Chapter 9 in R.T. Watson, M.C. Zinyowera, R.H. Moss and D.J. Dokken, eds., The Regional Impacts of Climate
MARGAREE Consultants
56
Change: As Assessment of Vulnerability, Working Group II of the Intergovernmental Panel on Climate Change, Cambridge University Press, Cambridge, pp. 331-354. Nurse, L.A., G. Sem, J.E. Hay, A.G. Suarez, Poh Poh Wong, L. Briguglio, and S. Ragoonaden, 2001. "Small island states," Chapter 17 in J.J. McCarthy, O.F. Canziani, N.A. Leary, D.J. Dokken and K.S. White, eds., Climate Change 2001: Impacts, Adaptation, and Vulnerability, Working Group II of the Intergovernmental Panel on Climate Change, Cambridge University Press, Cambridge, pp. 843-875. Ortiz Bultó, Paulo L., et al., 2002. " Impacts of Climate Change and Variability on Some Diseases in the Tropical Region and Examples of the Strategies for Adaptation," Climate - Health Group, PNCT Project, Cuba. Reilly, J., N. Hohmann and S. Kane, 1994. "Climate change and agricultural trade: who benefits and who loses?", Global Environmental Change, v. 4, n. 1, pp. 24-36. Rolle, A.W., et al., 1990. "A storm surge atlas for Northern and Central Bahamas," National Weather Service, 21 p. plus Appendix. Rosenzweig, Cynthia and Martin L. Parry, 1994. "Potential Impact of Climate Change on World Food Supply," Nature, 367, pp. 133-138. Ruitenbeek, J. and C. Cartier, 1999. "Issues in Applied Coral Reef Biodiversity Valuation: Results for Montego Bay, Jamaica," H.J. Ruitenbeek Resource Consulting Limited, Gabriola Island, B.C., March. St. Kitts. St. Kitts-Nevis Initial National Communication, St. Kitts-Nevis. St. Lucia, 2001. Saint Lucia's Initial National Communication on Climate Change, Ministry of Planning, Development, Environment & Housing, Castries, St. Lucia. St. Lucia, 2002. St. Lucia Policy and Strategy for Planning for and Adapting to Climate Change, Ministry of Planning, Development, Environment & Housing, Castries, St. Lucia. St. Vincent, 2000. Initial National Communication on Climate Change St. Vincent and the Grenadines, National Environmental Advisory Board and Ministry of Health and the Environment, St. Vincent, November. Strand, Ivar, and G. Dharmaratne, 2002. "Adaptation to Climate Change in the Caribbean: The Role of Economic Valuation", Department of Agricultural and Resource Economics, University of Maryland, College Park, Maryland. Stratus Consulting Inc., 2000. "Economic Implications of Climate Change in Two Pacific Island Country Locations: Case Illustrations of Tarawa, Kiribati, and Vitu Levu, Fiji." Prepared by Stratus Consulting, Inc. for World Bank, Pacific Region under subcontract to CICERO, Oslo, Norway. March 2000.
MARGAREE Consultants
57
Taylor, J. 2000. "Technical Bulletin: Case Study of Brookswood, Township of Langley, B.C. Alternative Stormwater Management," http://www.sustainable-communities.agsci.ubc.ca/bulletins/TB_issueBrookswood.pdf, October 2000. Trinidad and Tobago, 2001. Initial National Communication to the United Nations Framework Convention on Climate Change, Environmental Management Authority, Republic of Trinidad and Tobago, Port of Spain. World Bank, 2002. "Natural Hazard Risk Management in the Caribbean: Revisiting the Challenge," Washington, D.C., June. World Travel and Tourism Council, (WTTC), 2001. Tourism Satellite Accounts 2001, London: WTTC.http://www.wttc.org/ Zwiers, F.W., and Kharin, V.V., 1998. "Changes in the extremes of climate simulated by CCCGCM2 under CO2 doubling," Journal of Climate, 11.9, 2200-2222.

MARGAREE Consultants
58
Appendix A
Statistical Data

MARGAREE Consultants
1
Table A-1. Data Relating to CARICOM Countries Statistical Data
Ant
igua
&
Bar
buda
Bah
amas
Bar
bado
s
Bel
ize
Dom
inic
a
Gre
nada
Guy
ana
Jam
aica
St. K
itts
St. L
ucia
St. V
ince
nt
Trin
idad
&
Toba
go
CA
RIC
OM
Population (000s) 70 303 267 256 71 98 697 2,591 43 156 111 1,306 Persons per household 5.07 3.43 4.46 3.55 4.48 4.45 4.22 3.4 3 3.4 3.64 Land area (km2) 440 13,935 431 22,966 751 345 214,970 10,830 269 616 345 5,126 Coastline (km) 153 3,542 97 386 153 121 459 886 135 158 84 704 Exclusive economic zone (000 km2)
110
759
167
15
27
297
11
4.7
32
104
Coral reef area (km2) 240 3,150 100 1,330 100 150 370 1,240 180 160 140 100 Forest/woodland (%) 30 12 3 60 11 47 35 37 48 Agricultural land (%) 1.5 27 46 25 36 CO2 emissions, 1998 (000 mtC)
92 489 429 109 23 50 450 3,001 28 54 44 6,112 10,881
Average temperature 25.7 Winter (oC) 24 21 27 27 26 27 22.8 27 26.7 24.5 Summer (oC) 29 28 27 27 26 27 27.7 27 26.7 26.7 Number of rain days 135 60 to
200
Annual rainfall (mm) 865 to 1470
1270 to 7620
750 to 1400
1600 to 3000
1324 to 2593
890 to 3800
1265 to 3420
1500 to 3810
1700

MARGAREE Consultants
2
Table A-2: Gross Domestic Product, 2000
Country 2000 GDP
($USD)
PPP GDP (2000 US$ millions)
Implicit PPP exchange
rate PPP to US$1
Output value of Services (2000 US$ millions)
Output value of Industry
(2000 US$
millions)
Output value of
Agriculture (2000
US$ millions)
Antigua & Barbuda $688.5 $524.0 $0.8 $438 $66 $21 Bahamas $4,800.0 $4,500.0 $0.9 $4,050 $315 $135 Barbados $2,600.0 $4,000.0 $1.5 $3,200 $640 $160 Belize $825.5 $790.0 $1.0 $458 $190 $142 Dominica $270.1 $290.0 $1.1 $183 $46 $61 Grenada $410.4 $394.0 $1.0 $297 $59 $38 Guyana $711.9 $3,400.0 $4.8 $1,115 $1,105 $1,180 Jamaica $7,400.0 $9,700.0 $1.3 $5,568 $3,414 $718 St. Kitts $314.1 $274.0 $0.9 $197 $62 $15 St. Lucia $707.1 $700.0 $1.0 $399 $226 $75 St. Vincent $332.9 $322.0 $1.0 $232 $56 $34 Trinidad & Tobago $7,300.0 $11,200.0 $1.5 $6,048 $4,928 $224 Total $26,360.5 $36,094.0 $22,184 $11,107 $2,803

MARGAREE Consultants
3
Table A-3: Tourism Data 1999 Country
Tot
al V
isito
rs
(000
)
Cru
ise
Ship
V
isito
rs (0
00)
Stay
Ove
r A
rriv
als (
000)
Hot
el R
oom
s
Em
ploy
men
t
Vis
itor
Day
s (0
00)
Vis
itor
Exp
endi
ture
s (U
S$ m
illio
n)
Spen
ding
per
V
isito
r D
ay
(US$
) V
isito
r E
xpen
ditu
res
as %
of G
DP
Antigua and Barbuda 568 328 240 3,185 3,822 2,008 291 $145 52% Bahamas 3,559 1,982 1,577 14,153 16,984 13,021 1,583 $122 34%* Barbados 951 433 518 6,585 7,902 4,059 677 $167 33% Belize 361 34 327 3,963 4,756 2.323 112 $48 24%* Dominica 276 202 74 857 1,028 720 49 $68 22% Grenada 371 246 125 1,928 2,314 1,121 62 $55 26% Guyana 75 75 730 876 525 52* $99* 11%* Jamaica 2,012 764 1,248 23,067 27,680 9,500 1,280 $135 21% St. Kitts and Nevis 221 137 84 1,754 2,105 725 70 $97 31%* St. Lucia 612 351 261 3,065 3,678 2,178 311 $143 56% St. Vincent and Grenadines 116 48 68 1,540 1,848 524 79 $151 29% Trinidad and Tobago 416 57 359 4,236 5,083 2,570 201* $78* 3%* Total 9,538 4,582 4,956 65,063 78,076 39,274 4,767 $121 Notes: * denotes 1998 data Employment estimated on the basis of 1.2 employees per hotel room Visitor days estimated as sum of 7 days for each stay-over visitor and 1 day for each cruise ship visitor. Spending per visitor day could be higher (lower) if the average length of stay of stay-over visitors is shorter (longer) than 7 days (6 nights).