assessment of the economic value of recreation and …
TRANSCRIPT
ASSESSMENT OF THE ECONOMIC VALUE OF RECREATION AND TOURISM INWESTERN AUSTRALIA'S NATIONAL PARKS, MARINE PARKS AND FORESTS
By Jack Carlsen and David Wood

ASSESSMENT OF THE ECONOMIC VALUE OF RECREATION AND TOURISM IN WA TECHNICAL REPORTS
The technical report series present data and its analysis, meta-studies and conceptual studies, and are considered to be of value to industry, government and researchers. Unlike the Sustainable Tourism Cooperative Research Centre (STCRC) Monograph series, these reports have not been subjected to an external peer review process. As such, the scientific accuracy and merit of the research reported here is the responsibility of the authors, who should be contacted for clarification of any content. Author contact details are at the back of this report.
EDITORS
Prof Chris Cooper University of Queensland Editor-in-Chief Prof Terry De Lacy Sustainable Tourism CRC Chief Executive Prof Leo Jago Sustainable Tourism CRC Director of Research National Library of Australia Cataloguing in Publication Data
Carlsen, Jack. Assessment of the economic value of recreation and tourism in Western Australia's national parks, marine parks and forests.
Bibliography. ISBN 1 920704 66 3.
1. National parks and reserves - Economic aspects – Western Australia. 2. Forest reserves - recreational use - Economic aspects - Western Australia. 3. Marine parks and reserves - Public use - Economic aspects – Western Australia. 4. Tourism - Economic aspects – Western Australia. I. Wood, David (David S.). II. Cooperative Research Centre for Sustainable Tourism. III. Title.
333.7809941 Copyright © CRC for Sustainable Tourism Pty Ltd 2004
All rights reserved. Apart from fair dealing for the purposes of study, research, criticism or review as permitted under the Copyright Act, no part of this book may be reproduced by any process without written permission from the publisher. Any enquiries should be directed to Brad Cox, Communications Manager [[email protected]] or Trish O’Connor, Publishing Manager [[email protected]]. Acknowledgements
The Sustainable Tourism CRC, established by the Australian Commonwealth Government, has funded this research. Funding and support was also provided by CALM and the researchers wish to thank the heads of those organisations, Kieron McNamara and Terry De Lacy respectively.
The authors also wish to thank the members of the steering committee for their guidance in conducting this research and compilation of the report, as follows:
Kelly Agar, CALM Ross Dowling, Edith Cowan University Kate Hassall, CALM Colin Ingram, CALM Diane Lee, Murdoch University Jane Seman, WATC Jim Sharp, CALM
The work of the research assistants Diane Hopkins, Rachel Goff, Kim Kyle, Josh O’Keefe and German Ugarte is especially acknowledged.

NATIONAL PARKS, MARINE PARKS AND FORESTS
CONTENTS PREFACE _________________________________________________________________________________V SUMMARY _______________________________________________________________________________V CHAPTER 1 INTRODUCTION _____________________________________________________________1
SOUTHERN FOREST REGION____________________________________________________________________ 1 GASCOYNE COAST REGION ____________________________________________________________________ 1 STEERING COMMITTEE _________________________________________________________________________ 1 OUTLINE OF THE REPORT ______________________________________________________________________ 2 ECONOMICS AND NATURAL AREA TOURISM ___________________________________________________ 2 ECONOMIC VALUES OF SPECIFIC TOURISM RESOURCES ________________________________________ 2 MEASURING THE VALUE OF TOURISM AND RECREATION_______________________________________ 3 PREVIOUS STUDIES_____________________________________________________________________________ 4
OVERSEAS ____________________________________________________________________________________ 4 AUSTRALIA ___________________________________________________________________________________ 4
CHAPTER 2 DIRECT TOURIST SPEND METHODOLOGY ___________________________________6 SELECTED METHODOLOGY_____________________________________________________________________ 6 REGION SELECTION ____________________________________________________________________________ 7 VISITOR EXPENDITURE SURVEY ________________________________________________________________ 7 ESTIMATING DIRECT TOURIST SPEND__________________________________________________________ 8
TOTAL VISITOR EXPENDITURE _____________________________________________________________________ 8 ATTRIBUTION FACTOR ___________________________________________________________________________ 8 SUBSTITUTION VALUE ___________________________________________________________________________ 8
DATA TREATMENT_____________________________________________________________________________ 9 ESTIMATION OF VISITATION _______________________________________________________________________ 9 ESTIMATION OF LENGTH OF STAY __________________________________________________________________ 9 ESTIMATION OF AVERAGE DAILY EXPENDITURE ______________________________________________________ 10
CHAPTER 3 CASE STUDY 1: SOUTHERN FOREST REGION_______________________________ 11 TOURISM AND RECREATION IN THE SOUTHERN FOREST REGION _____________________________ 11
TOURISM IN THE SOUTH WEST REGION _____________________________________________________________ 11 TOURISM IN THE SOUTHERN FOREST REGION _________________________________________________________ 12 SURVEY DISTRIBUTION AND METHODS _____________________________________________________________ 13 VISITOR SURVEY FINDINGS - SOUTHERN FOREST REGION _______________________________________________ 13
Origin of visitors ____________________________________________________________________________ 14 Length of stay_______________________________________________________________________________ 14 Travel party ________________________________________________________________________________ 14 Mode of transportation _______________________________________________________________________ 15 Accommodation type _________________________________________________________________________ 15 Information sources__________________________________________________________________________ 15 Reason for visit _____________________________________________________________________________ 16 Activities undertaken _________________________________________________________________________ 16 Substitution factor ___________________________________________________________________________ 16 Importance of forests_________________________________________________________________________ 17 Visitor expenditure __________________________________________________________________________ 17 Attribution value ____________________________________________________________________________ 17 Substitution value ___________________________________________________________________________ 18
SUMMARY_____________________________________________________________________________________ 18 CHAPTER 4 CASE STUDY 2: GASCOYNE COAST REGION________________________________ 19
TOURISM AND RECREATION IN THE GASCOYNE COAST REGION ______________________________ 19 SURVEY DISTRIBUTION AND METHODS _____________________________________________________________ 20 VISITOR SURVEY FINDINGS - GASCOYNE COAST REGION________________________________________________ 20
Origin of visitors ____________________________________________________________________________ 20 Length of stay_______________________________________________________________________________ 21 Travel party ________________________________________________________________________________ 21 Mode of transport ___________________________________________________________________________ 22 Accommodation type _________________________________________________________________________ 22 Information sources__________________________________________________________________________ 22 Reason for visit _____________________________________________________________________________ 23
iii

ASSESSMENT OF THE ECONOMIC VALUE OF RECREATION AND TOURISM IN WA
Activities undertaken _________________________________________________________________________ 23 Substitution factor ___________________________________________________________________________ 23 Visitor expenditure __________________________________________________________________________ 24 Attribution value ____________________________________________________________________________ 24 Substitution value ___________________________________________________________________________ 24
SUMMARY_____________________________________________________________________________________ 25 CHAPTER 5 CONCLUSION______________________________________________________________ 26 REFERENCES ___________________________________________________________________________ 27 AUTHORS ______________________________________________________________________________ 29 LIST OF TABLES
Table 1: 1991/1992 Visitor Expenditure At Australian World Heritage Areas __________________________5 Table 2: 2002/03 Investment Highlights (South West Development Commission 2002)_______________11 Table 3: Origin Of Visitors To The Southern Forest Region (N=439) __________________________________14 Table 4: Australian Visitor Origin To The Southern Forest Region (N=369) ___________________________14 Table 5: Length Of Stay Of Visitors To The Southern Forest Region (N=440)__________________________14 Table 6: Nature Of Visitor Groups To The Southern Forest Region (N=445)___________________________14 Table 7: Mode Of Travel Used By Visitors To The Southern Forest Region (N=443)____________________15 Table 8: Type Of Accommodation Used By Visitors To The Southern Forest Region (N=432) __________15 Table 9: Information Sources The Southern Forest Region (N=439)___________________________________15 Table 10: Most Important Reason For Visiting The Southern Forest Region (N=416) __________________16 Table 11: Activities Undertaken By Visitors To The Southern Forest Region (N=376) __________________16 Table 12: Substitution Factors (N=376)______________________________________________________________16 Table 13: Importance Of Forests In Attracting Tourists To The Southern Forest Region (N=441) ______17 Table 14: Average Expenditure Per Person/ Per Day In The Southern Forest Region __________________17 Table 15: Origin Of Visitors To The Gascoyne Coast Region (N=373)_________________________________21 Table 16: Australian Visitor Origin To The Gascoyne Coast Region (N=226) __________________________21 Table 17: Length Of Stay Of Visitors To The Gascoyne Coast Region (N=373) ________________________21 Table 18: Nature Of Visitors Groups To The Gascoyne Coast Region (N=373) ________________________21 Table 19: Mode Of Travel Used By Visitors To The Gascoyne Coast Region (N=373) __________________22 Table 20: Type Of Accommodation Used By Visitors To The Gascoyne Coast Region (N=358) _________22 Table 21: Finding About The Gascoyne Coast Region (N=370) _______________________________________22 Table 22: Most Important Reason For Visiting The Gascoyne Coast Region (N=336) __________________23 Table 23: Activities Undertaken By Visitors To The Gascoyne Coast Region (N=323) __________________23 Table 24: Substitution Factors (N=369)______________________________________________________________23 Table 25: Average Expenditure Per Person/Per Day In The Gascoyne Coast Region ___________________24 LIST OF FIGURES
Figure 1: The Multiplier Effect (Lindberg 2001) _______________________________________________________3 Figure 2: Calculation Of The Average Expenditure Per Person / Per Day _______________________________7 Figure 3: Location Of The Southern Forest Region ___________________________________________________12 Figure 4: Southern Forest Seasonal Visitation________________________________________________________13 Figure 5: Location Of The Gascoyne Coast Region ___________________________________________________19
iv

NATIONAL PARKS, MARINE PARKS AND FORESTS
PREFACE
This is the first assessment of the value of national parks, marine parks and forests for tourism and recreation in Western Australia. It was conducted at the behest of partner organisations in the Sustainable Tourism Cooperative Research Centre (STCRC) in Western Australia, namely Conservation and Land Management (CALM) and the Western Australian Tourism Commission (WATC) and funded as a tactical project. As such, it addressed a specific research need for accurate and reliable data on the value of natural areas for tourism and recreation for use in managing and sustaining these areas into the future.
A case study approach was adopted and two study regions were nominated because of their significance for tourism and recreation and their endowment of natural attractions within parks, forests and marine areas. A second stage of the study will draw upon the lessons learned in the case studies to develop a generic tool kit for assessment of other natural areas for tourism.
The project was conducted by the Curtin Sustainable Tourism Centre, Curtin University of Technology in collaboration with researchers from Murdoch and Edith Cowan Universities. A steering committee comprised of representatives from the three universities and the two industry partner organisations provided overall guidance on the project.
The data and findings in this report are based on conservative estimates and projections of visitor expenditure and behaviour and as such provide an indication of direct economic value. Any errors or omissions in the report remain the responsibility of the authors.
SUMMARY
National Parks, marine parks and forests make a significant contribution to the economies of regions in which they are situated and to neighbouring towns through direct tourist expenditure. This study estimated the direct yearly tourist expenditure in two regions known for their unique natural attractions - the Southern Forest Region and the Gascoyne Coast Region.
Objectives of the Study
This study aims to measure the economic value of protected natural environments (national parks, marine parks and forests) through direct tourism expenditure in regions that are recognised for their unique natural attractions. This report presents the results of two case study regions in Western Australia - the Southern Forest Region and the Gascoyne Coast Region, as determined by the STCRC Network partners (CALM and WATC).
Method
Visitor expenditure surveys were used to estimate the average expenditure per visitor per day in each of the two regions. The annual expenditure of all tourists in these regions was then calculated by multiplying this figure by the average number of annual overnight visitors (domestic and international) and then multiplying by the average length of stay in the region.
In order to determine the proportion of this total expenditure which could be directly attributable to the national parks, marine parks and forests of the regions, an attribution factor was generated using a number of variables derived from the visitor surveys. These attribution factors were then multiplied by the total annual visitor expenditure to create a best estimate of the economic value of tourism in national parks, marine parks and forests. Finally, the substitution value was estimated by apportioning the value of direct tourism expenditure that would otherwise have not occurred if the Western Australian national parks, marine parks and forest areas did not exist. To identify the substitution factor a scenario question investigated the likely holiday destination choice of respondents if the national park, marine park or forest they visited did not exist.
v

ASSESSMENT OF THE ECONOMIC VALUE OF RECREATION AND TOURISM IN WA Key Findings
The main findings for each region are outlined in the table below.
Executive Summary of Direct Tourist Expenditure
CASE STUDY REGION
Southern Forest Region
Gascoyne Coast Region
Average expenditure per person/ per day $89.70 $81.30 Overnight visitors (average last four years) 201,100 188,700 Average length of stay (days) 3.9 9 Total Direct Expenditure ($million) $70.5m $138m Attribution factor (%) 88% 92% Attribution of Visitor Expenditure ($million) $61.9m $127m
Both attribution figures are conservative estimates which primarily measure attribution through visitor’s primary reason for holidaying in each region. The amount of direct expenditure therefore attributable to the national parks, marine parks and forests of the region is between these conservative estimates and the total expenditure estimated in this study as follows:
Attribution of Visitor Expenditure to the national parks, marine parks and forests:
• Southern Forest Region $61.9 to $70.5million • Gascoyne Coast Region $127 to $138 million
Substitution Factor
The substitution factor provides an estimate of the amount of new or retained tourist expenditure attributable to national parks, marine parks and forests that would otherwise not have occurred. In the case of the Southern Forest Region the substitution value was estimated to be $5.7 million and in the case of the Gascoyne Coast Region was estimated to be $23.5 million.
Substitution of Attributable Visitor Expenditure to the
national parks, marine parks and forests:
• Southern Forest Region $5.7 million • Gascoyne Coast Region $23.5 million
Future Actions
The next stage will be to develop a tool kit of techniques to assess the economic value of tourism to parks and natural areas. The tool kit will be developed following a critical appraisal of selected evaluation techniques that have been implemented in Australia and abroad to learn from best practice and avoid duplication. The tool kit will enable natural area managers such as national and marine park administrators and rangers to readily assess the economic value of natural areas for tourism. Theses assessments can then be used to present cases to better resource the management of the natural environmental assets that support tourism and thus help make tourism sustainable.
vi
NATIONAL PARKS, MARINE PARKS AND FORESTS
Chapter 1
INTRODUCTION
This study aims to measure the economic value of protected natural environments through direct tourism expenditure in regions that are recognised for their unique natural attractions. This report presents the results of two case study regions in Western Australia - the Southern Forest Region and the Gascoyne Coast Region, as determined by the Sustainable Tourism Cooperative Research Centre (STCRC)) Network partners (CALM and WATC).
Information about the economic value of protected natural areas is often necessary to justify expenditure of public funds on management of such areas. The direct tourism expenditure measurements carried out as part of this study is intended to provide a tool for future economic assessments of natural environments in order to manage and allocate resources to these areas to ensure the sustainability of the natural resource base for tourism and recreation.
There are a number of valuation techniques that are used to estimate the contribution of tourism activity to the economy of a region. Although economic impacts of tourism include direct, indirect and induced effects, this study concentrates on direct tourist expenditure due to difficulties using multipliers (see Chapter 2).
This study used visitor surveys conducted in April-June 2003 in two case study regions in order to determine yearly visitor expenditure. The proportion of total yearly visitor expenditure that can be directly attributable to the natural environments of these regions was then determined using a number of indicators derived from the visitor surveys.
The two case study regions presented in this report are both located in Western Australia - the Southern Forest Region and the Gascoyne Coast Region as determined by the STCRC Network partners, Department of Conservation and Land Management (CALM) and the Western Australian Tourism Commission (WATC).
The Southern Forest Region and the Gascoyne Coast Region were highlighted as priority areas for measuring the economic value of tourism because they are both regions with unique natural environments under increasing pressure from tourism, as well as other competing industries such as logging, mining and fishing. The environmental impacts of tourism as a result of increasing visitor numbers in these regions have become a major concern for management of these unique natural environments.
Southern Forest Region The Southern Forest Region forms a significant part of the South West Region of Western Australia where tourism is an important contributor to the regional economy due to its proximity to the capital city of Perth and its numerous natural attractions. The Southern Forest Region has been formulated by the Western Australian Tourism Commission to promote forest–related tourism because of the forests being a significant tourist draw card of the South West Region. Most of the forested lands in the Southern Forest Region that are used for tourism and recreation purposes are public lands vested in the Conservation Commission of Western Australia and managed by CALM.
Gascoyne Coast Region The Gascoyne Coast Region is on the north-west coast of Western Australia and contains Cape Range National Park and provides access to Ningaloo Marine Park. Despite its isolation from the most populated areas of Western Australia, the Gascoyne Coast Region has become a popular tourism destination due its diverse marine environment which is easily accessible from the coast and its warm climate.
Steering Committee A steering committee was set up for this study, which included representatives from:
• Curtin University of Technology;
1

ASSESSMENT OF THE ECONOMIC VALUE OF RECREATION AND TOURISM IN WA
• The Department of Conservation and Land Management; • Edith Cowan University; • Murdoch University; and • The Western Australian Tourism Commission.
Outline of the Report Chapter 1 discusses the need for and different methods of measuring the economic value of natural environments from tourism. Chapter 2 of the report outlines the selected methodology and its specific application to this study. The findings of the visitor surveys in the two case study regions are outlined in Chapter 3, detailing background information, visitor profiles, and visitor expenditure. Conclusions are presented in Chapter 4 of the report.
Economics and Natural Area Tourism Natural environments are important components of the recreation and tourism industry and contribute significantly to attracting tourists to Australia’s regions. The annual growth in international participation in natural area tourism in Australia is 4.5% per annum (Chua 2001) with over 50% of all international visitors visiting a national park during their stay (Blamey 1995). Of international visitors surveyed 23% reported that the opportunity to experience Australia’s natural landscapes and wildlife particularly influenced their decision to travel to Australia (Chua 2001). In the domestic market, over 9.9 million, nearly 6% of day trips and 13% of overnight trips included a visit to a national park and or a bush walk (Chua 2001). This increase in demand has been reflected in the tremendous growth in the commercial nature, ‘eco’ and adventure tourism (NEAT) sector in Australia (Buckley 2000; Font & Tribe 2000).
The economic returns generated from the sustainable management of tourism in natural areas can be maintained over a long period of time for the benefit of a wide range of users and stakeholders. Investment in resources and infrastructure that support and encourage tourism and recreation in natural areas therefore provide opportunities for significant benefits to state and regional economies.
The contribution of natural area tourism to Western Australia’s economy, however, has had little recognition and is under-valued. This is partly due to the fact that tourism and recreation to these areas has not previously been assessed or measured in an objective systematic way. The agencies responsible for the management and marketing of these natural areas, the Department of Conservation and Land Management (CALM) and the Western Australian Tourism Commission (WATC) respectively, are constantly seeking the levels of recognition and resources to support and sustain these areas.
By providing more accurate values for tourism activities occurring in natural environments, there is the opportunity to reverse market failure by providing decision makers with information on the real cost of alternative actions. Particularly in a climate where public funds are finite, these measures can be utilised to support decision-making in the area of resource commitment and budget allocation to promote the sustainable management of natural areas.
‘The absence of systematic large-scale gathering of economic data from parks means that key parts of the economy are overlooked. The absence of adequate statistics causes an information blind spot; these natural places are valued, on a financial basis, at a zero price. This leads to excessive destruction of natural areas, implying that present economic performance in many countries will be reduced, and future economic performance will be severely curtailed’ (Union 1998).
Economic Values of Specific Tourism Resources Although most economic values studies usually focus on a tourist destination and estimate the total expenditure of tourists in that area, policymakers are sometimes interested in the economics generated by a specific tourism resource. Johnson and Moore (1993) state that to accurately estimate economic values of specific resources it is necessary to know the expenditures that are associated solely with that resource i.e. the expenditure which would be lost if that resource wasn’t available to tourists.
2

NATIONAL PARKS, MARINE PARKS AND FORESTS
Additional information about multiple destinations and substitution behaviour are needed to calculate accurate estimates of the economic value of a specific resource, including:
• Whether the trip was solely to visit the resource or whether it was combined with other destinations;
• What other tourist attractions were visited during the trip; • What proportion of the trip was devoted to the resource; and • Would the tourist choose an alternative resource location if the resource wasn’t
available? (Johnson and Moore 1993)
Estimates of economic values for specific tourism resources may be overstated if calculations use total trip expenditures rather than the proportion of the trip devoted solely to the resource (attribution factor) and if visitor’s alternative holiday plans are not accounted for (substitution behaviour) (Johnson and Moore 1993).
Measuring the Value of Tourism and Recreation Two broad groups of economic indicators can be used to measure the value of tourism and recreation in natural areas (Driml 1998). These are presented in Figure 3.
The first group describes the values of direct expenditure associated with tourism and recreation, generating activity and employment in the economy. These indicators are concerned with visitor expenditure on items associated with their travel to a region including and not limited to transport, recreational equipment, accommodation and commercial tours. The direct values of visitor spending also leads to indirect impacts resulting from purchases from other sectors and induced impacts when workers spend income on goods and services. Direct values are multiplied where successive rounds of employment and income are generated by the initial expenditure. Some of these values also leak out of the economy through purchases made outside the region.
Figure 1: The multiplier effect (Lindberg 2001)
Tourist Sector(e.g. restaurants)
Tourist Spending
Wages and profits Imports (Leakages)
Other sectors(e.g. food and beverage
processing)
Direct Impacts
Induced Impacts
Indirect Impacts
The second group of economic indicators is measured as net economic benefits or the total benefits derived by tourism and the businesses that service the tourism market minus any costs to society in the provision of those benefits (Driml 1998). The benefits to visitors are measured in terms of consumer surplus. The measure records how much a visitor is willing to pay above the price currently determined by market forces.
3
ASSESSMENT OF THE ECONOMIC VALUE OF RECREATION AND TOURISM IN WA Previous Studies
Overseas
Worldwide, research in the field of environmental economics and natural resource management has been on increase. Previous international studies have included Eagles, MacLean and Stabler (2000) valuation of the national parks of Canada, Fix and Loomis (1997) valuation of mountain biking in Utah, Nayak (2001) valuation of forests in India and Xue, Cook and Tisdell (2000) valuation of the tourism value of Changbai Mountain Reserve in China, to name but a few. Australia also has an increasing database of economic valuation studies of natural areas. Studies by Driml (1998), Knapman and Stanley (1993), Ward (1999), Pearson, Russell and Woodford (2000) are just a few of the previous valuation studies published measuring the value of tourism to natural areas in Australia.
Eagles (1999) reports that Parks Canada conservatively estimates that parks contributed C$1.25 (AU$1.32) billion to that country’s GDP each year as of the early 1990s (Lindberg & Denstadli, in press). The total economic direct effect of British Columbia’s provincial parks is estimated to be about C$533(AU$586) million in 1999, 90% of which was generated by the spending of park visitors (British Columbia Ministry of Water 2001).
Considering individual parks, Stynes, Propst and Sun (2002) found that the average expenditure per party day for 2000, at Mount Rainier National Park in US was US$62 with an average party size of 2.8. Spending varies considerably across segments – from a high US$259 per party night for visitors staying in park lodges to US$28 dollar per night for backcountry campers. Day visitors from outside the local area contribute 41% of the park visitor spending, followed by visitors staying at hotels outside the park (30%). The restaurant sector receives 23% of visitor sales, followed by hotels (20%) and retail trade (20%). Recreation admissions/fees and gas/oil each accounts for about 10% of the direct sales. The total visitor spending was US$24 million in direct sales.
However, these studies have adopted individual approaches: collecting different data, covering different time periods and generally providing results that are incomparable across cases and difficult to replicate in subsequent time periods.
The development of a model for these economic valuations that could be applied across a number of cases and replicated in subsequent time periods to allow for the compilation of a longitudinal history would be a valuable contribution to the industry. This model would also allow for the simulation of various conditions in relation to tourism to the natural area to determine the values. Other benefits could include the aggregation of visitor data across a wide range of natural areas to determine visitor profiles, determining the ratio of operational spending compared with income generated by various natural areas and predicting future demand and economic values based on the trends in existing data.
The United States National Parks Service currently uses a model for estimating economic impacts within the national parks and regions of the States. The Money Generation Model 2 (MGM2) was based on the original Money Generation Model (MGM) developed by the National Parks Service in America in 1990 and the Micro-Implan Recreation Economic Impacts Estimation System model (MIREC) originally developed by Stynes and Propst (1993) for the US Army Corps of Engineers. The first MGM aimed at providing ‘quick, inexpensive estimates of the economic impact of national park visitor spending on the region’s economy’ (Stynes 1999).
MGM2 has provided a useful tool for land management agencies in their decision-making regarding resources allocation. Similar to Australia, the United States has large tracts of land set aside in reserves and managed by national park agencies.
The environmental context in the United States however differs from that in Australia. Particularly, the differences occur in the opportunities for data collection from natural area visitors. In the United States, many national parks house accommodation outlets where visitors can be more closely monitored and intercepted for surveying purposes.
Australia
In Australia, many of the tourism and recreational sites are unsupervised sites, covering large areas with relatively low visitation. In addition the information requirements of the management agencies in the United States differ from those in Australia.
Although there are likely to be a number of problematic differences in the application of MGM2 in Australia due to identified operational and environmental contexts. The
4

NATIONAL PARKS, MARINE PARKS AND FORESTS fundamental principles of the model provide a sound basis for the development of a dedicated model for the Australian context.
This study will focus on the direct values of tourism and recreation to the study region, which will ultimately used to build a model for future economic studies of natural areas. Of the numerous studies, the following examples are from Queensland and New South Wales. Kinhill Economics (1998), estimates that visitor expenditure associated with all protected areas in Queensland totals between $602 and $858 million per year (Lindberg & Denstadli, in press).
Driml and Common (1995) present the following data on 1991/1992 annual visitor expenditure at the following World Heritage Areas:
Table 1: 1991/1992 visitor expenditure at Australian World Heritage Areas
Location Expenditure (AUD$) Great Barrier Reef 776 million Wet Tropics 377 million Kakadu 122 million Uluru 38 million Tasmania Wilderness 59 million
Values fluctuate significantly across the different areas. This is due in part to differences
in attractiveness and accessibility, but may also be due in part to the methods used in calculating the estimates.
Hassal and Associates (2001), assessed the economic benefits arising from visitors to the Great Barrier Reef, using financial data from marine park tourism operators and expenditure data from Tourism Queensland. They estimate a total direct value of $407 million and a total economic impact of $736 million in turnover.
The New South Wales National Parks and Wildlife Service has conducted a number of expenditure/economic impact studies. Montague Island Nature Reserve is an example of information derived from economic impact studies. The report identifies the contribution of this reserve to regional economy of the Eurobodolla local government area, in which the island is situated.
The NPWS did an economic impact assessment of the contribution of the nature reserve to the regional economy, using NPWS expenditures on island management, and expenditures of the park visitors.
5

ASSESSMENT OF THE ECONOMIC VALUE OF RECREATION AND TOURISM IN WA
Chapter 2
DIRECT TOURIST SPEND METHODOLOGY
Selected Methodology There are a variety of methodologies that can be used to assess the economic value of tourism and recreation. Each of these methodologies has their advantages and disadvantages and each suit different types of projects, depending on the amount of data available and the scale of the area to be studied.
The majority of projects measuring economic impact use input-output analysis in order to determine the indirect and induced effects of tourism activity. Input-output analysis is reliant on the use of extensive data about economic multipliers which are not available for either of the two regions. Although data is available at a national level, the small scale of the selected case study areas would mean that using this data would be highly inaccurate as a basis to measure the indirect and induced impacts of tourism. The use of multipliers in measuring secondary impacts has also been questioned on the basis that:
• Multipliers assume that extra output can be produced without constraints on the supply of labour, capital, land, good or service. The factors of production are assumed to be limitless in supply and therefore can be sourced without any price increase.
• Multipliers assume that households consume goods and services in exact proportion to their initial budget shares. No allowance is made for purchasers’ marginal preferences. For example the household budget share of some goods might increase or fall as household income increases.
• An increase in demand for a product implies an equal increase in production. In reality however, if domestic demand increases it might be more efficient for industries to divert some exports to local consumption or import to some extent rather than increasing local production by the full amount;
• Multipliers are often misused when evaluating industry assistance proposals because they refer to changes in the economy caused by a change in final demand for a product, while requests for government assistance are usually framed in terms of increasing the production of an industry.
Although multipliers can be a useful way of summarising and quantifying inter-linkages within the economy, they are more often abused than used correctly. Multipliers can be considered as a method of inflating the output of an industry to more impressive levels.
This study used visitor spending to measure the direct economic value of tourism and recreation to the South West Forest and Gascoyne Coast Regions. Visitor spending was determined by a visitor expenditure survey which asked tourists to record their amounts of expenditure on different items during their holiday in the selected regions. Measuring visitor spending through visitor expenditure surveys has several advantages to using business sales due to much higher response rates with visitors and the ability to collect additional data about visitor characteristics and behaviour in order to develop visitor profiles. This study collected data about visitor characteristics and behaviour in order to assist in the management of these areas (see Chapter 3). Figure 2 shows how the mean daily expenditure per person per day was calculated for each expenditure item.
In the case of accommodation, the number of nights was determined subtracting 1 to the number of days visitors stayed in the region. For example it is assumed that a visitor that stayed 2 days stayed 1 night. In some cases overnight visitors reported that they have stayed 1 day, in this case the figure was transformed to 2 days, because if 1 day is subtracted by 1 equals 0 nights and that is not valid.
For the other cases (No.2 to No.7), the formula has been applied to each item separately. The sum of each expenditure item average separately (No.1 to No.7) computes the average expenditure per person/ per day ( epp).
6

NATIONAL PARKS, MARINE PARKS AND FORESTS
Figure 2: Calculation of the average expenditure per person / per day
Expenditure item (No.) Calculation ( = average)
1. Accommodation Accommodation expense (No. 1)
No. of people χ Nights in the region figures cover ( length of stay-1)
2. Food and drink in restaurants/hotels 3. Food and drink in supermarkets 4. Travel 5. Activities 6. Equipment 7. Other (souvenirs etc.)
Expenditure item (No. 2-7 separately)
No. of people χ Length of stay figures cover
Average expenditure per person / per day ( epp)
epp = Σ of the of each expenditure item
Region Selection The STCRC Network partners and the management and marketing agencies for public lands in Western Australia (CALM and the WATC) highlighted the Southern Forest Region and the Gascoyne Coast Region as priority areas for economic assessment. Dr David Wood, the Chief Investigator for the research has 10 years experience in conducting research in the Gascoyne Coast Region and historical data on visitor spend information spanning the same period. This data, an extensive knowledge of the region, as well as the access to the network of contacts through Dr David Wood, made this case study region an excellent choice for this valuation study. Similarly, Research Assistant, Rachel Goff has recently completed a Masters Thesis on tourism and recreation in the southern forest region bringing similar knowledge benefits to the study of this case study region.
For the network partners, CALM and WATC, the natural areas of Gascoyne Coast Region and the Southern Forest Region are of importance as they are under increasing pressure from tourism and recreation. Most noticeable has been the environmental impact of increased tourism and recreation in the two regions due to the increasing visitor numbers. Management agencies for the natural areas and regional stakeholders have raised concern about managing the impact of tourism and recreation ‘on the ground’. In order to manage and allocate resources to these areas to ensure the sustainability of the natural resource base for tourism and recreation it was decided to conduct an economic evaluation study to be used for justification of future resource allocation to the management of these significant state assets.
Visitor Expenditure Survey In order to measure visitor expenditure in each case study region, a representative sample was obtained by distributing questionnaires to places of accommodation, visitor centres and national park checkpoints. The questionnaires were distributed during the Western Australian April school holidays in order to capture a maximum number of visitors and ensure a good response rate. 446 and 373 surveys were returned during the April to June period in the South West and Gascoyne Coast Regions respectively. Some of these surveys were carried out by an interviewer at key tourist sites whilst the remaining were completed by visitors and returned by mail (see Chapter 3).
The visitor expenditure of each of the samples was measured by asking respondents to indicate:
• The approximate amount of money (in Australian dollars) they spent on their trip with reference to the categories of ‘travel’, ‘accommodation’, ‘food and drinks’, ‘activities’, ‘equipment’ and ‘other’;
• How much was spent ‘in the region’; • Whether these expenditure figures were per day or for the total trip; • How many people were covered by these expenditure figures; and
7

ASSESSMENT OF THE ECONOMIC VALUE OF RECREATION AND TOURISM IN WA
• Their length of stay in the region (in days). The nature of asking visitors to record their own spending gives rise to a limitation in the
accuracy of the data. Common difficulties arise in visitors misinterpreting expenditure questions and in their inability to estimate holiday expenditure. Response results from previous expenditure surveys undertaken in both case study areas were used to inform the framing of the questions to ensure maximum understanding and responsiveness.
Estimating Direct Tourist Spend
Total Visitor Expenditure
Respondents were asked to detail their expenditure in the region on a range of items. The survey data also provided estimates of average daily expenditure per visitor per day using average length of stay and adjustment of total expenditure to account for the number of persons the expenditure covered. The average daily expenditure per person was then extrapolated using the estimates of total visitors to the study region in 2003, the average expenditure per visitor per day and the average length of stay as follows.
Note: There a several organisations who collect data about the number of visitors to a
region. These include CALM and local tourist bureaux. Overnight visitors to each region are BTR’s figures provided by the WATC, these numbers were averaged over the last four years. It is acknowledged that those figures in some periods denote a confidence interval of 50% and over.
Attribution Factor
An estimation is required as to the amount of individual expenditure that can be attributed to visits to the national parks, marine parks and forests of the study regions. Using a range of motivational, behavioural and importance variables from the surveys, the proportion of visitors that identified ‘natural environments’ (national parks, natural environments, natural attractions, etc.) was used to estimate the attribution factor.
It is acknowledged that this method is somewhat rudimentary in approach, however in the absence of accurate and reliable data on the attribution of individual tourist expenditure to forested areas it provides a best estimate approach and one that has been tested in other studies including those in the national parks of Canada by Eagles, MacLean and Stabler (2000) and in the public estate of northern New South Wales, Australia by Carlsen (1997).
Substitution Val
The substitution vinterstate or interninternational visitocountry, because oand forest areas. tourism expenditunational parks, mfactor a scenario qthe national park, estimated as follow
8
Total attributable visitor expenditure = Total visitor expenditure x attribution factor (%)
Total visitor expenditure = Average daily visitor expenditure x average length of stay x total number of visitors
ue
alue occurs when Western Australian residents would have substituted an ational trip for their intrastate holiday. It also occurs when interstate and rs choose to holiday in Western Australia in preference to another state or f the opportunity to visit Western Australian national parks, marine parks The substitution value is estimated by apportioning the value of direct re that would otherwise have not occurred if the Western Australian
arine parks and forest areas did not exist. To identify the substitution uestion investigated the likely holiday destination choice of respondents if marine park or forest they visited did not exist. The substitution value was s:
Total Substitution Value = Total attributable visitor expenditure x substitution factor (%)

NATIONAL PARKS, MARINE PARKS AND FORESTS
Data Treatment Treatment of data sources for the purposes of estimation required some decisions about ‘outliers’ (that is ‘extreme’ values of some variables in the primary data set) and the accuracy of secondary data. The approach employed in the study was to use the most conservative estimates and measures available for the key variables of visitation, length of stay and average daily expenditure. It was important to recognise how sensitive the estimates were to changes in any of these key variables to ensure that the study provided robust and reliable estimates of the economic value of tourism to Western Australian national parks. The following section outlines the approach used to estimate key variables and includes a discussion of the treatment of the data in order to provide the best estimates for visitation, length of stay and average daily expenditure.
Estimation of Visitation
One of the key variables used in estimation of economic value of tourism is visitation, as measured in number of visitors to the region (domestic and international). The main source for domestic and international visitor data is the Bureau of Tourism Research, National Visitor Survey (NVS) and International Visitor Survey (IVS). It has been acknowledged that the smaller the geographic area for which NVS and IVS data is employed, the less reliable the data will be. This is due to the limited sample size of respondents who may have visited that area during the study period and subsequently been selected to participate in the visitor survey. This means that the estimates of visitation by BTR for non-metropolitan (or non-tourism) destinations typically involve a high degree of standard error in the data and in the estimates, typically 50 percent. The actual level of visitation could be 50 percent more or less than the estimate provided in the data summaries for small areas.
Visitation data for the local government areas within the boundaries of the study regions herein (Manjimup in the Southern Forest and both Exmouth and Carnarvon in the Gascoyne Coast) for 2002 was found to have a high degree of standard error. In order to reduce the standard error and improve the estimates, a four year rolling average was used as the basis for estimation of visitation. This had the effect of increasing the sample size and reducing the standard error to the order of 20 percent or less. This was considered acceptable for the purposes of extrapolation and estimation.
In the case of the Gascoyne Coast, visitation data for two Local Government Areas (LGAs) was employed, the Shires of Carnarvon and Exmouth. Summing the estimated visitation for both these LGAs produced an estimate of visitation that included some ‘double-counting’ That is, a proportion of visitors counted in the Carnarvon LGA data would also be counted in the Exmouth LGA data if they visited both areas during their holiday on the Gascoyne Coast. Using the BTR data and primary data from this survey, the proportions of visitors that stayed in both LGAs was estimated. In the case of the Gascoyne Coast it was found that approximately 20 percent of visitors stayed in both LGAs. Thus the sum total of visitors to both LGAs was adjusted downwards by 20 percent to avoid double counting of visitors and over-estimation of visitation and expenditure. This double counting was not an issue in the Great Southern Region as data from only one LGA (Manjimup) was employed in this study.
Estimation of Length of Stay
Length of stay data can be influenced by visitors that choose to stay much longer than the average to take advantage of the favourable climate that exists and the general amenity offered in national parks and marine parks. This was found to be the case in Gascoyne Coast where camping on stations was made available for extended periods to visitors that would stay for extended periods. These extended stays (outliers) had the effect of skewing the average length of stay data so a decision was made to remove them from the data set. The basis for deciding outliers was calculated using the value of two standard deviations from the mean length of stay. Using this rule, it could be expected that statistically there is a 95 percent probability that any visitor selected at random would have a length of stay within the two standard deviations of the mean. That is, the length of stay data is representative of an estimated 95 percent of the visitor population. The other 5 percent would be considered
9

ASSESSMENT OF THE ECONOMIC VALUE OF RECREATION AND TOURISM IN WA outliers for the purposes of analysis and extrapolation.
It should be recognised that length of stay influences average daily expenditure because it is based on an estimate of total expenditure by all visitors divided by total number of days in the region. Removing the outliers in the length of stay data had the effect decreasing the average length of stay and increasing the average daily expenditure estimate.
Estimation of Average Daily Expenditure
Figure 2 describes the basis for estimation of average daily expenditure. Again it was necessary to ‘clean’ the data set to remove outliers for each expenditure item, so that representative estimates of the mean expenditure for each item could be calculated. The sum of the mean expenditure per item per person provided the estimate of overall average expenditure. This figure was then divided by the average length of stay as estimated using the decision rules in Chapter 2. The lower average length of stay figure obtained after removal of outliers had the affect of increasing the average expenditure per person per day. To check this, a higher average length of stay figure was estimated before the removal of outliers. It was found that average length of stay and average daily expenditure are inversely related. Furthermore the net effect of the estimation of total expenditure was found to be neutral in that the extrapolated estimate was not affected by the decision to use a higher average length of stay and a lower average daily expenditure, or vice versa. AS previously stated, the approach in the study was to use the most conservative and representative data as the basis for estimation, so outliers for the key variables of length of stay and expenditure were removed.
10
NATIONAL PARKS, MARINE PARKS AND FORESTS Chapter 3
CASE STUDY 1: SOUTHERN FOREST REGION
The Southern Forest Region and the Gascoyne Coast Region were highlighted as priority areas for economic assessment of tourism because they are both under increasing pressure from tourism and recreation and other competing industries. The environmental impacts of increased tourism due to increasing visitor numbers in these regions have become a major concern for management of their unique natural areas.
Tourism and Recreation in the Southern Forest Region
Tourism in the South West Region
Tourism to the South West Region has predominantly been derived from the domestic market, totalling 1,557,000 in 2002 (Bureau of Tourism Research 2002). International visitors to the South West Region represent less than 5% of the total market (approx 82,000 in 2002). The Western Australian Tourism Commission estimates that overnight domestic visitors spent $401 million in 2001 in the South West Region. In addition to domestic and international tourism to the natural areas and forests of the South West Region, local communities also utilise the areas for recreational purposes.
Tourism in the South West Region contributes $508 million, second only to the mining and mineral processing sector which contributes $1.8 billion (South West Development Commission 2002, p. 18).
The South West has the fastest tourism infrastructure growth rate across all the regions. As of June 2002 there were 14 tourism projects under construction at a total value of $34.1 million and a further 39 at the planning stage at a value of $214.2 million (Western Australian Tourism Commission in Department of Local and Regional Development, 2003).
Previous research conducted by various agencies and individuals report the importance of the natural environment such as forests for attracting tourists to the South West as a whole. The Bureau of Tourism Research as well as localised surveys report that over 50% of visitors to the South West Region visit a national park or participate in bushwalking and forest walks. The CALM VISTAT database system which measures visits to recreation sites in the region also highlights the popularity of forest recreation sites in the region. In addition, the growth rate in nature based tourism activities in the region has been increasing at 13% per annum with bushwalking, four wheel drive, safari tours and camping cited as the most popular activities (Coakes Consulting 2002).
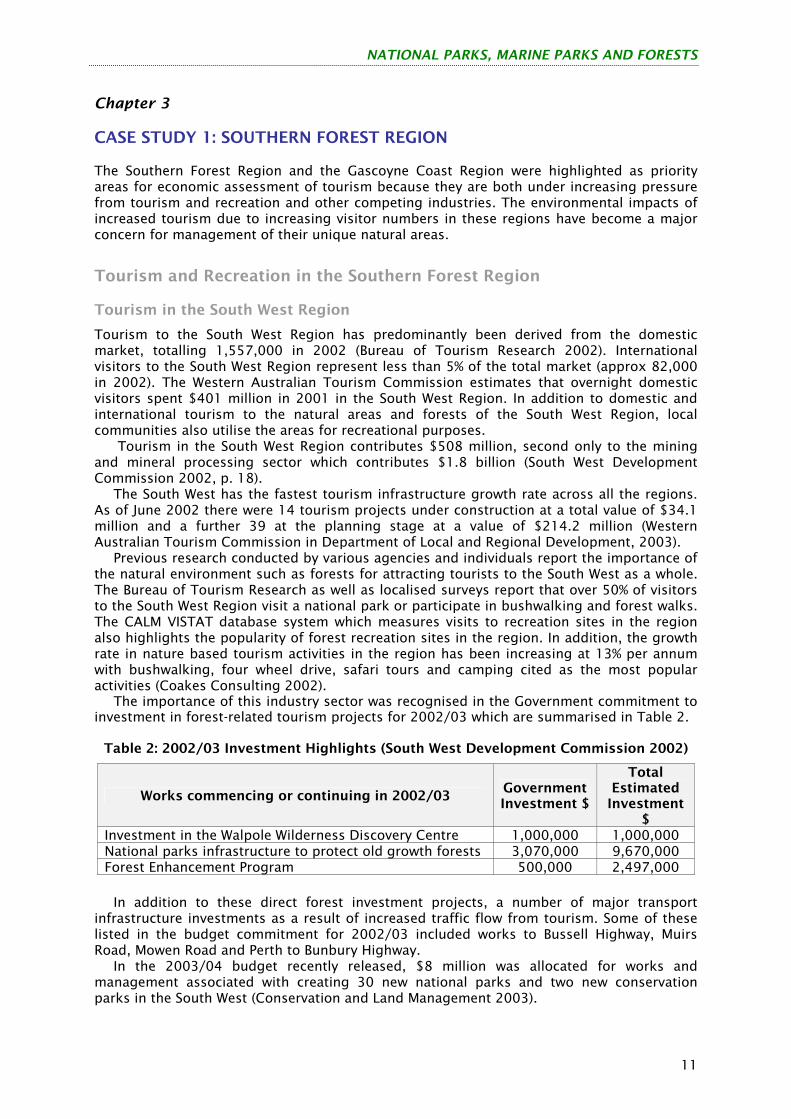
The importance of this industry sector was recognised in the Government commitment to investment in forest-related tourism projects for 2002/03 which are summarised in Table 2.
Table 2: 2002/03 Investment Highlights (South West Development Commission 2002)
Works commencing or continuing in 2002/03 Government Investment $
Total Estimated
Investment $
Investment in the Walpole Wilderness Discovery Centre 1,000,000 1,000,000 National parks infrastructure to protect old growth forests 3,070,000 9,670,000 Forest Enhancement Program 500,000 2,497,000
In addition to these direct forest investment projects, a number of major transport
infrastructure investments as a result of increased traffic flow from tourism. Some of these listed in the budget commitment for 2002/03 included works to Bussell Highway, Muirs Road, Mowen Road and Perth to Bunbury Highway.
In the 2003/04 budget recently released, $8 million was allocated for works and management associated with creating 30 new national parks and two new conservation parks in the South West (Conservation and Land Management 2003).
11

ASSESSMENT OF THE ECONOMIC VALUE OF RECREATION AND TOURISM IN WA Tourism in the Southern Forest Region
The Southern Forest Region forms a significant part of the South West Region of Western Australia to which tourism is a major contributor to regional gross domestic product. The Southern Forest Region, selected for this case study, is a Western Australian Tourism Commission designated region formulated for marketing purposes due to the high incidence of forest related attractions and activities in the region.
Figure 3: Location of the Southern Forest Region
The Southern Forest Region closely aligns with the boundaries of the Shire of Manjimup and encompasses three main centres, being Manjimup, Pemberton and Walpole. It is to be noted that the Southern Forest Region extends east of the Shire of Manjimup boundary to contain the Valley of the Giants site, a significant forest attraction which is located within the Shire of Denmark.
The entire Shire has a permanent population of approximately 10,200 people (Australian Bureau of Statistics 2002). The Shire traditionally relied on the timber industry for employment and wealth creation; however the changing forest management policies in Western Australia as a result of the Regional Forest Agreements, introduced under the 1992 National Forest Policy Statement, have had a profound impact on the region’s productive capacity. In 2002 an additional thirty national parks were created (including seventeen under RFA) under the Government’s Protecting Old Growth Forest Policy.
Tourism has become the prime economic alternative in order to sustain the communities within the shire. To highlight the transition in industry, Bunnings Mill employed 660 workers in 1960, 250 in 1984 and 113 in 1998 (Pemberton Progress Association, 2000). In 1997 it was estimated that in Pemberton there was 318 employees or 233 full time equivalent employees employed in tourism (Commonwealth of Australia and the Western Australian
12
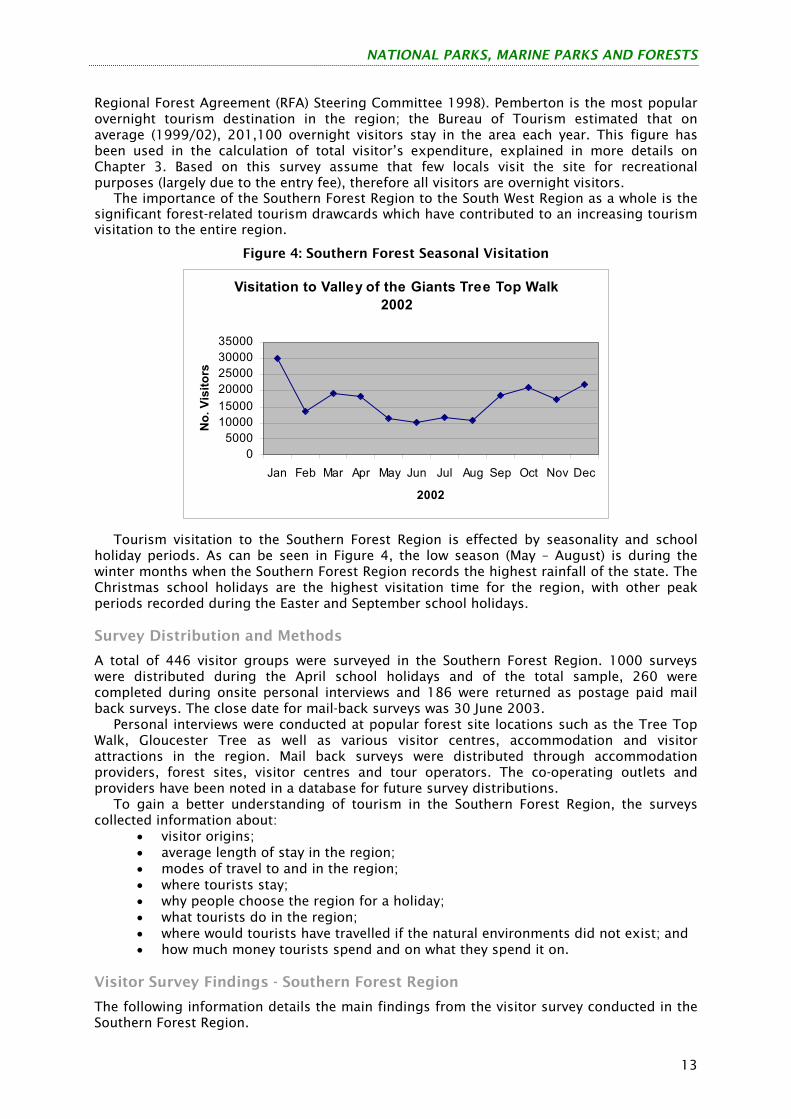
NATIONAL PARKS, MARINE PARKS AND FORESTS Regional Forest Agreement (RFA) Steering Committee 1998). Pemberton is the most popular overnight tourism destination in the region; the Bureau of Tourism estimated that on average (1999/02), 201,100 overnight visitors stay in the area each year. This figure has been used in the calculation of total visitor’s expenditure, explained in more details on Chapter 3. Based on this survey assume that few locals visit the site for recreational purposes (largely due to the entry fee), therefore all visitors are overnight visitors.
The importance of the Southern Forest Region to the South West Region as a whole is the significant forest-related tourism drawcards which have contributed to an increasing tourism visitation to the entire region.
Figure 4: Southern Forest Seasonal Visitation
Visitation to Valley of the Giants Tree Top Walk 2002
05000
100001500020000250003000035000
Jan Feb Mar Apr May Jun Jul Aug Sep Oct Nov Dec
2002
No.
Vis
itors
Tourism visitation to the Southern Forest Region is effected by seasonality and school
holiday periods. As can be seen in Figure 4, the low season (May – August) is during the winter months when the Southern Forest Region records the highest rainfall of the state. The Christmas school holidays are the highest visitation time for the region, with other peak periods recorded during the Easter and September school holidays.
Survey Distribution and Methods
A total of 446 visitor groups were surveyed in the Southern Forest Region. 1000 surveys were distributed during the April school holidays and of the total sample, 260 were completed during onsite personal interviews and 186 were returned as postage paid mail back surveys. The close date for mail-back surveys was 30 June 2003.
Personal interviews were conducted at popular forest site locations such as the Tree Top Walk, Gloucester Tree as well as various visitor centres, accommodation and visitor attractions in the region. Mail back surveys were distributed through accommodation providers, forest sites, visitor centres and tour operators. The co-operating outlets and providers have been noted in a database for future survey distributions.
To gain a better understanding of tourism in the Southern Forest Region, the surveys collected information about:
• visitor origins; • average length of stay in the region; • modes of travel to and in the region; • where tourists stay; • why people choose the region for a holiday; • what tourists do in the region; • where would tourists have travelled if the natural environments did not exist; and • how much money tourists spend and on what they spend it on.
Visitor Survey Findings - Southern Forest Region
The following information details the main findings from the visitor survey conducted in the Southern Forest Region.
13

ASSESSMENT OF THE ECONOMIC VALUE OF RECREATION AND TOURISM IN WA
Origin of visitors Table 3 provides an overview of the origin of the visitors. Of the total sample over half (59.5%) of the visitors surveyed live in Western Australia, followed by 24.6% interstate visitors and 15.9% international visitors. This may have been as a result of the survey period coinciding with the April school holiday period within the state.
Table 3: Origin of Visitors to the Southern Forest Region (n=439)
Place of Origin % of respondents Intrastate 59.5% Interstate 24.6%
International 15.9% Table 4 provides an overview of the Australian state of residence for the survey
respondents. New South Wales (9.8%) and Victoria (10.3%) made up the largest proportion of interstate visitors. The majority of international tourists were from the UK (49.3%) and Germany (14.1%).
Table 4: Australian Visitor Origin to the Southern Forest Region (n=369)
Australian State of Residence % of respondents Western Australia 70.7% Victoria 10.3% New South Wales 9.8% South Australia 4.3% Queensland 3.8% Australian Capital Territory 0.5% Tasmania 0.5%
Length of stay The majority of visitors stayed in the region for three or less days (62%), with a significant proportion staying between 4 and 7 days (32.5%). The average length of stay in the region was 3.9 days.
Table 5: Length of stay of visitors to the Southern Forest Region (n=440)
Length of Stay (days) % of respondents 1-3 Days 62% 4-7 Days 32.5% 8-14 Days 4.1% 15+ Days 1.4%
Travel party 49.4% of visitors to the region travelled in a group whilst 45.6% travelled with one other person. The average group size was 4.
Table 6: Nature of visitor groups to the Southern Forest Region (n=445)
Nature of visitor groups % of respondents Family or friends 49.4% With partner 45.6% Alone 3.6% Club/tour group 1.1% Other 0.2%
14

NATIONAL PARKS, MARINE PARKS AND FORESTS
Mode of transportation Almost three-quarters (70%) of visitors travelled in an own motor vehicle to the region. Of those who arrived by plane or scheduled bus, 77% hired a vehicle.
Table 7: Mode of travel used by visitors to the Southern Forest Region (n=443)
Transportation % of respondents Own motor vehicle 69.8% Hire car 16% Plane 9.3% Scheduled bus 3.4% Other 0.9% Package tour bus 0.7%
Accommodation type The most popular accommodation type for visitors to the Southern Forest Region was cabin or chalet style of accommodation (25.7%). Accommodation in 4-5 star hotels/ lodges (14.4%), caravan parks (14.8%) and 3 star hotels/ lodges (14.6%) were equally popular choices, with campground accommodation capturing 8.6% of the market and houses at 7.2%.
Table 8: Type of accommodation used by visitors to the Southern Forest Region (n=432)
Accommodation Type % of respondents Cabin/ Chalet 25.7% Caravan Park 14.8% Hotel/ motel 29.0% Backpackers 10.0% Campground 8.6% House 7.2% Other 4.9%
Information sources Almost half (49.9%) of the respondents sourced information about the region through friends or word of mouth. A significant proportion of respondents (27.1%) nominated ‘Other’ as the source of information, which was mainly described as local knowledge due to living in Perth.
Table 9: Information sources the Southern Forest Region (n=439)
Source of Information % of respondents Friends/ word of mouth 49.9% Other 27.1% Guide book 15.0% Advertisement 13.4% Local tourism office 7.7% WA Tourism Commission 6.4% Internet site 5.2% Documentary 1.6% CALM 1.4%
15

ASSESSMENT OF THE ECONOMIC VALUE OF RECREATION AND TOURISM IN WA
Reason for visit The natural environment, Tree Top Walk, Gloucester Tree and forests were considered to be the most important reasons for visiting the region with 26.7%, 23.3% and 21.4% of respondents stating these to be the most important reason for visiting respectively.
Table 10: Most important reason for visiting the Southern Forest Region (n=416)
Purpose for Visit % of respondents
(No. 1 reason) The natural environment 26.7% Tree top walk / Gloucester Tree 23.3% Forests 21.4% Other 15.4% Coast 7.0% Wineries 5.3% National parks 1.4%
Activities undertaken Sightseeing, Tree Top Walk, Gloucester Tree and bushwalking are the most popular activities in the Southern Forest Region.
Table 11: Activities undertaken by visitors to the Southern Forest Region (n=376)
Activities undertaken % of respondents
(No.1 activity) Sightseeing 31.9% Tree top walk/ Gloucester Tree 25.5% Bushwalking 22.1% Visiting national parks 7.2% Other 5.1% Touring wineries 2.9% Fishing 2.9% Swimming 1.3% Arts and Crafts 0.8% Dining out 0.5%
Substitution factor The substitution factor occurs when interstate and international visitors choose to holiday in Western Australia and when Western Australian residents substitute an intrastate holiday for an interstate or international trip. It also occurs when the opportunity to visit national parks, marine parks and forest areas generates visits and expenditure that would otherwise have not occurred. Table 12 indicates that 9.2% of respondents would either have holidayed in another State or overseas or stayed at home if the natural environments of the national park and forests in the region did not exist.
Table 12: Substitution Factors (n=376)
Options % of respondents Travel elsewhere in WA 64.4% Travel to the region anyway 26.4% Travel to another Australian state 5.7% Travel to another country 1.4% Stay at home 2.1%
Substitution factors
16

NATIONAL PARKS, MARINE PARKS AND FORESTS
Importance of forests Table 13 details the visitors’ perception on how important the forests are in attracting tourists to the region. 58.5% ranked the forests as an ‘extremely important’ and 36.3% ranked them as ‘very important’ in attracting tourists to the region. All respondents said that the forests were important (to varying degrees) in attracting tourists to the region.
Table 13: Importance of forests in attracting tourists to the Southern Forest Region
(n=441)
Importance % of respondents Extremely Important 58.5% Very Important 36.3% Moderately Important 4.1% Somewhat Important 1.1%
Visitor expenditure Respondents were asked to detail their holiday expenditure in order to generate an estimate of the direct tourist spend in the region. Table 14 outlines the average expenditures per person, per day in the region according to each expenditure category. This was calculated using the method outlined in Chapter 2 – Direct Tourist Spend Methodology.
Table 14: Average expenditure per person/ per day in the Southern Forest Region
Expenditure Item Per person/ per day Accommodation in the region $35.80 Food and drink restaurants in the region $14.00 Travel in the region $10.20 Food and drink supermarkets in the region $8.00 Other in the region $7.90 Equipment in the region $7.70 Activities in the region $6.10 Total $89.70
Total average expenditure per person per day in the region is $89.70 per head. To
estimate the yearly expenditure of all tourists to the Southern Forest Region, the average number of yearly overnight visitors (domestic and international) to the region (201,100) was multiplied by the average daily expenditure per person ($89.70), which was then multiplied by the average length of stay in the region (3.9 days). Using these calculations, tourists directly contribute $70.5 million in expenditure to the Southern Forest Region. An annual visitation of 201,100 is a conservative estimate considering that the Tree Top Walk, only one forest site, attracts this level of visitation annually.
201,100 x $89.70 x 3.9days = $70.5 million
Attribution value The information collected from visitors to the Southern Forest Region, can be utilised to estimate how much of their total expenditure is attributable to the natural environments.
From the data the following information supports the notion that the ‘natural environments’ (national parks, natural attractions, forests, etc,) are a significant part of the visitor experience.
• 80% of respondents reported that ‘natural environments’ were the No.1 reason for visiting the region.
• 90% of activities undertaken were nature-based. • 95% of visitors ranked forests as ‘important’ in attracting them to the region. Based on the supporting evidence outlined above, it is reasonable to assume that
approximately 88% of visitor expenditure (based on an average of the three variables outlined above) could be attributed to the national parks and forests in the study area.
17

ASSESSMENT OF THE ECONOMIC VALUE OF RECREATION AND TOURISM IN WA
The estimated annual expenditure of overnight visitors attributable to the national parks and forests in the study area is equal to:
Overnight visitors (Domestic and International) x 88% (daily visitor expenditure attributable to forests sites in the region) x daily spend by visitors in the region x average length of stay
in the region
201,100 x 88% x $89.70 x 3.9days = $61.9 million
Substitution value The substitution factor was estimated to be 9.2% based on the scenario question. When this is applied to the total attributable visitor expenditure of $61.9 million the substitution value is estimated to be $5.7 million. Thus,
The estimated annual expenditure value attracted to or retained in Western Australia due to the national parks and forests of the Southern Forest Region is $5.7 million.
Summary It has been estimated that $61.9 million of the direct tourist expenditure is attributable to the ‘natural environments’ of the Southern Forest Region. Furthermore, national parks and forests of the region are likely to provide a secondary reason for visiting the region or at least indirectly attract tourists to the region. It could therefore be argued that the national parks and forests of the Southern Forest Region generate between $61.9 and $70.5 million in tourist expenditure.
As a proportion of the South West Development Commission’s estimate that visitors generate $508 in tourist expenditure (includes day visitors and locals), the Southern Forest contributes in direct economic value at least 10-14% of the total tourism generated income in the South West.
Furthermore, it has been estimated that the substitution value associated with new and retained tourist expenditure attributable to national parks and forests in the Southern Forest Region is $5.7 million.
18

NATIONAL PARKS, MARINE PARKS AND FORESTS
Chapter 4
CASE STUDY 2: GASCOYNE COAST REGION
Tourism and Recreation in the Gascoyne Coast Region Tourism is the fastest growing industry in the Gascoyne Region, which is based on the attractions of the region’s unique natural environment, including the Cape Range National Park and the Ningaloo Marine Park. The Gascoyne Development Commission estimates that around 272,000 domestic and international tourists visited the region during 2002 contributing approximately $149 million to the region’s economy (Gascoyne Development Commission 2003).
Figure 5: Location of the Gascoyne Coast Region
Longitudinal data collected by Dr David Wood and students from Curtin University of
Technology between 1997 and 2002 reveals that the direct spend from tourists in the town of Exmouth alone is in excess of $80 million annually with visitor numbers of around 100,000.
The most favoured tourist activities in Exmouth are snorkelling, visiting beaches and
19

ASSESSMENT OF THE ECONOMIC VALUE OF RECREATION AND TOURISM IN WA swimming with whale sharks that visit the Ningaloo Reef between March and June each year and whilst fishing is popular amongst intrastate tourists (30%) it was only rated as the most popular activity by 10% of tourists to Exmouth in 2002 declining from a popularity rating in excess of 70% in 1989-1991 (Wood and Dowling 2002). Tourists to the Gascoyne predominantly stay in camping grounds and backpacker accommodation in the region’s towns.
There is an air of optimism in the region’s tourist industry, based partly on the increasing demand for nature-based tourism for which the Gascoyne Region is well placed. The economic return from tourism is expected to grow as developments such as the Exmouth Boat Harbour Resort and Residential Development are completed (Gascoyne Development Commission 2003). Tourism has been considered a solution for a small, stagnant economy for at least the past 15 years. In 1993, Bill Kelty’s Taskforce on Regional Development identified nature-based tourism as a major opportunity for economic development in the Gascoyne Region of Western Australia (GDC 1993).
The Gascoyne Development Commission has noticed important changes in tourists’ arrival patterns. The number of tourists visiting during the low periods has increased with greater interest from European travellers who tend to travel during the historical low season from November to March. This period coincides with the seasons for viewing whale shark and turtle nesting. The region is also experiencing an increase in the number of retirees travelling from the south to stay for the winter months.
The Gascoyne’s resident population of 10,308 is concentrated in the key settlements of Carnarvon, Exmouth, Denham, Gascoyne Junction and Coral Bay (Gascoyne Development Commission 2003).
Survey Distribution and Methods
A total of 373 visitor groups were surveyed during the Easter school holidays, which also coincide with the arrival of whale sharks in the Ningaloo Marine Park. 233 of the survey sample were surveyed during onsite personal interviews, with the remainder 140 completing mail back surveys distributed by accommodation places.
To gain a better understanding of tourism in the Gascoyne Coast Region, the surveys collected information about:
• visitor origins; • average length of stay in the region; • modes of travel to and in the region; • where tourists stay; • why people choose the region for a holiday; • what tourists do in the region; • where would tourists have travelled if the natural environments did not exist; and • how much money tourists spend and on what they spend it on
Visitor Survey Findings - Gascoyne Coast Region
The following information details the main findings from the visitor survey in the Gascoyne Coast Region in April 2003.
Origin of visitors The large majority of visitors reside either within Western Australia (48.2%) or overseas (39.3%) with relatively few interstate visitors (12.5%) holidaying in the region. Of international visitors, most of the respondents are from the UK (41.4%), Germany (15.2%) and Switzerland (10.3%).
These findings are fairly consistent with previous surveys conducted in April 2000, 2001 and 2002 which show fairly even proportions of intrastate and international visitors with a much smaller proportion of interstate visitors. Surveys undertaken during this period of the year may however collect more international visitors than at other times of the year because of it coinciding with whale shark season which is the region’s major international attraction.
20

NATIONAL PARKS, MARINE PARKS AND FORESTS
Table 15: Origin of visitors to the Gascoyne Coast Region (n=373)
Place of Origin % of respondents Intrastate 48.2% Interstate 12.5% International 39.3%
Table 16 provides an overview of the Australian state of residence for the survey
respondents. Victoria (7.6%) and New South Wales (6.7%) made up the largest proportion of interstate visitors.
Table 16: Australian Visitor Origin to the Gascoyne Coast Region (n=226)
Australian State of Residence % of respondents
Western Australia 79.5%
Victoria 7.6%
New South Wales 6.7%
South Australia 2.2%
Queensland 3%
Northern Territory 1%
Length of stay Most visitors stay in the region for a period between 4 and 7 days (44.7%). A significant proportion of visitors, however, stay for longer than 1 week (38.5%). The average length of stay in the region is 9 days.
These findings are similar to those in the April 2000, 2001 and 2002 surveys conducted in the region.
Table 17: Length of stay of visitors to the Gascoyne Coast Region (n=373)
Length of Stay (days) % of respondents 1-3 Days 16.8% 4-7 Days 44.7% 8-14 Days 23.6% 15+ Days 14.9%
Travel party Visitors to the region travelled in a group (43.3%), whilst 38.7% travelled with one other person. The average group size was 5.
Table 18: Nature of visitors groups to the Gascoyne Coast Region (n=373)
Nature of visitor groups % of respondents Family or friends 43.3% With partner 38.7% Alone 12% Club/ tour group 6%
21

ASSESSMENT OF THE ECONOMIC VALUE OF RECREATION AND TOURISM IN WA
Mode of transport Visitors travelled to the region in their own motor vehicle (61.4%). Of those who arrived by plane or scheduled bus, hired a vehicle (49%) or were dependant on local buses (50%) to access the Ningaloo Marine Park and Cape Range National Park.
Table 19: Mode of travel used by visitors to the Gascoyne Coast Region (n=373)
Transportation % of respondents Own motor vehicle 61.4% Scheduled bus 10.7% Plane 10.5% Hire car 9.4% Package tour bus 6.7% Other 0.9%
Accommodation type Campgrounds are by far the most popular accommodation type for visitors to the Gascoyne Coast Region (73.5%), followed by backpackers (28.2%), motel/hotels (16.5%) and caravan parks (13.1%). Table 20: Type of accommodation used by visitors to the Gascoyne Coast Region (n=358)
Accommodation Type % of respondents Campground 73.5% Backpackers 28.2% Motel / hotel 16.5% Caravan Park 13.1% Cabin/ Chalet 7.3% House 5.9% Other 3.1%
Information sources Friends and word of mouth were the most common methods of finding out about the region (61.1%), followed by guidebooks (27%), which were also regularly used as a source of information. These results are consistent with findings of surveys undertaken in previous years.
Table 21: Finding about the Gascoyne Coast Region (n=370)
Source of Information % of respondents Friends/ word of mouth 61.1% Guide book 27% Other 11.4% Advertisement 8.1% Internet site 5.7% WA Tourism Commission 5.1% Local tourism office 4.3% Documentary 3.2% CALM 1.9%
22

NATIONAL PARKS, MARINE PARKS AND FORESTS Reason for visit Snorkelling and diving (26.5%) was nominated by the greatest proportion of respondents as the most important reason for visiting the region, followed by Ningaloo Marine Park (22%), the natural environment (17.6%) and swimming with whale sharks (14.6%).
Table 22: Most important reason for visiting the Gascoyne Coast Region (n=336)
Purpose for Visit % of respondents
(No. 1 Reason) Snorkelling/diving 26.5% Ningaloo Marine Park 22% The natural environment 17.6% Swimming with whale sharks 14.6% Access to the coast 8% Other 6.3% Fishing 4.8% Cape Range National Park 1.5%
Activities undertaken Snorkelling, swimming with whale sharks and diving from a boat are the most popular activities in the Gascoyne Coast Region.
Table 23: Activities undertaken by visitors to the Gascoyne Coast Region (n=323)
Activities undertaken % of respondents
(No.1 Activity) Snorkelling from the shore 29.7% Swimming with whale sharks 18.6% Diving from a boat 10.2% Snorkelling from a boat 9.6% Other 5.6% Sightseeing 5.9% Fishing from a boat 5.6% Fishing from the shore 4.6% Swimming 4.3% Lying on the beach 3.7% Diving from the shore 1.2% Safari tours 0.9% Coral viewing from a boat 0.3%
Substitution factor The substitution factor occurs when interstate and international visitors choose to holiday in Western Australia and when Western Australian residents substitute an intrastate holiday for an interstate or international trip. It also occurs when the opportunity to visit national parks and marine parks generates visits and expenditure that would otherwise have not occurred. Table 24 shows that 18.5% of respondents would either have holidayed in another State or overseas or stayed at home if the natural environments of the national park and forests in the region did not exist.
Table 24: Substitution factors (n=369)
Options % of respondents Travel elsewhere in WA 68.5% Travel to the region anyway 13.0% Travel to another Australian state 9.5% Travel to another country 3.3% Stay at home 5.7%
Substitution factors
23
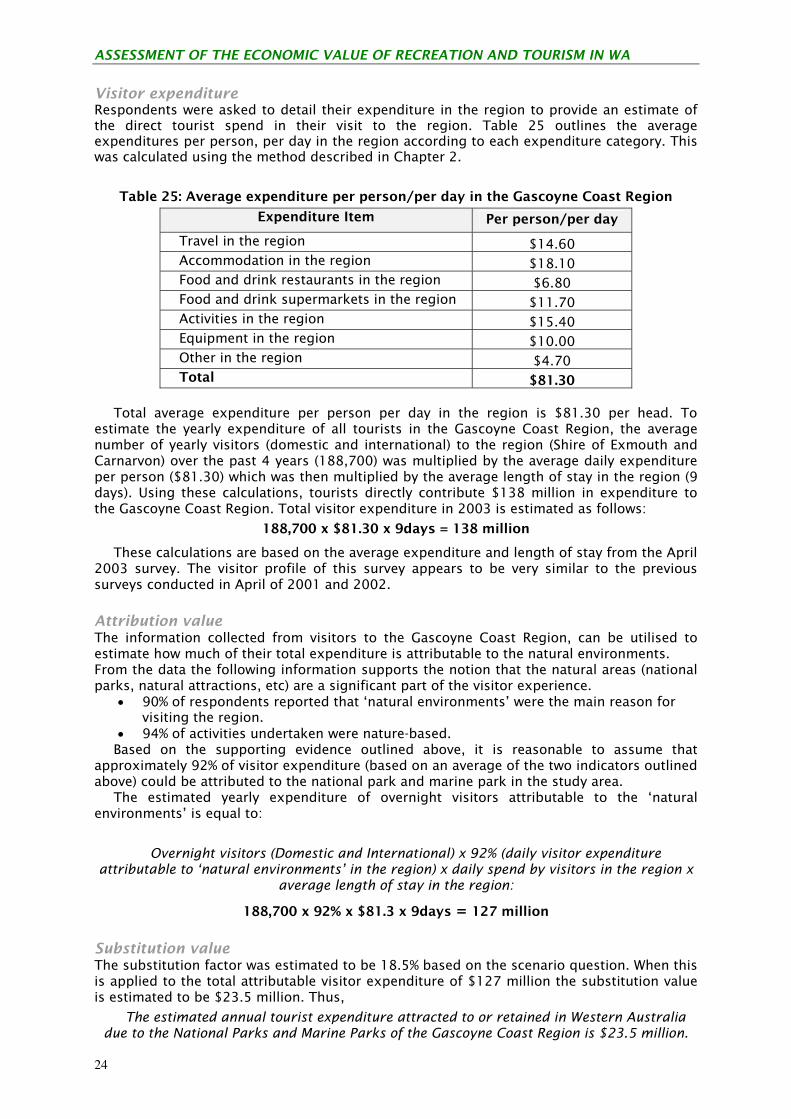
ASSESSMENT OF THE ECONOMIC VALUE OF RECREATION AND TOURISM IN WA
Visitor expenditure Respondents were asked to detail their expenditure in the region to provide an estimate of the direct tourist spend in their visit to the region. Table 25 outlines the average expenditures per person, per day in the region according to each expenditure category. This was calculated using the method described in Chapter 2.
Table 25: Average expenditure per person/per day in the Gascoyne Coast Region
Expenditure Item Per person/per day Travel in the region $14.60 Accommodation in the region $18.10 Food and drink restaurants in the region $6.80 Food and drink supermarkets in the region $11.70 Activities in the region $15.40 Equipment in the region $10.00 Other in the region $4.70 Total $81.30
Total average expenditure per person per day in the region is $81.30 per head. To
estimate the yearly expenditure of all tourists in the Gascoyne Coast Region, the average number of yearly visitors (domestic and international) to the region (Shire of Exmouth and Carnarvon) over the past 4 years (188,700) was multiplied by the average daily expenditure per person ($81.30) which was then multiplied by the average length of stay in the region (9 days). Using these calculations, tourists directly contribute $138 million in expenditure to the Gascoyne Coast Region. Total visitor expenditure in 2003 is estimated as follows:
188,700 x $81.30 x 9days = 138 million
These calculations are based on the average expenditure and length of stay from the April 2003 survey. The visitor profile of this survey appears to be very similar to the previous surveys conducted in April of 2001 and 2002.
Attribution value The information collected from visitors to the Gascoyne Coast Region, can be utilised to estimate how much of their total expenditure is attributable to the natural environments. From the data the following information supports the notion that the natural areas (national parks, natural attractions, etc) are a significant part of the visitor experience.
• 90% of respondents reported that ‘natural environments’ were the main reason for visiting the region.
• 94% of activities undertaken were nature-based. Based on the supporting evidence outlined above, it is reasonable to assume that
approximately 92% of visitor expenditure (based on an average of the two indicators outlined above) could be attributed to the national park and marine park in the study area.
The estimated yearly expenditure of overnight visitors attributable to the ‘natural environments’ is equal to:
Overnight visitors (Domestic and International) x 92% (daily visitor expenditure attributable to ‘natural environments’ in the region) x daily spend by visitors in the region x
average length of stay in the region:
188,700 x 92% x $81.3 x 9days = 127 million
Substitution value The substitution factor was estimated to be 18.5% based on the scenario question. When this is applied to the total attributable visitor expenditure of $127 million the substitution value is estimated to be $23.5 million. Thus,
The estimated annual tourist expenditure attracted to or retained in Western Australia due to the National Parks and Marine Parks of the Gascoyne Coast Region is $23.5 million.
24

NATIONAL PARKS, MARINE PARKS AND FORESTS Summary It is estimated that $127 million of the direct tourist expenditure is attributable to the national and marine park of the Gascoyne Coast Region. The natural environments of the region also provide a secondary reason for visiting the region or at least indirectly attract tourists to the region. It could therefore be argued that the natural environments of the Gascoyne Coast Region generate between $127 and $138 million in tourist expenditure.
Furthermore, the substitution value of the national and marine park of the Gascoyne Coast Region was estimated to be $23.5 million.
25

ASSESSMENT OF THE ECONOMIC VALUE OF RECREATION AND TOURISM IN WA
Chapter 5
CONCLUSION
This report provides estimates of the direct expenditure attributable to tourism and recreation in two of Western Australia’s national parks. It also investigates the methodological and practical issues associated with evaluation of national parks, marine parks and forests with a view to developing tools and techniques for further evaluations.
The study finds that the tourism generates significant revenue in both study regions of the Southern Forest and the Gascoyne Coast. In fact, tourism is estimated to provide approximately $69 million for the Southern Forest Region and $138 million for the Gascoyne Coast Region. Not all of this expenditure is attributable to the existence of the national parks, marine parks and forests however, so it was necessary to estimate an attribution factor for each case study. Using a range of motivational, behavioural and importance variables it was possible to attribute a proportion of total direct tourism expenditure in each case study region. In the case of the Southern Forest the attribution factor was estimated to be 88 percent, that is, 0.88 of total direct tourism expenditure or about $62 million of direct tourist expenditure is attributable to the national parks and forests. In the case of the Gascoyne Coast, the attribution factor was about 92 percent, so 0.92 of total direct tourism expenditure or about $127 million of direct tourist expenditure is attributable to the national park and marine park. This is considered a lower bound estimate of the value of national parks, marine parks and forests, as the natural environments features in almost all visitors’ decisions in the Southern Forest Region and Gascoyne Coast Region.
There is also an estimate of the amount of new tourist expenditure generated from interstate and overseas visitors as well as the level of expenditure retained in the State when intrastate visitors holiday in and around Western Australian national parks, marine parks and forests. This substitution factor was estimated using a scenario question to identify the alternative tourist destination choices if the Parks or forests did not exist. Whilst the limitations of scenario and projections are acknowledged this does provide an estimate of the amount of new or retained tourist expenditure attributable to national parks, marine parks and forests that would otherwise not have occurred. In the case of the Southern Forest Region the substitution value was estimated to be $5.7 million and in the case of the Gascoyne Coast Region was estimated to be $23.5 million.
26

NATIONAL PARKS, MARINE PARKS AND FORESTS
References Australian Bureau of Statistics (2002). 2001 Census data. Canberra: Australian Bureau of
Statistics. Blamey, R. (1995). Occasional Paper No. 21: The Nature of Ecotourism. Canberra, Bureau of
Tourism Research. British Columbia Ministry of Water (2001). Economic Benefits of British Columbia's Provincial
Parks. Buckley, R. (2000). ‘Wilderness in Australia: What's Happening in a World Context.’ USDA
Forest Service Proceedings RMRS-P 2(15): 190-193. Bureau of Tourism Research (2002). Travel by Australians March 2002 - Quarterly Results of
the National Visitor Survey. Canberra, Bureau of Tourism Research. Carlsen, J. (1997). ‘Economic Evaluation of recreation and tourism in natural areas: a case
study in New South Wales, Australia.’ Tourism Economics 3(3): 20-29. Chua, P. (2001). ‘Profile of the Outdoor/Ecotourism International Visitor to Western
Australia.’ Touristics 17(1): 2-6. Coakes Consulting (2002). Socio-Economic Assessment of the Forest Management Plan.
Perth, Conservation Commission Forest Products Commission. Commonwealth of Australia and the Western Australian Regional Forest Agreement (RFA)
Steering Committee (1998). Economic Profile of the Tourism and Recreation Industries in the Regional Forest Agreement Area. Perth, Commonwealth of Australia and Western Australian Government.
Conservation and Land Management (CALM) (2003). Conservation News May 2003, Department of Conservation and Land Management.
Driml, S. (1998). The Value of Protected Areas to Queensland. Brisbane, Queensland Department of Environment.
Driml, S. & Common, M. (1995). 'Economic and Financial Benefits of Tourism in Major Protected Areas'. Australian Journal of Environmental Management 2(March 1995): 19-29.
Eagles, P. (1999). International Trends in Park Tourism and Ecotourism. Unpublished manuscript. Department of Recreation and Leisure Studies, University of Waterloo, Canada.
Eagles, P., MacLean, D. & Stabler. (2000). 'Estimating the Tourism Volume and Value in Parks and Protected Areas in Canada and the USA'. The George Wright Forum 17(3): 62-82.
Fix, P. & Loomis, J. (1997). ‘The economic benefits of mountain biking at one of its meccas: an application of the travel cost method to mountain biking in Moab, Utah.’ Journal of Leisure Research 29(3): 342-353.
Font, X. & Tribe, J., Eds. (2000). Forest Tourism and Recreation - case studies in environmental management. Oxford, UK., CABI Publishing.
Gascoyne Development Commission (GDC) (2003). Gascoyne Economic Perspective: an update on the economy of Western Australia's Gascoyne Region, Department of Local Government and Regional Development, Government of Western Australia.
Hassal and Associates (2001). Socio-Economic Impact Assessment of the Contribution of Marine Tourism Operators to the Cairns-Douglas Region.
Johnson, R.L. & Moore, E. (1993). ‘Tourism Impact Estimation.’ Annals of Tourism Research 20: 279-288.
Kinhill Economics (1998). The Value of Protected areas to Queensland. Brisbane, Queensland Department of Environment.
Knapman, B. & Stanley, O. (1993). A Travel Cost Analysis of Kakadu National Park. Building a Research Base in Tourism - Proceedings of the National Conference on Tourism Research, University of Sydney, Bureau of Tourism Research.
Lindberg, K. (2001). Economic Impacts. Encyclopaedia of Ecotourism. D. Weaver: 363-377. Lindberg, K. & Denstadli, J.M. (in press). The Impact of National Park Visitation on Rural
Economies and Government Revenue in Queensland: examples of Girraween, Eungella, Daintree and Carnarvon, Sustainable Tourism CRC, Gold Coast, Australia.
Nayak, B. (2001). ‘Economic-ecologic values of an Indian Forest: A case study.’ Indian Journal of Agricultural Economics 56(3): 325.
Pearson, L., Russell, I., & Woodford (2000). Economic Impact of Noosa National Park on the
27

ASSESSMENT OF THE ECONOMIC VALUE OF RECREATION AND TOURISM IN WA
Sunshine Coast and Noosa Economies. School of Natural and Rural Systems Management, The University of Queensland: 1-44.
South West Development Commission (2002). South West 2002-2003 Budget, South West Development Commission.
Stynes, D. (1999). Guidelines for Measuring Visitor Spending. Stynes, D.J. & Propst, D.B. (1993). Micro-Implan Recreation Economic Impact Estimation
System: MI-REC User's Manual Version 3, Department of Park and Recreation Resources, Michigan State University.
Stynes, D.J., Propst, D.B. & Sun (2002). Economic Impacts of Visitors to Mount Rainier National Park, 2000, Michigan State University.
Union, T.W. (1998). United Nations List of Protected Areas. Cambridge, IUCN. Ward, J. (1999). Measuring the Economic Value of Recreation and Tourism on Fraser Island.
Australia - the World's Natural Theme Park. Proceedings of the Ecotourism Association of Australia National Conference, Fraser Island, Queensland, Ecotourism of Australia.
Wood, D.S. & Dowling, R. (2002). Tourism on the Carnarvon-Ningaloo Coast between Quobba Station and Exmouth and its Implications for Sustainability of the Coast, Western Australian Planning Commission.
Xue, D., Cook, A. & Tisdell, C. (2000). ‘Biodiversity and the tourism value of Changbai Mountain Biosphere Reserve, China: a Travel Cost approach.’ Tourism Economics, 6(4): 335-357.
28

NATIONAL PARKS, MARINE PARKS AND FORESTS
Authors Prof Jack Carlsen Prof Carlsen is currently the Malayan United Industries (MUI) Chair in Tourism and Hospitality Studies within the Curtin Business School, Curtin University of Technology, Western Australia. He facilitates the tourism research program at Curtin, which includes tourism development, planning and management. Jack has an excellent research track record, which has produced more than 50 scholarly publications on various topics related to tourism economics, management, planning, development and evaluation. Appointed to the Chair in 2002, he has since been successful in establishing the Curtin Sustainable Tourism Centre, which plays a lead role in sustainable tourism teaching, research, consulting, and policy formulation in Western Australia. Nationally he is the Sustainable Enterprises research program leader and is a member of the Program Development Committee within the Sustainable Tourism CRC. Jack has extensive international linkages and in 2004 co-authored a book with Prof Donald Getz in Canada and Prof Alison Morrison in Scotland titled The Family Business in Tourism and Hospitality. Email: [email protected] Dr David Wood Dr Wood is currently Dean of Research and Graduate Studies, Division of Humanities, Curtin University of Technology. He has worked extensively as a researcher in the Gascoyne (Ningaloo) Region of Western Australia where he prepared a regional ecotourism strategy, the case study for his Doctorate which examines participatory decision making processes in the implementation of government policies. David has continued to work in the region undertaking research into visitation and its social, economic and environmental impacts. David has also worked with Yamatji people in the Gascoyne and prepared a regional indigenous tourism strategy in conjunction with the Kuwiniwardu Aboriginal Resource Centre, Gascoyne Development Commission and the Shire of Carnarvon. David’s research has contributed to the development of Management plans for the Ningaloo Marine and Cape Range National Parks and regional strategies and local structure plans and has been used by the Department of Conservation and Land Management as a rationale for the establishment of World Heritage areas and a representative marine park system for Western Australia. David is also involved in heritage tourism research and is a Councillor of the Heritage Council of Western Australia. Email: [email protected]
29
CAIRNSNQ CoordinatorProf Bruce PrideauxPh: +61 7 4042 [email protected]
DARWINNT CoordinatorMs Alicia BoylePh: + 61 8 8946 [email protected] GOLD COAST
National Network ManagerMr Brad CoxPh: +61 7 5552 [email protected]
BRISBANETourism Infrastructure andEngineering EnvironmentsResearchDr David LockingtonPh: +61 7 3365 [email protected]
LISMORERegional TourismResearchMr Dean CarsonPh: +61 2 6620 [email protected]
SYDNEYNSW CoordinatorDr Tony GriffinPh: +61 2 9514 [email protected]
MELBOURNEVIC CoordinatorProf Betty WeilerPh: +61 3 9904 [email protected]
LAUNCESTONTAS CoordinatorProf Trevor SofieldPh: + 61 3 6324 [email protected]
CANBERRAACT CoordinatorDr Brent RitchiePh: +61 2 6201 [email protected]
PERTHWA CoordinatorDr Diane LeePh: + 61 8 9360 [email protected]
ADELAIDESA CoordinatorProf Graham BrownPh: +61 8 8302 [email protected]
NATIONAL NETWORK
CRC for Sustainable Tourism Pty Ltd
[ABN 53 077 407 286]
PMB 50
GOLD COAST MC QLD 9726
AUSTRALIA
Telephone: +61 7 5552 8172
Facsimile: +61 7 5552 8171
Email: [email protected]
http://www.crctourism.com.au