assessment of the estuary and northern gulf of st...
TRANSCRIPT
Canadian Science Advisory Secretariat Quebec Region Science Advisory Report 2017/020
June 2017
ASSESSMENT OF THE ESTUARY AND NORTHERN GULF OF ST. LAWRENCE (AREAS 13 TO 17, 12A, 12B, 12C AND 16A)
SNOW CRAB STOCKS IN 2016
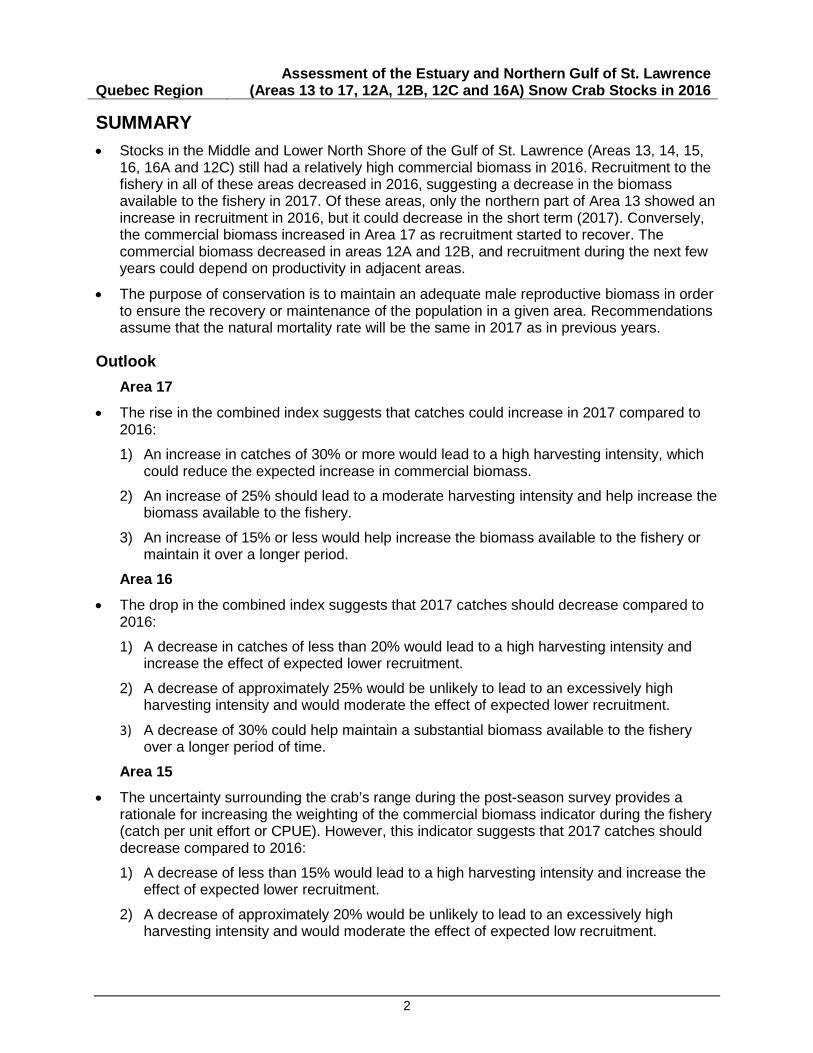
Figure 1. Snow crab management areas in the Estuary and the northern Gulf of St. Lawrence.
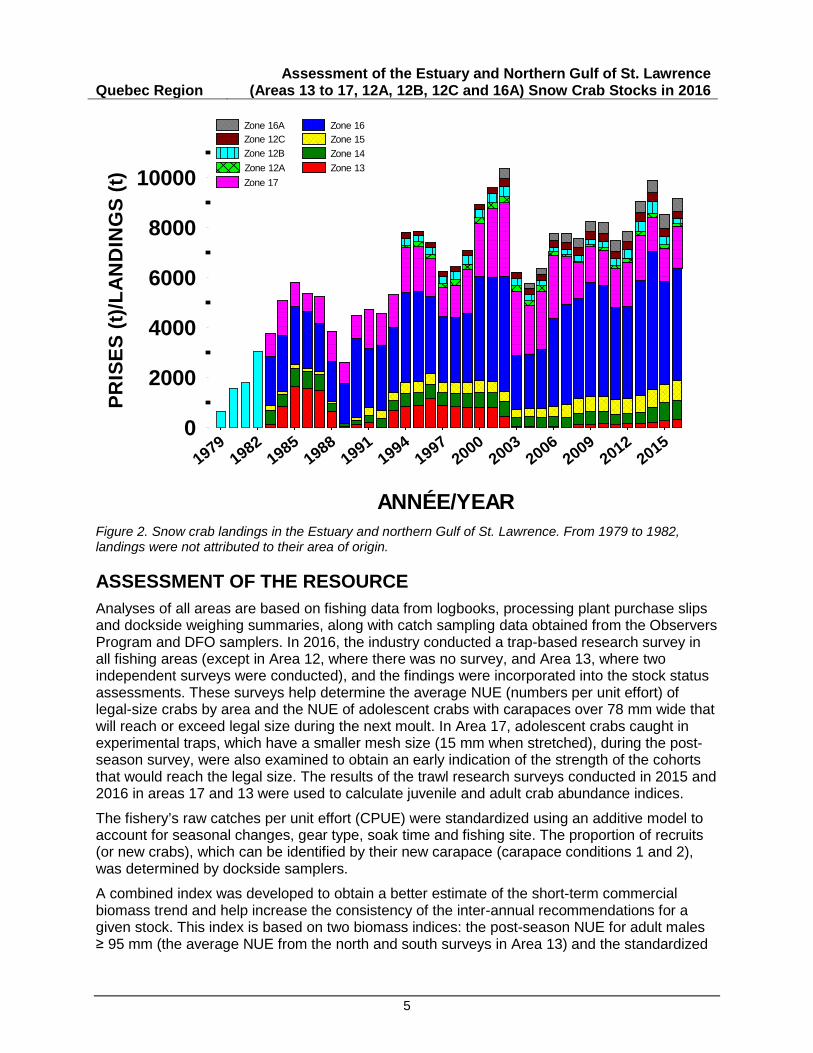
Context: The snow crab fishery in the Estuary and the northern Gulf of St. Lawrence began in the late 1960s. The fishery experienced a boom from 1979 to 1985, and a management approach based on the TAC (total allowable catch) was gradually introduced between 1985 and 1995. There are nine management areas (13 to 17, 16A, 12A, 12B and 12C) (Figure 1). Landings have varied depending on the adjusted TACs based on recruitment waves and troughs that affect the quantity of crabs available to the fishery (Figure 2), with maximum levels recorded in 1995 (7,879 t) and 2002 (10,372 t). Landings dropped considerably in 2003 owing to the lower TACs established in response to signs of overfishing, mainly in Area 16. Landings totalled 9,167 t in 2016. The fishery targets only males with a carapace width ≥ 95 mm. White crab (crab that has recently moulted) and adolescent males may be returned to the water during the fishing season to enhance their meat yield and give them a chance to reproduce. Furthermore, since 1985, when the proportion of white crab in catches at sea exceeds 20%, the fishery is automatically closed in the affected area. This measure aims to minimize the mortality of these very fragile crabs, which will be available to the fishery the following year. The DFO Fisheries and Aquaculture Management Branch, Quebec Region, requested a stock status assessment and a science advisory report to set the 2017 quotas. A scientific peer review was conducted on February 14 and 15, 2017. Participants included representatives from DFO Science and Fisheries and Aquaculture Management, the fishing industry and First Nations.
Quebec Region Assessment of the Estuary and Northern Gulf of St. Lawrence
(Areas 13 to 17, 12A, 12B, 12C and 16A) Snow Crab Stocks in 2016
2
SUMMARY • Stocks in the Middle and Lower North Shore of the Gulf of St. Lawrence (Areas 13, 14, 15,
16, 16A and 12C) still had a relatively high commercial biomass in 2016. Recruitment to thefishery in all of these areas decreased in 2016, suggesting a decrease in the biomassavailable to the fishery in 2017. Of these areas, only the northern part of Area 13 showed anincrease in recruitment in 2016, but it could decrease in the short term (2017). Conversely,the commercial biomass increased in Area 17 as recruitment started to recover. Thecommercial biomass decreased in areas 12A and 12B, and recruitment during the next fewyears could depend on productivity in adjacent areas.
• The purpose of conservation is to maintain an adequate male reproductive biomass in orderto ensure the recovery or maintenance of the population in a given area. Recommendationsassume that the natural mortality rate will be the same in 2017 as in previous years.
Outlook Area 17
• The rise in the combined index suggests that catches could increase in 2017 compared to2016:
1) An increase in catches of 30% or more would lead to a high harvesting intensity, whichcould reduce the expected increase in commercial biomass.
2) An increase of 25% should lead to a moderate harvesting intensity and help increase thebiomass available to the fishery.
3) An increase of 15% or less would help increase the biomass available to the fishery ormaintain it over a longer period.
Area 16
• The drop in the combined index suggests that 2017 catches should decrease compared to2016:
1) A decrease in catches of less than 20% would lead to a high harvesting intensity andincrease the effect of expected lower recruitment.
2) A decrease of approximately 25% would be unlikely to lead to an excessively highharvesting intensity and would moderate the effect of expected lower recruitment.
3) A decrease of 30% could help maintain a substantial biomass available to the fisheryover a longer period of time.
Area 15
• The uncertainty surrounding the crab’s range during the post-season survey provides arationale for increasing the weighting of the commercial biomass indicator during the fishery(catch per unit effort or CPUE). However, this indicator suggests that 2017 catches shoulddecrease compared to 2016:
1) A decrease of less than 15% would lead to a high harvesting intensity and increase theeffect of expected lower recruitment.
2) A decrease of approximately 20% would be unlikely to lead to an excessively highharvesting intensity and would moderate the effect of expected low recruitment.
Quebec Region Assessment of the Estuary and Northern Gulf of St. Lawrence
(Areas 13 to 17, 12A, 12B, 12C and 16A) Snow Crab Stocks in 2016
3
3) A decrease of 25% or more could help maintain a substantial biomass available to the fishery over a longer period of time.
Area 14
• The drop in the combined index suggests that 2017 catches should decrease compared to 2016:
1) A decrease of less than 10% would lead to a high harvesting intensity and increase the effect of expected lower recruitment.
2) A decrease of approximately 15% would be unlikely to lead to an excessively high harvesting intensity and would moderate the effect of expected low recruitment.
3) A decrease of 20% or more could help maintain a substantial biomass available to the fishery over a longer period of time.
Area 13
• This stock was reopened to fishing in 2008, and it was subject to a conservative harvesting approach. The slight rise in the combined index suggests that it is possible to maintain or slightly increase catches in 2017 compared to 2016:
1) An increase in catches of 15 to 20% would lead to a high harvesting intensity and could reduce the biomass available to the fishery in 2018.
2) The status quo or an increase of no more than 10% would help maintain the biomass available to the fishery.
3) A decrease would help maintain a substantial biomass available to the fishery over a longer period of time.
Area 12A
• The decrease in the commercial catch rate suggests that 2017 catches should decrease compared to 2016. A lack of information due to the absence of a post-season survey warrants greater caution in the choice of scenarios:
1) A decrease in catches of less than 10% would lead to a high harvesting intensity and could reduce the biomass available to the fishery in 2018.
2) A decrease of approximately 15% could lead to a moderate harvesting intensity and help maintain the biomass available to the fishery.
3) A decrease of over 15% could help increase the biomass available or maintain it over a longer period.
Area 12B
• The drop in the combined index suggests that 2017 catches should decrease compared to 2016. Failure to achieve TAC could be partly explained by socio-economic factors:
1) A decrease in catches of 20% or less would lead to a high harvesting intensity and could reduce the biomass available in 2018.
2) A decrease of approximately 40% would moderate the harvesting intensity.
3) A decrease greater than 40% could help maintain the biomass available to the fishery if environmental conditions do not deteriorate further.
Quebec Region Assessment of the Estuary and Northern Gulf of St. Lawrence
(Areas 13 to 17, 12A, 12B, 12C and 16A) Snow Crab Stocks in 2016
4
Area 12C
• The stability of the combined index suggests that 2017 catches should be similar to 2016:
1) An increase in catches of 10% would lead to a high harvesting intensity and could reduce the biomass available to the fishery in 2018.
2) The status quo would be unlikely to lead to an excessively high harvesting intensity and should maintain the commercial biomass.
3) A decrease could help maintain or increase the biomass available over a longer period of time.
Area 16A
• The drop in the combined index suggests that 2017 catches should decrease compared to 2016:
1) A decrease of 10% or less would lead to a high harvesting intensity in an average recruitment period.
2) A 15 to 20% decrease would be unlikely to lead to an excessively high harvesting intensity.
3) A decrease of over 20% could help maintain the biomass available to the fishery over a longer period of time.
INTRODUCTION
Species biology In Canada, snow crab can be found from the southern tip of Nova Scotia to halfway up the Labrador coast, as well as in the Estuary and Gulf of St. Lawrence. In the Gulf of St. Lawrence, commercial-size males live at depths ranging from 50 m to 200 m, except during their winter moulting and reproductive periods, during which they migrate to shallower waters. Snow crab stop growing after the terminal moult. Males are considered adolescents (small claws) prior to the terminal moult and adults (large claws) afterwards. Male carapace width (CW) ranges from 40 mm to 165 mm after the terminal moult. If they do not undergo their terminal moult earlier, males reach legal size (95 mm CW) at about nine years of age. The proportion of males that reach the legal size is correlated with the temperature of the environment throughout their development. Snow crab recruitment is periodic or episodic and varies considerably over an 8- to 12-year cycle. The entry of recruits into the fishery can be determined by regular monitoring of landings (carapace size and condition) and the catch rate (catch per unit effort or CPUE), and is confirmed by scientific trap and trawl surveys. Global warming and specifically the gradual increase in recent years in the average temperature of the deep layer could affect snow crab distribution and productivity by warming and thinning the cold intermediate water layer, its habitat.
Quebec Region Assessment of the Estuary and Northern Gulf of St. Lawrence
(Areas 13 to 17, 12A, 12B, 12C and 16A) Snow Crab Stocks in 2016
5
ANNÉE/YEAR
19791982
19851988
19911994
19972000
20032006
20092012
2015
PRIS
ES (t
)/LA
ND
ING
S (t)
0
2000
4000
6000
8000
10000 Zone 13Zone 14Zone 15Zone 16
Zone 17Zone 12AZone 12BZone 12CZone 16A
Figure 2. Snow crab landings in the Estuary and northern Gulf of St. Lawrence. From 1979 to 1982, landings were not attributed to their area of origin.
ASSESSMENT OF THE RESOURCE Analyses of all areas are based on fishing data from logbooks, processing plant purchase slips and dockside weighing summaries, along with catch sampling data obtained from the Observers Program and DFO samplers. In 2016, the industry conducted a trap-based research survey in all fishing areas (except in Area 12, where there was no survey, and Area 13, where two independent surveys were conducted), and the findings were incorporated into the stock status assessments. These surveys help determine the average NUE (numbers per unit effort) of legal-size crabs by area and the NUE of adolescent crabs with carapaces over 78 mm wide that will reach or exceed legal size during the next moult. In Area 17, adolescent crabs caught in experimental traps, which have a smaller mesh size (15 mm when stretched), during the post-season survey, were also examined to obtain an early indication of the strength of the cohorts that would reach the legal size. The results of the trawl research surveys conducted in 2015 and 2016 in areas 17 and 13 were used to calculate juvenile and adult crab abundance indices.
The fishery’s raw catches per unit effort (CPUE) were standardized using an additive model to account for seasonal changes, gear type, soak time and fishing site. The proportion of recruits (or new crabs), which can be identified by their new carapace (carapace conditions 1 and 2), was determined by dockside samplers.
A combined index was developed to obtain a better estimate of the short-term commercial biomass trend and help increase the consistency of the inter-annual recommendations for a given stock. This index is based on two biomass indices: the post-season NUE for adult males ≥ 95 mm (the average NUE from the north and south surveys in Area 13) and the standardized
Quebec Region Assessment of the Estuary and Northern Gulf of St. Lawrence
(Areas 13 to 17, 12A, 12B, 12C and 16A) Snow Crab Stocks in 2016
6
commercial CPUE. The combined index is calculated by standardizing each of the two indices according to their respective average and standard deviation over the 2000–2012 reference period and averaging them for the current year.
Data on the size structure of crabs sampled at sea, dockside and during trap surveys were also used.
To date, data on female insemination levels have been collected sporadically in certain areas. Annual systematic sampling of each area is recommended so this parameter can be used for stock status assessments because it is a measure of primiparous female mating success and the relative abundance of large adult males.
Area 17 Description of the fishery
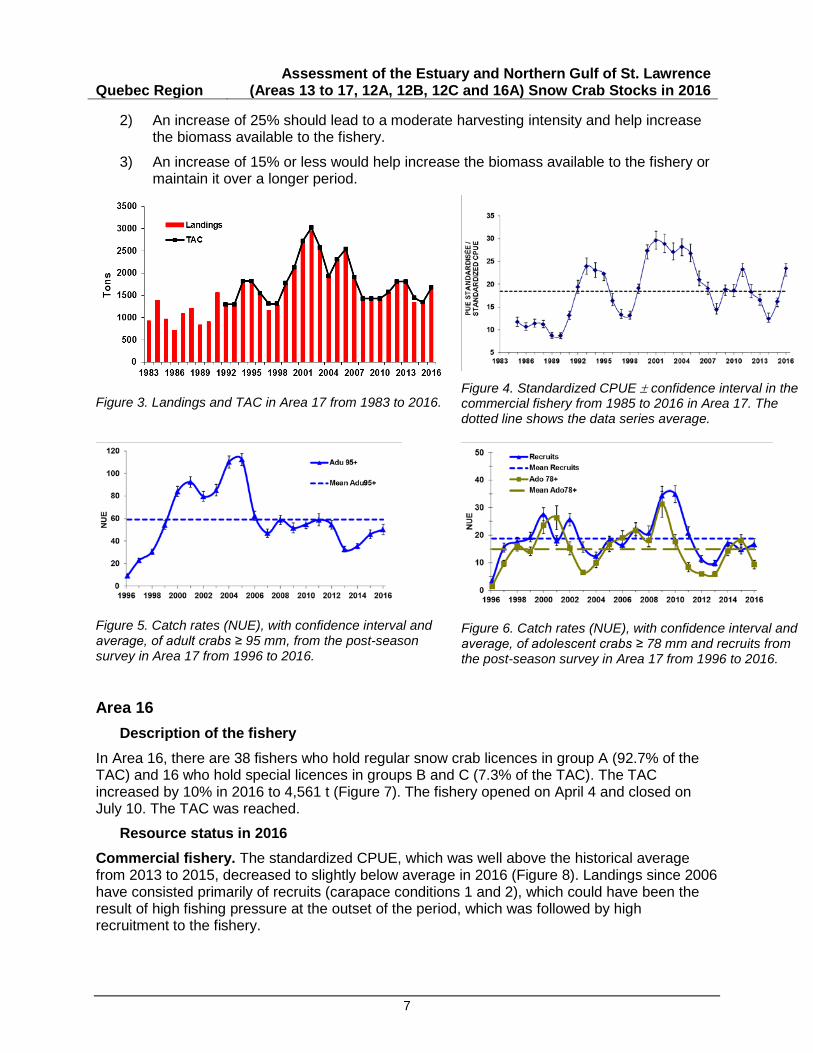
In Area 17, there are 21 fishers who hold regular licences in group A (88% of the TAC) and 20 fishers who hold special licences in group B (12% of the TAC). The TAC increased by 25% between 2015 and 2016 to 1,678 t (Figure 3). The fishing season opened on April 2 and closed on June 20. Catches totalled 1,682 t.
Resource status in 2016 Commercial fishery. The standardized CPUE increased significantly in 2016 and is now well above the historical average (Figure 4). Landings consisted primarily of intermediate-shell crabs (carapace condition 3), although the proportion of recruits (carapace conditions 1 and 2) is increasing. The average size of legal-size crabs caught at sea has been low since 2014 and was 109.2 mm in 2016.
Fishery-independent surveys. The trap-based research survey, a data series that began in 1996 on the North Shore and in 1999 on the South Shore, indicates that the NUE of adults ≥ 95 mm increased slightly in 2016 (Figure 5) due to a slight increase in crabs left by the fishery and recruits (Figure 6), but is nonetheless below average. The NUE of adolescents ≥ 78 mm decreased (Figure 6), which contradicts previous results obtained with traps equipped with a smaller mesh size (experimental traps), which predicted an increase for 2016. The results of the last trawl survey, conducted in 2015, showed a high density of adolescents in 2015 and predicted a greater number of adolescent crabs in 2016, which should lead to a strong recruitment to the fishery in 2017 and 2018. The average size of legal-size adult crabs increased during the 2016 post-season survey, suggesting that it will be higher in the 2017 commercial fishery. The combined index of commercial CPUE and of NUE from the post-season survey increased in 2016 compared to 2015 but remains below average. This index suggests that there will be more biomass available to the fishery in 2017 than there was in 2016.
The average amount of sperm stored in the females’ spermathecae increased in 2016 compared to 2015, suggesting a sex ratio that allows for increased reproductive success.
A marked decrease in the preferred habitat of snow crab in Area 17 has been observed in recent years, which could have an impact on stock productivity.
Outlook and conclusions The rise in the combined index suggests that catches could increase in 2017 compared to 2016:
1) An increase in catches of 30% or more would lead to a high harvesting intensity, which could reduce the expected increase in commercial biomass.
Quebec Region Assessment of the Estuary and Northern Gulf of St. Lawrence
(Areas 13 to 17, 12A, 12B, 12C and 16A) Snow Crab Stocks in 2016
7
2) An increase of 25% should lead to a moderate harvesting intensity and help increase the biomass available to the fishery.
3) An increase of 15% or less would help increase the biomass available to the fishery or maintain it over a longer period.
Figure 3. Landings and TAC in Area 17 from 1983 to 2016. Figure 4. Standardized CPUE ± confidence interval in the commercial fishery from 1985 to 2016 in Area 17. The dotted line shows the data series average.
Figure 5. Catch rates (NUE), with confidence interval and average, of adult crabs ≥ 95 mm, from the post-season survey in Area 17 from 1996 to 2016.
Figure 6. Catch rates (NUE), with confidence interval and average, of adolescent crabs ≥ 78 mm and recruits from the post-season survey in Area 17 from 1996 to 2016.
Area 16 Description of the fishery
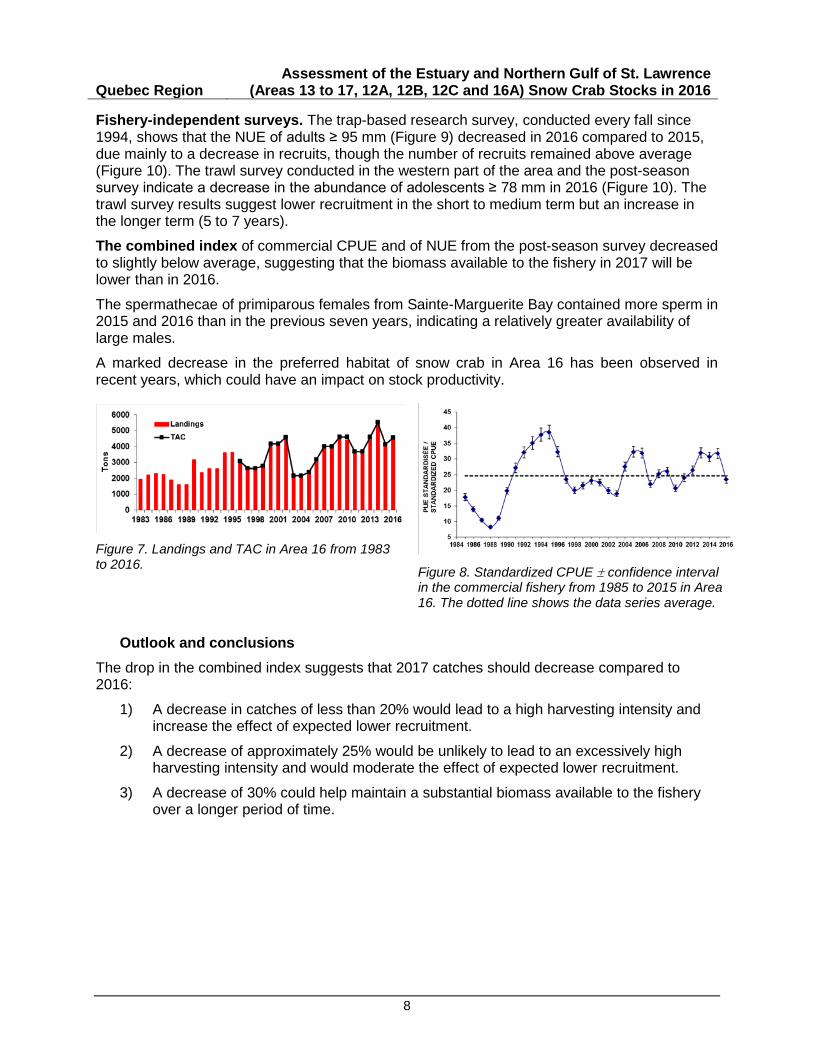
In Area 16, there are 38 fishers who hold regular snow crab licences in group A (92.7% of the TAC) and 16 who hold special licences in groups B and C (7.3% of the TAC). The TAC increased by 10% in 2016 to 4,561 t (Figure 7). The fishery opened on April 4 and closed on July 10. The TAC was reached.
Resource status in 2016 Commercial fishery. The standardized CPUE, which was well above the historical average from 2013 to 2015, decreased to slightly below average in 2016 (Figure 8). Landings since 2006 have consisted primarily of recruits (carapace conditions 1 and 2), which could have been the result of high fishing pressure at the outset of the period, which was followed by high recruitment to the fishery.
Quebec Region Assessment of the Estuary and Northern Gulf of St. Lawrence
(Areas 13 to 17, 12A, 12B, 12C and 16A) Snow Crab Stocks in 2016
8
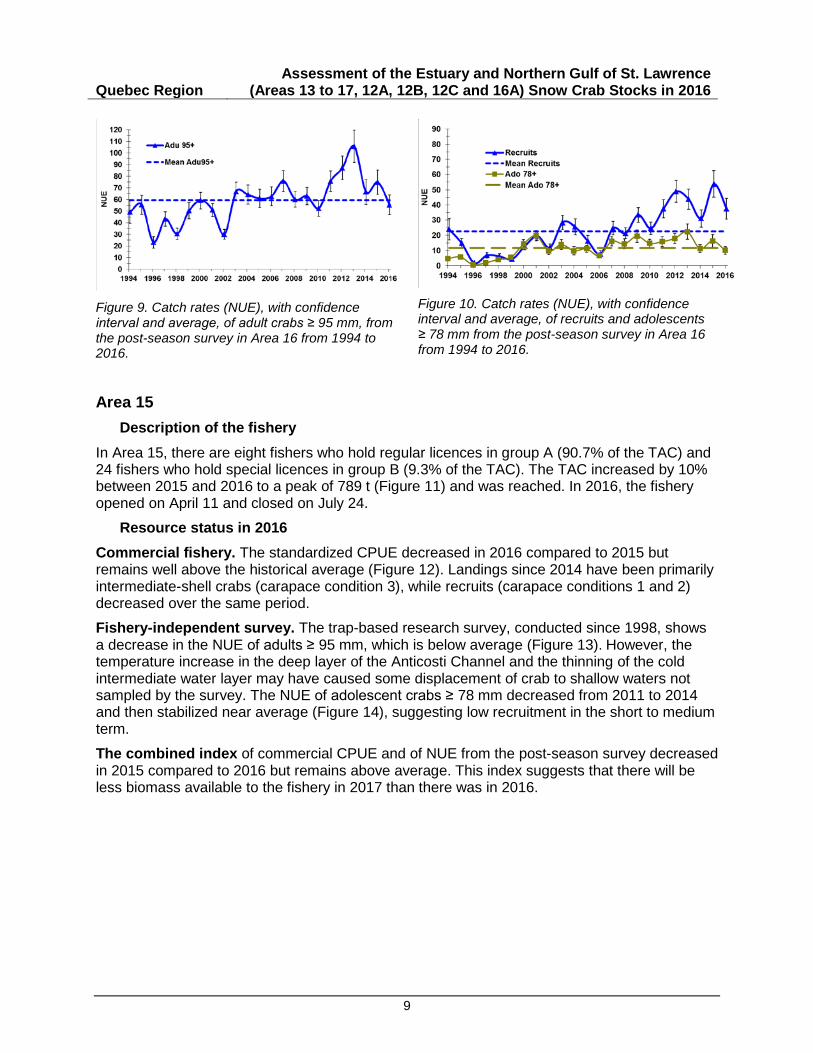
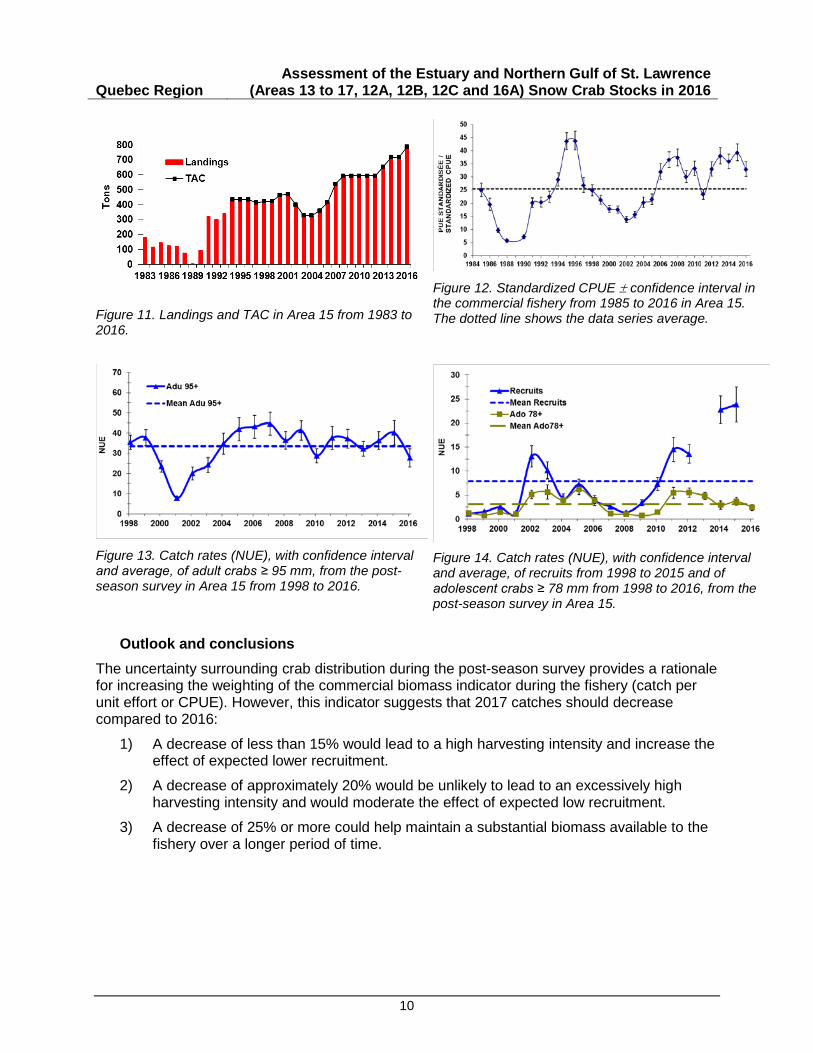
Fishery-independent surveys. The trap-based research survey, conducted every fall since 1994, shows that the NUE of adults ≥ 95 mm (Figure 9) decreased in 2016 compared to 2015, due mainly to a decrease in recruits, though the number of recruits remained above average (Figure 10). The trawl survey conducted in the western part of the area and the post-season survey indicate a decrease in the abundance of adolescents ≥ 78 mm in 2016 (Figure 10). The trawl survey results suggest lower recruitment in the short to medium term but an increase in the longer term (5 to 7 years).
The combined index of commercial CPUE and of NUE from the post-season survey decreased to slightly below average, suggesting that the biomass available to the fishery in 2017 will be lower than in 2016.
The spermathecae of primiparous females from Sainte-Marguerite Bay contained more sperm in 2015 and 2016 than in the previous seven years, indicating a relatively greater availability of large males.
A marked decrease in the preferred habitat of snow crab in Area 16 has been observed in recent years, which could have an impact on stock productivity.
Figure 7. Landings and TAC in Area 16 from 1983 to 2016. Figure 8. Standardized CPUE ± confidence interval
in the commercial fishery from 1985 to 2015 in Area 16. The dotted line shows the data series average.
Outlook and conclusions The drop in the combined index suggests that 2017 catches should decrease compared to 2016:
1) A decrease in catches of less than 20% would lead to a high harvesting intensity and increase the effect of expected lower recruitment.
2) A decrease of approximately 25% would be unlikely to lead to an excessively high harvesting intensity and would moderate the effect of expected lower recruitment.
3) A decrease of 30% could help maintain a substantial biomass available to the fishery over a longer period of time.
Quebec Region Assessment of the Estuary and Northern Gulf of St. Lawrence
(Areas 13 to 17, 12A, 12B, 12C and 16A) Snow Crab Stocks in 2016
9
Figure 9. Catch rates (NUE), with confidence interval and average, of adult crabs ≥ 95 mm, from the post-season survey in Area 16 from 1994 to 2016.
Figure 10. Catch rates (NUE), with confidence interval and average, of recruits and adolescents ≥ 78 mm from the post-season survey in Area 16 from 1994 to 2016.
Area 15 Description of the fishery
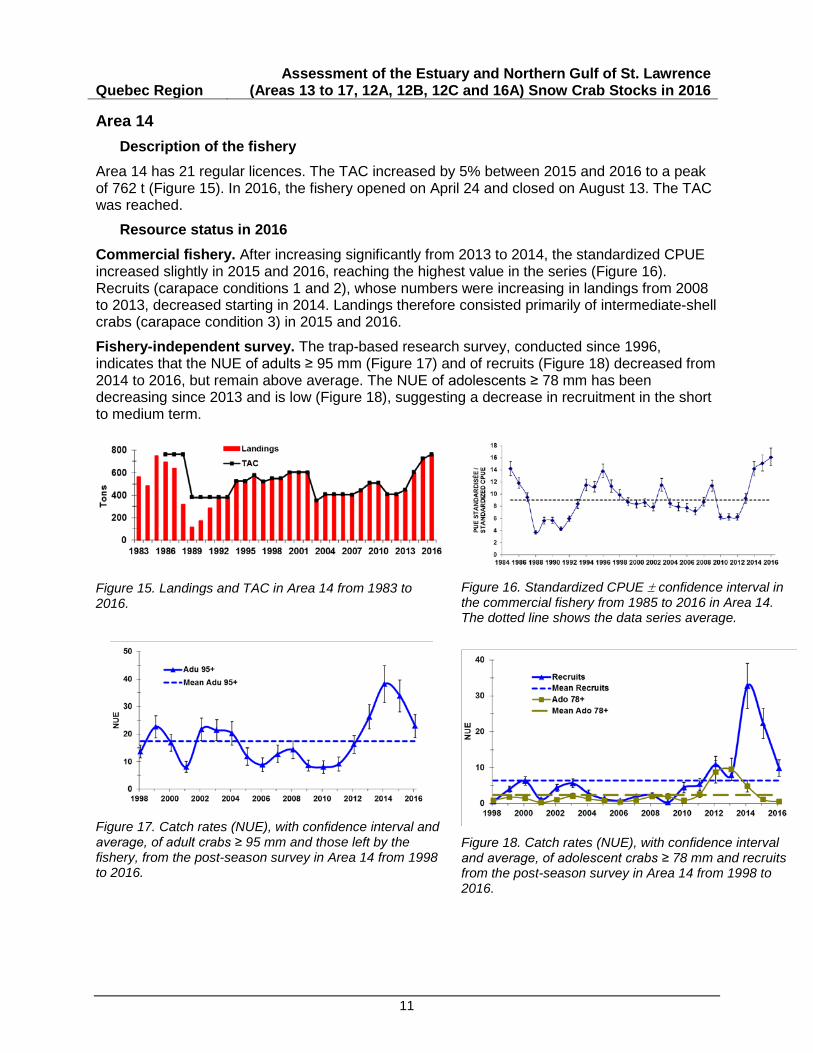
In Area 15, there are eight fishers who hold regular licences in group A (90.7% of the TAC) and 24 fishers who hold special licences in group B (9.3% of the TAC). The TAC increased by 10% between 2015 and 2016 to a peak of 789 t (Figure 11) and was reached. In 2016, the fishery opened on April 11 and closed on July 24.
Resource status in 2016 Commercial fishery. The standardized CPUE decreased in 2016 compared to 2015 but remains well above the historical average (Figure 12). Landings since 2014 have been primarily intermediate-shell crabs (carapace condition 3), while recruits (carapace conditions 1 and 2) decreased over the same period.
Fishery-independent survey. The trap-based research survey, conducted since 1998, shows a decrease in the NUE of adults ≥ 95 mm, which is below average (Figure 13). However, the temperature increase in the deep layer of the Anticosti Channel and the thinning of the cold intermediate water layer may have caused some displacement of crab to shallow waters not sampled by the survey. The NUE of adolescent crabs ≥ 78 mm decreased from 2011 to 2014 and then stabilized near average (Figure 14), suggesting low recruitment in the short to medium term.
The combined index of commercial CPUE and of NUE from the post-season survey decreased in 2015 compared to 2016 but remains above average. This index suggests that there will be less biomass available to the fishery in 2017 than there was in 2016.
Quebec Region Assessment of the Estuary and Northern Gulf of St. Lawrence
(Areas 13 to 17, 12A, 12B, 12C and 16A) Snow Crab Stocks in 2016
10
Figure 11. Landings and TAC in Area 15 from 1983 to 2016.
Figure 12. Standardized CPUE ± confidence interval in the commercial fishery from 1985 to 2016 in Area 15. The dotted line shows the data series average.
Figure 13. Catch rates (NUE), with confidence interval and average, of adult crabs ≥ 95 mm, from the post-season survey in Area 15 from 1998 to 2016.
Figure 14. Catch rates (NUE), with confidence interval and average, of recruits from 1998 to 2015 and of adolescent crabs ≥ 78 mm from 1998 to 2016, from the post-season survey in Area 15.
Outlook and conclusions The uncertainty surrounding crab distribution during the post-season survey provides a rationale for increasing the weighting of the commercial biomass indicator during the fishery (catch per unit effort or CPUE). However, this indicator suggests that 2017 catches should decrease compared to 2016:
1) A decrease of less than 15% would lead to a high harvesting intensity and increase the effect of expected lower recruitment.
2) A decrease of approximately 20% would be unlikely to lead to an excessively high harvesting intensity and would moderate the effect of expected low recruitment.
3) A decrease of 25% or more could help maintain a substantial biomass available to the fishery over a longer period of time.
Quebec Region Assessment of the Estuary and Northern Gulf of St. Lawrence
(Areas 13 to 17, 12A, 12B, 12C and 16A) Snow Crab Stocks in 2016
11
Area 14 Description of the fishery
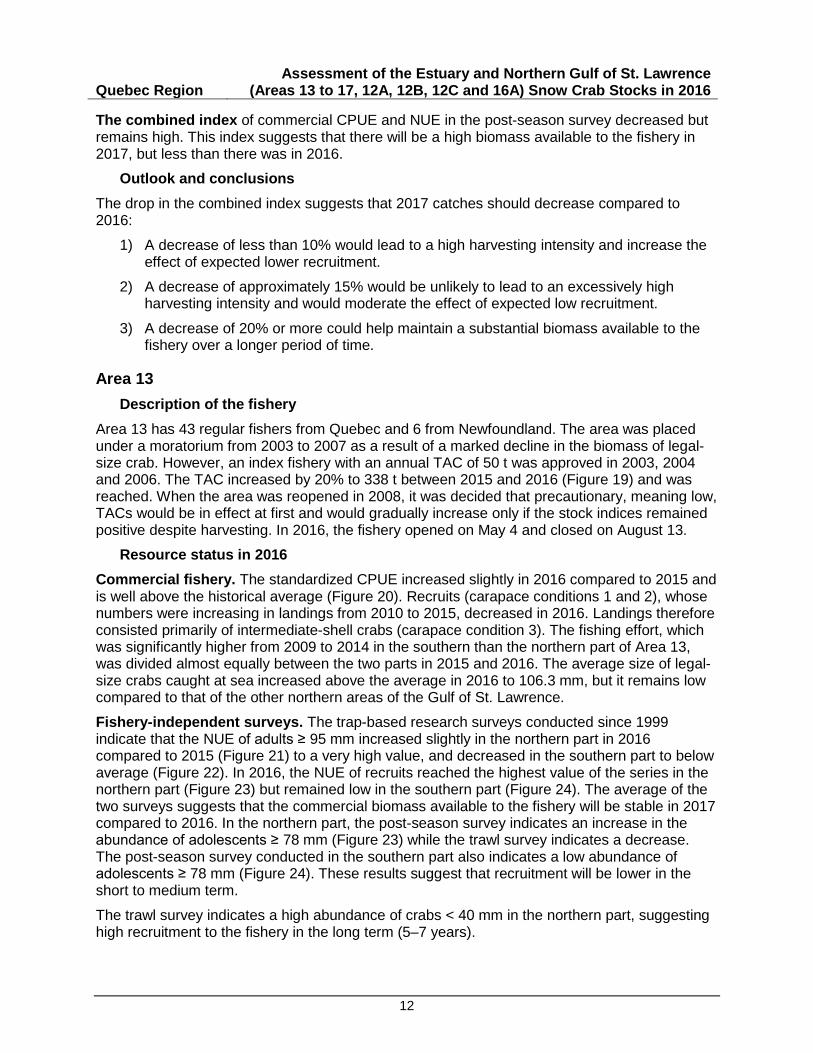
Area 14 has 21 regular licences. The TAC increased by 5% between 2015 and 2016 to a peak of 762 t (Figure 15). In 2016, the fishery opened on April 24 and closed on August 13. The TAC was reached.
Resource status in 2016 Commercial fishery. After increasing significantly from 2013 to 2014, the standardized CPUE increased slightly in 2015 and 2016, reaching the highest value in the series (Figure 16). Recruits (carapace conditions 1 and 2), whose numbers were increasing in landings from 2008 to 2013, decreased starting in 2014. Landings therefore consisted primarily of intermediate-shell crabs (carapace condition 3) in 2015 and 2016.
Fishery-independent survey. The trap-based research survey, conducted since 1996, indicates that the NUE of adults ≥ 95 mm (Figure 17) and of recruits (Figure 18) decreased from 2014 to 2016, but remain above average. The NUE of adolescents ≥ 78 mm has been decreasing since 2013 and is low (Figure 18), suggesting a decrease in recruitment in the short to medium term.
Figure 15. Landings and TAC in Area 14 from 1983 to 2016.
Figure 16. Standardized CPUE ± confidence interval in the commercial fishery from 1985 to 2016 in Area 14. The dotted line shows the data series average.
Figure 17. Catch rates (NUE), with confidence interval and average, of adult crabs ≥ 95 mm and those left by the fishery, from the post-season survey in Area 14 from 1998 to 2016.
Figure 18. Catch rates (NUE), with confidence interval and average, of adolescent crabs ≥ 78 mm and recruits from the post-season survey in Area 14 from 1998 to 2016.
Quebec Region Assessment of the Estuary and Northern Gulf of St. Lawrence
(Areas 13 to 17, 12A, 12B, 12C and 16A) Snow Crab Stocks in 2016
12
The combined index of commercial CPUE and NUE in the post-season survey decreased but remains high. This index suggests that there will be a high biomass available to the fishery in 2017, but less than there was in 2016.
Outlook and conclusions The drop in the combined index suggests that 2017 catches should decrease compared to 2016:
1) A decrease of less than 10% would lead to a high harvesting intensity and increase the effect of expected lower recruitment.
2) A decrease of approximately 15% would be unlikely to lead to an excessively high harvesting intensity and would moderate the effect of expected low recruitment.
3) A decrease of 20% or more could help maintain a substantial biomass available to the fishery over a longer period of time.
Area 13 Description of the fishery
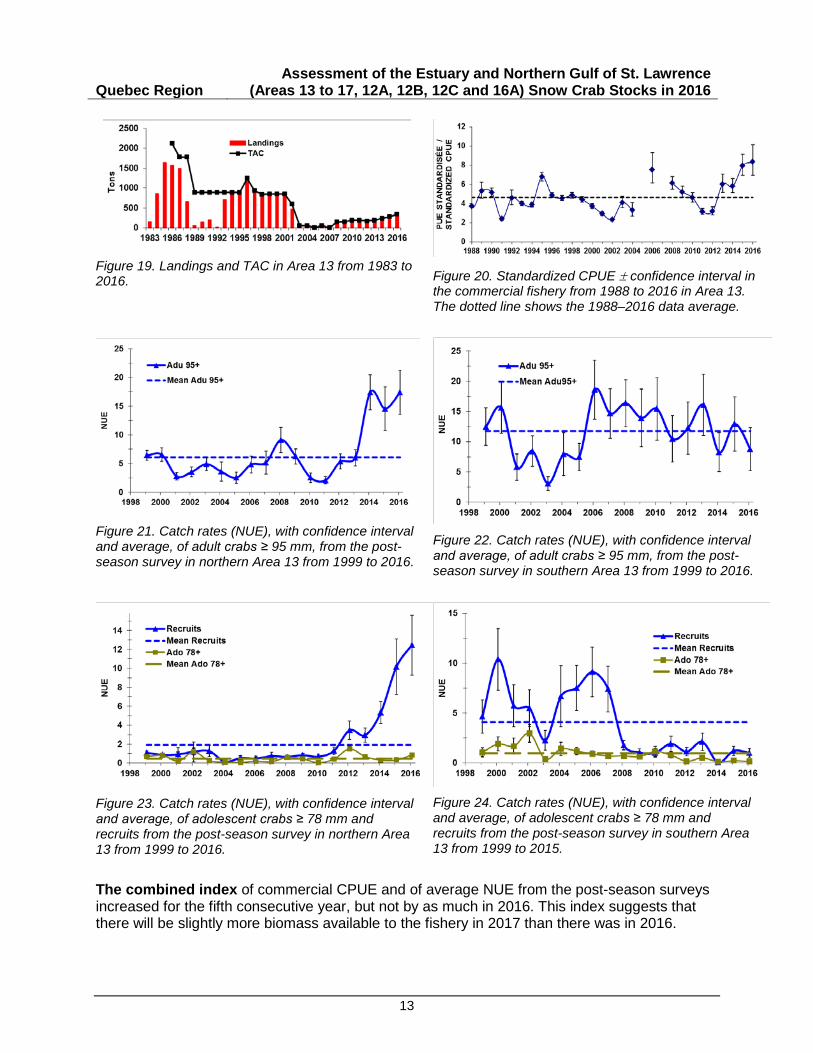
Area 13 has 43 regular fishers from Quebec and 6 from Newfoundland. The area was placed under a moratorium from 2003 to 2007 as a result of a marked decline in the biomass of legal-size crab. However, an index fishery with an annual TAC of 50 t was approved in 2003, 2004 and 2006. The TAC increased by 20% to 338 t between 2015 and 2016 (Figure 19) and was reached. When the area was reopened in 2008, it was decided that precautionary, meaning low, TACs would be in effect at first and would gradually increase only if the stock indices remained positive despite harvesting. In 2016, the fishery opened on May 4 and closed on August 13.
Resource status in 2016 Commercial fishery. The standardized CPUE increased slightly in 2016 compared to 2015 and is well above the historical average (Figure 20). Recruits (carapace conditions 1 and 2), whose numbers were increasing in landings from 2010 to 2015, decreased in 2016. Landings therefore consisted primarily of intermediate-shell crabs (carapace condition 3). The fishing effort, which was significantly higher from 2009 to 2014 in the southern than the northern part of Area 13, was divided almost equally between the two parts in 2015 and 2016. The average size of legal-size crabs caught at sea increased above the average in 2016 to 106.3 mm, but it remains low compared to that of the other northern areas of the Gulf of St. Lawrence.
Fishery-independent surveys. The trap-based research surveys conducted since 1999 indicate that the NUE of adults ≥ 95 mm increased slightly in the northern part in 2016 compared to 2015 (Figure 21) to a very high value, and decreased in the southern part to below average (Figure 22). In 2016, the NUE of recruits reached the highest value of the series in the northern part (Figure 23) but remained low in the southern part (Figure 24). The average of the two surveys suggests that the commercial biomass available to the fishery will be stable in 2017 compared to 2016. In the northern part, the post-season survey indicates an increase in the abundance of adolescents ≥ 78 mm (Figure 23) while the trawl survey indicates a decrease. The post-season survey conducted in the southern part also indicates a low abundance of adolescents ≥ 78 mm (Figure 24). These results suggest that recruitment will be lower in the short to medium term.
The trawl survey indicates a high abundance of crabs < 40 mm in the northern part, suggesting high recruitment to the fishery in the long term (5–7 years).
Quebec Region Assessment of the Estuary and Northern Gulf of St. Lawrence
(Areas 13 to 17, 12A, 12B, 12C and 16A) Snow Crab Stocks in 2016
13
Figure 19. Landings and TAC in Area 13 from 1983 to 2016. Figure 20. Standardized CPUE ± confidence interval in
the commercial fishery from 1988 to 2016 in Area 13. The dotted line shows the 1988–2016 data average.
Figure 21. Catch rates (NUE), with confidence interval and average, of adult crabs ≥ 95 mm, from the post-season survey in northern Area 13 from 1999 to 2016.
Figure 22. Catch rates (NUE), with confidence interval and average, of adult crabs ≥ 95 mm, from the post-season survey in southern Area 13 from 1999 to 2016.
Figure 23. Catch rates (NUE), with confidence interval and average, of adolescent crabs ≥ 78 mm and recruits from the post-season survey in northern Area 13 from 1999 to 2016.
Figure 24. Catch rates (NUE), with confidence interval and average, of adolescent crabs ≥ 78 mm and recruits from the post-season survey in southern Area 13 from 1999 to 2015.
The combined index of commercial CPUE and of average NUE from the post-season surveys increased for the fifth consecutive year, but not by as much in 2016. This index suggests that there will be slightly more biomass available to the fishery in 2017 than there was in 2016.
Quebec Region Assessment of the Estuary and Northern Gulf of St. Lawrence
(Areas 13 to 17, 12A, 12B, 12C and 16A) Snow Crab Stocks in 2016
14
Outlook and conclusions This stock was reopened to fishing in 2008, and it was subject to a conservative harvesting approach. The slight rise in the combined index suggests that it is possible to maintain or slightly increase catches in 2017 compared to 2016:
1) An increase in catches of 15 to 20% would lead to a high harvesting intensity and could reduce the biomass available to the fishery in 2018.
2) The status quo or an increase of no more than 10% would help maintain the biomass available to the fishery.
3) A decrease would help maintain a substantial biomass available to the fishery over a longer period of time.
Area 12A Description of the fishery
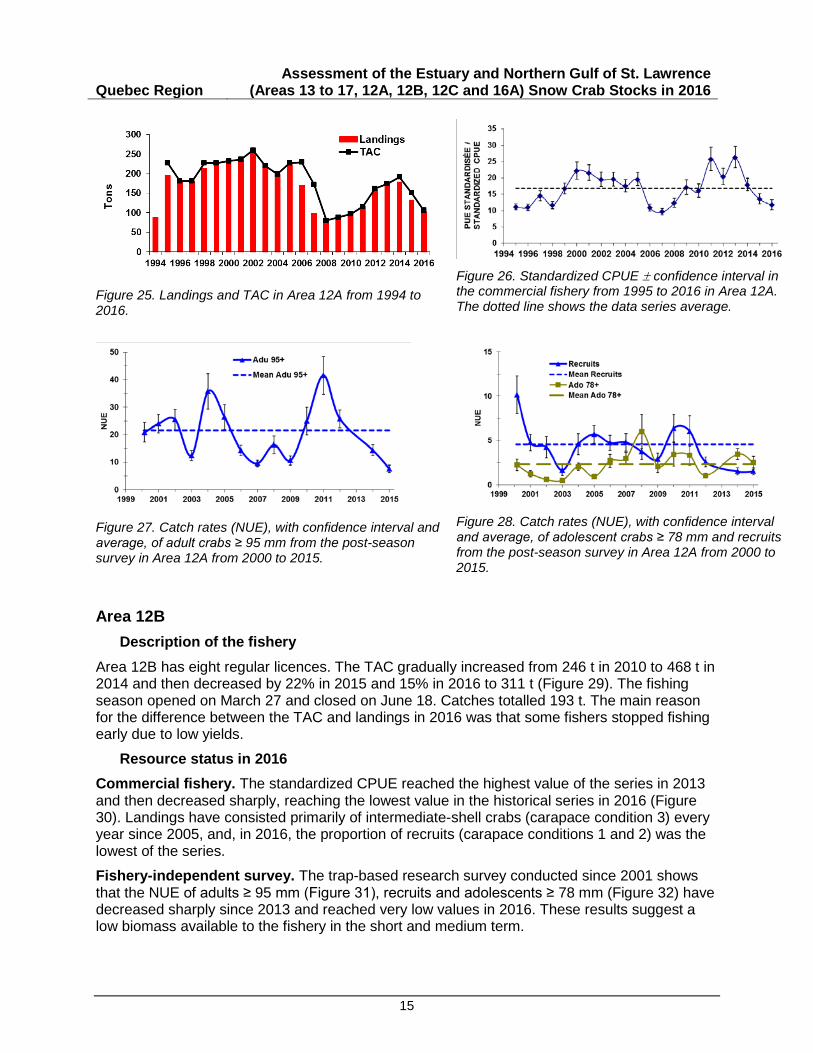
Area 12A has 10 regular licences. The TAC was 151 t in 2015 and was decreased by 30% in 2016 to 106 t (Figure 25). In 2016, the fishery opened on March 22 and closed on June 6. The TAC was reached.
Resource status in 2016 Commercial fishery. The standardized CPUE went from the highest value of the series in 2013 to well below average in 2016 (Figure 26). There were few recruits (carapace conditions 1 and 2) in the landings, which consisted primarily of intermediate-shell crabs (carapace condition 3).
The average size of crabs caught in the commercial fishery has been decreasing since 2013 due to a decline in the number of large crabs and a greater percentage of crabs near the legal size.
Fishery-independent survey. The trap-based research survey, which started in 2000, was not conducted in 2013 or 2016. The NUE of adults ≥ 95 mm decreased in 2015 compared to 2014, to the lowest value of the series (Figure 27). The NUE of recruits remained stable in 2015 compared to 2014, at the lowest value of the series (Figure 28). The NUE of adolescents ≥ 78 mm decreased in 2015 to a value close to the average (Figure 28). It is important to note that the abundance of crabs in Area 12A is partially determined by overflow from adjacent areas (17 to the west and 12 to the east).
A decrease in the preferred habitat of snow crab in Area 12A has been observed in recent years, which could have an impact on stock productivity.
Outlook and conclusions The decrease in the commercial catch rate suggests that 2017 catches should decrease compared to 2016. A lack of information due to the absence of a post-season survey warrants greater caution in the choice of scenarios.
1) A decrease in catches of less than 10% would lead to a high harvesting intensity and could reduce the biomass available to the fishery in 2018.
2) A decrease of approximately 15% could lead to a moderate harvesting intensity and help maintain the biomass available to the fishery.
3) A decrease of over 15% could help increase the biomass available or maintain it over a longer period.
Quebec Region Assessment of the Estuary and Northern Gulf of St. Lawrence
(Areas 13 to 17, 12A, 12B, 12C and 16A) Snow Crab Stocks in 2016
15
Figure 25. Landings and TAC in Area 12A from 1994 to 2016.
Figure 26. Standardized CPUE ± confidence interval in the commercial fishery from 1995 to 2016 in Area 12A. The dotted line shows the data series average.
Figure 27. Catch rates (NUE), with confidence interval and average, of adult crabs ≥ 95 mm from the post-season survey in Area 12A from 2000 to 2015.
Figure 28. Catch rates (NUE), with confidence interval and average, of adolescent crabs ≥ 78 mm and recruits from the post-season survey in Area 12A from 2000 to 2015.
Area 12B Description of the fishery
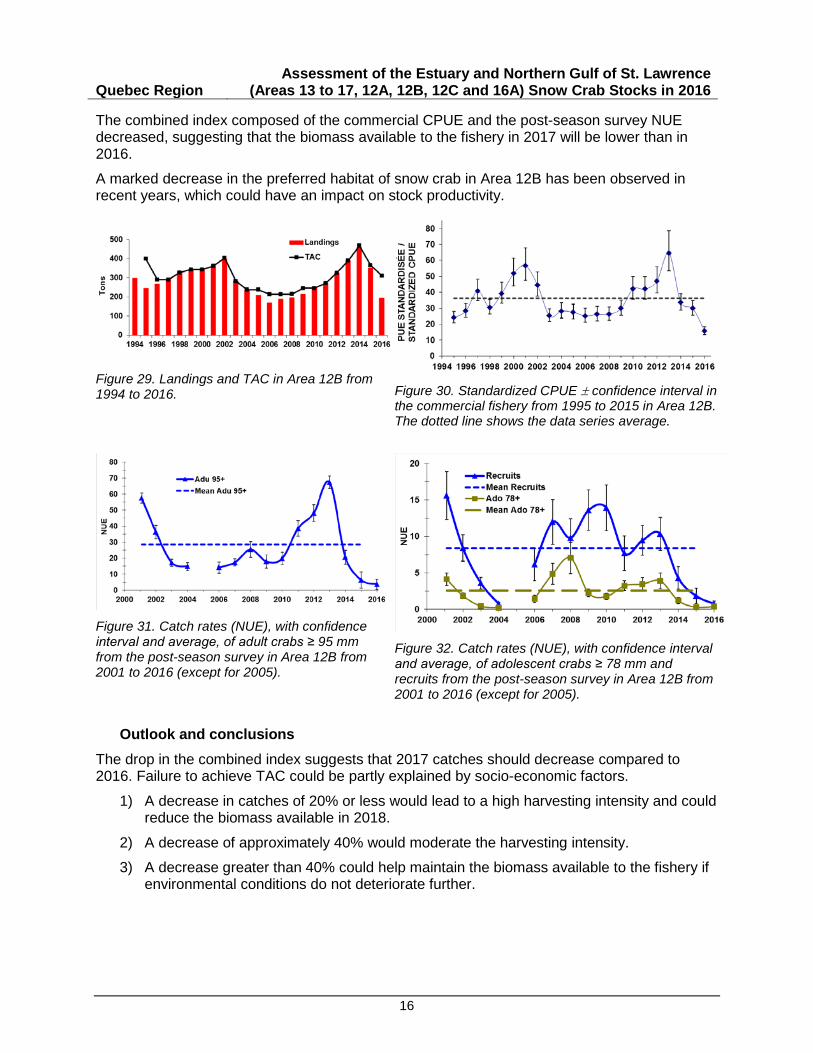
Area 12B has eight regular licences. The TAC gradually increased from 246 t in 2010 to 468 t in 2014 and then decreased by 22% in 2015 and 15% in 2016 to 311 t (Figure 29). The fishing season opened on March 27 and closed on June 18. Catches totalled 193 t. The main reason for the difference between the TAC and landings in 2016 was that some fishers stopped fishing early due to low yields.
Resource status in 2016 Commercial fishery. The standardized CPUE reached the highest value of the series in 2013 and then decreased sharply, reaching the lowest value in the historical series in 2016 (Figure 30). Landings have consisted primarily of intermediate-shell crabs (carapace condition 3) every year since 2005, and, in 2016, the proportion of recruits (carapace conditions 1 and 2) was the lowest of the series.
Fishery-independent survey. The trap-based research survey conducted since 2001 shows that the NUE of adults ≥ 95 mm (Figure 31), recruits and adolescents ≥ 78 mm (Figure 32) have decreased sharply since 2013 and reached very low values in 2016. These results suggest a low biomass available to the fishery in the short and medium term.
Quebec Region Assessment of the Estuary and Northern Gulf of St. Lawrence
(Areas 13 to 17, 12A, 12B, 12C and 16A) Snow Crab Stocks in 2016
16
The combined index composed of the commercial CPUE and the post-season survey NUE decreased, suggesting that the biomass available to the fishery in 2017 will be lower than in 2016.
A marked decrease in the preferred habitat of snow crab in Area 12B has been observed in recent years, which could have an impact on stock productivity.
Figure 29. Landings and TAC in Area 12B from 1994 to 2016. Figure 30. Standardized CPUE ± confidence interval in
the commercial fishery from 1995 to 2015 in Area 12B. The dotted line shows the data series average.
Figure 31. Catch rates (NUE), with confidence interval and average, of adult crabs ≥ 95 mm from the post-season survey in Area 12B from 2001 to 2016 (except for 2005).
Figure 32. Catch rates (NUE), with confidence interval and average, of adolescent crabs ≥ 78 mm and recruits from the post-season survey in Area 12B from 2001 to 2016 (except for 2005).
Outlook and conclusions The drop in the combined index suggests that 2017 catches should decrease compared to 2016. Failure to achieve TAC could be partly explained by socio-economic factors.
1) A decrease in catches of 20% or less would lead to a high harvesting intensity and could reduce the biomass available in 2018.
2) A decrease of approximately 40% would moderate the harvesting intensity.
3) A decrease greater than 40% could help maintain the biomass available to the fishery if environmental conditions do not deteriorate further.
Quebec Region Assessment of the Estuary and Northern Gulf of St. Lawrence
(Areas 13 to 17, 12A, 12B, 12C and 16A) Snow Crab Stocks in 2016
17
Area 12C Description of the fishery
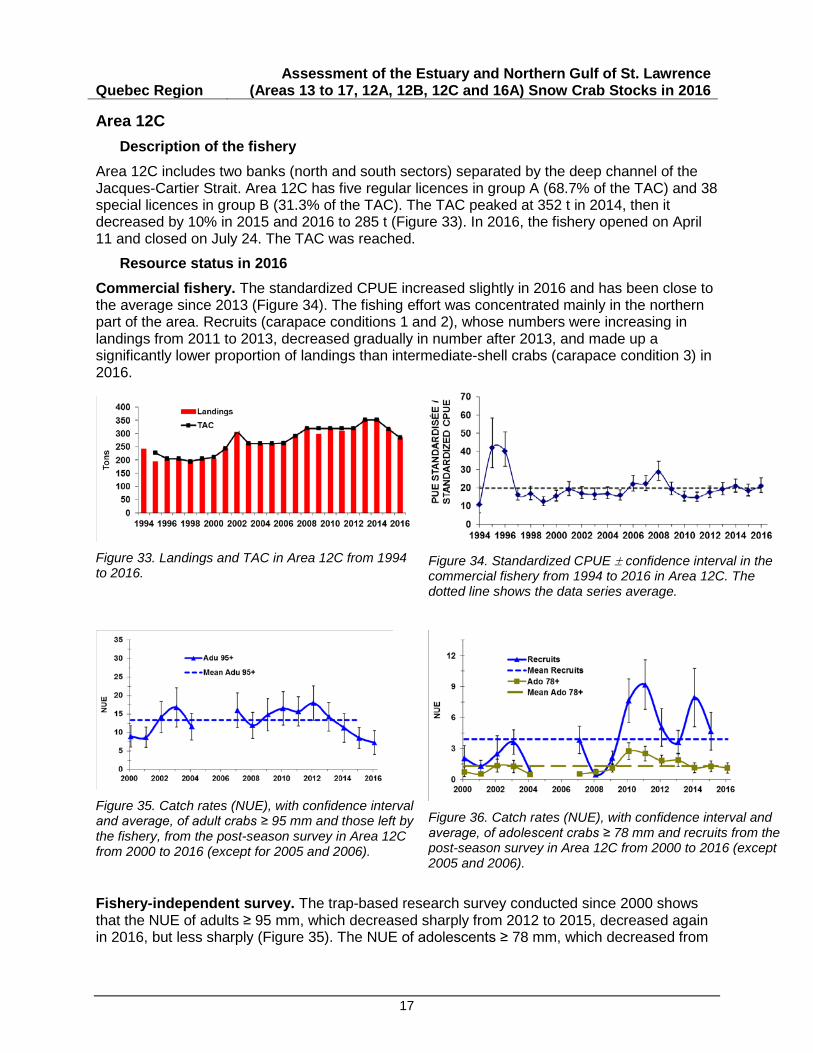
Area 12C includes two banks (north and south sectors) separated by the deep channel of the Jacques-Cartier Strait. Area 12C has five regular licences in group A (68.7% of the TAC) and 38 special licences in group B (31.3% of the TAC). The TAC peaked at 352 t in 2014, then it decreased by 10% in 2015 and 2016 to 285 t (Figure 33). In 2016, the fishery opened on April 11 and closed on July 24. The TAC was reached.
Resource status in 2016 Commercial fishery. The standardized CPUE increased slightly in 2016 and has been close to the average since 2013 (Figure 34). The fishing effort was concentrated mainly in the northern part of the area. Recruits (carapace conditions 1 and 2), whose numbers were increasing in landings from 2011 to 2013, decreased gradually in number after 2013, and made up a significantly lower proportion of landings than intermediate-shell crabs (carapace condition 3) in 2016.
Figure 33. Landings and TAC in Area 12C from 1994 to 2016.
Figure 34. Standardized CPUE ± confidence interval in the commercial fishery from 1994 to 2016 in Area 12C. The dotted line shows the data series average.
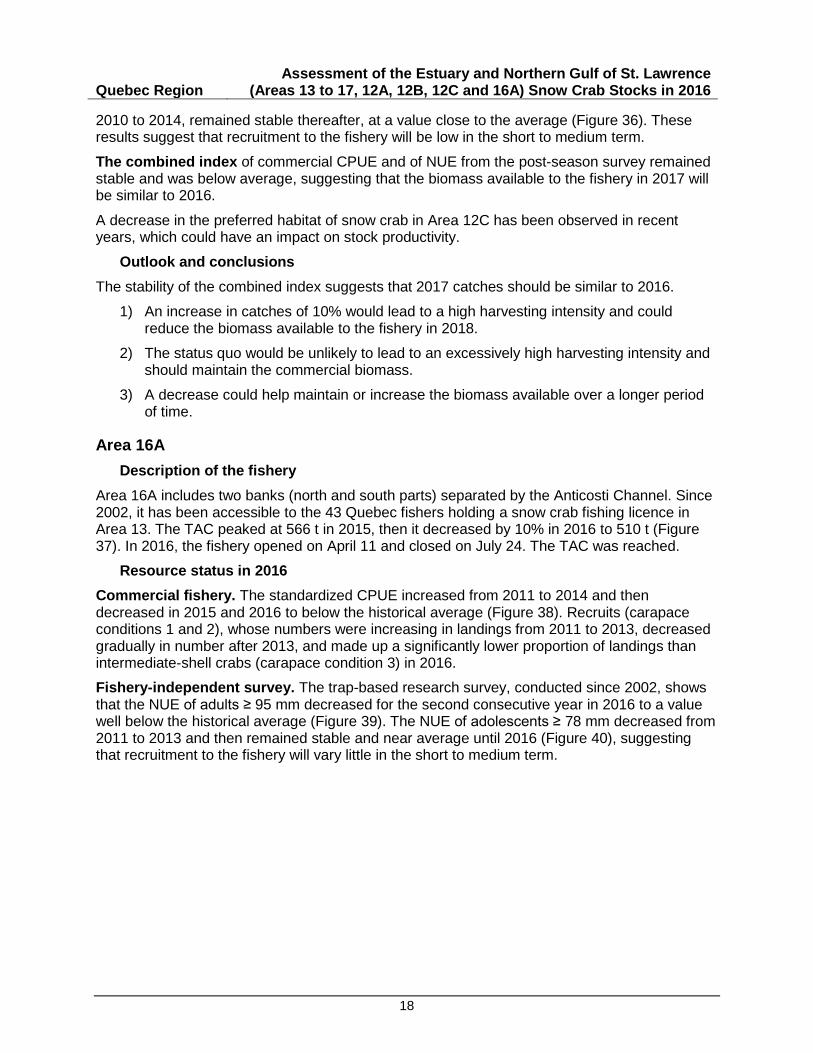
Figure 35. Catch rates (NUE), with confidence interval and average, of adult crabs ≥ 95 mm and those left by the fishery, from the post-season survey in Area 12C from 2000 to 2016 (except for 2005 and 2006).
Figure 36. Catch rates (NUE), with confidence interval and average, of adolescent crabs ≥ 78 mm and recruits from the post-season survey in Area 12C from 2000 to 2016 (except 2005 and 2006).
Fishery-independent survey. The trap-based research survey conducted since 2000 shows that the NUE of adults ≥ 95 mm, which decreased sharply from 2012 to 2015, decreased again in 2016, but less sharply (Figure 35). The NUE of adolescents ≥ 78 mm, which decreased from
Quebec Region Assessment of the Estuary and Northern Gulf of St. Lawrence
(Areas 13 to 17, 12A, 12B, 12C and 16A) Snow Crab Stocks in 2016
18
2010 to 2014, remained stable thereafter, at a value close to the average (Figure 36). These results suggest that recruitment to the fishery will be low in the short to medium term.
The combined index of commercial CPUE and of NUE from the post-season survey remained stable and was below average, suggesting that the biomass available to the fishery in 2017 will be similar to 2016.
A decrease in the preferred habitat of snow crab in Area 12C has been observed in recent years, which could have an impact on stock productivity.
Outlook and conclusions The stability of the combined index suggests that 2017 catches should be similar to 2016.
1) An increase in catches of 10% would lead to a high harvesting intensity and could reduce the biomass available to the fishery in 2018.
2) The status quo would be unlikely to lead to an excessively high harvesting intensity and should maintain the commercial biomass.
3) A decrease could help maintain or increase the biomass available over a longer period of time.
Area 16A Description of the fishery
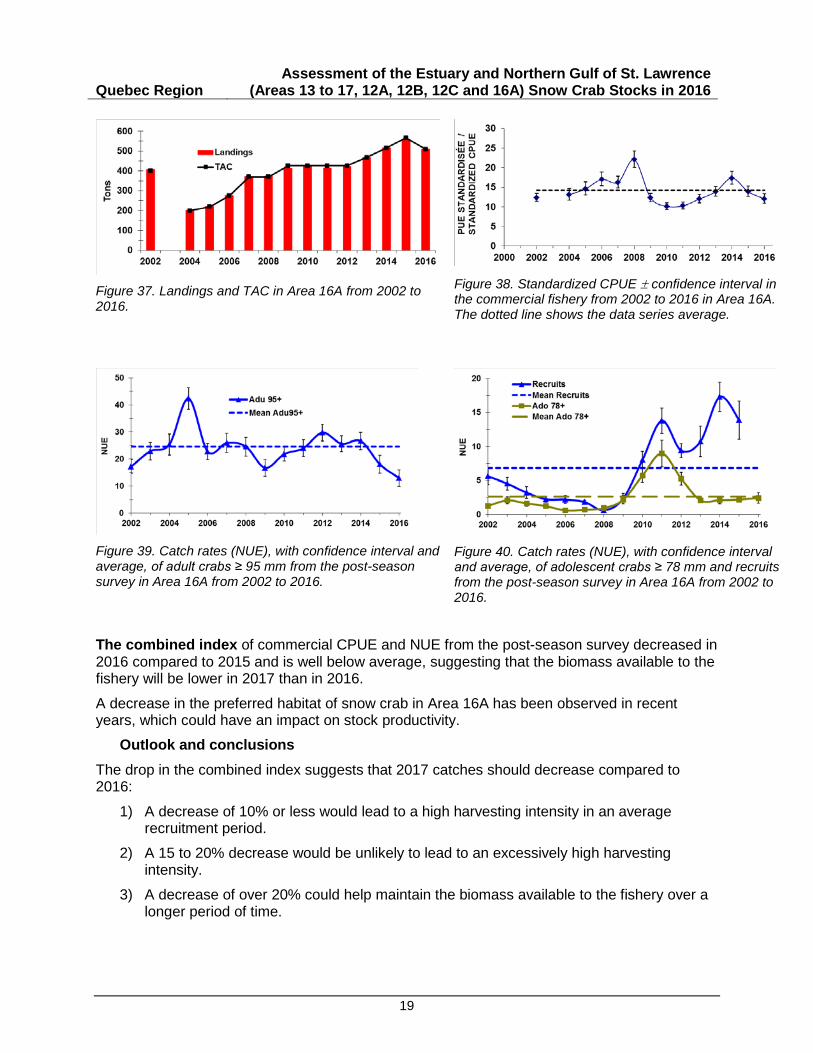
Area 16A includes two banks (north and south parts) separated by the Anticosti Channel. Since 2002, it has been accessible to the 43 Quebec fishers holding a snow crab fishing licence in Area 13. The TAC peaked at 566 t in 2015, then it decreased by 10% in 2016 to 510 t (Figure 37). In 2016, the fishery opened on April 11 and closed on July 24. The TAC was reached.
Resource status in 2016 Commercial fishery. The standardized CPUE increased from 2011 to 2014 and then decreased in 2015 and 2016 to below the historical average (Figure 38). Recruits (carapace conditions 1 and 2), whose numbers were increasing in landings from 2011 to 2013, decreased gradually in number after 2013, and made up a significantly lower proportion of landings than intermediate-shell crabs (carapace condition 3) in 2016.
Fishery-independent survey. The trap-based research survey, conducted since 2002, shows that the NUE of adults ≥ 95 mm decreased for the second consecutive year in 2016 to a value well below the historical average (Figure 39). The NUE of adolescents ≥ 78 mm decreased from 2011 to 2013 and then remained stable and near average until 2016 (Figure 40), suggesting that recruitment to the fishery will vary little in the short to medium term.
Quebec Region Assessment of the Estuary and Northern Gulf of St. Lawrence
(Areas 13 to 17, 12A, 12B, 12C and 16A) Snow Crab Stocks in 2016
19
Figure 37. Landings and TAC in Area 16A from 2002 to 2016.
Figure 38. Standardized CPUE ± confidence interval in the commercial fishery from 2002 to 2016 in Area 16A. The dotted line shows the data series average.
Figure 39. Catch rates (NUE), with confidence interval and average, of adult crabs ≥ 95 mm from the post-season survey in Area 16A from 2002 to 2016.
Figure 40. Catch rates (NUE), with confidence interval and average, of adolescent crabs ≥ 78 mm and recruits from the post-season survey in Area 16A from 2002 to 2016.
The combined index of commercial CPUE and NUE from the post-season survey decreased in 2016 compared to 2015 and is well below average, suggesting that the biomass available to the fishery will be lower in 2017 than in 2016.
A decrease in the preferred habitat of snow crab in Area 16A has been observed in recent years, which could have an impact on stock productivity.
Outlook and conclusions The drop in the combined index suggests that 2017 catches should decrease compared to 2016:
1) A decrease of 10% or less would lead to a high harvesting intensity in an average recruitment period.
2) A 15 to 20% decrease would be unlikely to lead to an excessively high harvesting intensity.
3) A decrease of over 20% could help maintain the biomass available to the fishery over a longer period of time.
Quebec Region Assessment of the Estuary and Northern Gulf of St. Lawrence
(Areas 13 to 17, 12A, 12B, 12C and 16A) Snow Crab Stocks in 2016
20
Sources of uncertainty The quality of science advice depends mainly on the accuracy of the parameters obtained through sampling and the subsequent analyses. Information obtained from logbooks and purchase slips during the fishing season affects the accuracy of the parameters derived from these documents. For instance, abundance indices and fishing effort calculations obtained from logbooks may include errors that will affect the scientific advice provided. The selectivity and catchability of traps can vary depending on the type of trap used, its volume and mesh size, the amount and quality of bait used and soak time, which can vary with fishing strategies employed and the prevailing environmental conditions. The catchability of adolescent crabs and recruits can also be affected by the abundance of intermediate-size crabs (carapace condition 3) on the seafloor. The selective sorting of catches can also affect the quality of the data obtained.
The abundance and condition indices and the estimates of crab size obtained from the trawl and trap surveys are affected by the type of gear used and by uncertainties related to catchability variations in the different crab groups targeted. Some types of fishing gear are better suited to given seafloor areas than other types, and this factor influences the spatial coverage ultimately sampled. The biological characteristics specific to snow crabs can also create sources of uncertainty that impinge on the scientific advice. For instance, the terminal moulting phase, which occurs at various sizes, affects crab condition and catchability. Natural mortality can also vary with the life cycle stage and condition of the crabs.
OTHER CONSIDERATIONS Snow crab distribution is linked to the thickness (and temperature) of the cold intermediate water layer, which is its benthic phase habitat. However, the increase in the temperature of the deep layer, observed for several years in the Gulf of St. Lawrence, accompanied by the warming of the surface layer, may reduce crab habitat area and affect its distribution. The length of early pelagic larval development stages and larvae survival are related to surface water temperatures (mainly in spring and summer) just as egg incubation time and crab growth are related to the temperature of the seafloor where they develop. It thus seems that stock distribution and productivity could be affected by the temperature in the various water layers. The effect of warming waters on crab productivity and stock distribution is a real issue. Impacts could vary significantly in different regions or areas.
SOURCES OF INFORMATION This Science Advisory Report is from the February 14-15, 2017, meeting on the Assessment of the Estuary and northern Gulf of St. Lawrence Snow Crab stocks. Additional publications from this meeting will be posted on the Fisheries and Oceans Canada Science Advisory Schedule as they become available.
Dufour, R. and J.-P. Dallaire. 2003. Status of snow crab populations in the St. Lawrence Estuary and the Northern Gulf of St. Lawrence from 1999 to 2001. DFO Can. Sci. Advis. Sec. Res. Doc. 2003/048.
Lambert, J. and J.-P. Dallaire. 2016. Status of major snow crab stocks in the Estuary and northern Gulf of St. Lawrence in 2014 (areas 13, 14, 15, 16 and 17). DFO Can. Sci. Advis. Sec. Res. Doc. 2016/082. vi + 97 p. [In French only.]
DFO 2016. Assessment of the Estuary and Northern Gulf of St. Lawrence (Areas 13 to 17, 12A, 12B, 12C and 16A) Snow Crab Stocks in 2015. DFO Can. Sci. Advis. Sec. Sci. Advis. Rep. 2016/023.
Quebec Region Assessment of the Estuary and Northern Gulf of St. Lawrence
(Areas 13 to 17, 12A, 12B, 12C and 16A) Snow Crab Stocks in 2016
21
Sainte-Marie, B., J.-M. Sévigny, and M. Carpentier. 2002. Interannual variability of sperm reserves and fecundity of primiparous females of the snow crab (Chionoecetes opilio) in relation to sex ratio. Can. J. Fish. Aquat. Sci. 59: 1932-1940.
THIS REPORT IS AVAILABLE FROM THE: Centre for Science Advice (CSA)
Quebec Region Fisheries and Oceans Canada Maurice Lamontagne Institute
850 route de la Mer P.O. Box 1000
Mont-Joli, Quebec, Canada G5H 3Z4
Telephone: 418-775-0825 Email: [email protected]
Internet address: www.dfo-mpo.gc.ca/csas-sccs/
ISSN 1919-5087 © Her Majesty the Queen in Right of Canada, 2017
Correct citation for this publication:
DFO. 2017. Assessment of the Estuary and Northern Gulf of St. Lawrence (Areas 13 to 17, 12A, 12B, 12C and 16A) Snow Crab Stocks in 2016. DFO Can. Sci. Advis. Sec. Sci. Advis. Rep. 2017/020.
Aussi disponible en français :
MPO. 2017. Évaluation des stocks de crabe des neiges de l’estuaire et du nord du golfe du Saint-Laurent (Zones 13 À 17, 12A, 12B, 12C et 16A) en 2016. Secr. can. de consult. sci. du MPO, Avis sci. 2017/020.