assessment of the expanded homeowners assistance program - hap report part ii... · september 2012...
TRANSCRIPT
S E P T E M B E R 2 0 1 2
ASSESSMENT OF THE EXPANDED
HOMEOWNERS ASSISTANCE PROGRAM
AN ANALYSIS OF KEY CONCERNS IDENTIF IED IN THE
NATIONAL DEFENSE AUTHORIZATION ACT
FOR F ISCAL YEAR 2012
REPORT CE212T2
Rodney T. Roper
Ami ta S i ngh
Doug l a s T. Whee l er

NOTICE :
THE VIEWS, OPINIONS, AND FINDINGS CON-
TAINED IN THIS REPORT ARE THOSE OF LMI AND
SHOULD NOT BE CONSTRUED AS AN OFFICIAL
AGENCY POSITION, POLICY, OR DECISION,
UNLESS SO DESIGNATED BY OTHER OFFICIAL
DOCUMENTATION.
LMI © 2012. ALL RIGHTS RESERVED.
iii
Assessment of the Expanded Homeowners Assistance Program: An Analysis of Key Concerns Identified in the National Defense Authorization Act for Fiscal Year 2012
CE212T2/SEPTEMBER 2012
Executive Summary
The National Defense Authorization Act (NDAA) for Fiscal Year 2012 required
the Department of Defense (DoD) to prepare a report for Congress on the expand-
ed Homeowners Assistance Program (HAP) that included three questions regard-
ing the cost of expanding the criteria for eligibility in the program. In addition,
House Committee on Armed Services Report 112-78 directed DoD to report to
Congress on the sufficiency of funding for the program, the volume and pro-
cessing of applications, and options for assistance at large military installations.
This report covers the three questions raised in the NDAA, while the three ques-
tions in the House report are addressed in a separate report.
Our specific findings with respect to expanded eligibility are as follows:
1. HAP expansion—home purchase date. If the home purchase date criterion
were expanded from July 1, 2006, to July 1, 2008, and the dates for per-
manent change of station (PCS) orders did not change, the additional cost
to the program would range from $1 billion to $1.8 billion, before any off-
sets from home sales.
2. HAP expansion—orders date. If the date criteria for the home purchase
date were expanded by 2 more years and for the permanent change of sta-
tion orders by 1 more year, the additional cost to the program of this extra
year of eligibility would range from $450 million to $570 million, before
offsets from home sales. This incremental cost, added to the cost of the
home purchase date expansion described in question 1, would give the
combined impact for expanding both criteria.
3. Number of service members impacted. If the date criteria for PCS orders
were expanded by the additional year described in question 2, an addition-
al 1,700 to 2,400 applicants would be eligible for the HAP.
iv
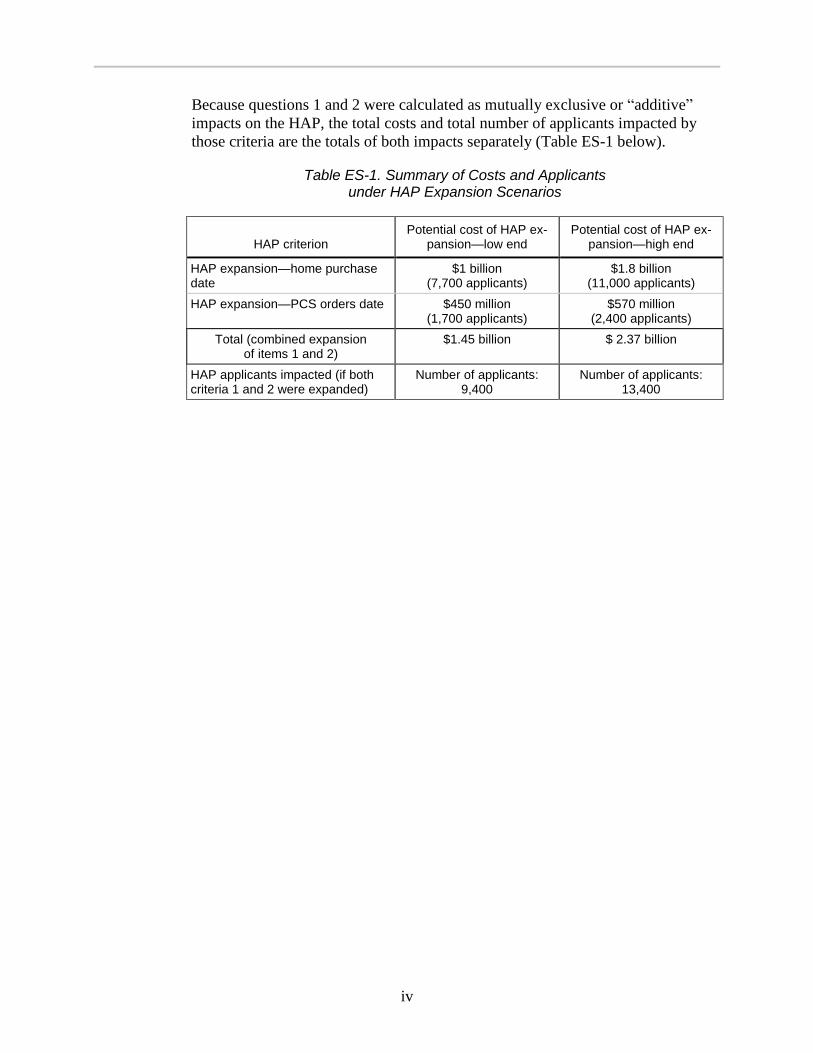
Because questions 1 and 2 were calculated as mutually exclusive or “additive”
impacts on the HAP, the total costs and total number of applicants impacted by
those criteria are the totals of both impacts separately (Table ES-1 below).
Table ES-1. Summary of Costs and Applicants under HAP Expansion Scenarios
HAP criterion Potential cost of HAP ex-
pansion—low end Potential cost of HAP ex-
pansion—high end
HAP expansion—home purchase date
$1 billion (7,700 applicants)
$1.8 billion (11,000 applicants)
HAP expansion—PCS orders date $450 million (1,700 applicants)
$570 million (2,400 applicants)
Total (combined expansion of items 1 and 2)
$1.45 billion $ 2.37 billion
HAP applicants impacted (if both criteria 1 and 2 were expanded)
Number of applicants: 9,400
Number of applicants: 13,400
v
Contents
Chapter 1 Introduction ............................................................................. 1-1
BACKGROUND ........................................................................................................... 1-1
TASK DESCRIPTION ................................................................................................... 1-2
REPORT ORGANIZATION............................................................................................. 1-2
Chapter 2 Homeowners Assistance Program Summary .......................... 2-1
HAP BENEFITS ......................................................................................................... 2-2
ELIGIBILITY BY CATEGORY .......................................................................................... 2-2
Wounded, Injured, Ill, or Surviving Spouse ........................................................ 2-3
BRAC Members of Armed Forces and Civilian Employees ............................... 2-4
Permanently Reassigned Members of Armed Forces ....................................... 2-4
Category Priorities ............................................................................................. 2-4
OTHER ELIGIBILITY FACTORS ..................................................................................... 2-4
Minimum Economic Impact................................................................................ 2-4
Date of Purchase ............................................................................................... 2-5
Maximum Home Purchase Price ....................................................................... 2-6
Date of Assignment, Report Date, and Basis for Relocation ............................. 2-6
Applicable Percentage ....................................................................................... 2-6
Chapter 3 Analysis and Findings ............................................................. 3-1
HAP EXPANSION—HOME PURCHASE DATE ................................................................ 3-1
Requirement ...................................................................................................... 3-1
Approach and Assumptions ............................................................................... 3-1
HAP EXPANSION—PCS ORDERS DATE ..................................................................... 3-5
Requirement ...................................................................................................... 3-5
Approach and Assumptions ............................................................................... 3-6
vi
NUMBER OF SERVICE MEMBERS IMPACTED ................................................................. 3-7
Requirement ...................................................................................................... 3-7
Approach and Assumptions ............................................................................... 3-7
Chapter 4 Conclusions ............................................................................. 4-1
Appendix A NDAA Section 2866
Appendix B HAP Funds Spent and Needs Projection, January 2012
Appendix C LMI Projection of HAP Funds
Appendix D Abbreviations
Figures
Figure 2-1. Case-Shiller Home Price Index, 1987–2011 ......................................... 2-5
Figure 3-1. Expansion of HAP Home Purchase Date Eligibility .............................. 3-1
Figure 3-2. PCS Applicants Impacted by First Half of Housing Bubble ................... 3-2
Figure 3-3. Population of PCS Applicants if Home Purchase Window Included Second Half of Housing Bubble ......................................................................... 3-3
Figure 3-4. Estimated Additional Cost to the HAP from Extending Home Purchase Date ................................................................................................... 3-4
Figure 3-5. Combined Expansion of Home Purchase Date and PCS Order Date Eligibility .................................................................................................... 3-5
Figure 3-6. Number of Eligible PCS Applicants ...................................................... 3-6
Tables
Table 2-1. Funding Sources for HAP ...................................................................... 2-1
Table 2-2. HAP Windows of Eligibility ..................................................................... 2-6
Table 3-1. Average Likely Benefit Cost per Claim................................................... 3-5
Table 3-2. Summary of Costs and Applicants under the HAP Expansion Scenarios .......................................................................................................... 3-7
Table 3-3. HAP Applicants Added by Expanding Eligibility Criteria......................... 3-8
Table 4-1. Additional Costs and Applicants under the HAP Expansion Scenarios .......................................................................................................... 4-1

1-1
Chapter 1 Introduction
BACKGROUND
The Homeowners Assistance Program (HAP) was authorized in Section 1013 of
the Demonstration Cities and Metropolitan Development Act of 1966, as amend-
ed. The law established monetary relief for eligible service members (including
the US Coast Guard) and federal employees (including those paid with nonap-
propriated funds) who suffer financial loss on the sale of their primary residence
when a base closure or realignment announcement causes a decline in the residen-
tial real estate market and they cannot sell their homes under reasonable terms or
conditions.
The Department of Defense (DoD) designated the US Army as executive agent
for the HAP. US Army Corps of Engineers (USACE) real estate personnel at
headquarters and at one district office administer the program for DoD by pro-
cessing applications for assistance from DoD and Coast Guard service members.
They analyze the community’s real estate market, conduct market impact studies,
and make recommendations to the Deputy Assistant Secretary of the Army for
Installations, Housing and Partnerships, DASA (IH&P), for final determinations
on the eligibility of applicants and the amount of their benefits.
The American Recovery and Reinvestment Act of 2009 (ARRA) allocated
$555 million in funds and temporarily expanded the HAP to assist service mem-
bers who are wounded, injured, or become ill while deployed and DoD employees
who are forward deployed; surviving spouses of service members or DoD em-
ployees who are killed while deployed; service member and civilian employees
assigned to organizations affected by Base Realignment and Closure (BRAC)
2005; and service members required to permanently relocate during the home
mortgage crisis. The National Defense Authorization Act (NDAA) of 2010
authorized an additional $300 million for this program.
The NDAA for Fiscal year (FY) 12 required DoD to prepare a report for Congress
on three questions regarding the cost of expanding the criteria for HAP eligibility.
In addition, House Committee on Armed Services Report 112-78 directed DoD to
report to Congress on the sufficiency of funding for the program, the volume and
processing of applications, and options for assistance at large military installa-
tions. This report covers the three questions raised in the NDAA regarding ex-
panded eligibility, while the three questions in the House report are addressed in a
separate report.
1-2
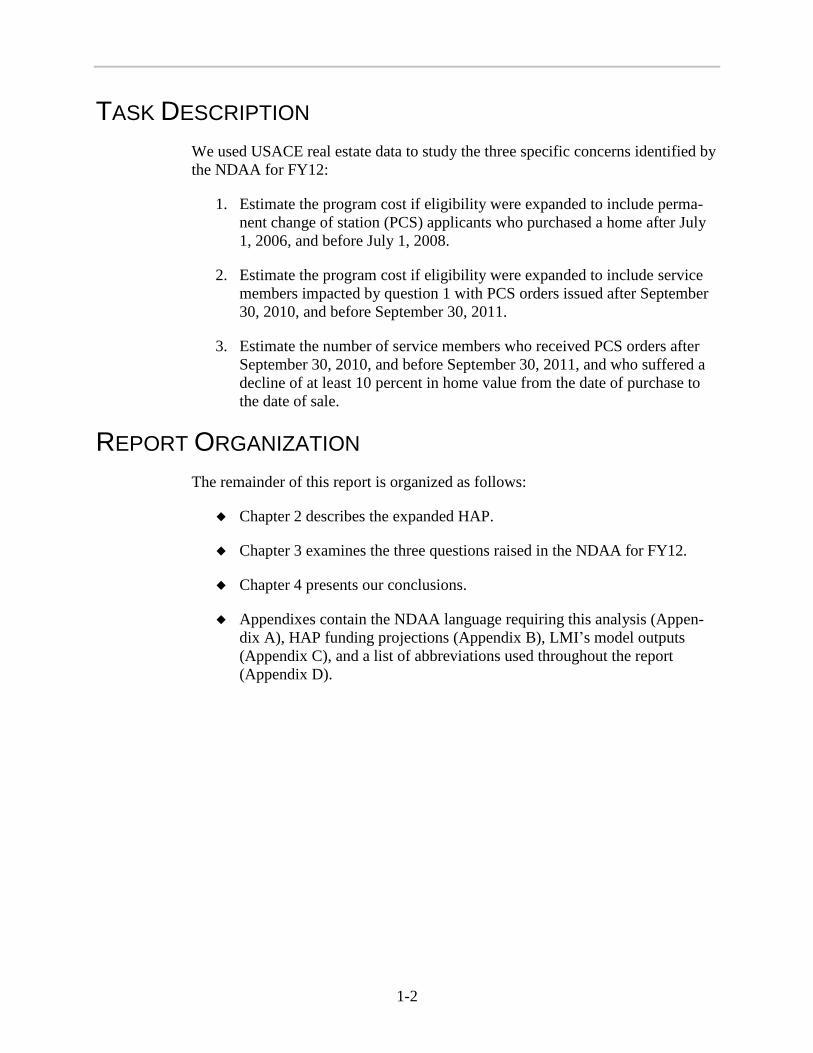
TASK DESCRIPTION
We used USACE real estate data to study the three specific concerns identified by
the NDAA for FY12:
1. Estimate the program cost if eligibility were expanded to include perma-
nent change of station (PCS) applicants who purchased a home after July
1, 2006, and before July 1, 2008.
2. Estimate the program cost if eligibility were expanded to include service
members impacted by question 1 with PCS orders issued after September
30, 2010, and before September 30, 2011.
3. Estimate the number of service members who received PCS orders after
September 30, 2010, and before September 30, 2011, and who suffered a
decline of at least 10 percent in home value from the date of purchase to
the date of sale.
REPORT ORGANIZATION
The remainder of this report is organized as follows:
Chapter 2 describes the expanded HAP.
Chapter 3 examines the three questions raised in the NDAA for FY12.
Chapter 4 presents our conclusions.
Appendixes contain the NDAA language requiring this analysis (Appen-
dix A), HAP funding projections (Appendix B), LMI’s model outputs
(Appendix C), and a list of abbreviations used throughout the report
(Appendix D).
2-1
Chapter 2 Homeowners Assistance Program Summary
The HAP was originally created under of Title 42 of the United States Code
(USC), Section 3374, to assist eligible military and federal civilian employee
homeowners when the real estate market declines as a direct result of a closure or
reduction in scope of operations due to BRAC. Section 1001 of the ARRA tempo-
rarily authorizes the HAP to assist
members of the armed forces who are wounded, injured, or ill (30 percent
or greater disability);
DoD and Coast Guard civilian homeowners who are wounded, injured, or
become ill (30 percent or greater disability) while forward deployed on or
after September 11, 2001;
surviving spouses of a service member or civilian employee whose spouse
dies as a result of a wound, injury, or illness incurred while in the line of
duty, and who need to relocate within 2 years of the death of the spouse;
homeowners affected by BRAC 2005 who were relocating during the
mortgage crisis; and
service member homeowners undergoing PCS moves during the mortgage
crisis.1
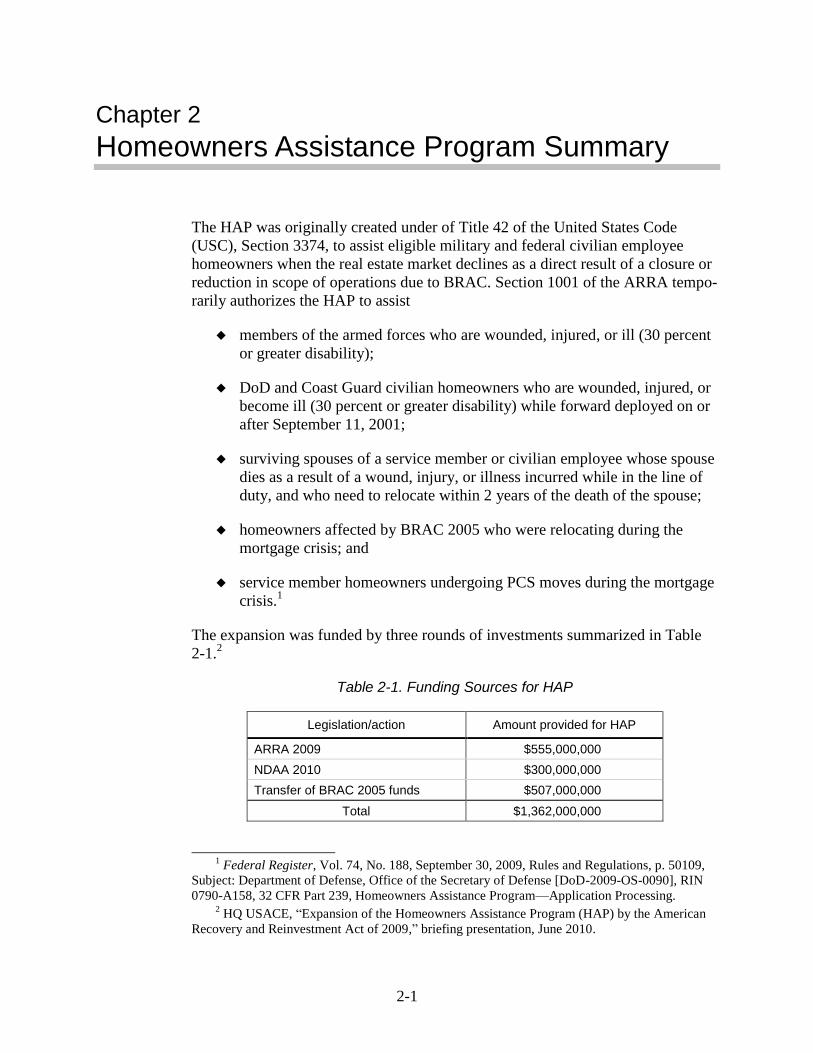
The expansion was funded by three rounds of investments summarized in Table
2-1.2
Table 2-1. Funding Sources for HAP
Legislation/action Amount provided for HAP
ARRA 2009 $555,000,000
NDAA 2010 $300,000,000
Transfer of BRAC 2005 funds $507,000,000
Total $1,362,000,000
1 Federal Register, Vol. 74, No. 188, September 30, 2009, Rules and Regulations, p. 50109,
Subject: Department of Defense, Office of the Secretary of Defense [DoD-2009-OS-0090], RIN
0790-A158, 32 CFR Part 239, Homeowners Assistance Program—Application Processing. 2 HQ USACE, “Expansion of the Homeowners Assistance Program (HAP) by the American
Recovery and Reinvestment Act of 2009,” briefing presentation, June 2010.

2-2
In addition to these funds, the HAP can retain the funds from homes sold through
its program. This source has generated an additional $499 million in revenue as of
January 2012 (see projection of HAP funds spent and needs in Appendix B).
HAP BENEFITS
HAP benefits are authorized in Title 42 USC, Section 3374, as amended by Sec-
tion 1001 of ARRA. It authorizes the Secretary of Defense, under specified condi-
tions, to acquire title to, hold, manage, and dispose of—or in lieu thereof, to
reimburse for certain losses upon private sale of, or foreclosure against—any
property improved with a one- or two-family dwelling owned by designated
individuals.
If an applicant cannot sell the primary residence after demonstrating reasonable
efforts to do so, the government may purchase the primary residence for the
greater of the applicable percentage (as identified by applicant type) of the prior
fair market value (PFMV), which is the original purchase price of the primary res-
idence, or the total amount of the eligible mortgages that remain outstanding.
If an applicant sells, has sold, or otherwise has transferred title of the primary res-
idence, the benefit calculation is the amount of closing costs plus an amount not
to exceed the difference between the applicable percentage of the PFMV and the
sales price.
If an applicant is foreclosed upon, the benefit will pay all legally enforceable lia-
bilities directly associated with the foreclosed mortgage—for example, a deficien-
cy judgment.
Sellers’ closing costs typically include loan payoff fees, a real estate commission,
title insurance, all or part of transfer taxes and escrow fees (if any), and attorney’s
fees where applicable. The HAP may reimburse the seller for a limited contribu-
tion made to the buyer’s portion of closing costs. However, it can only reimburse
for customary/normal closing costs that the applicant has paid out of pocket at the
closing.
ELIGIBILITY BY CATEGORY
The following sections describe the categories of applicants eligible for HAP
assistance.

Homeowners Assistance Program Summary
2-3
Wounded, Injured, Ill, or Surviving Spouse
The category of wounded, injured, or ill or surviving spouse (WII/SS) includes
members of the armed forces
who receive a disability rating of 30 percent or more; or
who are eligible for the service member’s Group Life Insurance Traumatic
Injury Protection Program; or
whose treating physician certifies that the member is likely, by a prepon-
derance of the evidence, to receive a disability rating of 30 percent or
more for an unfitting condition resulting from wounds, injuries, or illness
incurred in the line of duty while deployed on or after September 11,
2001; and
who are reassigned in furtherance of medical treatment or rehabilitation,
or due to retirement in connection with such disability, and who need to
sell their primary residence due to the wound, injury, or illness.
It also includes civilian employees of DoD or the Coast Guard and nonappropri-
ated fund employees who
suffer a wound, injury, or illness (not due to their own misconduct) on or
after September 11, 2001, in the performance of duties while forward de-
ployed in support of the armed forces, who provide written documentation
that the preponderance of the evidence meets the criteria for a disability
rating of 30 percent or more;
relocate from their primary residence in furtherance of medical treatment,
rehabilitation, or due to medical retirement resulting from the wound, inju-
ry, or illness; and
need to sell their primary residence due to the wound, injury, or illness.
Lastly, it includes surviving spouses of service members or civilian employees
whose spouse dies as the result of a wound, injury, or illness incurred in
the line of duty while deployed (or forward deployed for civilian
employees) on or after September 11, 2001, and
who relocate from the member’s or civilian employee’s primary residence
within 2 years of the death of the spouse.
2-4
BRAC Members of Armed Forces and Civilian Employees
The BRAC category includes members of the armed forces and civilian employ-
ees assigned to an installation or unit identified for BRAC 2005 closure or
realignment
whose position is eliminated or transferred because of the realignment or
closure, and
who accepts employment or is required to relocate because of a transfer
beyond the normal commuting distance from the primary residence (50
miles). The new residence must be within 50 miles of the new duty
station.
Permanently Reassigned Members of Armed Forces
The permanent reassignment category includes members reassigned under PCS
orders dated between February 1, 2006, and September 30, 2010 (subject to avail-
ability of funds) to a new duty station or home port outside a 50-mile radius of the
member’s former duty station or home port.3
Category Priorities
The first priority for processing and paying claims goes to WII/SS applicants. In
consideration of the sacrifices of those in this category, they not only receive pri-
ority but also are subject to less restrictive eligibility requirements.
Second priority goes to those affected by BRAC. Many are asked to stay at the
“losing” location until the organization relocates, at which time they are asked to
move to the “gaining” base. The HAP assists by relieving some of the concerns
about selling their homes.
Third priority, paid until funds are depleted, is the military PCS category. The
HAP is intended to help alleviate some of the burden caused by the housing crisis.
OTHER ELIGIBILITY FACTORS
Minimum Economic Impact
Those who qualify for the HAP include BRAC 2005 service members and civilian
employees, as well as PCS service members, whose primary residence has suf-
fered at least a 10 percent decline in home value from the date of purchase to date
3 Deputy Under Secretary of Defense for Installations and Environment, DUSD(I&E), memo-
randum to Deputy Assistant Secretary of the Army (Installations and Housing), “Expanded
Homeowners Assistance Program (HAP),” December 23, 2009.
Homeowners Assistance Program Summary
2-5
of sale. (HAP applicants in the WII/SS category do not need to show minimum
economic impact.)
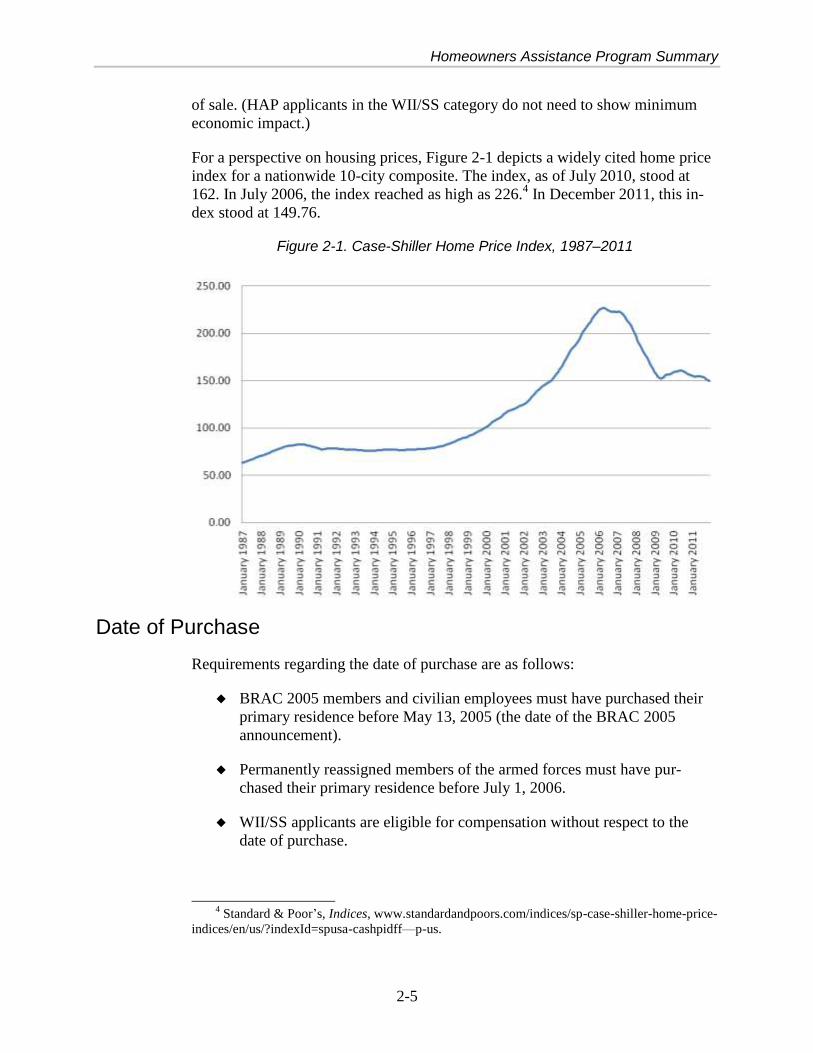
For a perspective on housing prices, Figure 2-1 depicts a widely cited home price
index for a nationwide 10-city composite. The index, as of July 2010, stood at
162. In July 2006, the index reached as high as 226.4 In December 2011, this in-
dex stood at 149.76.
Figure 2-1. Case-Shiller Home Price Index, 1987–2011
Date of Purchase
Requirements regarding the date of purchase are as follows:
BRAC 2005 members and civilian employees must have purchased their
primary residence before May 13, 2005 (the date of the BRAC 2005
announcement).
Permanently reassigned members of the armed forces must have pur-
chased their primary residence before July 1, 2006.
WII/SS applicants are eligible for compensation without respect to the
date of purchase.
4 Standard & Poor’s, Indices, www.standardandpoors.com/indices/sp-case-shiller-home-price-
indices/en/us/?indexId=spusa-cashpidff—p-us.
2-6
Table 2-2 summarizes the HAP windows of eligibility, which vary by category of
recipient.
Table 2-2. HAP Windows of Eligibility
Category Start End Description
WII/SS 9/11/01 — Wounded, ill, or injured during deployment; eligible up to 2 years after death of spouse
BRAC 7/1/06 9/30/12 Position relocated or eliminated; sale of home pur-chased before May 13, 2005
PCS 2/1/06 9/30/10 Orders cut; sale of home purchased before July 1, 2006
Maximum Home Purchase Price
The maximum home purchase price is the PFMV, the purchase price of the prima-
ry residence.
Date of Assignment, Report Date, and Basis for Relocation
BRAC 2005 members and civilian employees must have been assigned on
May 13, 2005, to an installation or unit identified for closure or realignment under
the 2005 round of BRAC.
PCS members of the armed forces must have received qualifying orders to relo-
cate dated between February 1, 2006, and September 30, 2010, and sell their
home after July 1, 2006.
WII/SS applicants’ soldier or civilian spouses must have deployed or forward de-
ployed on or after September 11, 2001.
Applicable Percentage
If an applicant is eligible as a BRAC 2005 civilian or military employee, or is a
permanently reassigned member of the armed forces, and sells the primary resi-
dence, the applicable percentage is 90 percent of the PFMV. In addition, closing
costs incurred on the sale may be reimbursed.
If an applicant is eligible as a BRAC 2005 civilian or military employee, or is a
permanently reassigned member of the armed forces, and cannot sell the primary
residence after demonstrating reasonable efforts to do so, the applicable percent-
age is 75 percent of the PFMV. Closing costs incurred on the sale will not be
reimbursed.

Homeowners Assistance Program Summary
2-7
If an applicant is eligible in the WII/SS category and sells the primary residence,
the applicable percentage is 95 percent of the PFMV. In addition, closing costs
incurred on the sale may be reimbursed. If the applicant cannot sell the primary
residence after demonstrating reasonable efforts to do so, the applicable percent-
age is 90 percent of the PFMV.

2-8
3-1
Chapter 3 Analysis and Findings
This chapter outlines our analysis and findings for the three areas of concern. For
each question, we summarize the congressionally required focus area, the scope
of our analysis, analytical assumptions, and our results.
HAP EXPANSION—HOME PURCHASE DATE
Requirement
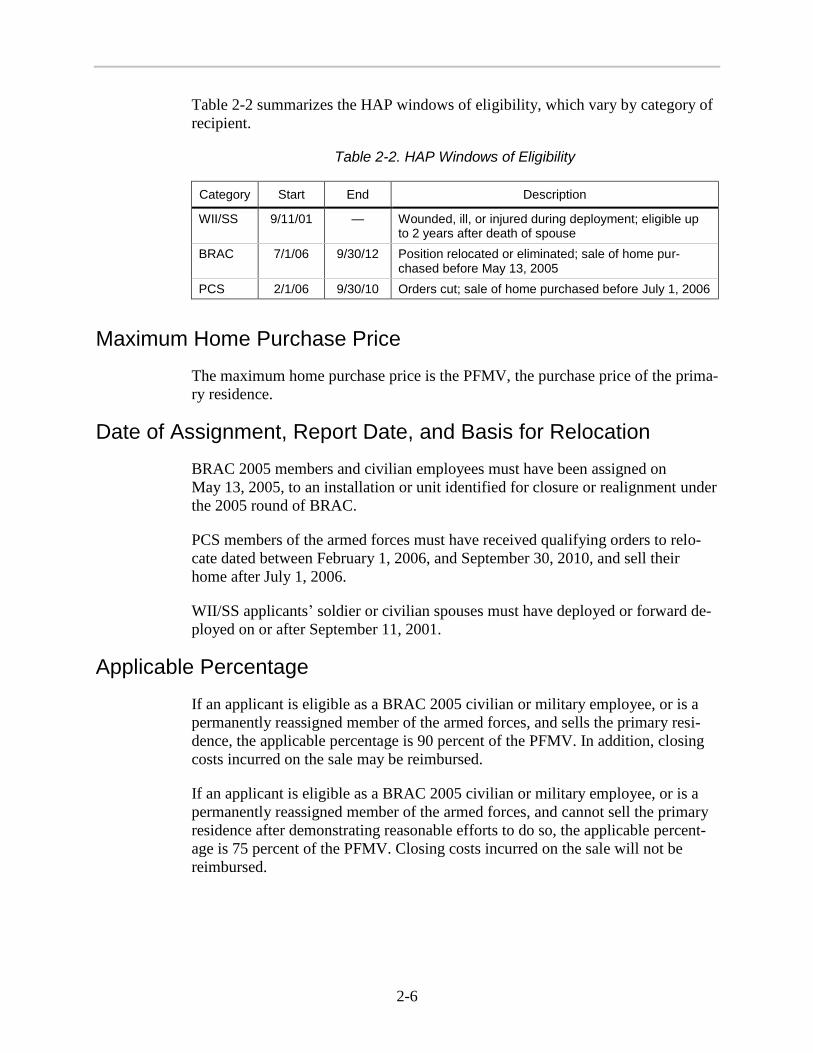
Congress wishes to know the estimated cost if eligibility dates were expanded to
include permanent change of duty station applicants who purchased a home after
July 1, 2006, and before July 1, 2008. This expansion is represented in Figure 3-1.
Figure 3-1. Expansion of HAP Home Purchase Date Eligibility
Approach and Assumptions
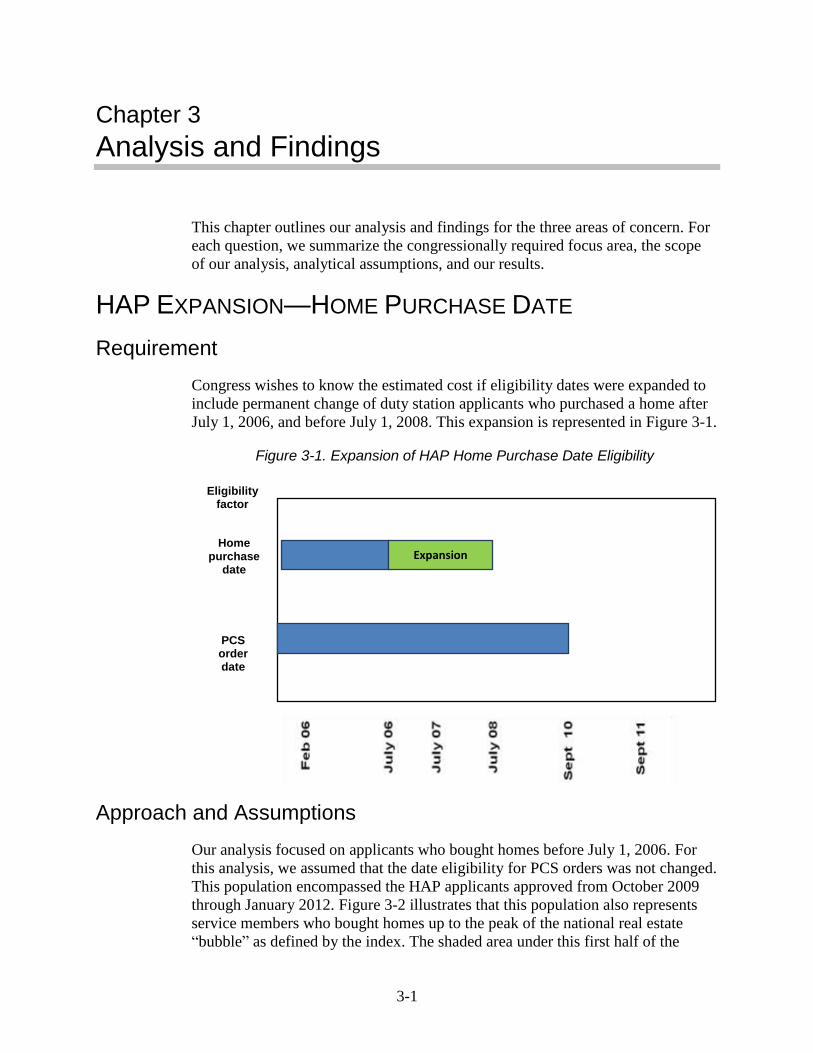
Our analysis focused on applicants who bought homes before July 1, 2006. For
this analysis, we assumed that the date eligibility for PCS orders was not changed.
This population encompassed the HAP applicants approved from October 2009
through January 2012. Figure 3-2 illustrates that this population also represents
service members who bought homes up to the peak of the national real estate
“bubble” as defined by the index. The shaded area under this first half of the
Home purchase
date
Eligibility factor
PCS order date
Expansion
3-2
bubble represents the population of eligible PCS applicants who have received
HAP benefits (or are projected to receive them) up to when the program closes in
September 30, 2012.
Figure 3-2. PCS Applicants Impacted by First Half of Housing Bubble
Expanding the home purchase date 2 more years (to July 1, 2008) would include
the other half of the real estate bubble, and this would effectively double the im-
pact on HAP funds. This result is based on the following assumptions:
The home purchase date is the most significant factor determining the
number of potential applicants.
A 2-year expansion of the home purchase date effectively captures the
other half of this real estate bubble.
The population of applicants under the existing home purchase ending
date of July 1, 2006, accounts for the $1.63 billion1 in HAP PCS claims
paid between October 2006 and January 2012.
This expansion will not affect the WII/SS or BRAC benefit categories.
1 Costs were estimated on the basis of the number of PCS applicants who have been deemed
eligible as of January 2012. We apportioned the administrative and other costs to the PCS appli-
cants to develop reasonable estimates. Due to uncertainty about how many of the eligible PCS
applicants would receive payment, we developed a range of costs and estimated that approximate-
ly 70 percent of the eligible PCS applicants would be paid. Thus, as of January 2012, an estimated
$1.63 billion would be required at the lower end of the range, and at the upper end approximately
$2.2 would be required to pay all obligations.
Analysis and Findings
3-3
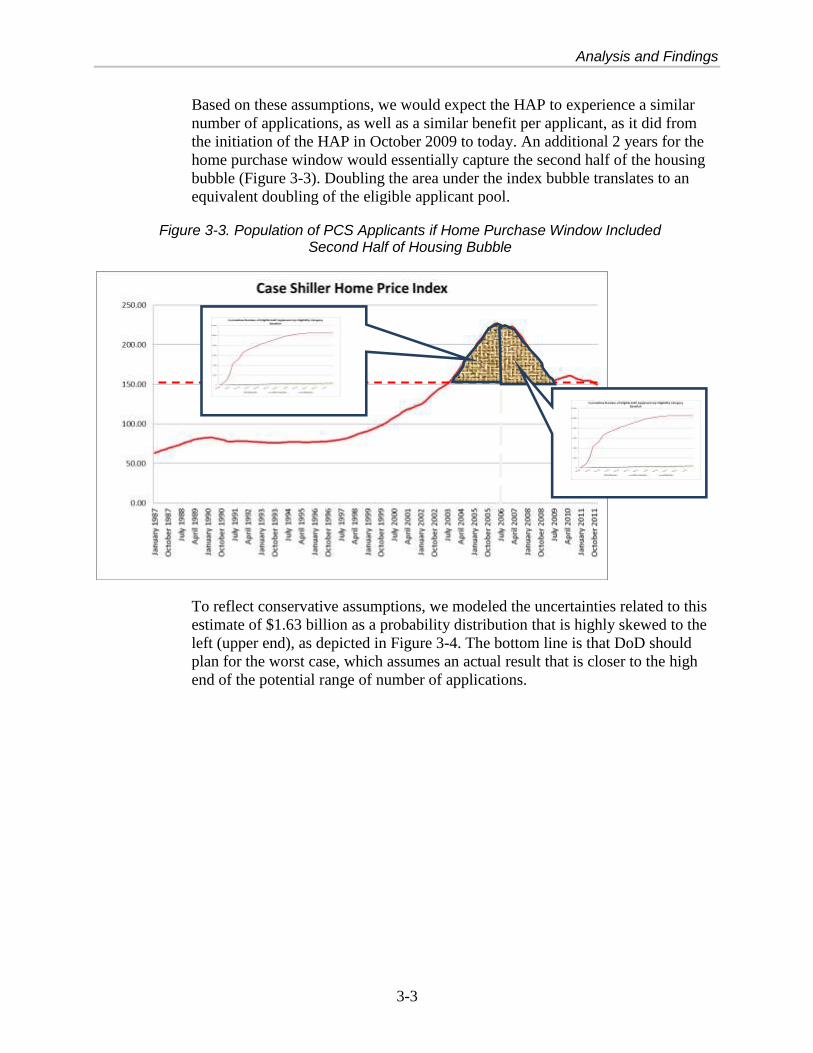
Based on these assumptions, we would expect the HAP to experience a similar
number of applications, as well as a similar benefit per applicant, as it did from
the initiation of the HAP in October 2009 to today. An additional 2 years for the
home purchase window would essentially capture the second half of the housing
bubble (Figure 3-3). Doubling the area under the index bubble translates to an
equivalent doubling of the eligible applicant pool.
Figure 3-3. Population of PCS Applicants if Home Purchase Window Included Second Half of Housing Bubble
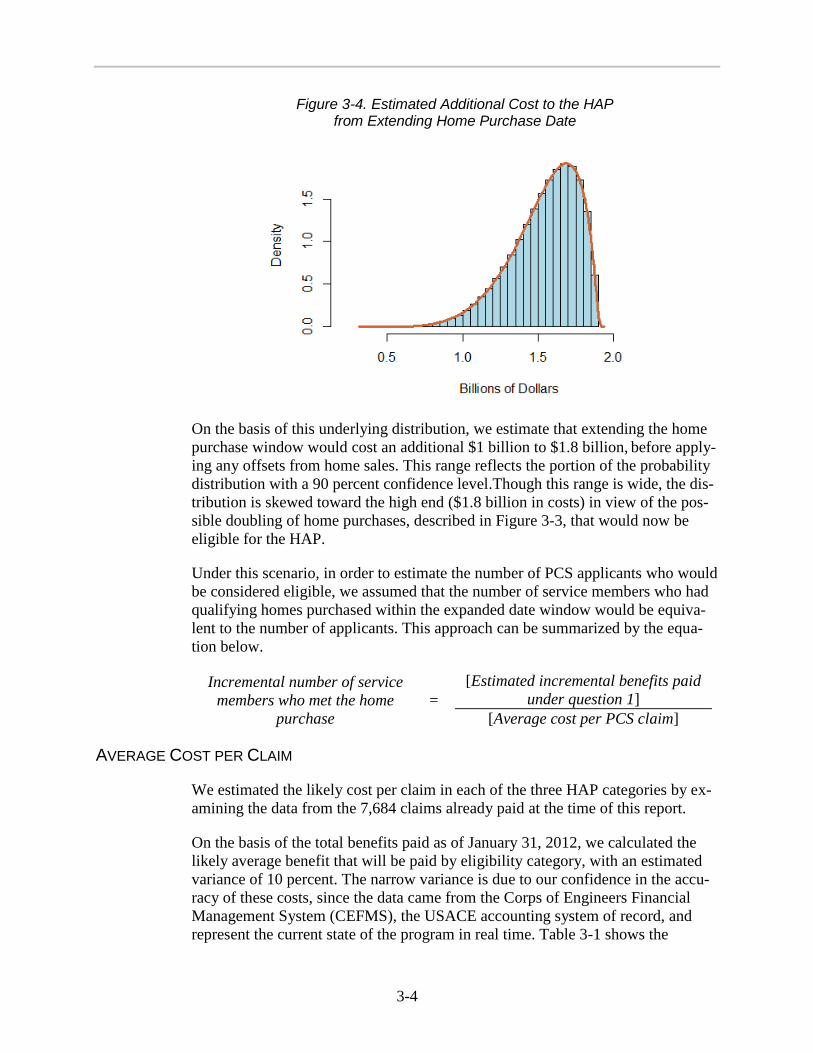
To reflect conservative assumptions, we modeled the uncertainties related to this
estimate of $1.63 billion as a probability distribution that is highly skewed to the
left (upper end), as depicted in Figure 3-4. The bottom line is that DoD should
plan for the worst case, which assumes an actual result that is closer to the high
end of the potential range of number of applications.
3-4
Figure 3-4. Estimated Additional Cost to the HAP from Extending Home Purchase Date
On the basis of this underlying distribution, we estimate that extending the home
purchase window would cost an additional $1 billion to $1.8 billion, before apply-
ing any offsets from home sales. This range reflects the portion of the probability
distribution with a 90 percent confidence level.Though this range is wide, the dis-
tribution is skewed toward the high end ($1.8 billion in costs) in view of the pos-
sible doubling of home purchases, described in Figure 3-3, that would now be
eligible for the HAP.
Under this scenario, in order to estimate the number of PCS applicants who would
be considered eligible, we assumed that the number of service members who had
qualifying homes purchased within the expanded date window would be equiva-
lent to the number of applicants. This approach can be summarized by the equa-
tion below.
Incremental number of service
members who met the home
purchase
=
[Estimated incremental benefits paid
under question 1]
[Average cost per PCS claim]
AVERAGE COST PER CLAIM
We estimated the likely cost per claim in each of the three HAP categories by ex-
amining the data from the 7,684 claims already paid at the time of this report.
On the basis of the total benefits paid as of January 31, 2012, we calculated the
likely average benefit that will be paid by eligibility category, with an estimated
variance of 10 percent. The narrow variance is due to our confidence in the accu-
racy of these costs, since the data came from the Corps of Engineers Financial
Management System (CEFMS), the USACE accounting system of record, and
represent the current state of the program in real time. Table 3-1 shows the
Analysis and Findings
3-5
average cost per claim we expect the HAP to pay for the three eligibility catego-
ries, and their estimated variation.
Table 3-1. Average Likely Benefit Cost per Claim
Eligibility category Lower bound Most likely Upper bound
WII/SS $256,874 $285,314 $313,845
BRAC 05 $57,182 $63,535 $69,889
PCS $150,521 $167,245 $183,970
For this analysis, we applied the PCS average cost per claim of $167,245. On the
basis of this approach, we expect to see approximately 11,0002 more PCS appli-
cants, if the HAP program extend the home purchase date to July 1, 2008.
HAP EXPANSION—PCS ORDERS DATE
Requirement
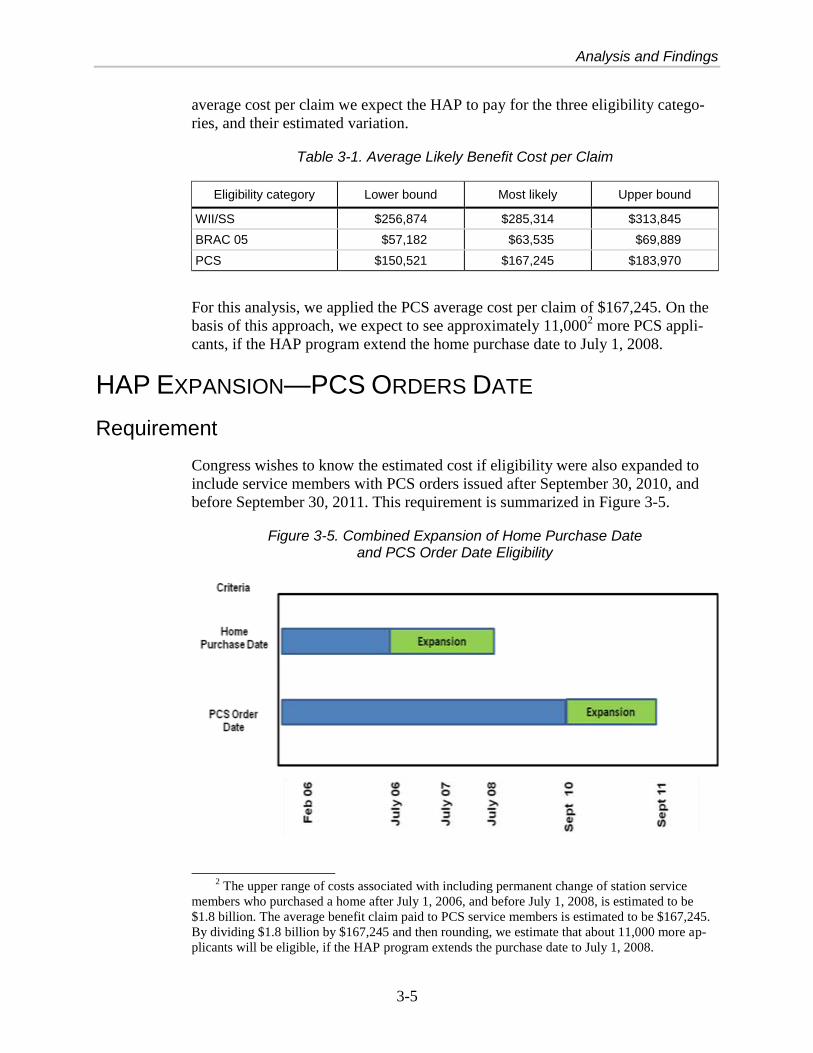
Congress wishes to know the estimated cost if eligibility were also expanded to
include service members with PCS orders issued after September 30, 2010, and
before September 30, 2011. This requirement is summarized in Figure 3-5.
Figure 3-5. Combined Expansion of Home Purchase Date and PCS Order Date Eligibility
2 The upper range of costs associated with including permanent change of station service
members who purchased a home after July 1, 2006, and before July 1, 2008, is estimated to be
$1.8 billion. The average benefit claim paid to PCS service members is estimated to be $167,245.
By dividing $1.8 billion by $167,245 and then rounding, we estimate that about 11,000 more ap-
plicants will be eligible, if the HAP program extends the purchase date to July 1, 2008.
3-6
Approach and Assumptions
This approach would augment the expansion of the home purchase eligibility date
with a 1-year expansion of the PCS order eligibility date. The challenge is to un-
derstand the potential incremental impacts on HAP funding by adding this year.
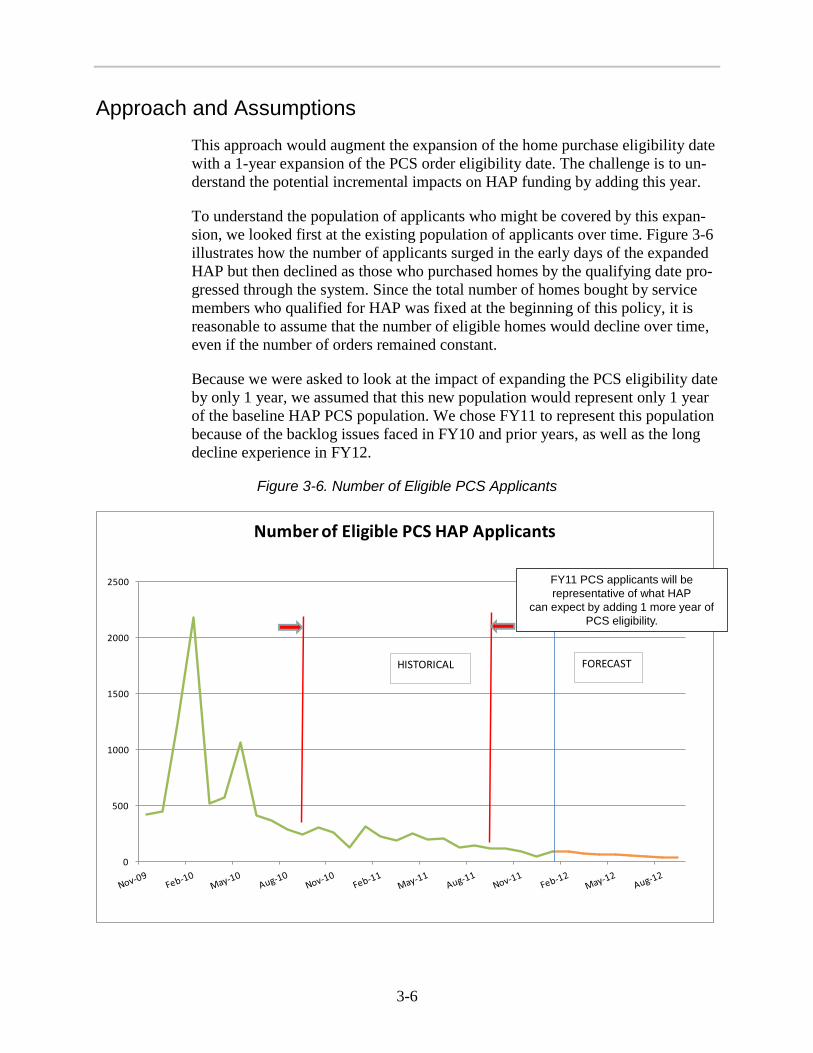
To understand the population of applicants who might be covered by this expan-
sion, we looked first at the existing population of applicants over time. Figure 3-6
illustrates how the number of applicants surged in the early days of the expanded
HAP but then declined as those who purchased homes by the qualifying date pro-
gressed through the system. Since the total number of homes bought by service
members who qualified for HAP was fixed at the beginning of this policy, it is
reasonable to assume that the number of eligible homes would decline over time,
even if the number of orders remained constant.
Because we were asked to look at the impact of expanding the PCS eligibility date
by only 1 year, we assumed that this new population would represent only 1 year
of the baseline HAP PCS population. We chose FY11 to represent this population
because of the backlog issues faced in FY10 and prior years, as well as the long
decline experience in FY12.
Figure 3-6. Number of Eligible PCS Applicants
0
500
1000
1500
2000
2500
Number of Eligible PCS HAP Applicants
HISTORICAL FORECAST
FY11 PCS applicants will be
representative of what HAP
can expect by adding 1 more year of
PCS eligibility.
Analysis and Findings
3-7
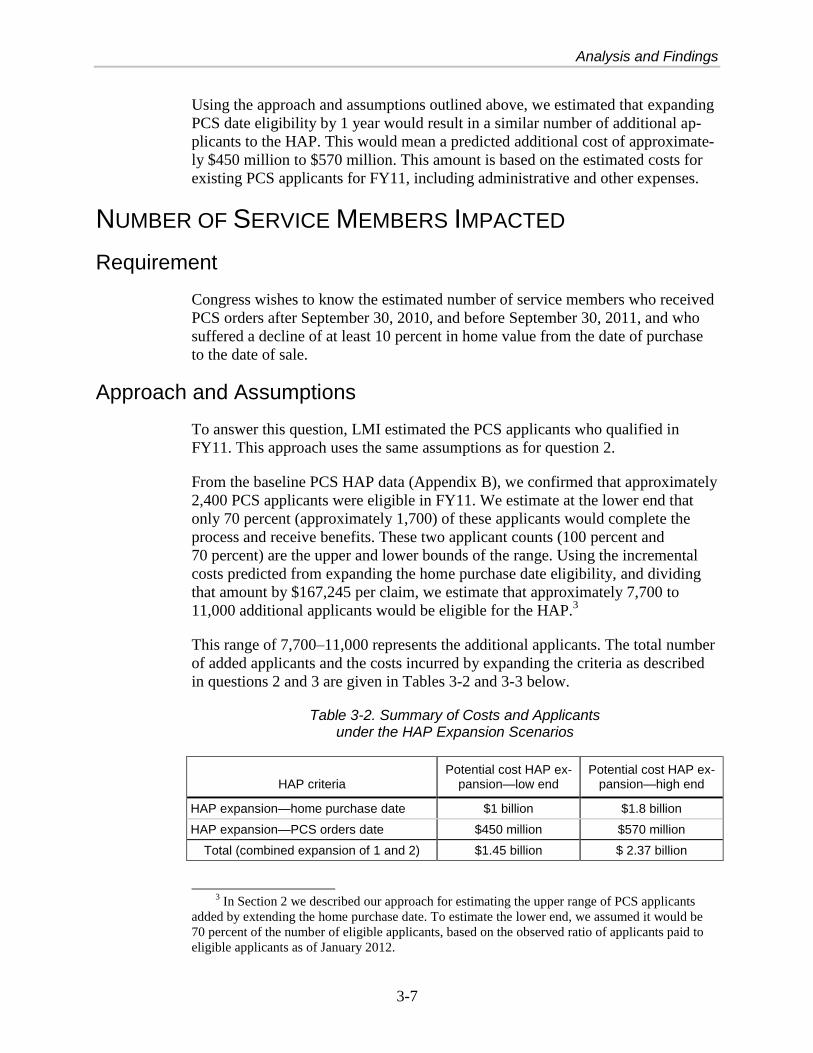
Using the approach and assumptions outlined above, we estimated that expanding
PCS date eligibility by 1 year would result in a similar number of additional ap-
plicants to the HAP. This would mean a predicted additional cost of approximate-
ly $450 million to $570 million. This amount is based on the estimated costs for
existing PCS applicants for FY11, including administrative and other expenses.
NUMBER OF SERVICE MEMBERS IMPACTED
Requirement
Congress wishes to know the estimated number of service members who received
PCS orders after September 30, 2010, and before September 30, 2011, and who
suffered a decline of at least 10 percent in home value from the date of purchase
to the date of sale.
Approach and Assumptions
To answer this question, LMI estimated the PCS applicants who qualified in
FY11. This approach uses the same assumptions as for question 2.
From the baseline PCS HAP data (Appendix B), we confirmed that approximately
2,400 PCS applicants were eligible in FY11. We estimate at the lower end that
only 70 percent (approximately 1,700) of these applicants would complete the
process and receive benefits. These two applicant counts (100 percent and
70 percent) are the upper and lower bounds of the range. Using the incremental
costs predicted from expanding the home purchase date eligibility, and dividing
that amount by $167,245 per claim, we estimate that approximately 7,700 to
11,000 additional applicants would be eligible for the HAP.3
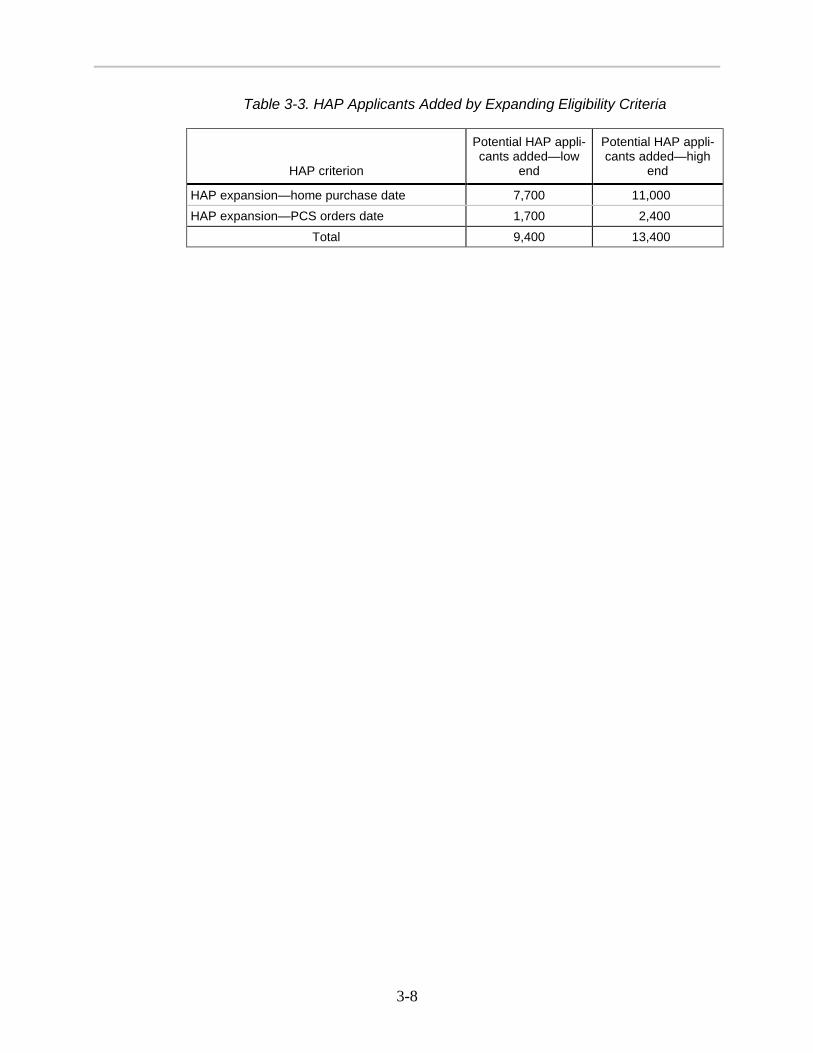
This range of 7,700–11,000 represents the additional applicants. The total number
of added applicants and the costs incurred by expanding the criteria as described
in questions 2 and 3 are given in Tables 3-2 and 3-3 below.
Table 3-2. Summary of Costs and Applicants under the HAP Expansion Scenarios
HAP criteria Potential cost HAP ex-
pansion—low end Potential cost HAP ex-
pansion—high end
HAP expansion—home purchase date $1 billion $1.8 billion
HAP expansion—PCS orders date $450 million $570 million
Total (combined expansion of 1 and 2) $1.45 billion $ 2.37 billion
3 In Section 2 we described our approach for estimating the upper range of PCS applicants
added by extending the home purchase date. To estimate the lower end, we assumed it would be
70 percent of the number of eligible applicants, based on the observed ratio of applicants paid to
eligible applicants as of January 2012.
3-8
Table 3-3. HAP Applicants Added by Expanding Eligibility Criteria
HAP criterion
Potential HAP appli-cants added—low
end
Potential HAP appli-cants added—high
end
HAP expansion—home purchase date 7,700 11,000
HAP expansion—PCS orders date 1,700 2,400
Total 9,400 13,400
4-1
Chapter 4 Conclusions
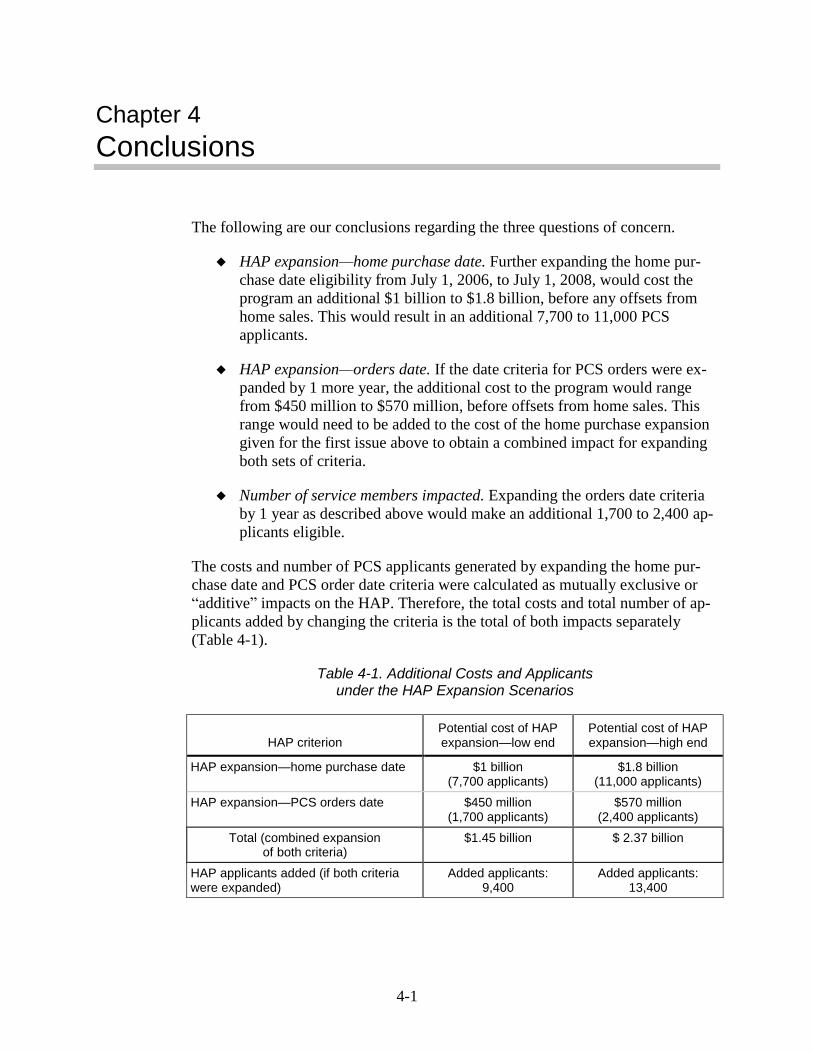
The following are our conclusions regarding the three questions of concern.
HAP expansion—home purchase date. Further expanding the home pur-
chase date eligibility from July 1, 2006, to July 1, 2008, would cost the
program an additional $1 billion to $1.8 billion, before any offsets from
home sales. This would result in an additional 7,700 to 11,000 PCS
applicants.
HAP expansion—orders date. If the date criteria for PCS orders were ex-
panded by 1 more year, the additional cost to the program would range
from $450 million to $570 million, before offsets from home sales. This
range would need to be added to the cost of the home purchase expansion
given for the first issue above to obtain a combined impact for expanding
both sets of criteria.
Number of service members impacted. Expanding the orders date criteria
by 1 year as described above would make an additional 1,700 to 2,400 ap-
plicants eligible.
The costs and number of PCS applicants generated by expanding the home pur-
chase date and PCS order date criteria were calculated as mutually exclusive or
“additive” impacts on the HAP. Therefore, the total costs and total number of ap-
plicants added by changing the criteria is the total of both impacts separately
(Table 4-1).
Table 4-1. Additional Costs and Applicants under the HAP Expansion Scenarios
HAP criterion Potential cost of HAP expansion—low end
Potential cost of HAP expansion—high end
HAP expansion—home purchase date $1 billion (7,700 applicants)
$1.8 billion (11,000 applicants)
HAP expansion—PCS orders date $450 million (1,700 applicants)
$570 million (2,400 applicants)
Total (combined expansion of both criteria)
$1.45 billion $ 2.37 billion
HAP applicants added (if both criteria were expanded)
Added applicants: 9,400
Added applicants: 13,400

4-2
A-1
Appendix A NDAA Section 2866
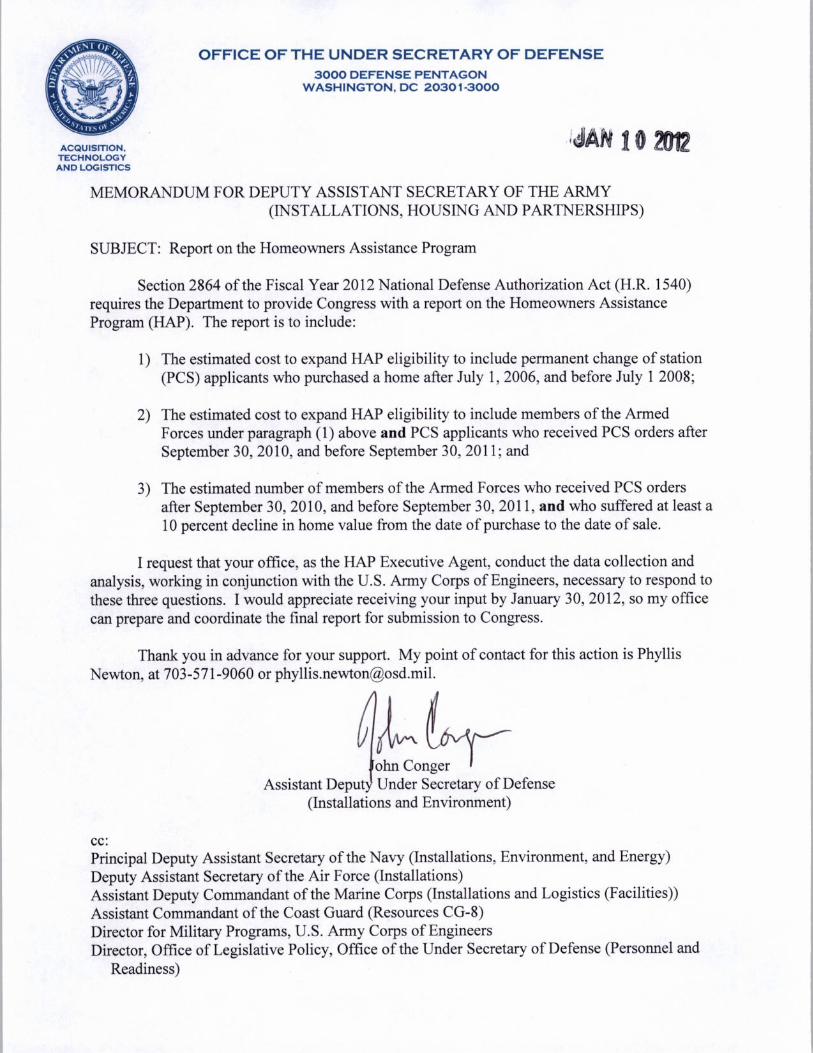
This appendix contains Section 2866 of the NDAA requiring DoD to report on
expanding HAP eligibility, and the January 10, 2012, memorandum from the As-
sistant Deputy Under Secretary of Defense (Installations and Environment) that
requests the HAP to respond to the areas of concern.


B-1
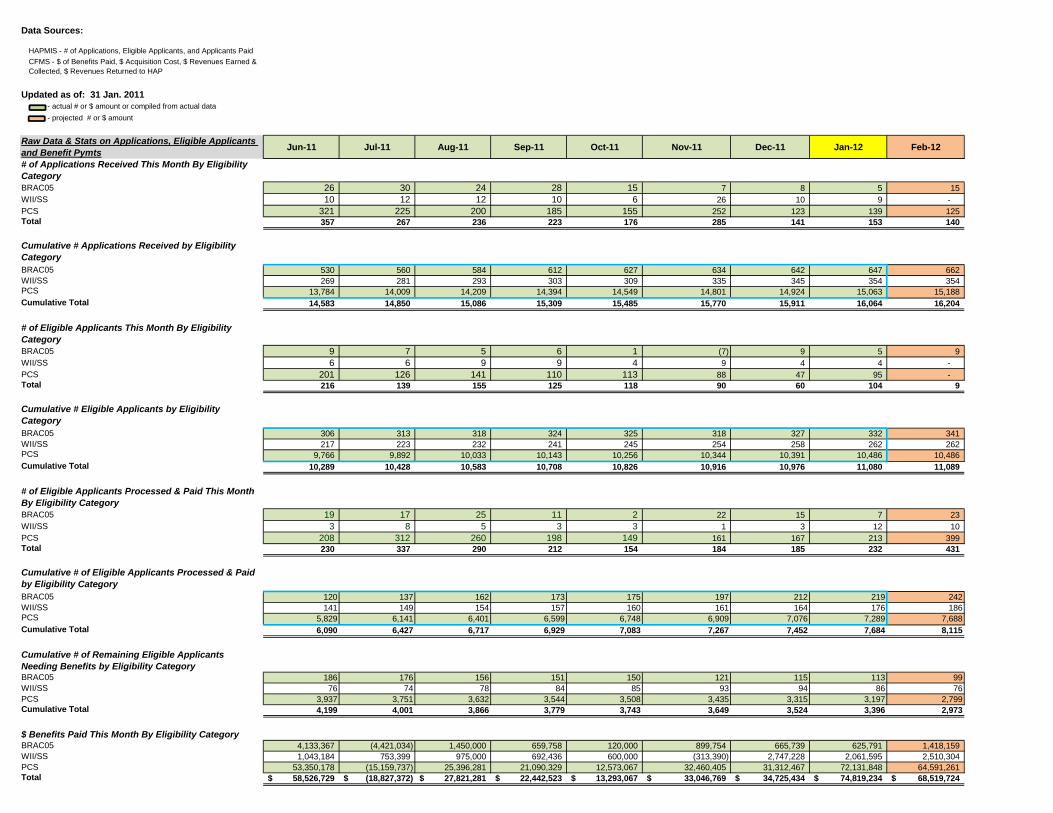
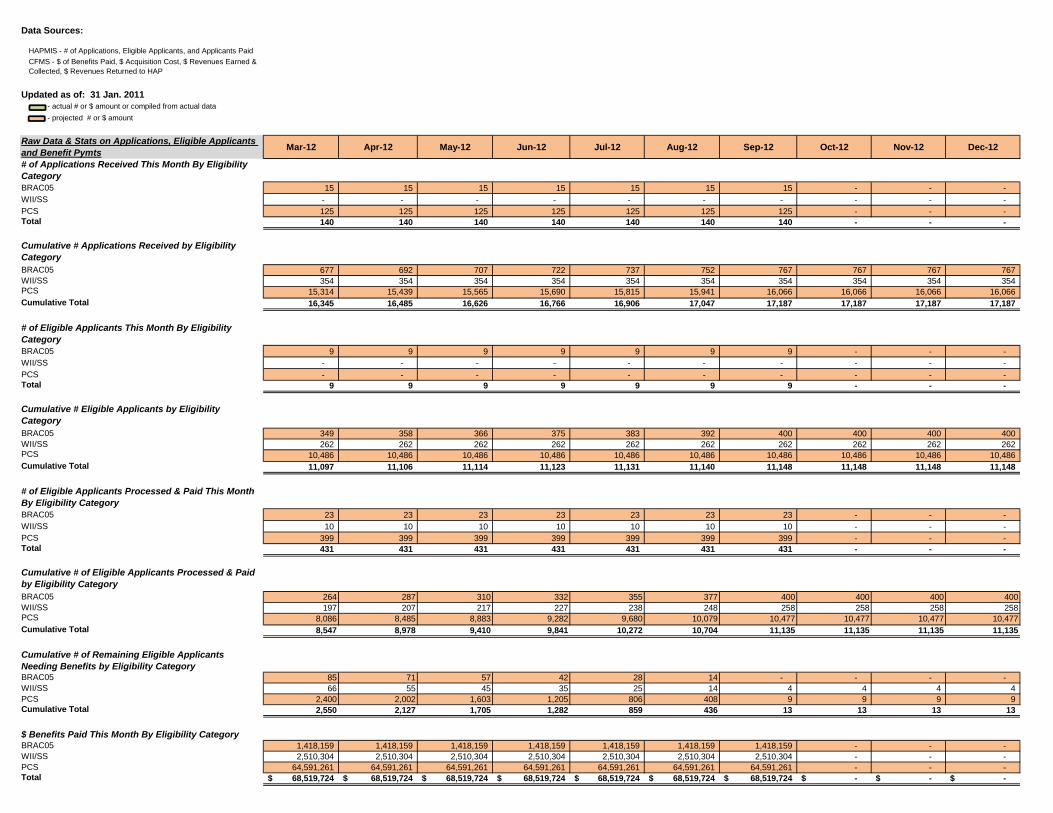
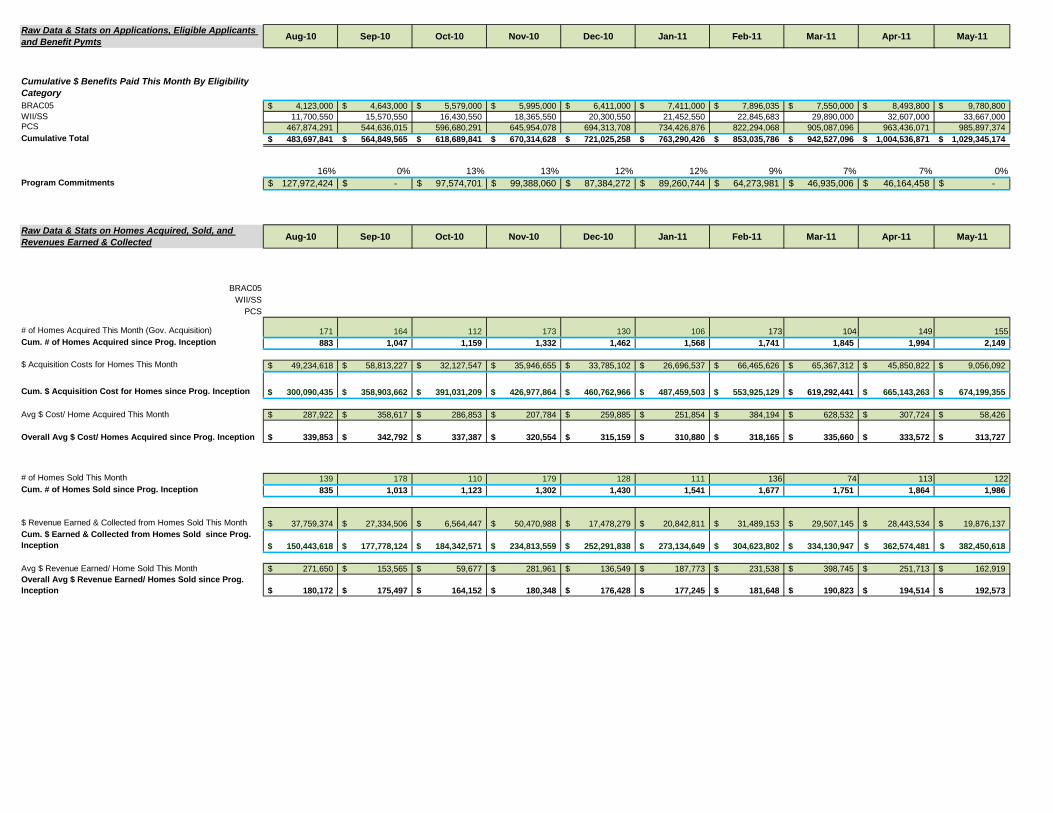
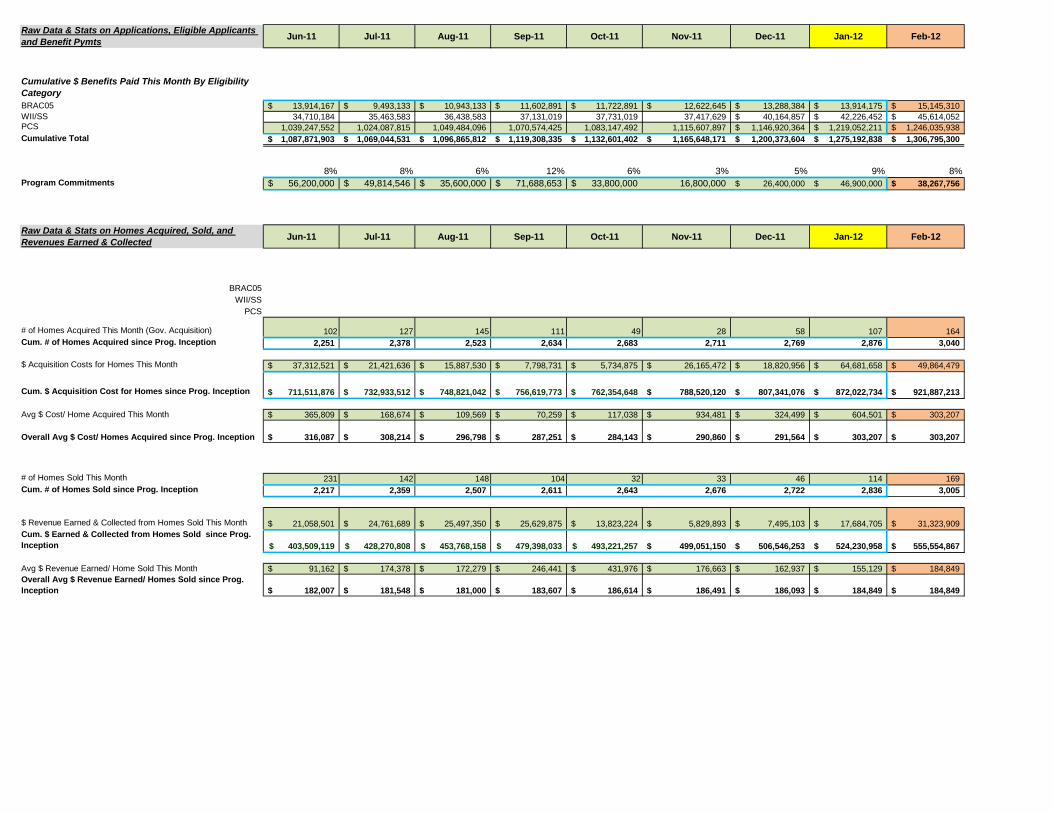
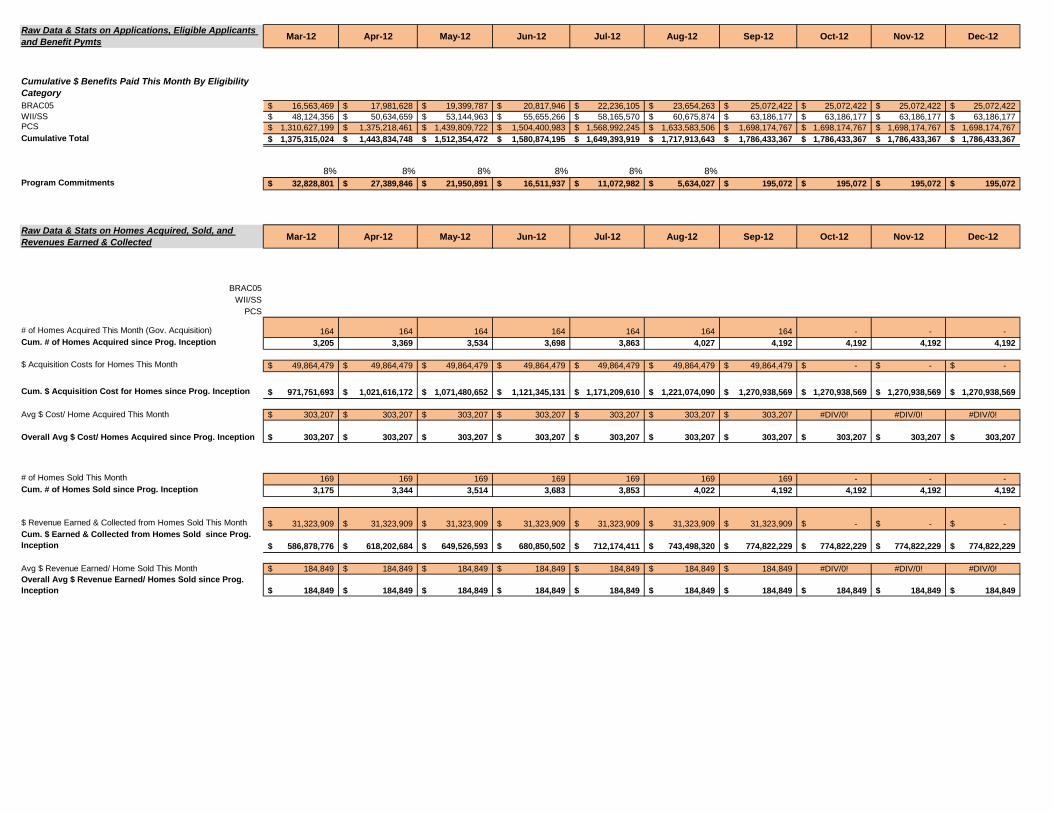
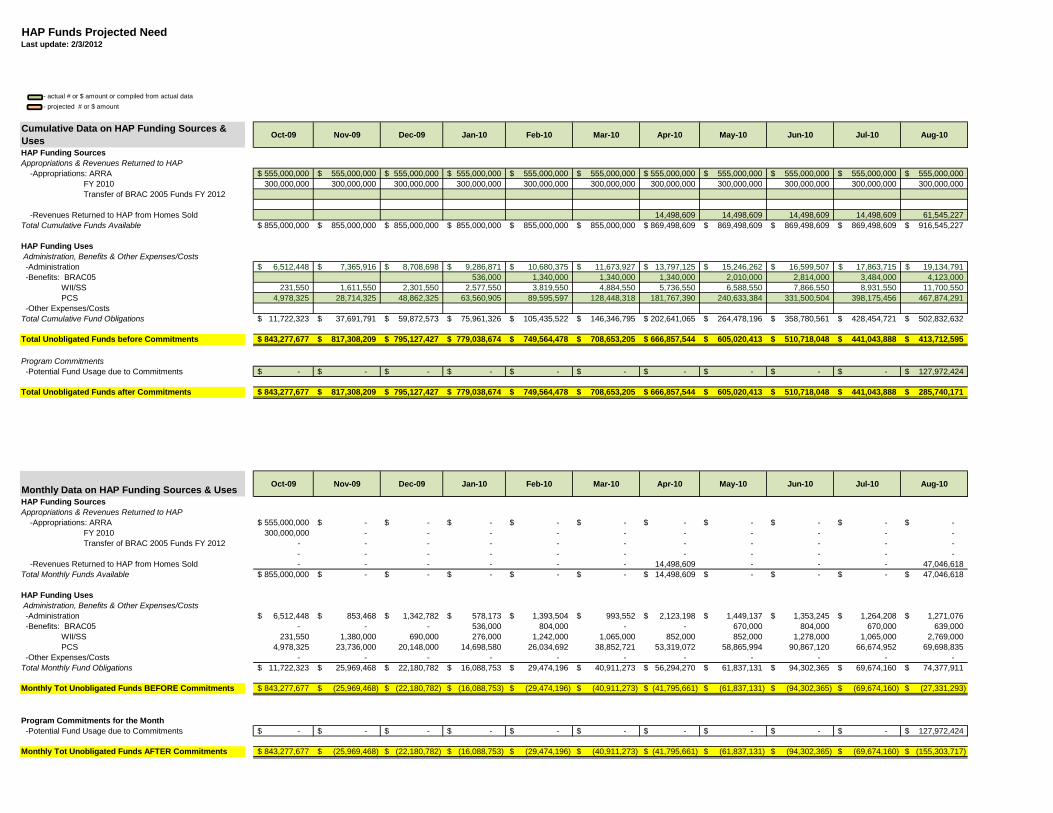
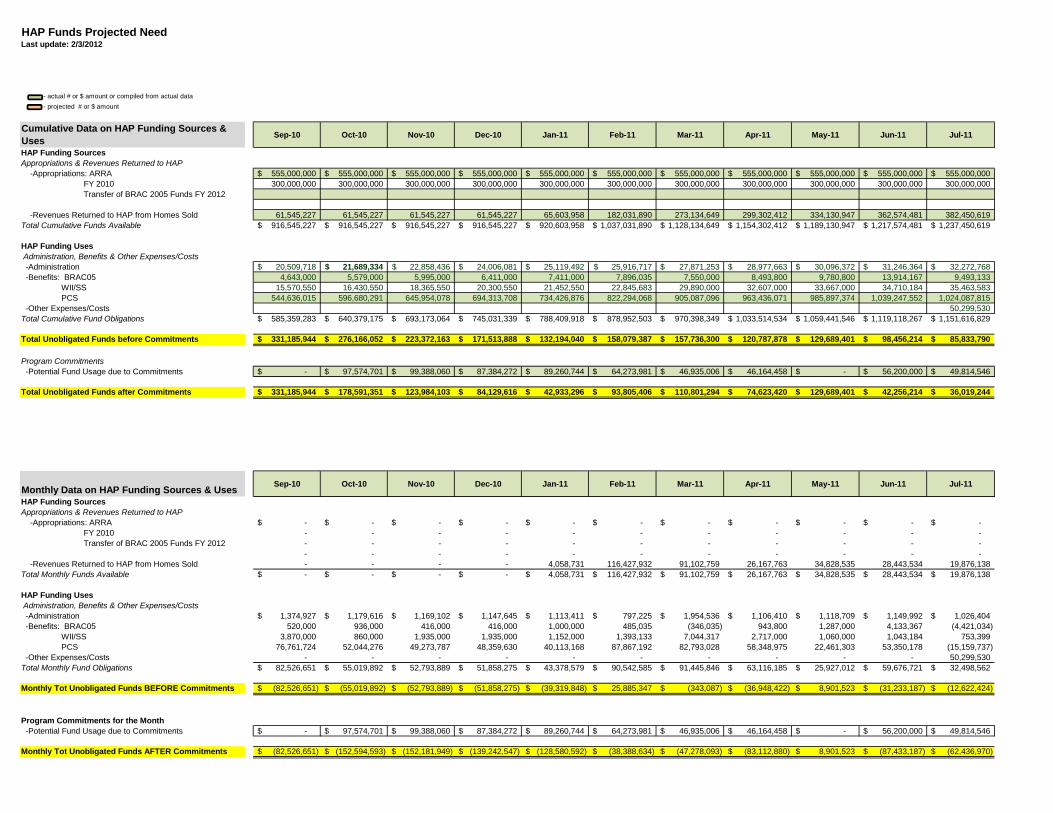
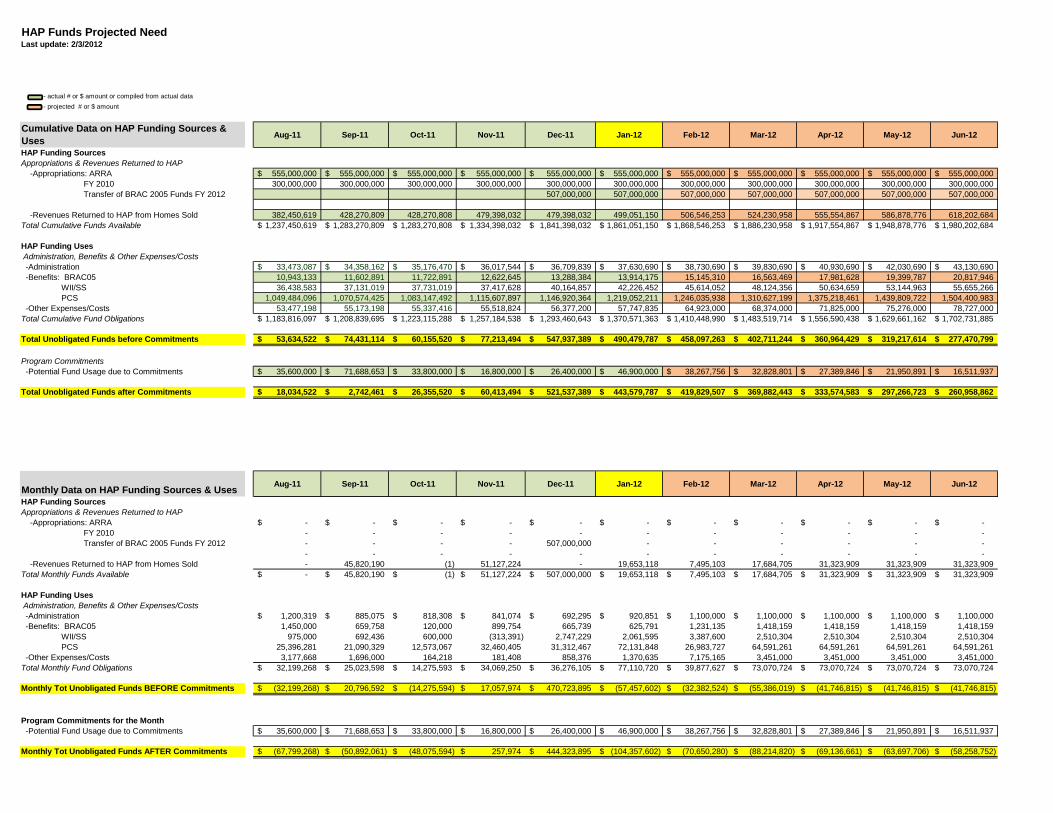
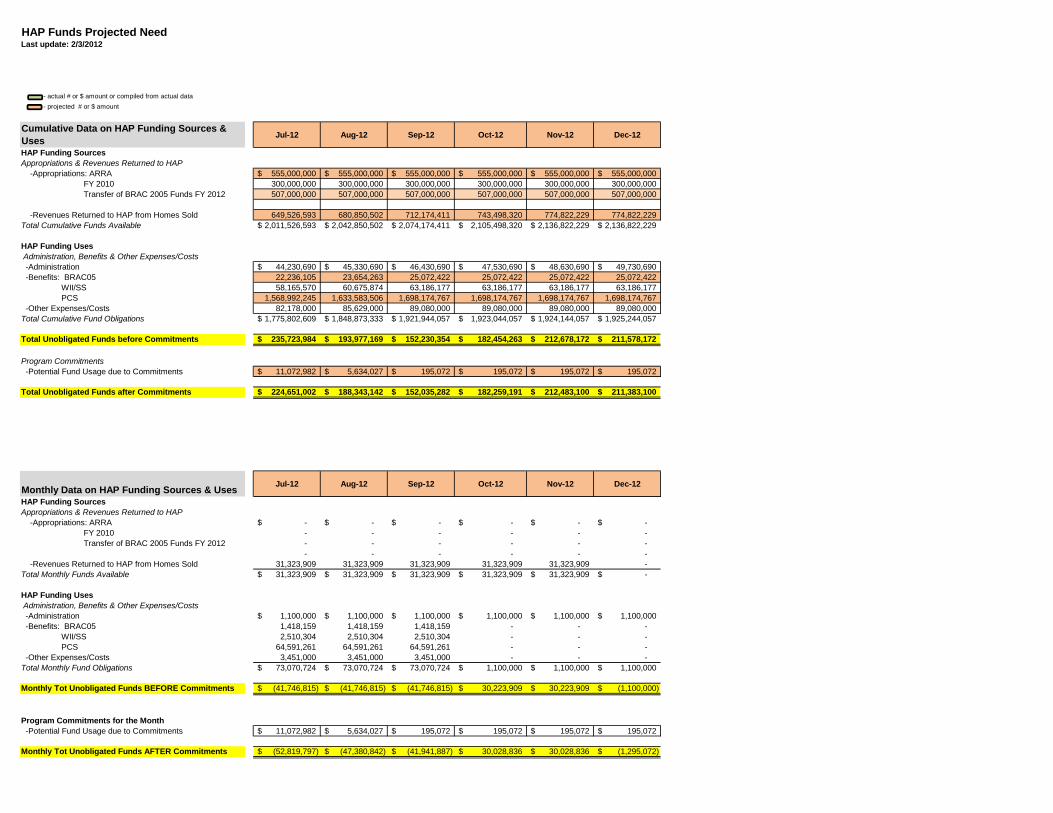
Appendix B HAP Funds Spent and Needs Projection, January 2012
This appendix contains the CEFMS-based financial data for the HAP funds as of
January 2012.

DRAFT—[Click here and type report #)] —9/12/12B-2 CE212T2_Appendix B1_Cover.docx
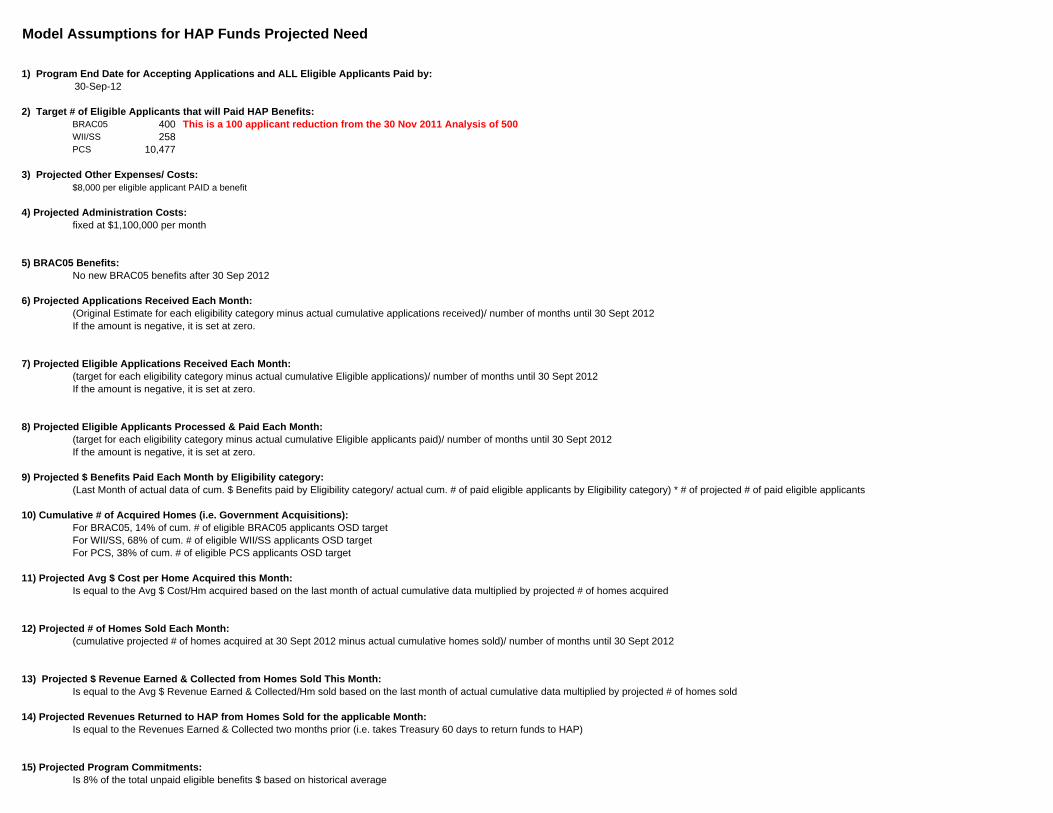
Model Assumptions for HAP Funds Projected Need
1) Program End Date for Accepting Applications and ALL Eligible Applicants Paid by:30-Sep-12
2) Target # of Eligible Applicants that will Paid HAP Benefits:BRAC05 400 This is a 100 applicant reduction from the 30 Nov 2011 Analysis of 500WII/SS 258 PCS 10,477
3) Projected Other Expenses/ Costs:$8,000 per eligible applicant PAID a benefit
4) Projected Administration Costs:fixed at $1,100,000 per month
5) BRAC05 Benefits:No new BRAC05 benefits after 30 Sep 2012
6) Projected Applications Received Each Month:(Original Estimate for each eligibility category minus actual cumulative applications received)/ number of months until 30 Sept 2012If the amount is negative, it is set at zero.
7) Projected Eligible Applications Received Each Month:(target for each eligibility category minus actual cumulative Eligible applications)/ number of months until 30 Sept 2012If the amount is negative, it is set at zero.
8) Projected Eligible Applicants Processed & Paid Each Month:(target for each eligibility category minus actual cumulative Eligible applicants paid)/ number of months until 30 Sept 2012If the amount is negative, it is set at zero.
9) Projected $ Benefits Paid Each Month by Eligibility category:(Last Month of actual data of cum. $ Benefits paid by Eligibility category/ actual cum. # of paid eligible applicants by Eligibility category) * # of projected # of paid eligible applicants
10) Cumulative # of Acquired Homes (i.e. Government Acquisitions):For BRAC05, 14% of cum. # of eligible BRAC05 applicants OSD targetFor WII/SS, 68% of cum. # of eligible WII/SS applicants OSD targetFor PCS, 38% of cum. # of eligible PCS applicants OSD target
11) Projected Avg $ Cost per Home Acquired this Month:Is equal to the Avg $ Cost/Hm acquired based on the last month of actual cumulative data multiplied by projected # of homes acquired
12) Projected # of Homes Sold Each Month:(cumulative projected # of homes acquired at 30 Sept 2012 minus actual cumulative homes sold)/ number of months until 30 Sept 2012
13) Projected $ Revenue Earned & Collected from Homes Sold This Month:Is equal to the Avg $ Revenue Earned & Collected/Hm sold based on the last month of actual cumulative data multiplied by projected # of homes sold
14) Projected Revenues Returned to HAP from Homes Sold for the applicable Month:Is equal to the Revenues Earned & Collected two months prior (i.e. takes Treasury 60 days to return funds to HAP)
15) Projected Program Commitments:Is 8% of the total unpaid eligible benefits $ based on historical average

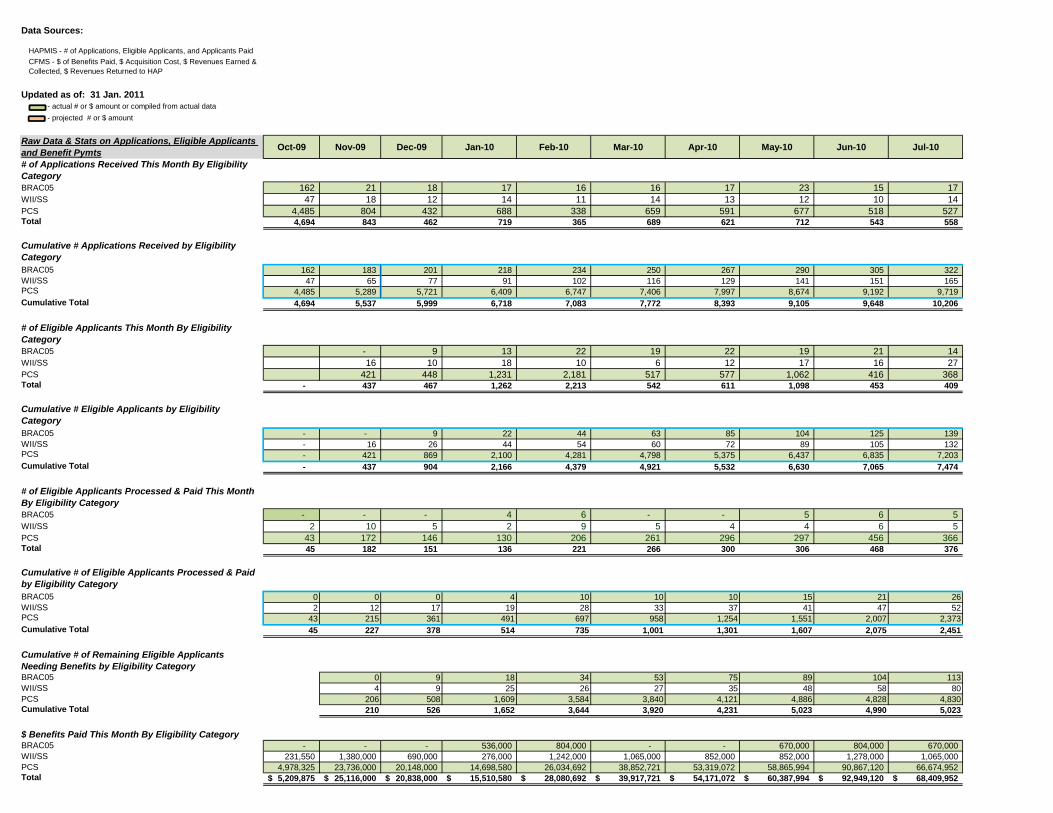
Data Sources:
HAPMIS - # of Applications, Eligible Applicants, and Applicants PaidCFMS - $ of Benefits Paid, $ Acquisition Cost, $ Revenues Earned & Collected, $ Revenues Returned to HAP
Updated as of: 31 Jan. 2011 - actual # or $ amount or compiled from actual data - projected # or $ amount
Raw Data & Stats on Applications, Eligible Applicants and Benefit Pymts# of Applications Received This Month By Eligibility CategoryBRAC05WII/SSPCSTotal
Cumulative # Applications Received by Eligibility CategoryBRAC05WII/SSPCSCumulative Total
# of Eligible Applicants This Month By Eligibility CategoryBRAC05WII/SSPCSTotal
Cumulative # Eligible Applicants by Eligibility CategoryBRAC05WII/SSPCSCumulative Total
# of Eligible Applicants Processed & Paid This Month By Eligibility CategoryBRAC05WII/SSPCSTotal
Cumulative # of Eligible Applicants Processed & Paid by Eligibility CategoryBRAC05 WII/SS PCS Cumulative Total
Cumulative # of Remaining Eligible Applicants Needing Benefits by Eligibility CategoryBRAC05WII/SSPCSCumulative Total
$ Benefits Paid This Month By Eligibility CategoryBRAC05WII/SSPCSTotal
Oct-09 Nov-09 Dec-09 Jan-10 Feb-10 Mar-10 Apr-10 May-10 Jun-10 Jul-10
162 21 18 17 16 16 17 23 15 17 47 18 12 14 11 14 13 12 10 14
4,485 804 432 688 338 659 591 677 518 527 4,694 843 462 719 365 689 621 712 543 558
162 183 201 218 234 250 267 290 305 322 47 65 77 91 102 116 129 141 151 165
4,485 5,289 5,721 6,409 6,747 7,406 7,997 8,674 9,192 9,719 4,694 5,537 5,999 6,718 7,083 7,772 8,393 9,105 9,648 10,206
- 9 13 22 19 22 19 21 14 16 10 18 10 6 12 17 16 27
421 448 1,231 2,181 517 577 1,062 416 368 - 437 467 1,262 2,213 542 611 1,098 453 409
- - 9 22 44 63 85 104 125 139 - 16 26 44 54 60 72 89 105 132 - 421 869 2,100 4,281 4,798 5,375 6,437 6,835 7,203 - 437 904 2,166 4,379 4,921 5,532 6,630 7,065 7,474
- - - 4 6 - - 5 6 5 2 10 5 2 9 5 4 4 6 5
43 172 146 130 206 261 296 297 456 366 45 182 151 136 221 266 300 306 468 376
0 0 0 4 10 10 10 15 21 262 12 17 19 28 33 37 41 47 52
43 215 361 491 697 958 1,254 1,551 2,007 2,37345 227 378 514 735 1,001 1,301 1,607 2,075 2,451
0 9 18 34 53 75 89 104 1134 9 25 26 27 35 48 58 80
206 508 1,609 3,584 3,840 4,121 4,886 4,828 4,830210 526 1,652 3,644 3,920 4,231 5,023 4,990 5,023
- - - 536,000 804,000 - - 670,000 804,000 670,000 231,550 1,380,000 690,000 276,000 1,242,000 1,065,000 852,000 852,000 1,278,000 1,065,000
4,978,325 23,736,000 20,148,000 14,698,580 26,034,692 38,852,721 53,319,072 58,865,994 90,867,120 66,674,952 5,209,875$ 25,116,000$ 20,838,000$ 15,510,580$ 28,080,692$ 39,917,721$ 54,171,072$ 60,387,994$ 92,949,120$ 68,409,952$
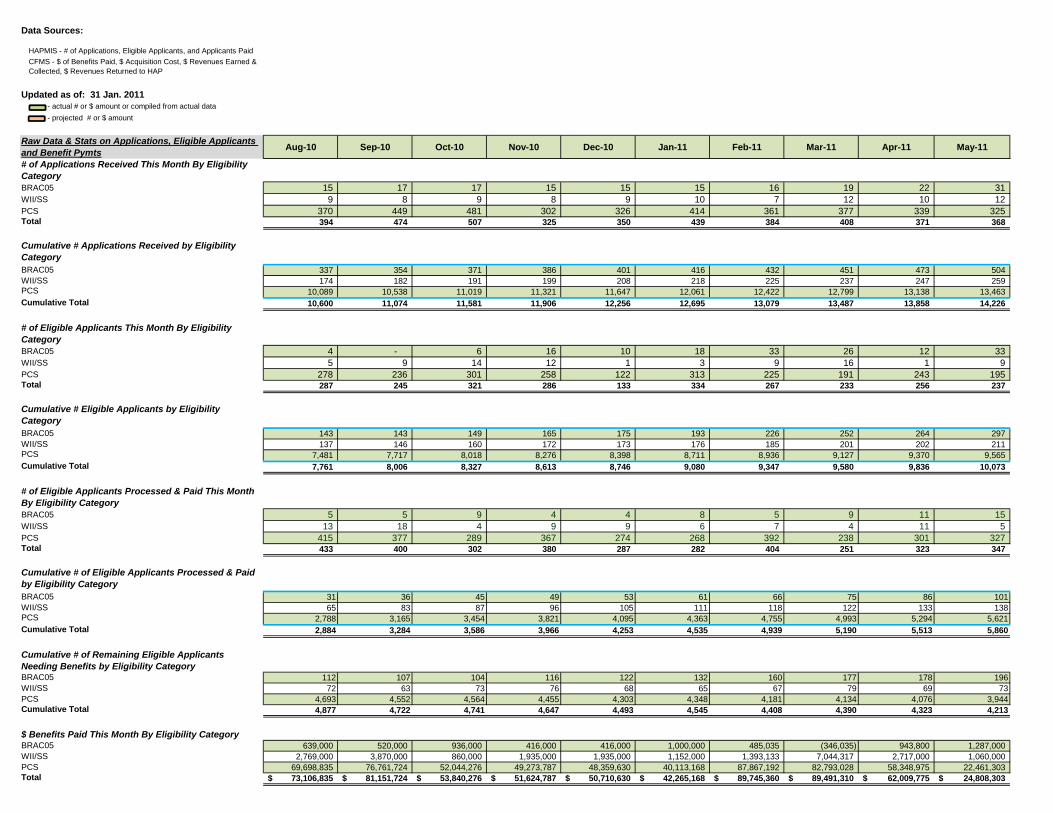
Data Sources:
HAPMIS - # of Applications, Eligible Applicants, and Applicants PaidCFMS - $ of Benefits Paid, $ Acquisition Cost, $ Revenues Earned & Collected, $ Revenues Returned to HAP
Updated as of: 31 Jan. 2011 - actual # or $ amount or compiled from actual data - projected # or $ amount
Raw Data & Stats on Applications, Eligible Applicants and Benefit Pymts# of Applications Received This Month By Eligibility CategoryBRAC05WII/SSPCSTotal
Cumulative # Applications Received by Eligibility CategoryBRAC05WII/SSPCSCumulative Total
# of Eligible Applicants This Month By Eligibility CategoryBRAC05WII/SSPCSTotal
Cumulative # Eligible Applicants by Eligibility CategoryBRAC05WII/SSPCSCumulative Total
# of Eligible Applicants Processed & Paid This Month By Eligibility CategoryBRAC05WII/SSPCSTotal
Cumulative # of Eligible Applicants Processed & Paid by Eligibility CategoryBRAC05 WII/SS PCS Cumulative Total
Cumulative # of Remaining Eligible Applicants Needing Benefits by Eligibility CategoryBRAC05WII/SSPCSCumulative Total
$ Benefits Paid This Month By Eligibility CategoryBRAC05WII/SSPCSTotal
Aug-10 Sep-10 Oct-10 Nov-10 Dec-10 Jan-11 Feb-11 Mar-11 Apr-11 May-11
15 17 17 15 15 15 16 19 22 31 9 8 9 8 9 10 7 12 10 12
370 449 481 302 326 414 361 377 339 325 394 474 507 325 350 439 384 408 371 368
337 354 371 386 401 416 432 451 473 504 174 182 191 199 208 218 225 237 247 259
10,089 10,538 11,019 11,321 11,647 12,061 12,422 12,799 13,138 13,463 10,600 11,074 11,581 11,906 12,256 12,695 13,079 13,487 13,858 14,226
4 - 6 16 10 18 33 26 12 33 5 9 14 12 1 3 9 16 1 9
278 236 301 258 122 313 225 191 243 195 287 245 321 286 133 334 267 233 256 237
143 143 149 165 175 193 226 252 264 297 137 146 160 172 173 176 185 201 202 211
7,481 7,717 8,018 8,276 8,398 8,711 8,936 9,127 9,370 9,565 7,761 8,006 8,327 8,613 8,746 9,080 9,347 9,580 9,836 10,073
5 5 9 4 4 8 5 9 11 15 13 18 4 9 9 6 7 4 11 5
415 377 289 367 274 268 392 238 301 327 433 400 302 380 287 282 404 251 323 347
31 36 45 49 53 61 66 75 86 10165 83 87 96 105 111 118 122 133 138
2,788 3,165 3,454 3,821 4,095 4,363 4,755 4,993 5,294 5,6212,884 3,284 3,586 3,966 4,253 4,535 4,939 5,190 5,513 5,860
112 107 104 116 122 132 160 177 178 19672 63 73 76 68 65 67 79 69 73
4,693 4,552 4,564 4,455 4,303 4,348 4,181 4,134 4,076 3,9444,877 4,722 4,741 4,647 4,493 4,545 4,408 4,390 4,323 4,213
639,000 520,000 936,000 416,000 416,000 1,000,000 485,035 (346,035) 943,800 1,287,000 2,769,000 3,870,000 860,000 1,935,000 1,935,000 1,152,000 1,393,133 7,044,317 2,717,000 1,060,000
69,698,835 76,761,724 52,044,276 49,273,787 48,359,630 40,113,168 87,867,192 82,793,028 58,348,975 22,461,303 73,106,835$ 81,151,724$ 53,840,276$ 51,624,787$ 50,710,630$ 42,265,168$ 89,745,360$ 89,491,310$ 62,009,775$ 24,808,303$
Data Sources:
HAPMIS - # of Applications, Eligible Applicants, and Applicants PaidCFMS - $ of Benefits Paid, $ Acquisition Cost, $ Revenues Earned & Collected, $ Revenues Returned to HAP
Updated as of: 31 Jan. 2011 - actual # or $ amount or compiled from actual data - projected # or $ amount
Raw Data & Stats on Applications, Eligible Applicants and Benefit Pymts# of Applications Received This Month By Eligibility CategoryBRAC05WII/SSPCSTotal
Cumulative # Applications Received by Eligibility CategoryBRAC05WII/SSPCSCumulative Total
# of Eligible Applicants This Month By Eligibility CategoryBRAC05WII/SSPCSTotal
Cumulative # Eligible Applicants by Eligibility CategoryBRAC05WII/SSPCSCumulative Total
# of Eligible Applicants Processed & Paid This Month By Eligibility CategoryBRAC05WII/SSPCSTotal
Cumulative # of Eligible Applicants Processed & Paid by Eligibility CategoryBRAC05 WII/SS PCS Cumulative Total
Cumulative # of Remaining Eligible Applicants Needing Benefits by Eligibility CategoryBRAC05WII/SSPCSCumulative Total
$ Benefits Paid This Month By Eligibility CategoryBRAC05WII/SSPCSTotal
Jun-11 Jul-11 Aug-11 Sep-11 Oct-11 Nov-11 Dec-11 Jan-12 Feb-12
26 30 24 28 15 7 8 5 15 10 12 12 10 6 26 10 9 -
321 225 200 185 155 252 123 139 125 357 267 236 223 176 285 141 153 140
530 560 584 612 627 634 642 647 662 269 281 293 303 309 335 345 354 354
13,784 14,009 14,209 14,394 14,549 14,801 14,924 15,063 15,188 14,583 14,850 15,086 15,309 15,485 15,770 15,911 16,064 16,204
9 7 5 6 1 (7) 9 5 9 6 6 9 9 4 9 4 4 -
201 126 141 110 113 88 47 95 - 216 139 155 125 118 90 60 104 9
306 313 318 324 325 318 327 332 341 217 223 232 241 245 254 258 262 262
9,766 9,892 10,033 10,143 10,256 10,344 10,391 10,486 10,486 10,289 10,428 10,583 10,708 10,826 10,916 10,976 11,080 11,089
19 17 25 11 2 22 15 7 23 3 8 5 3 3 1 3 12 10
208 312 260 198 149 161 167 213 399 230 337 290 212 154 184 185 232 431
120 137 162 173 175 197 212 219 242141 149 154 157 160 161 164 176 186
5,829 6,141 6,401 6,599 6,748 6,909 7,076 7,289 7,6886,090 6,427 6,717 6,929 7,083 7,267 7,452 7,684 8,115
186 176 156 151 150 121 115 113 9976 74 78 84 85 93 94 86 76
3,937 3,751 3,632 3,544 3,508 3,435 3,315 3,197 2,7994,199 4,001 3,866 3,779 3,743 3,649 3,524 3,396 2,973
4,133,367 (4,421,034) 1,450,000 659,758 120,000 899,754 665,739 625,791 1,418,159 1,043,184 753,399 975,000 692,436 600,000 (313,390) 2,747,228 2,061,595 2,510,304
53,350,178 (15,159,737) 25,396,281 21,090,329 12,573,067 32,460,405 31,312,467 72,131,848 64,591,261 58,526,729$ (18,827,372)$ 27,821,281$ 22,442,523$ 13,293,067$ 33,046,769$ 34,725,434$ 74,819,234$ 68,519,724$
Data Sources:
HAPMIS - # of Applications, Eligible Applicants, and Applicants PaidCFMS - $ of Benefits Paid, $ Acquisition Cost, $ Revenues Earned & Collected, $ Revenues Returned to HAP
Updated as of: 31 Jan. 2011 - actual # or $ amount or compiled from actual data - projected # or $ amount
Raw Data & Stats on Applications, Eligible Applicants and Benefit Pymts# of Applications Received This Month By Eligibility CategoryBRAC05WII/SSPCSTotal
Cumulative # Applications Received by Eligibility CategoryBRAC05WII/SSPCSCumulative Total
# of Eligible Applicants This Month By Eligibility CategoryBRAC05WII/SSPCSTotal
Cumulative # Eligible Applicants by Eligibility CategoryBRAC05WII/SSPCSCumulative Total
# of Eligible Applicants Processed & Paid This Month By Eligibility CategoryBRAC05WII/SSPCSTotal
Cumulative # of Eligible Applicants Processed & Paid by Eligibility CategoryBRAC05 WII/SS PCS Cumulative Total
Cumulative # of Remaining Eligible Applicants Needing Benefits by Eligibility CategoryBRAC05WII/SSPCSCumulative Total
$ Benefits Paid This Month By Eligibility CategoryBRAC05WII/SSPCSTotal
Mar-12 Apr-12 May-12 Jun-12 Jul-12 Aug-12 Sep-12 Oct-12 Nov-12 Dec-12
15 15 15 15 15 15 15 - - - - - - - - - - - - - 125 125 125 125 125 125 125 - - - 140 140 140 140 140 140 140 - - -
677 692 707 722 737 752 767 767 767 767 354 354 354 354 354 354 354 354 354 354
15,314 15,439 15,565 15,690 15,815 15,941 16,066 16,066 16,066 16,066 16,345 16,485 16,626 16,766 16,906 17,047 17,187 17,187 17,187 17,187
9 9 9 9 9 9 9 - - - - - - - - - - - - - - - - - - - - - - -
9 9 9 9 9 9 9 - - -
349 358 366 375 383 392 400 400 400 400 262 262 262 262 262 262 262 262 262 262
10,486 10,486 10,486 10,486 10,486 10,486 10,486 10,486 10,486 10,486 11,097 11,106 11,114 11,123 11,131 11,140 11,148 11,148 11,148 11,148
23 23 23 23 23 23 23 - - - 10 10 10 10 10 10 10 - - -
399 399 399 399 399 399 399 - - - 431 431 431 431 431 431 431 - - -
264 287 310 332 355 377 400 400 400 400197 207 217 227 238 248 258 258 258 258
8,086 8,485 8,883 9,282 9,680 10,079 10,477 10,477 10,477 10,4778,547 8,978 9,410 9,841 10,272 10,704 11,135 11,135 11,135 11,135
85 71 57 42 28 14 - - - - 66 55 45 35 25 14 4 4 4 4
2,400 2,002 1,603 1,205 806 408 9 9 9 9 2,550 2,127 1,705 1,282 859 436 13 13 13 13
1,418,159 1,418,159 1,418,159 1,418,159 1,418,159 1,418,159 1,418,159 - - - 2,510,304 2,510,304 2,510,304 2,510,304 2,510,304 2,510,304 2,510,304 - - -
64,591,261 64,591,261 64,591,261 64,591,261 64,591,261 64,591,261 64,591,261 - - - 68,519,724$ 68,519,724$ 68,519,724$ 68,519,724$ 68,519,724$ 68,519,724$ 68,519,724$ -$ -$ -$
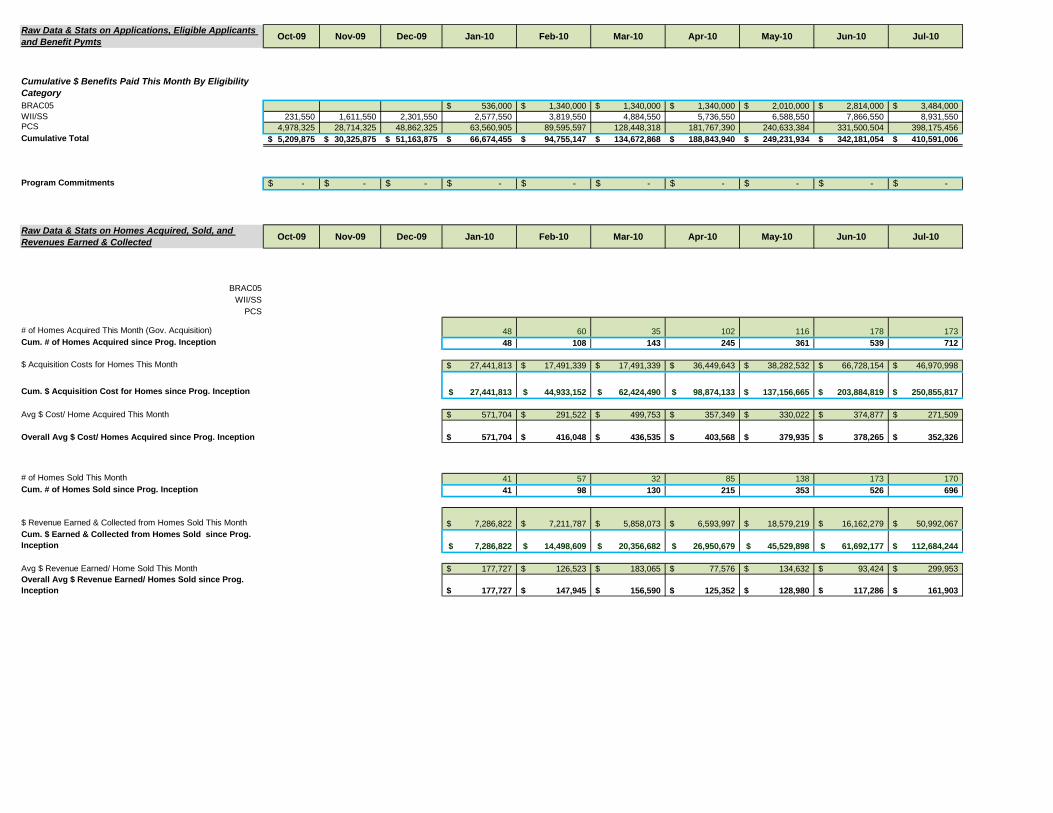
Raw Data & Stats on Applications, Eligible Applicants and Benefit Pymts
Cumulative $ Benefits Paid This Month By Eligibility CategoryBRAC05WII/SSPCSCumulative Total
Program Commitments
Raw Data & Stats on Homes Acquired, Sold, and Revenues Earned & Collected
BRAC05WII/SS
PCS
# of Homes Acquired This Month (Gov. Acquisition)Cum. # of Homes Acquired since Prog. Inception
$ Acquisition Costs for Homes This Month
Cum. $ Acquisition Cost for Homes since Prog. Inception
Avg $ Cost/ Home Acquired This Month
Overall Avg $ Cost/ Homes Acquired since Prog. Inception
# of Homes Sold This MonthCum. # of Homes Sold since Prog. Inception
$ Revenue Earned & Collected from Homes Sold This MonthCum. $ Earned & Collected from Homes Sold since Prog. Inception
Avg $ Revenue Earned/ Home Sold This MonthOverall Avg $ Revenue Earned/ Homes Sold since Prog. Inception
Oct-09 Nov-09 Dec-09 Jan-10 Feb-10 Mar-10 Apr-10 May-10 Jun-10 Jul-10
536,000$ 1,340,000$ 1,340,000$ 1,340,000$ 2,010,000$ 2,814,000$ 3,484,000$ 231,550 1,611,550 2,301,550 2,577,550 3,819,550 4,884,550 5,736,550 6,588,550 7,866,550 8,931,550
4,978,325 28,714,325 48,862,325 63,560,905 89,595,597 128,448,318 181,767,390 240,633,384 331,500,504 398,175,456 5,209,875$ 30,325,875$ 51,163,875$ 66,674,455$ 94,755,147$ 134,672,868$ 188,843,940$ 249,231,934$ 342,181,054$ 410,591,006$
-$ -$ -$ -$ -$ -$ -$ -$ -$ -$
Oct-09 Nov-09 Dec-09 Jan-10 Feb-10 Mar-10 Apr-10 May-10 Jun-10 Jul-10
48 60 35 102 116 178 173 48 108 143 245 361 539 712
27,441,813$ 17,491,339$ 17,491,339$ 36,449,643$ 38,282,532$ 66,728,154$ 46,970,998$
27,441,813$ 44,933,152$ 62,424,490$ 98,874,133$ 137,156,665$ 203,884,819$ 250,855,817$
571,704$ 291,522$ 499,753$ 357,349$ 330,022$ 374,877$ 271,509$
571,704$ 416,048$ 436,535$ 403,568$ 379,935$ 378,265$ 352,326$
41 57 32 85 138 173 170 41 98 130 215 353 526 696
7,286,822$ 7,211,787$ 5,858,073$ 6,593,997$ 18,579,219$ 16,162,279$ 50,992,067$
7,286,822$ 14,498,609$ 20,356,682$ 26,950,679$ 45,529,898$ 61,692,177$ 112,684,244$
177,727$ 126,523$ 183,065$ 77,576$ 134,632$ 93,424$ 299,953$
177,727$ 147,945$ 156,590$ 125,352$ 128,980$ 117,286$ 161,903$
Raw Data & Stats on Applications, Eligible Applicants and Benefit Pymts
Cumulative $ Benefits Paid This Month By Eligibility CategoryBRAC05WII/SSPCSCumulative Total
Program Commitments
Raw Data & Stats on Homes Acquired, Sold, and Revenues Earned & Collected
BRAC05WII/SS
PCS
# of Homes Acquired This Month (Gov. Acquisition)Cum. # of Homes Acquired since Prog. Inception
$ Acquisition Costs for Homes This Month
Cum. $ Acquisition Cost for Homes since Prog. Inception
Avg $ Cost/ Home Acquired This Month
Overall Avg $ Cost/ Homes Acquired since Prog. Inception
# of Homes Sold This MonthCum. # of Homes Sold since Prog. Inception
$ Revenue Earned & Collected from Homes Sold This MonthCum. $ Earned & Collected from Homes Sold since Prog. Inception
Avg $ Revenue Earned/ Home Sold This MonthOverall Avg $ Revenue Earned/ Homes Sold since Prog. Inception
Aug-10 Sep-10 Oct-10 Nov-10 Dec-10 Jan-11 Feb-11 Mar-11 Apr-11 May-11
4,123,000$ 4,643,000$ 5,579,000$ 5,995,000$ 6,411,000$ 7,411,000$ 7,896,035$ 7,550,000$ 8,493,800$ 9,780,800$ 11,700,550 15,570,550 16,430,550 18,365,550 20,300,550 21,452,550 22,845,683 29,890,000 32,607,000 33,667,000
467,874,291 544,636,015 596,680,291 645,954,078 694,313,708 734,426,876 822,294,068 905,087,096 963,436,071 985,897,374 483,697,841$ 564,849,565$ 618,689,841$ 670,314,628$ 721,025,258$ 763,290,426$ 853,035,786$ 942,527,096$ 1,004,536,871$ 1,029,345,174$
16% 0% 13% 13% 12% 12% 9% 7% 7% 0%127,972,424$ -$ 97,574,701$ 99,388,060$ 87,384,272$ 89,260,744$ 64,273,981$ 46,935,006$ 46,164,458$ -$
Aug-10 Sep-10 Oct-10 Nov-10 Dec-10 Jan-11 Feb-11 Mar-11 Apr-11 May-11
171 164 112 173 130 106 173 104 149 155883 1,047 1,159 1,332 1,462 1,568 1,741 1,845 1,994 2,149
49,234,618$ 58,813,227$ 32,127,547$ 35,946,655$ 33,785,102$ 26,696,537$ 66,465,626$ 65,367,312$ 45,850,822$ 9,056,092$
300,090,435$ 358,903,662$ 391,031,209$ 426,977,864$ 460,762,966$ 487,459,503$ 553,925,129$ 619,292,441$ 665,143,263$ 674,199,355$
287,922$ 358,617$ 286,853$ 207,784$ 259,885$ 251,854$ 384,194$ 628,532$ 307,724$ 58,426$
339,853$ 342,792$ 337,387$ 320,554$ 315,159$ 310,880$ 318,165$ 335,660$ 333,572$ 313,727$
139 178 110 179 128 111 136 74 113 122835 1,013 1,123 1,302 1,430 1,541 1,677 1,751 1,864 1,986
37,759,374$ 27,334,506$ 6,564,447$ 50,470,988$ 17,478,279$ 20,842,811$ 31,489,153$ 29,507,145$ 28,443,534$ 19,876,137$
150,443,618$ 177,778,124$ 184,342,571$ 234,813,559$ 252,291,838$ 273,134,649$ 304,623,802$ 334,130,947$ 362,574,481$ 382,450,618$
271,650$ 153,565$ 59,677$ 281,961$ 136,549$ 187,773$ 231,538$ 398,745$ 251,713$ 162,919$
180,172$ 175,497$ 164,152$ 180,348$ 176,428$ 177,245$ 181,648$ 190,823$ 194,514$ 192,573$
Raw Data & Stats on Applications, Eligible Applicants and Benefit Pymts
Cumulative $ Benefits Paid This Month By Eligibility CategoryBRAC05WII/SSPCSCumulative Total
Program Commitments
Raw Data & Stats on Homes Acquired, Sold, and Revenues Earned & Collected
BRAC05WII/SS
PCS
# of Homes Acquired This Month (Gov. Acquisition)Cum. # of Homes Acquired since Prog. Inception
$ Acquisition Costs for Homes This Month
Cum. $ Acquisition Cost for Homes since Prog. Inception
Avg $ Cost/ Home Acquired This Month
Overall Avg $ Cost/ Homes Acquired since Prog. Inception
# of Homes Sold This MonthCum. # of Homes Sold since Prog. Inception
$ Revenue Earned & Collected from Homes Sold This MonthCum. $ Earned & Collected from Homes Sold since Prog. Inception
Avg $ Revenue Earned/ Home Sold This MonthOverall Avg $ Revenue Earned/ Homes Sold since Prog. Inception
Jun-11 Jul-11 Aug-11 Sep-11 Oct-11 Nov-11 Dec-11 Jan-12 Feb-12
13,914,167$ 9,493,133$ 10,943,133$ 11,602,891$ 11,722,891$ 12,622,645$ 13,288,384$ 13,914,175$ 15,145,310$ 34,710,184 35,463,583 36,438,583 37,131,019 37,731,019 37,417,629 40,164,857$ 42,226,452$ 45,614,052$
1,039,247,552 1,024,087,815 1,049,484,096 1,070,574,425 1,083,147,492 1,115,607,897 1,146,920,364$ 1,219,052,211$ 1,246,035,938$ 1,087,871,903$ 1,069,044,531$ 1,096,865,812$ 1,119,308,335$ 1,132,601,402$ 1,165,648,171$ 1,200,373,604$ 1,275,192,838$ 1,306,795,300$
8% 8% 6% 12% 6% 3% 5% 9% 8%56,200,000$ 49,814,546$ 35,600,000$ 71,688,653$ 33,800,000$ 16,800,000 26,400,000$ 46,900,000$ 38,267,756$
Jun-11 Jul-11 Aug-11 Sep-11 Oct-11 Nov-11 Dec-11 Jan-12 Feb-12
102 127 145 111 49 28 58 107 164 2,251 2,378 2,523 2,634 2,683 2,711 2,769 2,876 3,040
37,312,521$ 21,421,636$ 15,887,530$ 7,798,731$ 5,734,875$ 26,165,472$ 18,820,956$ 64,681,658$ 49,864,479$
711,511,876$ 732,933,512$ 748,821,042$ 756,619,773$ 762,354,648$ 788,520,120$ 807,341,076$ 872,022,734$ 921,887,213$
365,809$ 168,674$ 109,569$ 70,259$ 117,038$ 934,481$ 324,499$ 604,501$ 303,207$
316,087$ 308,214$ 296,798$ 287,251$ 284,143$ 290,860$ 291,564$ 303,207$ 303,207$
231 142 148 104 32 33 46 114 169 2,217 2,359 2,507 2,611 2,643 2,676 2,722 2,836 3,005
21,058,501$ 24,761,689$ 25,497,350$ 25,629,875$ 13,823,224$ 5,829,893$ 7,495,103$ 17,684,705$ 31,323,909$
403,509,119$ 428,270,808$ 453,768,158$ 479,398,033$ 493,221,257$ 499,051,150$ 506,546,253$ 524,230,958$ 555,554,867$
91,162$ 174,378$ 172,279$ 246,441$ 431,976$ 176,663$ 162,937$ 155,129$ 184,849$
182,007$ 181,548$ 181,000$ 183,607$ 186,614$ 186,491$ 186,093$ 184,849$ 184,849$
Raw Data & Stats on Applications, Eligible Applicants and Benefit Pymts
Cumulative $ Benefits Paid This Month By Eligibility CategoryBRAC05WII/SSPCSCumulative Total
Program Commitments
Raw Data & Stats on Homes Acquired, Sold, and Revenues Earned & Collected
BRAC05WII/SS
PCS
# of Homes Acquired This Month (Gov. Acquisition)Cum. # of Homes Acquired since Prog. Inception
$ Acquisition Costs for Homes This Month
Cum. $ Acquisition Cost for Homes since Prog. Inception
Avg $ Cost/ Home Acquired This Month
Overall Avg $ Cost/ Homes Acquired since Prog. Inception
# of Homes Sold This MonthCum. # of Homes Sold since Prog. Inception
$ Revenue Earned & Collected from Homes Sold This MonthCum. $ Earned & Collected from Homes Sold since Prog. Inception
Avg $ Revenue Earned/ Home Sold This MonthOverall Avg $ Revenue Earned/ Homes Sold since Prog. Inception
Mar-12 Apr-12 May-12 Jun-12 Jul-12 Aug-12 Sep-12 Oct-12 Nov-12 Dec-12
16,563,469$ 17,981,628$ 19,399,787$ 20,817,946$ 22,236,105$ 23,654,263$ 25,072,422$ 25,072,422$ 25,072,422$ 25,072,422$ 48,124,356$ 50,634,659$ 53,144,963$ 55,655,266$ 58,165,570$ 60,675,874$ 63,186,177$ 63,186,177$ 63,186,177$ 63,186,177$
1,310,627,199$ 1,375,218,461$ 1,439,809,722$ 1,504,400,983$ 1,568,992,245$ 1,633,583,506$ 1,698,174,767$ 1,698,174,767$ 1,698,174,767$ 1,698,174,767$ 1,375,315,024$ 1,443,834,748$ 1,512,354,472$ 1,580,874,195$ 1,649,393,919$ 1,717,913,643$ 1,786,433,367$ 1,786,433,367$ 1,786,433,367$ 1,786,433,367$
8% 8% 8% 8% 8% 8%32,828,801$ 27,389,846$ 21,950,891$ 16,511,937$ 11,072,982$ 5,634,027$ 195,072$ 195,072$ 195,072$ 195,072$
Mar-12 Apr-12 May-12 Jun-12 Jul-12 Aug-12 Sep-12 Oct-12 Nov-12 Dec-12
164 164 164 164 164 164 164 - - - 3,205 3,369 3,534 3,698 3,863 4,027 4,192 4,192 4,192 4,192
49,864,479$ 49,864,479$ 49,864,479$ 49,864,479$ 49,864,479$ 49,864,479$ 49,864,479$ -$ -$ -$
971,751,693$ 1,021,616,172$ 1,071,480,652$ 1,121,345,131$ 1,171,209,610$ 1,221,074,090$ 1,270,938,569$ 1,270,938,569$ 1,270,938,569$ 1,270,938,569$
303,207$ 303,207$ 303,207$ 303,207$ 303,207$ 303,207$ 303,207$ #DIV/0! #DIV/0! #DIV/0!
303,207$ 303,207$ 303,207$ 303,207$ 303,207$ 303,207$ 303,207$ 303,207$ 303,207$ 303,207$
169 169 169 169 169 169 169 - - - 3,175 3,344 3,514 3,683 3,853 4,022 4,192 4,192 4,192 4,192
31,323,909$ 31,323,909$ 31,323,909$ 31,323,909$ 31,323,909$ 31,323,909$ 31,323,909$ -$ -$ -$
586,878,776$ 618,202,684$ 649,526,593$ 680,850,502$ 712,174,411$ 743,498,320$ 774,822,229$ 774,822,229$ 774,822,229$ 774,822,229$
184,849$ 184,849$ 184,849$ 184,849$ 184,849$ 184,849$ 184,849$ #DIV/0! #DIV/0! #DIV/0!
184,849$ 184,849$ 184,849$ 184,849$ 184,849$ 184,849$ 184,849$ 184,849$ 184,849$ 184,849$
HAP Funds Projected NeedLast update: 2/3/2012
- actual # or $ amount or compiled from actual data - projected # or $ amount
Cumulative Data on HAP Funding Sources & Uses Oct-09 Nov-09 Dec-09 Jan-10 Feb-10 Mar-10 Apr-10 May-10 Jun-10 Jul-10 Aug-10
HAP Funding SourcesAppropriations & Revenues Returned to HAP -Appropriations: ARRA 555,000,000$ 555,000,000$ 555,000,000$ 555,000,000$ 555,000,000$ 555,000,000$ 555,000,000$ 555,000,000$ 555,000,000$ 555,000,000$ 555,000,000$ FY 2010 300,000,000 300,000,000 300,000,000 300,000,000 300,000,000 300,000,000 300,000,000 300,000,000 300,000,000 300,000,000 300,000,000 Transfer of BRAC 2005 Funds FY 2012
-Revenues Returned to HAP from Homes Sold 14,498,609 14,498,609 14,498,609 14,498,609 61,545,227 Total Cumulative Funds Available 855,000,000$ 855,000,000$ 855,000,000$ 855,000,000$ 855,000,000$ 855,000,000$ 869,498,609$ 869,498,609$ 869,498,609$ 869,498,609$ 916,545,227$
HAP Funding Uses Administration, Benefits & Other Expenses/Costs -Administration 6,512,448$ 7,365,916$ 8,708,698$ 9,286,871$ 10,680,375$ 11,673,927$ 13,797,125$ 15,246,262$ 16,599,507$ 17,863,715$ 19,134,791$ -Benefits: BRAC05 536,000 1,340,000 1,340,000 1,340,000 2,010,000 2,814,000 3,484,000 4,123,000 WII/SS 231,550 1,611,550 2,301,550 2,577,550 3,819,550 4,884,550 5,736,550 6,588,550 7,866,550 8,931,550 11,700,550 PCS 4,978,325 28,714,325 48,862,325 63,560,905 89,595,597 128,448,318 181,767,390 240,633,384 331,500,504 398,175,456 467,874,291 -Other Expenses/CostsTotal Cumulative Fund Obligations 11,722,323$ 37,691,791$ 59,872,573$ 75,961,326$ 105,435,522$ 146,346,795$ 202,641,065$ 264,478,196$ 358,780,561$ 428,454,721$ 502,832,632$
Total Unobligated Funds before Commitments 843,277,677$ 817,308,209$ 795,127,427$ 779,038,674$ 749,564,478$ 708,653,205$ 666,857,544$ 605,020,413$ 510,718,048$ 441,043,888$ 413,712,595$
Program Commitments -Potential Fund Usage due to Commitments -$ -$ -$ -$ -$ -$ -$ -$ -$ -$ 127,972,424$
Total Unobligated Funds after Commitments 843,277,677$ 817,308,209$ 795,127,427$ 779,038,674$ 749,564,478$ 708,653,205$ 666,857,544$ 605,020,413$ 510,718,048$ 441,043,888$ 285,740,171$
Monthly Data on HAP Funding Sources & Uses Oct-09 Nov-09 Dec-09 Jan-10 Feb-10 Mar-10 Apr-10 May-10 Jun-10 Jul-10 Aug-10
HAP Funding SourcesAppropriations & Revenues Returned to HAP -Appropriations: ARRA 555,000,000$ -$ -$ -$ -$ -$ -$ -$ -$ -$ -$ FY 2010 300,000,000 - - - - - - - - - - Transfer of BRAC 2005 Funds FY 2012 - - - - - - - - - - -
- - - - - - - - - - - -Revenues Returned to HAP from Homes Sold - - - - - - 14,498,609 - - - 47,046,618 Total Monthly Funds Available 855,000,000$ -$ -$ -$ -$ -$ 14,498,609$ -$ -$ -$ 47,046,618$
HAP Funding Uses Administration, Benefits & Other Expenses/Costs -Administration 6,512,448$ 853,468$ 1,342,782$ 578,173$ 1,393,504$ 993,552$ 2,123,198$ 1,449,137$ 1,353,245$ 1,264,208$ 1,271,076$ -Benefits: BRAC05 - - - 536,000 804,000 - - 670,000 804,000 670,000 639,000 WII/SS 231,550 1,380,000 690,000 276,000 1,242,000 1,065,000 852,000 852,000 1,278,000 1,065,000 2,769,000 PCS 4,978,325 23,736,000 20,148,000 14,698,580 26,034,692 38,852,721 53,319,072 58,865,994 90,867,120 66,674,952 69,698,835 -Other Expenses/Costs - - - - - - - - - - - Total Monthly Fund Obligations 11,722,323$ 25,969,468$ 22,180,782$ 16,088,753$ 29,474,196$ 40,911,273$ 56,294,270$ 61,837,131$ 94,302,365$ 69,674,160$ 74,377,911$
Monthly Tot Unobligated Funds BEFORE Commitments 843,277,677$ (25,969,468)$ (22,180,782)$ (16,088,753)$ (29,474,196)$ (40,911,273)$ (41,795,661)$ (61,837,131)$ (94,302,365)$ (69,674,160)$ (27,331,293)$
Program Commitments for the Month -Potential Fund Usage due to Commitments -$ -$ -$ -$ -$ -$ -$ -$ -$ -$ 127,972,424$
Monthly Tot Unobligated Funds AFTER Commitments 843,277,677$ (25,969,468)$ (22,180,782)$ (16,088,753)$ (29,474,196)$ (40,911,273)$ (41,795,661)$ (61,837,131)$ (94,302,365)$ (69,674,160)$ (155,303,717)$
HAP Funds Projected NeedLast update: 2/3/2012
- actual # or $ amount or compiled from actual data - projected # or $ amount
Cumulative Data on HAP Funding Sources & UsesHAP Funding SourcesAppropriations & Revenues Returned to HAP -Appropriations: ARRA FY 2010 Transfer of BRAC 2005 Funds FY 2012
-Revenues Returned to HAP from Homes SoldTotal Cumulative Funds Available
HAP Funding Uses Administration, Benefits & Other Expenses/Costs -Administration -Benefits: BRAC05 WII/SS PCS -Other Expenses/CostsTotal Cumulative Fund Obligations
Total Unobligated Funds before Commitments
Program Commitments -Potential Fund Usage due to Commitments
Total Unobligated Funds after Commitments
Monthly Data on HAP Funding Sources & UsesHAP Funding SourcesAppropriations & Revenues Returned to HAP -Appropriations: ARRA FY 2010 Transfer of BRAC 2005 Funds FY 2012
-Revenues Returned to HAP from Homes SoldTotal Monthly Funds Available
HAP Funding Uses Administration, Benefits & Other Expenses/Costs -Administration -Benefits: BRAC05 WII/SS PCS -Other Expenses/CostsTotal Monthly Fund Obligations
Monthly Tot Unobligated Funds BEFORE Commitments
Program Commitments for the Month -Potential Fund Usage due to Commitments
Monthly Tot Unobligated Funds AFTER Commitments
Sep-10 Oct-10 Nov-10 Dec-10 Jan-11 Feb-11 Mar-11 Apr-11 May-11 Jun-11 Jul-11
555,000,000$ 555,000,000$ 555,000,000$ 555,000,000$ 555,000,000$ 555,000,000$ 555,000,000$ 555,000,000$ 555,000,000$ 555,000,000$ 555,000,000$ 300,000,000 300,000,000 300,000,000 300,000,000 300,000,000 300,000,000 300,000,000 300,000,000 300,000,000 300,000,000 300,000,000
61,545,227 61,545,227 61,545,227 61,545,227 65,603,958 182,031,890 273,134,649 299,302,412 334,130,947 362,574,481 382,450,619 916,545,227$ 916,545,227$ 916,545,227$ 916,545,227$ 920,603,958$ 1,037,031,890$ 1,128,134,649$ 1,154,302,412$ 1,189,130,947$ 1,217,574,481$ 1,237,450,619$
20,509,718$ 21,689,334$ 22,858,436$ 24,006,081$ 25,119,492$ 25,916,717$ 27,871,253$ 28,977,663$ 30,096,372$ 31,246,364$ 32,272,768$ 4,643,000 5,579,000 5,995,000 6,411,000 7,411,000 7,896,035 7,550,000 8,493,800 9,780,800 13,914,167 9,493,133
15,570,550 16,430,550 18,365,550 20,300,550 21,452,550 22,845,683 29,890,000 32,607,000 33,667,000 34,710,184 35,463,583 544,636,015 596,680,291 645,954,078 694,313,708 734,426,876 822,294,068 905,087,096 963,436,071 985,897,374 1,039,247,552 1,024,087,815
50,299,530 585,359,283$ 640,379,175$ 693,173,064$ 745,031,339$ 788,409,918$ 878,952,503$ 970,398,349$ 1,033,514,534$ 1,059,441,546$ 1,119,118,267$ 1,151,616,829$
331,185,944$ 276,166,052$ 223,372,163$ 171,513,888$ 132,194,040$ 158,079,387$ 157,736,300$ 120,787,878$ 129,689,401$ 98,456,214$ 85,833,790$
-$ 97,574,701$ 99,388,060$ 87,384,272$ 89,260,744$ 64,273,981$ 46,935,006$ 46,164,458$ -$ 56,200,000$ 49,814,546$
331,185,944$ 178,591,351$ 123,984,103$ 84,129,616$ 42,933,296$ 93,805,406$ 110,801,294$ 74,623,420$ 129,689,401$ 42,256,214$ 36,019,244$
Sep-10 Oct-10 Nov-10 Dec-10 Jan-11 Feb-11 Mar-11 Apr-11 May-11 Jun-11 Jul-11
-$ -$ -$ -$ -$ -$ -$ -$ -$ -$ -$ - - - - - - - - - - - - - - - - - - - - - - - - - - - - - - - - - - - - - 4,058,731 116,427,932 91,102,759 26,167,763 34,828,535 28,443,534 19,876,138 -$ -$ -$ -$ 4,058,731$ 116,427,932$ 91,102,759$ 26,167,763$ 34,828,535$ 28,443,534$ 19,876,138$
1,374,927$ 1,179,616$ 1,169,102$ 1,147,645$ 1,113,411$ 797,225$ 1,954,536$ 1,106,410$ 1,118,709$ 1,149,992$ 1,026,404$ 520,000 936,000 416,000 416,000 1,000,000 485,035 (346,035) 943,800 1,287,000 4,133,367 (4,421,034)
3,870,000 860,000 1,935,000 1,935,000 1,152,000 1,393,133 7,044,317 2,717,000 1,060,000 1,043,184 753,399 76,761,724 52,044,276 49,273,787 48,359,630 40,113,168 87,867,192 82,793,028 58,348,975 22,461,303 53,350,178 (15,159,737)
- - - - - - - - - - 50,299,530 82,526,651$ 55,019,892$ 52,793,889$ 51,858,275$ 43,378,579$ 90,542,585$ 91,445,846$ 63,116,185$ 25,927,012$ 59,676,721$ 32,498,562$
(82,526,651)$ (55,019,892)$ (52,793,889)$ (51,858,275)$ (39,319,848)$ 25,885,347$ (343,087)$ (36,948,422)$ 8,901,523$ (31,233,187)$ (12,622,424)$
-$ 97,574,701$ 99,388,060$ 87,384,272$ 89,260,744$ 64,273,981$ 46,935,006$ 46,164,458$ -$ 56,200,000$ 49,814,546$
(82,526,651)$ (152,594,593)$ (152,181,949)$ (139,242,547)$ (128,580,592)$ (38,388,634)$ (47,278,093)$ (83,112,880)$ 8,901,523$ (87,433,187)$ (62,436,970)$
HAP Funds Projected NeedLast update: 2/3/2012
- actual # or $ amount or compiled from actual data - projected # or $ amount
Cumulative Data on HAP Funding Sources & UsesHAP Funding SourcesAppropriations & Revenues Returned to HAP -Appropriations: ARRA FY 2010 Transfer of BRAC 2005 Funds FY 2012
-Revenues Returned to HAP from Homes SoldTotal Cumulative Funds Available
HAP Funding Uses Administration, Benefits & Other Expenses/Costs -Administration -Benefits: BRAC05 WII/SS PCS -Other Expenses/CostsTotal Cumulative Fund Obligations
Total Unobligated Funds before Commitments
Program Commitments -Potential Fund Usage due to Commitments
Total Unobligated Funds after Commitments
Monthly Data on HAP Funding Sources & UsesHAP Funding SourcesAppropriations & Revenues Returned to HAP -Appropriations: ARRA FY 2010 Transfer of BRAC 2005 Funds FY 2012
-Revenues Returned to HAP from Homes SoldTotal Monthly Funds Available
HAP Funding Uses Administration, Benefits & Other Expenses/Costs -Administration -Benefits: BRAC05 WII/SS PCS -Other Expenses/CostsTotal Monthly Fund Obligations
Monthly Tot Unobligated Funds BEFORE Commitments
Program Commitments for the Month -Potential Fund Usage due to Commitments
Monthly Tot Unobligated Funds AFTER Commitments
Aug-11 Sep-11 Oct-11 Nov-11 Dec-11 Jan-12 Feb-12 Mar-12 Apr-12 May-12 Jun-12
555,000,000$ 555,000,000$ 555,000,000$ 555,000,000$ 555,000,000$ 555,000,000$ 555,000,000$ 555,000,000$ 555,000,000$ 555,000,000$ 555,000,000$ 300,000,000 300,000,000 300,000,000 300,000,000 300,000,000 300,000,000 300,000,000 300,000,000 300,000,000 300,000,000 300,000,000
507,000,000 507,000,000 507,000,000 507,000,000 507,000,000 507,000,000 507,000,000
382,450,619 428,270,809 428,270,808 479,398,032 479,398,032 499,051,150 506,546,253 524,230,958 555,554,867 586,878,776 618,202,684 1,237,450,619$ 1,283,270,809$ 1,283,270,808$ 1,334,398,032$ 1,841,398,032$ 1,861,051,150$ 1,868,546,253$ 1,886,230,958$ 1,917,554,867$ 1,948,878,776$ 1,980,202,684$
33,473,087$ 34,358,162$ 35,176,470$ 36,017,544$ 36,709,839$ 37,630,690$ 38,730,690$ 39,830,690$ 40,930,690$ 42,030,690$ 43,130,690$ 10,943,133 11,602,891 11,722,891 12,622,645 13,288,384 13,914,175 15,145,310 16,563,469 17,981,628 19,399,787 20,817,946 36,438,583 37,131,019 37,731,019 37,417,628 40,164,857 42,226,452 45,614,052 48,124,356 50,634,659 53,144,963 55,655,266
1,049,484,096 1,070,574,425 1,083,147,492 1,115,607,897 1,146,920,364 1,219,052,211 1,246,035,938 1,310,627,199 1,375,218,461 1,439,809,722 1,504,400,983 53,477,198 55,173,198 55,337,416 55,518,824 56,377,200 57,747,835 64,923,000 68,374,000 71,825,000 75,276,000 78,727,000
1,183,816,097$ 1,208,839,695$ 1,223,115,288$ 1,257,184,538$ 1,293,460,643$ 1,370,571,363$ 1,410,448,990$ 1,483,519,714$ 1,556,590,438$ 1,629,661,162$ 1,702,731,885$
53,634,522$ 74,431,114$ 60,155,520$ 77,213,494$ 547,937,389$ 490,479,787$ 458,097,263$ 402,711,244$ 360,964,429$ 319,217,614$ 277,470,799$
35,600,000$ 71,688,653$ 33,800,000$ 16,800,000$ 26,400,000$ 46,900,000$ 38,267,756$ 32,828,801$ 27,389,846$ 21,950,891$ 16,511,937$
18,034,522$ 2,742,461$ 26,355,520$ 60,413,494$ 521,537,389$ 443,579,787$ 419,829,507$ 369,882,443$ 333,574,583$ 297,266,723$ 260,958,862$
Aug-11 Sep-11 Oct-11 Nov-11 Dec-11 Jan-12 Feb-12 Mar-12 Apr-12 May-12 Jun-12
-$ -$ -$ -$ -$ -$ -$ -$ -$ -$ -$ - - - - - - - - - - - - - - - 507,000,000 - - - - - - - - - - - - - - - - - - 45,820,190 (1) 51,127,224 - 19,653,118 7,495,103 17,684,705 31,323,909 31,323,909 31,323,909 -$ 45,820,190$ (1)$ 51,127,224$ 507,000,000$ 19,653,118$ 7,495,103$ 17,684,705$ 31,323,909$ 31,323,909$ 31,323,909$
1,200,319$ 885,075$ 818,308$ 841,074$ 692,295$ 920,851$ 1,100,000$ 1,100,000$ 1,100,000$ 1,100,000$ 1,100,000$ 1,450,000 659,758 120,000 899,754 665,739 625,791 1,231,135 1,418,159 1,418,159 1,418,159 1,418,159
975,000 692,436 600,000 (313,391) 2,747,229 2,061,595 3,387,600 2,510,304 2,510,304 2,510,304 2,510,304 25,396,281 21,090,329 12,573,067 32,460,405 31,312,467 72,131,848 26,983,727 64,591,261 64,591,261 64,591,261 64,591,261 3,177,668 1,696,000 164,218 181,408 858,376 1,370,635 7,175,165 3,451,000 3,451,000 3,451,000 3,451,000
32,199,268$ 25,023,598$ 14,275,593$ 34,069,250$ 36,276,105$ 77,110,720$ 39,877,627$ 73,070,724$ 73,070,724$ 73,070,724$ 73,070,724$
(32,199,268)$ 20,796,592$ (14,275,594)$ 17,057,974$ 470,723,895$ (57,457,602)$ (32,382,524)$ (55,386,019)$ (41,746,815)$ (41,746,815)$ (41,746,815)$
35,600,000$ 71,688,653$ 33,800,000$ 16,800,000$ 26,400,000$ 46,900,000$ 38,267,756$ 32,828,801$ 27,389,846$ 21,950,891$ 16,511,937$
(67,799,268)$ (50,892,061)$ (48,075,594)$ 257,974$ 444,323,895$ (104,357,602)$ (70,650,280)$ (88,214,820)$ (69,136,661)$ (63,697,706)$ (58,258,752)$
HAP Funds Projected NeedLast update: 2/3/2012
- actual # or $ amount or compiled from actual data - projected # or $ amount
Cumulative Data on HAP Funding Sources & UsesHAP Funding SourcesAppropriations & Revenues Returned to HAP -Appropriations: ARRA FY 2010 Transfer of BRAC 2005 Funds FY 2012
-Revenues Returned to HAP from Homes SoldTotal Cumulative Funds Available
HAP Funding Uses Administration, Benefits & Other Expenses/Costs -Administration -Benefits: BRAC05 WII/SS PCS -Other Expenses/CostsTotal Cumulative Fund Obligations
Total Unobligated Funds before Commitments
Program Commitments -Potential Fund Usage due to Commitments
Total Unobligated Funds after Commitments
Monthly Data on HAP Funding Sources & UsesHAP Funding SourcesAppropriations & Revenues Returned to HAP -Appropriations: ARRA FY 2010 Transfer of BRAC 2005 Funds FY 2012
-Revenues Returned to HAP from Homes SoldTotal Monthly Funds Available
HAP Funding Uses Administration, Benefits & Other Expenses/Costs -Administration -Benefits: BRAC05 WII/SS PCS -Other Expenses/CostsTotal Monthly Fund Obligations
Monthly Tot Unobligated Funds BEFORE Commitments
Program Commitments for the Month -Potential Fund Usage due to Commitments
Monthly Tot Unobligated Funds AFTER Commitments
Jul-12 Aug-12 Sep-12 Oct-12 Nov-12 Dec-12
555,000,000$ 555,000,000$ 555,000,000$ 555,000,000$ 555,000,000$ 555,000,000$ 300,000,000 300,000,000 300,000,000 300,000,000 300,000,000 300,000,000 507,000,000 507,000,000 507,000,000 507,000,000 507,000,000 507,000,000
649,526,593 680,850,502 712,174,411 743,498,320 774,822,229 774,822,229 2,011,526,593$ 2,042,850,502$ 2,074,174,411$ 2,105,498,320$ 2,136,822,229$ 2,136,822,229$
44,230,690$ 45,330,690$ 46,430,690$ 47,530,690$ 48,630,690$ 49,730,690$ 22,236,105 23,654,263 25,072,422 25,072,422 25,072,422 25,072,422 58,165,570 60,675,874 63,186,177 63,186,177 63,186,177 63,186,177
1,568,992,245 1,633,583,506 1,698,174,767 1,698,174,767 1,698,174,767 1,698,174,767 82,178,000 85,629,000 89,080,000 89,080,000 89,080,000 89,080,000
1,775,802,609$ 1,848,873,333$ 1,921,944,057$ 1,923,044,057$ 1,924,144,057$ 1,925,244,057$
235,723,984$ 193,977,169$ 152,230,354$ 182,454,263$ 212,678,172$ 211,578,172$
11,072,982$ 5,634,027$ 195,072$ 195,072$ 195,072$ 195,072$
224,651,002$ 188,343,142$ 152,035,282$ 182,259,191$ 212,483,100$ 211,383,100$
Jul-12 Aug-12 Sep-12 Oct-12 Nov-12 Dec-12
-$ -$ -$ -$ -$ -$ - - - - - - - - - - - - - - - - - -
31,323,909 31,323,909 31,323,909 31,323,909 31,323,909 - 31,323,909$ 31,323,909$ 31,323,909$ 31,323,909$ 31,323,909$ -$
1,100,000$ 1,100,000$ 1,100,000$ 1,100,000$ 1,100,000$ 1,100,000$ 1,418,159 1,418,159 1,418,159 - - - 2,510,304 2,510,304 2,510,304 - - -
64,591,261 64,591,261 64,591,261 - - - 3,451,000 3,451,000 3,451,000 - - -
73,070,724$ 73,070,724$ 73,070,724$ 1,100,000$ 1,100,000$ 1,100,000$
(41,746,815)$ (41,746,815)$ (41,746,815)$ 30,223,909$ 30,223,909$ (1,100,000)$
11,072,982$ 5,634,027$ 195,072$ 195,072$ 195,072$ 195,072$
(52,819,797)$ (47,380,842)$ (41,941,887)$ 30,028,836$ 30,028,836$ (1,295,072)$

C-1
Appendix C LMI Projection of HAP Funds
This appendix contains the outputs from LMI’s modeling of HAP funds.

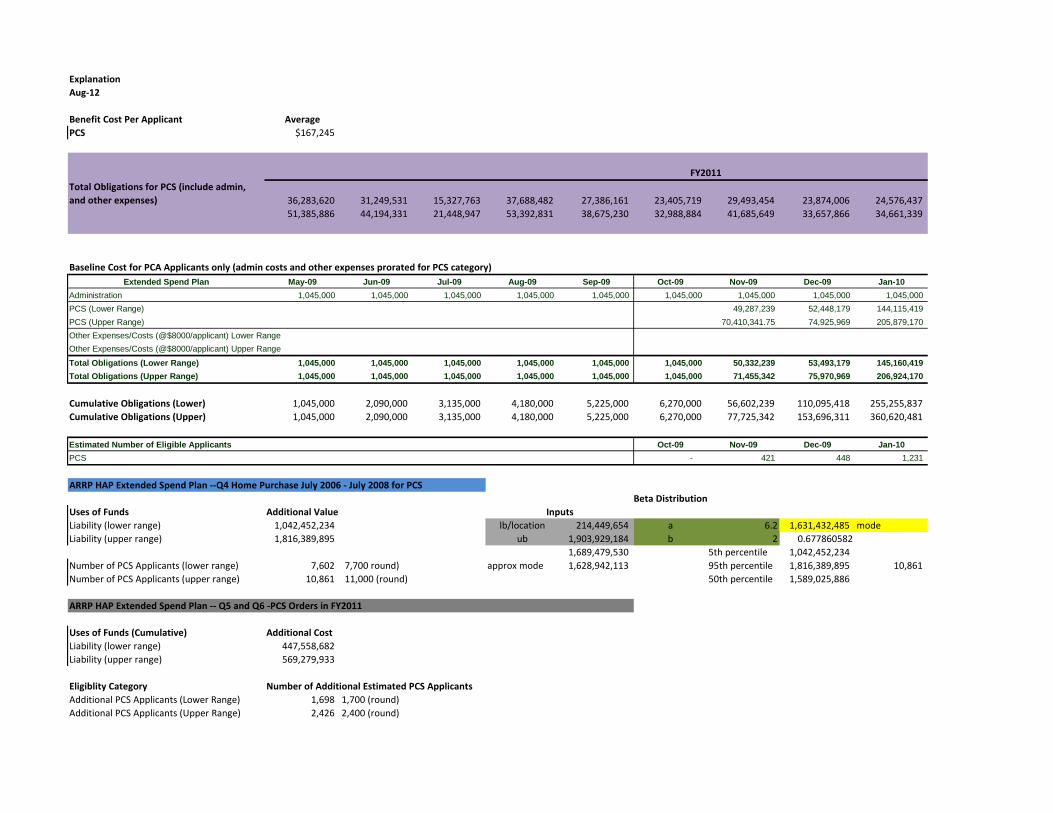
Explanation Aug‐12
Benefit Cost Per Applicant AveragePCS $167,245
Total Obligations for PCS (include admin, and other expenses) 36,283,620 31,249,531 15,327,763 37,688,482 27,386,161 23,405,719 29,493,454 23,874,006 24,576,437
51,385,886 44,194,331 21,448,947 53,392,831 38,675,230 32,988,884 41,685,649 33,657,866 34,661,339
Baseline Cost for PCA Applicants only (admin costs and other expenses prorated for PCS category)Extended Spend Plan May-09 Jun-09 Jul-09 Aug-09 Sep-09 Oct-09 Nov-09 Dec-09 Jan-10
Administration 1,045,000 1,045,000 1,045,000 1,045,000 1,045,000 1,045,000 1,045,000 1,045,000 1,045,000 PCS (Lower Range) 49,287,239 52,448,179 144,115,419 PCS (Upper Range) 70,410,341.75 74,925,969 205,879,170 Other Expenses/Costs (@$8000/applicant) Lower RangeOther Expenses/Costs (@$8000/applicant) Upper Range
Total Obligations (Lower Range) 1,045,000 1,045,000 1,045,000 1,045,000 1,045,000 1,045,000 50,332,239 53,493,179 145,160,419 Total Obligations (Upper Range) 1,045,000 1,045,000 1,045,000 1,045,000 1,045,000 1,045,000 71,455,342 75,970,969 206,924,170
Cumulative Obligations (Lower) 1,045,000 2,090,000 3,135,000 4,180,000 5,225,000 6,270,000 56,602,239 110,095,418 255,255,837 Cumulative Obligations (Upper) 1,045,000 2,090,000 3,135,000 4,180,000 5,225,000 6,270,000 77,725,342 153,696,311 360,620,481
Estimated Number of Eligible Applicants Oct-09 Nov-09 Dec-09 Jan-10PCS - 421 448 1,231
ARRP HAP Extended Spend Plan ‐‐Q4 Home Purchase July 2006 ‐ July 2008 for PCS
Uses of Funds Additional ValueLiability (lower range) 1,042,452,234 lb/location 214,449,654 a 6.2 1,631,432,485 modeLiability (upper range) 1,816,389,895 ub 1,903,929,184 b 2 0.677860582
1,689,479,530 5th percentile 1,042,452,234 Number of PCS Applicants (lower range) 7,602 7,700 round) approx mode 1,628,942,113 95th percentile 1,816,389,895 10,861 Number of PCS Applicants (upper range) 10,861 11,000 (round) 50th percentile 1,589,025,886
ARRP HAP Extended Spend Plan ‐‐ Q5 and Q6 ‐PCS Orders in FY2011
Uses of Funds (Cumulative) Additional CostLiability (lower range) 447,558,682 Liability (upper range) 569,279,933
Eligiblity Category Number of Additional Estimated PCS ApplicantsAdditional PCS Applicants (Lower Range) 1,698 1,700 (round)Additional PCS Applicants (Upper Range) 2,426 2,400 (round)
FY2011
Beta DistributionInputs
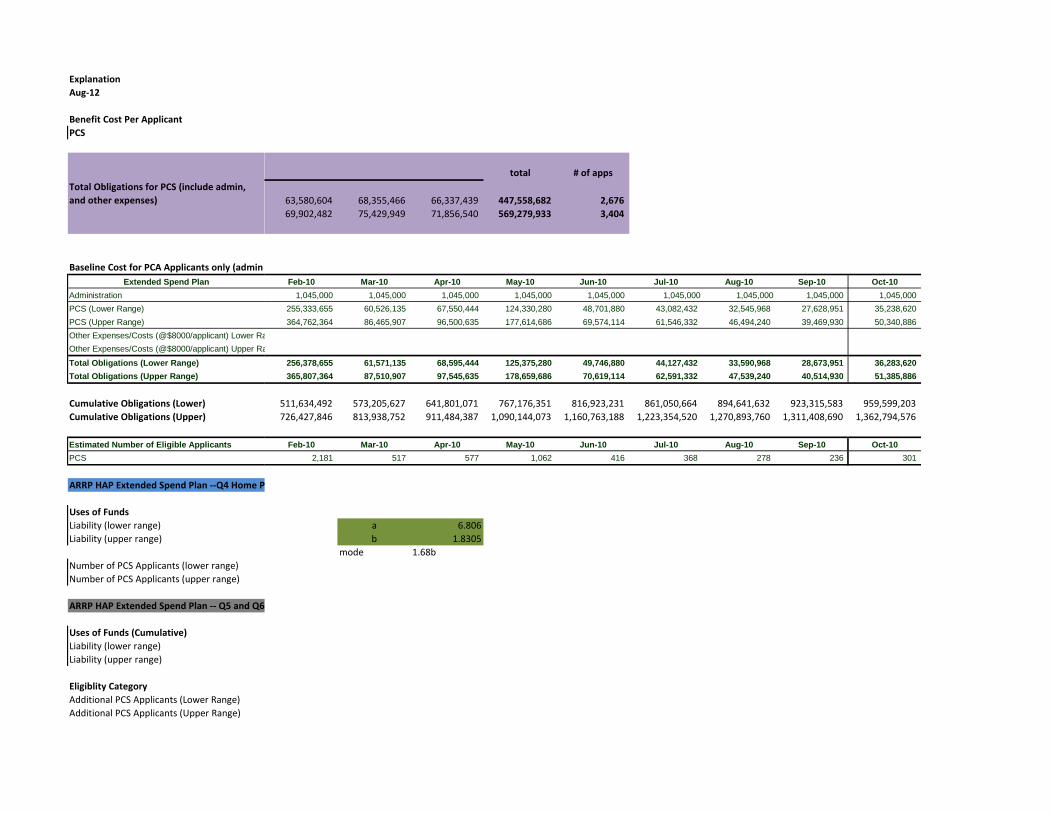
Explanation Aug‐12
Benefit Cost Per ApplicantPCS
Total Obligations for PCS (include admin, and other expenses)
Baseline Cost for PCA Applicants only (admin Extended Spend Plan
AdministrationPCS (Lower Range)PCS (Upper Range)Other Expenses/Costs (@$8000/applicant) Lower RaOther Expenses/Costs (@$8000/applicant) Upper Ra
Total Obligations (Lower Range)Total Obligations (Upper Range)
Cumulative Obligations (Lower)Cumulative Obligations (Upper)
Estimated Number of Eligible ApplicantsPCS
ARRP HAP Extended Spend Plan ‐‐Q4 Home P
Uses of FundsLiability (lower range)Liability (upper range)
Number of PCS Applicants (lower range)Number of PCS Applicants (upper range)
ARRP HAP Extended Spend Plan ‐‐ Q5 and Q6
Uses of Funds (Cumulative)Liability (lower range)Liability (upper range)
Eligiblity CategoryAdditional PCS Applicants (Lower Range)Additional PCS Applicants (Upper Range)
total # of apps
63,580,604 68,355,466 66,337,439 447,558,682 2,676 69,902,482 75,429,949 71,856,540 569,279,933 3,404
Feb-10 Mar-10 Apr-10 May-10 Jun-10 Jul-10 Aug-10 Sep-10 Oct-101,045,000 1,045,000 1,045,000 1,045,000 1,045,000 1,045,000 1,045,000 1,045,000 1,045,000
255,333,655 60,526,135 67,550,444 124,330,280 48,701,880 43,082,432 32,545,968 27,628,951 35,238,620 364,762,364 86,465,907 96,500,635 177,614,686 69,574,114 61,546,332 46,494,240 39,469,930 50,340,886
256,378,655 61,571,135 68,595,444 125,375,280 49,746,880 44,127,432 33,590,968 28,673,951 36,283,620 365,807,364 87,510,907 97,545,635 178,659,686 70,619,114 62,591,332 47,539,240 40,514,930 51,385,886
511,634,492 573,205,627 641,801,071 767,176,351 816,923,231 861,050,664 894,641,632 923,315,583 959,599,203 726,427,846 813,938,752 911,484,387 1,090,144,073 1,160,763,188 1,223,354,520 1,270,893,760 1,311,408,690 1,362,794,576
Feb-10 Mar-10 Apr-10 May-10 Jun-10 Jul-10 Aug-10 Sep-10 Oct-102,181 517 577 1,062 416 368 278 236 301
a 6.806b 1.8305
mode 1.68b
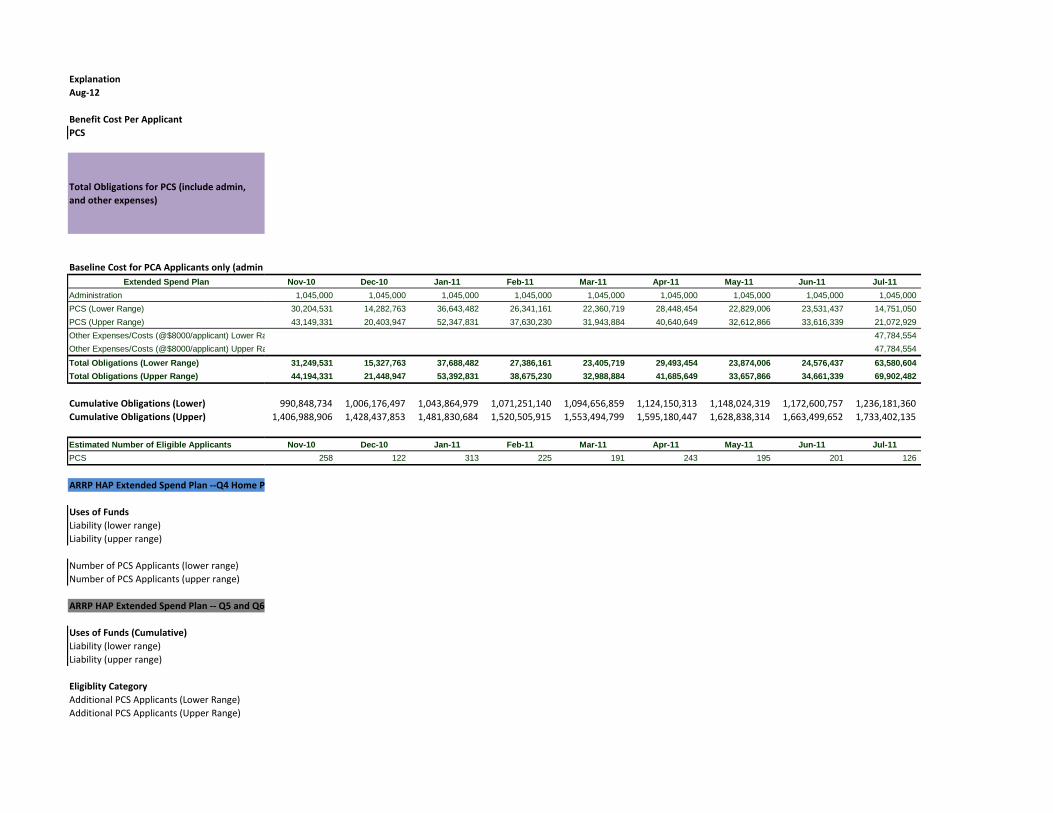
Explanation Aug‐12
Benefit Cost Per ApplicantPCS
Total Obligations for PCS (include admin, and other expenses)
Baseline Cost for PCA Applicants only (admin Extended Spend Plan
AdministrationPCS (Lower Range)PCS (Upper Range)Other Expenses/Costs (@$8000/applicant) Lower RaOther Expenses/Costs (@$8000/applicant) Upper Ra
Total Obligations (Lower Range)Total Obligations (Upper Range)
Cumulative Obligations (Lower)Cumulative Obligations (Upper)
Estimated Number of Eligible ApplicantsPCS
ARRP HAP Extended Spend Plan ‐‐Q4 Home P
Uses of FundsLiability (lower range)Liability (upper range)
Number of PCS Applicants (lower range)Number of PCS Applicants (upper range)
ARRP HAP Extended Spend Plan ‐‐ Q5 and Q6
Uses of Funds (Cumulative)Liability (lower range)Liability (upper range)
Eligiblity CategoryAdditional PCS Applicants (Lower Range)Additional PCS Applicants (Upper Range)
Nov-10 Dec-10 Jan-11 Feb-11 Mar-11 Apr-11 May-11 Jun-11 Jul-111,045,000 1,045,000 1,045,000 1,045,000 1,045,000 1,045,000 1,045,000 1,045,000 1,045,000
30,204,531 14,282,763 36,643,482 26,341,161 22,360,719 28,448,454 22,829,006 23,531,437 14,751,050 43,149,331 20,403,947 52,347,831 37,630,230 31,943,884 40,640,649 32,612,866 33,616,339 21,072,929
47,784,554 47,784,554
31,249,531 15,327,763 37,688,482 27,386,161 23,405,719 29,493,454 23,874,006 24,576,437 63,580,604 44,194,331 21,448,947 53,392,831 38,675,230 32,988,884 41,685,649 33,657,866 34,661,339 69,902,482
990,848,734 1,006,176,497 1,043,864,979 1,071,251,140 1,094,656,859 1,124,150,313 1,148,024,319 1,172,600,757 1,236,181,3601,406,988,906 1,428,437,853 1,481,830,684 1,520,505,915 1,553,494,799 1,595,180,447 1,628,838,314 1,663,499,652 1,733,402,135
Nov-10 Dec-10 Jan-11 Feb-11 Mar-11 Apr-11 May-11 Jun-11 Jul-11258 122 313 225 191 243 195 201 126
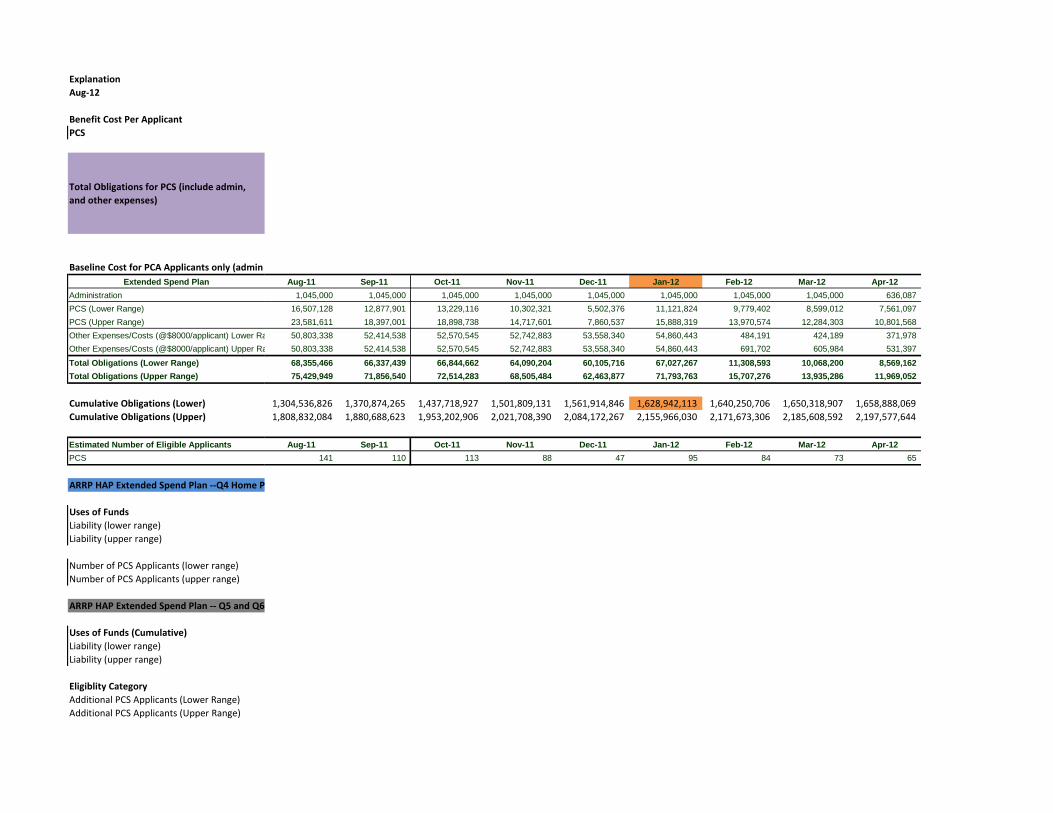
Explanation Aug‐12
Benefit Cost Per ApplicantPCS
Total Obligations for PCS (include admin, and other expenses)
Baseline Cost for PCA Applicants only (admin Extended Spend Plan
AdministrationPCS (Lower Range)PCS (Upper Range)Other Expenses/Costs (@$8000/applicant) Lower RaOther Expenses/Costs (@$8000/applicant) Upper Ra
Total Obligations (Lower Range)Total Obligations (Upper Range)
Cumulative Obligations (Lower)Cumulative Obligations (Upper)
Estimated Number of Eligible ApplicantsPCS
ARRP HAP Extended Spend Plan ‐‐Q4 Home P
Uses of FundsLiability (lower range)Liability (upper range)
Number of PCS Applicants (lower range)Number of PCS Applicants (upper range)
ARRP HAP Extended Spend Plan ‐‐ Q5 and Q6
Uses of Funds (Cumulative)Liability (lower range)Liability (upper range)
Eligiblity CategoryAdditional PCS Applicants (Lower Range)Additional PCS Applicants (Upper Range)
Aug-11 Sep-11 Oct-11 Nov-11 Dec-11 Jan-12 Feb-12 Mar-12 Apr-121,045,000 1,045,000 1,045,000 1,045,000 1,045,000 1,045,000 1,045,000 1,045,000 636,087
16,507,128 12,877,901 13,229,116 10,302,321 5,502,376 11,121,824 9,779,402 8,599,012 7,561,097 23,581,611 18,397,001 18,898,738 14,717,601 7,860,537 15,888,319 13,970,574 12,284,303 10,801,568 50,803,338 52,414,538 52,570,545 52,742,883 53,558,340 54,860,443 484,191 424,189 371,978 50,803,338 52,414,538 52,570,545 52,742,883 53,558,340 54,860,443 691,702 605,984 531,397
68,355,466 66,337,439 66,844,662 64,090,204 60,105,716 67,027,267 11,308,593 10,068,200 8,569,162 75,429,949 71,856,540 72,514,283 68,505,484 62,463,877 71,793,763 15,707,276 13,935,286 11,969,052
1,304,536,826 1,370,874,265 1,437,718,927 1,501,809,131 1,561,914,846 1,628,942,113 1,640,250,706 1,650,318,907 1,658,888,0691,808,832,084 1,880,688,623 1,953,202,906 2,021,708,390 2,084,172,267 2,155,966,030 2,171,673,306 2,185,608,592 2,197,577,644
Aug-11 Sep-11 Oct-11 Nov-11 Dec-11 Jan-12 Feb-12 Mar-12 Apr-12141 110 113 88 47 95 84 73 65
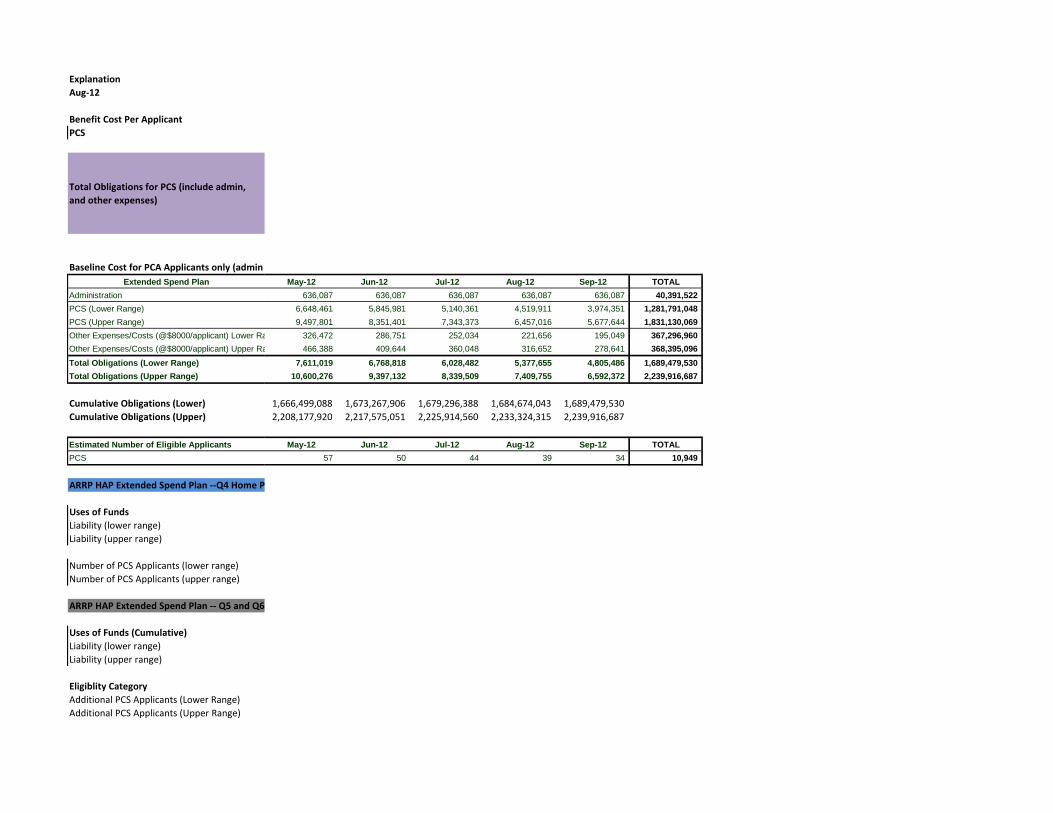
Explanation Aug‐12
Benefit Cost Per ApplicantPCS
Total Obligations for PCS (include admin, and other expenses)
Baseline Cost for PCA Applicants only (admin Extended Spend Plan
AdministrationPCS (Lower Range)PCS (Upper Range)Other Expenses/Costs (@$8000/applicant) Lower RaOther Expenses/Costs (@$8000/applicant) Upper Ra
Total Obligations (Lower Range)Total Obligations (Upper Range)
Cumulative Obligations (Lower)Cumulative Obligations (Upper)
Estimated Number of Eligible ApplicantsPCS
ARRP HAP Extended Spend Plan ‐‐Q4 Home P
Uses of FundsLiability (lower range)Liability (upper range)
Number of PCS Applicants (lower range)Number of PCS Applicants (upper range)
ARRP HAP Extended Spend Plan ‐‐ Q5 and Q6
Uses of Funds (Cumulative)Liability (lower range)Liability (upper range)
Eligiblity CategoryAdditional PCS Applicants (Lower Range)Additional PCS Applicants (Upper Range)
May-12 Jun-12 Jul-12 Aug-12 Sep-12 TOTAL636,087 636,087 636,087 636,087 636,087 40,391,522
6,648,461 5,845,981 5,140,361 4,519,911 3,974,351 1,281,791,048 9,497,801 8,351,401 7,343,373 6,457,016 5,677,644 1,831,130,069
326,472 286,751 252,034 221,656 195,049 367,296,960 466,388 409,644 360,048 316,652 278,641 368,395,096
7,611,019 6,768,818 6,028,482 5,377,655 4,805,486 1,689,479,530 10,600,276 9,397,132 8,339,509 7,409,755 6,592,372 2,239,916,687
1,666,499,088 1,673,267,906 1,679,296,388 1,684,674,043 1,689,479,5302,208,177,920 2,217,575,051 2,225,914,560 2,233,324,315 2,239,916,687
May-12 Jun-12 Jul-12 Aug-12 Sep-12 TOTAL57 50 44 39 34 10,949

D-1
Appendix D Abbreviations
ARRA American Recovery and Reinvestment Act of 2009
BRAC Base Realignment and Closure
CEFMS Corps of Engineers Financial Management System
DASA (IH&P) Deputy Assistant Secretary of the Army for Installations,
Housing and Partnerships
DoD Department of Defense
HAP Homeowners Assistance Program
HAPMIS HAP Management Information System
NDAA National Defense Authorization Act
PCS permanent change of station
PFMV prior fair market value
USACE US Army Corps of Engineers
WII/SS wounded, injured, or ill or surviving spouse

DRAFT—[Click here and type report #)] —9/18/12D-2 CE212T2_Appendix D_Abbreviations.docx