assessment of the impact of effluent from a soft …
TRANSCRIPT

Bajopas Volume 4 Number 1 June, 2011
Bayero Journal of Pure and Applied Sciences, 4(1): 126 - 134 Received: October, 2010 Accepted: March, 2011 ISSN 2006 - 6996
ASSESSMENT OF THE IMPACT OF EFFLUENT FROM A SOFT DRINK PROCESSING FACTORY ON THE PHYSICO-CHEMICAL PARAMETERS OF
ERUVBI STREAM BENIN CITY, NIGERIA
T. O. T. Imoobe* and P. I.O. koye Department of Animal and Environmental Biology, University of Benin, Benin City, P.M.B. 1154, Nigeria.
Correspondence author: [email protected]
ABSTRACT An investigation of the impact of industrial effluent discharged into Eruvbi stream was carried out in the wet season months of March to August, 2009. Water samples from three selected points in the stream were analysed for temperature, total dissolved solids, turbidity, pH, electrical conductivity, dissolved oxygen, biochemical oxygen demand (BOD5), total alkalinity, chloride, hardness, calcium, magnesium and nitrate. Samples were collected at three sites, designated as station 1 (upstream of effluent discharge point), station 2 (effluent discharge point) and station 3 (downstream of effluent discharge point). Water temperature, turbidity, alkalinity, hardness, calcium and magnesium were found to be significantly higher at the discharge point (Station 2). The parameters when compared with Federal Environmental Protection Agency (FEPA) limit for discharge into Nigeria surface waters and WHO guidelines, turbidity in stations 2 and 3 were found to exceed the maximum allowable limit (5NTU) while dissolved oxygen level at all stations were lower than the minimum allowable limit (5mg/L) for aquatic life. All other physiochemical parameters including biochemical oxygen demand were below the recommended limits in all stations. This physico-chemical regime is an indication of the deteriorating water quality of the stream at the discharge point and downstream due to the effluent inflow.
Keywords: Benin City, Industrial effluent, Physicochemical, Stream, Water quality
INTRODUCTION
Industrialization, like other human activities that impact on the environment, often results in pollution
and degradation. It carries inevitable costs and problems in terms of pollution of the air, water
resources and general degradation of the natural environment (Suflita et al., 1983; Thomas et al., 1992).
Water on earth can be said to be enormous
in quantity, when it is considered that more than two-thirds of the earth surface is covered by water, yet,
fresh potable water free from harmful physical, biological and chemical contamination is not always
available at the right time or the right place for human or ecosystem use. Water Pollution comes mainly from
human activities such as increased domestic, municipal, agricultural and industrial activities.
Worldwide, water bodies are the primary means for
disposal of waste, especially the effluents, from industries that are near them. These effluents from
industries have a great deal of influence on the pollution of the water body and can alter the physical,
chemical and biological nature of the receiving water body (Sangodoyin, 1991). The initial effect of waste is
to degrade the physical quality of the water. Later biological degradation becomes evident in terms of
number, variety and organization of the living organisms in the water (Gray, 1989). Often the water
bodies readily assimilate waste materials they receive without significant deterioration of some quality
criteria; the extent of this is referred to as its assimilative capacity (Fair et al., 1968). The input of waste into water bodies therefore does not always
impact negatively on aquatic environment because of
the self purification property of lotic systems (Ifabiyi, 2008).
However, the availability of quality water needed for maintenance of normal biological function
is on the decline (Odigie and Fajemirokun, 2005). Surface water and ground water degradation are
major problems arising from pollution due to introduction of industrial effluent. Industrial effluent is
unwanted water generated from industrial activities and are inappropriately discharged into the
environment or receiving stream. Its characteristics provide basic information about the integrity of the
rivers and streams into which they are discharged (Kanu et al., 2006). The discharge of industrial effluents has led inevitably, to alteration in the quality and ecology of receiving water bodies (Ogbeibu and
Edutie, 2002).
Benin City is becoming fairly industrialized, although some of these industries are situated some
distance away from rivers; their effluents are channeled into such rivers as Ikpoba River (Ogbeibu
and Edutie, 2002). One of these industries is a soft drink industry and the wastewater from its operation
is conveyed over a distance by an underground tunnel and discharged into Eruvbi Stream which is a tributary
of Ikpoba River. These effluents which are rich in organic and inorganic substances are capable of
producing adverse effects on the physical, chemical and biotic components of the environment and either
directly or indirectly on human health (Mason, 1981; Ogbeibu and Ezeunara, 2002).
126
doi:10.4314/bajopas.v4i1.28
Bajopas Volume 4 Number 1 June, 2011
Although limnological study have been carried out
earlier (Olomukoro, 1983) on Eruvbi Stream to investigate the physico-chemical parameters and
macrobenthic fauna, there has not been any study to assess the impact of effluent from the Soft Drink
industry regularly discharged into the water; consequently there has been a dearth of information
on the degradation of the water body. The need for constant monitoring is imperative to be able to
investigate changes on temporal basis. The main objectives of this study are to evaluate the impact of
effluent from the Soft Drink industry on the quality of the receiving stream and to ascertain their conformity
with national standards set by the Nigerian Federal Environmental Protection Agency (FEPA) and WHO
guidelines for drinking water.
MATERIALS AND METHODS Study area
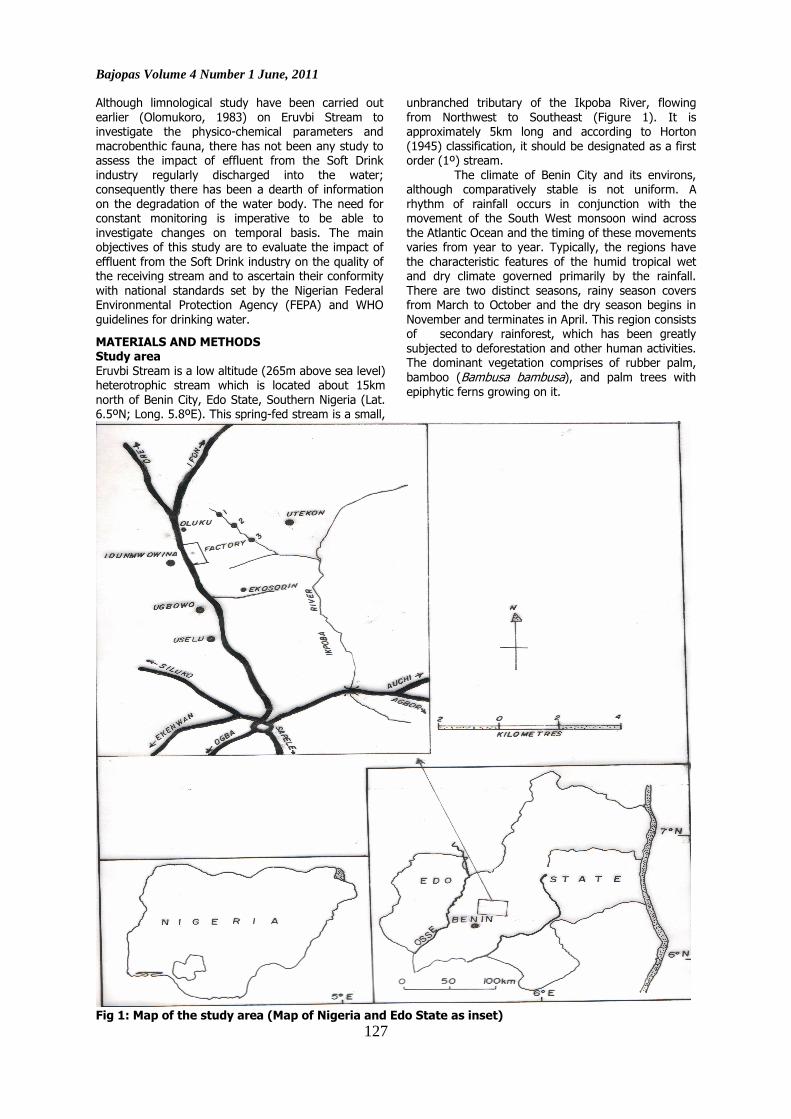
Eruvbi Stream is a low altitude (265m above sea level) heterotrophic stream which is located about 15km
north of Benin City, Edo State, Southern Nigeria (Lat. 6.5ºN; Long. 5.8ºE). This spring-fed stream is a small,
unbranched tributary of the Ikpoba River, flowing
from Northwest to Southeast (Figure 1). It is approximately 5km long and according to Horton
(1945) classification, it should be designated as a first order (1º) stream.
The climate of Benin City and its environs, although comparatively stable is not uniform. A
rhythm of rainfall occurs in conjunction with the movement of the South West monsoon wind across
the Atlantic Ocean and the timing of these movements varies from year to year. Typically, the regions have
the characteristic features of the humid tropical wet and dry climate governed primarily by the rainfall.
There are two distinct seasons, rainy season covers from March to October and the dry season begins in
November and terminates in April. This region consists of secondary rainforest, which has been greatly
subjected to deforestation and other human activities. The dominant vegetation comprises of rubber palm,
bamboo (Bambusa bambusa), and palm trees with epiphytic ferns growing on it.
Fig 1: Map of the study area (Map of Nigeria and Edo State as inset)
127
Bajopas Volume 4 Number 1 June, 2011
Sampling Stations In the present study three sampling stations were selected. Station 1 is the upstream station with a width exceeding 5m, at this point the stream was fast flowing. The substratum was muddy and relatively less disturbed than the other two stations. Dominant macrophytes are Nymphae lotus and Cyclosorus sp. There was no effluent input in this station and human activities such as swimming and laundering were noticed during the study, and the colour of the water is clear.
Station 2, the discharge point was located 1km downstream of station 1. It consists of pool and riffle areas. It was the contact point of the Soft Drink effluent with the stream water before it flows down to station 3 then into the Ikpoba River. The substratum is coarsely sandy with pebbles. The south bank is muddy and the stream width is less than 1m at this site. Surface runoff was heavy at this station during rains and current velocity was relatively fast. Sagittaria sp and Cyclosorus sp were dominant macrophytes, especially at the upstream section of the main channel. The colour of the water changes from clear water to muddy water due to the mixing of the effluent with the water.
Station 3 was located about 500m downstream of station 2. It consists of a shallow riffle, less than 2m wide, and then flows downstream to Ikpoba River. Substratum is coarse sand, except for few patches of clay. This site gets heavily silted during the rains and the current velocity was very high. Dominant macrophytes were Nymphae lotus and Sagittaria sp.
Water Sample Collection and Physicochemical Analysis Monthly sampling of Eruvbi Stream was carried out in the wet season months from March to August, 2009. Samples were collected between the hours of 0900 and 1200hours on each sampling day. Each time, sampling began in station 1 and terminated in station 3. Acceptable standard methods and instrumentations were followed during sample collection procedures (APHA, 1998). At each station, the surface water temperature was taken in-situ. Surface water samples for physico-chemical analyses were collected into thoroughly cleaned 1liter polyethylene bottles and tightly closed. Each bottle was rinsed with the appropriate sample before the final sample collection. The samples were placed in a cooler box and then taken to the laboratory for analyses. For dissolved oxygen (DO) determinations, separate samples were collected in 300 ml plain glass bottles and the samples fixed using the azide modification of Winkler’s method (APHA, 1998). Samples for biochemical oxygen demand (BOD) were collected into dark glass bottles for incubation and subsequent DO determination. In the laboratory, total dissolved solids, turbidity, pH, electrical conductivity, dissolved oxygen, biochemical oxygen demand (BOD5), total alkalinity, chloride, hardness, calcium, magnesium and nitrate.were determined according to procedures outlined in the Standard Methods for the Examination of Water and Wastewater (APHA, 1998). Total dissolved solid was determined using a TDS meter (Model 4076), Electrical Conductivity was measured using Cybersan 510 conductivity meter, pH was measured using a HACH digital meter while turbidity was determined using a DR/2000 HACH spectrophotometer. Titrimetric method was used in the determination of Calcium, Magnesium, Chloride and Alkalinity. Nitrate was determined
spectrophotometrically at 470nm. Data was analysed using Statistical Package for Social Sciences (SPSS 16.0) to test for significant differences within the physico-chemical parameters using One-way analysis of variance (ANOVA). Where significant values (p < 0.05) were obtained, ‘A posteriori’ Duncan Multiple Range Test was subsequently applied to all pairs of means to detect the location of difference. Pearson’s rank correlation was also used to establish relations between parameters in the study stream (Zar, 1984).
RESULTS A summary of the results of physico-chemical analyses are presented in Table 1. These values were placed alongside Federal Environmental Protection Agency (FEPA) limit for discharge into Nigeria surface waters and WHO guideline values (FEPA, 1991; WHO, 2006). The monthly variations across the stations are also shown in Table 2. Surface water temperature fluctuated between 20 and 31oC during the entire period of study. Temperature values in Station 2 were significantly higher (P< 0.01) than values in both stations 1 and 3. There was, however, no temporal variation in the mean water temperature of the study area. Although station 2 had the highest mean TDS throughout the study period, statistical analysis using ANOVA indicated that it was not significantly different (P> 0.05) from the upstream and downstream stations 1 and 3 respectively. There was, also no significant (P> 0.05) temporal variations in the mean TDS of the study area. Turbidity measured in NTU was significantly higher (P < 0.01) in station 2 than stations 1 and 3 which were not different (P > 0.05) from each other. Mean values recorded in stations 2 and 3 were beyond WHO standard (5NTU). Analysis of variance result also showed that there were no significant (P > 0.05) monthly variations observed among the various sampling stations. The pH ranged from acidic to slightly alkaline in station 2 while in station 1 it was within weak acidic range. Stations 2 and 3 were significantly higher (P < 0.01) in pH than station 1 which was acidic. The conductivity of water was highest in station 2 and lowest in station 3. There was however, no significant spatial and temporal variation (P > 0.05). The mean DO was generally low. There was no significant difference (P > 0.05) in the DO level among the stations. The BOD was lowest in station 1 and highest in station 3. There was also no significant difference (P > 0.05) in the mean BOD values. The mean alkalinity was lowest in station 1 and highest in station 2 which was significantly higher (P < 0.05) than values recorded in stations 1 and 3. Chloride concentrations were expectedly low as the study area was a freshwater body. Spatially, there was no significant difference (P>0.05) in chloride content. The mean hardness value was lowest in station 1 and highest in station 2. Station 2 had significantly higher (P < 0.001) values than stations 1 and 3. Calcium mean values were low in both stations 1 and 3 and significantly higher (P < 0.05) in station 2. The mean values of magnesium at station 2 was significantly higher (P < 0.001) than in stations 1 and 3. The mean Nitrate values at the different stations were not significantly different (P > 0.05).
128

Bajopas Volume 4 Number 1 June, 2011
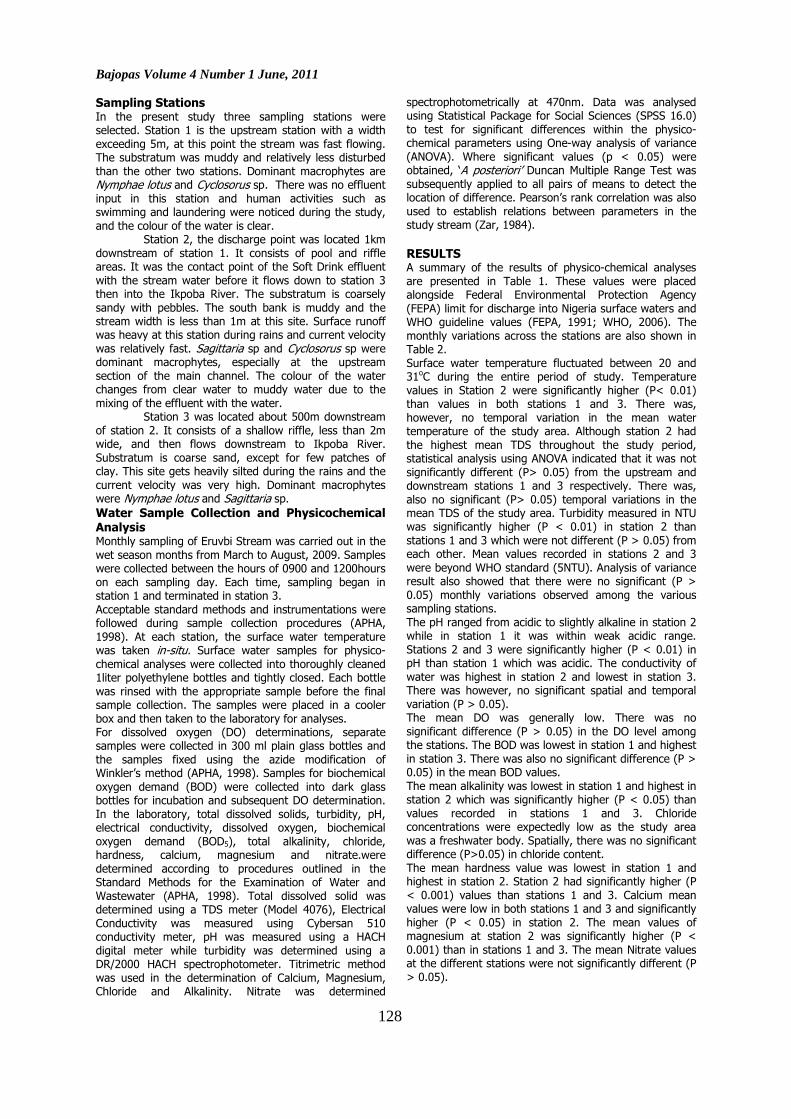
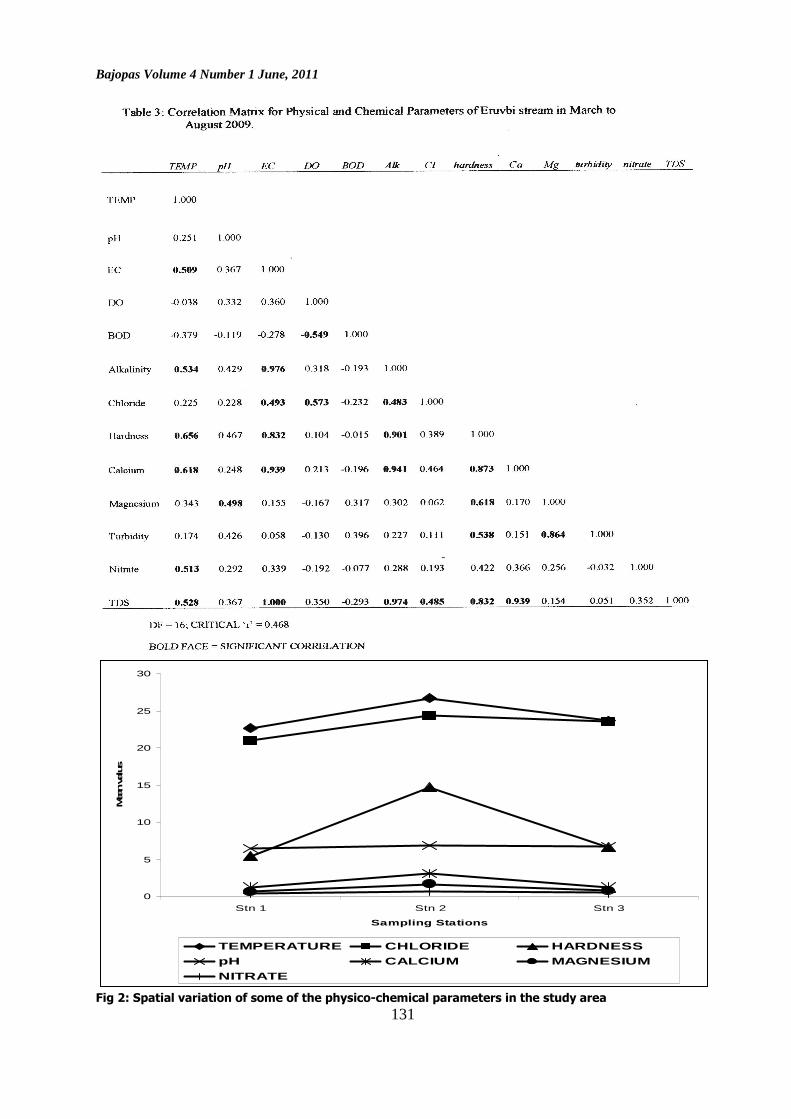
The spatial variations in all the physicochemical parameters investigated shown in Figures 1 and 2 indicate that all parameters except Dissolved Oxygen and Biochemical Oxygen demand (BOD5) were clearly higher in values at station 2, the point of effluent discharge into the stream. The relationship between the physico-chemical parameters was examined using the Pearson’s correlation analysis and the results are shown in the form of correlation matrix (Table 3). Any correlation value ‘r’ greater than the critical r (0.468) is significantly correlated, while r values lower than the given critical value are considered not significantly correlated. Temperature exhibited a significant correlation with only EC, alkalinity, hardness, calcium, nitrate and TDS (r =
0.509, 0.534, 0.656, 0.618, 0.513 and 0.528 respectively). The pH correlated significantly only with Magnesium (r = 0.498). EC indicated a significant correlation with alkalinity (r = 0.976), chloride (r = 0.493), hardness (r = 0.832), calcium (r = 0.939), and TDS (r = 1.000). DO was directly correlated with chloride (0.573) and inversely correlated with BOD5 (-0.549). Alkalinity revealed a significant correlation with chloride, hardness, calcium and TDS (r = 0.483, 0.901, 0.941 and 0.974 respectively). Chloride related directly with TDS (r = 0.485). Hardness demonstrated a direct significant correlation with calcium (0.873), magnesium (0.618), turbidity (0.538) and TDS (0.832). Calcium and magnesium correlated significantly with TDS (r = 0.939) and turbidity (r = 0.864) respectively.
129

Bajopas Volume 4 Number 1 June, 2011
130
Bajopas Volume 4 Number 1 June, 2011
0
5
10
15
20
25
30
Stn 1 Stn 2 Stn 3
Sampling Stations
Mea
n valus
TEMPERATURE CHLORIDE HARDNESS
pH CALCIUM MAGNESIUM
NITRATE
Fig 2: Spatial variation of some of the physico-chemical parameters in the study area 131

Bajopas Volume 4 Number 1 June, 2011
0
20
40
60
80
100
120
140
160
180
Stn 1 Stn 2 Stn 3
Sampling Stations
Mea
n va
lues
CONDUCTIVITY (US/CM) TOTALALKALINITY
TURBIDITY (NTU) TOTAL DISOLVED SOLID
DISOLVED OXYGEN B.O.D
Fig 3: Spatial variation of some of the physico-chemical parameters in the study area.
DISCUSSION The results of the water quality measurement indicated that some parameters exhibited significant spatial variation. Water temperature, turbidity, alkalinity, hardness, calcium and magnesium were significantly higher at the discharge point (station 2) than the upstream and downstream stations 1and 3. The parameters when compared with Federal Environmental Protection Agency (FEPA) limit for discharge into Nigeria surface waters and WHO guideline values, turbidity in stations 2 and 3 were found to exceed the minimum allowable limit (5NTU) while dissolved oxygen level at all stations were below minimum allowable limit (5mg/L) for aquatic life (WHO, 2006). All other physiochemical parameters including biological oxygen demand were below the recommended limits in all stations. This physico-chemical regime is an indication of the deteriorating water quality of the stream at the discharge point due to the effluent inflow. Water temperature is influenced by substrate composition, turbidity, vegetation cover, run-off, inflows and heat exchange with the air (Awachie, 1981; Ikusemiju, 1981; Umeham, 1989). Though Surface water temperatures of natural inland water in the tropics is between 250C and 350C (Alabaster and Lloyd, 1980), the high temperature values reported from station 2 can be attributed to firstly, the discharge of warm effluent and steam condensates into the receiving water and second, the increased organic load, that might have caused an increase in absorption of heat (Odokuma and Okpokwasili, 1997; Ekhaise and Anyasi, 2005). Higher mean value of total dissolved solids was recorded in station 2 (5.79mg/l), though this was within the permissible levels of drinking water, it indicated high levels of dissolved ions in the effluent as corroborated by the higher conductivity level in station 2. Alabaster and Lloyd (1980) reported that excessive concentration of suspended and dissolved solids might be harmful to aquatic life, because they decrease water quality, inhibit photosynthetic processes and eventually lead to increase
of bottom sediments and decrease of water depth (Ogbeibu and Anagboso, 2004). Turbidity and transparency are intimately related to hydrological regime of a water body. When there is increase in turbidity, transparency is reduced. Turbidity of the water increased greatly from 88.92 NTU at the point of entry (station 2) and reduced drastically to 12.65 NTU in station 3 due to downstream dilution. This indicates an increase in the concentration of suspended matters in the water as a result of effluent inflow and the subsequent reduction at the downstream station 3 is indicative of self purification by the river (Gray, 1989). The discharge of effluents directly into station 2 significantly increased turbidity and reduced the dissolved oxygen level. Exogenous substances of organic origin are known to increase water colour, turbidity, and suspended and dissolved solids and thus reduce turbidity (Chikere and Okpokwasili, (2001). The pH obtained from this study was well within acceptable limit (FEPA, 1991; WHO, 2006). Similar range of 6.8 - 7.2 was recorded by Ovie and Adeniji (1994) for Shiroro Lake while Ovie (1997) recorded between 6.9 and 7.6 for Jebba Lake. These circumneutral values indicated that lotic waters are more acidic than lentic water bodies (Hutchinson, 1975). Electrical Conductivity which measures the total ionic composition of water and its overall richness recorded its highest value of 155.23µS/cm in station 2. Though much below FEPA minimum allowable limit (1000mg/L) for aquatic life, the higher values at the discharged point could be due to the effluent inflow containing ionic substances such as nitrates, chlorides, calcium and Magnesium. The dissolved oxygen concentration is a function of temperature, pressure, salinity and biological activity in the water body. Tropical aquatic ecosystem should have a dissolved oxygen concentration of at least 5mg/l in order to support diversified biota, including fish (Jha et al, 2008).
132
Bajopas Volume 4 Number 1 June, 2011
The study area was not well aerated, the level (3.18mg/l – 3.27mg/) was below the FEPA (1991) standard value of 5 mg/l necessary for aquatic productivity. The recorded DO mean of 3.18 mg/l (station 2) could be attributed to the presence of high concentrations of degradable organic and inorganic matters which resulted in a tendency to be more oxygen demanding, making oxygen less available to the desirable organisms including fishes. This is in agreement with the observations made by Ekundayo (1977) and Imevbore (1983). The range recorded is similar to the range (4.5 to 6.4mg/l) for Eleme River in Niger Delta receiving petrochemical effluent (Chikere and Okpokwasili, 2001), but a much lower dissolved oxygen range of 1.84 – 5.22mg/l was reported by Ogbeibu and Edutie (2002) in Ikpoba river. The Biochemical Oxygen Demand is widely used to determine the pollution due to organic loading and the quality of receiving surface water. It represents the amount of oxygen required for the biological decomposition of organic matter under aerobic condition at a standardized temperature (20○C) and time of
incubation (usually 5 days). It is an expression of how much oxygen is needed for microbes to oxidize a given quantity of organic matter. However, organic matter will undergo chemical oxidization even in the absence of decomposers. High BOD value as recorded in station 3 (18.47mg/l) downstream of the discharge point though below the FEPA (1991) standard value of 30 mg/l could be attributed to partial or non-treatment of the effluents by the industry before releasing them into waste-receiving streams. Poor self-purification of the receiving streams could also be a contributing factor. High BOD has undesirable consequence on aquatic life such as leading to the production of ammonia and hydrogen sulphide (Boyd and Lichkopler, 1979) which affect fish negatively in various ways. The biodegradation of organic materials exerts oxygen tension in the water and increases the biochemical oxygen demand. This implies that it is dangerous to discharge the effluent directly into water without aeration, as this would deplete the water of dissolved oxygen that is needed by aquatic animals for respiration. This is because high BOD leads to less dissolved oxygen, which is detrimental to aquatic lives (Jha et al, 2008). The alkalinity value was high in station 2 (149.52mg/l) and above the recommended permissible limit. This could be because the effluent contains sodium carbonate as components of detergents used in washing,
The range of chloride values observed was low as it is usual for tropical freshwaters. Highest mean value was recorded in station 2 (23.36mg/l) which is below the permissible limit stipulated by FEPA and WHO.
Hardness of natural waters is caused largely by calcium and magnesium salts and to a small extent by iron, aluminum, and other metals. Values recorded throughout the study period were minimal and below the limit stipulated by FEPA. Water hardness is important to fish culture and is a commonly reported aspect of water quality. Both Calcium and Magnesium contribute to the total hardness of the water (5.50 to 6.67mg/l). Like hardness, calcium and magnesium had their highest peak in station 2 and recorded values during the duration of the study were generally low and below the FEPA’s limit. Calcium revealed a positive correlation with hardness.
Nitrate level was low at all stations; however, the highest value of 0.67mg/l was recorded in station 2. Nitrates and phosphates have often been cited as the limiting nutrients in aquatic systems and as indices of eutrophication in lakes, rivers and reservoir (Wetzel, 1975; Thornton, 1986; Ovie, 1997). Nitrate plays a vital role in the biological metabolism of aquatic organisms (notably phytoplankton and macrophytes). Concentration of nitrate production in water at any given time is a product of balance between nitrate productions through the activities of nitrifying bacteria and nitrate destruction by autotrophic assimilation and/or bacteria denitrification (Hutchinson, 1975). The increased levels of electrical conductivity, nitrate, and cations are products of decomposition and mineralization of organic materials, at the discharge point (station 2) and downstream station 3. The biological significance of this is the disruption of the delicate ecological balance of the ecosystem, a reduction in population of organisms, and a subsequent loss of the already depleted biodiversity of the stream (Imoobe and Ohiozebau, 2009). Most of these impacted parameters appear to have easily recovered to their original state downstream.
Conclusion and Recommendation The changes observed in some of the physical and chemical properties of Eruvbi stream, notably increased TDS, turbidity and reduced dissolved oxygen in Stations 2 and 3 indicate inefficient effluent treatment in the distilleries. This study has shown that the quality of receiving water is influenced significantly by the chemical composition of effluents discharged into Eruvbi stream due to reduced oxygen, increased temperature and turbidity.
Although, the concentrations of some of these parameters reduced downstream of effluent discharge some still remained high downstream of the effluent discharge point in the water. Because Eruvbi stream serves as a source of domestic water supply for the local community for drinking, washing, fishing and swimming, all specified quality criteria must be met especially before the discharge, therefore to ensure that the integrity of Eruvbi stream is maintained the following recommendations are made; I. Continuous discharge of improperly treated
effluent by the soft drink processing industries should be stopped as this may further compound the pollution problem of Eruvbi Stream.
II. Alternatively, the industrial waste should be processed before been discharged into the stream ,this is important so that pollutants which may pose health risks and hazards are not discharged into the surrounding ecosystem.
III. Strict adherence to stipulated guidelines for effluent generated by industries coupled with adequate and regular monitoring of effluent discharge into the aquatic environment should be undertaken to halt further deterioration of the environment that might jeopardize human health.
IV. Automated measuring and monitoring equipment be installed to check discharge parameters against stipulated standards for drinking water, aquatic life and other uses.
133
Bajopas Volume 4 Number 1 June, 2011
REFERENCES Alabaster, J.S and Lloyd, R. (1980). Water quality criteria for
freshwater fish. Butterworts, London. 350pp. American Public Health Association (1998). Standard
methods for the Examination of Water and Waste water, 20th edn. American Public Health Association, Washington. 1134 pp.
Awachie, J.B.E. (1981). Running Water Ecology in Africa pp 339 – 366. In: M.A. Lock and D.D Williams (ed). Perspectives in Running Water Ecology. New York and London, Plenum Press. 389pp.
Boyd,C.E. and Lichikoppler, F. (1979). Water Quality in Fish Pond Culture Research and Development Serirs. No. 22 International Center for Agriculture. Experimental Station. Aubm.
Chikere, B.O. and Okpokwasili, G.C. (2001). Organic pollution in a Niger Delta River receiving petrochemical effluents. Trop. Freshwat. Biol. 10: 19 – 33.
Ekhaise, F.O. and Anyasi, C.C. (2005). Influence of Breweries Effluent Discharge on the Microbiological and Physico-chemical Quality of Ikpoba River, Nigeria. Biotechnology 4 (10): 1062 – 1065.
Ekundayo, J. A. (1977). Environmental consequences of the pollution of the Lagos lagoon., Bull. Sci. 3: 291-300.
Fair, G.M., Geyer, J.C., and Okun, D.A. (1968). Water and Wastewater Engineering. Vol. 2: Water Purification and Wastewater Treatment and Disposal. John Wiley & Sons, Inc., New York, NY, USA. 251pp.
Federal Environmental Protection Agency (FEPA) (1991). Guideline and Standard for Environmental Pollution Control in Nigeria. FG Press 238pp.
Gray, N. F. (1989). Biology of Water Treatment. Oxford University Press, New York. 338pp
Horton, R.E. (1945). Erosional Development of Streams and their Drainage Basins: Hydrophysical Approach to Quantitative Morphology. Bulletin of the Geological Society of America 56.
Hutchinson, G.E. (1975). A Treatise on Limnology. III. Aquatic Macrophytes and attached Algae. John Wiley & Sons, New York. 494pp
Ifabiyi, I. P. (2008). Self Purification of a Freshwater Stream in Ile-Ife: Lessons for Water Management. Journal of Human Ecology, 24(2): 131-137.
Ikusemiju, K. (1981). The Hydrobiology and Fishes of the Lekki Lagoon, Nigeria. Nig. J. Nat. Sci., 3(1 & 2): 135 – 146.
Imevbore, A. M. A. (1983). The investigation of faecal pollution in the surface water of the Niger Delta of Nigeria. Final report on Vol. 3 Ed. Niger Delta Basin Development.
Imoobe T. O. T. and Ohiozebau, E (2009). Pollution Status of a Tropical Forest River Using Aquatic Insects as Indicators. African Journal of Ecology, 48, 232–238.
Jha P, Barat S, Nayak CR. (2008). Fish Production, Water Quality and Bacteriological Parameters of Koi Carp Ponds Under Live-food and Manure Based Management Regimes. Zoological Research
Apr. 29(2):165—173.
Kanu, I., Achi, O.K.,Ezemonye, O.U and Anyanwu, E.C. (2006). Seasonal Variation in Bacterial Heavy Metal Bisorption in Water Samples from Eziama River near Soap and Brewery Industries and the Environmental Health Implications. Environmental Science and Technology. 3 (1): 92 – 102.
Mason, C.F. (1981). Biology of Freshwater Pollution. Longman. U.K. 239pp.
Odigie, D and Fajemirokun, B. (2005). Water Justice in Nigeria: Crisis or Challenge. International Workshop on Water Poverty and Social Crisis Agadir, Morocco, 12-15 December 2005.
Odokuma, L.O. and Okpokwasili, G.C. (1997). Seasonal Influences on the Organic Pollution Monitoring of the New Calabar River Nigeria. Environ. Monitor. Assess. 45: 43 – 56.
Ogbeibu, A.E & Anagboso, M.U. (2004). Baseline Limnological Investigation of the Utor River in Essan South-East, Edo State, Southern Nigeria: 1. Physical and Chemical Hydrology. Trop. Freshwat. Biol. 12 (13): 45 – 62.
Ogbeibu, A.E. and Edutie, L.O. (2002). Impact of Brewery Effluent on the Water Quality and Rotifers of Ikpoba River, Southern Nigeria. African Journal of Environmental Pollution and Health. 1 (1): 1 – 12.
Ogbeibu, A.E. and Ezeunara, P.U. (2002). Ecological Impact of Brewery Effluent on the Ikpoba River, Using the Fish Communities as Bioindicators. Journal of Aquatic Sciences. 17 (1): 35 – 44.
Olomukoro, J.O. (1983). Limnological Investigations of the Macrobenthic Fauna of Eruvbi Stream, a Tributary of Ikpoba River, Benin City. Unpublished M.Sc. Thesis University of Benin, Benin City. 104pp.
Onwudinjo, C.C. (1990). The Hydrology and Plankton of Benin River, Nigeria. Unpublished Ph.D. thesis, University of Benin, Benin City. 355pp.
Ovie, S.I. (1997). The Ecology and Culture of the Zooplankton of Jebba Lake, Nigeria. Unpublished Ph.D. Thesis University of Benin, Benin City.
Ovie, S.I. and Adeniji, H.A. (1994). Zooplankton and Environmental Characteristics of Shiroro Lake at the Extreme of its Hydrobiological Cycle. Hydrobiologia. 286: 175 – 182.
Radojevic, M. and Bashkin, V. N. (1999): Practical environmental Analysis. RS.C, U.K. 466 pp.
Sangodoyin, A.Y. (1991), “Groundwater and Surface Water Pollution by Open Refuse Dump in Ibadan, Nigeria”. Journal of Discovery and Innovations, 3 (1): 24-31.
Suflita, J. M., Robinson, J. M., and Tiedje, J. M. (1983). Kinetics of Microbial Dehalogenation of Haloaromatic Substrates in Methanogenic Environment. Applied and Environmental Microbiology 45(5) 1466- 1473.
Thomas, J. M. Ward, C. H., Raymond, R. L. Wilson, J. T. and Lohehr, R. C. (1992). Bioremediation. In Encyclopedia of Microbiology I (J. Lederberg ed.) Academic Press London. 369-377.
Thornton, J.A. (1986). Nutrients in African Lake Ecosystems. Do we know all? J. Limnol. Soc. South Afr. 12: 6 – 21.
Umeham, S.N. (1989). Some Aspects of the Physico-chemical Limnology of Lake Chad (Southern Sector). Journal of Aquatic Sciences. 4: 21 – 26.
Wetzel, R.G. (1975). Limnology. W.B. Saunders Company, Philadelphia, London. 743pp.
World Health Organization (2006). Guidelines for Drinking Water Quality Vol. 1 Geneva, Switzerland.
Zar, J.H. (1984) Biostastistical Analysis, 2nd edn. Prentice Hall Inc., New Jersey.
134