assessment of the impact of wastewater treatment …
TRANSCRIPT

ASSESSMENT OF THE IMPACT OF WASTEWATER TREATMENT PLANT
DISCHARGES AND OTHER ANTHROPOGENIC VARIABLES ON RIVER
WATER QUALITY IN THE eTHEKWINI METROPOLITAN AREA.
By
JAYSEELAN NAIDOO
Submitted in fulfilment of the academic requirements for the degree of
MASTER OF SCIENCE
in the
School of Agricultural, Earth and Environmental Sciences University of Kwazulu-Natal
December 2013
ii
PREFACE
All of the work presented henceforth is ultimately based on the experimental work
conducted in the School of Agricultural, Earth and Environmental Sciences, University of
KwaZulu-Natal, Durban (South Africa) – from January 2012 to December 2014 under the
supervision of Dr. Srinivasan Pillay.
This dissertation comprises the original intellectual product of the author, Jayseelan
Naidoo, and has not been submitted in substance for any other degree or award at this or
any other learning institution, nor is it being submitted concurrently for any other degree
or award. Information sources and the work of others are duly acknowledged as such.

iii
ACKNOWLEDGEMENTS
My sincere gratitude goes to the following people for their help and assistance in the
compilation of this study:
1. To my supervisor, Dr. Srinivasan Pillay, for your mentorship, motivation and patience.
2. My daughter Kim, not only for your continuous support, but also for your motivation.
3. Mr. Jerome Naidoo for assistance in compilation of this work.
4. Mr. Vernon Govender, Mr. Jason Naidoo, Mr Sachin Bunsee, Mr Sugendran Thaver and Mr
Norman Govender for all your efforts and assistance with this study.
5. Ms. Rashna Thirugeni for your patience and support.
6. Mr. Eddie Powys for your assistance in the lab.

iv
DECLARATION - PLAGIARISM
I, Jayseelan Naidoo, declare that:
1. The research reported in this thesis, except where otherwise indicated, is my original
research.
2. This thesis has not been submitted for any degree or examination at any other
university.
3. This thesis does not contain other persons’ data, pictures, graphs of other information
unless specifically acknowledged as being sourced from other persons’.
4. This thesis does not contain other persons’ writing unless specifically acknowledged as
being sourced from other researchers. Where other written sources have been quoted,
then:
a. Their words have been re-written but the general information attributed to
them has been referenced
b. Where their exact words have been used, then their writing has been placed in
italics and inside quotation marks, and referenced.
5. This thesis does not contain text, graphics or tables copied and pasted from the
internet, unless specifically acknowledged, and the source being detailed in the thesis
and in the Reference sections.
Signed:
_________________________
Jayseelan Naidoo
As the candidate’s supervisor I have/have not approved this dissertation/thesis for
submission.
Signed: _________________ Name: _________________ Date: _________________

v
DECLARATION-PUBLICATIONS
The author of this document will be working towards the production of individual research papers
from this dissertation, as well as the submission of these papers to the relevant journals for
publication.
Signed: _________________ Name: ___JAYSEELAN NAIDOO Date: 02/12/2014
vi
ABSTRACT
On a global scale the deterioration in riverine water quality is of great concern since water is
one of the most valuable and essential resources that forms the basis of all life.
For South Africa, the declining water quality is of even more importance since the country is
located in a semi-arid part of the world with scarce water supplies. The quality of water in
many rivers in South Africa continues to deteriorate at unprecedented rates, which affects its
availability and use. This situation is quite the same for rivers in the eThekwini Metropolitan
Area which is located in Kwazulu-Natal, a coastal province of South Africa.
This study assesses the qualitative impact of wastewater plant discharges from the
uMhlatuzana; Northern and KwaMashu Wastewater Treatment Works, on the uMhlatuzana
River; uMgeni River and uMhlangane River, respectively. Samples were collected from
identified points upstream and downstream of the wastewater discharges and the results were
analysed in terms of the t-test statistical technique to identify any significant change in water
quality between the upstream and downstream sites. In addition, the samples collected were
analysed for physico-chemical and microbiological parameters as respects compliance with
the Target Water Quality Guideline Range for aquatic ecosystems (DWAF, 1996); as well as
in comparison with the general requirements for purification of wastewater (DWAF, 1984).
The results from the t-test statistical analyses indicated that there was significant difference
between the upstream and downstream water quality for the following parameters and sites:
pH and permanganate value at the uMgeni River sampling sites; for dissolved oxygen at the
uMhlatuzana and uMgeni River sampling sites ; for total dissolved solids, conductivity,
chlorides, ammonia; nitrite and nitrates at all sampling sites.
In 50% of the instances there was compliance with the Target Water Quality Guideline Range
for aquatic ecosystems (DWAF, 1996). The majority of sites did not meet the general
requirements for purification of wastewater (DWAF, 1984); and the results indicate that
negative impacts from wastewater discharges occurred in 76% of the instances, while other
anthropogenic influences adversely affected water quality in 23% of instances. This study has
identified the extent; nature and source of water quality impacts on the rivers and it could
serve as a useful tool for rehabilitation and monitoring since it identifies the major source of
adverse water quality impacts.
vii
TABLE OF CONTENTS
PREFACE ................................................................................................................................................... xii
ACKNOWLEDGEMENT ........................................................................................................................... iii
DECLARATION: PLAGIARISM ............................................................................................................... iv
DECLARATION: PUBLICATIONS ........................................................................................................... v
ABSTRACT ................................................................................................................................................. vi
LIST OF FIGURES ..................................................................................................................................... xi
LIST OF TABLES ...................................................................................................................................... xii
LIST OF APPENDICES ............................................................................................................................. xiii
LIST OF ABBREVIATIONS ..................................................................................................................... xiv
CHAPTER ONE ........................................................................................................................................... 1
INTRODUCTION ...................................................................................................................................... 1
1.1 Rationale for the Study ........................................................................................................................... 1
1.2 Research Aim ......................................................................................................................................... 3
1.3 Research Objectives ................................................................................................................................ 3
CHAPTER TWO .......................................................................................................................................... 5
LITERATURE REVIEW ............................................................................................................................. 5
2.1 Introduction ............................................................................................................................................. 5
2.2 Wastewater .............................................................................................................................................. 5
2.2.1 Preliminary Treatment ............................................................................................................ 9
2.2.1.1 Screening ............................................................................................................... 9
2.2.1.2 Grit Removal ......................................................................................................... 10
2.2.1.3Flow Measurement ............................................................................................... 12
2.2.2 Primary Treatment ................................................................................................................ 12
2.2.3 Secondary Treatment ............................................................................................................ 14
viii
2.2.3.1 Aeration and Activated Sludge Treatment ............................................................ 14
2.2.3.2 Biological Filtration .............................................................................................. 17
2.2.3.3 Secondary Settling ................................................................................................ 18
2.2.4 Tertiary Treatment ................................................................................................................ 19
2.2.4.1 Stabilization Ponds ............................................................................................... 20
2.2.4.2 Disinfection ........................................................................................................... 20
2.2.4.2.a Chlorination ............................................................................. 22
2.2.4.2.b Ultraviolet Radiation ................................................................ 22
2.2.4.2.c Ozonation ................................................................................. 23
2.2.5 Solids Treatment ................................................................................................................... 24
2.3 Water Quality ........................................................................................................................................ 28
2.3.1 Water Quality Parameters ..................................................................................................... 31
2.3.1.1 Physico-chemical Parameters ............................................................................... 31
2.3.1.1.a Chemical Oxygen Demand (COD) ...................................................... 31
2.3.1.1.b Dissolved Oxygen (DO) ..................................................................... 32
2.3.1.1.c Electrical Conductivity (EC) ................................................................ 33
2.3.1.1.d pH ....................................................................................................... 33
2.3.1.1.e Total Dissolved Solids (TDS) ............................................................. 34
2.3.1.1.f Suspended Solids ................................................................................ 35
2.3.1.1.g Turbidity .............................................................................................. 35
2.3.1.1.h Ammonia, Nitrites and Nitrates ........................................................... 36
2.3.1.1.i Chloride ................................................................................................ 38
2.3.1.1.j Permanganate Value (PV4) .................................................................. 39
2.3.1.2 Microbiological Parameters .................................................................................. 39
2.3.2 Water Quality Legislation ..................................................................................................... 40
2.3.2.1 The Constitution of the Republic of South Africa (108 of 1996) ......................... 42
2.3.2.2 The National Water Resources Strategy (NWRS) ................................................ 42
2.3.2.3 The National Water Act (NWA) (36 of 1998) ...................................................... 43

ix
2.3.2.4 The National Environmental Management Act (NEMA) (107 of 1998) .............. 44
2.3.2.5 The South African Target Water Quality Guidelines (TWQGR) ......................... 44
2.4 Anthropogenic Impacts ......................................................................................................................... 45
2.4.1 Agricultural, Forestry and Mining Activities ........................................................................ 45
2.4.2 Industrial Activities ............................................................................................................... 46
2.4.3 Urbanization .......................................................................................................................... 47
2.5 Conclusion ............................................................................................................................................ 49
CHAPTER THREE .................................................................................................................................... 50
THE STUDY AREA ................................................................................................................................... 50
3.1 Introduction ........................................................................................................................................... 50
3.2 Description of the eThekwini Municipality (EM) ................................................................................ 50
3.3 The uMhlangane River and KwaMashu Wastewater Trearment Works (KWWTW) .......................... 51
3.4 The uMgeni River and Northern Wastewater Treatment Works (NWWTW) ...................................... 54
3.5 The uMhatuzana River and the uMhlatuzana Wastewater Treatment Works (UWWTW) ............... 56
3.6 Conclusion ............................................................................................................................................ 59
CHAPTER FOUR ....................................................................................................................................... 60
DATA COLLECTION AND METHODOLOGY ...................................................................................... 60
4.1 Introduction ........................................................................................................................................... 60
4.2 Location of Sampling Sites for Data Collection ................................................................................... 60
4.3 Methodology of Sample Collection ...................................................................................................... 61
4.4 Methodology for Analyses of Data ....................................................................................................... 61
4.5 Conclusion ............................................................................................................................................ 62
CHAPTER FIVE ........................................................................................................................................ 63
RESULTS AND DISCUSSION ................................................................................................................. 63
x
5.1 Introduction ........................................................................................................................................... 63
5.2 pH .......................................................................................................................................................... 64
5.3 Total Dissolved Solids (TDS) ............................................................................................................... 65
5.4 Chlorides ............................................................................................................................................... 66
5.5 Ammonia............................................................................................................................................... 66
5.6 Dissolved Oxygen (DO) ....................................................................................................................... 68
5.7 Chemical Oxygen Demand (COD) ....................................................................................................... 69
5.8 Permanganate Value (PV4) ................................................................................................................... 70
5.9 Conductivity .......................................................................................................................................... 71
5.10 Escherichia Coli (E.coli) ..................................................................................................................... 71
5.11 Turbidity ............................................................................................................................................. 72
5.12 Nitrites and Nitrates ............................................................................................................................ 73
5.13 Conclusion .......................................................................................................................................... 73
CHAPTER SIX ........................................................................................................................................... 75
CONCLUSION AND RECOMMENDATIONS ........................................................................................ 75
6.1 Conclusion ............................................................................................................................................ 75
6.2 Recommendations ................................................................................................................................. 77
REFERENCES ........................................................................................................................................... 78
APPENDIX ................................................................................................................................................. 91

xi
LIST OF FIGURES
Figure 2.1 Composition of raw sewage (Tempelton & Butler, 2011) .................................. 7
Figure 2.2 Treatment stages in wastewater (Tempelton & Butler, 2011).......................... .......8
Figure 2.3 Preliminary treatment schematics (WEF, 2008a)................................................. 11
Figure 2.4 Circular Shaped Primary SedimentationTank (http://en.ekoton.com/about
us)........................................................................................................................................… 13
Figure 2.5 The Activated Sludge Process (WEF, 2008a).........................................................16
Figure 2.6 A Typical Trickling Filter (WEF, 2008a)...............................................................17
Figure 2.7 Anaerobic digester with depiction of sludge layers (Gerhardi, 2003)................ 26
Figure 2.8 Belt filter press process flow diagram (WEF, 2008b)........................................... 28
Figure 2.9 Land use activities generating a groundwater pollution threat (Kresic, 2009).... 29
Figure 2.10 World’s urban population prediction for 2030 (WWAP, 2009).......................... 48
Figure 3.1 Location of KWWTW and uMhlangane River (EWS, 2011)............................... 52
Figure 3.2 KWWTW Flow and Process Diagram (EWS, 2011)............................................... 53
Figure 3.3 Location of NWWTW and uMgeni River (EWS, 2011)........................................54
Figure 3.4 NWWTW Flow and Process Diagram (EWS, 2011)............................................ 56
Figure 3.5 Location of UWWTW and uMhlangane River (EWS, 2011)................................57
Figure 3.6 UWWTW Flow and Process Diagram (EWS, 2011)............................................ 58
Figure 4.1 The 650 MDS Multiparameter Display System and ii) The 6920 Multiparameter Sonde (http://www.ysihydrodata.com/products.htm)..............................................................62
xii
LIST OF TABLES
Table 2.1 Major components of domestic wastewater (Ujang and Henze, 2006) ...................6
Table 2.2 Types and numbers of Microorganisms found in raw domestic sewage
(Tchobanoglous et al., 2004)....................................................................................................21
Table 2.3 Characteristics of commonly used disinfectants (Ahuja, 2009)...............................24
Table 2.4 Diseases generally transmitted by contaminated drinking water (Gray, 1999)...... 30
Table 2.5 Major potential sources of nitrogen and phosphorus (Dallas and Day 2004)..........37
Table 4.1 Tabulated description of the sample sites (Source: Author)……………………... 60

xiii
LIST OF APPENDICES
Appendix A. Results and graphical representation of sample results from all sample sites.
xiv
LIST OF ABBREVIATIONS
COD Chemical Oxygen Demand
DO Dissolved Oxygen
DWA Department of Water Affairs
DWAF Department of Water Affairs and Forestry
E.coli Escherichia coli
KWWTW Kwamashu Wastewater Treatment Works
ML/day Megalitres per day
NWWTW Northern Wastewater Treatment Works
NWA National Water Act (No. 36 of 1998)
NWRS National Water Resource Strategy
pH Potential of Hydrogen
TDS Total Dissolved Solids
UKZN University of KwaZulu-Natal
US-EPA United States – Environmental Protection Agency
UWWTW uMhlatuzana Wastewater Treatment Works
WHO World Health Organization
WISA Water Institute of South Africa
WRC Water Research Commission
WWTW Waste Water Treatment Works
UNITS
cm Centimetre
km Kilometre km2 Square kilometre
L Litre
m Metre
mg/l Milligrams per litre
°C Degrees centigrade
< Less than
> Greater than

1
CHAPTER ONE
INTRODUCTION
1.1 RATIONALE FOR THE STUDY
Without water, life as we know it would not be possible (Ahuja, 1986). Virtually all our
daily activities involve the consumption of water in one form or another. However over
80 countries in the world suffer from a water deficit, and an estimated 1.2 billion people
drink unclean water (Ahuja, 2009); and global trends indicate that by the year 2025,
nearly two billion people will live in regions or countries with absolute water scarcity
(Seckler et al., 1999).
South Africa is a water scarce country with complex hydrological conditions that make it
very challenging to secure sufficient water for economic growth (Schreiner and Hassan,
2011). Approximately 60 percent of the region is regarded as arid to semi-arid
(Nomquphu, 2005). It is the 30th driest country in the world and the intensity of South
Africa’s water use at 31 percent of the available resources is high by world standards and
far greater than other countries in the region (DWAF, 2011). About 65% of the country
receives less than 500mm rainfall on average per year, and about 20% receives less than
200mm per year with desert conditions on the far western parts (DWA, 1986). Also, the
water quality of rivers in South Africa has deteriorated to the extent that they have been
deemed to be of poor quality for human consumption and of limited associated uses. The
poor quality is largely due to the discharges of inadequately treated industrial;
agricultural and domestic wastewater into rivers as well as other indiscriminate activities.
Constitutionally, South Africa has legally enshrined the right to minimum amounts of
water as a human right, but supplying this amount to all citizens is turning out to be a
difficult task (Rogers and Leal, 2010). This has necessitated the transfer of water into
South Africa from neighboring countries. Transferring water from areas having a surplus
to those with a deficit has provided a solution to water scarcity (Cyrus et al., 1999).
However augmenting water supplies for South Africa from neighboring countries
through inter-basin transfers attracts high costs and continued supply is not sustainable,

2
since international arrangements on shared rivers are expected to become a matter of key
concern and tension as these countries development needs for more water expand
(Schreiner and Hassan, 2011).
These national challenges with respect to water quality, its availability and utilization in
South Africa necessitate urgent interventions. Water quality concerns have led to an
increasing demand for monitoring of water quality (Antonopoulos et al., 2001). The
deterioration in water resources needs to be controlled through effective and feasible
concepts of water management (Nhlapi and Gijzen, 2005). Mechanisms to achieve this
include, water resource management, the promotion of more efficient municipal,
agricultural and industrial water usage and protect the water resource from pollution;
however implementation of these reforms is proving to be challenging, given the diverse
and complex nature of the country’s water resources and their use (DWAF, 2011). There
is thus a need to use the existing water supplies effectively and efficiently and changes
are needed to sustain urban water and resource management services (Daigger, 2009).
The Department of Water Affairs is the custodian of South Africa`s water resources and
has initiated various monitoring programs and promulgated a series of laws that regulate
all water matters to ensure efficient; effective and sustainable utilization thereof.
Compliance with sewage standards is currently a major challenge. These are discussed in
the literature survey.
In addressing the national challenges with respect to water availability and utilization in
South Africa extensive research has been conducted on the water quality of many rivers
in South Africa (DWAF, 2001; Harris et al., 1991; Van Wyk, 2001; Naidoo, 2005;
Bezuidenhout et al., 2002). ‘The State of the Rivers Report’ for the Crocodile, Sabie-
Sand and Olifants River System (DWAF, 2001), ‘The evaluation of water quality in the
Mvoti River’ (Harris et al., 1991) and the study of the water quality of the Palmiet River
(Naidoo, 2005) also noted that factors and processes influencing water quality are best
understood when the catchment is considered as an inter-related system, where catchment
activities continuously influence naturally dynamic river systems. With reference to the
deteriorating riverine water quality, Bezuidenhout et al., (2002), indicated that continuous
3
fecal pollution in source water is a global problem that is particularly debilitating to rural
communities that are directly dependent on untreated source water for all their domestic
and other purposes. This baseline study assesses the impacts of wastewater treatment
plant discharges and other anthropogenic impacts on the water quality of three specific
rivers in the eThekwini Municipal Area namely: the uMhlangane River; the uMgeni
River and the uMhlatuzana River. Furthermore this study serves as a tool in proposing
remediation and mitigation measures to improve the riverine water quality by
identification of pollution impacts and sources. By quantifying the impacts of pollution
sources essential information to formulate and implement appropriate pollution strategies
can be provided (Van Wyk, 2001).
1.2 RESEARCH AIM
The aims of this study are:
To determine the impact of wastewater treatment plant discharges on the water
quality of the uMhlangane River; the uMgeni River and the uMhlatuzana River
and to identify other anthropogenic variables that have an influence on the water
quality of these rivers.
1.3 RESEARCH OBJECTIVES
The research objectives are to:
identify the water quality legislation as promulgated by the Department of
Water Affairs and Forestry and compliance thereto;
determine the water quality upstream and compare it with the water quality
downstream of the wastewater treatment works discharge point and further
compare these result with the wastewater treatment works discharge permit;
conduct assessments of activities along the course of the river to determine the
point source and non-point source anthropogenic activities necessitating the use
4
of land and water adjacent to the rivers and the impact thereof on water quality
and
propose rehabilitative measures for rivers with compromised water quality.

5
CHAPTER TWO
LITERATURE REVIEW
2.1 INTRODUCTION
This chapter discusses wastewater; water quality and anthropogenic activities.
Wastewater is described in terms of its origins; composition; treatment processes and
impacts on water quality. Water quality impacts; physico-chemical and microbiological
parameters to quantify water quality impacts as well as water quality legislation are
identified. The nature and extent to which anthropogenic activities influence water
quality are also discussed in this chapter.
2.2 WASTEWATER
Wastewater originates from domestic, commercial and industrial sources (Tempelton and
Butler, 2011). It is a reference to any water that has been adversely affected in terms of
its quality by anthropogenic influences and is defined as an amalgam of water-conveyed
wastes from the sanitary conveniences of dwellings; commercial; institutional and
industrial facilities. From the standpoint of sources of generation, wastewater may be
defined as a combination of the liquid or water-carried wastes removed from residences,
institutions, and commercial and industrial establishments (Tchobanoglous et al., 2004).
The constituents of wastewater include a varying range of potential contaminants such as
silt; sand; chemical residues; industrial cooling waters; industrial process waters;
biodegradable organic wastes; detergents; pesticides; fats; oil; greases; solvents; phenols;
cyanides; nutrients (nitrogen, phosphates, ammonia); metals (Hg, Pb, Cd, Cr, Cu, Ni) and
microorganisms (pathogenic bacteria, viruses and worm eggs) (Table 2.1) (Ujang and
Henze, 2006).
6
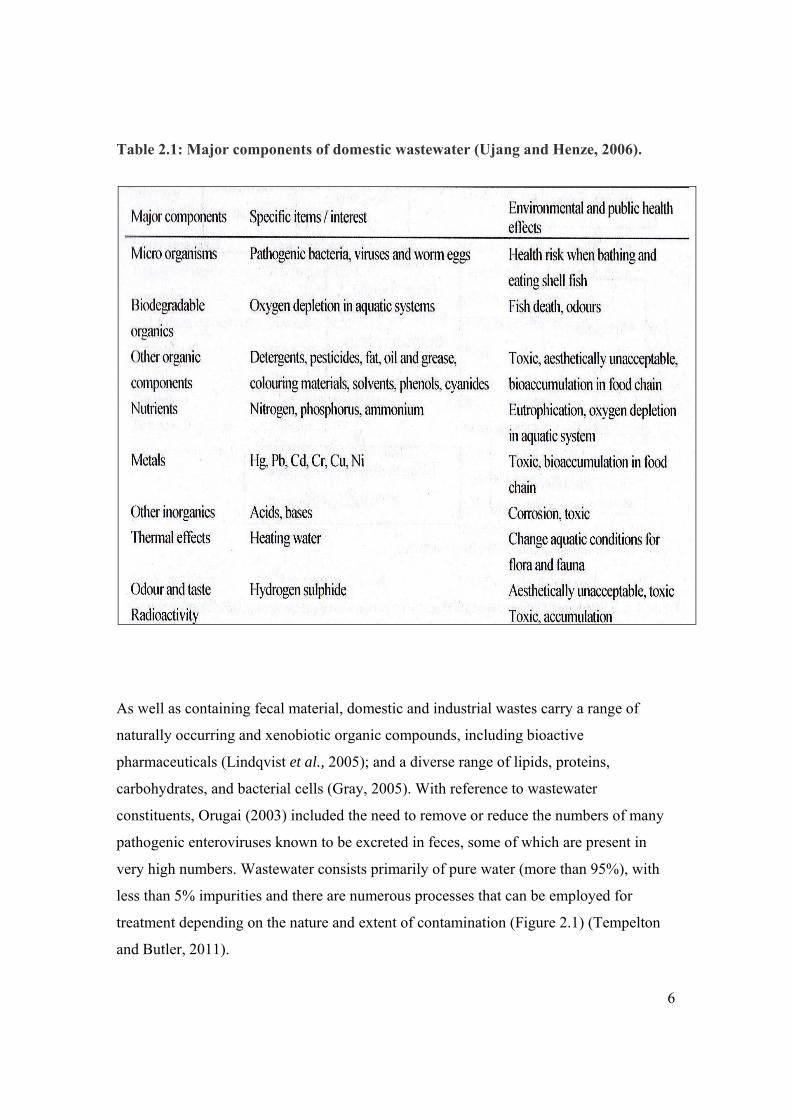
Table 2.1: Major components of domestic wastewater (Ujang and Henze, 2006).
As well as containing fecal material, domestic and industrial wastes carry a range of
naturally occurring and xenobiotic organic compounds, including bioactive
pharmaceuticals (Lindqvist et al., 2005); and a diverse range of lipids, proteins,
carbohydrates, and bacterial cells (Gray, 2005). With reference to wastewater
constituents, Orugai (2003) included the need to remove or reduce the numbers of many
pathogenic enteroviruses known to be excreted in feces, some of which are present in
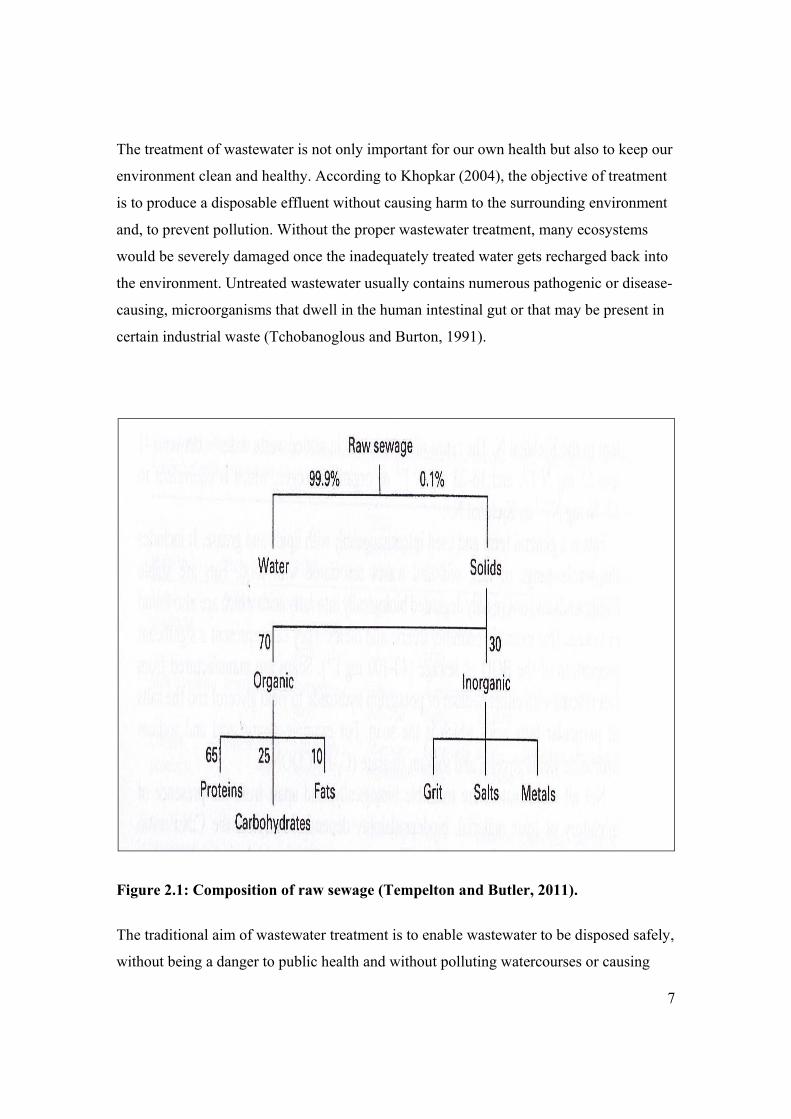
very high numbers. Wastewater consists primarily of pure water (more than 95%), with
less than 5% impurities and there are numerous processes that can be employed for
treatment depending on the nature and extent of contamination (Figure 2.1) (Tempelton
and Butler, 2011).
7
The treatment of wastewater is not only important for our own health but also to keep our
environment clean and healthy. According to Khopkar (2004), the objective of treatment
is to produce a disposable effluent without causing harm to the surrounding environment
and, to prevent pollution. Without the proper wastewater treatment, many ecosystems
would be severely damaged once the inadequately treated water gets recharged back into
the environment. Untreated wastewater usually contains numerous pathogenic or disease-
causing, microorganisms that dwell in the human intestinal gut or that may be present in
certain industrial waste (Tchobanoglous and Burton, 1991).
Figure 2.1: Composition of raw sewage (Tempelton and Butler, 2011).
The traditional aim of wastewater treatment is to enable wastewater to be disposed safely,
without being a danger to public health and without polluting watercourses or causing
8
other nuisance (Tempelton and Butler, 2011). From the perspective of the treatment
works, the primary objective of wastewater treatment process operation is to meet the
permit requirements or, if the facility is non-discharging, the applicable requirements of
the regulatory agencies for groundwater protection (Boyd and Mbelu, 2009).
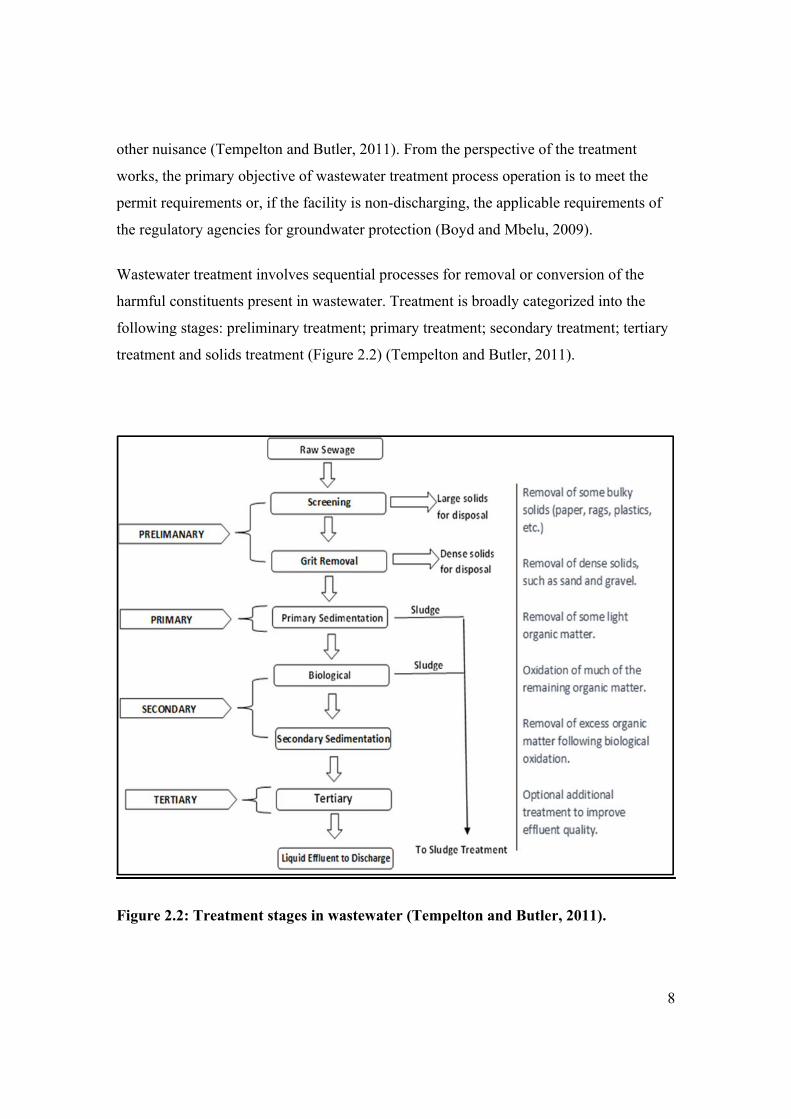
Wastewater treatment involves sequential processes for removal or conversion of the
harmful constituents present in wastewater. Treatment is broadly categorized into the
following stages: preliminary treatment; primary treatment; secondary treatment; tertiary
treatment and solids treatment (Figure 2.2) (Tempelton and Butler, 2011).
Figure 2.2: Treatment stages in wastewater (Tempelton and Butler, 2011).

9
2.2.1 Preliminary Treatment
The first unit process in any treatment plant is the preliminary treatment unit (Water 21,
2013). Preliminary treatment is defined as the removal of wastewater constituents that
may cause maintenance or operational problems with the treatment operations, processes,
and ancillary systems (Tchobanoglous et al., 2004). According to WISA (2002),
preliminary treatment is important for:
screening and removal of solids that could cause blockages in pumps and piping
as well as damage equipment;
removal of grit and sand that could cause pipe blockages and abnormal pump
wear through abrasion as well as reduce downstream tank volumes through grit
settlement in tanks and;
inflow measurement which is invaluable in managing the treatment process in
addition to budgetary and future expansion planning.
Preliminary treatment of wastewater occurs at the head of the works and generally
includes screening, grit removal and flow measurement as indicated in figure 2.3, below.
2.2.1.1. Screening
The head of works is the point of entry of the wastewater into the treatment works site
where treatment begins with the waste going through a screening process to remove items
that cannot get through the treatment process (Rogers and Leal, 2010). These items
include the removal of large solid components which are entrapped by coarse screens.
These coarse screens are generally constructed of heavy, parallel rectangular or round
steel bars spaced 50-150mm apart in the channel and are sloped at an angles ranging from
30 to 45 degrees from the vertical position. The influent sewage water passes through a
bar screen to remove all large objects like cans, rags, sticks, plastic packets etc. carried in
the sewage stream (London, 1999). Fine screens are located after the coarse screens to
10
remove the finer solids such as rags and paper (WISA, 2002). Substances typically
removed include wood, cardboard, rags, plastic, grit, grease and scum (WEF, 1996). If
gross solids are not removed, they become entrained in pipes and moving parts of the
treatment plant, and can cause substantial damage and inefficiency in the process (EPA,
2004). In addition, floating material can encourage the development of odours and
breeding of flies and other organisms (DWAF, 2002).
2.2.1.2. Grit Removal
The preliminary treatment stage concludes after the heavier solids such as grit and sand is
allowed to settle out in channels for removal to a landfill site (WISA, 2002). Grit
channels or chambers, by design allow the grit and sand particles to settle out for removal
to a landfill site. Removal volumes of grit vary (4 to 200ml/m3 is typical)
(Tchobanoglous et al., 2004). There are 3 general types of grit chambers:
Horizontal- flow chamber either of a rectangular or square configuration where
the flow passes through the chamber in a horizontal direction and the straight line
velocity of flow is controlled by the dimensions of the unit, special influent
distribution gates and the use of special weir sections at the effluent end;
Aerated chamber which consists of a spiral-flow aeration tank where the spiral
velocity is induced and controlled by the tank dimensions and quantity of air
supplied to the unit or
The vortex-type which consists of a cylindrical tank in which the flow enters
tangentially creating a vortex-flow pattern; centrifugal and gravitational forces
cause the grit to separate (Tchobanoglous et al., 2004).

11
Figure 2.3: Preliminary treatment schematics (WEF, 2008a).
Whereas the process of degritting is costly and difficult to operate (Ujang and Henze,
2006); it is important for treatment. According to Tempelton and Butler (2011), grit
removal is an important preliminary treatment process for several reasons:
To protect mechanical equipment and pumps from abrasive wear;
To prevent pipe clogging by deposition of grit, and
To reduce accumulation of grit in settling tanks and digesters.
12
2.2.1.3. Flow Measurement
There are many flow measuring devices but the open channel flow measurement using a
venturi flume is possibly the most widely used system for waste waters (WISA, 2002).
Other flow measuring devices include venturi meters, flow nozzles or orifice meters
(WRC, 2006). Flow measuring devices are usually located downstream of the screens,
and their primary function is to accurately measure the amount of wastewater entering the
treatment works. In addition, regular flow recordings provide warnings on blockages or
pump failure in sewer reticulation (DWAF, 2002). Records of this nature aid in
determining the nature and extent of future treatment works expansions and are
invaluable for plant operation and process control.
2.2.2 Primary Treatment
Primary treatment is predominantly a physical removal process. Following preliminary
treatment, primary treatment removes suspended and floating material (WEF, 1996). The
main purpose of primary sedimentation is to allow separation of the solid and liquid
phase fractions in the wastewater thereby reducing the suspended solids content of the
influent wastewater (Boyd and Mbelu, 2009). The solids separation reduces the organic
loading on downstream processes and also reduces the suspended solids load on
subsequent processes. The rationale for separation is explained by WISA (2002), as
follows: “when a liquid, containing solids(mostly organic) in suspension, is placed in a
relatively quiescent state, those solids having a higher specific gravity than the liquid will
tend to settle and those with a lower specific gravity will tend to rise”. Hence, the
majority of organic and suspended solids separate from the liquid and settle at the bottom
of the settling tank and is subsequently transferred to the sludge digester tank. This
reduces the load on the biological aerobic liquid stage and allows sludge to be treated
anaerobically (WISA, 1999).
Primary treatment involves the utilization of large settling tanks to facilitate this
separation. The tank configuration could be rectangular in shape with horizontal inflow
13
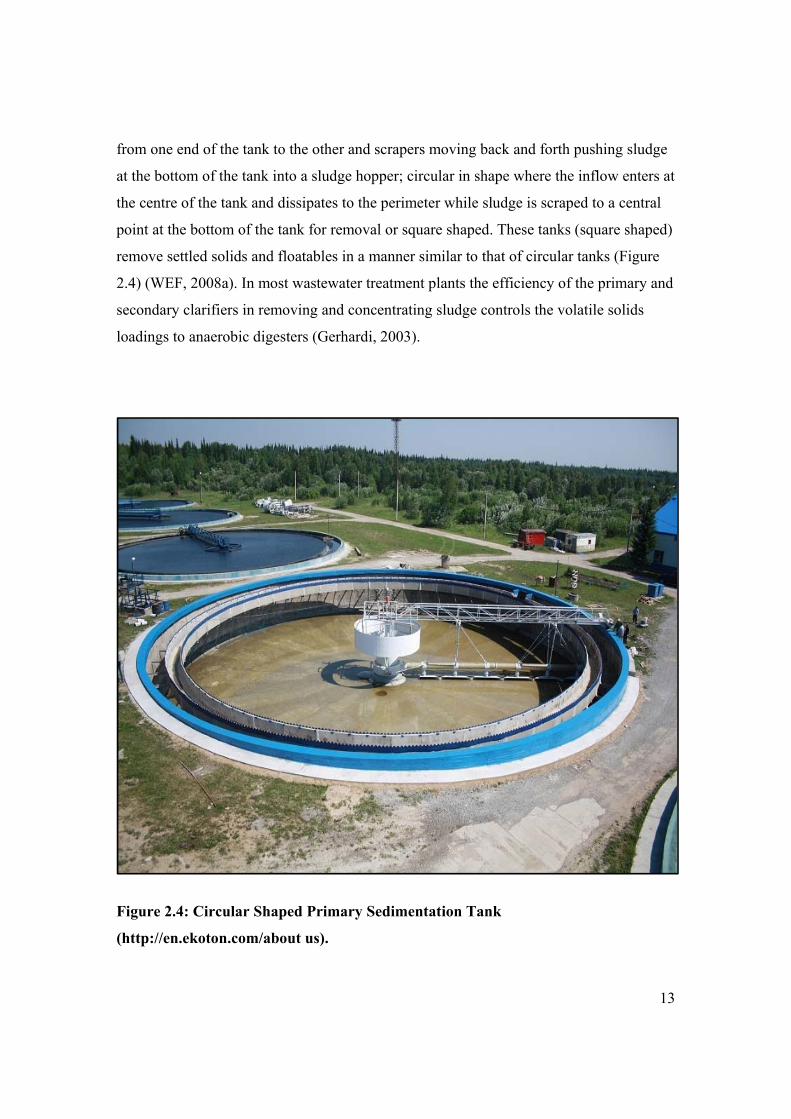
from one end of the tank to the other and scrapers moving back and forth pushing sludge
at the bottom of the tank into a sludge hopper; circular in shape where the inflow enters at
the centre of the tank and dissipates to the perimeter while sludge is scraped to a central
point at the bottom of the tank for removal or square shaped. These tanks (square shaped)
remove settled solids and floatables in a manner similar to that of circular tanks (Figure
2.4) (WEF, 2008a). In most wastewater treatment plants the efficiency of the primary and
secondary clarifiers in removing and concentrating sludge controls the volatile solids
loadings to anaerobic digesters (Gerhardi, 2003).
Figure 2.4: Circular Shaped Primary Sedimentation Tank
(http://en.ekoton.com/about us).
14
2.2.3 Secondary Treatment
Secondary treatment is effected predominantly by biological means. Following primary
treatment, the next treatment stage is termed secondary treatment. Secondary treatment
provides for the oxygenation of the liquid fraction flowing from the primary settling
tanks (WISA, 2002). This oxygen is consumed by microoganisms as they reduce the
organic substances in the wastewater. Secondary treatment reduces the concentrations of
dissolved and colloidal organic substances and suspended matter in the wastewater
(WEF, 1996). Secondary treatment includes the processes of aeration in an activated
sludge system or treatment in biological filtration (also known as trickling filters) and
secondary settling.
2.2.3.1 Aeration and Activated Sludge Treatment
For secondary treatment the conventional and most popular process is activated sludge
(WATER 21, 2013). The activated sludge process is the most commonly used system for
the treatment of municipal wastewater, and it is probably the most versatile and effective
of all wastewater treatment processes (Gerhardi, 2003). This secondary treatment begins
with aeration or oxygenation of primary tank effluent in a large basin or tank. The
primary tank effluent flows into aerated basins, wherein it is mixed with a mass of
microorganisms that reduce the organic matter by their metabolic activity (Figure 2.5).
The activated sludge process contains a large number and a large diversity of organisms
(Gerhardi, 2008). This process essentially involves an aeration tank, that is, a biological
reactor where the biomass is kept in suspension by aeration (Orhon et al., 2009). The
activated sludge process is a biological process of developing an activated mass of
microorganisms capable of stabilizing waste aerobically (Boyd and Mbelu, 2009).

15
Biological treatment is an ingenious system where pollutants in wastewater serve as
substrate for the microbial community sustained in a reactor and microorganisms are
grown in a controlled environment at the expense of organic and inorganic pollutants in
the feed stream through a complex sequence of biochemical reactions (Orhon et al.,
2009). The principle in an activated sludge plant is that a mass of active sludge is kept
moving in wastewater by stirring or aeration (Ujang and Henze, 2006). Because the
sludge is aerated, and the bacteria become very active during aeration, the term ‘activated
sludge’ is used to describe the process where bacterial solids are active in the purification
of the wastes within the aeration tank (Gerhardi, 2003). Aeration facilitates the dissolving
of oxygen in the effluent; mixes and keeps the effluent mass in suspension and is vital for
the activity of aerobic microorganisms in the aeration basin. This results in a stable
effluent that will cause limited future oxygen demands on the receiving waters (WISA,
1999).
The two basic methods of aerating wastewater are (1) to introduce air or pure oxygen into
the wastewater with submerged diffusers or other aeration devices or (2) to agitate the
wastewater mechanically so as to promote solution of air from the atmosphere
(Tchobanoglous et al., 2004). Diffused air aeration is enabled either by passing fine
bubbles or air through it, providing strong agitation or as a result of percolation through a
thin stream of sewage (WISA, 2002).

16
Figure 2.5: The Activated Sludge Process (WEF, 2008a).
There are two groups of mechanical aerators differentiated according to their axis and
location configuration namely: surface or submerged vertical axis aerators and surface or
submerged horizontal axis aerators. In surface aerators, oxygen is entrained from the
atmosphere; in submerged aerators, oxygen is entrained from the atmosphere and, for
some types, from air or pure oxygen introduced in the tank bottom (Tchobanoglous et al.,
2004). Typically, the effluent is oxygenated in a large basin which may range in depth
from 1.5 to 5.0 metres and use motor-driven aerators floating on the surface of the
wastewater (Beychok, 1971). New configurations have been adopted (multistage plants
for nutrient removal) and new technologies are being developed ( membrane bioreactors,
biofiltration, sequencing batch biofilm reactors) but all derive from the traditional
activated sludge process (Tandoi et al., 2005).

17
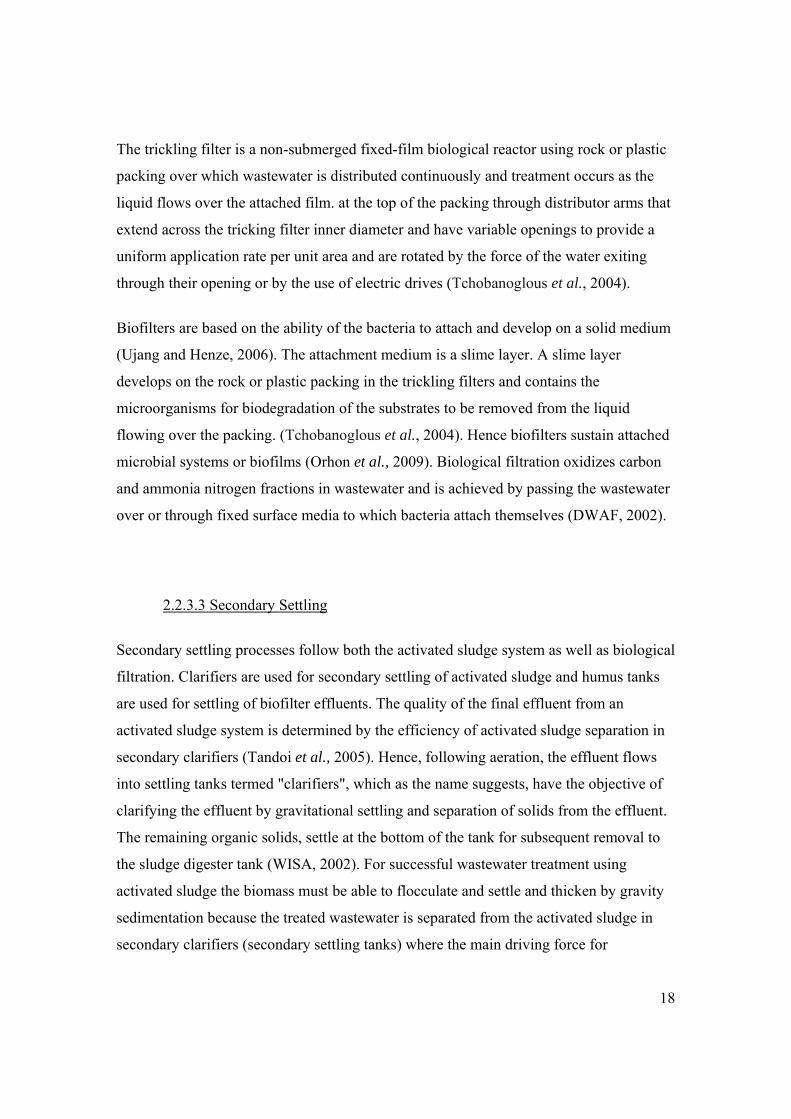
2.2.3.2 Biological Filtration
Since the late 1880`s secondary treatment has been effected by biological filtration with
the use of trickling filters (also termed biofilters). Trickling filters attempt to duplicate the
natural purification process that occurs when polluted wastewater enters a receiving
stream and trickles over a rock bed or rocky river bottom (Figure 2.6) (WEF, 2008a).
Figure 2.6: A Typical Trickling Filter (WEF, 2008a).
18
The trickling filter is a non-submerged fixed-film biological reactor using rock or plastic
packing over which wastewater is distributed continuously and treatment occurs as the
liquid flows over the attached film. at the top of the packing through distributor arms that
extend across the tricking filter inner diameter and have variable openings to provide a
uniform application rate per unit area and are rotated by the force of the water exiting
through their opening or by the use of electric drives (Tchobanoglous et al., 2004).
Biofilters are based on the ability of the bacteria to attach and develop on a solid medium
(Ujang and Henze, 2006). The attachment medium is a slime layer. A slime layer
develops on the rock or plastic packing in the trickling filters and contains the
microorganisms for biodegradation of the substrates to be removed from the liquid
flowing over the packing. (Tchobanoglous et al., 2004). Hence biofilters sustain attached
microbial systems or biofilms (Orhon et al., 2009). Biological filtration oxidizes carbon
and ammonia nitrogen fractions in wastewater and is achieved by passing the wastewater
over or through fixed surface media to which bacteria attach themselves (DWAF, 2002).
2.2.3.3 Secondary Settling
Secondary settling processes follow both the activated sludge system as well as biological
filtration. Clarifiers are used for secondary settling of activated sludge and humus tanks
are used for settling of biofilter effluents. The quality of the final effluent from an
activated sludge system is determined by the efficiency of activated sludge separation in
secondary clarifiers (Tandoi et al., 2005). Hence, following aeration, the effluent flows
into settling tanks termed "clarifiers", which as the name suggests, have the objective of
clarifying the effluent by gravitational settling and separation of solids from the effluent.
The remaining organic solids, settle at the bottom of the tank for subsequent removal to
the sludge digester tank (WISA, 2002). For successful wastewater treatment using
activated sludge the biomass must be able to flocculate and settle and thicken by gravity
sedimentation because the treated wastewater is separated from the activated sludge in
secondary clarifiers (secondary settling tanks) where the main driving force for
19
separation is gravitation (Tandoi et al., 2005). The overflow from the clarifier is the clear
treated effluent from the process, and the underflow, which contains settled sludge solids,
is the sludge return or recycle stream (WISA, 1999). The sludge is returned to the
aeration basin as it contains a mass of microorganisms that will mix with incoming
effluent and once again effect reduction of organic matter. A portion of the sludge is
removed as waste sludge from the aeration basin and transferred to the digester while the
overflow from the clarifier undergoes disinfection before being discharged to the
receiving environment (Tandoi et al., 2005).
For secondary settling of biofilter effluent, the effluent flows into the humus tank from
the biofilter underdrain. Humus tanks are required to remove the solids present in the
effluent discharged from biological filters (biofilters) by sedimentation (WISA, 2002).
All the sludge from trickling filters settling tanks is sent to sludge processing facilities or
returned to the primary clarifiers to be settled with primary solids (Tchobanoglous et al.,
2004).
2.2.4 Tertiary Treatment
Tertiary treatment generally includes some form of chemical treatment. The purpose of
tertiary treatment is to provide a final treatment stage to further improve the effluent
quality before it is discharged to the receiving environment and can include nutrient
removal processes; final polishing of effluent in stabilization ponds and disinfection.
According to Tempelton and Butler (2011), tertiary treatment is the further removal of
suspended solids or nutrients and/or disinfection before discharge to the receiving
watercourse. Usually tertiary treatment at a sewage works involves a series of ponds,
wetlands or reed beds that are installed to provide a degree of polishing of the treated
effluent discharged from the mechanical treatment process (DWAF, 2002).
20
2.2.4.1 Stabilization Ponds
Waste stabilization ponds are by design usually about 1.5 m deep basins with earthen
sides, and usually arranged in a series in which wastewater flows from one pond to the
following pond by gravity, with an incremental improvement in quality as the flow
moves from one pond to the next.
According to Ujang and Henze (2006), the advantages of waste stabilization ponds,
which come from their unique combination of physical simplicity and biological
complexity, include:
Low cost;
Simplicity of construction;
Excellent pathogen removal;
Ability to treat a variety of wastes;
Toleration of organic and hydraulic shock loads;
Low maintenance requirements;
Low sludge production;
Reliability of operation and
Simple land reclamation
2.2.4.2 Disinfection
A critical aspect of tertiary treatment is disinfection. Ideally water destined for human
consumption should be free from microorganisms, however, in practice this is an
unattainable goal (Gray, 1999). The goal of water disinfection is to remove or inactivate
pathogenic microorganisms (WISA, 2002); and disinfection of wastewater treatment

21
plant effluent inactivates or destroys pathogenic bacteria, viruses, and amoebic cysts
commonly found in wastewater (WEF, 1996). In addition to destruction of pathogens, a
further advantage of disinfection is that the general microbiological quality of the water is
also improved (WRC, 2006). Biological effluents from domestic wastewater treatment
are required to be disinfected before reuse because they still contain microorganisms of
intestinal origin, such as helminth ova and fecal coliform bacteria such as Escherichia
coli (Liberti et al., 2000) (Table 2.2).
Table 2.2: Types and numbers of Microorganisms found in raw domestic sewage (Tchobanoglous et al., 2004).

22
Since the numbers of pathogenic present in wastes and polluted waters are usually few
and difficult to isolate and identify, microorganisms which are more numerous and easily
tested for, are commonly used as surrogate (i.e., an indicator) organisms for the target of
pathogens (Metcalfe and Eddy, 2004). The presence of Escherichia coli indicates the
presence of fecal pollution. Escherichia coli is a bacterium of enteric origin and its
occurrence and abundance allows for its use in defining the sanitary quality of water and
wastewater. The World Health Organization has established a maximum level of 1000
fecal coliform units (FCU)/100 mℓ for Category “A” water quality (Liberti et al., 2000).
There are many disinfection techniques in use (Table 2.3) (Ahuja, 2009), The commonly
used disinfectants include chlorination; UV irradiation and ozonation. Apart from these,
other forms of disinfection include the application of calcium hypochlorite (DWAF
2002).
2.2.4.2. a. Chlorination
Chlorine has been the dominant disinfectant of wastewater (WISA, 2002). For many
years, wastewater treatment plant designers selected chlorine because of its ability to
disinfect wastewater with relatively low doses, its simple feed and control procedures,
and its low cost compared with other substances (WEF, 2008a). It is also relatively easy
to handle and cost effective (Gray, 1999). Disinfection is effected as chlorine oxidizes
cellular material and causes destruction of proteins when critical enzymes are inactivated.
2.2.4.2. b. Ultraviolet Radiation
With the proper dosage, ultraviolet radiation has proved to be an effective bactericide and
vircide for wastewater, while not contributing to the formation of toxic products
(Tchobanoglous et al., 2004). The mode of disinfection is by ultraviolet light which
inhibits cellular replication by alteration of cellular genetics and thereby inactivating

23
bacteria and viruses. At a wavelength of 253.7 nm, ultraviolet light can inactivate
microorganisms without significantly altering the effluent`s physical and chemical
properties and unlike chlorine, UV light leaves no residual that can affect receiving
waters; it adds nothing but energy, which produces some heat (WEF, 2008a).
2.2.4.2. c. Ozonation
Ozone is an extremely reactive oxidant, and it is generally believed that bacterial kill
through ozonation occurs directly because of cell wall disintegration (Tchobanoglous et
al., 2004). At a dosage rate of 1ppm, ozone destroys all bacteria within ten minutes. The
bacteria are destroyed as a result of protoplasmic oxidation, which causes disintegration
of the bacterial cell wall. When ozone decomposes in water, it results in the formation of
the free radicals hydrogen per-oxy and hydroxyl which have great oxidizing capacity and
play an active role in disinfection (WEF, 2008a).
Ozone is generated on site by photochemical or electrical excitation methods; is more
costly when compared to the cost of chlorination and it has to be manufactured on site.

24
Table 2.3: Characteristics of commonly used disinfectants (Ahuja, 2009).
2.2.5 Solids Treatment
Primary tank sludge usually undergoes thickening to increase its solids content prior to
subsequent sludge treatment processes of anaerobic digestion and dewatering. This is
necessitated since untreated sludge from the primary and secondary sedimentation tanks
have a high water content (Tchobanoglous et al., 2004). Thickening also aids in reducing
25
the cost of sludge treatment. Sludge produced in wastewater treatment plants amounts to
a small percentage (1%) of the volume of treated wastewater, while the processes for
sludge treatment and disposal represent from 20% to 60% of operating costs,
incorporating manpower, energy and sludge disposal costs (Foladori et al., 2010).
Following primary sedimentation and thickening, wastewater solids are treated in
anaerobic digesters. The anaerobic digestion of sludge is a tertiary treatment stage that
stabilizes surplus sludge generated through the sewage treatment process (DWAF, 2002).
Enabled by biological degradation of organic compounds, anaerobic digestion destroys a
major portion of the volatile solids in sludge (thereby reducing the sludge volumetrically)
and minimizing putrefaction. This process of digestion converts the raw sludge from a
smelly putrescible nature to a substance that is relatively odour-free, readily dewaterable
and sufficiently stabilized to be disposed of without causing nuisance conditions, (Boyd
and Mbelu, 2009).
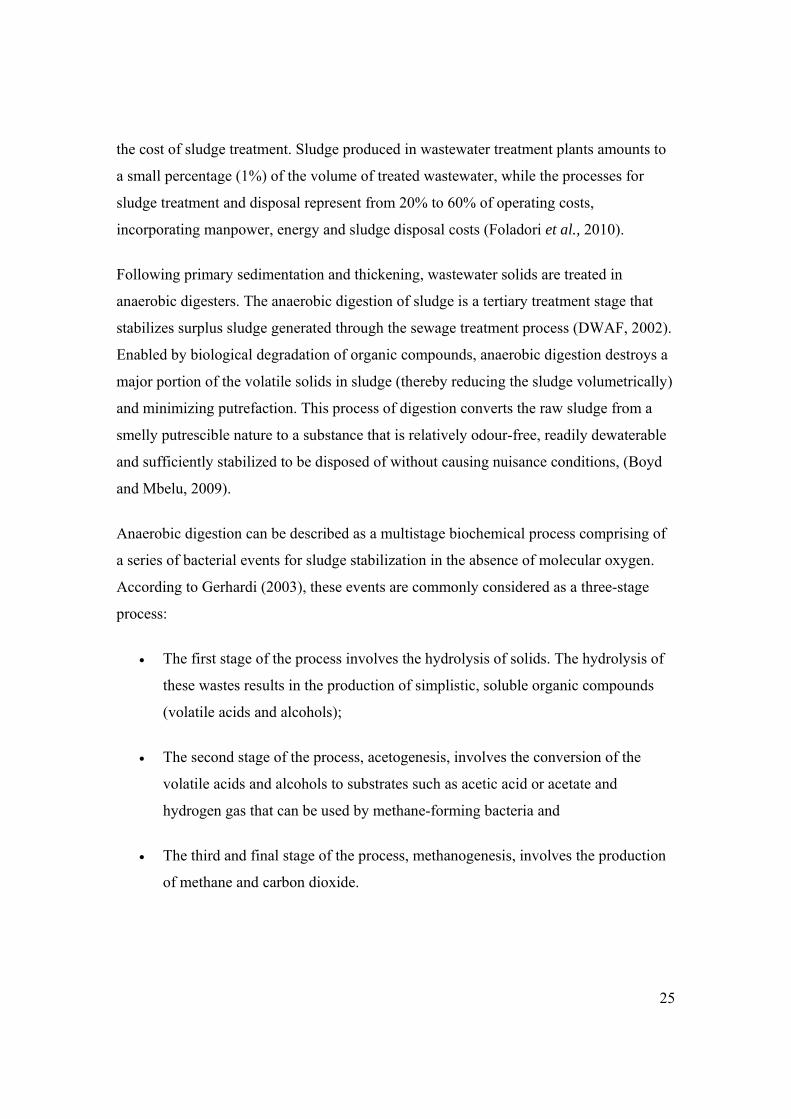
Anaerobic digestion can be described as a multistage biochemical process comprising of
a series of bacterial events for sludge stabilization in the absence of molecular oxygen.
According to Gerhardi (2003), these events are commonly considered as a three-stage
process:
The first stage of the process involves the hydrolysis of solids. The hydrolysis of
these wastes results in the production of simplistic, soluble organic compounds
(volatile acids and alcohols);
The second stage of the process, acetogenesis, involves the conversion of the
volatile acids and alcohols to substrates such as acetic acid or acetate and
hydrogen gas that can be used by methane-forming bacteria and
The third and final stage of the process, methanogenesis, involves the production
of methane and carbon dioxide.
26
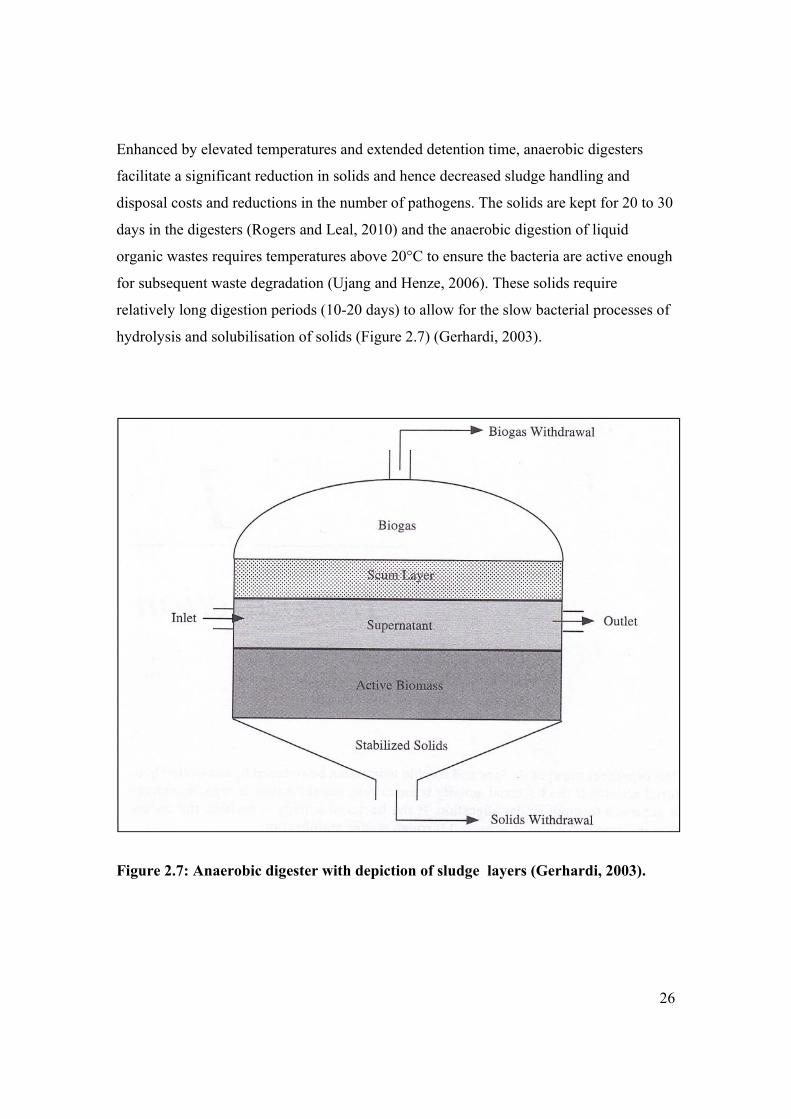
Enhanced by elevated temperatures and extended detention time, anaerobic digesters
facilitate a significant reduction in solids and hence decreased sludge handling and
disposal costs and reductions in the number of pathogens. The solids are kept for 20 to 30
days in the digesters (Rogers and Leal, 2010) and the anaerobic digestion of liquid
organic wastes requires temperatures above 20°C to ensure the bacteria are active enough
for subsequent waste degradation (Ujang and Henze, 2006). These solids require
relatively long digestion periods (10-20 days) to allow for the slow bacterial processes of
hydrolysis and solubilisation of solids (Figure 2.7) (Gerhardi, 2003).
Figure 2.7: Anaerobic digester with depiction of sludge layers (Gerhardi, 2003).

27
Apart from generating stabilized sludge solids, anaerobic digestion produces a mixture of
gases which are collectively termed digester gas or biogas which consists mostly of
methane and carbon dioxide. The gases produced in largest quantities are methane and
carbon dioxide and by volume, methane is 60% to 65%, and carbon dioxide is 35% to
40% (Gerhardi, 2003).
Of significant value in terms of energy generation, is methane since it is a flammable,
odourless gas and can be used as a fuel source. Most municipal wastewater treatment
plants use biogas to heat digesters to 32-35°C (Gerhardi, 2003). Furthermore, anaerobic
digestion of wastewater sludge can, in many cases, produce sufficient digester gas to
meet most of the energy needs for plant operation (Tchobanoglous et al., 2004).
Following anaerobic digestion, the stabilized sludge needs to be dewatered for disposal.
One of the major destinations for sludge in many areas, especially in the past, was the
nearby ocean, although recently many countries have introduced laws for marine
pollution control, which do not permit sea dumping (Foladori et al., 2010). Options for
safe and beneficial disposal include agricultural use, landfill and incineration. The sludge
is digested or broken down to a stable mass by the action of microorganisms and
thereafter it is dried and stored on site or disposed of at a landfill site (WISA, 2002).
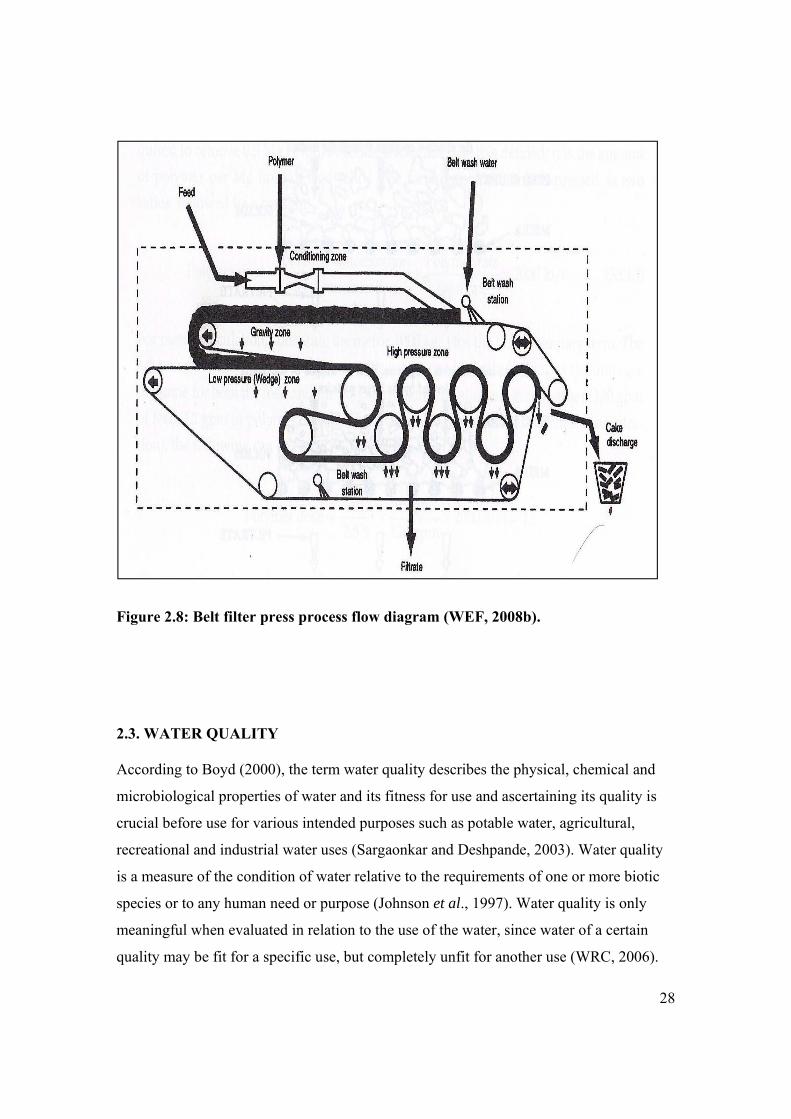
Dewatering is carried out by mechanical means such as a filter press and by non-
mechanical methods which include application on drying beds (Figure 2.8). The main
aim of dewatering is to eliminate as much water as possible to produce a non-fluid
material whose solid concentration is higher than 20% of total solids. (Ujang and Henze,
2006).
Drying beds are the cheapest and simplest form of dewatering (Gray, 1999). They
consume less energy but require greater land extension, and more manual labour, mainly
to handle the sludge cake (Ujang and Henze, 2006).
28
Figure 2.8: Belt filter press process flow diagram (WEF, 2008b).
2.3. WATER QUALITY
According to Boyd (2000), the term water quality describes the physical, chemical and
microbiological properties of water and its fitness for use and ascertaining its quality is
crucial before use for various intended purposes such as potable water, agricultural,
recreational and industrial water uses (Sargaonkar and Deshpande, 2003). Water quality
is a measure of the condition of water relative to the requirements of one or more biotic
species or to any human need or purpose (Johnson et al., 1997). Water quality is only
meaningful when evaluated in relation to the use of the water, since water of a certain
quality may be fit for a specific use, but completely unfit for another use (WRC, 2006).

29
From a human perspective water quality has implicit reference to safety, since safe
drinking water and sanitation is an essential human right (WATER 21, 2013).
Water quality is impacted upon by human activities which include agricultural activities,
urban and industrial development, mining and recreation as well as by natural processes
such as seasonal variation, climatic changes and the types of soils, rocks and surfaces
through which it flows. These impacts influence the water use potential and hence, it is
important to ascertain the quantities and the proportional presence of different types of
impurities in water which are determined by the nature of the water source (Figure 2.9)
(Polasek et al., 2005). Water availability, its quality and its suitability has been ever
deteriorating due to climate change and direct human impacts on water resources Jähnig,
(2010).
Figure 2.9: Land use activities generating a groundwater pollution threat (Kresic,
2009).

30
Deteriorating water quality increases treatment costs of potable and industrial process
water, and decreases agricultural yields as a consequence of increased impurities in
irrigation water. The effects of consumption of water of poor quality on human health, on
the aquatic ecosystem (aquatic biota, and in-stream and riparian habitats) as well as
various sectors of the economy, including agriculture, industry and recreation, can have
disastrous consequences. Toxic substances coupled with high populations of certain
microorganisms such as cyanobacteria may present a health hazard for non-drinking
purposes such as irrigation, swimming, fishing, rafting, boating, and industrial
application (Table 2.4). Cyanobacteria are commonly found in freshwater systems that
are the source waters for the production of drinking water. This is of special importance
to the drinking water suppliers as several genera of cyanobacteria can produce
cyanotoxins that can affect human health (Water SA, 2007).
Table 2.4: Diseases generally transmitted by contaminated drinking water (Gray, 1999).
31
2.3.1 Water Quality Parameters
Since water is one of the most valuable and essential resources that form the basis of all
life, accurate monitoring and assessment of our water resources is necessary for sustained
water resource management (Hodgson and Manus, 2006). Assessment of water quality is
critical for pollution control and the protection of surface and ground waters (Gray,
1999). The regimen of monitoring and assessment is enabled by comparison with
established water quality parameters which are broadly categorized as physical; chemical
and microbiological parameters. The quality of water is typically determined by
monitoring microbial presence, especially fecal coliform bacteria, and physico-chemical
properties (Gray, 1994). Water quality is determined by measurement against a set of
standards or scientifically determined parameters by which compliance can be assessed.
The parameters for water quality are determined by its intended use.
Traditional approaches to assessing water quality are based on a comparison of
experimentally determined parameter values with existing guidelines (Boyacioglu, 2007).
Water quality guidelines for South Africa are grouped according to potential user types
(e.g. domestic, industrial) in the 1996 Water Quality Guidelines (DWAF, 1996). Drinking
water quality is subject to the South African National Standard (SANS) 241 Drinking
Water Specification (Hodgson and Manus, 2006).
2.3.1.1 Physico-chemical Parameters
These parameters, as the name suggests, refer to physical or chemical quality effects on
water. Physico-chemical constituents include: chemical oxygen demand; dissolved
oxygen; electrical conductivity; pH; dissolved/suspended solids; turbidity; ammonia;
chlorides; permanganate value; nitrites and nitrates.
2.3.1.1.a. Chemical Oxygen Demand (COD).
COD is a measure of the oxygen equivalent of the organic matter content of a sample that
is susceptible to oxidation by a strong chemical oxidant (DWAF, 1996c). According to
32
King et al., (2003) COD is a measure of the oxidation of reduced chemicals in water.
COD is determined by means of a test which measures the amount of oxygen consumed
to chemically oxidize organic water contaminants to inorganic end products. The test is
based on the chemical decomposition of substances that are dissolved or held in
suspension in water. The results of this test indicates the amount of dissolved oxygen that
was consumed and consequently the higher the COD, the higher the presence of
contaminants in the sample and vice versa.
2.3.1.1.b. Dissolved Oxygen (DO)
Dissolved oxygen is a relative measurement of the amount of oxygen dissolved or carried
in a given sample. It is a measure of the amount of gaseous oxygen that is dissolved in
water. Oxygen enters the water body through diffusion, from the surrounding atmosphere
by aeration and by photosynthesis. Adequate DO is a requisite for good water quality.
Most aquatic organisms depend wholly on the oxygen dissolved in water for their
survival. Hence, maintaining adequate dissolved oxygen levels is crucial for the survival
and functioning of these organisms. A well-mixed water body is generally fully saturated
at approximately 10mg/l of DO at 15 degrees celsius. Generally, a lack of DO in natural
waters creates the most problems, specifically an increase in tastes and odours as a result
of anaerobic decomposition (Ritter, 2010). Insufficient DO in water results in a condition
known as hypoxia which is caused by decomposing organic matter. Insufficient oxygen
in water negatively impacts on the aquatic organisms including fish. When DO levels
drop to below 5mg/l, aquatic organisms are put under stress. DO levels that remain below
1-2mg/l for a few hours can cause major fish kills. Oxygen depletion (low DO) is also
sometimes experienced in eutrophic conditions accompanied by turbid conditions, algal
blooms, pathogens, and habitat loss (Obeng, 2010).
33
2.3.1.1.c. Electrical Conductivity (EC).
Electrical conductivity is a measure of the ability of the water to conduct an electric
current (WRC, 2006); and it is a measure of the total amount of dissolved material in a
water sample (Dallas and Day, 2004). Additionally, conductivity measurements are used
to establish the degree of mineralization of water to assess the effect of the total
concentration of ions, which is particularly relevant to corrosion rates; and to evaluate
variations in the concentration of dissolved minerals in a water source (Ritter, 2010). This
test measures the salinity derived from the total dissolved inorganic compounds as well
as other substances that have a potential to carry an electric charge, such as nitrates and
phosphates. It is a general indicator of water quality change. Conductivity increases in
direct proportion to dissolved ion concentrations (Boyd, 2000). Hence the higher the
inorganic dissolved solids concentration of water, the higher the conductivity and vice
versa. Conductivity may also increase naturally when metals within the bedrock are
dissolved and taken up by the river current (Kadewa, et al., 2005). However, rivers with
granite bedrock have a lower conductivity than rivers with runoff containing clay
particles since the minerals in clay ionize more readily in water. A decrease in
conductivity may also result from high rainfall as a result of the natural dilution potential
caused by the additional rainfall.
2.3.1.1. d. pH
pH is a measure of the acidity or alkalinity of a solution. pH is dependent on the carbonic
acid equilibrium of water as explained by Cooke (2006): '' when carbon dioxide from the
air enters freshwater, small amounts of carbonic acid are formed which then dissociate
into hydrogen ions and bicarbonate ions''. This hydrogen ion concentration is measured as
pH. pH controls many chemical reactions, including coagulation; disinfection; water
softening; corrosion; biochemical reactions and ammonia removal (Ritter, 2010).
Variation in pH has wide ranging effects of water chemistry and hence on the aquatic
ecosystem. Human induced pH variation can arise from industrial discharges; mining
34
activities and farming. Extensive research has been done on the toxic effects of pH on
fish, (Ingersoll et al., 1985); (Wendelaar et al., 1986); (Henriksen et al., 1987) and (Hall,
1987). Most fresh waters in South Africa are relatively well buffered and more or less
neutral, with pH ranges between 6 and 8 (Day and King, 1995). At a pH level of 9 and
above the membranes of fish are denatured. pH levels below 4.5 renders the water
unsuitable for aquatic organisms since at low pH levels release of metals that could
contain toxins is accelerated from rocks in and around the river and this could be toxic to
aquatic organisms. Also, organic substances like plant debris will not undergo
decomposition and fish eggs will not hatch. Hence the ideal pH range for most surface
water is 6 to 8 (Dallas and Day, 2004); (DWAF, 1996).
2.3.1.1. e. Total Dissolved Solids (TDS)
TDS a measure of all the compounds dissolved in water and is directly proportional to
electrical conductivity. TDS represents the total quantity of organic and inorganic
dissolved material in the water (Dallas and Day, 2004). In natural waters, the biggest
contributor of such compounds is inorganic ions. TDS is likely to increase as water
moves downstream as salts are being added both naturally and by human intervention. In
natural waters, the biggest contributor of such compounds is inorganic ions such as
calcium; magnesium; sodium and potassium. Many human activities have induced
increased TDS levels in water. Apart from the obvious effects of discharging saline
industrial effluents into rivers or lakes, increasing TDS levels may be caused by
irrigation; clear felling and return of large quantities of sewage effluent to inland waters
(Dallas and Day, 2004). Storm flows have a tendency to decrease the concentration of
TDS by its dilution effect. The presence of salts affects plant growth in three ways:
Osmotic effects, caused by the total dissolved salt concentration in the soil water;
Specific ion toxicity, caused by the concentration of individual ions; and
Soil particle dispersion, caused by high sodium and low salinity (Tchobanoglous et al., 2004).
35
With aquatic organisms, physiological adaptation to changes in salt concentrations are
enabled when these changes occur slowly. It is often the rate of change rather than the
final salinity that is most critical (Dallas and Day, 2004).
2.3.1.1. f. Suspended Solids
Suspended solids are defined as solids that are relatively large and settle easily under
quiescent conditions (WRC, 2006). This is a measure of the amount of solid sediments
carried in suspension by the water. Usually, the higher the sediment concentration, the
poorer the water quality is. Sediment alone, diminishes water suitability especially for
urban supply, recreation, industrial consumption and aquatic life. As suspended solids
settle out they may smother or abrade benthic fauna and impair gill function and foraging
efficiency in fish (Dallas and Day, 2004). Additionally chemicals and wastes attach onto
suspended solid particles. Wash off, and hence a reduction of suspended solids may result
from storm flows.
2.3.1.1. g. Turbidity
Turbidity measures the light-transmitting properties of water and is an indication of the
cloudiness or clarity of water. In South Africa, turbidity is still considered to be the most
important pollution indicator, which is used exclusively in most waterworks for
monitoring their performance and for control of the required dosing rate of destabilization
agents (Water SA, 2005). The removal of turbidity by any treatment process is important
for subsequent treatment processes (WRC, 2013). Waters showing very little light
scattering produce low-turbidity measurements; those with a great deal of light scattering
have high turbidity. It is an indication of the extent of suspended matter in water and
influences the microbial water quality. Turbidity is commonly quantified by the use of
instruments that project a beam of light into a small volume of water, with the amount
that is reflected at a 90 degree angle measured. This process is termed nephelometry, and
36
the units are called nephelometric turbidity units (NTU`s). Turbidity, usually reported in
Nephelometric Turbidity Units is largely a function of suspended particulate material
concentrations in the water sources (African Journal of Aquatic Science, 2007). The
majority of natural waters have turbidities less than 50 NTU`s, but values can range from
1 NTU to 1000 NTU or more (Boyd, 2000). Higher turbidity levels are often associated
with higher levels of disease-causing microorganisms such as viruses, parasites, and
some bacteria. High turbidity reduces water clarity and impedes light penetration which
is essential for photosynthesis. Hence the activity of primary producers such as
peryphyton and macrophytes decreases as a result of reduced light penetration and
consequently the food availability for organisms higher in the food chain is reduced.
According to Wood and Armitage (1997), fish are adversely affected by elevated
turbidity and suspended sediment concentrations by impairment of gill function; reduced
resistance to disease; reduced spawning habitat; reduced food availability and
interference with hunting efficiency. Elevated turbidity levels are caused by overgrazing;
non-contour ploughing removal of riparian vegetation; industrial discharges; mining
activities and flooding.
2.3.1.1. h. Ammonia; Nitrites and Nitrates
The most common and important forms of nitrogen are ammonia; nitrite; nitrate and
nitrogen gas. The nitrogen cycle starts with the absorption of nitrates by microscopic and
aquatic plants as certain bacteria in the soil and water convert atmospheric nitrogen into
nitrate, a process called nitrogen fixation (Miller, 2005). The nitrogen cycle involves
losses and gains that are physically related to use of fertilizers, farm wastes, sewage and
industrial activities (Hall, 2003). Sources of ammonia include: sewage discharges;
industries using ammonia or ammonium salts; industrial discharges and commercial
fertilizers. In surface or ground water ammonium generally results from the
decomposition of nitrogenous organic matter, and is one of the constituents of the
nitrogen cycle (Table 2.5) (Dallas and Day, 2004). Ammonia is a common pollutant and
is one of the nutrients contributing to eutrophication (DWAF, 1996).
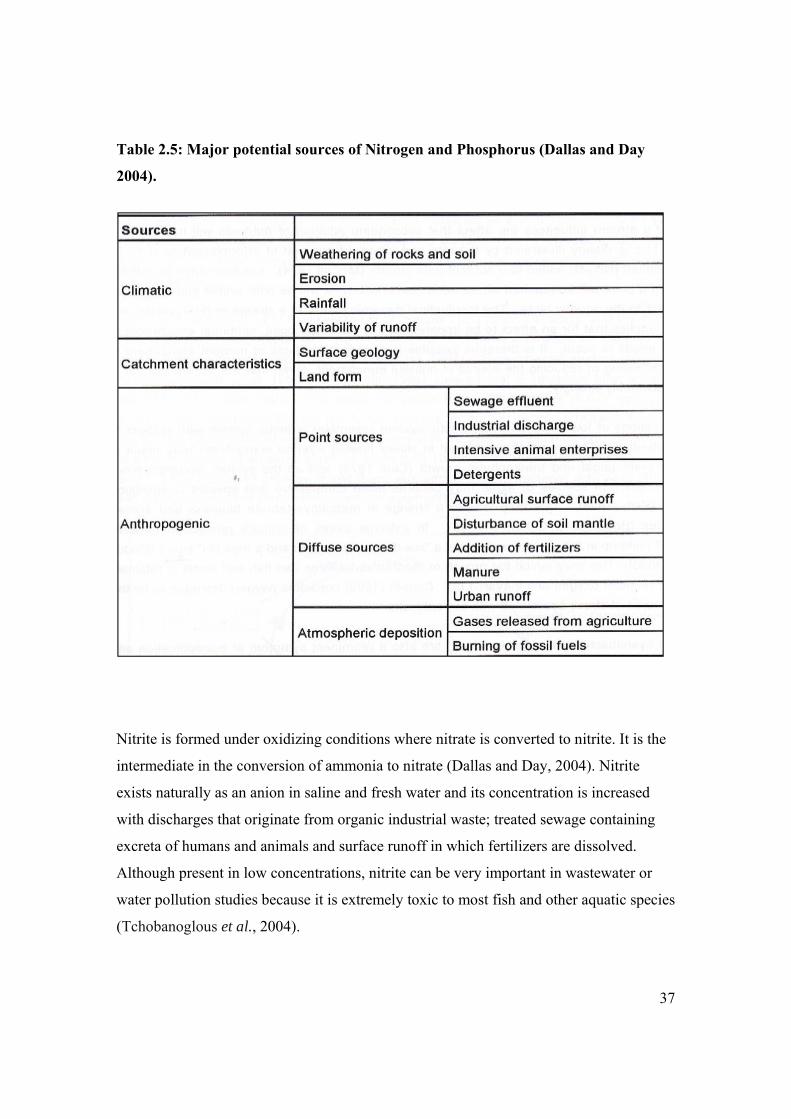
37
Table 2.5: Major potential sources of Nitrogen and Phosphorus (Dallas and Day
2004).
Nitrite is formed under oxidizing conditions where nitrate is converted to nitrite. It is the
intermediate in the conversion of ammonia to nitrate (Dallas and Day, 2004). Nitrite
exists naturally as an anion in saline and fresh water and its concentration is increased
with discharges that originate from organic industrial waste; treated sewage containing
excreta of humans and animals and surface runoff in which fertilizers are dissolved.
Although present in low concentrations, nitrite can be very important in wastewater or
water pollution studies because it is extremely toxic to most fish and other aquatic species
(Tchobanoglous et al., 2004).
38
Nitrates are produced when nitrogen or ammonia is oxidized. Nitrates are the end
products of aerobic stabilization of organic nitrogen (Dallas and Day, 2004). Owing to
their soluble nature, nitrates are easily transported in rivers and groundwater (Murphy,
2006). Hence nitrates are ubiquitous in aquatic environments. However, nitrate removal
by conventional physico-chemical water treatment technologies is usually very expensive
and/or very energy consuming (Rocca et al., 2007). Nitrates are generated by both natural
and human sources. In South Africa the most extreme nitrate concentrations are caused
through point-source pollution (Holtzhausen, 2005). Non-point sources include,
excessive fertilization of agricultural land which has generally been reported as one of the
key factors influencing the nitrate groundwater pollution (Yu et al., 2012). Nitrates
stimulate plant growth however, elevated nitrate concentrations in the aquatic
environment results in eutrophication. Nitrate and phosphate nutrients can lead to
eutrophication of waterways (Cheesman, 2005). High nutrient concentration in surface
water bodies, nitrogen and phosphorus in particular, is an increasing environmental
concern worldwide because it is a major reason for eutrophication of lakes and rivers (Yu
et al., 2012). The blanket term “eutrophication” refers to a collection of symptoms caused
by an overabundance of nutrients entering fresh, estuarine or marine waters (Burkholder,
2001). Epidemiological studies in Canada and South Australia have shown a statistically
significant increase in congenital malformations associated with nitrate-rich well water
(AWA, 1992). Generally, the discharge of nitrogen (the forms of which are ammonia,
nitrite and nitrate) to receiving waters leads to significant effects on water quality,
causing phytoplankton blooms and resulting in eutrophication of water bodies (Xia,
2008).
2.3.1.1. i. Chloride
Chloride is an anion of chlorine and they are essential components of living systems,
being involved in the ionic, osmotic and water balance of body fluids (Dallas and Day,
2004). Chloride ions are quite often the result of salt deposits that dissolve in water.
These salts may include: sodium chloride and magnesium chloride. Chloride inputs to
39
surface waters can arise from irrigation return flows, sewage effluent discharges and
various industrial processes (DWAF, 1996). Chloride is also found naturally in
groundwater because of leaching from rocks and soils in contact with the water body.
Chlorides in natural water result from the leaching of chloride-containing rocks and soils
with which water comes into contact, and in coastal areas from saltwater intrusion
(Tchobanoglous et al., 2004). Chloride is an aesthetic parameter, and as such may have
impacts on the taste; smell or colour of water. At high concentrations, chlorides cause
corrosion of piping and metals; causes water to have an unpalatable taste and in extreme
cases, may cause death in aquatic organisms. The extent of the presence of chloride may
also serve as an indication of deterioration in water quality.
2.3.1.1. j. Permanganate Value (PV4)
Potassium permanganate is utilized to quantitatively determine the total oxidisable
constituents in a water sample. Applications of potassium permanganate exploit its
oxidizing properties (Reides, 2002). The PV4 assesses the available oxygen or oxidizing
capacity of the water body and the extent of organic pollution. PV determines the
chemically oxidisable organic matter in a sample (Tamime et al., 1999). This assessment
is important in that when aquatic organisms, including microorganisms consume the
dissolved oxygen in water as part of their metabolism, the reduction in dissolved oxygen
may cause death in some of these organisms as well as cause other negative impacts on
water quality, as a result of reduced oxygen availability.
2.3.1.2. Microbiological Parameters
Microbiological assessment of water quality is essential in identifying the presence of
microorganisms associated with the transmission of water-borne diseases and the
presence of fecal pollution. Continuous fecal pollution in source water is a global
problem that is particularly debilitating to rural communities that are directly dependent
on untreated source water for all their domestic and other purposes (Bezuidenhout et al.,
40
2002). Ideally water destined for human consumption should be free from
microorganisms, however in practice this is an unattainable goal (Gray, 1999). In water
bodies contaminated by human and animal wastes, pathogenic microbes are often widely
present (Naidoo, 2005). It is impractical to monitor all types of microorganisms in
wastewater on a regular basis; therefore indicator organisms are measured as surrogates.
(Tempelton and Butler, 2011). In addition, the tests required to detect specific pathogens
are still considered time intensive and expensive (Ritter, 2010). Indicator organisms are
used to give an indication of the possible presence of pathogens (WRC, 2006); and
provide evidence of fecal contamination from humans or warm-blooded animals (Ritter,
2010). The most common indicator organisms are total and fecal coliforms (Tempelton
and Butler, 2011). Therefore, if these organisms are found in water, this is an indication
of fecal contamination and renders the water unsafe to consume without adequate
disinfection. Fecal indicator bacteria are considered to be useful indicators of fecal
contamination of the aquatic environment, generally associated with an increased risk of
contracting gastrointestinal and respiratory illness (Haile et al., 1999). Escherichia coli
(E.coli) is used as a bacterial indicator of fecal pollution by warm-blooded animals
(generally interpreted as human fecal pollution). E.coli may comprise up to 97% of
coliform bacteria in human feces. It is a bacterium of enteric origin whose occurrence and
abundance allows for its use in defining the sanitary quality of water and wastewater
(Liberti et al., 2000). The presence of E.coli is an indicator of the potential presence of
other microbial pathogens including viruses and parasites, as well as bacterial pathogens
such as salmonella spp., Shingella spp., Vibrio cholerae spp., campylobacter jejuni .,
Campylobacter coli and Yersinia enterocolitica. These bacteria are responsible for
gastrointestinal diseases such as gastroenteritis, salmonellosis, dysentery, cholera and
typhoid fever (DWAF, 1996e).
2.3.2 Water Quality Legislation
Water is one of the most valuable and essential resources that form the basis of all life
(Govender et al., 2007). However it is the most poorly managed resource in the world
41
(Kadewa et al., 2005); and humans have a habit of using water as if there is an unlimited
supply (Rogers and Leal, 2010). The self-purification capacity of many rivers has been
exceeded, and they now serve as wastewater collectors in many cities around the world.
The most obvious effect is growing water stress (insufficient water supplies) occurring
broadly around the world (Daigger, 2009). It was predicted in 1989 that in the continent
of Africa by 2025, there would be a significant water crisis with two-thirds of the
population being water stressed (Showers, 2002). A recent study commissioned by the
Water Research Commission describes South Africa’s freshwater ecosystems as “in a
shocking state” with 82%, 65% and 57% of estuarine, wetland and river ecosystem types
respectively threatened (WRC, 2011). These problems are further compounded by the
zero dilution capacity of many rivers in South Africa which means that all pollutants and
effluent streams will increasingly need to be treated to ever higher standards before being
discharged into communal waters or deposited in landfills (Turton, 2008). In the absence
of water management related regulation or lack of effective and efficient regulation,
water quality will deteriorate to critical levels. This deterioration of water resources needs
to be controlled through effective and feasible concepts of urban water management
(Nhlapi and Gijzen, 2005). In addressing water quality management, South Africa has
revised its water policy to facilitate the protection; sustainable utilization; conservation;
management and regulation of its limited water resources. To give effect to this
endeavour, water quality management in South Africa is governed by a hierarchical suite
of environmental legislation, which include: The Constitution of the Republic of South
Africa Act No. 108 of 1996, which is the supreme law of the country; framework
environmental legislation such as the National Environmental Management Act No. 107
of 1998; as well as sectorial environmental legislation such as The National Water Act
No 36 of 1998; The National Water Resources Strategy and The South African Target
Water Quality Guidelines(TWQGR).

42
2.3.2.1. The Constitution of the Republic of South Africa Act No. 108 of 1996.
The Bill of rights, embodied in the Constitution includes the following water related
principles:
Achieving of equitable access to water, which includes equity of access to the
provision of water services; the utilization of water resources and to the benefits
derived from the use of water resources.
Achieving sustainable water utilization through progressive adjustments to water
use in order to achieve a balance between water availability and water
requirements and by taking steps to protect water resources.
Achieving effective and efficient water utilization to optimize social and
economic benefit.
In South Africa water is treated, first and foremost, as a social commodity to which
people and the aquatic environment have a legal protected right (Du Plessis, 2003).
Section 24 of the Constitution prescribes that every person shall have the right to an
environment which is not detrimental to his or her well-being. The Constitution also
refers to measures for preventing pollution and ecological degradation; promoting
conservation and ecologically sustainable utilization and development of natural
resources. This creates imperatives for pollution prevention; prevention of ecological
degradation and sustainable utilization of aquatic resources.
2.3.2.2. The National Water Resources Strategy (NWRS).
The NWRS divides the country into 19 water management areas, each being managed by
a catchment management agency. This serves as a framework for the protection;
utilization; conservation; management and regulation of South Africa`s water resources.
According to Section 5(4)(a) of the NWRS, its purpose is to set out the strategies,
objectives, plans, guidelines and procedures of the minister and institutional

43
arrangements relating to the protection, use development, conservation, management and
control of water resources within the framework of existing relevant government policy
to achieve:
The purpose of this Act
Any compulsory national standards prescribed under Section 9(1) of the
Water Services Act, 1997 (Act No 108 of 1997); (W&S AFRICA, 2012).
2.3.2.3. The National Water Act (NWA) No. 36 of 1998.
The NWA supplies the regulatory background for water resource management. The
concepts of Resource Quality Objectives and Resource Quality that were introduced by
the NWA necessitate that water quality management also takes responsibility for the
management of the aquatic ecosystem quality (in-stream and riparian habitat, and aquatic
biota quality). Protection of basic human and ecological needs, economic efficiency and
social equity are the most important pillars guiding water resource allocation and use
under the new National Water Act of South Africa (Water SA, 2005. It is a challenge to
balance economic and social development with sustainable use of water resources. This
challenge is referred to in the NWA as the aim to balance long-term protection of water
resources. Chapter 14 of the NWA provides for the monitoring of the quality of South
Africa’s water resources, since what cannot be measured, cannot be managed (Schreiner
and Hassan, 2011). Section 26(1) of the NWA provides for the use of water resources to
be monitored, measured and recorded; the prohibition of any activity for the protection of
a water resource as well as the requirement for waste treatment before discharge into a
water resource. The objective of the NWA is to ensure that the country’s water resources
are protected, utilized, developed, conserved, managed and regulated in accord with the
following considerations:
Meeting the basic needs of the present as well as future generations;
The promotion of equitable access to water;

44
Redress of past racial and gender discrimination;
The promotion of efficient, sustainable and beneficial utilization of water in the public interest;
Facilitation of social and economic upliftment;
Provision for increasing demands for water use;
Protection of aquatic and related ecosystems as well as their biological diversity;
Reduction and prevention of pollution and degradation of water resources;
Honoring international obligations and
Promotion of dam safety and management of flood and drought situations.
The NWA introduced Water Management Areas; Catchment Management Agencies;
Integrated Catchment Management and Catchment Forums to facilitate the objectives
listed above.
2.3.2.4. The National Environmental Management (NEMA), Act No. 107 of
1998.
NEMA provides umbrella legislation by establishing principles and determining
procedures for co-operative governance and co-ordinated environmental functions
exercised by organs of the state. It identifies institutions that promote cooperative
governance and determines the procedures to co-ordinate environmental functions of
state departments.
2.3.2.5. The South African Water Quality Guidelines (TWQGR).
A target range for water quality has been set by the Department of Water Affairs, as a
response to increasing deterioration of South Africa`s water resources. The water quality
guideline approach is based on the principle that receiving waters have a capacity to
assimilate pollution up to a point at which it becomes detrimental towards specified water

45
users (Fruggle and Rabie, 2003). The natural assimilative capacity of river water is
breached when there is excessive discharge of undesirable substances in the river water.
TWQGR provides for the acceptable level or range at which a substance may be found in
water so as not to compromise the water quality and cause a detrimental effect on water
quality. This “no effect range” is the range of concentrations or levels at which the
presence of a constituent would have no known or anticipated adverse effect on the
fitness of water for a particular use or on the protection of aquatic ecosystems (DWAF,
1996). The TWQGR applies to water use for irrigation; livestock watering; domestic use;
aquatic ecosystems; industrial and recreational use.
2.4. ANTHROPOGENIC IMPACTS
Anthropogenic impacts are a reference to those human activities that have an influence
on water quality. Eutrophication is often a consequence of human activities such as
agriculture; urbanization and industrialization (Varioli et al., 2005). Domestic and
commercial activities contribute synthetic organic chemicals to wastewater discharges;
agricultural runoff; urban runoff and leachate from contaminated soils and such organic
contaminants include pesticides (such as atrazine and aldicarb), solvents and metal
degreasers (such as trichlorobenzene; tetrachloroethylene; trichloroethylene and
trichloroethane) and a family of compounds formerly in wide use, the polychlorinated
biphenyls (Ritter, 2010). Land based activities in the various river catchments greatly
affect the natural variation of water quality.
2.4.1. Agricultural; Forestry and Mining Activities
Related activities such as land clearance; irrigation; ploughing of fields; spreading of
fertilizers and pesticides on farmlands as well as livestock farming have significant
impacts on the quality of water. Soil disturbance accompanying forest ploughing,
drainage, road works and harvesting operations has the potential to cause large quantities

46
of sediment to enter the stream or river, resulting in increased turbidity and siltation
(Nisbet, 2001). The employment of poor farming methods (such as non-contour
ploughing), coupled with the injudicious or excessive application of fertilizers such as
urea, ammonium nitrate or ammonium phosphate may result in a washout of these
fertilizers into adjoining rivers periods of heavy rainfall, causing elevated concentrations
of nitrate, ammonium and phosphorus in receiving waters. Pressure to increase
productivity of agricultural systems in order to meet domestic and international demand
has resulted in the intensification of agriculture, exploitation of more land and greater
reliance on pesticides, fertilizers and imported animal feedstuff (Shabalala and Combrink,
2012). Typical sources of water pollution associated with agricultural systems include
livestock grazing, nitrates and phosphates in fertilizers, metals, pathogens, sediments and
pesticides (Shabalala and Combrink, 2012). Wastes discharges from livestock grazing are
rich in nitrogen and phosphorus and are bacteriologically contaminated (Shabalala and
Combrink, 2012). Excessive influx of fecal materials from anthropogenic sources and
animal farms can pose major problems due to the potential adverse health impacts when
the waters are to be used for potable, recreational and shellfish harvesting purposes
(Reeves et al., 2004). Impacts from forestry include removal of large canopy trees and
soil disturbance. Removal of forest cover reduces evapotranspiration of rainfall and
increases surface storm-water runoff, causing erosion and suspended sediment pollution
of receiving waters (Lee et al., 2004). Mining operations alter the land topography,
thereby causing high runoff rates; high turbidity and soil erosion. They produce increased
quantities of heavy metals in streams and such operations may also release a toxic mix of
metals and ore-extracting substances such as cyanide. Acids from mine drainage severely
affect water quality. Receiving waters from acidic coal mine drainage normally have a
very low pH (down to 2) and a high total dissolved solids (Dallas and Day, 2004).
2.4.2. Industrial Activities
Waste products from the oil and petrochemical industries include oils and oil emulsions
as well as chemical process effluent. Effluents from chemical industries often have high
loads of suspended solids and high oxygen demand (as a result of biodegradable organic
content and reducing chemicals such as sulphides), in addition to elevated concentrations
47
of trace metals, toxic inorganics (egg cyanides and fluorides) organic compounds and
nutrients (Dallas and Day, 2004). The lignin in wastewater from the pulp bleaching
process in the paper industry results in surface foaming. Textile industries discharge dyed
or discolored effluents which may contain chemicals that are toxic to aquatic organisms.
Various pollutants from power stations, waste disposal sites and agricultural lands
potentially can contaminate groundwater (Sargaonkar et al., 2008).
2.4.3. Urbanization
Urbanization entails the construction of buildings; roads; and sidewalks and the use of
chemicals for landscaping, which results in the increase of impervious surfaces that
accelerate runoff and pollution of the receiving water body. As urbanization occurs, soils
are covered by increasing quantities of impervious surfaces such as parking lots; roads;
sidewalks and rooftops which greatly reduces the ability of the earth to infiltrate
rainwater, turning much of it into storm water runoff (Ahuja, 2009). Some of the
numerous adverse effects on receiving waters from urban runoff include physical effects
such as flooding, erosion, sedimentation; physico-chemical effects such as elevated
temperatures, dissolved oxygen depletion, nutrient enrichment; toxicity and biological
effects such as reduced biodiversity (Marsalek et al., 2002). Ongoing urbanization in
recent decades has led to significant changes in both volume and quality of storm water
runoff (Figure 2.10) (Walsh et al., 2004). Urbanization affects flood runoff as it produces
impermeable surfaces and the construction of sewage and storm drains accelerate runoff.
Storm water runoff contains pollutants such as toxic chemicals; fecal contaminants;
metals and nutrients that accelerate eutrophication.
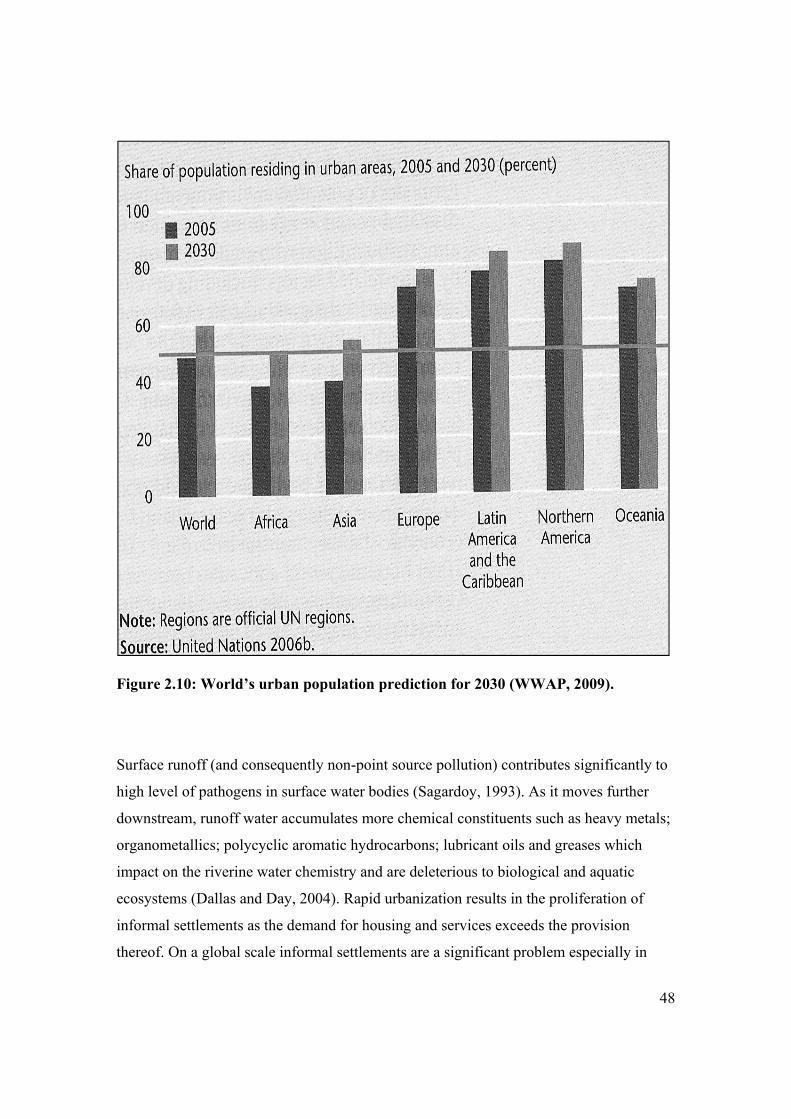
48
Figure 2.10: World’s urban population prediction for 2030 (WWAP, 2009).
Surface runoff (and consequently non-point source pollution) contributes significantly to
high level of pathogens in surface water bodies (Sagardoy, 1993). As it moves further
downstream, runoff water accumulates more chemical constituents such as heavy metals;
organometallics; polycyclic aromatic hydrocarbons; lubricant oils and greases which
impact on the riverine water chemistry and are deleterious to biological and aquatic
ecosystems (Dallas and Day, 2004). Rapid urbanization results in the proliferation of
informal settlements as the demand for housing and services exceeds the provision
thereof. On a global scale informal settlements are a significant problem especially in

49
third world countries housing the world`s disadvantaged (May et al., 1998). In 1994,
approximately 1.06 million households comprising 7.7 million people lived in informal
settlements (Statistics South Africa, 1997). Informal settlements are characterized by a
dense proliferation of small make-shift shelters built from diverse materials, degradation
of the local ecosystem and by severe social problems (Mazur, 1995). Often informal
settlements are constructed close to rivers, for access to water supplies and waste
discharges. In many instances sewage and excreta from these informal settlements are
discharged into storm water drainage pipes, which directly flow into nearby rivers
(Paulse et al., 2007). Fecal contamination from non-point agricultural pollution can also
cause deterioration of water quality by emitting significant levels of fecal bacteria and
nutrients to waterways (Monaghan et al., 2007). Fecal contamination of water catchments
occurs from natural wildlife as well as from anthropogenic sources (Mudge and Duce,
2005).
2.5. CONCLUSION
Wastewater, generated from human activities has many negative impacts if it is
inadequately treated. Adequate treatment necessitates various processes to ensure
compliance with discharge requirements and no adverse effects on the water quality of
the receiving water system. Processes for wastewater treatment are sequentially
categorized as physical; biological and chemical methods. The quality of water is
determined by comparison of the physico-chemical and microbiological assessment with
the legislated water quality guidelines. Water quality legislation in South Africa
facilitates holistic water management which includes its protection; sustainable utilization
and conservation. Anthropogenic activities are predominantly land based human
activities which result in a severe decline in water quality when the environmental
impacts are overlooked. These impacts include: washout of pesticides and fertilizers;
industrial waste discharges; runoff from informal settlements and impervious surfaces.

50
CHAPTER THREE
THE STUDY AREA
3.1. INTRODUCTION
The study area comprises three river systems of the eThekwini Municipality, each of
which receives a discharge exceeding 4 million litres per day from wastewater treatment
works located within their catchments, namely:
uMhlangane River into which the KwaMashu Wastewater Treatment Works
discharges (KWWTW);
uMgeni River into which the Northern Wastewater Treatment Works (NWWTW)
discharges, and
uMhlatuzana River into which the uMhlatuzana Wastewater Treatment Works
(UWWTW), discharges.
Using the location of discharge from these wastewater treatment works as the reference
point, the study area for each river is further subdivided as the riverine area upstream of
the discharge point and the riverine area downstream of the discharge point.
3.2. DESCRIPTION OF THE eTHEKWINI MUNICIPALITY (EM).
EM is located in the province of KwaZulu-Natal, which is one of nine provinces in South
Africa. The municipality operates 27 wastewater treatment works with a cumulative
treatment volume of 460 million liters of wastewater daily (WSDP, 2012). The region is
characterized by a typical warm sub-tropical climate of KwaZulu-Natal with an average
winter temperature of 16°C between the months of May to July and an average summer
temperature of 27°C between the much warmer months of January to March, coupled
with an average annual rainfall of 1054 mm mainly during the summer months
(MER/ERM, 2011). Approximately 80% of the annual rainfall is received in the
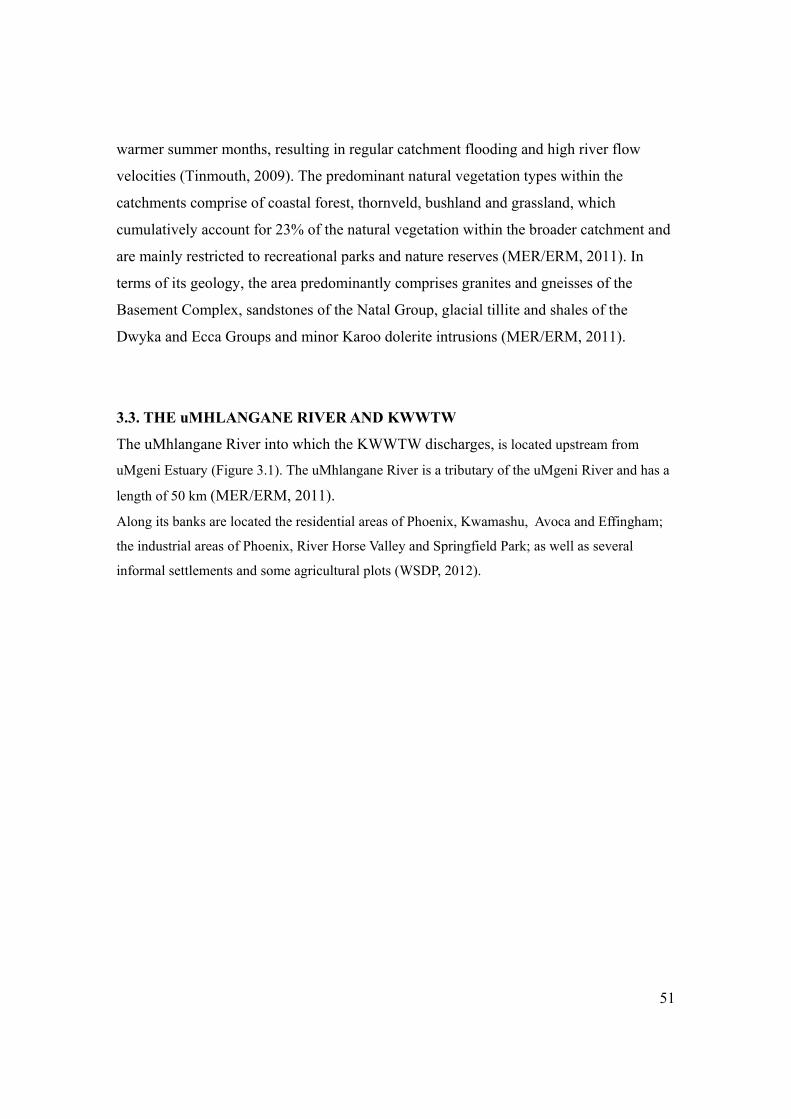
51
warmer summer months, resulting in regular catchment flooding and high river flow
velocities (Tinmouth, 2009). The predominant natural vegetation types within the
catchments comprise of coastal forest, thornveld, bushland and grassland, which
cumulatively account for 23% of the natural vegetation within the broader catchment and
are mainly restricted to recreational parks and nature reserves (MER/ERM, 2011). In
terms of its geology, the area predominantly comprises granites and gneisses of the
Basement Complex, sandstones of the Natal Group, glacial tillite and shales of the
Dwyka and Ecca Groups and minor Karoo dolerite intrusions (MER/ERM, 2011).
3.3. THE uMHLANGANE RIVER AND KWWTW
The uMhlangane River into which the KWWTW discharges, is located upstream from
uMgeni Estuary (Figure 3.1). The uMhlangane River is a tributary of the uMgeni River and has a
length of 50 km (MER/ERM, 2011).
Along its banks are located the residential areas of Phoenix, Kwamashu, Avoca and Effingham;
the industrial areas of Phoenix, River Horse Valley and Springfield Park; as well as several
informal settlements and some agricultural plots (WSDP, 2012).
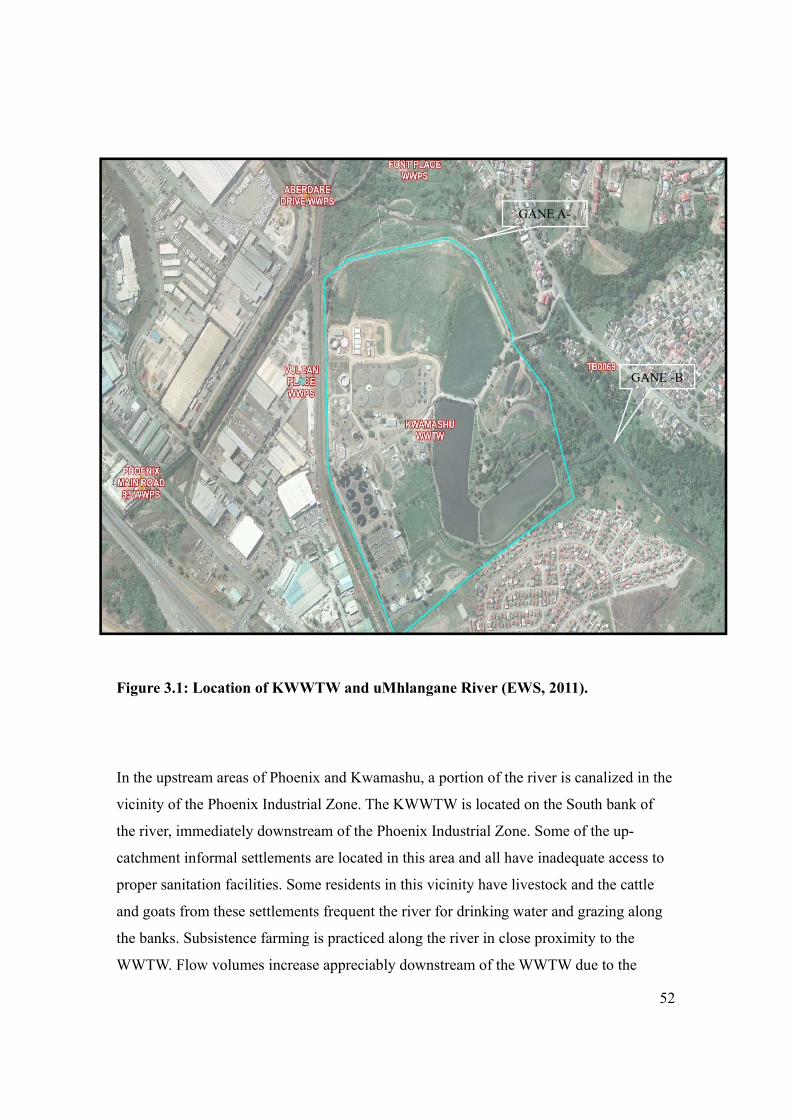
52
Figure 3.1: Location of KWWTW and uMhlangane River (EWS, 2011).
In the upstream areas of Phoenix and Kwamashu, a portion of the river is canalized in the
vicinity of the Phoenix Industrial Zone. The KWWTW is located on the South bank of
the river, immediately downstream of the Phoenix Industrial Zone. Some of the up-
catchment informal settlements are located in this area and all have inadequate access to
proper sanitation facilities. Some residents in this vicinity have livestock and the cattle
and goats from these settlements frequent the river for drinking water and grazing along
the banks. Subsistence farming is practiced along the river in close proximity to the
WWTW. Flow volumes increase appreciably downstream of the WWTW due to the
GANE A-
GANE -B
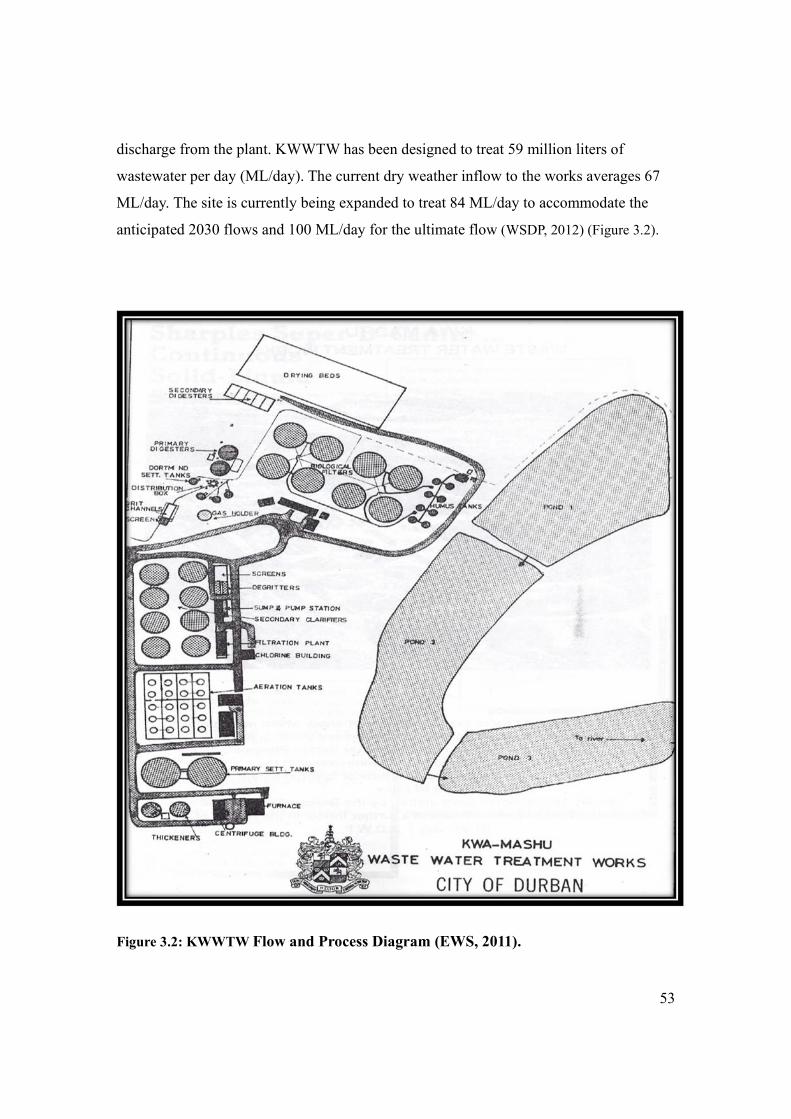
53
discharge from the plant. KWWTW has been designed to treat 59 million liters of
wastewater per day (ML/day). The current dry weather inflow to the works averages 67
ML/day. The site is currently being expanded to treat 84 ML/day to accommodate the
anticipated 2030 flows and 100 ML/day for the ultimate flow (WSDP, 2012) (Figure 3.2).
Figure 3.2: KWWTW Flow and Process Diagram (EWS, 2011).

54
The nature and extent of treatment is prescribed by the General Standard and Exemption Permit
1523 B, which is issued by the Department of Water. In terms of treatment standards,
KWWTW has been granted an Exemption Permit, No.1523B, which provides increased
discharge volumes and E.coli Limits of 1000cfu/100ml.
3.4. THE uMGENI RIVER AND NWWTW
The uMgeni River into which Northern Wastewater Works discharges has a catchment of
4416 km2 and a length of 255 km (WRC, 2002) (Figure 3.3). The river rises in the Dargle
Range at an altitude of about 1830 meters above sea level (Begg, 1989). At this point the
river flows through an undisturbed region.
Figure 3.3: Location of NWWTW and uMgeni River (EWS, 2011).
UMG-A UMG-B
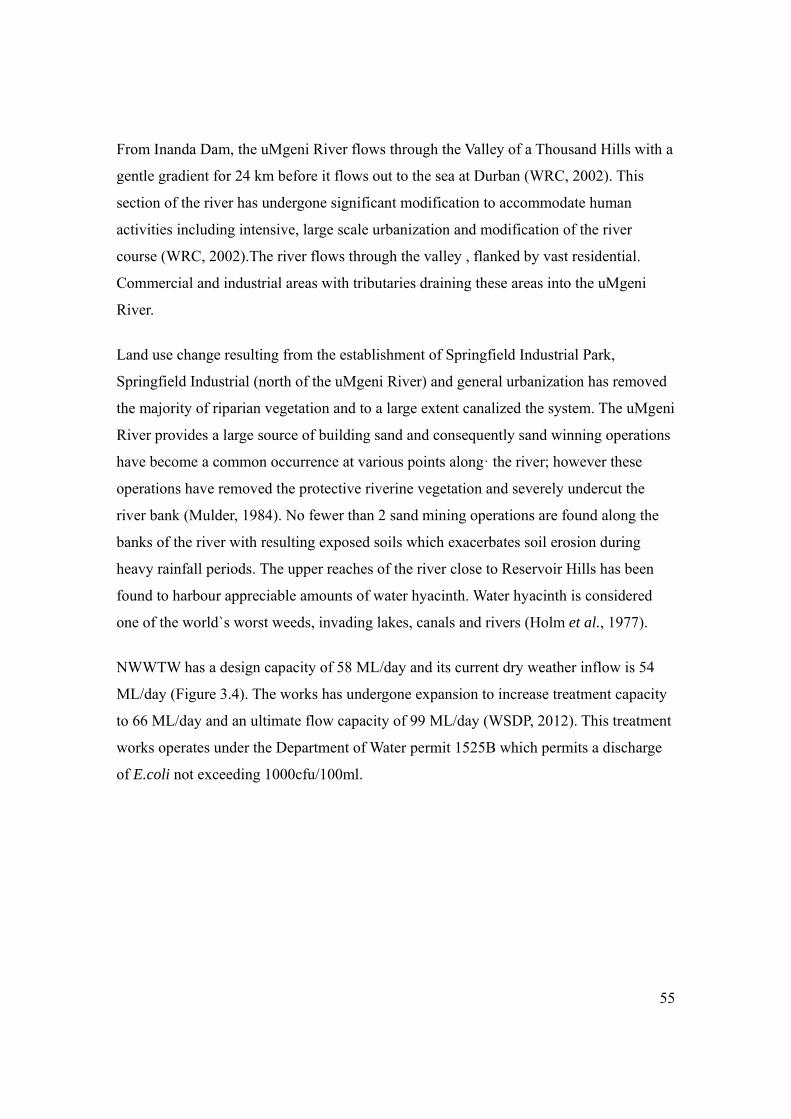
55
From Inanda Dam, the uMgeni River flows through the Valley of a Thousand Hills with a
gentle gradient for 24 km before it flows out to the sea at Durban (WRC, 2002). This
section of the river has undergone significant modification to accommodate human
activities including intensive, large scale urbanization and modification of the river
course (WRC, 2002).The river flows through the valley , flanked by vast residential.
Commercial and industrial areas with tributaries draining these areas into the uMgeni
River.
Land use change resulting from the establishment of Springfield Industrial Park,
Springfield Industrial (north of the uMgeni River) and general urbanization has removed
the majority of riparian vegetation and to a large extent canalized the system. The uMgeni
River provides a large source of building sand and consequently sand winning operations
have become a common occurrence at various points along· the river; however these
operations have removed the protective riverine vegetation and severely undercut the
river bank (Mulder, 1984). No fewer than 2 sand mining operations are found along the
banks of the river with resulting exposed soils which exacerbates soil erosion during
heavy rainfall periods. The upper reaches of the river close to Reservoir Hills has been
found to harbour appreciable amounts of water hyacinth. Water hyacinth is considered
one of the world`s worst weeds, invading lakes, canals and rivers (Holm et al., 1977).
NWWTW has a design capacity of 58 ML/day and its current dry weather inflow is 54
ML/day (Figure 3.4). The works has undergone expansion to increase treatment capacity
to 66 ML/day and an ultimate flow capacity of 99 ML/day (WSDP, 2012). This treatment
works operates under the Department of Water permit 1525B which permits a discharge
of E.coli not exceeding 1000cfu/100ml.
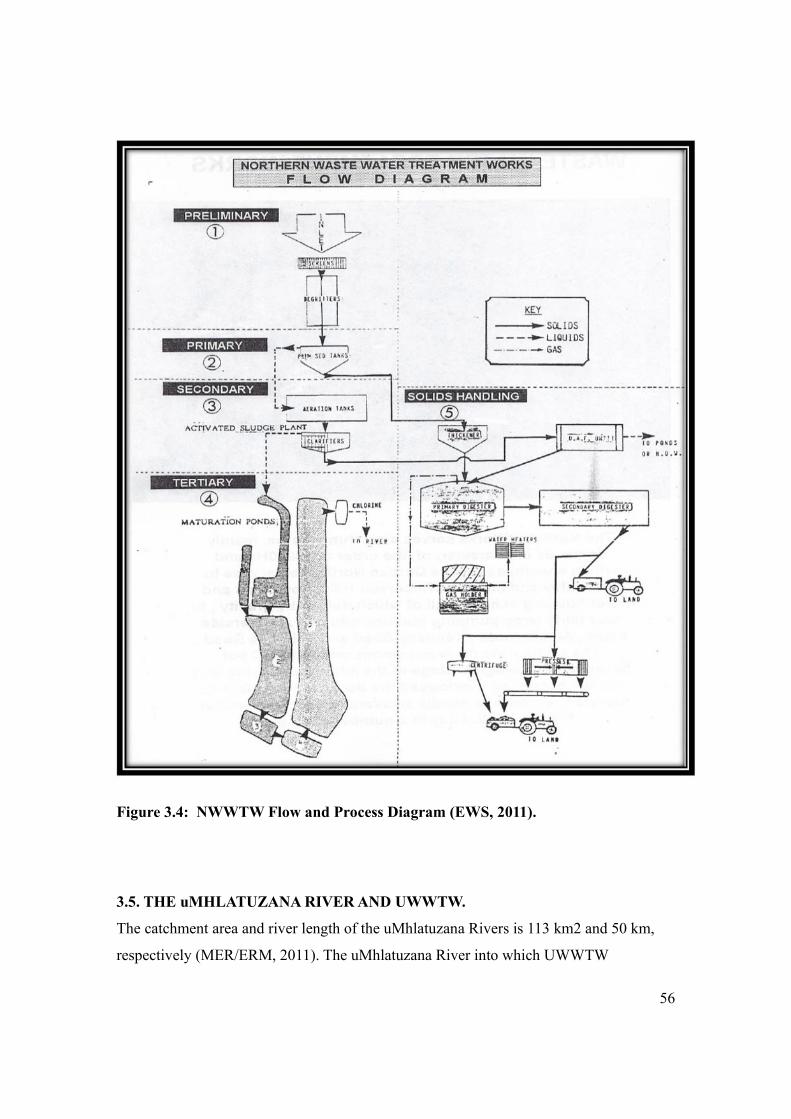
56
Figure 3.4: NWWTW Flow and Process Diagram (EWS, 2011).
3.5. THE uMHLATUZANA RIVER AND UWWTW.
The catchment area and river length of the uMhlatuzana Rivers is 113 km2 and 50 km,
respectively (MER/ERM, 2011). The uMhlatuzana River into which UWWTW

57
discharges (Figure 3.5) carries treated effluent from its upper reaches emanating from the
Hillcrest Wastewater Treatment Works. A wastewater pumping station (with evidence of
recent overflows) is also located along the river. Further downstream there is evidence of
quarrying operations as well as the Marianhill Industrial Area which has a mix of light
and heavy industries. Residential areas are located in close proximity to the river, and
tend to increase along the area adjacent to UWWTW. Downstream of the uMhlatuzana
Wastewater Treatment Works, the discharge from the works tends to dilute and enhance
the water appearance. Habitat integrity, riparian and the instream condition of the river
are fair, however in the lower reaches the riparian habitat quality deteriorates to poor
(WRC, 2002).
Figure 3.5: Location of UWWTW and uMhlatuzana River (EWS, 2011).
ZANA-B
ZANA-A

58
The UWWTW had been designed to treat inflow of 15 ML/day and its current dry
weather inflow averages 10.5 ML/day (Figure 3.6). No expansion is planned for this
works at this stage. Trunk sewers from Hillcrest to UWWTW are at the Environmental
Impact Assessment stage (WSDP, 2012).The nature and extent of treatment is prescribed by
permit 651 B, which is issued by the Department of Water and permits a maximum E.coli
discharge of 1000cfu/100ml.
Figure 3.6: UWWTW Flow and Process Diagram (EWS, 2011).
59
3.6. CONCLUSION
The uMhlangane River; uMgeni River and uMhlatuzana River flow through areas of
much activity which include: residential; industrial; agricultural areas as well as sites with
informal settlements. The process and flow diagrams for the WWTW present an
overview of the nature and extent of wastewater treatment as prescribed by the General
Standard and Exemption Permits issued by the Department of Water for the treatment
and discharge of wastewater into these rivers.

60
CHAPTER FOUR
DATA COLLECTION AND METHODOLOGY
4.1. INTRODUCTION
This chapter identifies the sampling site locations and unique names as well as the
methodology of sample collection to ensure integrity and authenticity. Also, the
nature, location and method of sample analyses are discussed and the comparative
guidelines for evaluation of the results obtained are noted.
4.2. LOCATION OF SAMPLING SITES FOR DATA COLLECTION
Water samples were taken from the uMhlangane; uMgeni and uMhlatuzana Rivers
at 6 different locations. 2 sampling points were located on each of the 3 rivers with
one site located upstream and the other located downstream of the effluent discharge
points. The sample sites are identified in Table 4.1 below.
The exact location of the sampling sites were identified on the first reconnaissance
survey. The rationale for the choice of these sample sites was to obtain results which
could identify the sources and nature of impacts on the riverine water quality.
Table 4.1: Tabulated description of the sample sites (Source: Author).
Unique Site Name Location Of The Site
Gane 1 uMhlangane River - above the discharge point
Gane 2 uMhlangane River - below the discharge point
Umg 1 uMngeni River - above the discharge point
Umg 2 uMngeni River - below the discharge point
Zana 1 uMhlatuzana River - above the discharge point
Zana 2 uMhlatuzana River - below the discharge point
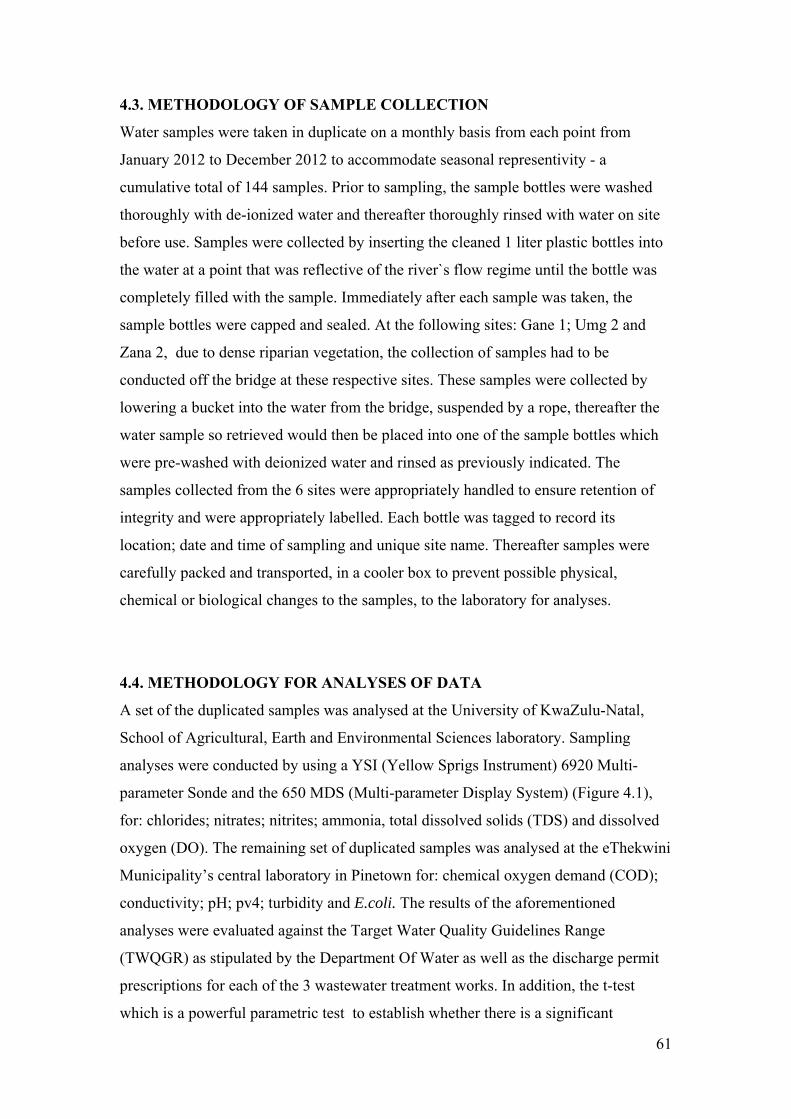
61
4.3. METHODOLOGY OF SAMPLE COLLECTION
Water samples were taken in duplicate on a monthly basis from each point from
January 2012 to December 2012 to accommodate seasonal representivity - a
cumulative total of 144 samples. Prior to sampling, the sample bottles were washed
thoroughly with de-ionized water and thereafter thoroughly rinsed with water on site
before use. Samples were collected by inserting the cleaned 1 liter plastic bottles into
the water at a point that was reflective of the river`s flow regime until the bottle was
completely filled with the sample. Immediately after each sample was taken, the
sample bottles were capped and sealed. At the following sites: Gane 1; Umg 2 and
Zana 2, due to dense riparian vegetation, the collection of samples had to be
conducted off the bridge at these respective sites. These samples were collected by
lowering a bucket into the water from the bridge, suspended by a rope, thereafter the
water sample so retrieved would then be placed into one of the sample bottles which
were pre-washed with deionized water and rinsed as previously indicated. The
samples collected from the 6 sites were appropriately handled to ensure retention of
integrity and were appropriately labelled. Each bottle was tagged to record its
location; date and time of sampling and unique site name. Thereafter samples were
carefully packed and transported, in a cooler box to prevent possible physical,
chemical or biological changes to the samples, to the laboratory for analyses.
4.4. METHODOLOGY FOR ANALYSES OF DATA
A set of the duplicated samples was analysed at the University of KwaZulu-Natal,
School of Agricultural, Earth and Environmental Sciences laboratory. Sampling
analyses were conducted by using a YSI (Yellow Sprigs Instrument) 6920 Multi-
parameter Sonde and the 650 MDS (Multi-parameter Display System) (Figure 4.1),
for: chlorides; nitrates; nitrites; ammonia, total dissolved solids (TDS) and dissolved
oxygen (DO). The remaining set of duplicated samples was analysed at the eThekwini
Municipality’s central laboratory in Pinetown for: chemical oxygen demand (COD);
conductivity; pH; pv4; turbidity and E.coli. The results of the aforementioned
analyses were evaluated against the Target Water Quality Guidelines Range
(TWQGR) as stipulated by the Department Of Water as well as the discharge permit
prescriptions for each of the 3 wastewater treatment works. In addition, the t-test
which is a powerful parametric test to establish whether there is a significant
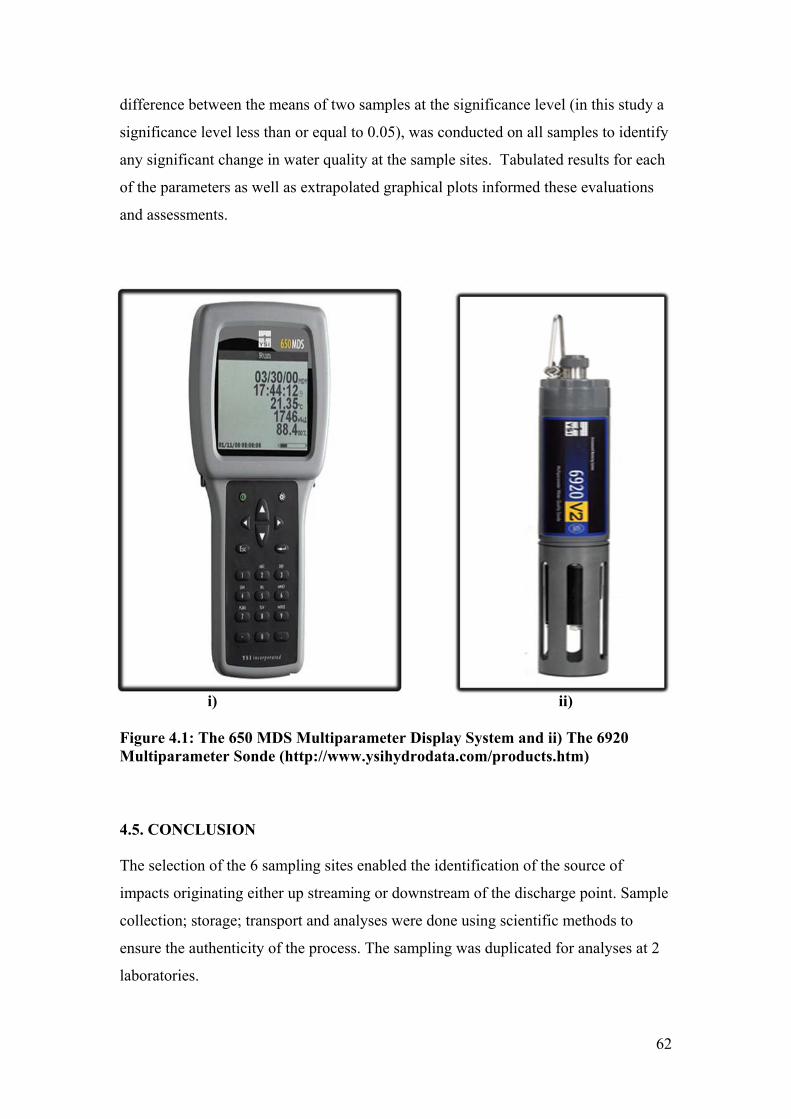
62
difference between the means of two samples at the significance level (in this study a
significance level less than or equal to 0.05), was conducted on all samples to identify
any significant change in water quality at the sample sites. Tabulated results for each
of the parameters as well as extrapolated graphical plots informed these evaluations
and assessments.
i) ii) Figure 4.1: The 650 MDS Multiparameter Display System and ii) The 6920 Multiparameter Sonde (http://www.ysihydrodata.com/products.htm) 4.5. CONCLUSION The selection of the 6 sampling sites enabled the identification of the source of
impacts originating either up streaming or downstream of the discharge point. Sample
collection; storage; transport and analyses were done using scientific methods to
ensure the authenticity of the process. The sampling was duplicated for analyses at 2
laboratories.
63
CHAPTER FIVE
RESULTS AND DISCUSSION
5.1. INTRODUCTION
The tabulated results and graphical comparisons of the sampling from the uMhlatuzana
River (Zana A and Zana B); uMgeni River (Umg A and Umg B) and the uMhlangane
River (Gane A and Gane B), at the sample point above (A) and below (B) their respective
wastewaster treatment works discharge point, are attached as Appendix A. The results for
the water quality parameter are discussed as follows:
in terms of compliance with the TWQGR for aquatic ecosystems (DWAF, 1996);
in comparison with the general requirements for purification of wastewater as per
Regulation 991 (DWAF, 1984); and
for the t-test analyses to identify any significant change in water quality upstream
and downstream of the WWTW.
The TWQGR for pH; Chloride; Ammonia; TDS and DO for Aquatic Ecosystems are
discussed below. There are no specific TWQGR for COD; PV4; Conductivity; Turbidity;
E.coli; Nitrite and Nitrate as respects Aquatic Ecosystems. The results were further
discussed in comparison with the general requirements for purification of wastewater as
per Regulation 991 (DWAF, 1984); for pH; Ammonia; DO; COD; Conductivity and
E.coli. There are no general requirements prescribed by DWAF for the other water
quality parameters in this scope of study. The t-test analyses were conducted for all
parameters and the results are discussed below.
64
5.2. Potential of Hydrogen ( pH)
The TWQGR for pH as respects Aquatic Ecosystems is 0.5 of a pH unit variation. From
Appendix A the results for all sample sites except for 1 at Zana A were within the
TWQGR for Aquatic Ecosystems. This compliance indicates the rivers are not
significantly impacted by factors that influence pH; however there was a significant
increase (0.12) in pH from Umg A to B. As site B is located at the WWTW discharge
point, this discharge is likely the cause of the pH increase. The pH of natural waters is
influenced by various factors and processes, including temperature, discharge of
effluents, acid mine drainage, acidic precipitation, runoff, microbial activity and acid-
forming substances released into the atmosphere as well as the geology and geochemistry
of the rocks and soils of a particular catchment area (DWAF, 1996a). The average pH for
Zana A; B; Umg A; B; Gane A and B was 7.66; 7.68; 7.31; 7.43; 7.66 and 7.63
respectively. These results are normal and within the acceptable range, since according to
DWAF (1996b), most fresh waters in South Africa, are relatively well buffered and more
or less neutral, with pH ranges between 6 and 8. The waters have remained more or less
neutral, while in 2 instances reaching a mildly alkaline and a mildly acidic condition.
In terms of the general requirements for purification of wastewater, regulation 991
specifies a pH of between 5,5 and 9,5 (DWAF, 1984). As indicated above, the average
pH at each site meets the general requirements.
From Appendix A the t-test results for pH at Zana and Gane indicate that t.calc < t.crit.
This implies that there is no significant difference in the water quality water with respect
to pH when one compares the sample point upstream with that downstream of the
WWTW (p ≤ 0.05). However, in the case of Umg the results indicate a significant
difference between the upstream and downstream water quality since t.calc > t.crit
(2.0217>1.717); (p ≤ 0.05). As indicated above, the most likely reason for this increase in
pH from upstream to downstream is the discharge from the WWTW.

65
5.3. Total Dissolved Solids (TDS)
The TWQGR for TDS as respects Aquatic Ecosystems is < 15% variation from the
normal cycles of the water body. According to DWAF (1996), changes in the long-term
shifts in the TDS concentration are more important than single values; therefore, mean or
seasonal mean values for the concentrations in a data set should be compared with the
TWQGR. From Appendix A, the mean for Zana A; B; Umg A; B and Gane A; B were:
297.58mg/l; 402.08mg/l; 385.75mg/l; 612.66mg/l; 478.91mg/l and 613.33mg/l
respectively. In comparing the mean of each of the A sites with its corresponding B site
the TDS increased from the A sites to the B sites by 135%; 159% and 128% for Zana;
Umg and Gane respectively. These variations far exceed the TWQGR for TDS as
respects Aquatic Ecosystems. With 1 exception from Gane A to B; the TDS increased
from A to B for all sites. According to DWAF (1996b), salts accumulate as water moves
downstream because salts are continuously being added through natural and
anthropogenic sources whilst very little is removed by precipitation or natural processes.
Domestic and industrial effluent discharges and surface runoff from urban, industrial and
cultivated areas are examples of the types of sources that may contribute to increased
TDS concentrations. Since there is a significant increase at the discharge point (B), the
WWTW effluent is singled out as the cause of this increase. The elevated TDS at sites
above the WWTW discharge points is attributed to palaeozoic and mesozoic sedimentary
rock formations TDS concentrations are generally in the range of 200 - 1 100 mg/l in
water in contact with palaeozoic and mesozoic sedimentary rock formations (DWAF,
1996b).
From Appendix A the t-test results for TDS at all sites indicate there is a significant
difference between the upstream and downstream water quality since t.calc > t.crit (p ≤
0.05). The most likely reason for this increase in pH from upstream to downstream has
already been discussed above.
66
5.4. CHLORIDES
The TWQGR for Chlorides as respects Aquatic Ecosystems is 400mg/l. The results for
chlorides at all site complied with the TWQGR. The average Chlorides for Zana A; B;
Umg A; B and Gane A; B was 54.25mg/l; 59.25mg/l; 58.67mg/l; 137.17mg/l; 64.33mg/l
and 102.83mg/l; respectively. This is typical for chlorides as concentrations of chloride
in fresh water range from a few to several hundred mg/l (DWAF, 1996a). All sites
recorded chlorides above 50mg/l and only in one instance at Umg B did the chloride
result exceed 200mg/l. The threshold for an increased corrosion rate is approximately 50
mg/l and at chloride concentrations greater than 200 mg/l, there is likely to be a
significant shortening of the lifetime of domestic appliances as a result of corrosion
(DWAF, 1996a). With 1 exception from Zana A to B; the chlorides increased from A to
B for all sites. As indicated in Appendix A, the chlorides remained constant from site
Zana A to B; however there was an increase of 233% in chlorides from site Umg A to B,
and an increase of 160% from site Gane A to B. This increase is likely a result of the
sewage effluent discharges from the 2 WWTW, since the increase is at the discharge site
(B site). Chloride inputs to surface waters can arise from irrigation return flows, sewage
effluent discharges and various industrial processes (DWAF, 1996a).
From Appendix A, the t-test results for Chlorides at all sites indicate a significant
difference between the upstream and downstream water quality since t.calc > t.crit (p ≤
0.05). For Zana, a relatively smaller difference (1.875>1.717), in comparison with Umg
and Gane, where there is quite a significant difference between the upstream and
downstream water quality (6.9602>1.717) and (8.438> 1.717) respectively.
The most likely reason for this increase in Chlorides from upstream to downstream is the
discharge from the WWTW which has already been discussed above.
5.5. AMMONIA
The TWQGR for Ammonia as respects Aquatic Ecosystems is 0.007mg/l. As indicated in
Appendix A, the results for all sites far exceeded the TWQGR for Aquatic Ecosystems.

67
With 2 exceptions from Umg A to B; the Ammonia concentration increased from A to B
for all sites. The average Ammonia for Zana A; B; Umg A; B and Gane A; B was
0.52mg/l; 0.88mg/l; 0.64mg/l; 1.2mg/l; 0.61mg/l and 1.06mg/l; respectively. The
percentage increase in Ammonia from the A site to the B site was 169%; 187% and 173%
for Zana; Umg and Gane respectively. Ammonia occurs naturally through gas exchange
with the atmosphere; chemical and biochemical transformation of nitrogenous matter and
nitrogen fixation; other sources of ammonia include sewage discharges; discharge from
industries that use ammonia or ammonium salts and commercial fertilizers containing
highly soluble ammonia and ammonium salts DWAF, 1996b). At the A sites (above the
discharge point) the source of increased ammonia could be from the informal settlements
located upstream of Umg A , in the vicinity of Reservoir Hills and along the embankment
at Stonebridge Drive where small scale farming is practiced and fertilizers are used. Zana
A is most likely impacted by the effluent from the Hillcrest WWTW and pumpstation
overflows. The location of all B sites are below the WWTW discharge point. Hence the
increased Ammonia concentration at these sites can be attributed to sewage discharges.
At Ammonia concentrations of 0.015mg/l, chronic effects to Aquatic Ecosystems result
and at concentrations of 0.100mg/l, acute effects result (DWAF, 1996b). At all sites, the
Ammonia results exceeded both the chronic and acute effects value. Acute toxicity to fish
may cause a loss of equilibrium, hyper-excitability, an increased breathing rate, an
increased cardiac output and oxygen intake, and in extreme cases convulsions, coma and
death, while chronic effects include a reduction in hatching success, reduction in growth
rate and morphological development, and pathological changes in tissue of gills, liver and
kidneys (DWAF, 1996b). As for Ammonia, the general requirements for purification of
wastewater, regulation 991 specifies a free and saline ammonia (as N) 1.0mg/l (DWAF,
1984).
As indicated in Appendix A, the average Ammonia for Zana A; B; Umg A; B and Gane
A; B was 0.52mg/l; 0.88mg/l; 0.64mg/l; 1.2mg/l; 0.61mg/l and 1.06mg/l; respectively. 2
results at Zana B; 7 results at Umg B; 2 results at Gane A and 6 results at Gane B
exceeded the 1.0mg/l prescription. Upstream of Gane A, small scale farming for the local
market consumption is practiced and the conservative quantities of fertilizers used is
68
likely to increase ammonia levels through washout into the river. The average Ammonia
concentration at sites Umg B and Gane B exceeded the requirement of 1.0mg/l. while the
average for the Zana B site was elevated, but within range. As these sites are all located
below the WWTW discharge point, the discharges from the WWTW is the most likely
contributor to these excesses as already discussed.
The Ammonia results for the t-test from Appendix A at all sites indicates there is a
significant difference between the upstream and downstream water quality since t.calc >
t.crit (p ≤ 0.05). For Zana, the difference is significantly high (8.35>1.717); however for
Umg and Gane, the difference between the upstream and downstream water quality is
significantly lower in comparison with Zana, (2.46>1.717) and (3.08> 1.717)
respectively. The most likely reason for this increase in Ammonia from upstream to
downstream is the discharge from the WWTW and has already been discussed above.
5.6. Dissolved Oxygen (DO)
The TWQGR for DO, specifies a range of 80-120% DO saturation for Aquatic
Ecosystems (DWAF, 1996b).The temperature range for sampling at all sites was 15-20
degrees celsius (°C). Typical saturation concentrations are: 12.77 mg/l at 5 °C; 10.08
mg/l at 15 °C and 9.09mg/l at 20 °C (DWAF, 1996b). From Appendix A, the levels of
DO at all sites were extremely low in comparison with these standards and are therefore
unacceptable. The average DO and percent saturation (%), for Zana A; B; Umg A; B and
Gane A; B was 4.42mg/l (44.2%); 5.6mg/l (56%); 4.21mg/l (42.1%); 3.19mg/l (31.9%);
4.43mg/l (44.3%) and 4.1mg/l (41%); respectively. These were also below the TWQGR
for DO for Aquatic Ecosystems. For Zana, the average DO increased from site A to B.
For Umg and Gane, there was a decrease in DO from site A to B. Dissolved oxygen
concentrations can be increased naturally or induced artificially by aeration at a WWTW.
It is likely the increase in DO for Zana was the result of elevated aeration rates at the
WWTW. The decrease in DO for Umg and Gane, can be attributed to low aeration rates
at these WWTW as well as increased organic matter in the wastewater discharges.
Sewage effluents also reduce DO in aquatic systems by introducing into the system
69
organic matter which, as noted by Russell (1996) requires oxygen for its breakdown. The
rate of increase of dissolution of oxygen can be accelerated if turbulence of the water
increases, causing entrainment of air from the atmosphere, while reduction in the
concentration of dissolved oxygen can be caused by re-suspension of anoxic sediments,
as a result of river floods or dredging activities. The presence of oxidisable organic
matter, either of natural origin (detritus) or originating in waste discharges, can lead to
reduction in the concentration of dissolved oxygen in surface waters (DWAF, 1996b).
According to DWAF (1996b), as a result of low DO, juveniles of many aquatic
organisms are more sensitive to physiological stress a rising from oxygen depletion, and
in particular to secondary effects such as increased vulnerability to predation and disease.
In terms of the general requirements for purification of wastewater, regulation 991
specifies dissolved oxygen of at least 75 percent saturation (DWAF, 1984).
As indicated above, the DO saturation for all sites ranged from 31.9% to 56%, which is
significantly below the requisite 75 percent saturation. The reasons for this discrepancy
were discussed above.
From Appendix A, the t-test result for DO at Zana was 2.1 and 6.38 for Umg. Since t.calc
> t.crit for Zana (2.1>1.717) and Umg (6.38> 1.717) this implies that there is significant
difference in the water quality with respect to DO when one compares the water upstream
with that downstream of the WWTW (p ≤ 0.05). However, in the case of Gane the results
indicate no significant difference between the upstream and downstream water quality
since t.calc < t.crit (p ≤ 0.05). The rationale for the variance in DO was discussed in
detail above.
5.7. Chemical Oxygen Demand (COD)
In terms of the general requirements for purification of wastewater, regulation 991
specifies a COD not exceeding 75 mg/l (DWAF, 1984). From Appendix A the average
COD for Zana A; B; Umg A; B; Gane A and B was 51.67mg/l; 38.75mg/l; 61.4mg/l;
41.58mg/l; 47.29mg/l and 42.78mg/l respectively. The averages for COD were all within
70
the requirements for a COD not exceeding 75mg/l. However 1 site each at Zana A; Umg
A; Umg B and 2 sites at Gane A exceeded the 75mg/l requirement. The irregular elevated
peaks at the A sites are most likely a result of rainfall and the consequent increase in
runoff. At the B sites the elevated COD was probably as a result of high levels of organic
matter contained in the discharge.
As indicated in Appendix A, the t-test results for COD at Zana (0.139 < 1.717); Umg
(0.100 < 1.717); and Gane (0.375 < 1.717); Since t.calc < t.crit there is no significant
difference in the water quality with respect to COD when one compares the water
upstream with that downstream of the WWTW (p ≤ 0.05).
5.8. Permanganate Value (PV 4)
In terms of the general requirements for purification of wastewater, regulation 991
specifies a PV 4 not exceeding 10mg/l (DWAF, 1984). Appendix A indicates the average
PV 4 for sites: Zana A; B; Umg A; B; Gane A and B, was 6.73mg/l; 6.37mg/l; 3.72mg/l;
5.71mg/l; 7.47mg/l and 11.98mg/l respectively. The average PV 4 at Gane B exceeded
the general requirement of 10mg/l. 2 sites at Zana A; 1 site at Zana B; 1 site at Gane A
and 2 sites at Gane B, were above the general requirement for PV 4. The probable
reasons for the increased PV4 are discussed below.
From Appendix A the t-test results for PV 4 at Zana (0.35<1.717) and Gane (0.57<
1.717), this indicates that there is no significant difference in the water quality with
respect to PV 4 when one compares the water upstream with that downstream of the
WWTW since t.calc < t.crit (p ≤ 0.05). However, in the case of Umg the results indicate a
significant difference between the upstream and downstream water quality (p ≤ 0.05),
since t.calc > t.crit (3.23>1.717). PV 4 provides an indirect measurement of the oxygen
content, since according to Tamime et al (1999), it is a quick test to determine the
chemically oxidisable organic matter in a sample. The most likely reason for this increase
in PV 4 from upstream to downstream is the increase in organic matter conveyed by the
wastewater discharge from the WWTW. The presence of oxidisable organic matter,
71
either of natural origin (detritus) or originating in waste discharges, can lead to reduction
in the concentration of dissolved oxygen in surface waters (DWAF, 1996b). The
significant difference in PV4 results for Umg correlate with the low DO results discussed
above, for Umg.
5.9. CONDUCTIVITY
In terms of the general requirements for purification of wastewater, regulation 991
specifies Conductivity not exceeding 75mS/m (DWAF, 1984). From Appendix A, the
average Conductivity for Zana A; B; Umg A; B; Gane A and B was 33.33mg/l;
38.75mg/l; 39.66mg/l; 144.08mg/l; 55.58mg/l and 61mg/l respectively. The average
Conductivity Umg B exceeded the 75mS/m requirement. A total of 6 sites at exceeded
the 75mS/m Conductivity prescription and these were all located at Umg B. Generally
heavy rainfall increases the dilution capacity and hence lowers the Conductivity and
during low rainfall periods (winter) little or no dilution, results in higher Conductivity
concentrations. The increases in Conductivity were recorded during the low rainfall
months. Since the increased conductivity was recorded at the B site, this suggests the
source of the increased Conductivity to be the discharged wastewater.
From Appendix A the t-test results for Conductivity at all sites are: Zana (3.04>1.717);
Umg (2.8>1.717) and Gane (2.03>1.717). These results indicate there is a significant
difference between the upstream and downstream water quality since t.calc > t.crit (p ≤
0.05). The most likely reason for this increase from upstream to downstream is the
discharge from the WWTW.
5.10. ESCHERICHIA COLI (E.coli)
In terms of the general requirements for purification of wastewater, regulation 991
indicates that the waste water or effluent shall not contain any typical (fecal) coli per
100ml E.coli (DWAF, 1984). However as indicated in the literature review the 3 WWTW
are exempted from this requirement to the extent that their discharges may not contain
more than a 1000 typical (fecal) coli per 100ml E.coli.

72
As indicated in Appendix A, 4 sites at Zana A; 6 sites at Zana B; 4 sites at Umg A; no
sites at Umg B; 1 site at Gane A and 2 sites at Gane B met this requirement. The majority
of sites far exceeded the 1000 cfu/ml requirement, which indicates the presence of
pathogens and poor sanitary quality of the water (WRC, 2006); (Liberti et al., 2000). The
source of this contamination for Umg A is the informal settlement with poor sanitary
facilities located upstream in the vicinity of Reservoir Hills. Zana A is most likely
impacted by the effluent discharges into the river from the Hillcrest WWTW and
pumpstation overflows. Gane A is most likely impacted by faecal contamination from
livestock grazing along the river. The cause of non-compliance at the B sites is the poor
quality of wastewater discharged from the WWTW. Indicator organisms (E.coli) provide
evidence of faecal contamination from humans and warm-blooded animals (Ritter, 2010).
For E.coli, from Appendix A the t-test results are: Zana (0.03 <1.717); Umg
(0.56<1.717) and Gane (0.73<1.717); this indicates no significant difference between the
upstream and downstream water quality since t.calc < t.crit (p ≤ 0.05).
5.11. TURBIDITY
From Appendix A the t-test results for Turbidity are: Zana (0.31<1.717); Umg
(0.54<1.717) and Gane (0.13<1.717); since t.calc < t.crit. there is no significant
difference in the water quality with respect to Turbidity when one compares the water
upstream with that downstream of the WWTW (p ≤ 0.05). There was an anomalous
increase in Turbidity at Gane A (434 NTU) and at Gane B (411 NTU). Since the point of
origin of the elevated Turbidity was above the WWTW discharge point, the anomalously
high Turbidity could be attributed high levels of suspended matter being washed down
the river. Turbidity in water is caused by the presence of suspended matter which usually
consists of a mixture of inorganic matter, such as clay and soil particles, and organic
matter; also the discharge of sewage and other wastes can contribute significantly to
turbidity (DWAF, 1996a). There were 11 instances of a decrease in Turbidity from Zana
A to B which indicates that the diluting effect of the WWTW discharge at Zana B (which
had lowered turbidity levels) resulted in a lowering the overall turbidity.
73
Elevated turbidity levels accelerate microbial growth since microbial growth in water is
most extensive on the surface of particulates and inside loose, naturally-occurring flocs;
also river silt (which increases turbidity) readily adsorbs viruses and bacteria (DWAF,
1996a).
5.12. NITRITES AND NITRATES
From Appendix A the t-test results for Nitrites and Nitrates at all sites are: Zana
(6.35>1.717); Umg (12.07>1.717) and Gane (4.48>1.717); this indicates a significant
difference between the upstream and downstream water quality (p ≤ 0.05). The most
likely reason for this increase in pH from upstream to downstream is the effluent
discharges from the WWTW. A significant source of nitrates in natural water results from
the oxidation of vegetable and animal debris and of animal and human excrement as well
as treated sewage wastes that contain elevated concentrations of nitrate (DWAF, 1996a).
In aquatic systems elevated concentrations generally give rise to the accelerated growth
of algae and the occurrence of algal blooms which may subsequently cause problems
associated with malodors and tastes in water and the possible occurrence of toxicity
(DWAF 1996a). Optimum levels for aquatic ecosystem functioning are those below 0.5
mg/L as there are moderate species diversity, low productivity and rapid nutrient cycling
and no excessive growth of aquatic plants or algal blooms; but at levels between 0.5 – 2.5
mg/L mesotrophic conditions prevail, which result in high species diversity and high
productivity as well as nuisance growth of aquatic plants and blue - green algal blooms
(DWAF, 1996a).
5.13. CONCLUSION
In comparison with the TWQGR for Aquatic Ecosystems, the average results for pH;
COD and Chlorides were within the range; the average results for TDS and Ammonia far
exceeded the TWQGR and the DO results were well below the TWQGR. As respects the
general requirements for purification of wastewater (DWAF, 1984), the average pH at all
sites complied with the general requirements; the average Ammonia at Umg B and Gane

74
B exceeded the general requirements while the other sites were compliant; the average
DO at all sites was well below the general requirement; the average PV4 at Gane B
exceeded the general requirement, while the other site complied; the average conductivity
at Umg B exceeded the general requirements, while all other sites met the requirements;
and the majority of sites far exceeded the general requirement as respects E.coli, despite
there being a relaxation in the requirement for E.coli compliance.
The t-test results indicated that there was significant difference between the upstream and
downstream water quality for the following parameters and sites: pH and PV4 at Umg;
for DO at Zana and Umg; for TDS, conductivity, chlorides, ammonia; nitrites and nitrates
at all sites.
75
CHAPTER SIX
CONCLUSION AND RECOMMENDATIONS
6.1. CONCLUSION
This study highlighted the decline in global water availability as well as the challenges in
South Africa as respects water scarcity and the deterioration in water quality which has
further reduced its availability. The deterioration in water quality necessitates urgent
interventions for management of water resources to ensure that the existing water
supplies are utilized sustainably.
Water quality deterioration results predominantly from anthropogenic activities.
Anthropogenic activities refer to human activities that aggravate or cause the decline in
water quality. Wastewater, resulting from human activities often contains pathogenic
microorganisms and results in negative impacts when inadequately treated and
discharged into rivers. Other impacting anthropogenic activities include: washout of
pesticides and fertilizers; industrial discharges and urbanization.
The specific aim of this study was to determine the impact of wastewater discharges from
the KwaMashu; Northern and uMhlatuzana Treatment Works on the water quality of the
uMhlangane; the uMgeni and the uMhlatuzana Rivers respectively; as well as to identify
other anthropogenic variables influencing the water quality of these rivers. The results of
sampling from the six sites were compared with the TWQGR for Aquatic Ecosystems,
and the average results for pH; COD and Chlorides were within the range. The average
results for TDS and Ammonia far exceeded the TWQGR and the DO results were well
below the TWQGR and hence non-compliant.
When comparing the results from the six sites with the general requirements for
purification of wastewater (DWAF, 1984), the average pH at all sites complied with the
general requirements; the average Ammonia at Umg B and Gane B exceeded the general
requirements while the other sites were compliant; the average DO at all sites was well

76
below the general requirement; the average PV4 at Gane B exceeded the general
requirement, while the other site complied; the average conductivity at Umg B exceeded
the general requirements, while all other sites met the requirements; and the majority of
sites far exceeded the general requirement as respects E.coli, despite there being a
relaxation in the requirement for E.coli compliance.
The t-test results indicated that there was significant difference between the upstream and
downstream water quality for the following parameters and sites: pH and PV4 at Umg;
for DO at Zana and Umg; for TDS, conductivity, chlorides, ammonia; nitrite and nitrates
at all sites.
There was a decline in water quality from upstream to downstream for the following:
TDS ; Chlorides; Ammonia; Conductivity ; Nitrites and Nitrates-at all sites;
DO; PV4; Turbidity-at all sites, except for Zana;
pH; E.coli- at the Umg site.
This is a total of declining water quality on 23 instances from upstream to downstream.
The Umg site is has the poorest water quality (for 10 instances of declining quality).
The WWTW discharge point is located at the downstream site and the reason for the
declining water quality can be attributed to the discharge of inadequately treated
wastewater into the river.
There was an improvement in water quality from upstream to downstream for:
COD –at all sites;
DO; PV4 -at the Zana site;
E.coli -at sites Zana and Gane.
This is a total of 7 instances of an improvement in water quality from upstream to
downstream. The dilution effect of the WWTW discharge containing lower
concentrations of the above parameters is likely result in the above improvement in water
quality. The poor quality at the upstream sites is the result of anthropogenic activities. For
Umg A, the informal settlement with poor sanitary facilities located upstream in the
vicinity of Reservoir Hills is the most likely cause of the water quality decline. Zana A is
77
impacted by the effluent discharges into the river from the Hillcrest WWTW; industrial
discharges and pump station overflows and Gane A is most likely impacted by fecal
contamination from livestock grazing along the river and industrial discharges into the
canal. The presence of oxidisable organic matter, either of natural origin (detritus) or
originating in waste discharges, can lead to reduction in the concentration of dissolved
oxygen in surface waters (DWAF, 1996b). PV 4 provides an indirect measurement of the
oxygen content, according to Tamime et al., (1999).
6.2. RECOMMENDATIONS
The recommendations for improving the downstream riverine water quality of the
uMhlatuzana; uMhlangane and uMgeni Rivers include:
urgent upgrade of the WWTW discharging into these rivers to meet the
Department of Water discharge requirements and consequently reduce the poor
water quality impacts on the river;
upskilling and training of operation staff at the WWTW to ensure efficient
process operation;
the Department of Water to enforce penalties for non- compliance with discharge
permit requirements;
improving the policing of pollution and monitoring of rivers to reduce illegal
discharges;
the provision of proper housing and sanitation facilities and the eradication of
informal settlements on and around the river banks.

78
REFERENCES
African Journal of Aquatic Science. (2007). Water quality in South African temporarily
open/closed estuaries: A conceptual model, 32:2, 99-111.
Ahuja, S. (1986). Handbook of Water Purity and Quality. Academic Press. New York.
Ahuja, S. (2009). Handbook of Water Purity and Quality. Academic Press. New York.
Antonopoulos, V.Z., Papamichail, D M. and Mitsiou, K.A. (2001). Statistical and trend
analysis of water quality and quantity data for the Strymon River in Greece: Hydrology and
Earth System Sciences, 5: 679-692.
Begg, G.W. The location, status and function of the priority wetlands of Natal. The wetlands
of Natal. Part 3, (Natal Town and Regional Planning Commission, Pietermaritzburg, 1989, p.
172.
Beychock, M.R. (1971). Performance of surface-aerated basins. Chemical Engineering
Progress Symposium Series. No. 67 (107): 322-339. CSA. Illumina website.
Bezuidenhout, C.C., Mthembu, N., Puckree, T. and Lin, J. (2002): Microbiological evaluation
of the Mhlathuze River, Kwazulu-Natal (RSA). Water SA Vol. 28. No. 3.
Boyacioglu, H. (2007). Development of a water quality index based on a European
classification scheme. Water SA. Vol.33 No.1 January 2007.
Boyd, C.E. (2000). Water Quality: An Introduction. Kluwer Academic Publishers, London.
Boyd, L.A. and Mbelu A.M. (2009). Guideline for the Inspection of Wastewater Treatment
Works. Water Research Commission. Report No. TT 375/08.

79
Burkholder, J.M. (2001). Eutrophication and oligotrophication. In: Encyclopedia of
Biodiversity, vol. 2. Academic Press, New York, pp649-670.
Cheesman, O.D. (2005). Environmental Impacts of Sugar Production, CABI Publishing,
United Kingdom.
Cooke, K. (2006). Water Quality Parameters-River Assessment Monitoring Project;
Kentucky Water Watch. Available from: http: //kywater.org/ww/ramp/rmtests.htm.
Cyrus, D.P., Wepener, V., MaKay, C.F., Cilliers, P.M., Weerts, S.P. and Viljoen, A. (1999):
The Effects of Intrabasin Transfer on the Hydrochemistry, Benthic Invertebrates and
Ichyofauna of the Mhlatuze Estuary and Lake Nsezi. Water Research Commission Report,
722, (1), 99, p. 253.
Daigger, G.T. (2009): Evolving Urban Water Residuals Management Paradigms; Water
Reclamation and Reuse, Decentralisation and Resource Recovery. Water Environment
Research.
Dallas, H.F. and Day, J.A. (2004). The Effect of Water Quality Variables on Aquatic
Ecosystems: A Review. Water Research Commission. Report No. TT224/04.
Day, J.A. and King, J.M. (1995). Geographical patterns and their origins, in the dominance of
major ions in South African rivers. S. Afr. J. Sci. 91: 299-306.
Du Plessis, H.M. (2003): Knowledge review 2003/04 – Water and the economy. Available
from: http://www.wrc.org.za/downloads/knowledgereview/2003/XDB.pdf.
DWA (Department of Water Affairs). (1986). Management of the water resources of the
Republic of South Africa. Pretoria, Department of Water Affairs.

80
DWAF. (Department of Water Affairs and Forestry). (1984). General and Special Standards.
Regulation No. 991 18 May 1984. Government Gazette No.9225
DWAF (Department of Water Affairs and Forestry). 1996a. South African Water Quality
Guidelines: Volume 1 - Domestic Use. 2nd Edition. Government Press: Pretoria.
DWAF (Department of Water Affairs and Forestry). 1996b. South African Water Quality
Guidelines: Volume 7 - Aquatic Ecosystem. 2nd Edition. Government Press: Pretoria.
DWAF (Department of Water Affairs and Forestry). (1996c): South African Water Quality
Guidelines-Industrial Use, Volume 3. Pretoria: Government Printer.
DWAF (Department of Water Affairs). (1996e). Water quality guidelines for South Africa:
Recreational Water Use. 2nd Edition. Pretoria.
DWAF (Department of Water Affairs and Forestry). (2001). State of the Rivers Report:
Crocodile, Sabie-Sand and Olifants River Systems. WRC Report No. TT 147/01. Department
of Water Affairs and Forestry, Pretoria.
DWAF (Department of Water Affairs and Forestry). (2002). An Illustrated Guide to Basic
Sewage Purification Operations. First Edition. Pretoria: Government Printer.
DWAF (Department of Water Affairs and Forestry). (2001). State of the Rivers Report:
Crocodile, Sabie-Sand and Olifants River Systems. WRC Report No. TT 147/01. Department
of Water Affairs and Forestry, Pretoria.
DWAF (Department of Water Affairs and Forestry). (2011). Diagnostic Report, National
Planning Commission, 2011:18.
Environ. Earth Science. (2010). Environmental status of the metropolitan river (Kifissos) of
Athens, Greece.61:983–993. DOI 10.1007/s12665-009-0417-6.
81
EPA (Environmental Protection Association). (2004). Primer for Municipal Waste water
Treatment Systems. Document no. EPA 832-R-04-001. Washington, DC.
eThekwini Municipality (EWS). (2011). GIS Map of Treatment Works and Process Flow.
GIS Section. Prior Rd Durban.
eThekwini Municipality (WSDP). (2012). Water Services Development Plan (WSDP).
Adopted by Council March 2012.
Foladori, P., Andreottola, G. and Ziglio, G. (2010). Sludge Reduction Technologies in
Wastewater Treatment Plants. University of Trento, Italy. IWA Publishing. London.
Gerhardi, M.H. (2003). The Microbiology of Anaerobic Digesters. John Wiley & Sons
Inc., New York.
Gerhardi, M.H. (2008). Microscopic Examination of the Activated Sludge Process. John
Wiley & Sons Inc., New York.
Govender, M., Chetty, K. and Bulcock, H. (2007). A Review of Hyperspectral Remote
Sensing and its Application in Vegetation and Water Resource Studies. Water SA. Vol. 33.
No. 2.
Gray, N.F. (1994). Drinking Water Quality, Problems and Solutions. John Wiley and Sons
Ltd, England.
Gray, N.F. (1999). Water Technology. An Introduction for Environmental Scientists and
Engineers. John Wiley & Sons Inc., New York.
Gray, N.F. (2005). Water Technology: an Introduction for Environmental Scientists and
Engineers. Oxford: Boston Elsevier/Butterworth-Heinemann.
Haile, R.W., White, J.S., Gold, M., Cressey, R. and Mc Gee, C. (1999). The health effects of
in ocean water contaminated by storm drain runoff. Epidemiology 10. No. 355-363.

82
Hall, L.W. (1987). Acidification effects on larval striped bass, Monone saxatilis, in
Chesapeake bay tributaries: A Review. Water Air & Soil Pollution, 35: 87-96.
Hall, R.O. (2003). A Stream`s role in watershed nutrient export. Proceedings of the National
Academy of Science, 100: 10137-10138.
Harris, J. and Kelly, H. (1991). Water quality in the Mvoti River, Division of Water
Technology, CSIR, Pretoria.
Hassan, R.M. and Farolfi, S. (2005). Water value, resource rent recovery and economic
welfare cost of environment protection: A water-sector model for the Steelpoort sub-basin in
South Africa. Water SA. Vol. 31. No.1. January 2005.
Henriksen, A., Ekebirge, E.J.S., Fjeheim, A., Raddum, G., Rosseland B.O. and Skogheim,
O.K. (1987). Water Chemistry-fish decline: Episodic changes in water quality effect on fish
and invertebrates. Report to SWAP, Bergen, Norway.
Hodgson, K. Manus, L. (2006). A drinking water quality framework for South Africa. Water
SA. No. 32(5):673-678.
Holm L.G., Plucknett D.L., Pancho J.V. and Herberger J.P. 1977. The World`s Worst Weeds:
Distribution and Biology. University press. Honolulu, Hawaii.
Holtzhausen, L. (2005): When water turns deadly-Investigating Nitrite in South Africa`s
Groundwater. Available from: www.wrc.org.za/archives/waterwheel.
Horner, M.S. (2006): The Presence of Algae in Dog River’s Tributaries. Department of Earth
Sciences, University of South Alabama.
www.southalabama.edu/geography/fearn/480page/OOHorner/Horner.htm.
83
Ingersoll, C.G., Lapoint, T.W., Breck, J. and Bergman, H.L. (1985). An early life history of
brook trout (Salvelinus fontinalis) bioassay testing the independent and combined effects of
pH, calcium and aluminium in low conductivity water. United States Fish and Wildlife
Service. Acid Rain Report No. 21: 42-48.
Jähnig, S.C. (2010). River Water Quality Assessment in Selected Yangtze Tributaries:
Background and Method Development. Journal of Earth Science.Vol. 21, No. 6, p. 876–881.
ISSN 1674-487X. Printed in China.
Johnson, D.L., Ambrose, S.H., Bassett, T.J., Bowen, M.L., Crummey, D.E., Isaacson J.S.,
Johnson, D.N., Lamb, P., Saul, M. and Winter-Nelson, A.E. (1997). Meanings of
Environmental terms. Journal of Environmental Quality. No. 26. 581-589.
Journal of American Water and Wastewater Association (AWA). (1992). Vol. 84, No, 9.
Nitrate Contamination of Groundwater: Sources and Potential Health Effects, pp.85-90.
Kadewa, W., Moyo, B.H.Z., Mumba, P. and Phiri, O. (2005). Assessment of the impact of
industrial effluent on water quality of receiving rivers in urban areas of Malawi. International
Journal of Environmental Science and Technology (IJE). No.2. 237-44.
Khopkar, S.M. (2004). Environmental pollution Monitoring and Control. New Dehli: New
Age International. P299.
King, J.M., Scheepers, A.C.T., Fisher, R.C., Reinecke, MK. and Smith, L.B. (2003). River
Rehabilitation: Literature review, Case studies and Emerging Principles. Water Research
Commission. Report No. 1161/1/03.
Kresic, N. (2009). Groundwater Resources: Sustainability, Management and Restoration.
Mcgraw-Hill. USA.

84
Lee, P., Smyth, C. and Boutin, S. (2004). Quantitative review of riparian buffer width
guidelines from Canada and the United States. Journal of Environmental Management. No.
70:165–180.
Liberti, L., Lopez. A, Notarnicola, M., Barnea, N., Pedahzur, R. and Fattal, B. (2000).
Comparison of advanced disinfecting methods for municipal wastewater reuse in agriculture.
Water Science & Technology. No. 42 215-220.
Lindqvist, N., Tuhkanen, T. and Kronberg, L. (2005). Occurrence of acidic pharmaceuticals
in raw and treated sewages and in receiving waters. Water Research 39: 2219-2228.
London, L., Dalvi, M. A., Nowicki, A. and Cairncross, E. (2005). Approaches for regulating
water in South Africa for the presence of pesticides. Water SA. Vol. 31 No. 1 January 2005.
p53.
Marsalek, J., Rochfort, Q., Grapentine, L., Brownlee, B. and Saldanha, M.J. (2002).
Assessment of stormwater impacts on an urban stream with a detention pond. Water Science
& Technology. No. 45 (3): 255-263.
May, J., Budlender, D., Mokate, R., Rogerson, C. and Stavrou, A. (1998). Poverty and
Inequality in South Africa. Durban, South Africa: Praxis Publishing.
Mazur, R.E. (1995). African migration and appropriate housing responses in Metropolitan
Cape Town. Draft Report. Cape Town: Western Cape Community -Based Housing Trust.
MER/ERM (2011) Development of the Bay of Natal Estuarine Management Plan: Situation
Assessment. Report prepared for eThekwini Municipality, Transnet National Port Authority
and The Department of Agriculture, Environmental Affairs and Rural Development.
Miller, G.T. (2005). Water for all: Improving water resource governance in Southern Africa.
Gatekeeper Series No. 113. Available from: http://www.poptel.org.uk/iied/sarl/gatekeepers
GK113.pdf.
85
Monaghan, R.M., Wilcock, R.J., Smith, L.C., Tikkisetty, B., Thorrold, B.S. and Costall, D.
(2007). Linkages between land management activities and water quality in an intensively
farmed catchment in southern New Zealand. Agr. Ecosyst. Environ. 118
(1–4), 211–222.
Mudge, S.M. and Duce, C.E. (2005). Identifying the source, transport path and sinks of
sewage derived organic matter. Environ. Pollut. 136, 209–220.
Mulder, C. (1984). Lower Umgeni River Study, Mulder Associates Inc, Durban.
Murphy, S. (2006). USGS Water Quality Monitoring: Information on water quality
parameters. Available from: http//bcn.boulder.co.us/basin/data/BACT/info/index/html.
Naidoo, K. (2005). The anthropogenic impacts of urbanization and industrialisation on the
water quality, ecology and health status of the Palmiet River Catchment in Durban,
KwaZulu-Natal. Unpublished Masters Dissertation, University of KwaZulu-Natal, South
Africa.
Nel. J., Murray, K., Maherry, A., Petersen, C., Roux, D., Driver, A., Hill, L., van Deventer,
H., Funke, N., Swartz, E. and Smith-Adao, L. (2011). Technical Report for the National
Freshwater Ecosystem Priority Areas Project. Pretoria. Water Research Commission.
Pretoria.
Nhlapi, I. and Gijzen, J.H. (2005). A 3-step strategic approach to sustainable wastewater
management. Water SA. Vol. 31 No. 1 January 2005. p133.
Nisbet, T.R. (2001). The role of forest management in controlling diffuse pollution in UK
forestry. Forest Ecology Management. No. 143:215-226.
Nomqquphu, W. (2005). Overview of the Situation and Challenges for Water Quality
Monitoring and Reporting in South Africa. Work Session on Water Statistics, Vienna 20-22
June 2005.
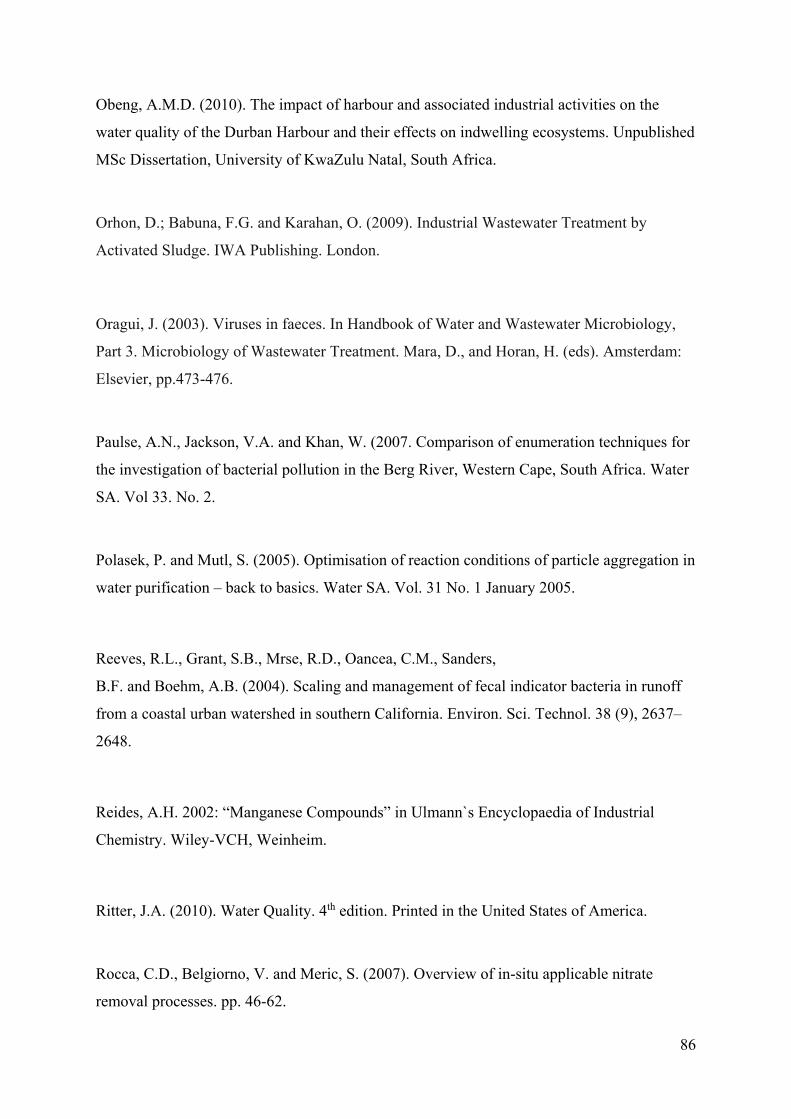
86
Obeng, A.M.D. (2010). The impact of harbour and associated industrial activities on the
water quality of the Durban Harbour and their effects on indwelling ecosystems. Unpublished
MSc Dissertation, University of KwaZulu Natal, South Africa.
Orhon, D.; Babuna, F.G. and Karahan, O. (2009). Industrial Wastewater Treatment by
Activated Sludge. IWA Publishing. London.
Oragui, J. (2003). Viruses in faeces. In Handbook of Water and Wastewater Microbiology,
Part 3. Microbiology of Wastewater Treatment. Mara, D., and Horan, H. (eds). Amsterdam:
Elsevier, pp.473-476.
Paulse, A.N., Jackson, V.A. and Khan, W. (2007. Comparison of enumeration techniques for
the investigation of bacterial pollution in the Berg River, Western Cape, South Africa. Water
SA. Vol 33. No. 2.
Polasek, P. and Mutl, S. (2005). Optimisation of reaction conditions of particle aggregation in
water purification – back to basics. Water SA. Vol. 31 No. 1 January 2005.
Reeves, R.L., Grant, S.B., Mrse, R.D., Oancea, C.M., Sanders,
B.F. and Boehm, A.B. (2004). Scaling and management of fecal indicator bacteria in runoff
from a coastal urban watershed in southern California. Environ. Sci. Technol. 38 (9), 2637–
2648.
Reides, A.H. 2002: “Manganese Compounds” in Ulmann`s Encyclopaedia of Industrial
Chemistry. Wiley-VCH, Weinheim.
Ritter, J.A. (2010). Water Quality. 4th edition. Printed in the United States of America.
Rocca, C.D., Belgiorno, V. and Meric, S. (2007). Overview of in-situ applicable nitrate
removal processes. pp. 46-62.
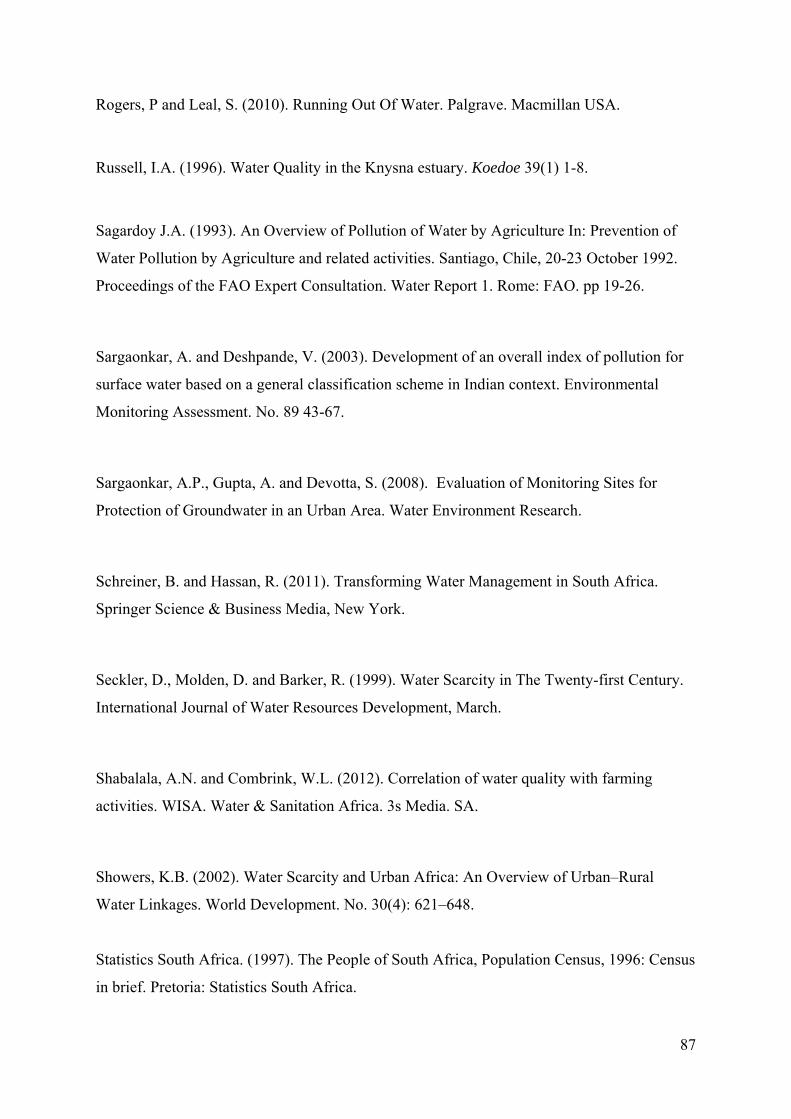
87
Rogers, P and Leal, S. (2010). Running Out Of Water. Palgrave. Macmillan USA.
Russell, I.A. (1996). Water Quality in the Knysna estuary. Koedoe 39(1) 1-8.
Sagardoy J.A. (1993). An Overview of Pollution of Water by Agriculture In: Prevention of
Water Pollution by Agriculture and related activities. Santiago, Chile, 20-23 October 1992.
Proceedings of the FAO Expert Consultation. Water Report 1. Rome: FAO. pp 19-26.
Sargaonkar, A. and Deshpande, V. (2003). Development of an overall index of pollution for
surface water based on a general classification scheme in Indian context. Environmental
Monitoring Assessment. No. 89 43-67.
Sargaonkar, A.P., Gupta, A. and Devotta, S. (2008). Evaluation of Monitoring Sites for
Protection of Groundwater in an Urban Area. Water Environment Research.
Schreiner, B. and Hassan, R. (2011). Transforming Water Management in South Africa.
Springer Science & Business Media, New York.
Seckler, D., Molden, D. and Barker, R. (1999). Water Scarcity in The Twenty-first Century.
International Journal of Water Resources Development, March.
Shabalala, A.N. and Combrink, W.L. (2012). Correlation of water quality with farming
activities. WISA. Water & Sanitation Africa. 3s Media. SA.
Showers, K.B. (2002). Water Scarcity and Urban Africa: An Overview of Urban–Rural
Water Linkages. World Development. No. 30(4): 621–648.
Statistics South Africa. (1997). The People of South Africa, Population Census, 1996: Census
in brief. Pretoria: Statistics South Africa.
88
Tamime. A.Y. and Robinson, R.K. (1999). Yoghurt-Science and Technology. Woodhead
Publishing Limited. Abington Hall, Abington.
Tandoi, V., Jenkins, D. and Wanner, J. (2005). Activated Sludge Separation Problems.
Scientific and Technical Report No. 16. IWA Publishing. London.
Tchobanoglous, G. and Burton, F.L. (1991). Wastewater Engineering Treatment, Disposal
and Reuse. Mc-Graw Hill. New York.
Tchobanoglous, G. Burton, F.L. and Stensel, H. D. (2004). Wastewater Engineering
Treatment and Reuse. Mc-Graw Hill. New York.
Tempelton, M.R. and Butler, D. (2011). An Introduction to Wastewater Treatment. Ventus
Publishing UK.
The Constitution of the Republic of South Africa, Act 108 of 1996. Pretoria: Government
Printer.
Tinmouth, N. (2009) The Mgeni Estuary pre- and post Inanda Dam Estuarine Dynamics.
Department of Geological Sciences, University of KwaZulu-Natal- Westville Campus.
Unpublished Master’s Thesis.
Turton, A. (2008). Three Strategic Water Quality Challenges That Decision Makers Need To
Know About and How the CSIR Should Respond, Pretoria: CSIR Report. Report No.
CSIR/NRE/WR/EXP/2008/010/A.
Ujang, Z. and Henze, M. (2006). Municipal Wastewater Management in Developing
Countries. IWA Publishing. London.
Van Wyk, F. (2001): An integrated manual for the management, control and protection of the
Vaal River Barrage Reservoir, Master’s thesis. Johannesburg: Rand Afrikaans University.

89
Viaroli, P., MistriGuerzoni, S. and Cardoso, A.C. (2005). Structure, functions and ecosystems
alteration in Southern European coastal lagoon: preface. Hydrobiologia 550, 7–9.
Walsh, C.J., Leonard, A.W., Ladson, A.R. and Fletcher, T.D. (2004). Urban Stormwater and
the Ecology of Streams. Cooperative Research Centre for Freshwater Ecology and
Cooperative Research Centre for Catchment Hydrology. NO. 44. Canberra, Australia.
Water and Environmental Health at London and Loughborough. (1999). "Waste water
Treatment Options". Technical brief no. 64. London School of Hygiene & Tropical Medicine
and Loughborough University.
Water SA. (2005). Water value, resource rent recovery and economic welfare cost of
environmental Protection: A water-sector model for the Steelpoort Sub-basin in South Africa.
Vol 31 No. 1 January 2005.
Water SA. (2007). Cyanobacterial Incident Management Frameworks for application by
drinking water suppliers. Vol. 33. No. 5. October 2007.
Water 21. (2011). Of droughts and flooding rains: riparian adaptation to climate. Change.
October 2011. International Water Association. London. UK.
Water 21. (2013). Sustainable treatment of municipal wastewater. October 2013.
International Water Association. London. UK.
WEF (Water Environment Federation). (1996). Operation of Municipal Wastewater
Treatment Plants. Fifth Edition. Alexandria, USA.
WEF (Water Environment Federation). (2008a). Operation of Municipal Wastewater
Treatment Plants. Volume 2: Liquid Processes. McGraw-Hill. New York.

90
WEF (Water Environment Federation). (2008b). Operation of Municipal Wastewater
Treatment Plants. Volume 3: Solids Processes. McGraw-Hill. New York.
Wendelaar, B., Bonga, S.E. and Dederen, L.H.T. (1986). Effects of acidified water on fish.
Endeavour. No.10:198-202.
WISA (Water Institute of Southern Africa). (2002). Handbook for the Operation of
Wastewater Treatment Works.
Wood, P.J. and Armitage, P.D. (1997). Biological effects of fine sediment in the lotic
environment. Environmental Management. No. 21(2): 203.
WWAP (World Water Assessment Programme). 2009. The United Nations World Water
Development Report 3: Water in a Changing World. Paris. UNESCO.
WRC (Water Research Commission). 2002. State of Rivers Report. uMngeni River and
neighboring streams. WRC Report no.TT 200/02. Pretoria.
WRC (Water Research Commission). (2006). Handbook for the Operation of Water
Treatment Works. TT 265/06.
WRC (Water Research Commission). (2013). Natural Organic Matter in Drinking Water
Sources: Its Characterization and Treatability. Report No. 1883/1/12. January 2013.
Xia X., Li S. and Shen Z. (2008). Effect of Nitrification on Nitrogen Flux across Sediment-
Water Interface. Water Environment Research.
Yu X., Konig T., Qi Z and Yongsheng G. (2012). Nitrogen and Phosphorus removal of
locally adapted plant species used in constructed wetlands in China. Water Science &
Technology. Volume 66. No. 4.

APPENDIX A
91

APPENDIX A
92
APPENDIX A
93
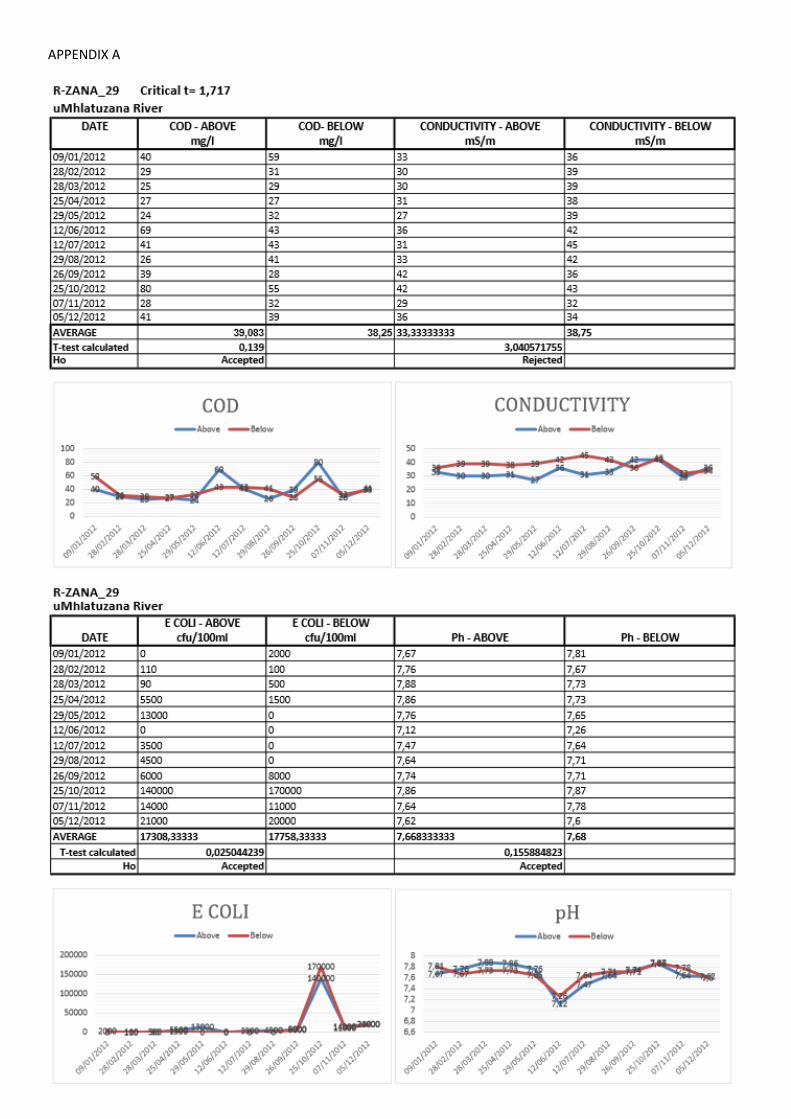
APPENDIX A
94
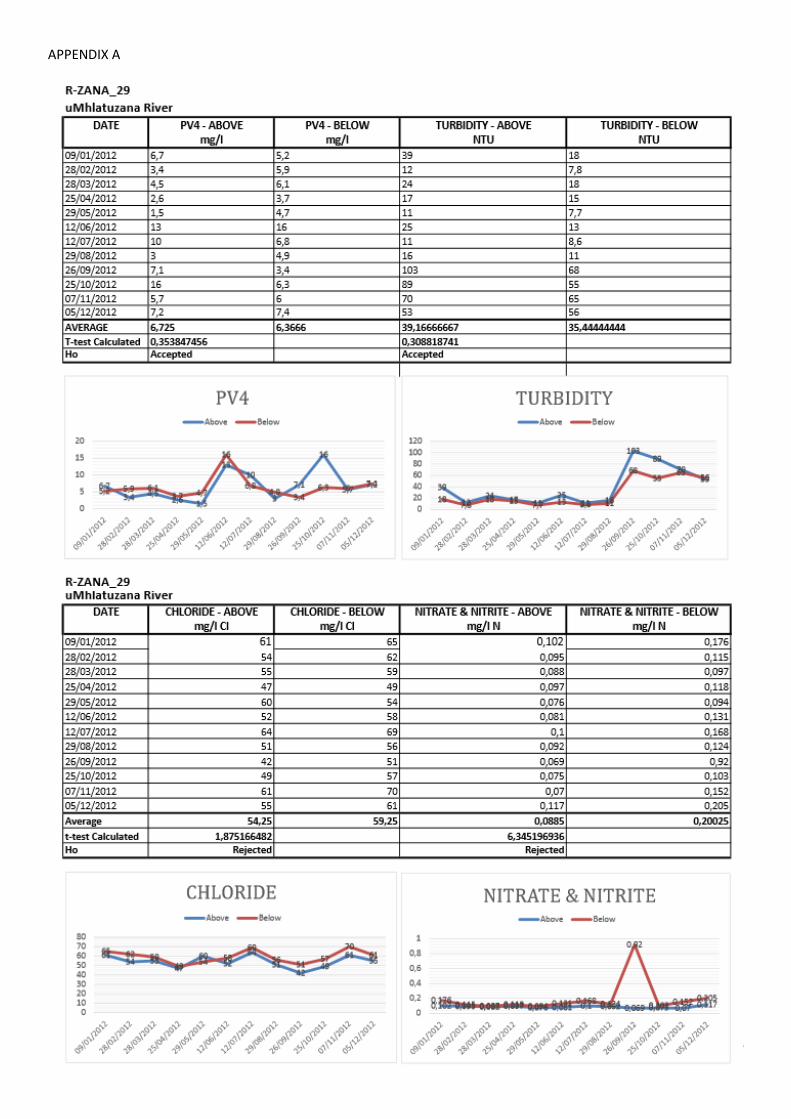
APPENDIX A
95

APPENDIX A
96
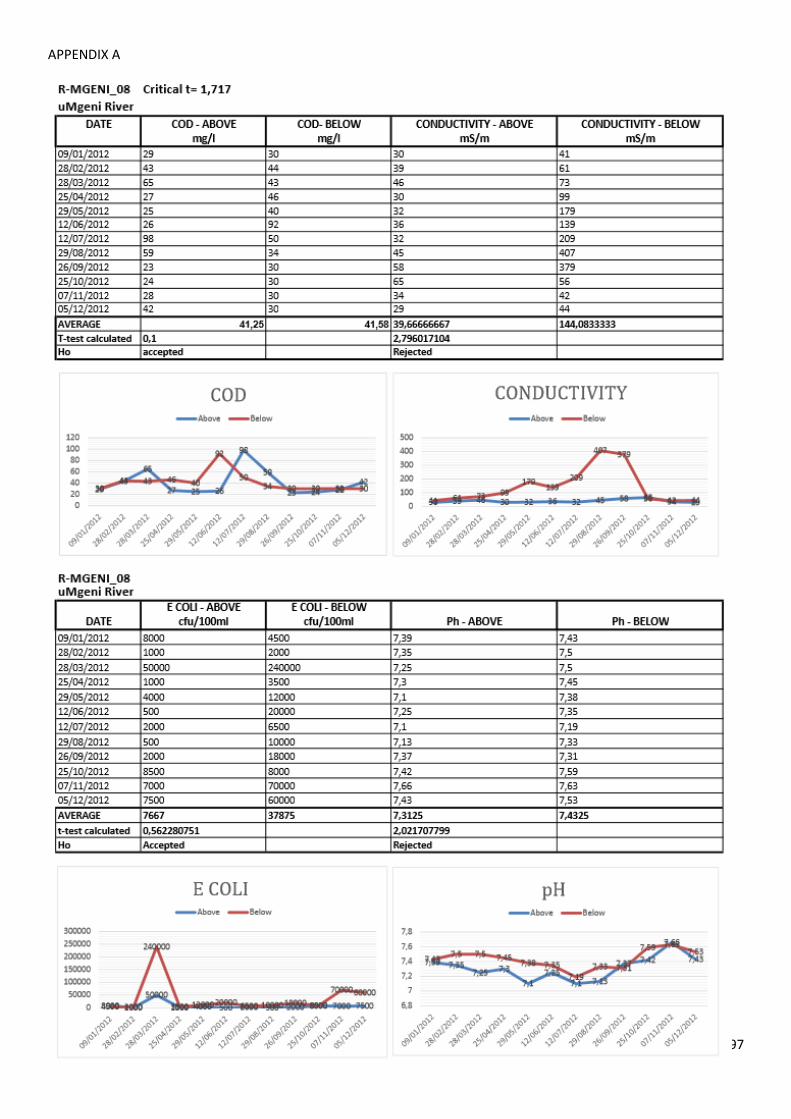
APPENDIX A
97
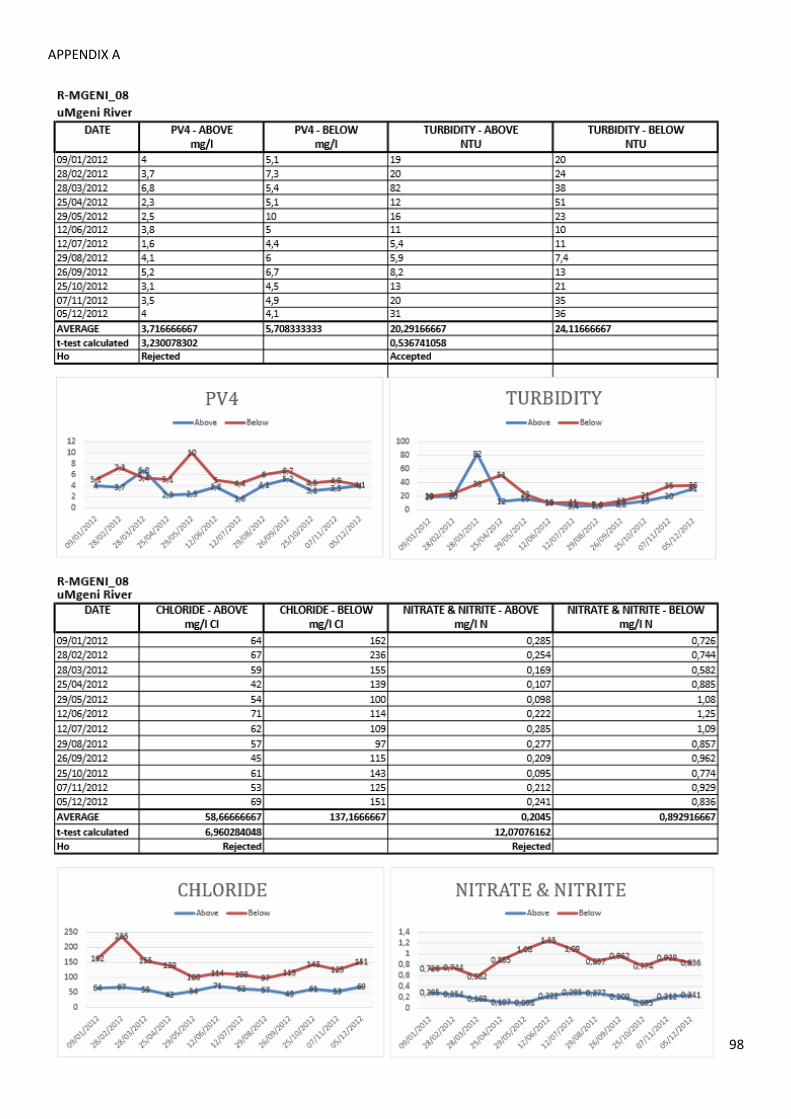
APPENDIX A
98
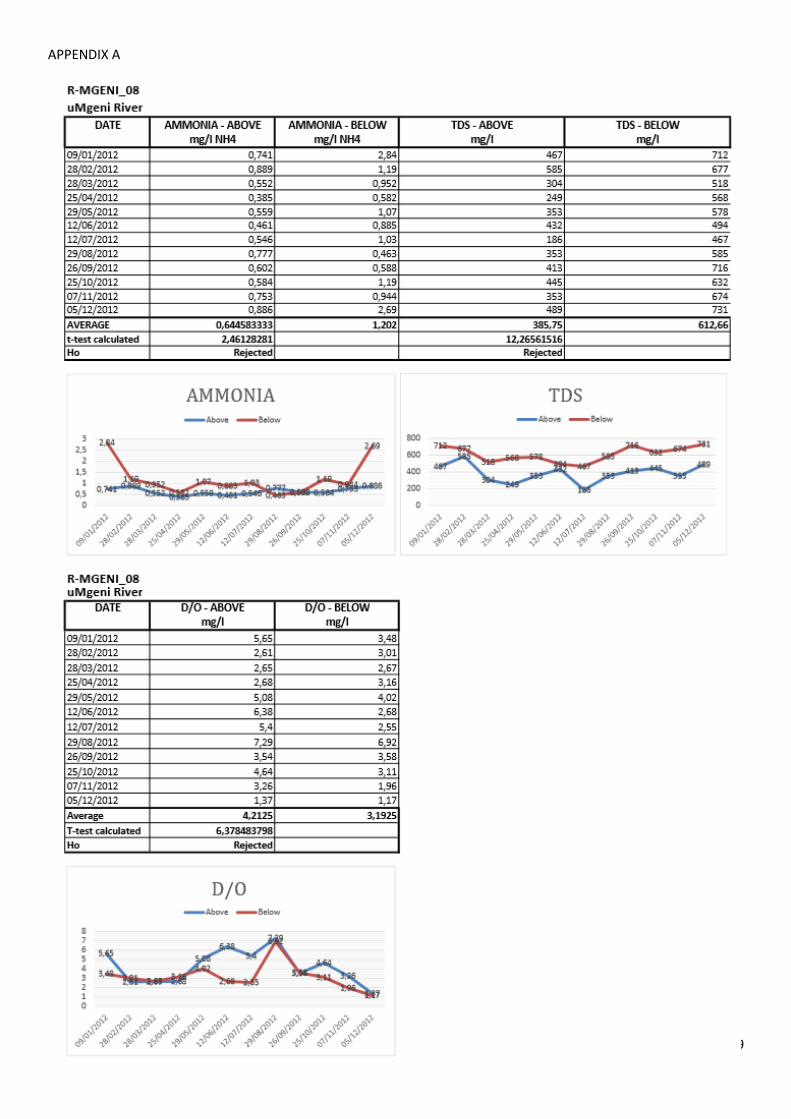
APPENDIX A
99