assessment of the northern gulf of st. lawrence (3pn,...
TRANSCRIPT

Canadian Science Advisory Secretariat Quebec Region Science Advisory Report 2015/041
December 2015
ASSESSMENT OF THE NORTHERN GULF OF ST. LAWRENCE (3PN, 4RS) COD STOCK IN 2014
Figure 1. Cod stock management area in the Northern Gulf of St. Lawrence (3Pn, 4RS).
Context The first total allowable catch (TAC) of the northern Gulf of St. Lawrence cod stock (NAFO subdivision 3Pn and divisions 4R and 4S), in 1977, was 55 000 t. It reached a maximum of 100 000 t between 1983 and 1985. This fishery was then placed under two moratoriums (1994 to 1996 and 2003). Between 1974 and 1993, this stock was fished by Canadian fleets using fixed and mobile gear as well as by some foreign fleets using mobile gear. Since 1997, the majority of landings have been made by the Canadian fleet using fixed gear (handlines, longlines and gillnets). Recreational fishing has been practiced and regulated for several years although it is not well documented.
In 2010, the Committee on the Status of Endangered Wildlife in Canada (COSEWIC) designated the Laurentian North (3Pn,4RS and 3Ps) cod population, part of which consists of northern Gulf of St. Lawrence (3Pn, 4RS) cod, as endangered, based essentially on the extent of the decline (78–89%) in adult abundance over three generations (30 years). A recovery potential assessment was conducted in 2011. The northern Gulf cod spawning stock biomass has been in the critical zone, well below the limit reference point, since 1990.
This resource is managed mainly through the imposition of an annual TAC. Several other management measures (number and types of gear, area closures during spawning and in winter (3Ps), observers, dockside monitoring, minimum size, bycatch monitoring, rules for the recreational fishery, etc.) are also applied. Since 1999, the management year has started on May 15 of the current year and ended on May 14 of the following year.
This stock is assessed every two years using mainly data from commercial fisheries, sentinel programs (fixed and mobile gear) and the DFO research survey. This Science Advisory Report is from the February 19, 2015 meeting on the assessment of northern Gulf of St. Lawrence cod stocks.

Quebec Region Assessment of the Northern Gulf of St. Lawrence
(3Pn, 4RS) Cod Stock in 2014
2
SUMMARY • The total allowable catch (TAC) for the 2012 to 2014 period was 1 500 t per year. Landings for
those three years totalled 1 311, 1 206 and 1 229 t. Landings from the recreational fishery are not known.
• Commercial fishery performance indicators estimated from fishers’ logbooks (longline and gillnet) show an increase from 2010 to 2013 and a slight decrease in 2014. In 2014, they were at average levels (1997–2013). The results of a survey of fishers regarding their fishing yields paint a similar picture.
• Sentinel fishery catch rates (longline and gillnet) increased from 2010 to 2012 or 2013 and then decreased, down to the series average (1995–2013) in 2014.
• In 2014, abundance indices from the DFO research survey and sentinel fishery trawl survey were above average for their respective series. This increase is attributed largely to year-class abundance from 2011 and 2012. The spatial distribution of cod has expanded in Division 4S and is now similar to that observed in the early 1990s.
• Natural mortality estimated by sequential population analysis (SPA) has increased substantially between 2002 and 2014. Possible causes are predation by seals and unaccounted fishing mortality.
• The estimated exploitation rates from the tagging program and the SPA diminished significantly between 2008 and 2014.
• Recruitment at age three, as estimated by the SPA since 1990, is higher in 2007, 2008 and 2009 (2004 to 2006 cohorts) as well as in 2014 and 2015.
• The spawning stock’s abundance has been in the critical zone, well below the limit reference point, for the last 25 years. Catches in 2015 and 2016 should be kept at the lowest possible level.
• Projections for 2016 and 2017 indicate that, with an annual harvest of 1 500 t (2015-2016 and 2016-2017), the mature biomass should increase. This increase would mainly be related to the abundance of the recent 2011 and 2012 cohorts. However, their abundance will have to be confirmed over the coming years.
• SPA diagnostic tools reveal some uncertainties in the age estimates. This has been a recurring problem for several years. However, these uncertainties cast no doubt on the fact that the stock is still in the critical zone. New analytical approaches could be considered.
BACKGROUND
Species biology In summer, 3Pn and 4RS cod are distributed throughout the northern Gulf of St. Lawrence at depths of 50 to 200 metres. In winter, the fish gather off southwestern (3Pn) and southern (3Psa and 3Psd) Newfoundland at depths of 300 to 500 m. Tagging studies indicate that this stock is generally isolated from neighboring stocks. There seems to be little mixing with adjacent stocks (i.e. to the southwest (4T) and northeast (2J, 3KL) in summer, and to the southeast (3Ps) in winter).
Spawning takes place mainly in April and May at depths of 200 to 250 metres. The main breeding area is located off Port au Port (west coast of Newfoundland). Age at 50% maturity has varied over time for this stock and is currently between four and five years. After spawning, the eggs disperse with the surface currents, and in fall, juveniles return to deeper environments.

Quebec Region Assessment of the Northern Gulf of St. Lawrence
(3Pn, 4RS) Cod Stock in 2014
3
Cod have a varied diet (zooplankton, crustaceans, and pelagic and benthic fish). Large cod eat mainly herring, flatfish, cod and crab. Predation on northern Gulf cod is poorly documented but several studies conducted in the southern Gulf of St. Lawrence (4T) report potentially high grey seal predation.
Ecosystem Every year, Fisheries and Oceans Canada (DFO) uses the Atlantic Zone Monitoring Program (AZMP) to assess prevailing physical oceanographic conditions in the Gulf of St. Lawrence. Conditions encountered in the northern Gulf in the last four years (2011 to 2014) were generally warmer compared to historical averages for surface water temperatures, the cold intermediate layer and deep waters. However, the sea ice volume in the winter of 2013-2014 was the third highest since 1969; as a result, the characteristics of the cold intermediate layer in the summer of 2014 were more representative of the historical average.
Although at low levels, capelin and herring populations are stable or on the rise while mackerel populations are declining. Greenland Halibut stock is stable while Atlantic Halibut stock is increasing. Although redfish stock biomass (unit 1 and 2) is low, strong cohorts (2011, 2012) have been observed in recent years, particularly in the northern Gulf.
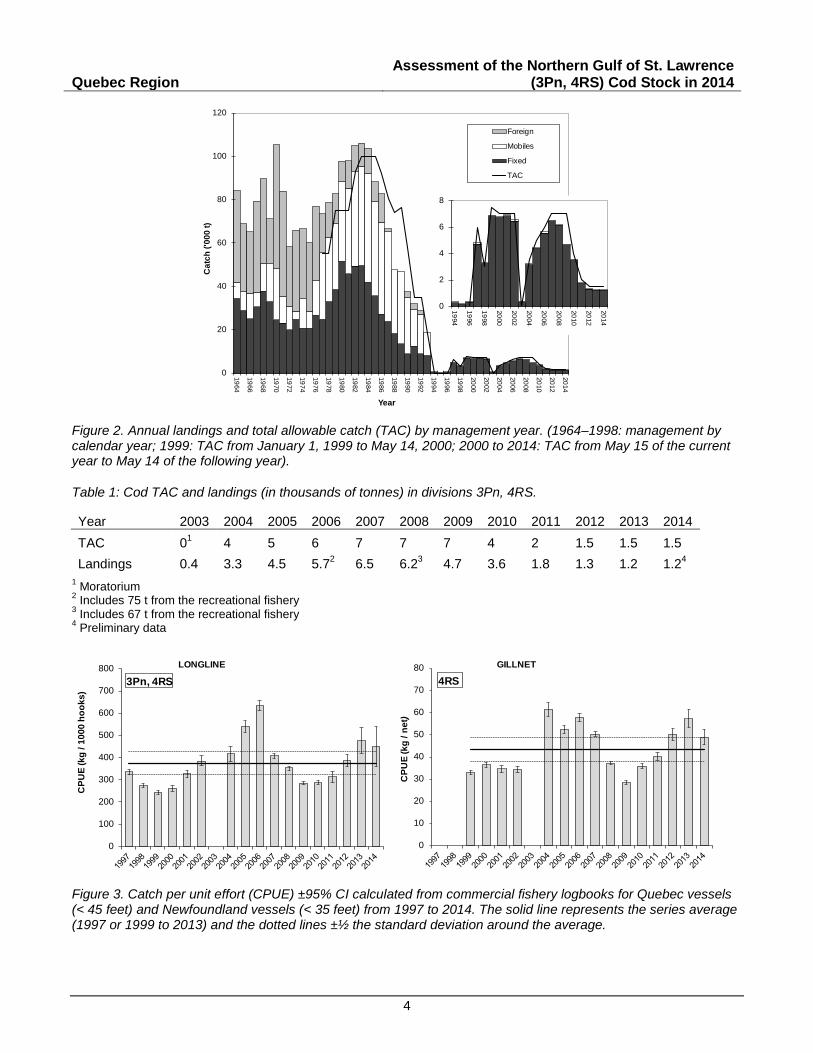
Fishery Cod TAC and landings steadily declined from 1984 to 1993 in the northern Gulf of St. Lawrence (Figure 2). The fishery was under moratorium from 1994 to 1996 and in 2003. Landings ranged between 1 772 and 6 470 t between 2004 and 2011 for TACs ranging from 2 000 to 7 000 t (Table 1). Since 2012, the annual TAC has been 1 500 t, and landings were 1 311 t, 1 206 t and 1 229 t for 2012, 2013 and 2014 (preliminary data). Cod landings in the recreational fishery are not known.
Commercial fishery performance indices taken from logbook data for the fixed gear fleets (gillnet and longline, Newfoundland vessels under 35 feet and Quebec vessels under 45 feet) show an increase in catches per unit effort (CPUE) after the 2003 moratorium, the maximum value being observed in 2004 for gillnets and in 2006 for longlines (Figure 3). After these maximums were reached, CPUEs decreased until 2009 then increased again until 2013. In 2014, these indices were slightly lower than the 2013 values but were at average levels for their respective series. The performance index for the commercial longline fishery (Quebec Region) suggests the same trends.
Fish caught in the commercial fishery were between 3 and 13 years of age. In the years when CPUEs in the commercial fishery were highest (2005, 2006, 2013, 2014), the proportion of individuals older than seven years of age in landings ranged between 72% and 83%, whereas in the years where CPUEs were lowest (2008 to 2011), this proportion ranged from 45% to 65%.
Since 1999, more than 90% of cod landings have come from the directed cod fishery. Cod bycatch landings are low and mainly occur in the directed Atlantic Halibut and Greenland Halibut fisheries, whereas bycatches in the directed northern Gulf cod fishery essentially consist of Greenland Halibut and Atlantic Halibut.
Cod is also a bycatch that is not accounted for in shrimp fishery landing statistics. These catches are of 1 kg or less per tow, and the cod caught are small (under 30 cm) (1–2 years). An analysis of the at-sea observer database indicates that cod is caught in slightly more than 20% of shrimp tows. In number, these catches represent less than 1% of biomass estimates from the DFO survey.
Quebec Region Assessment of the Northern Gulf of St. Lawrence
(3Pn, 4RS) Cod Stock in 2014
4
Figure 2. Annual landings and total allowable catch (TAC) by management year. (1964–1998: management by calendar year; 1999: TAC from January 1, 1999 to May 14, 2000; 2000 to 2014: TAC from May 15 of the current year to May 14 of the following year).
Table 1: Cod TAC and landings (in thousands of tonnes) in divisions 3Pn, 4RS.
Year 2003 2004 2005 2006 2007 2008 2009 2010 2011 2012 2013 2014 TAC 01 4 5 6 7 7 7 4 2 1.5 1.5 1.5 Landings 0.4 3.3 4.5 5.72 6.5 6.23 4.7 3.6 1.8 1.3 1.2 1.24
1 Moratorium 2 Includes 75 t from the recreational fishery 3 Includes 67 t from the recreational fishery 4 Preliminary data
Figure 3. Catch per unit effort (CPUE) ±95% CI calculated from commercial fishery logbooks for Quebec vessels (< 45 feet) and Newfoundland vessels (< 35 feet) from 1997 to 2014. The solid line represents the series average (1997 or 1999 to 2013) and the dotted lines ±½ the standard deviation around the average.
0
20
40
60
80
100
120
1964
1966
1968
1970
1972
1974
1976
1978
1980
1982
1984
1986
1988
1990
1992
1994
1996
1998
2000
2002
2004
2006
2008
2010
2012
2014
Cat
ch ('
000
t)
Year
Foreign
Mobiles
Fixed
TAC
0
2
4
6
8
1994
1996
1998
2000
2002
2004
2006
2008
2010
2012
2014
0
100
200
300
400
500
600
700
800
CPU
E (k
g / 1
000
hook
s)
LONGLINE
3Pn, 4RS
0
10
20
30
40
50
60
70
80
CPU
E (k
g / n
et)
GILLNET
4RS
Quebec Region Assessment of the Northern Gulf of St. Lawrence
(3Pn, 4RS) Cod Stock in 2014
5
ASSESSMENT
Sources of information The status of cod stock in the northern Gulf of St. Lawrence was assessed using data from commercial fisheries (landings, number at age, fishery performance index), a tagging program (exploitation rate), an abundance index calculated from the DFO research survey (4RS, 1990 to 2014), abundance indices from the fixed gear sentinel program (gillnets and longlines, 1995 to 2014), an abundance index derived from the mobile gear sentinel fisheries program (3Pn, 4RS, 1995–2014); biological, fecundity and maturity data from annual surveys dating back to 2002 (except 2003) and cod condition data collected annually since 1998.
Stock status
Biological data The proportion of mature fish at 4 years of age was less than 10% before 1994 but since 1995, it has generally been greater than 15% and even greater than 40% in 1995, 1997, 1999, 2009 and 2011. It ranged from 18 to 25% over the past three years. Fecundity at age decreased between 1984 and 1994. A gradual increase has been observed since 1994 and current levels are similar to those from 1985 to 1989.
Physical cod condition monitoring conducted mainly as part of the sentinel fisheries program shows an annual cycle. Condition indices are lower in spring before spawning; they then increase from summer until fall, when they peak. In 2014, this seasonal cycle expressed using Fulton’s index (somatic K) was similar to the 1998–2013 average. In 2014, the hepatosomatic index (HSI), which further monitors the recent fish feeding success, showed values similar to the 1998–2013 average.
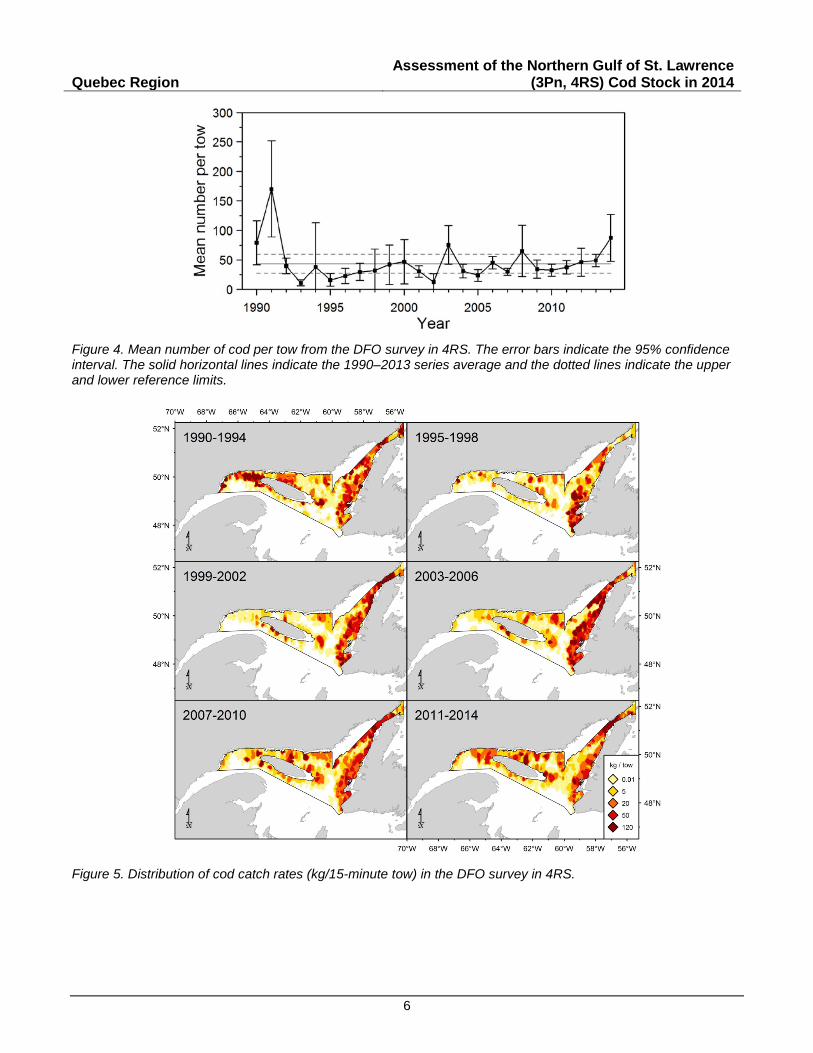
DFO survey The mean number and mean weight per tow for cod have been generally low and stable since 1992 (Figure 4). In 2014, an increase is observed in these indices, which are above the 1990–2013 series average. This is the second highest value for mean number per tow since 1990. In 2014, the wide range of the size frequency distribution shows that, in particular, the two modes observed in 2013 at 18 and 26 cm remain so in 2014 at 23 cm (2012 cohort) and 34 cm (2011 cohort). The abundance of these two cohorts is above the 1990–2013 series average.
Cod distribution in the northeastern Gulf remained similar from 1994 to 2014. However, in the western part of the Gulf, cod concentrations gradually declined from 1995 to 2006. From 2007 onward, the spatial distribution of cod expanded in Division 4S, especially north and west of Anticosti Island. Finally, recent cod distribution (2011–2014) is now similar to that observed in the early 1990s (1990–1994) (Figure 5).
Quebec Region Assessment of the Northern Gulf of St. Lawrence
(3Pn, 4RS) Cod Stock in 2014
6
Figure 4. Mean number of cod per tow from the DFO survey in 4RS. The error bars indicate the 95% confidence interval. The solid horizontal lines indicate the 1990–2013 series average and the dotted lines indicate the upper and lower reference limits.
Figure 5. Distribution of cod catch rates (kg/15-minute tow) in the DFO survey in 4RS.

Quebec Region Assessment of the Northern Gulf of St. Lawrence
(3Pn, 4RS) Cod Stock in 2014
7
Mobile gear sentinel fishery The sentinel bottom trawl fisheries index comes from stratified random surveys conducted in July in areas 3Pn, 4R and 4S. It includes two periods: 1995 to 2002, involving only depth strata of more than 20 fathoms; and from 2003 onward, when three 10- to 20-fathom strata were added to those previously sampled. This index shows no clear trend (Figure 6). The 2014 values (mean number and weight per tow) are above the 2003–2013 average, which is mainly explained by the abundance of two- and three-year-old fish in the catches (2011 and 2012 cohort).
Figure 6. Mean number of cod per 30-minute tow (±95% confidence interval) during the July mobile gear sentinel fisheries survey. The solid lines represent the averages for each series (1995–2002, 20 fathoms or more; 2003–2013: 10 fathoms or more) and the dotted lines ±½ the standard deviation around the average.
Fixed gear sentinel fishery CPUEs from the fixed gear sentinel fisheries program (gillnet and longline) have been used as abundance indices in cod assessments since 1998. Data are collected at 24 sites along the coastlines in 3Pn, 4R and 4S. Average gear deployment depths are 90 m for longline and 80 m for gillnet. The longline index increased between 1995 and 2006 then decreased, reaching its low in 2010. It then increased until 2013. In 2014, the longline index value was at the series average (1995–2013). The gillnet index shows a similar pattern and its 2014 value is also at the 1995–2013 series average (Figure 7). It should be noted that this pattern is similar to that of the commercial fishery CPUE.
0
10
20
30
40
50
60
7019
95
1996
1997
1998
1999
2000
2001
2002
2003
2004
2005
2006
2007
2008
2009
2010
2011
2012
2013
2014
+20 Fathoms
+10 Fathoms
Mea
n nu
mbe
r by
tow
Year

Quebec Region Assessment of the Northern Gulf of St. Lawrence
(3Pn, 4RS) Cod Stock in 2014
8
Figure 7. Standardized catch per unit effort (CPUE) for the fixed gear sentinel fisheries program. The solid line represents the 1995–2013 series average and the dotted lines ±½ the standard deviation around the average. The error bars indicate the 95% confidence interval.
Sequential population analysis A sequential population analysis (SPA), conducted using NFT ADAPT, was used to estimate several northern Gulf of St. Lawrence cod stock status parameters, including exploitation rate, population abundance, spawning stock biomass (SSB) and natural mortality (M). Natural mortality includes all potential mortality sources that are not accounted for in catch statistics (F). The SPA is based on catches at age in the commercial fishery and is adjusted based on various abundance indices: longline sentinel (1995 to 2014, ages 3 to 13), gillnet sentinel (1995 to 2014, ages 4 to 13); mobile sentinel ≥ 20 fathoms (1995 to 2002, ages 1 to 11); mobile sentinel ≥ 10 fathoms (2003 to 2014, ages 1 to 11), and the DFO survey (1990 to 2014, ages 1 to 11).
For the SPA, the M values were set at 0.2 from 1974 to 1985, 0.4 from 1986 to 1996 and 0.2 from 1997 to 2001. For the 2002–2014 period, the M values were estimated by blocks of four years using sensitivity analysis (NFT VPA/ADAPT). The estimated values were M=0.31 for 2002 to 2005, M=0.51 for 2006 to 2009 and M=0.50 from 2010 to 2014. Possible causes that may explain the increase in natural mortality from 2006 onward are seal predation and unaccounted fishing mortality.
There was a significant decrease in cod population abundance from the late 1980s to the early 1990s (Figure 8). It reached a high of 559 million in 1980 and a low of 31 million in 1994. This abundance remained low and stable until 2005, then exhibited a few fluctuations until 2014. The 2015 estimate (143 million) is the highest since 1993. This high value depends essentially on the abundance of the 2011 and 2012 cohorts. There was also a significant drop in the abundance of mature individuals from 1982 to 1994, and it remained stable and low until 2014.
0
10
20
30
40
50
60
70
80
90
1994 1996 1998 2000 2002 2004 2006 2008 2010 2012 2014
Stan
dard
ised
CPU
E
Year
Longline
0
10
20
30
40
50
60
70
1994 1996 1998 2000 2002 2004 2006 2008 2010 2012 2014
Stan
dard
ised
CPU
E
Year
Gillnet

Quebec Region Assessment of the Northern Gulf of St. Lawrence
(3Pn, 4RS) Cod Stock in 2014
9
Figure 8. Total population (ages 3+) and mature population numbers estimated by SPA.
The abundance of three-year-old individuals estimated by SPA since 1990 was higher in 2007, 2008 and 2009 (2004 to 2006 cohorts) as well as in 2014 and 2015 (Figure 9).
The spawning stock biomass has been in the critical zone, well below the limit reference point (LRP), since 1990 and has been stable for several years. The estimated value for 2014 is 17 559 t ±1 401.
Figure 9. Number of three-year-old recruits estimated by SPA.
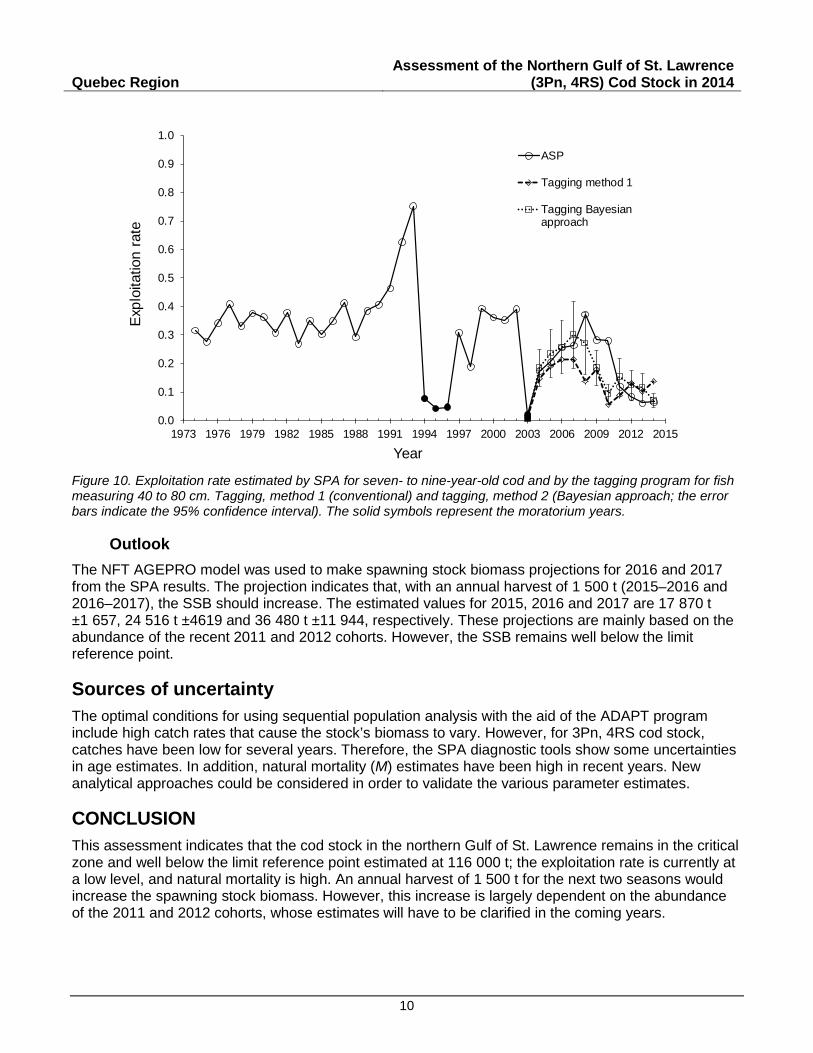
The exploitation rate for seven- to nine-year-old individuals, estimated using SPA, was high from 1997 to 2002 and in 2008, and it has dropped significantly from 2007 to 2014 (Figure 10) following TAC reductions.
Tagging A total of 87 147 cod in the northern Gulf were tagged between 1995 and 2014 in a tagging program whose aim was to estimate an exploitation rate. Of this number, 7 000 tags were returned by fishers, 89% of whom were from areas 3Pn, 4R and 4S. The exploitation rate estimated from this tagging program increased from 2003 to 2007 only to drop to a low level, where it has been since 2011 (Figure 10).
0
100
200
300
400
500
600
1973 1976 1979 1982 1985 1988 1991 1994 1997 2000 2003 2006 2009 2012 2015
Pop
ulat
ion
num
bers
(milli
on)
Year
Mature
3+
0
50 000
100 000
150 000
200 000
250 000
1974
1976
1978
1980
1982
1984
1986
1988
1990
1992
1994
1996
1998
2000
2002
2004
2006
2008
2010
2012
2014
Rec
ruitm
ent a
t age
3
Year
Quebec Region Assessment of the Northern Gulf of St. Lawrence
(3Pn, 4RS) Cod Stock in 2014
10
Figure 10. Exploitation rate estimated by SPA for seven- to nine-year-old cod and by the tagging program for fish measuring 40 to 80 cm. Tagging, method 1 (conventional) and tagging, method 2 (Bayesian approach; the error bars indicate the 95% confidence interval). The solid symbols represent the moratorium years.
Outlook The NFT AGEPRO model was used to make spawning stock biomass projections for 2016 and 2017 from the SPA results. The projection indicates that, with an annual harvest of 1 500 t (2015–2016 and 2016–2017), the SSB should increase. The estimated values for 2015, 2016 and 2017 are 17 870 t ±1 657, 24 516 t ±4619 and 36 480 t ±11 944, respectively. These projections are mainly based on the abundance of the recent 2011 and 2012 cohorts. However, the SSB remains well below the limit reference point.
Sources of uncertainty The optimal conditions for using sequential population analysis with the aid of the ADAPT program include high catch rates that cause the stock’s biomass to vary. However, for 3Pn, 4RS cod stock, catches have been low for several years. Therefore, the SPA diagnostic tools show some uncertainties in age estimates. In addition, natural mortality (M) estimates have been high in recent years. New analytical approaches could be considered in order to validate the various parameter estimates.
CONCLUSION This assessment indicates that the cod stock in the northern Gulf of St. Lawrence remains in the critical zone and well below the limit reference point estimated at 116 000 t; the exploitation rate is currently at a low level, and natural mortality is high. An annual harvest of 1 500 t for the next two seasons would increase the spawning stock biomass. However, this increase is largely dependent on the abundance of the 2011 and 2012 cohorts, whose estimates will have to be clarified in the coming years.
0.0
0.1
0.2
0.3
0.4
0.5
0.6
0.7
0.8
0.9
1.0
1973 1976 1979 1982 1985 1988 1991 1994 1997 2000 2003 2006 2009 2012 2015
Exp
loita
tion
rate
Year
ASP
Tagging method 1
Tagging Bayesianapproach

Quebec Region Assessment of the Northern Gulf of St. Lawrence
(3Pn, 4RS) Cod Stock in 2014
11
OTHER CONSIDERATIONS
Survey Since 1998, the Lower North Shore Fishermen’s association (LNSFA) and the Newfoundland and Labrador-based Fish, Food and Allied Workers (FFAW) have been conducting a telephone survey (random draw) with fixed gear fishers who hold a directed cod licence. The objective is to document various issues related to northern Gulf of St. Lawrence commercial cod fisheries. The survey results indicate roughly the same trends as the commercial fishery CPUEs and the fixed gear sentinel fishery indices. The answers to the question about fishery performance indicate that yields were higher before 2007, decreased until 2009, and increased again until 2014 for the three NAFO areas (Figure 11). Respondents also noted that the fish were smaller in 2008 and 2009 and that sizes had increased afterwards. No noticeable change in cod condition or migration profile was noted by the survey respondents.
Figure 11. Performance index by NAFO Division from the telephone survey of fixed gear fishers (dotted lines: years with no survey).
4
5
6
7
8
9
10
1997 2000 2003 2006 2009 2012 2015
Inde
x
Year
4R
3Pn
4S

Quebec Region Assessment of the Northern Gulf of St. Lawrence
(3Pn, 4RS) Cod Stock in 2014
12
SOURCES OF INFORMATION This Science Advisory Report is from the February 19, 2015 meeting on the Assessment of the northern Gulf of St. Lawrence (3Pn, 4RS) cod. Additional publications from this meeting will be posted on the Fisheries and Oceans Canada Science Advisory Schedule as they become available.
Bourdages, H., Brassard, C., Desgagnés, M., Galbraith, P., Gauthier, J., Lambert, J., Légaré, B., Parent, E. and Schwab, P. 2015. Preliminary results from the groundfish and shrimp multidisciplinary survey in August 2014 in the Estuary and northern Gulf of St. Lawrence. DFO Can. Sci. Advis. Sec. Res. Doc. 2014/115. v + 96 p.
Bousquet, N., Chassot, E., Duplisea, D. E. and Hammill, M. O. 2014. Forecasting the major influences of predation and environment on cod recovery in the northern Gulf of St. Lawrence. PLoS ONE 9(2): e82836. doi:10.1371/journal.pone.0082836.
Dawe, E., Koen-Alonso, M., Chabot, D., Stansbury, D. and Mullowney, D. 2012. Trophic interactions between key predatory fishes and crustaceans: comparison of two Northwest Atlantic systems during a period of ecosystem change. Mar. Ecol. Prog. Ser. Vol. 469: 233–248.
DFO. 2007. Accounting for changes in natural mortality in Gulf of St. Lawrence cod stocks. DFO Can. Sci. Advis. Sec. Sci. Advis. Rep. 2007/002.
DFO. 2011. Recovery potential assessment for Laurentian North designatable units (3Pn, 4RS and 3Ps) of Atlantic Cod (Gadus morhua). DFO Can. Sci. Advis. Sec. Sci. Advis. Rep. 2011/026.
DFO. 2012. Assessment of the northern Gulf of St. Lawrence (3Pn, 4RS) cod stock in 2011. DFO Can. Sci. Advis. Sec. Sci. Advis. Rep. 2012/005.
Duplisea, D. and Fréchet, A. 2011. Updated reference point estimates for northern Gulf of St. Lawrence (3Pn, 4RS) cod (Gadus morhua) based on revised beginning of year weights at age. DFO Can. Sci. Advis. Sec. Res. Doc. 2011/003 iv + 8 p.
Hammill, M. O., Stenson, G. B., Swain, D. P. and Benoît, H. P. 2014. Feeding by grey seals on endangered stocks of Atlantic cod and white hake. ICES Journal of Marine Science; doi:10.1093/icesjms/fsu123.
Le Bris, A., Fréchet, A. and Brêthes, J.-C. 2009. Estimation of the exploitation rate of the northern Gulf of St. Lawrence (3Pn, 4RS) Atlantic cod (Gadus morhua) stock, based on tagging data. DFO Can. Sci. Advis. Sec. Res. Doc. 2009/012. v + 35.
Le Bris, A., Fréchet, A., Galbraith, P. S. and Wroblewski, J. S. 2013. Evidence for alternative migratory behaviours in the northern Gulf of St. Lawrence population of Atlantic cod (Gadus morhua L.). ICES J. Mar. Sci. 70, 793–804.
Yvelin, J.-F., Fréchet, A. and Brêthes, J.-C. 2005. Migratory routes and stock structure of cod from the Northern Gulf of St. Lawrence (3Pn, 4RS). DFO Can. Sci. Advis. Sec. Res. Doc. 2005/055. 56 p.
Quebec Region Assessment of the Northern Gulf of St. Lawrence
(3Pn, 4RS) Cod Stock in 2014
13
THIS REPORT IS AVAILABLE FROM THE: Centre for Science Advice (CSA)
Quebec Region Fisheries and Oceans Canada Maurice Lamontagne Institute
P.O. Box 1000 Mont-Joli, Quebec (Canada)
G5H 3Z4
Telephone: 418-775-0825 Email: [email protected]
Internet address: www.dfo-mpo.gc.ca/csas-sccs/
ISSN 1919-5087 © Her Majesty the Queen in Right of Canada, 2015
Correct citation for this publication:
DFO. 2015. Assessment of the northern Gulf of St. Lawrence (3Pn, 4RS) cod stock in 2014. DFO Can. Sci. Advis. Sec. Sci. Advis. Rep. 2015/041.
Aussi disponible en français :
MPO. 2015. Évaluation du stock de morue du nord du golfe du Saint-Laurent (3Pn, 4RS) en 2014. Secr. can. de consult. sci. du MPO, Avis sci. 2015/041.