assessment of the population dynamics of endagered plants...
TRANSCRIPT

1
ASSESSMENT OF THE POPULATION DYNAMICS OF ENDAGERED PLANTS NATIVE TO HAWAI’I
Lalasia Bialic-Murphy Ph.D. Proposal, October 1, 2014
Department of Botany University of Hawai’i at Manoa
Dissertation Committee Orou Gaoue
Kasey Barton Tom Ranker
Tamara Ticktin Qi Chen
Appendix ES-12-2 PhD Proposal Lalasia Bialic-Murphy

2
Table of Contents
1 - Introduction ............................................................................................................................................. 3 2 - Overview of Demographic Modeling Techniques ..................................................................... 6 3 - Study Question #1: How does microhabitat heterogeneity affect population persistence of critically endangered plants confined to narrow ecological niches? A case study of an island endemic shrub, Cyrtandra dentata. .................................................................... 9 Background and Rationale ................................................................................................................ 9 Material and methods ...................................................................................................................... 10 Data collection ..................................................................................................................................... 13 Data Analysis ........................................................................................................................................ 14
4 - Study Question #2: How does fruit predation by rodents and pollen limitation affect the population dynamics of endangered plants native to island ecosystems? A case study of an island endemic shrub, Delissea waianaeensis. .................................................................... 17 Background and rationale .............................................................................................................. 17 Material and methods ...................................................................................................................... 18 Data collection ..................................................................................................................................... 21 Data analysis ........................................................................................................................................ 25
5 - Study Question # 3: How will climate change affect the population dynamics of critically endangered plants? A case study of an island endemic shrub, Schiedea obovata. ......................................................................................................................................................................... 26 Background and rationale .............................................................................................................. 26 Material and methods ...................................................................................................................... 27 Data collection ..................................................................................................................................... 31 Data Analysis ........................................................................................................................................ 33
6 - Study Question #4: For plant reintroductions, are the vital rates of outplanted individuals and the first filial generation different? If so, does the transition from an outplanted to a naturally occurring population affect short and long-term population dynamics? .................................................................................................................................................... 35 Background and rationale .............................................................................................................. 35 Material and methods ...................................................................................................................... 36 Data collection ..................................................................................................................................... 36 Data analysis ........................................................................................................................................ 37
7 - Timeline ................................................................................................................................................. 38
Appendix ES-12-2 PhD Proposal Lalasia Bialic-Murphy

3
1 - Introduction
The primary focus of population ecology is understanding species’ population dynamics
and the environmental parameters and physiological mechanisms underpinning
survivorship, growth, and reproduction (i.e., vital rates) (Menges 1990; Morris & Doak
2002). Altered abiotic and biotic environmental stressors (i.e., threats), such as climate
change and the introduction of exotic competitors, predators and pathogens, can have
long-lasting effects on a species’ vital rates and population persistence (Ehrlen 2013).
The influence of species interactions on population growth rate is dependent on which
life stages are impacted and the magnitude of effect. Previous studies suggest that the
relative importance of life stages on population growth vary systematically by life history.
In general, the relative importance of seedling survival and growth on population growth
rate is often proportionally greater for short-lived species. Conversely, the effect of
changes in the survival of mature plants on population growth rate is often proportionally
greater for long-lived species (Silvertown et al. 1996). However, these general patterns
do not always hold true, particularly for declining populations that have undergone recent
disturbance or active management (Menges 1990; Silvertown et al. 1996). To fully
understand the effect of environmental stressors on population dynamics, it is necessary
to link the effect of targeted environmental stressors on susceptible life stages to
population growth rate.
To date, the primary strategies that are used by conservation practitioners to prevent the
loss of biodiversity and manage endangered species are to protect and maintain critical
habitat, suppress the obvious biotic threats contributing to population decline and
reintroduce rare plant populations into natural areas (Maschinski & Haskins 2012; Soorae
2013). The end goal of these actions is to prevent immediate extinction, achieve and
maintain self-sustaining populations and reverse negative population trends (HPPRCC
2011; Maschinski & Haskins 2012). To evaluate if the suppression of primary threats and
plant reintroduction will likely result in the desired end goal (such as a targeted
Appendix ES-12-2 PhD Proposal Lalasia Bialic-Murphy

4
population size or self-sustaining population persistence) or if additional management is
needed, it is necessary to project the expected future status of a population. Demographic
matrix modeling is a key analytical approach that can be used for this purpose.
Demographic modeling can also be a useful tool to evaluate the strength of species
interactions, such as exotic herbivores, and anthropogenic abiotic alteration, such as
climate change, on population dynamics. For species that occur in extremely altered
environments a comparative demographic modeling approach is a particularly useful tool
to identify which environmental stressor, if managed, would have the greatest impact on
population dynamics.
Understanding the impact of anthropogenic alterations on population dynamics may be
especially important to efficiently and effectively manage endangered species native to
oceanic island ecosystem for the following reasons: 1) Though anthropogenic alterations,
such as the introduction of exotic herbivores and predators, are the dominant drivers of
species endangerment globally, the impacts are thought to be more severe for island
species (Wilcove et al. 1998). This is in part due to the absence of shared evolutionary
history, such as the presence of herbivores and mammals (Gillespie & Clague 2009).
With lack of diverse herbivore and predator communities, island plants often have lower
mechanistic and physiologic tolerance to the introduction of exotic pests (Gillespie &
Clague 2009; Whittaker & Fernández-Palacios 2007). 2) Local island endemics have an
elevated risk of extinction due to their geographically limited and numerically small
populations, making them more susceptible to habitat degradation (Gilpin & Soule 1986;
Menges 1990; Shaffer 1981).
The use of demographic modeling to assess rare plant population dynamics has increased
significantly over the last four decades. By 2011 over 90 published population
demography studies had been conducted for endangered plants (Crone et al. 2011). The
primary focus of these previous studies was to gain a better understanding of basic
population dynamics of endangered species and to evaluate the effect of range
management (particularly fire and grazing) on population persistence.
Appendix ES-12-2 PhD Proposal Lalasia Bialic-Murphy

5
Surprisingly, few detailed rare plant demographic studies have been conducted that
explicitly link the primary drivers of endangerment of native species on oceanic islands
to population dynamics. Furthermore, only four demographic modeling studies have been
conducted to evaluate when plant reintroduction can be an effective tool for establishing
self-sustaining populations and what factors contribute to successful population
establishment and persistence (Bell et al. 2003; Colas et al. 2008; Liu et al. 2004;
Maschinski & Duquesnel 2007). Given this, it remains unclear if these commonly used
conservation strategies of rare species native to oceanic islands result in the desired end
goal.
Hawai‘i is an ideal location to study the ecology of localized island endemic plants and
gain a deeper understanding of the effect of species interactions with environmental
stressors on population dynamics. The flora of Hawai‘i is characterized as having one of
the highest rates of endemism in the world, with an estimate of over 89% of the flowering
plant species being endemic (Wagner et al. 1999). In the last four decades Hawai‘i has
undergone massive habitat conversion and exponential increase in the introduction of
exotic species, resulting in a severe decline of ecosystem function (Cuddihy & Stone
1993). Over 40% of the endemic species native to Hawaii are listed as critically
endangered or threatened (USFWS 2012), 99% of which are threatened by multiple
anthropogenic alterations (though assessments are primarily based on qualitative
assessment and expert opinion) (Wilcove et al. 1998). This severe decline of biodiversity
and high level of endangerment has led to Hawai‘i being dubbed the endangered species
capital of the world.
For this study I will use demographic modeling to examine the population ecology of
endangered plants endemic to Hawai‘i and investigate the effect of key species
interactions and abiotic tolerance associated with the endangerment of island plants on
population dynamics. I will also use demographic modeling to gain a deeper
understanding of when plant reintroduction and the suppression of primary threats are
effective strategies to achieve self-sustaining populations and compare conservation
Appendix ES-12-2 PhD Proposal Lalasia Bialic-Murphy

6
management options.
The species selected for this case study are three endangered taxa native to Hawai‘i,
Cyrtandra dentata St. John & Storey (Gesneriaceae), Delissea waianaeensis Lammers
(Campanulaceae) and Schiedea obovata (Sherff) W.L. Wagner & Weller
(Caryophyllaceae). Delissea waianaeensis and S. obovata are outplanted populations and
C. dentata is a naturally occurring population. For each study system, I will project the
ambient population dynamics and identify the relative importance of life stages and
associated vital rates on population dynamics. Furthermore, I will use a simulation
demographic modeling approach to assess the following questions:
1. How does microhabitat heterogeneity affect population persistence of critically
endangered plants confined to narrow ecological niches? A case study of an island
endemic shrub, Cyrtandra dentata.
2. How does fruit depredation by rodents and pollen limitation affect the long-term
population growth rate of endangered plants native to island ecosystems? A case
study of an island endemic shrub, Delissea waianaeensis.
3. How will climate change affect population dynamics of endangered plants native to
island ecosystems? A case study of an island endemic shrub, Schiedea obovata.
4. For plant reintroductions, are the vital rates of outplanted individuals and the first
filial generation different? If so, does the transition from an outplanted to a naturally
occurring population affect short and long-term population dynamics?
2 - Overview of Demographic Modeling Techniques
There are several different demographic modeling approaches that can be used to gain
insight into various aspects of plant population dynamics.
Demographic modeling can be used to project the long-term population growth rate.
Appendix ES-12-2 PhD Proposal Lalasia Bialic-Murphy

7
There are several different modeling approaches that can be used for this purpose,
unstructured (count based) and structured (stage or age based) models being the most
common. An unstructured model requires the least amount of data collection and is the
most simplistic. The assumption of this method is that individuals within a population are
identical. For many organisms however, there are important differences in the survival,
growth and reproduction of individuals. A structured modeling approach is the primary
tool used to assess the population dynamics of these “structured” organisms. Structured
demographic models also allow for integration of vital rates (i.e., survival, growth, and
reproduction) to project long-term asymptotic growth rate (using a stochastic stage
structure matrix model) and identify the relative importance of demographic processes on
population dynamics (using stochastic elasticity analysis) (Caswell 1989; Morris & Doak
2002). A population growth rate (!) > 1 indicates a growing population and a ! < 1
represents a declining population.
There are two types of structured models, deterministic and stochastic. An assumption of
a deterministic model is a constant environment. To overcome the constraint of this
assumption a stochastic modeling approach can be used, allowing for incorporation of
environmental variability into population simulations. A detailed description of
deterministic and stochastic modeling techniques can be found in Caswell (1989). A
primary assumption of structured models is that the population has reached a stable stage
distribution (SSD), meaning that there is a constant proportion of plants in each defined
life stage over time.
Structured models require dividing the population into discrete state variables, for
example seedling, immature and mature life stages. For species that do not have clear
biologically significant breaking points, artificial classification is necessary. Creating too
few classes, however, can lead to misrepresentation of vital rates and creating too many
classes can lead to sample size issues and limited statistical power (Caswell 1989).
For species that do not have clear breaking points (age or life stages), integral projection
modeling (IPM) may be a more appropriate modeling technique to use. IPM may also be
Appendix ES-12-2 PhD Proposal Lalasia Bialic-Murphy
8
a more appropriate tool to evaluate population dynamics when working with limited
demographic datasets (< 300 individuals) because it reduces the bias and variance of the
population projections (Ramula et al. 2009). Similar to structured matrix models, IPM
incorporates survival, growth and fecundity to project population dynamics. Unlike a
structured model, IPM integrates continuous state variables by incorporating vital rates
based on individual plant size rather than as discrete stage or age class mean vital rates.
(Easterling et al. 2000).
When evaluating population dynamics it is also important to quantify short-term trends
(Fox & Gurevitch 2000; Haridas & Tuljapurkar 2007; Koons et al. 2005). Short-term
population level responses to temporal variations in vital rates can deviate from long-term
projections, depending on the initial population structure. This is particularly true for a
population that is not at, or close to, a SSD. Evaluating short-term trends may be
especially important from a management perspective for the following reasons: 1) the
timeframe of conservation plans are often predefined, making it important to assess
benchmark goals; 2) disturbance (such as fire) and active management (such as threat
control) can cause temporal variation in vital rates. These factors can significantly alter
population structure, causing it to deviate from a SSD and long-term population
projections. Until the affected (or missing) life stages fill in and a SSD has been realized,
short-term population growth will depend on temporal shifts in vital rates and the
resulting change in population structure. In extreme cases, year-to-year fluctuations in
vital rates and the resulting population structure may cause extinction prior to a SSD and
asymptotic growth being achieved (Fox & Gurevitch 2000).
To evaluate short-term population dynamics transient analysis can be used to project
population structure (i.e., number of individuals within each life stage at a given time)
and quantify the risk of short-term extinction. Stochastic transient elasticity analysis can
be used to identify which life stages and threat control management actions have the
largest proportional effect on short-term population dynamics (Caswell 2007; Fox &
Gurevitch 2000; Haridas & Tuljapurkar 2007).
Appendix ES-12-2 PhD Proposal Lalasia Bialic-Murphy
9
For this research I will use a combination of stochastic stage structured matrix modeling
and IPM techniques to project long-term population growth for the study species and
simulate how demographic parameters and environmental parameters (i.e., microhabitat
heterogeneity, pollen limitation, predation by rodents, climate change and artificial cohort
transition of plant reintroduction) influence population growth rate. I will also use
transient analysis to evaluate short-term population dynamics of each study system.
3 - Study Question #1: How does microhabitat heterogeneity affect population
persistence of critically endangered plants confined to narrow ecological niches? A
case study of an island endemic shrub, Cyrtandra dentata.
Background and Rationale
Fine-scale habitat heterogeneity can have significant effects on the establishment and
growth of the seedling (Harper 1977). The effect of habitat heterogeneity and safe-site
availability on seedling establishment is well documented (Dostálek & Münzbergová
2013; Eriksson & Ehrlen 1992; Fetcher et al. 1983). The degree of suitability between
substrates can vary dramatically. Substrate with disproportionally greater seedling
establishment is often referred to as a “safe-site”. Important abiotic characteristics of
safe-sites include high light availability (Denslow 1980), suitable substrate characteristics
(Dostálek & Münzbergová 2013), low disturbance (Eriksson & Ehrlen 1992), and
sufficient water availability (Fetcher et al. 1983). The presence of nurse plants can also be
an important determinant of seedling establishment. For example, moss increases
localized water and nutrient levels and benefits initial establishment of Primulina
tabacum (Ren et al. 2010). However, integrative demographic studies that explicitly link
fine-scale abiotic characteristics to population persistence are limited. Picó and Riba
(2002) determined that a long-lived herb, Ramonda myconi, was geographically confined
to fine-scale habitat of shady ravines in the Pyrenees and population persistence was
highly dependent on temporal variation in precipitation and temperature. García (2003)
found that a critically endangered plant, Borderea chouardii, was likely geographically
restricted to shaded crevices of north-facing limestone due to its incapacity to germinate
and survive on other substrates. A detailed demographic study of three isolated
Appendix ES-12-2 PhD Proposal Lalasia Bialic-Murphy

10
populations of a perennial herb, Petrocoptis pseudoviscosa, was conducted to evaluate
population dynamics and identify the functional traits driving population persistence. For
one of the populations, deeper shade and higher humidity were positively correlated with
high recruitment and fast growth, relative to the other two populations. The impact of
abiotic conditions on vital rates was not, however, an important determinant of long-term
population persistence.
With limited knowledge of how habitat heterogeneity and the availability of substrate
with relatively higher seedling establishment (i.e., safe-sites) affect population dynamics
it remains unclear if these species interactions are important determinants of long-term
population persistence.
I propose to conduct a detailed demographic study to gain a deeper understand of how
microhabitat heterogeneity affects the persistence of a rare plant confined to a narrow
ecological niche. The study system, C. dentata, is a critically endangered taxon endemic
to Hawai‘i, confined to the gulches of wet to mesic forest communities (Wagner et al.
1999), often located in close proximity to seasonal waterfalls. Preliminary analysis
indicates that seedling establishment on elevated rocky outcroppings is significantly
greater than on the soil substrate (L. Bialic-Murphy, unpublished data). The reason for
this is unknown but winter rains, which cause pooling of water in the gulch bottom, may
be a contributing factor. Identifying the effect of substrate type on seedling establishment
and population dynamics is particularly important for effectively managing suitable
habitat of C. dentata and for selecting appropriate outplanting sites, which will be
necessary for delisting this taxon (USFWS 1998).
Material and methods Study species
Cyrtandra dentata is a federally endangered shrub endemic to the island of Oahu in
Hawai‘i. Cyrtandra dentata reaches 1.5 to 5 m at maturity and produces white
subumbelliform cymes, 3–9 inch long and the fruit are white ovate berries, 1–2.6 cm long
(Wagner et al. 1999). The reproductive biology of C. dentata is poorly understood but
floral characteristics suggest that it is moth pollinated and fleshy berries are indicative of
Appendix ES-12-2 PhD Proposal Lalasia Bialic-Murphy

11
frugivorous bird dispersal (OANRP 2003b). Flowers and fruit have been collected year
round but peak fruiting occurs from September to October (L. Bialic-Murphy,
unpublished data). The typical habitat is shady gulch bottoms of mesic to wet forest
communities.
Cyrtandra dentata historically spanned the northern Waianae Mountains and the leeward
side of the northern Koolau Mountains, from 300–610 m elevation (Wagner et al. 1999).
In 1996 it was listed as federally endangered and by 2010, it was restricted to seven
geographically isolated locations (USFWS 2012). The primary drivers of its
endangerment are predation by feral ungulates, rodents, and slugs, competition by non-
native plants, climate change and fires (USFWS 1998).
Study site
The study population is in the Kahanahaiki Management Unit (36 ha), referred to
hereafter as Kahanahaiki, which is located in the northern Waianae Mountain Range, on
the island of Oahu (21° 32’ N, -158°12’ W). Kahanahaiki is a tropical mesic forest;
composed of a mix of native and exotic flora and fauna. The dominant native canopy
species include Acacia koa, Metrosideros polymorpha, Nestegis sandwicensis, Diospyros
sandwicensis, Pouteria sandwicensis, Pisonia umbellifera and Antidesma platyphyllum.
The dominant native understory species include Alyxia stellata, Bidens torta, Coprosma
foliosa, and Microlepia strigosa. The exotic canopy species include Psidium cattleianum
and Schinus terebinthifolius. The exotic understory species include Blechnum
appendiculatum, Clidemia hirta, Melinis minutiflora and Cyclosorus dentatus (OANRP
2009). The mean monthly rainfall is 53–227 mm (Giambelluca et al. 2013), and mean
daily temperature range is 16–24 °C (Shiels & Drake 2011).
The Kahanahaiki C. dentata population is one of the two largest known populations, in
both numerical size and demographic structure. The population is located in the main
Kahanahaiki drainage, extending from the base of a seasonal waterfall to the north
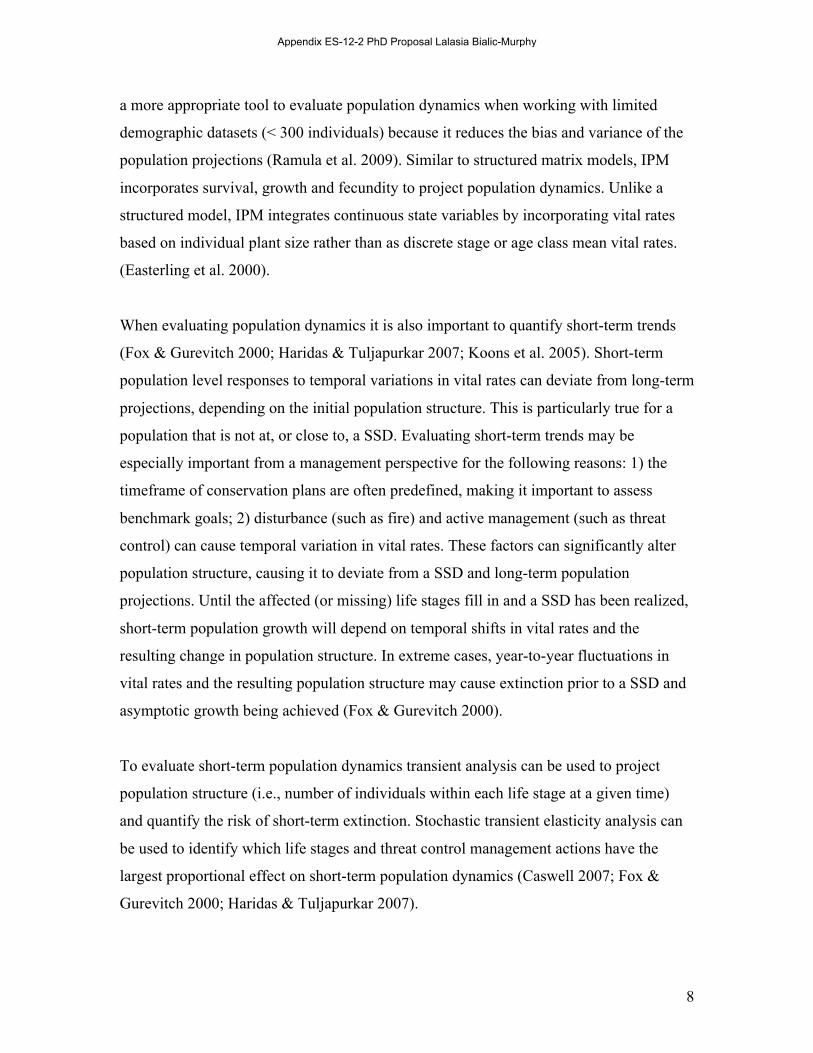
approximately 150 meters (Figure 1). The plants are concentrated in the gulch bottom and
along the steep, mossy rock walls.
Appendix ES-12-2 PhD Proposal Lalasia Bialic-Murphy

12
Figure 1: Location of a single population of Cyrtandra dentata in the Kahanahaiki Management Unit, in the
northern Waianae Mountain Range of Oahu.
Management history
Since 1995, the Kahanahaiki MU has been actively managed by the Oahu Army Natural
Resources Program (OANRP) as part of a larger mitigation effort to offset the potential
impact of military training operations on 89 rare plants and animals.
In 1996, OANRP constructed the Kahanahaiki fence for the protection of C. dentata and
eleven other managed taxa (Figure 1). By 1998, OANRP eradicated pigs from the fenced
area and initiated selective weed control directly surrounding the population, targeting
known ecosystem-altering vegetation. Since then, OANRP staff has conducted annual
ecosystem-level weed control across the study site (OANRP 2009). The goal of fencing
and weed control was to limit the direct and indirect threat that pigs and exotic vegetation
pose to ecosystem function. Feral ungulates directly impact all life stages of many native
Appendix ES-12-2 PhD Proposal Lalasia Bialic-Murphy

13
and introduced species. In general, native seedlings, saplings, and mature plants increased
in frequency and density following fencing and feral ungulates removal (Busby et al.
2010; Cole et al. 2012; Kellner et al. 2011; Loh & Tunison 1999). Exotic vegetation is a
primary competitor, invading and displacing native vegetation (Vitousek 1996).
Following suppression of top-down effects, the missing life stages (the seedling and
small immature plants) started establishing (M. Kiehn, unpublished data).
Data collection Demographic data
Detailed demographic data collection started in June of 2010. A subset of plants was
permanently tagged and will be monitored annually for five consecutive years. The life
cycle of C. dentata was divided into four discrete life stages: mature (>80cm), large
immature (20cm – 80cm), small immature (<20cm) plants, and seedling (less that 2cm).
Since there were less than 50 plants in the mature and large immature life stages, all
plants in these life stages were permanently tagged to maintain a robust sample size. For
the small immature and seedling life stages, a random sample of 50 plants was
permanently tagged. Individual plants > 10 cm in height were permanently tagged using
OANRP’s standard metal tag and wire method. Plants < 10 cm in height were marked
using pin flags and metal tags, placed two inches upslope from the plants. Plants growing
on the upper gulch walls were excluded from sampling to avoid risk of damaging suitable
habitat. Seedlings growing on rocky substrate were marked using florescent-colored
buttons, glued to the rocks two inches above each plant.
For each tagged plant, height to apical meristem (when possible), basal diameter,
reproductive status, vigor, and rooting substrate were recorded. In addition, the total
number of plants in each life stage will be counted the final year of the study. Data were
also recorded for a subset of abiotic and biotic environmental parameters including
annual precipitation, and percent cover of native and non-native vegetation. These data
will be used to investigate how the subset of environmental parameters is associated with
temporal variation in vital rates and population dynamics.
Appendix ES-12-2 PhD Proposal Lalasia Bialic-Murphy

14
Seedling establishment and microhabitat
To calculate the effect of abiotic habitat characteristics on seedling establishment
necessary for matrix model simulation, I collected additional field data in 2014. First, I
classified the substrate into two categories, talus rocky outcroppings and soil. Then, I
installed 1m x 1m quadrats directly underneath ten randomly selected mature plants. For
each plot, data were recorded for the total number of seedlings established and percent
cover (based on ocular estimation) of each substrate type. These data will be used to
calculate the expected and observed seedling establishment rate on each substrate type. I
assumed that the ratio of seeds that fell and germinated on each substrate type would be
directly proportional to the percent cover of each substrate type if there were no
differences in substrate suitability.
Data Analysis Matrix projection model
Assessing population dynamics, using a structured modeling approach, first requires
using the collected demographic data to construct yearly Lefkovitch transition matrices
using the following formula (Caswell 2001):
n(! + 1) = !n(!) (1)
where the vector n(!) represents the number of plants in four discrete life stage at time !
and !(! + 1) represents the number of plants in each life stage the following year. The
matrix, !, is composed of 8 matrix elements (aij), which represent the transition
probability of the s (seedlings), si (small immature), sl (large immature), m (mature) life
stages from time t to t+1. The matrix, !, is parameterized in terms of the probability of
survival !, the probability of growing to the next stage class !, and the fertility term !!
of each life stage. The fertility term is the product of fecundity, the probability of fruiting
and the germination and establishment rate. For C. dentata the fertility term will be
calculated by dividing the number of seedlings counted by the number of mature plants
the previous year.
Appendix ES-12-2 PhD Proposal Lalasia Bialic-Murphy
15
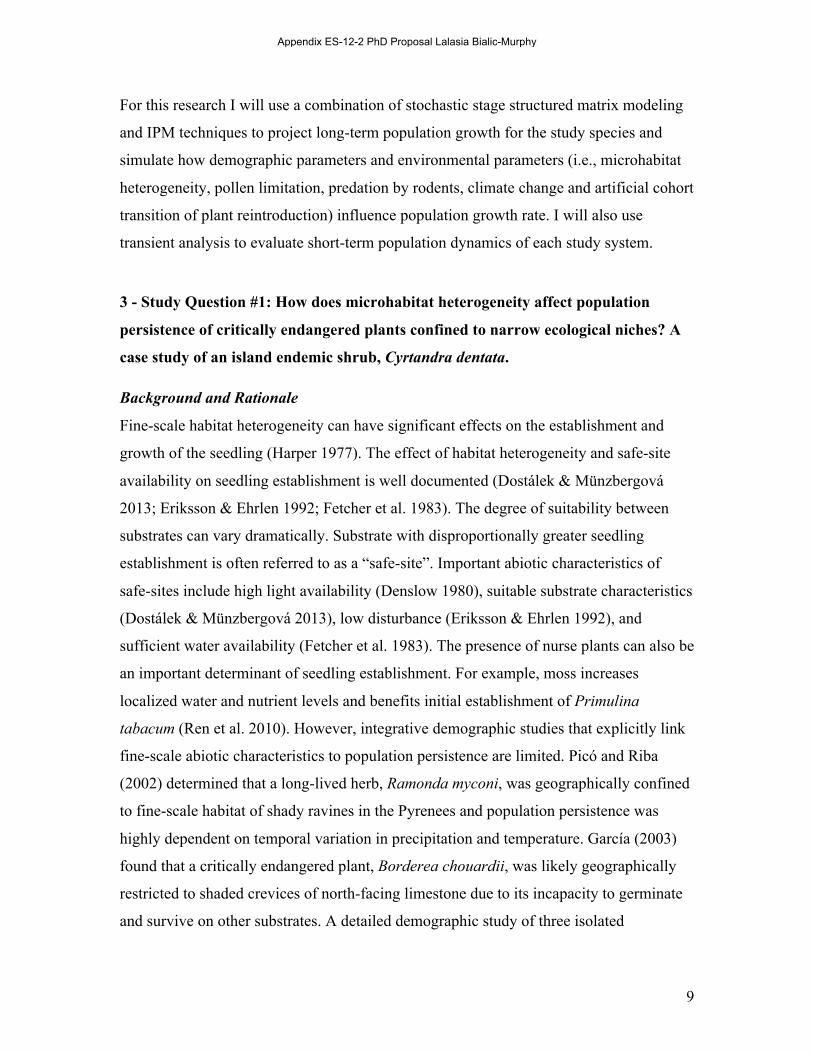
! =
!!(1− !!) 0 0 !!!!!!!! !!"(1− !!") 0 00 !!"!!" !!"(1− !!") 00 0 !!"!!" !!
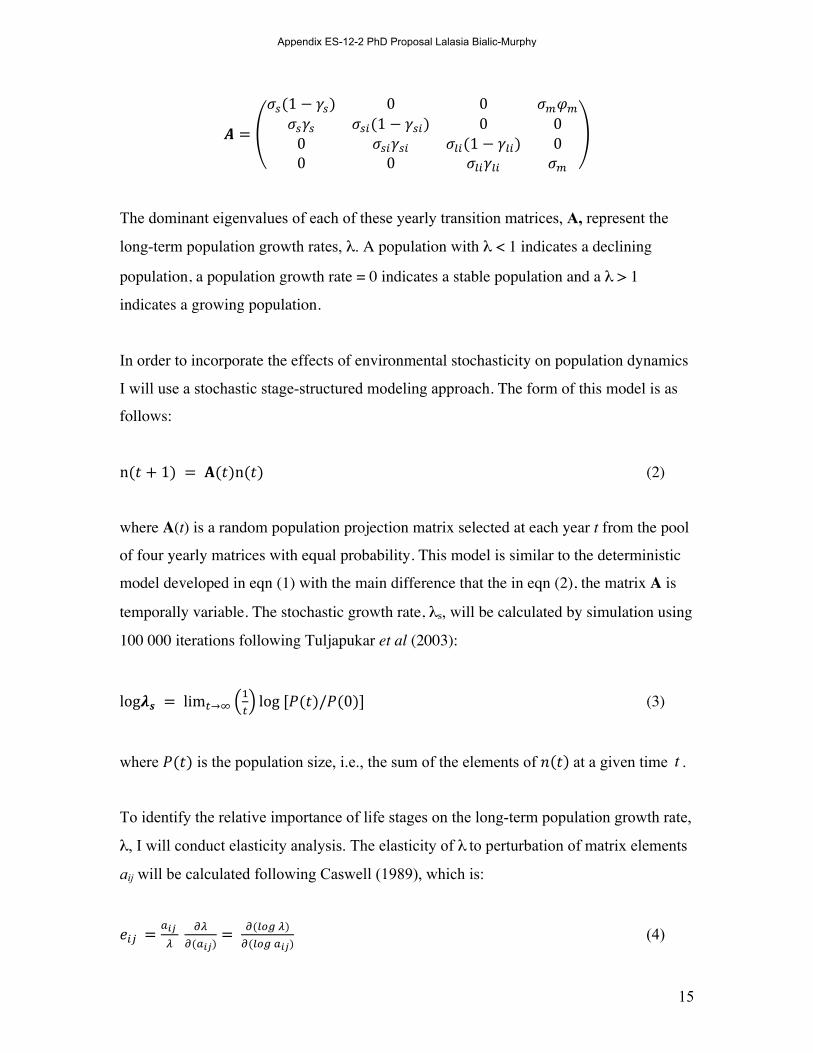
The dominant eigenvalues of each of these yearly transition matrices, A, represent the
long-term population growth rates, λ. A population with λ < 1 indicates a declining
population, a population growth rate = 0 indicates a stable population and a λ > 1
indicates a growing population.
In order to incorporate the effects of environmental stochasticity on population dynamics
I will use a stochastic stage-structured modeling approach. The form of this model is as
follows:
n(! + 1) = !(!)n(!) (2)
where A(t) is a random population projection matrix selected at each year t from the pool
of four yearly matrices with equal probability. This model is similar to the deterministic
model developed in eqn (1) with the main difference that the in eqn (2), the matrix A is
temporally variable. The stochastic growth rate, λs, will be calculated by simulation using
100 000 iterations following Tuljapukar et al (2003):
log!! = lim!→!!!log [!(!)/!(0)] (3)
where !(!) is the population size, i.e., the sum of the elements of ! ! at a given time .
To identify the relative importance of life stages on the long-term population growth rate,
λ, I will conduct elasticity analysis. The elasticity of λ to perturbation of matrix elements
aij will be calculated following Caswell (1989), which is:
!!" =!!" ! !"!(!!")
= !(!"# !)!(!"# !!")
(4)
€
t
Appendix ES-12-2 PhD Proposal Lalasia Bialic-Murphy
16
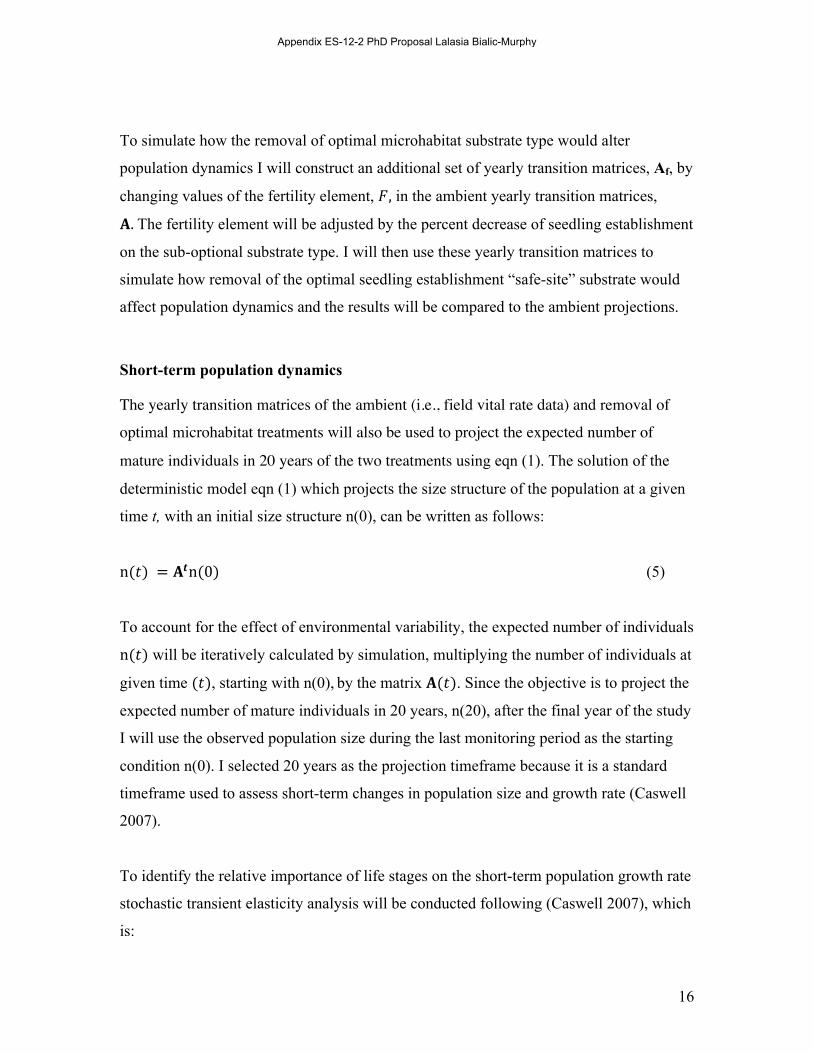
To simulate how the removal of optimal microhabitat substrate type would alter
population dynamics I will construct an additional set of yearly transition matrices, Af, by
changing values of the fertility element, !, in the ambient yearly transition matrices,
!. The fertility element will be adjusted by the percent decrease of seedling establishment
on the sub-optional substrate type. I will then use these yearly transition matrices to
simulate how removal of the optimal seedling establishment “safe-site” substrate would
affect population dynamics and the results will be compared to the ambient projections.
Short-term population dynamics
The yearly transition matrices of the ambient (i.e., field vital rate data) and removal of
optimal microhabitat treatments will also be used to project the expected number of
mature individuals in 20 years of the two treatments using eqn (1). The solution of the
deterministic model eqn (1) which projects the size structure of the population at a given
time t, with an initial size structure n(0), can be written as follows:
n(!) = !!n(0) (5)
To account for the effect of environmental variability, the expected number of individuals
n(!) will be iteratively calculated by simulation, multiplying the number of individuals at
given time (!), starting with n(0), by the matrix !(!). Since the objective is to project the
expected number of mature individuals in 20 years, n(20), after the final year of the study
I will use the observed population size during the last monitoring period as the starting
condition n(0). I selected 20 years as the projection timeframe because it is a standard
timeframe used to assess short-term changes in population size and growth rate (Caswell
2007).
To identify the relative importance of life stages on the short-term population growth rate
stochastic transient elasticity analysis will be conducted following (Caswell 2007), which
is:
Appendix ES-12-2 PhD Proposal Lalasia Bialic-Murphy

17
!! ! !" !! =!!!! !
!!! !!!!
(6)
4 - Study Question #2: How does fruit predation by rodents and pollen limitation
affect the population dynamics of endangered plants native to island ecosystems? A
case study of an island endemic shrub, Delissea waianaeensis.
Background and rationale
Two of the primary threats implicated in the decline of species native to oceanic islands
are rodents and the loss of native pollinators (Carpenter 1976; Pender et al. 2014; Shiels
& Drake 2011). Rodents are the most pervasive predators of native plants in island
ecosystems (Ruffino et al. 2009; Towns et al. 2006; Traveset et al. 2009), primarily
impacting reproduction (Shiels et al. 2014). Shiels and Drake (2011) found that in mesic
forest communities in Hawai‘i black rats consume > 44% of the available fruits of
common native and non-native species. Rodents also consume vegetative plant material,
which may impact plant fitness. Pollen limitation affects plant fertility, reducing seed set
and decreasing genetic diversity (Burd 1994).
While the influence of fruit and seed predation by rodents on susceptible life stages has
been extensively studied, only one study has assessed the influence of exotic rodents at
the population level (Pisanu et al. 2012). The results of that study indicated that rodent
suppression, in some cases, can positively influence the probability of plant population
persistence. Furthermore, while the impact of pollen limitation on plant fitness has been
well examined only a limited number of studies have linked pollen limitation to
population growth rate (Bierzychudek 1982; Ehrlén & Eriksson 1995; García & Ehrlén
2002; Parker 1997), and most of those found that pollen limitation did not impact plant
population persistence.
I propose to investigate the affect of pollen limitation and fruit depredation by black rats
(Rattus rattus) on population dynamics of a critically endangered island endemic shrub,
Delissea waianaeensis. Investigating the population level impact of both exotic rodents
Appendix ES-12-2 PhD Proposal Lalasia Bialic-Murphy

18
and pollen limitation simultaneously will provide a deeper insight into the synergistic
effects of these biotic stressors on plant population persistence.
Preliminary analysis of a study conducted at the Pahole and Kahanahaiki reintroduction
sites suggest D. waianaeensis is pollen limited (Pender 2013b) and a study conducted at
the Kaluaa reintroduction site confirms black rats consume D. waianaeensis fruit (L.
Bialic-Murphy, unpublished data). Previous research indicates that D. waianaeensis seeds
remain viable following digestion by black rats (Shiels 2010). However, it is unresolved
if seeds following digestion are deposited in habitat suitable for germination and
establishment. The foraging habits and den characteristics of black rats suggest that D.
waianaeensis seeds following digestion are not deposited in favorable sites. Black rats
primarily make dens below ground in soil and fractured rock substrate, under logs, in
thick understory vegetation, and inside partially dead non-native trees. When foraging,
black rats are the most active in areas with thick vegetation cover, 10–30 cm above them
(Shiels 2010). Naturally occurring D. waianaeensis seedlings and immature plants at the
study site are primarily found in open areas (Lalasia Bialic-Murphy, unpublished data),
which suggest that black rats have a negative impact on D. waianaeensis fertility.
Material and methods Study species
Delissea waianaeensis is a long-lived arborescent woody shrub endemic to the Waianae
Mountain Range, on the island of Oahu. It grows into a single or branched erect stem,
reaching 1–3 meters tall at first reproduction (Wagner et al. 1999). It produces purple,
red, white, and pink berries which are indicative of frugivorous bird dispersal and floral
characteristics suggest D. waianaeensis was historically pollinated by native birds in the
honeycreeper (Drepanidinae) and Hawaiian Mohoideae (Mohoidae) groups (Lammers &
Freeman 1986; Pender 2013a). Anthropogenic alterations have driven many of the bird
species in these families to extinction (Banko et al. 2009). The Hawai‘i ‘amakihi
(Hemignathus flavus) and Oahu ‘apapane (Himatione sanguinea), which are still present
in the Waianae Mountain Range, are ineffective pollinators and nectar robbers (Pender
2013). Manipulative pollination treatments suggest D. waianaeensis is pollen limited,
having significantly less seed set per fruit for control and self-pollination treatments,
Appendix ES-12-2 PhD Proposal Lalasia Bialic-Murphy

19
relative to a pollen-addition treatment (Pender 2013). Production of viable seeds from
isolated plants indicates that D. waianaeensis is capable of self-pollination (Lammers
2005).
Delissea waianaeensis individuals have been documented between 245–760 m elevation,
along the north facing slopes and gulch bottoms of the Waianae Mountain Range
(Wagner et al. 1999). The historic geographic range and density are poorly understood
and based primarily on qualitative field observations. In 1996, it was listed as federally
endangered (USFWS 1998) and by 2005 D. waianaeensis was restricted to seven
geographically isolated locations, with a meta-population of twenty-five plants (USFWS
2012). The cause of endangerment is unknown but herbivory by ungulates, slugs and
rodents, competition by invasive vegetation, pollen limitation, fires, and climate change
have been proposed to be likely causes of decline (USFWS 1998).
Study site
In 2002, D. waianaeensis was reintroduced to the Central Kaluaa Management Unit (40
ha), hereafter referred to as Central Kaluaa, which is located in the northern Waianae
Mountains, on the island of Oahu (HON; 21° 28’ N, -158°6’ W) (Figure 2). The mean
monthly rainfall is 52–171 mm (Giambelluca et al. 2013). The plant community is a
tropical mesic forest, composed of mixed native and exotic flora and fauna. The
dominant canopy species include Acacia koa, Metrosideros polymorpha, Nestegis
sandwicensis, Diospyros sandwicensis, Pouteria sandwicensis, Charpentiera obovata,
Pisonia umbellifera, Psychotria mariniama, Antidesma platyphyllum. The dominant
understory species include Alyxia stellata, Carex meyneii, Bidens torta, Coprosma
foliosa, and Microlepia strigosa. Dominant canopy exotic species include Psidium
cattleianum, Schinus terebinthifolius, and Toona ciliata. The dominant exotic understory
species include Blechnum appendiculatum, Clidemia hirta, Melinis minutiflora and
Cyclosorus dentatus (OANRP 2011).
Appendix ES-12-2 PhD Proposal Lalasia Bialic-Murphy

20
Figure 2: Location of a single population of Delissea waianaeensis in the Kaluaa Management Unit, in the
Waianae Mountain Range on the island of Oahu.
Management history
In 2001, The Nature Conservancy constructed the Central Kaluaa (40 ha) fence,
eradicated feral ungulates, and implemented invasive vegetation control for the protection
of D. waianaeensis and other managed taxa (Figure 2). In 2002, The Nature Conservancy
initiated reintroduction of D. waianaeensis into Central Kaluaa gulch (hereafter at Kal-
C), starting with the clearing of invasive vegetation across the reintroduction location and
the outplanting of 43 mature plants. This site was selected because it was an appropriate
habitat for the target species, it was relatively accessible and it was within the historic
geographic distribution (per comm., Dan Sailer).
The founders used for Kaluaa D. waianaeensis reintroduction were from a relictual
geographically isolated population of five individuals, located 4000 meters from the
Appendix ES-12-2 PhD Proposal Lalasia Bialic-Murphy

21
outplanting site. Stock from the other six geographically isolated populations was not
used for the Kal-C reintroduction to avoid potential outbreeding depression and the loss
of local adaptations (Kawelo et al. 2012).
Seeds were collected and grown in a greenhouse for one growing season, prior to
outplanting. The mean height at reintroduction was 56 cm. Six outplanting efforts were
conducted from 2002 through 2012. The initial outplanting of 43 plants occurred in 2002.
In 2004, the management of the reintroduction population was transferred to OANRP and
incorporated into a larger conservation plan to offset the potential impact of military
training operations on 89 rare plants and animals. OANRP outplanted an additional 303
plants from 2004–2012 (Table 1). The 2012 outplanting included representation from two
additional founders that were discovered in close proximity to the five original founders
used for the Kaluaa reintroduction.
Year Planted Number Planted
Number Alive (2014)
% Remaining
2002 43 14 33% 2004 21 12 57% 2008 36 20 56% 2009 19 9 47% 2010 52 39 75% 2011 121 117 97% 2012 54 49 91% Total 346 260 75%
Table 1: D. waianaeensis reintroduction effort from 2002–2012.
Data collection Demographic data
Detailed demographic data collection started in January of 2010. A subset of plants was
permanently tagged and will be monitored annually for five consecutive years. The life
cycle of D. waianaeensis was categorized into four life stages: mature (reproducing
individuals), large immature (> 35 cm and non-reproductive), small immature (2 cm – 35
cm), and seedling (less that 2cm). In each life stage a subset of 50 plants were randomly
selected and permanently tagged. Plants > 10 cm in height were permanently marked
with metal tags (wired to the base of each plant) and plants < 10 cm in height were
Appendix ES-12-2 PhD Proposal Lalasia Bialic-Murphy

22
marked using pin flags and metal tags, placed two inches upslope from each plant.
Seedling clusters were tracked using plots; the boundaries were delineated with pin flags
and orange string.
For each tagged plant, height to apical meristem (when possible), basal diameter,
reproductive status, vigor, number of expanded leaves, and rooting substrate were
recorded. The calculate fecundity, a subset of twenty mature plants will be randomly
selected and tracked once a month during the 2015 fruiting season. To avoid double
counting fruits, monitored infructescense will be tagged using orange sewing thread. In
addition, the total number of plants in each life stage will be counted the final year of the
study.
Pollination limitation data
To calculate the effect of pollen limitation on fecundity of D. waianaeensis necessary for
matrix model simulation, I will use data from a pollination manipulation experiment
conducted in 2009 and 2010 (Pender 2013b). Specifically, the mean seed set of the
control treatment will be subtracted from the mean seed set of the plus-pollen treatment.
The pollination manipulation experiments were conducted at the Pahole Natural Area
Reserve and Kahanahaiki Management Unit. The control and plus-pollen treatments were
applied to a subset of plants at each population. For the control treatment the flowers
were left unmanipulated and for the plus-pollen treatment flowers were supplemented
with either pollen collected from the male-phase of the same plant and pollen from three
or more plants in the same population. At Kahanahaiki the treatments were applied to 12
and 11 plants in 2009 and 2010 respectively. At Pahole the treatments were applied to 25
plants in 2010. The results of this study indicate that D. waianaeensis is pollen limited
(Table 2). Pollen supplementation increased seed set by 38%, relative to the other
treatments (F = 12.42, P = <0.05).
There is a potential bias in using pollination data that were not collected at the field site,
such as differences in pollination networks. The genetic material used for the
Appendix ES-12-2 PhD Proposal Lalasia Bialic-Murphy

23
Kahanahaiki and Pahole reintroduction sites was also from a different source population
than the genetic material used for the Kaluaa reintroduction. However, the seed set of
unmanipulated open-pollinated fruits collected at Kaluaa, Pahole, and Kahanahaiki were
not significantly different (Lauren Weisenberger; unpublished data, Pender 2013b),
indicating D. waianaeensis was pollen limited at all of the sites. Therefore, I will assume
that pollen supplementation would have similar affects on seed set for plants at Kaluaa,
relative to Pahole and Kahanahaiki.
Treatment Control Plus Pollen
Mean Seed Set 133
217
Sample Size 41 11
Table 2: Mean seed set from Delissea waianaeensis pollination study
at Pahole and Kahanahaiki.
Rodent depredation data
Preliminary field trial – To determine if rodents depredate D. waianaeensis fruit, two
motion-sensing cameras were installed during the peak fruiting season of 2014 for a total
of fifteen trap nights. The cameras were aimed directly at two patches of mature plants
(two and four plants in each patch). The only visitation recorded was by black rats. All
photographs capturing black rats were during nighttime. Each night of the study black
rats were photographed climbing D. waianaeensis plants and interacting with mature
fruit, which suggests that black rats are a primary predator of mature fruit (Figure 3).
Appendix ES-12-2 PhD Proposal Lalasia Bialic-Murphy

24
Figure 3: Black rat interacting with mature fruit.
Effect of rodent depredation on fecundity – To calculate the percentage of D.
waianaeensis fruit depredated by rodents necessary for matrix model simulation, I will
use a modified version of the monitoring methodology developed by Pender et al. (2013).
I will install twenty-five tracking tunnels (50 cm x 10 cm x 10 cm; Connovation Limited,
Auckland, New Zealand), with tracking cards inserted (The Black Trakka Gotcha Traps
LTD, Warkworth, New Zealand), and place them throughout the study site during the
2015 peak fruiting season. Each tracking tunnel will be baited with one mature D.
waianaeensis fruit. I will check the tracking tunnels two nights after installment and the
total number of consumed fruit will be recorded. The tunnels will be baited and
monitored twice during the 2015 fruiting season. I will then record the footprints left on
the tracking tunnel cards to identify all animal species (using Oahu Army Natural
Resources Program identification cards). I will scatter the remaining fruit in the tracking
tunnels at the field site.
Appendix ES-12-2 PhD Proposal Lalasia Bialic-Murphy

25
Data analysis
I will use field data collected for the demography of D. waianaeensis to develop yearly
transition matrices and project the ambient population dynamics using the following
matrix projection model:
n(! + 1) = !n(!)
where the vector n(!) represents the number of plants in four discrete life stage at time !
and !(! + 1) represents the number of plants in each life stage the following year.
The projection matrix A, will be of the following form:
! =
!!(1− !!) 0 0 !!!!!!!! !!"(1− !!") 0 00 !!"!!" !!"(1− !!") 00 0 !!"!!" !!
The matrix, !, is composed of 8 matrix elements (aij), which represent the transition
probability of the s (seedlings), si (small immature), sl (large immature), m (mature) life
stages from time t to t+1. The matrix, A, is parameterized in terms of the probability of
surviving !, the probability of growing to the next stage class !, and the fertility term !!
of each life stage. The fertility term is the product of the survival of mature plants,
fecundity, the probability of fruiting and the germination and establishment rate.
To simulate the effect of black rat removal (i.e., no fruit depredation by rodents) on
population dynamics, the establishment and germination rate of the fertility element in
the ambient yearly transition matrices ! will be increased by the mean fruit depredation
by rodents. To simulate the affect of removing of pollen limitation on population
dynamics the fecundity term of the fertility element in the ambient yearly transition
matrices will be increased by the proportional difference in fecundity of the control and
plus pollen treatments.
Appendix ES-12-2 PhD Proposal Lalasia Bialic-Murphy

26
The yearly transition matrices for the two treatments (rodent depredation and pollen
limitation) will then be used to project the short and long-term population dynamics and
the results will be compared to the projected ambient population dynamics.
It should be noted that there is a potential bias of the pollen limitation and rodent
depredation projections. Specifically, the simulations will not account for density
dependence of seedlings. However, seedling survival of isolated seedlings and seedling
clumps were not significantly different at the field sites (Lalasia Bialic-Murphy,
unpublished data), which suggests that density dependence could be neglected in this
system.
For the fruit depredation by rodent simulation I will assume that fruits following
consumption are not deposited in favorable habitat. The purpose of this simulation is to
gain a deeper insight into the potential impact of fruit depredation by rodents on
population dynamics. If the results of this study indicate fruit depredation by rodents has
a large impact on population dynamics and is an important determinant of population
persistence (if seeds were deposited in unfavorable habitat following digestion),
management may want to consider explicitly monitoring seed fate following digestion by
rodents.
5 - Study Question # 3: How will climate change affect the population dynamics of
critically endangered plants? A case study of an island endemic shrub, Schiedea
obovata.
Background and rationale
Theoretical and empirical population ecology studies suggest that, in general,
environmental stressors that influence fecundity and seedling establishment will have the
largest proportional effect, if managed (i.e., conducting threat control management), on
the population growth rate of short-lived herbaceous species (Morris et al. 2008;
Silvertown et al. 1996). Seedlings are particularly sensitive to drought and soil moisture
availability due to their limited root system; which are contained in the drier upper
Appendix ES-12-2 PhD Proposal Lalasia Bialic-Murphy

27
surface soil layer (Gerhardt 1996; Gilbert et al. 2001; Kobe et al. 1995; Poorter &
Hayashida-Oliver 2000). Climate change is predicted to increase annual and inter-annual
climatic variability, increasing the average length of drought periods and extreme rainfall
events (Change 2007). Under such a scenario, short-lived (<10 years) species are
projected to be disproportionally affected by climate change (Morris et al. 2008).
The effect of climate change on population persistence of plant populations remains
unresolved (McLaughlin et al. 2002; Parmesan & Yohe 2003; Souther & McGraw 2014),
particularly for species native to oceanic islands. For flora native to Hawai‘i, only one
quantitative demographic study has been conducted to link weather patterns to population
dynamics. Decline in the population size of Argyroxyphium sandwicense, a long-lived
monocarpic plant, may be strongly associated with weather patterns (focusing on
temporal changes in mean yearly precipitation) (Krushelnycky et al. 2013). However, the
effect of weather patterns on vital rates was not explicitly isolated for this study. Given
this, it is impossible to conclude that climate change was the cause of population decline.
The central focus of my research is to combine classical drought tolerance experiments
with size-structured population projection modeling to understand the effect of climate
change on population persistence of an endemic island plant, S. obovata. I will conduct a
greenhouse experiment, manipulating soil water content availability to assess the effect of
water availability on seedling survival and growth. These survivorship and growth data
will be used to simulate how changing precipitation patterns could potentially alter
population growth rate of four predetermined water treatments (which are described in
detail below). Explicitly linking drought tolerance to population dynamics will provide
better insight into the vulnerability of oceanic island species to the effects of climate
change.
Material and methods Study species
Schiedea obovata is a short-lived, perennial, herbaceous shrub endemic to the Waianae
and Koolau Mountain Ranges, on the island of Oahu (Hawai‘i). Plants have been
documented between 550–800 m elevation, primarily found along mesic ridgelines
Appendix ES-12-2 PhD Proposal Lalasia Bialic-Murphy

28
(Wagner et al. 1999). The historic geographic range and density is poorly understood and
based primarily on qualitative field observations. Over the past several decades S.
obovata has experienced a severe reduction in geographical range and by 1991 it was
listed as federally endangered (USFWS 1998). To date, there are three known naturally
occurring population left, with a total of one, 403, and 3117 plants.
Schiedea obovata is a suberect or ascending branched shrub, reaching 0.3–1 cm tall
(Wagner et al. 2005). Fruit are capsules and the sepals are fleshy and dark purple. Floral
characteristics suggest that S. obovata is a facultative selfer and purple berries are
indicative of frugivorous bird dispersal. The cause of endangerment is unknown but
habitat fragmentation, competition with invasive ecosystem-altering vegetation, predation
by ungulates, rodents and slugs, climate change, and fire are implicated (USFWS 1998).
Study site
The study site is located in the Kahanahaiki Management Unit (Figure 4). Location and
forest community composition of this area is described in detail in the study site section
of 3.1.
Appendix ES-12-2 PhD Proposal Lalasia Bialic-Murphy

29
Figure 4: Location of a single population of Schiedea obovata in the Kahanahaiki Management Unit, in the
northern Waianae Mountain Range on the island of Oahu.
Management history
In 1996, prior to reintroduction, the Kahanahaiki fence was constructed and ungulates
were removed for protection of S. obovata and eleven other endangered species. Since
1998 ecosystem level suppression of rodents and invasive plants has been conducted for
the protection of S. obovata and other vulnerable resources (OANRP 2009) (Figure 4).
The reintroduction, referred to hereafter as MMR-G, is representative of a single founder
from Kahanahaiki. Site selection was based on the following criteria: appropriate habitat
and associated species within the historic geographic distribution and similar topography
relative to naturally occurring populations (OANRP 2003a). Stock from the other six
source populations was not used for the MMR-G reintroduction to avoid potential
outbreeding depression and the loss of localized adaptations (Kawelo et al. 2012). This
Appendix ES-12-2 PhD Proposal Lalasia Bialic-Murphy

30
decision was partially supported by recent research that was conducted to examine the
risk of inbreeding and outbreeding depression of mixing founder stock (Weisenberger
2012). Inbreeding and outbreeding depression were not detected. However, plants from
maternal source populations furthest from the Kahanahaiki population had the lowest
progeny fitness when outplanted at Kahanahaiki (which is the driest and lowest elevation
reintroduction site), which may indicate local adaptation. Alternatively, reduced progeny
fitness may be the effect of the numerical small population size and genetic drift.
Management recommendation of that study for the reintroduction of S. obovata at
Kahanahaiki was: “propagules that originate from higher elevations should not be moved
to lower elevations. Kahanahaiki progeny are the only plants that should be planted into
Kahanahaiki gulch.”
Seeds used for the reintroduction were collected and grown in a greenhouse for one
growing season, prior to outplanting. The mean height at reintroduction was 58 cm. Six
outplanting efforts were conducted from 1999 through 2011.
Year Planted Number Planted
Number Alive (2014)
% Remaining
1999 4 0 0% 2000 6 0 0% 2006 66 2 3% 2009 80 29 36% 2011 102 66 64% Total 258 97 38%
Table 3: S. obovata reintroduction effort from 1999–2011.
Starting in 2011, localized suppression of exotic slug (Stylommatophora, Limacidae and
Systellommatophora, Veronicellidae) has been conducted at the MMR-G reintroduction
site. The slug suppression methodology is hand broadcast of Sluggo (Neudorff Co.,
Fresno, California) molluscicide at a monthly application rate. Sluggo application does
not occur in the summer months, when slug density is low (Stephanie Joe, pers. comm.).
The justification for this management action was based on a study conducted by (Joe &
Appendix ES-12-2 PhD Proposal Lalasia Bialic-Murphy

31
Daehler 2007). The results of that study indicated that slugs had a significant effect on S.
obovata seedlings, with a fifty percent reduction in survivorship over a six-month period.
Data collection Demographic data
Field monitoring was initiated in April of 2014 and will be conducted annually for three
consecutive years. At the start of the study a total of 14 1x1m permanent plots were
installed throughout the outplanting site. We delineated the plot boundaries with pin flags
in the upper left and lower right corners (when facing uphill) for tracking purposes.
Plants, within each plot, that were > 8cm in height were permanently tagged (using
OANRP’s standard metal tags and wire method). For plants in the seedling (<8cm with
cotyledons) and small immature (<8cm with no cotyledons) life stages a subset of five
randomly selected plants were permanently tagged within each plot. To avoid damage,
immature plants <8cm were marked using pin flags and color coded wire (placed two
inches upslope from the plants) or color coded wire (wrapped around the base of the main
stem). Seedling clusters were tracked using subplots (within the 1x1 m plots); pin flags
and orange string delineating the plot boundaries.
For each tagged plant height to apical meristem, reproductive status and vigor data were
recorded. To calculate the mean buds and flowers per plant, which will be used to
estimate the fecundity term, a subset of twenty mature plants will be randomly selected
and tracked once a month during the 2015 fruiting season. The total number of buds and
flowers on each infructescence will be recorded. To avoid double counting, the monitored
infructescence will be tagged using orange sewing thread. Fecundity will be the product
of the mean “fruits per flower” and “ seeds per fruit”, which were data obtained from a
previous study that was conducted at Kahanahaiki in 2009 (Weisenberger 2012), and the
mean buds and fruits per plant. The following abiotic and biotic environmental
parameters will also be monitored: annual precipitation, rooting substrate, and percent
cover of non-native vegetation. These data will be used to investigate how annual
precipitation, rooting substrate, and percent cover of non-native vegetation are associated
with temporal variation in vital rates and population dynamics. In addition, a water
content reflectometer (CS-616 Water Content Reflectometer, Campbell Scientific, Inc.)
Appendix ES-12-2 PhD Proposal Lalasia Bialic-Murphy
32
will be used to calculate the mean gravimetric soil water content (GSWC) at the field site
during the dry season, June and August, at Kahanahaiki (Giambelluca et al. 2013). Field
GSWC measurements will be taken twice a week for six weeks, six measurements in
June and six in August of 2014.
Drought and soil moisture data
To isolate the potential effect of pre-determined climate change scenarios (focusing on
precipitation) on seedling survival necessary for matrix model simulation, I will conduct
a greenhouse experiment. The experiments will be conducted in the Botany Greenhouses
at the University of Hawai‘i at Manoa in the spring of 2015.
The four water treatments will be: 1) “ambient” GSWC, mimicking mean field GSWC
during the driest months, which are June and August (Giambelluca et al. 2013), 2) a 20%
daily decrease in water, relative to the ambient water treatment 3) a 20% daily increase in
water, relative to the ambient water treatment 4) a 60% daily decrease in water treatment,
relative to the ambient water treatment (to mimic a persistent decrease in precipitation
that is consistent with current and predicted climate change in Hawai‘i) (Chu et al. 2010).
For each treatment the sample unit will be individual seedlings. A sample of 20 plants
will be used for each treatment, with a total of N=80 plants. The seeds that will be used
for the study were collected from five randomly selected mature plants at the field site in
the spring of 2014. The seeds were dried at 24° C and 43% relative humidity for one
month and then stored at -18°C and 20% relative humidity. In the spring of 2015, I will
germinate the seeds on 1% water agar (Sigma-Aldrich A1296) in Petri dishes. Following
germination, seedlings will be transplanted to 10 cm-diameter pots. Field soil (extracted
from a location in close proximity to the field population) will be used for the
experiment. Equal amounts of soil will be weighted and added to each pot. To recover
from transplant shock, seedlings will be placed on greenhouse benches and watered daily
for 1–2 weeks. The seedlings will then be randomly assigned to one of the four water
treatments. Plants will be watered, using the pre-determined watering treatment, every
other day for two months. Mortality data will be recorded each visit. At two months I will
Appendix ES-12-2 PhD Proposal Lalasia Bialic-Murphy
33
record data on height to the apical meristem and total number of expanded leaves. At the
end of the two-month watering treatments I will stop water all of the plant to mimic
extreme drought conditions. The plants will be monitored every other day until all plants
have died. Mortality data will be recorded each visit.
Data Analysis Integral projection model
I will use continuous individual plant vital rate data to project the ambient population
dynamics, using an integral projection modeling (Easterling et al. 2000):
n !, ! + 1 = ∫!k !, ! n !, ! !" (1)
with the integration being over all possible plant height Ω. The function n !, ! + 1
describes the number of individuals of size ! at time ! + 1 . The function k !, ! is a
kernel, which is similar to a stage structured matrix, comprised of fecundity and survival-
growth of individual plants. n(!, !) summarizes the population state at time t. Unlike a
stage structured matrix, which represents the transition probability of discrete life stages,
a kernel represents a nonnegative surface of all possible transitions (i.e., survival, growth
and fecundity) of individual plants from size ! at time (t) to size ! at time (t+1).
The function k is composed of survival-growth p !,! , which is the probability of
individuals of size ! growing to size ! (2).
! !,! = ! ! ! !,! (2)
Fertility f !,! is composed of the probability of mature survival !(!), probability of
fruiting f!(!), number of fruits f! ! and the probability of a seed germinating and
establishing p!p!.
! !,! = ! ! !! ! !!!!!!(!) (3)
Appendix ES-12-2 PhD Proposal Lalasia Bialic-Murphy
34
I will use the kernel (k) to project the long-term population growth rate. A population
growth rate <1 indicates a declining population, a population growth rate = 0 indicates a
stable population and a population growth rate >1 indicates a growing population.
I will also conduct elasticity analysis to identify how different areas of the kernel
(individual plant vital rates) influence the population growth rate following Easterling et
al. (2000), which is:
! !!, !! = ! !!,!!!
! !! ! !!!,!
(4)
The interpretation of elasticity, using an IPM approach, is similar to that of a structured
matrix model. However, the proportional relative importance of ! to a small change in a
vital rate is calculated for a small disk center in the kernel rather than for a discrete life
stage.
To simulate the affect of the drought treatments on population dynamics, I will construct
four additional sets of yearly transition kernels, substituting the ! !,! function by the
mean survival and growth of each watering treatment and the probability of establishment
and germination !!!! of the fertility function by the proportional difference in the
establishment rate of each watering treatment, relative to the ambient (i.e., field)
establishment rate. I will then compare the population dynamics of the drought
simulation to the ambient projection.
The simulations do not take into account density dependence, which may create a
potential bias of the projections. To assess if density dependence is a driving factor of
seedling survival and growth, additional analysis will be conducted. Specifically, tagged
plants each year of the study will be categorized as either: 1) isolated seedlings or 2)
seedling clumps. Analysis will then be conducted to determine if survival and growth of
seedlings clumps and isolated plants is significantly different. If seedlings clumps have a
significantly lower survival rate or slower growth it will indicate density dependency. If
Appendix ES-12-2 PhD Proposal Lalasia Bialic-Murphy

35
density dependence is detected, I will account for it by developing a density dependent
IPM, which means I will incorporate the density of seedlings in the fertility function of
the IPM eqn (1).
6 - Study Question #4: For plant reintroductions, are the vital rates of outplanted
individuals and the first filial generation different? If so, does the transition from an
outplanted to a naturally occurring population affect short and long-term
population dynamics?
Background and rationale
Preventing extinction and reversing negative population trends of rare species is a
primary focus of conservation biology (IUCN 2013). This is particularly challenging for
the rarest species, which are most at risk of extinction. For these taxa, urgent
conservation management is needed. Population reintroduction into natural environments
protected from development is the primary strategy used by responsible conservation
agencies worldwide to prevent biodiversity loss (IUCN 2013; Maschinski & Haskins
2012; Soorae 2013). The end goal is to achieve self-sustaining populations and promote
meta-population dynamics (Falk et al. 1996; Pavlik 1996). However, few detailed
demographic studies have been conducted to evaluate if reintroductions result in the
desired end goal (Maschinski & Haskins 2012). Thus, there is a vital need to advance our
understanding of what makes plant reintroductions effective and when it is an appropriate
conservation tool.
Of the few demographic studies that have been conducted, habitat conversion was listed
as the primary cause of endangerment (Bell et al. 2003; Colas et al. 2008; Liu et al. 2004;
Maschinski & Duquesnel 2007). Those studies suggest that population reintroductions
can be an effective management tool when outplanting in native-dominated ecosystems.
Those studies also illustrate that survival, growth and fecundity of outplanted populations
often differ significantly from those of naturally occurring populations (Bell et al. 2003;
Colas et al. 2008; Liu et al. 2004; Maschinski & Duquesnel 2007).
Appendix ES-12-2 PhD Proposal Lalasia Bialic-Murphy

36
Differences in vital rates between outplanted and naturally occurring populations can
result in different population level dynamics and the required number of individuals to
maintain a self-sustaining population. The mechanism driving the differences in vital
rates is unknown, although spatial variation in habitat quality was likely a contributing
factor. Increased genetic diversity of outplanted individuals may also explain higher
fecundity of outplanted individuals for one of the taxa (Colas et al. 2008). These studies
illustrate the risk of basing numerical size and demographic structure goals on studies
conducted on naturally occurring populations.
Two of the primary knowledge gaps of plant reintroduction are: 1) When there are
multiple environmental threats, not all of which can be managed, and the remaining
suitable habitat has been altered significantly, will population reintroduction and the
suppression of the primary threats be enough to achieve self-sustaining populations? 2)
Are there differences in vital rates of outplanted individuals and first filial generation? If
so, will the transition from an outplanted to a naturally occurring population affect the
population growth rate and what is the initial reintroduction size needed to result in a
self-sustaining population? To address these knowledge gaps, I will conduct a detailed
demographic study of two reintroduced plant populations, S. obovata and D.
waianaeensis, following two decades of active threat control management and multi-year
intensive reintroduction efforts.
Material and methods
For a detailed description of the study systems, study site and management history refer
to sections 2.2 and 2.3.
Data collection Demographic data
I will use field data collected for the demography of S. obovata and D. waianaeensis
studies.
Fecundity data
To calculate the difference in fecundity of S. obovata and D. waianaeensis reintroduced
individuals and the naturally recruited cohort necessary for matrix model simulation, a
Appendix ES-12-2 PhD Proposal Lalasia Bialic-Murphy
37
subset of twenty mature plants per taxon (ten F1 individuals and ten reintroduced
individuals) will be randomly selected and tracked once a month during the 2015 fruiting
season. To avoid double counting, monitored infructescense will be tagged using orange
sewing thread. For analytical purposes, age and size will be included as covariates to
control for the influence they may have on fecundity.
Data analysis I will follow the approach described in the data analysis section of 2.1 of this document
to construct the yearly transition matrices and project the ambient population dynamics.
To simulate the affect of artificial cohort transition on population dynamics, I will
construct two addition sets of yearly transition matrices: 1) only outplanted individuals
and 2) only naturally recruiting cohorts. Specifically, the fecundity term of the fertility
element in the ambient yearly transition matrices, !, will be altered by the proportional
difference in fecundity of outplanted and naturally occurring cohort plants. The results of
these two simulations will then be compared to the ambient treatment.
This method does not take into account density dependency, which may create a potential
bias of the projections. However, D. waianaeensis seedling survival of isolated seedlings
and seedling clumps were not significantly different at the field sites (Lalasia Bialic-
Murphy, unpublished data), which suggests that density dependence could be neglected
in our system. Similar analysis will be conducted for S. obovata and considered when
interpreting the results.
Appendix ES-12-2 PhD Proposal Lalasia Bialic-Murphy

38
7 - Timeline
Spring 2014 Fall 2014 Spring 2015 Fall 2015 Spring 2016 Fall 2016Literature ReviewOral DefenseDissertation
Manuscripts
Data CollectionGreenhouse Experiment
Data CollectionRodent MonitoringManuscripts
S. obovata
C. dentataData CollectionManuscripts
D. waianaeensis
Appendix ES-12-2 PhD Proposal Lalasia Bialic-Murphy

39
References: Banko, W., P. Banko, T. Pratt, C. Atkinson, P. Banko, J. Jacobi, and B. Woodworth.
2009. Historic decline and extinction. Conservation Biology of Hawaiian Forest Birds: Implications for Island Avifauna. Yale University:25-58.
Bell, T., M. Bowles, and A. McEachern. 2003. Projecting the success of plant population restoration with viability analysis. Pages 313-348. Population viability in plants. Springer.
Bierzychudek, P. 1982. The demography of jack-in-the-pulpit, a forest perennial that changes sex. Ecological monographs 52:335-351.
Burd, M. 1994. Bateman’s principle and plant reproduction: the role of pollen limitation in fruit and seed set. The Botanical Review 60:83-139.
Busby, P. E., P. Vitousek, and R. Dirzo. 2010. Prevalence of Tree Regeneration by Sprouting and Seeding Along a Rainfall Gradient in Hawai'i. Biotropica 42:80-86.
Carpenter, F. L. 1976. Plant-pollinator interactions in Hawaii: pollination energetics of Metrosideros collina (Myrtaceae). Ecology:1125-1144.
Caswell, H. 1989. Matrix population models. Wiley Online Library. Caswell, H. 2001. Matrix population models: construction, analysis, and interpretation,
2001. Sinauer, Sunderland. Caswell, H. 2007. Sensitivity analysis of transient population dynamics. Ecol Lett 10:1-
15. Change, I. P. O. C. 2007. Climate change 2007: The physical science basis. Agenda
6:333. Colas, B., F. Kirchner, M. Riba, I. Olivieri, A. Mignot, E. Imbert, C. Beltrame, D.
Carbonell, and H. Fréville. 2008. Restoration demography: a 10-year demographic comparison between introduced and natural populations of endemic Centaurea corymbosa (Asteraceae). Journal of Applied Ecology 45:1468-1476.
Cole, R. J., C. M. Litton, M. J. Koontz, and R. K. Loh. 2012. Vegetation Recovery 16 Years after Feral Pig Removal from a Wet Hawaiian Forest. Biotropica 44:463-471.
Crone, E. E., E. S. Menges, M. M. Ellis, T. Bell, P. Bierzychudek, J. Ehrlen, T. N. Kaye, T. M. Knight, P. Lesica, W. F. Morris, G. Oostermeijer, P. F. Quintana-Ascencio, A. Stanley, T. Ticktin, T. Valverde, and J. L. Williams. 2011. How do plant ecologists use matrix population models? Ecol Lett 14:1-8.
Cuddihy, L. W., and C. P. Stone 1993. Alteration of native Hawaiian vegetation; effects of humans , their activities and introductions. University of Hawaii Press, Honolulu.
Denslow, J. S. 1980. Gap partitioning among tropical rainforest trees. Biotropica. Dostálek, T., and Z. Münzbergová. 2013. Comparative population biology of critically
endangered Dracocephalum austriacum (Lamiaceae) in two distant regions. Folia Geobotanica 48:75-93.
Easterling, M. R., S. P. Ellner, and P. M. Dixon. 2000. Size-specific sensitivity: applying a new structured population model. Ecology 81:694-708.
Ehrlén, J., and O. Eriksson. 1995. Pollen Limitation and Population Growth in a Herbaceous Perennial Legume. Ecology 76:652-656.
Appendix ES-12-2 PhD Proposal Lalasia Bialic-Murphy

40
Eriksson, O., and J. Ehrlen. 1992. SEED AND MICROSITE LIMITATION OF RECRUITMENT IN PLANT-POPULATIONS. Oecologia 91:360-364.
Falk, D. A., C. I. Millar, and M. Olwell 1996. Restoring diversity: strategies for reintroduction of endangered plants. Island Press.
Fetcher, N., B. R. Strain, and S. F. Oberbauer. 1983. Effects of light regime on the growth, leaf morphology, and water relations of seedlings of two species of tropical trees. Oecologia 58:314-319.
Fox, G. A., and J. Gurevitch. 2000. Population numbers count: tools for near‐term demographic analysis. The American Naturalist 156:242-256.
García, M. B. 2003. Demographic viability of a relict population of the critically endangered plant Borderea chouardii. Conservation Biology 17:1672-1680.
García, M. B., and J. Ehrlén. 2002. Reproductive effort and herbivory timing in a perennial herb: fitness components at the individual and population levels. American Journal of Botany 89:1295-1302.
Gerhardt, K. 1996. Effects of root competition and canopy openness on survival and growth of tree seedlings in a tropical seasonal dry forest. Forest Ecology and Management 82:33-48.
Giambelluca, T. W., Q. Chen, A. G. Frazier, J. P. Price, Y.-L. Chen, P.-S. Chu, J. K. Eischeid, and D. M. Delparte. 2013. Online Rainfall Atlas of Hawai‘i. Bull. Amer. Meteor. Soc.
Gilbert, G. S., K. E. Harms, D. N. Hamill, and S. P. Hubbell. 2001. Effects of seedling size, El Niño drought, seedling density, and distance to nearest conspecific adult on 6-year survival of Ocotea whitei seedlings in Panamá. Oecologia 127:509-516.
Gillespie, R. G., and D. A. Clague 2009. Encyclopedia of islands. Univ of California Press.
Gilpin, M. E., and M. E. Soule 1986. Minimum viable population: Processes of species extinction. Sinauer Associates, Inc, Sunderland, Massachusetts.
Haridas, C. V., and S. Tuljapurkar. 2007. Time, transients and elasticity. Ecol Lett 10:1143-1153.
Harper, J. L. 1977. Population biology of plants. Population biology of plants. HPPRCC. 2011. Revised recovery objective guidelines: Hawaii and Pacific Plants
Recovery Coordinating Committee., U.S. Fish and Wildlife Service Pacific Island Ecoregion, Honolulu, Hawaii.
IUCN. 2013. The IUCN Red List of Threatened Species. http://www.iucnredlist.org/about/summary-statistics.
Kellner, J. R., G. P. Asner, K. M. Kinney, S. R. Loarie, D. E. Knapp, T. Kennedy-Bowdoin, E. J. Questad, S. Cordell, and J. M. Thaxton. 2011. Remote analysis of biological invasion and the impact of enemy release. Ecological Applications 21:2094-2104.
Kobe, R. K., S. W. Pacala, J. A. Silander Jr, and C. D. Canham. 1995. Juvenile tree survivorship as a component of shade tolerance. Ecological Applications:517-532.
Koons, D. N., J. B. Grand, B. Zinner, and R. F. Rockwell. 2005. Transient population dynamics: Relations to life history and initial population state. Ecological Modelling 185:283-297.
Krushelnycky, P. D., L. L. Loope, T. W. Giambelluca, F. Starr, K. Starr, D. R. Drake, A. D. Taylor, and R. H. Robichaux. 2013. Climate‐associated population declines
Appendix ES-12-2 PhD Proposal Lalasia Bialic-Murphy
41
reverse recovery and threaten future of an iconic high‐elevation plant. Global change biology 19:911-922.
Lammers, T. G., and C. E. Freeman. 1986. Ornithophily among the Hawaiian Lobelioideae (Campanulaceae): evidence from floral nectar sugar compositions. American Journal of Botany:1613-1619.
Liu, G. h., J. Zhou, D. s. Huang, and W. Li. 2004. Spatial and temporal dynamics of a restored population of Oryza rufipogon in Huli Marsh, South China. Restoration Ecology 12:456-463.
Loh, R. K., and J. T. Tunison. 1999. Vegetation recovery following pig removal in'Ola'a-Koa Rainforest Unit, Hawaii Volcanoes National Park.
Maschinski, J., and J. Duquesnel. 2007. Successful reintroductions of the endangered long-lived Sargent’s cherry palm, Pseudophoenix sargentii, in the Florida Keys. Biological Conservation 134:122-129.
Maschinski, J., and K. E. Haskins 2012. Plant reintroduction in a changing climate: promises and perils. Island Press.
McLaughlin, J. F., J. J. Hellmann, C. L. Boggs, and P. R. Ehrlich. 2002. Climate change hastens population extinctions. Proceedings of the National Academy of Sciences 99:6070-6074.
Menges, E. S. 1990. Population viability analysis for an endangered plant. Conservation biology 4:52-62.
Morris, W. F., and D. F. Doak 2002. Quantitative conservation biology. Sinauer Associates Sunderland, Massachusetts, USA.
Morris, W. F., C. A. Pfiser, T. Shripad, C. V. Haridas, C. Boggs, M. S. Boyce, E. M. Bruna, D. R. Church, T. Coulson, D. F. Doak, S. Forsyth, J.-M. Gaillard, C. C. Horvitz, S. Kalisz, B. E. Kendall, T. M. Knight, C. T. Lee, and E. S. Menges. 2008. Longevity can buffer plant and animal populations against changing climatic varibility. Ecology 89:19-25.
OANRP. 2009. Status reprot for the Makua and Oahu Implementation Plans. Pacific Cooperative Studies Unit, Honolulu, Hawaii.
OANRP. 2011. Status reprot for the Makua and Oahu Implementation Plans. Pacific Cooperative Studies Unit, Honolulu, Hawaii.
Parker, I. M. 1997. Pollinator limitation of Cytisus scoparius (Scotch broom), an invasive exotic shrub. Ecology 78:1457-1470.
Parmesan, C., and G. Yohe. 2003. A globally coherent fingerprint of climate change impacts across natural systems. Nature 421:37-42.
Pavlik, B. 1996. Defining and measuring success. Restoring diversity: strategies for reintroduction of endangered plants 127:155.
Pender, R. 2013a. Floral Trait Evolution and Pollen Ecology in the Hawaiian Lobeliad Genus, Clermontia (Campanulaceae) Botany. University of Hawaii at Manoa, ProQuest LLC (2013).
Pender, R. J. 2013b. Floral trait evolution and pollination ecology in the Hawaiian lobeliad genus Clermontia (Campanulaceae). UNIVERSITY OF HAWAI'I AT MANOA.
Pender, R. J., C. W. Morden, and R. E. Paull. 2014. Investigating the pollination syndrome of the Hawaiian lobeliad genus Clermontia (Campanulaceae) using floral nectar traits. American journal of botany 101:201-205.
Appendix ES-12-2 PhD Proposal Lalasia Bialic-Murphy

42
Pender, R. J., A. B. Shiels, L. Bialic-Murphy, and S. M. Mosher. 2013. Large-scale rodent control reduces pre-and post-dispersal seed predation of the endangered Hawaiian lobeliad, Cyanea superba subsp. superba (Campanulaceae). Biological invasions 15:213-223.
Picó, F. X., and M. Riba. 2002. Regional-scale demography of Ramonda myconi: remnant population dynamics in a preglacial relict species. Plant Ecology 161:1-13.
Pisanu, S., E. Farris, R. Filigheddu, and M. B. García. 2012. Demographic effects of large, introduced herbivores on a long-lived endemic plant. Plant Ecology 213:1543-1553.
Poorter, L., and Y. Hayashida-Oliver. 2000. Effects of seasonal drought on gap and understorey seedlings in a Bolivian moist forest. Journal of Tropical Ecology 16:481-498.
Ramula, S., M. Rees, and Y. M. Buckley. 2009. Integral projection models perform better for small demographic data sets than matrix population models: a case study of two perennial herbs. Journal of Applied Ecology 46:1048-1053.
Ren, H., G. Ma, Q. Zhang, Q. Guo, J. Wang, and Z. Wang. 2010. Moss is a key nurse plant for reintroduction of the endangered herb, Primulina tabacum Hance. Plant ecology 209:313-320.
Ruffino, L., K. Bourgeois, E. Vidal, C. Duhem, M. Paracuellos, F. Escribano, P. Sposimo, N. Baccetti, M. Pascal, and D. Oro. 2009. Invasive rats and seabirds after 2,000 years of an unwanted coexistence on Mediterranean islands. Biological invasions 11:1631-1651.
Shaffer, M. L. 1981. Minimum population sizes for species conservation. BioScience 31:131-134.
Shiels, A. B. 2010. Ecology and impacts of introduced rodents(Rattus spp. and Mus musculus) in the Hawaiian islands.
Shiels, A. B., and D. R. Drake. 2011. Are introduced rats (Rattus rattus) both seed predators and dispersers in Hawaii? Biological Invasions 13:883-894.
Shiels, A. B., W. C. Pitt, R. T. Sugihara, and G. W. Witmer. 2014. Biology and Impacts of Pacific Island Invasive Species. 11. Rattus rattus, the Black Rat (Rodentia: Muridae). Pacific Science 68:145-184.
Silvertown, J., M. Franco, and E. Menges. 1996. Interpretation of Elasticity Matrices as an Aid to the Management of Plant Populations for Conservation. Conservation Biology 10:591-597.
Soorae, P. S. 2013. Global Re-introduction Perspectives: 2013. Further case studies from around the globe
IUCN/SSC Re-introduction Specialist Group and Abu Dhabi, UAE: Environment Agency-Abu Dhabi, Gland, Switzerland.
Souther, S., and J. B. McGraw. 2014. Synergistic effects of climate change and harvest on extinction risk of American ginseng. Ecological Applications.
Towns, D. R., I. A. Atkinson, and C. H. Daugherty. 2006. Have the harmful effects of introduced rats on islands been exaggerated? Biological invasions 8:863-891.
Traveset, A., M. Nogales, J. A. Alcover, J. Delgado, M. López-Darias, D. Godoy, J. M. Igual, and P. Bover. 2009. A review on the effects of alien rodents in the Balearic
Appendix ES-12-2 PhD Proposal Lalasia Bialic-Murphy

43
(Western Mediterranean Sea) and Canary Islands (Eastern Atlantic Ocean). Biological Invasions 11:1653-1670.
USFWS. 1998. Recovery Plan for Oahu Plants in U. S. F. a. W. Service, editor, Portland, OR.
USFWS. 2012. Endangered species http://www.fws.gov/pacificislands/species.html, Portland, OR.
Vitousek, P. M. 1996. Biological invasions and ecosystem processes: towards an integration of population biology and ecosystem studies. Pages 183-191. Ecosystem Management. Springer.
Wagner, W. L., D. R. Herbst, and S. H. Sohmer 1999. Manual of the flowering plants of Hawai'i, Vols. 1 and 2. University of Hawai'i and Bishop Museum Press.
Wagner, W. L., S. G. Weller, and A. Sakai. 2005. Monograph of Schiedea (Caryophyllaceae-Alsinoideae).
Weisenberger, L. A. 2012. Inbreeding depression, outbreeding depression and heterosis in rare species in the genus Schiedea (Caryophyllaceae) on O`ahu. Page 188. University of Hawai'i at Manoa, Ann Arbor.
Whittaker, R. J., and J. M. Fernández-Palacios 2007. Island biogeography: ecology, evolution, and conservation. Oxford University Press.
Wilcove, D. S., D. Rothstein, J. Dubow, A. Phillips, and E. Losos. 1998. Quantifying threats to imperiled species in the United States. BioScience:607-615.
Appendix ES-12-2 PhD Proposal Lalasia Bialic-Murphy