assessment of ultrasonic phased array inspection method ... · pdf filepnnl-18596. technical...
TRANSCRIPT

PNNL-18596
Prepared for the U.S. Nuclear Regulatory Commission Under the U.S. Department of Energy Contract DE-AC05-76RL01830
Technical Letter Report
Assessment of Ultrasonic Phased Array Inspection Method for Welds in Cast Austenitic Stainless Steel Pressurizer Surge Line Piping
JCN N6398, Task 1B AA Diaz R Mathews AD Cinson TL Moran SL Crawford MT Anderson July 2009


PNNL-18596
Technical Letter Report
Assessment of Ultrasonic Phased Array Inspection Method for Welds in Cast Austenitic Stainless Steel Pressurizer Surge Line Piping JCN N6398, Task 1B AA Diaz R Mathews AD Cinson TL Moran SL Crawford MT Anderson July 2009 Prepared for the U.S. Nuclear Regulatory Commission under the U.S. Department of Energy Contract DE-AC05-76RL01830 Pacific Northwest National Laboratory Richland, Washington 99352


Abstract
Research is being conducted for the U.S. Nuclear Regulatory Commission (NRC) at the Pacific Northwest National Laboratory (PNNL) to assess the effectiveness and reliability of advanced nondestructive examination (NDE) methods for the inspection of light water reactor components. The scope of this research encompasses primary system pressure boundary materials including cast austenitic stainless steels (CASS); dissimilar metal welds; piping with corrosion-resistant cladding; weld overlays, inlays and onlays; and far-side examinations of austenitic piping welds. A primary objective of this work is to evaluate various NDE methods to assess their ability to detect, localize, and size cracks in coarse-grained steel components. In this effort, PNNL supports cooperation with Commissariat à l’Energie Atomique (CEA) to assess reliable inspection of CASS materials. The NRC Project Manager has established a cooperative effort with the Institut de Radioprotection et de Surete Nucleaire (IRSN). CEA, under funding from IRSN, are supporting collaborative efforts with the NRC and PNNL. Regarding its work on the NDE of materials, CEA is providing its modeling software (CIVA) in exchange for PNNL offering expertise and data related to phased-array detection and sizing, acoustic attenuation, and back scattering on CASS materials. This collaboration benefits the NRC because CEA performs research and development on CASS for Électricité de France (EdF).
This technical letter report provides a summary of a technical evaluation aimed at assessing the capabilities of phased-array (PA) ultrasonic testing (UT) methods as applied to the inspection of welds in CASS pressurizer (PZR) surge line nuclear reactor piping. A set of thermal fatigue cracks (TFCs) was implanted into three CASS PZR surge-line specimens (pipe-to-elbow welds) that were fabricated using vintage CASS materials formed in the 1970s, and flaw responses from these cracks were used to evaluate detection and sizing performance of the PA-UT methods applied. This effort was comprised of multiple elements that included use of microstructural knowledge (dimensional analysis, grain orientation, and grain type) as well as sound field modeling to more effectively modify inspection parameters and enhance the inspection outcomes. Advanced probe design and sound field simulations were employed to enhance detection and characterization of circumferentially oriented flaws, and an assessment of lateral (circumferential) flaw localization capability and performance was also conducted. An evaluation of flaw detection, length sizing, depth sizing, and signal-to-noise ratio was performed for all flaws in the subject specimens, as a function of various inspection parameters, and finally, measurements were made to quantify and assess the baseline CASS material noise and its potential impact on flaw detection.
Previous work has been focused on heavy-walled primary loop piping components with outer diameters (OD) ranging from 71.12 to 91.44 cm (28 to 36 in.). However, a variety of thinner cast piping welds, with OD measurements ranging from approximately 20.48 to 35.56 cm (12 to 14 in.), exist in pressurized water reactors, specifically in PZR surge lines and dissimilar metal safe ends at Combustion Engineering-designed plants. These smaller bore piping networks typically exhibit wall thicknesses ranging from 3.05 to 4.32 cm (1.2 to 1.7 in.), which is approximately half that of the larger bore, primary loop piping components. The CASS PZR surge-line specimens used in the study described in this report were fabricated from piping components salvaged from CE-designed units that were never brought to full operation.
The CASS PZR surge-line specimens used in this study were sliced, polished, and chemically etched to bring out the microstructures of both pipe and elbow segments. Microstructural analyses were
iii

conducted, and dimensional results provided insights into the inspection wavelength-to-grain diameter ratios. Grain diameters ranged from very small 0.5 mm (0.02 in.) to very large 41.0 mm (1.61 in.). A baseline CASS material noise analysis was also conducted. Full circumferential PA scans were acquired at 800 kHz and 1.5 MHz on the centrifugally cast stainless steel (CCSS) pipe ends of the three surge-line specimens to assess baseline material noise. In all specimens, the higher frequency resulted in more signal dropout, as anticipated. The higher frequency (1.5 MHz) is more sensitive to attenuation and beam redirection as the wavelength relative to the average grain diameters found in these specimens is much smaller. The median length of the diminished signal was suggested as an indication of flaw length that could go undetected due to a loss-of-signal effect from the coarse material microstructure. With this assumption, the data show that a flaw less than 14.6 mm (0.57 in.) could go undetected in this material as a worst-case scenario. This is only 1.4% of the circumference and shows very good detection. The results showed that the lower frequency (800 kHz) was much more effective and consistent at detecting the corner response in all three specimens.
This technical evaluation included PA-UT examinations on implanted/fabricated TFCs to evaluate detection, localization, and sizing performance as a function of frequency. Four different custom-made PA probes were employed in this study, operating nominally at 800-kHz, 1.0-MHz, 1.5-MHz, and 2.0-MHz center frequencies. Data were acquired as a function of inspection frequency, inspection angle (30° to 70° in 1° increments), and from both sides of the weld. The detection and sizing data showed that all the implanted TFCs in all three specimens were detected from both the CCSS (the pipe) and the statically cast stainless steel (SCSS—the elbow) sides of the weld at all inspection frequencies. Data at 800 kHz were not collected on one of the cracks from the SCSS elbow side due to geometrical constraints that precluded effective coupling of the PA probe. The results reported here show that longitudinal mode, transmit-receive matrix phased-array probes over a wide frequency range, can provide effective sound fields for detection and characterization of TFCs in CASS PZR surge-line components. PA-UT results were compared against true-state data for all flaws, and root mean square error (RMSE) was computed as a metric for both length sizing and depth sizing of the flaws in this study. Also, signal-to-noise ratio (SNR) measurements were made, and SNR values were computed and documented for all flaws and scanning scenarios.
The American Society of Mechanical Engineers (ASME) Boiler and Pressure Vessel Code, Section XI, Rules for Inservice Inspection (ISI) of Nuclear Power Plant Components, acceptance criterion for length sizing requires an RMSE less than 19.05 mm (0.75 in.), while the depth sizing criterion requires an RMSE less than 3.81 mm (0.125 in.). Regarding detection capability, all flaws were detected with the exception of flaw number 3 in specimen 7C-059 as seen from the SCSS elbow at 800 kHz. Data could not be collected on this flaw because of the large footprint of the probe and the elbow geometry on the intrados. Signal-to-noise values were very good, showing that flaw detection was not an issue. The data show that flaws are detectable at frequencies up to 2 MHz in these surge-line specimens, and that flaw-sizing performance is not degraded at these frequencies. The higher frequencies applied (especially the 2.0-MHz probe) provided flaw-tip-diffracted energy or specular energy from the upper portion of the flaw, which allowed time-of-flight depth sizing, with sizing error within the ASME Code-allowable limit. Aggregate length sizing was slightly over the ASME Code-allowable limit on specimen 7C-059 and generally within the limit on the two 9C specimens. Length sizing was generally better from the CCSS pipe side at 800 kHz and 1.0 MHz than from the SCSS elbow side; however, this trend was reversed at the higher frequencies, as the 1.5- and 2.0-MHz probes resulted in more accurate length sizing in the SCSS material. The crack depth sizing was similar from both the CCSS and the
iv

SCSS sides over all frequencies with an approximate 1.3-mm (0.05-in.) average error. Calculated SNR values were all very good, indicating minimal attenuation effects on sound field propagation over the frequency range applied.
The issue of beam skew or beam redirection and the potential for circumferential error in the positional registration of flaw responses relative to the true position of the probe on the part surface was also addressed. The measured localization data were compared to the true-state flaw position data on the specimens, and this information was plotted and analyzed to determine if beam skew and localization of the cracks were significantly affected by the microstructures. A flaw mapping exercise was conducted and the data showed that lateral (circumferential) beam skewing does not appear to be an issue impacting these data. There does not appear to be a shift toward one side or the other in start or end positions of the mapped flaws.
In conclusion, state-of-the-art phased-array inspection approaches are rapidly evolving and the capability to reliably detect and effectively characterize 10%–50% through-wall TFCs in CASS components where the wall thickness is generally less than 50 mm (2.0 in.) has been demonstrated here. PA-UT data obtained using inspection frequencies ranging from 800 kHz to 2.0 MHz yielded strong SNRs and provided accurate length and depth sizing results. While additional questions remain to be answered, long-wavelength ultrasonic approaches coupled with advanced signal processing technologies are beginning to show signs of success toward addressing this challenging inspection issue.
v

vi
.

Acronyms and Abbreviations
ASME American Society of Mechanical Engineers
BW bandwidth
CASS cast austenitic stainless steel
CCSS centrifugally cast stainless steel
CEA Commissariat à l’Energie Atomique
dB decibels
DMW dissimilar metal weld
EdF Électricité de France
EPRI Electric Power Research Institute
ID inner diameter
IRSN Institut de Radioprotection et de Surete Nucleaire
ISI inservice inspection
LWR light water reactor
NDE nondestructive examination
NPP nuclear power plant
NRC U.S. Nuclear Regulatory Commission
OD outer diameter
PA phased array
PA-UT phased array ultrasonic testing
PNNL Pacific Northwest National Laboratory
PWR pressurized water reactor
PZR pressurizer
RMSE root mean square error
SCSS statically cast stainless steel
SNR signal-to-noise ratio
TFC thermal fatigue crack
TLR technical letter report
TRL transmit-receive longitudinal
UT ultrasonic testing
WSS wrought stainless steel
vii

viii

Contents
Abstract ........................................................................................................................................................ iii
Acronyms and Abbreviations .....................................................................................................................vii
1.0 Introduction and Objectives............................................................................................................... 1.1
2.0 Scope of PA-UT Evaluations ............................................................................................................ 2.1
3.0 The CASS Inspection Challenge and Microstructural Analysis of PZR Surge-line specimens........ 3.1
4.0 Phased Array Probes and Focal Law Development .......................................................................... 4.1
4.1 Ultrasonic Probe Details............................................................................................................ 4.1
4.2 Focal Law Development ........................................................................................................... 4.1
4.3 2.0-MHz TRL Probe ................................................................................................................. 4.2
4.4 1.5-MHz TRL Probe ................................................................................................................. 4.4
4.5 1.0-MHz TRL Probe ................................................................................................................. 4.6
4.6 800-kHz TRL Probe .................................................................................................................. 4.7
5.0 Data Acquisition Set-Up and Configuration...................................................................................... 5.1
5.1 Phase Array Data Acquisition ................................................................................................... 5.1
6.0 Specimens and Flaws Evaluated in this Study .................................................................................. 6.1
6.1 CASS PZR Surge-Line Specimen 7C-059................................................................................ 6.1
6.2 CASS PZR Surge-Line Specimen 9C-001................................................................................ 6.4
6.3 CASS PZR Surge-Line Specimen 9C-002................................................................................ 6.6
7.0 Data Analysis and Results: CASS PZR Surge Line ......................................................................... 7.1
7.1 800-kHz Phased-Array Data ..................................................................................................... 7.1
7.2 1.0-MHz Phased Array Data ..................................................................................................... 7.4
7.3 1.5-MHz Phased Array Data ..................................................................................................... 7.5
7.4 2.0-MHz Phased Array Data ..................................................................................................... 7.7
7.5 Summary of Results ................................................................................................................ 7.10
7.6 Baseline CASS Material Noise Analyses................................................................................ 7.15
8.0 Discussion and Conclusions .............................................................................................................. 8.1
9.0 References ......................................................................................................................................... 9.1
ix

Figures
3.1 Photographs of the Side-View and End-View of the CASS PZR Ring Segment............................ 3.2
3.2 Photographs of Polished and Chemically Etched CASS PZR Ring Segment Showing the Pipe-Side Grain Microstructure and the Elbow-Side Grain Microstructure.................................... 3.2
3.3 WNP-3 Surge Line Section Showing the Locations of the Pipe and Elbow Cuts to Produce Two Pipe-to-Elbow Specimens, 9C-001 and 9C-002...................................................................... 3.3
3.4 WNP-3 Surge Line Elbow Microstructure ...................................................................................... 3.3
4.1 The ZETEC® Advanced Phased Array Calculator is Useful for Generating Focal Laws and Simulating the Sound Field for the Focal Law to Determine Beam Characteristics ....................... 4.2
4.2 2.0 MHz, Phased-Array Probe, Originally Developed for Inlays, Onlays, and Overlays ............... 4.3
4.3 Un-normalized Beam Simulations for the 2.0-MHz PA Probe at 45° Incidence in the Cast PZR Surge-Line Specimen, Using a Half-Path Focus at 50 mm..................................................... 4.3
4.4 1.5-MHz TRL Probe Originally Designed for Wrought Stainless Steel Welds .............................. 4.4
4.5 Simulations of the Beams Created by the 1.5-MHz TRL Arrangement for 30°, 45°, and 60°........ 4.5
4.6 Beam Simulations for the 1.5 MHz PA Probe at 45° Incidence in the Cast PZR Surge-Line Specimen, Using a Half-Path Focus at 50 mm................................................................................ 4.5
4.7 1.0 MHz, Phased-Array Probe, Originally Developed for Inlays, Onlays, and Overlays ............... 4.6
4.8 Un-normalized Beam Simulations for the 1.0-MHz PA Probe at 45° Incidence in the Cast PZR Surge-Line Specimen, Using a Half-Path Focus at 50 mm..................................................... 4.7
4.9 800-kHz TRL Probe ........................................................................................................................ 4.8
4.10 Simulations of the Beams Created by the 800-kHz TRL Arrangement for 30°, 45°, and 60° ........ 4.9
4.11 Beam Simulations for the 800 kHz PA Probe at 45° incidence in the Cast PZR Surge-Line Specimen, Using a Half-Path Focus at 50 mm................................................................................ 4.9
5.1 Photographs of the PZR Surge-Line Specimen 7C-059 .................................................................. 5.1
5.2 Data Acquisition System and Laboratory Workstation ................................................................... 5.2
6.1 Photographs of the Inside Surface of the CASS PZR Surge-Line after Excavation and Preparation of the Areas Targeted for Flaw Implantation ............................................................... 6.2
6.2 Side View Illustration of All Four Thermal Fatigue Cracks Implanted into PZR CASS Specimen 7C-059 ............................................................................................................................ 6.3
6.3 End View Illustration of All Four Thermal Fatigue Cracks Implanted into PZR CASS Specimen 7C-059 ............................................................................................................................ 6.4
6.4 Side View Illustration of All Four Thermal Fatigue Cracks Implanted into PZR CASS Specimen 9C-001 ............................................................................................................................ 6.5
6.5 End View Illustration of All Four Thermal Fatigue Cracks Implanted into PZR CASS Specimen 9C-001 ............................................................................................................................ 6.6
6.6 Side View Illustration of All Four Thermal Fatigue Cracks Implanted into PZR CASS Specimen 9C-002 ............................................................................................................................ 6.7
6.7 End View Illustration of All Four Thermal Fatigue Cracks Implanted into PZR CASS Specimen 9C-002 ............................................................................................................................ 6.8
7.1 800-kHz Data on Pipe Side of 9C-002, Flaw 1, Merged Image for Length Sizing......................... 7.2
x

7.2 800-kHz Data on Elbow Side of 9C-002, Flaw 1, Merged Image for Length Sizing ..................... 7.2
7.3 0.8-MHz Data on Pipe Side of 9C-002, Flaw 1a on the Left and 1b on the Right for Depth Sizing .................................................................................................................................... 7.3
7.4 0.8-MHz Data on Elbow Side of 9C-002, Flaw 1a on the Left and 1b on the Right for Depth Sizing .................................................................................................................................... 7.3
7.5 1.0-MHz Data on Pipe Side of 7C-059, Flaw 1, Merged Image for Length Sizing ........................ 7.4
7.6 1.0-MHz Data on Elbow Side of 7C-059, Flaw 1, Merged Image for Length Sizing..................... 7.5
7.7 1.5-MHz Data on Pipe Side of 9C-001, Flaw 2, Merged Image for Length Sizing ........................ 7.6
7.8 1.5-MHz Data on Elbow Side of 9C-001, Flaw 2, Merged Image for Length Sizing..................... 7.6
7.9 2.0-MHz Data on Pipe Side of 9C-002, Flaw 2, Merged Image for Length Sizing ........................ 7.8
7.10 2.0-MHz Data on Elbow Side of 9C-002, Flaw 2, Merged Image for Length Sizing..................... 7.8
7.11 2.0-MHz Data on Elbow Side of 9C-002, Flaw 2, for Depth Sizing............................................... 7.9
7.12 Map of True-State and Measured, Circumferential Flaw Localization Data for CASS PZR Surge-Line Specimen 7C-059 ....................................................................................................... 7.13
7.13 Map of True-State and Measured, Circumferential Flaw Localization Data for CASS PZR Surge-Line Specimen 9C-001 ....................................................................................................... 7.13
7.14 Map of True-State and Measured, Circumferential Flaw Localization Data for CASS PZR Surge-Line Specimen 9C-002 ....................................................................................................... 7.14
7.16 Pipe End Corner Response on 9C-001 at 800 kHz........................................................................ 7.17
7.17 Pipe End Corner Response on 9C-001 at 1.5 MHz ....................................................................... 7.17
7.18 Pipe End Corner Response on 9C-002 at 800 kHz........................................................................ 7.18
7.19 Pipe End Corner Response on 9C-002 at 1.5 MHz ....................................................................... 7.18
7.20 Pipe End Corner Response on 7C-059 at 800 kHz........................................................................ 7.19
7.21 Pipe End Corner Response on 7C-059 at 1.5 MHz ....................................................................... 7.19
7.22 Pipe End Corner Response on 7C-059 at 1.5 MHz ....................................................................... 7.20
xi

xii
Tables
3.1 Grain Diameter Measurements from the Three PZR Surge-line Specimens................................... 3.4
4.1 Ultrasonic Transducer Physical Specifications ............................................................................... 4.1
4.2 Theoretical Focal Spot Dimensions for all Probes Used in this Study.......................................... 4.10
6.1 Summary Table Depicting True-State Dimensions and Locations of All Flaws in All Three CASS PZR Surge-Line Specimens Examined in This Study.......................................................... 6.9
7.1 Length Sizing Summary of Results ............................................................................................... 7.10
7.2 Depth Sizing Summary of Results................................................................................................. 7.11
7.3 Signal-to-Noise Ratio Summary of Results................................................................................... 7.12
7.4 Length Error Averaged over the Four Frequencies ....................................................................... 7.15
7.5 Regions of Diminished Signal as Observed from the Corner Response off the Pipe End of the Surge-Line Specimens at a −10 dB Level ............................................................................... 7.20

1.0 Introduction and Objectives
Since 1977, Pacific Northwest National Laboratory (PNNL) has conducted research under U.S. Nuclear Regulatory Commission (NRC) guidance to evaluate state-of-the-art technical approaches for inspecting coarse-grained steel reactor components (Taylor 1984; Diaz et al. 1998; Anderson et al. 2007). This work recently has focused on assessing the viability of phased-array ultrasonic nondestructive examination (NDE) methods applied from the outside pipe surface of the components. Regarding ultrasonic methods, PNNL’s strategy has been to evaluate low-frequency (500 kHz to 1.5 MHz) phased-array ultrasonic testing (PA-UT) methods to assess the viability in using long-wavelength (low-frequency) inspection techniques that are inherently less sensitive to the effects of the coarse-grained microstructure, while maintaining suitable resolution to effectively detect, localize, and size flaws in these materials (Anderson et al. 2003; Anderson et al. 2007).
This document is a technical letter report (TLR) summarizing continuing laboratory evaluation of phased array (PA) ultrasonic testing (UT) on cast austenitic stainless steel (CASS) pressurizer (PZR) surge-line piping specimens at PNNL in Richland, Washington. Work reported here was conducted as part of an NRC project entitled, “Reliability of Nondestructive Examination for Nuclear Power Plant Inservice Inspection,” under Task 1B. A primary objective of this work is to evaluate various NDE methods to assess their ability to detect, localize, and size cracks in coarse-grained steel components and share the results with French researchers. In this effort, PNNL supports cooperation with Commissariat à l’Energie Atomique (CEA) to assess reliable inspection of CASS. The NRC Project Manager has established a cooperative effort with the Institut de Radioprotection et de Surete Nucleaire (IRSN). CEA, under funding from IRSN, is supporting collaborative efforts with the NRC and PNNL. Regarding its work on the NDE of materials, CEA is providing its modeling software (CIVA) in exchange for PNNL offering expertise and data related to phased-array detection and sizing, acoustic attenuation, and back scattering on CASS materials. This collaboration benefits the NRC because CEA performs research and development on CASS for Électricité de France (EdF). This TLR is submitted as an Operating Plan Milestone deliverable for Task 1B.
The focus of the research reported here is to determine the effectiveness and reliability of advanced NDE methods on light water reactor (LWR) components containing cast austenitic stainless steel material and other coarse-grained components that encompass dissimilar metal welds (DMWs), piping with corrosion-resistant cladding, weld overlays, inlays and onlays, and far-side examinations of austenitic piping welds. The specific goal of this work is to assess the effectiveness and reliability of various NDE methods to detect and, if possible, size cracks in coarse-grained steels that exist in Class 1 primary pressure boundary piping components of commercial light water nuclear reactors.
In early FY-2007, the NRC published NUREG/CR-6933, Assessment of Crack Detection in Heavy-Walled Cast Stainless Steel Piping Welds Using Advanced Low-Frequency Ultrasonic Methods (Anderson et al. 2007), which provided a detailed description of the inspection challenges posed by CASS as it relates to the microstructures and component geometries of primary piping loop configurations. This NUREG/CR documented PNNL’s initial results of using a new 500-kHz PA approach to examine Class 1 pressurized water reactor (PWR) primary coolant system piping welds. These welds are in cast piping of approximately 76.2-mm (3-in.) wall thickness, where a frequency of 500 kHz was necessary to penetrate this material thickness with reduced attenuation. However, thinner cast piping welds exist in PWRs, such
1.1

as on PZR surge lines and safe-ends to DMWs, and optimum frequencies and ultrasonic PA inspection parameters have yet to be established to examine relatively thin CASS components. In early FY-2008, PNNL generated an interim letter report documenting results from an initial investigation of low-frequency PA-UT methods for use on these thinner piping welds. This letter report provided a status of technical activities that included initial ultrasonic experiments on machined reflectors to ascertain the optimal center frequency for sound propagation and crack detection in these materials. Later in 2008, PNNL submitted to the NRC PNNL-17698, Assessment of Ultrasonic Phased Array Testing for Cast Austenitic Stainless Steel Pressurizer Surge Line Piping Welds and Thick Section Primary System Cast Piping Welds (Diaz et al. 2008), summarizing on-going assessments of lower-frequency PA inspection methods on both small- and large-bore CASS piping, and providing insights into the application of a PA delta technique for detection of tip-diffracted energy in this piping. Since that time, probe design improvements, acquisition of additional PZR surge-line specimens, greater knowledge of the microstructures, and technological developments to the PA scanning/analysis system required the acquisition of new data. The resultant outcome was an improved detection and characterization capability for PA ultrasonic inspection of smaller bore CASS piping.
Part of the previous work focused on acquiring baseline PA-UT data using a 1.5-MHz phased-array probe to image the end-of-block on both the centrifugally cast stainless steel (CCSS) pipe-side and the statically cast stainless steel (SCSS) elbow side of a PZR surge-line weld obtained from a cancelled nuclear power plant (NPP). The pipe-to-elbow weld volume was also imaged using this probe to obtain PA-UT data from the weld prior to implantation of thermal fatigue cracks (TFCs). These data were used to evaluate the effectiveness of this frequency range for suitable penetration and resolution in these components, and subsequently provided the basis for additional design and modeling of a more effective PA probe operating at a lower frequency (800 kHz). At the end of these initial studies, PNNL defined the specifications for implantation of a suite of TFCs in the austenitic weld of two additional CASS PZR surge lines for further evaluation of flaw detection, localization, and sizing capabilities with this technique. These flaws were specified to be implanted within the weld metal (with the exception of flaw number 2 in specimen 7C-059) to minimize the potential for disturbing the parent material or introducing implantation anomalies that might result in reflection of coherent sound energy. It is planned to induce thermal fatigue cracks in parent CASS material as a comparison with the data obtained on the flaws implanted into the welds.
The work reported here provides the results and conclusions from newly acquired ultrasonic PA data on all three PZR surge-line specimens using four discrete inspection frequencies—2.0 MHz, 1.5 MHz, 1.0 MHz, and 800 kHz, respectively. These data can be correlated with specific specimen microstructures and are compared against true-state data for all implanted TFCs. As with the initial technical investigation, phased-array imaging of the entire end-of-block on the CCSS pipe sides of each of the three specimens were again obtained and analyzed to assess sound field continuity and signal strength through the parent material from the corner trap geometry, which essentially simulates a 100% through-wall flaw. ASME Section XI, Appendix VIII, Supplement 9, Qualification Requirements for Cast Austenitic Piping Welds, does not currently contain requirements for performance demonstration related to CASS materials as there were no viable NDE techniques available to reliably inspect CASS materials when the provisions of Appendix VIII were developed. The work described in this study is expected to provide insights and data to support development of ASME Code rules for improved inspections of CASS piping (≤ 2-in.) and allow performance demonstration processes for this coarse-grained material to be established.
1.2

The work described here was performed to provide insights for evaluating the utility of advanced NDE approaches for the inspection of smaller bore, CASS PZR surge-line piping components. This document is intended as an interim TLR to describe recent findings and provide a detailed status of this work. Section 1 of this report describes the project background and technical objectives. Section 2 provides a description of the scope of work as it pertains to this evaluation for PA inspection capability. Section 3 provides a discussion of the CASS inspection problem as it relates to the propagation of ultrasonic energy in coarse-grained microstructures, as well as information pertaining to a microstructural analysis of the various specimens used in this study. Section 4 describes the various probes and probe configurations used, modeling of the probe configurations to generate expected performance information, and issues associated with PA focal law development. Section 5 provides a description of the data acquisition set-up and experimental approach employed in this work, while Section 6 describes the various CASS specimens used in these laboratory studies, including details regarding flaw location, size, and true-state dimensions. Section 7 provides discussions of the data analysis process and results from PA examinations of the CASS PZR surge-line specimens. Section 8 includes a technical discussion and conclusions from the work presented here. Section 9 addresses unresolved issues and a description of work currently in progress, while Section 10 identifies references cited in this TLR.
1.3

1.4

2.0 Scope of PA-UT Evaluations
The scope of the work reported here was defined by NRC guidance and is focused toward evaluating UT inspection capabilities in CASS pressurizer surge-line piping welds only. PNNL was tasked with acquisition and procurement of materials, fabrication of flawed specimens, design and procurement of specialized PA probes, and conducting data acquisition and analysis on these specimens. The macrostructure of vintage PZR surge-line piping to determine grain size, shape, and orientation was performed in FY-2007. The material comprising these components include both centrifugally cast (pipe segments) and statically cast (elbows), with dimensions of approximately 30.5- to 35.5-cm (12- to 14-in.) outside diameter (OD) and approximately 33-mm (1.3-in.) wall thickness. This thickness is representative of typical PZR surge lines and various safe-ends in Combustion Engineering-designed plants. The technical evaluation reported here included PA-UT examinations on implanted/fabricated TFCs to evaluate detection, localization, and sizing performance as a function of frequency and other critical inspection parameters.
The work consisted of design and sound field assessments for various PA probes, probe configurations, and wedges; development of specific PA focal laws; and use of a state-of-the-art data acquisition system (DYNARAY®) for implementing examinations. The primary focus of the work reported in this TLR includes:
Low-frequency PA-UT examination of CASS PZR surge-line components
– As a function of inspection frequency (2.0 MHz, 1.5 MHz. 1.0 MHz, and 800 kHz)
– As a function of inspection angle (30° to 70° in 1° increments)
– From both sides of the weld (centrifugally cast pipe side and statically cast elbow side).
The data analysis portion of this work included an evaluation of the microstructures (dimensional analysis, grain orientation, and grain type), comprising each of the piping specimens, quantifying detection and sizing performance against the true state, and assessing the capabilities for flaw localization/positioning versus true state. Also, an assessment of sound field continuity and signal strength (baseline material noise analysis) through the CCSS parent material on all three specimens will be presented. Metrics used for the analysis included signal-to-noise ratio (SNR), root-mean-square error (RMSE), and true-state values for flaw length, depth, and axial and circumferential location on the pipe.
2.1

2.2
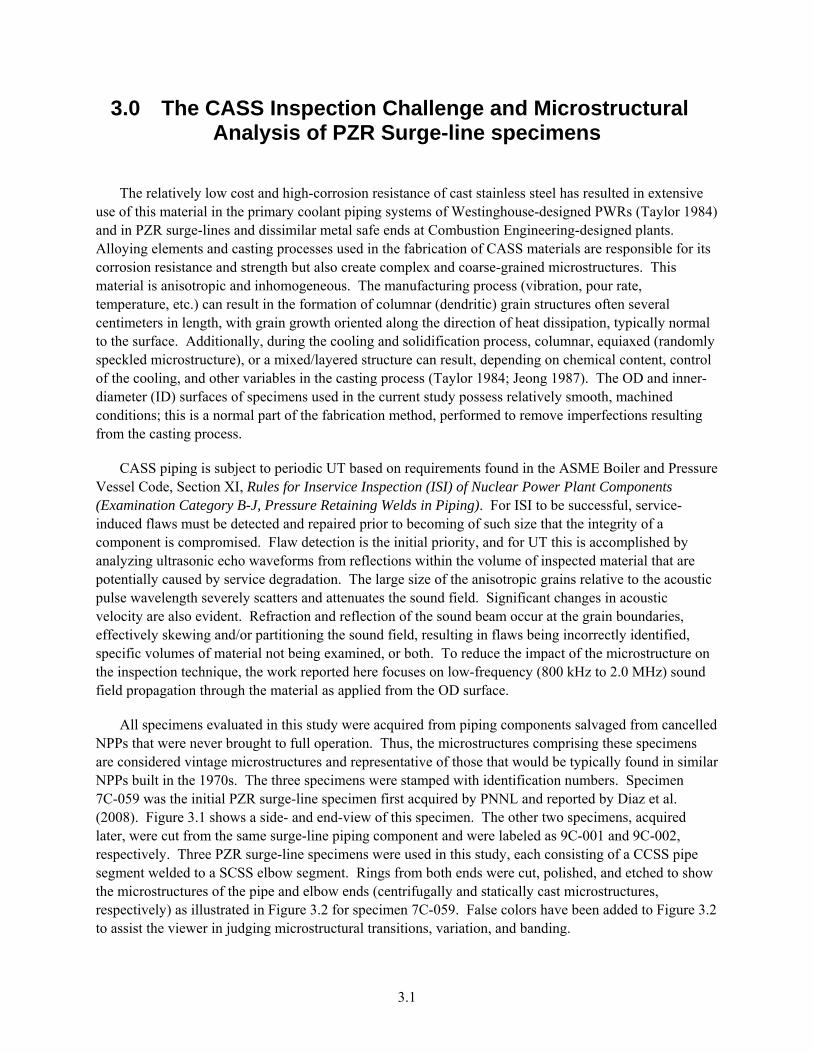
3.0 The CASS Inspection Challenge and Microstructural Analysis of PZR Surge-line specimens
The relatively low cost and high-corrosion resistance of cast stainless steel has resulted in extensive use of this material in the primary coolant piping systems of Westinghouse-designed PWRs (Taylor 1984) and in PZR surge-lines and dissimilar metal safe ends at Combustion Engineering-designed plants. Alloying elements and casting processes used in the fabrication of CASS materials are responsible for its corrosion resistance and strength but also create complex and coarse-grained microstructures. This material is anisotropic and inhomogeneous. The manufacturing process (vibration, pour rate, temperature, etc.) can result in the formation of columnar (dendritic) grain structures often several centimeters in length, with grain growth oriented along the direction of heat dissipation, typically normal to the surface. Additionally, during the cooling and solidification process, columnar, equiaxed (randomly speckled microstructure), or a mixed/layered structure can result, depending on chemical content, control of the cooling, and other variables in the casting process (Taylor 1984; Jeong 1987). The OD and inner-diameter (ID) surfaces of specimens used in the current study possess relatively smooth, machined conditions; this is a normal part of the fabrication method, performed to remove imperfections resulting from the casting process.
CASS piping is subject to periodic UT based on requirements found in the ASME Boiler and Pressure Vessel Code, Section XI, Rules for Inservice Inspection (ISI) of Nuclear Power Plant Components (Examination Category B-J, Pressure Retaining Welds in Piping). For ISI to be successful, service-induced flaws must be detected and repaired prior to becoming of such size that the integrity of a component is compromised. Flaw detection is the initial priority, and for UT this is accomplished by analyzing ultrasonic echo waveforms from reflections within the volume of inspected material that are potentially caused by service degradation. The large size of the anisotropic grains relative to the acoustic pulse wavelength severely scatters and attenuates the sound field. Significant changes in acoustic velocity are also evident. Refraction and reflection of the sound beam occur at the grain boundaries, effectively skewing and/or partitioning the sound field, resulting in flaws being incorrectly identified, specific volumes of material not being examined, or both. To reduce the impact of the microstructure on the inspection technique, the work reported here focuses on low-frequency (800 kHz to 2.0 MHz) sound field propagation through the material as applied from the OD surface.
All specimens evaluated in this study were acquired from piping components salvaged from cancelled NPPs that were never brought to full operation. Thus, the microstructures comprising these specimens are considered vintage microstructures and representative of those that would be typically found in similar NPPs built in the 1970s. The three specimens were stamped with identification numbers. Specimen 7C-059 was the initial PZR surge-line specimen first acquired by PNNL and reported by Diaz et al. (2008). Figure 3.1 shows a side- and end-view of this specimen. The other two specimens, acquired later, were cut from the same surge-line piping component and were labeled as 9C-001 and 9C-002, respectively. Three PZR surge-line specimens were used in this study, each consisting of a CCSS pipe segment welded to a SCSS elbow segment. Rings from both ends were cut, polished, and etched to show the microstructures of the pipe and elbow ends (centrifugally and statically cast microstructures, respectively) as illustrated in Figure 3.2 for specimen 7C-059. False colors have been added to Figure 3.2 to assist the viewer in judging microstructural transitions, variation, and banding.
3.1

Figure 3.1. Photographs of the Side-View (left) and End-View (right) of the CASS PZR Ring Segment
(specimen 7C-059)
Figure 3.2. Photographs of Polished and Chemically Etched CASS PZR Ring Segment (specimen
7C-059) Showing the Pipe-Side (CCSS) Grain Microstructure (left) and the Elbow-Side (SCSS) Grain Microstructure (right)
Nominal wall thickness on the pipe side of specimen 7C-059 was 30 mm (1.2 in.) and on the elbow side, 39 mm (1.5 in.). Four circumferentially oriented TFCs were implanted in the weld region of this specimen. An additional long segment of a surge line from Washington Nuclear Power Unit 3 (WNP-3) was obtained (see Figure 3.3). The foreground elbow was removed and cut in half to make two pipe-to-elbow specimens, 9C-001 and 9C-002. Again, rings from the two pipe sides and common elbow side were cut and the surfaces polished and chemically etched to display the microstructures. Figure 3.3 shows the microstructure from the two pipe rings, center and outside legs, and Figure 3.4 shows the elbow microstructure. Nominal wall thickness on the pipe side was 33 mm (1.3 in.) and 34–44 mm (1.3–1.7 in.) on the elbow side. Three circumferentially oriented TFCs were implanted in each of these two specimens.
Typical grain diameters range in size from approximately 0.5 mm (0.04 in.) to over 40 mm (1.6 in.) or more as a function of depth or spatial position in the material. At a 1.5-MHz inspection frequency, the corresponding wavelength in the CASS PZR surge-line material is approximately 3.8 mm (0.15 in.). Thus, the wavelength at this inspection frequency (relative to the average grain diameters encountered) will experience more scattering and more attenuation as the sound field propagates through the material. In contrast, at an 800-kHz inspection frequency, the wavelength in the material is approximately 7.1 mm
3.2

(0.28 in.). The sound field for the lower inspection frequency is generally less sensitive to the effects of grain boundary scattering and attenuation as the wavelength is larger than the majority of the grains in the microstructure for these specimens.
Figure 3.3. WNP-3 Surge Line Section Showing the Locations of the Pipe and Elbow Cuts to Produce
Two Pipe-to-Elbow Specimens, 9C-001 and 9C-002. The centrifugally cast pipe microstructures are displayed for both specimens.
Figure 3.4. WNP-3 Surge Line Elbow Microstructure
3.3

3.4
While the PZR surge-line specimens evaluated and reported here consisted of a wide range of grain sizes overall, some PZR surge-line microstructures exhibit larger average grain diameters, more complex grain orientations, and banding/layering. PNNL obtained a long segment of a PZR surge line that was sectioned on both sides of the elbow. These sections were sliced, polished, and chemically etched to bring out the microstructures of both pipe segments on opposite sides of the elbow joint shown in Figure 3.3. The resultant micrographs illustrate the variability and range of grain sizes that can be found in PZR surge-line components. Larger columnar grains that appear as “blocks of material” are evident on one side of the elbow, while thinner dendritic grains make up the pipe’s microstructure on the other side of the weld. In this case, it was anticipated that the average grain diameters and overall microstructures of these segments would provide a more challenging inspection scenario; however, this was not the case, as reported later in this report.
The grain-size diameters were measured at a mid-wall line in each of the specimens. Table 3.1 shows the average grain size and range from each of the surge-line specimens. The first surge-line specimen has a smaller-grained microstructure on both the pipe and elbow sides, with average grain diameters of 1.9 mm (0.07 in.) and 2.6 mm (0.10 in.), respectively.
Table 3.1. Grain Diameter Measurements from the Three PZR Surge-line Specimens
Surge Line 1 Grain Diameter (7C-059), mm (in.)
WNP3 Surge Line Grain Diameter (9C-001 and 9C-002),
mm (in.) Elbow Pipe Elbow Pipe Center Pipe Outside
Average 2.6 (0.10) 1.9 (0.07) 10.3 (0.41) 6.6 (0.26) 3.5 (0.14) Minimum 0.5 (0.02) 0.6 (0.02) 2.6 (0.10) 1.3 (0.05) 0.8 (0.03) Maximum 6.3 (0.25) 6.7 (0.26) 41.0 (1.61) 25.6 (1.01) 13.9 (0.55)
The WNP-3 specimen’s average grain sizes are 10.3 mm (0.41 in.) in the elbow and 3.5 mm (0.14 in.) or 6.6 mm (0.26 in.) in the pipe legs. Maximum grain diameters reached 41.0 mm (1.61 in.) on the elbow and 25.6 mm (1.01 in.) on the pipe side of the WNP-3 specimens. With these larger grains in the material, one would expect more scattering and attenuation as the sound field propagates through the material, possibly leading to a more challenging inspection.

4.0 Phased Array Probes and Focal Law Development
4.1 Ultrasonic Probe Details
The samples were examined using four phased-array probes: a 2.0-MHz transmit-receive longitudinal (TRL) arrangement, a 1.5-MHz TRL probe, a 1.0 MHz TRL probe, and an 800-kHz TRL probe. The 1.5-MHz transducer was chosen based on frequencies commonly used in reactor inspections of stainless steels. The 800-kHz transducer was developed by PNNL to be able to detect flaws in 25- to 50-mm (1- to 2-in.) thick CASS specimens based on previous PNNL experience in examining similar components. The additional 1.0- and 2.0-MHz probes were employed to more fully evaluate the entire frequency spectrum and provide data to better assess higher frequency limits for inspecting CASS PZR surge-line components. A set of custom wedges was fabricated for use in this study. Each set of wedges was curved to match the approximate 318-mm (12.5-in.) diameter of the surge-line specimens. General specifications for the four models of transducers are described in Table 4.1.
Table 4.1. Ultrasonic Transducer Physical Specifications
Probe 0.8-MHz TRL 1.0-MHz TRL 1.5-MHz TRL 2.0-MHz TRL Active Aperture 44 mm (1.7 in) 40 mm (1.6 in) 35 mm (1.4 in) 22 mm (0.9 in) Passive Aperture 22 mm (0.9 in) 20 mm (0.8 in) 17.5 mm (0.7 in) 11 mm (0.4 in) Active Aperture Elements 10 10 10 10 Passive Aperture Elements 5 5 3 5
4.2 Focal Law Development
Before a phased-array probe can be used to perform an examination, a set of focal laws must be produced to control the firing of individual elements. The focal laws are inputs to the Ultravision® control software, which determines specific elements to excite at specific times to allow for proper beam-forming in the material to be examined. The focal laws also contain details about the angles being generated, the focal point of the sound field, the delays associated with the wedge and electronics, and the orientation of the probe. PNNL uses a software package for producing focal laws known as the “ZETEC® Advanced Focal Law Calculator.” The software package performs two functions: 1) focal law generation and 2) simulation of the ultrasonic field produced by the probe when using the generated laws. The user enters the physical information about the PA probe, such as the number of elements and the sizes of the elements, and the wedge information, such as the wedge angle and the wedge size, into the program. The desired angles and focal distances are then entered, and the software generates the needed delays for each element to produce the desired beam steering and focusing in the material. The software beam simulation produces a simple image of the probe on the wedge, ray-tracing to show the focal depth and steering desired, and density mapping to enable the viewer to see how well the sound field responds for a particular angle and whether grating lobes exist that may be detrimental to the examination. Figure 4.1 shows an example of the ray tracing for a probe on the left with the sound field density mapping on the right. It should be noted that this simulation is performed in isotropic material; that is, the velocity of sound is maintained throughout any angle for a particular wave mode, which is not really the true state for
4.1

CASS, but enables the user to estimate sound field parameters and transducer performance for optimal array design and focal law development.
Figure 4.1. The ZETEC® Advanced Phased Array Calculator is Useful for Generating Focal Laws (left)
and Simulating the Sound Field for the Focal Law (right) to Determine Beam Characteristics
4.3 2.0-MHz TRL Probe
The 2-MHz TRL array was originally designed for evaluating inspection effectiveness of PA methods on components with inlays, onlays, and overlays (Figure 4.2). It consists of two 5-element by 10-element matrix arrays. One array is used for transmitting, the other for receiving ultrasonic signals. This probe has a 62% bandwidth (BW) at −6 decibels (dB) and an approximately 30-mm2 (1.2-in.2) footprint with a customized wedge for data collection in tight geometrical configurations. The probes were designed at PNNL and built by Imasonic®. This smaller size generally allows insonification of the far side of a specimen even with a weld crown present. The probe’s nominal wavelength in stainless steel is 2.92 mm (0.11 in.) at its average center frequency of 2.0 MHz. Skew angles of 20 degrees were possible with this array.
Specific focal laws were generated for the PZR surge-line specimens based on the thickness of each specimen and the width of the welds in each specimen. While a frequency of 2.0 MHz would normally be considered too high for use on CASS specimens, inspection work at 1.5 MHz indicated that even at higher frequencies, detection and sizing of flaws in smaller bore piping (e.g., CASS PZR surge-line piping) could be achieved. To push the detection limits and determine whether microstructurally induced attenuation would dominate, a higher “conventional” inspection frequency of 2.0 MHz was employed. Based on the focal laws and the results of the simulation, it was determined that the 2.0-MHz probe was capable of effectively insonifying the region surrounding the weld in the PZR surge-line samples. The 2.0-MHz probe produces a wavelength that is generally smaller than the majority of average grain diameters in all three of the PZR surge-line specimens evaluated in this study. Example simulations of the 2.0-MHz beam using one set of focal laws are shown in Figure 4.3.
4.2

Figure 4.2. 2.0 MHz, Phased-Array Probe, Originally Developed for Inlays, Onlays, and Overlays
Figure 4.3. Un-normalized Beam Simulations for the 2.0-MHz PA Probe at 45° Incidence in the Cast
PZR Surge-Line Specimen, Using a Half-Path Focus at 50 mm (1.97 in.). Top: side-view of focused sound field at 45° incident angle in the part. Bottom: cross-sectional view of sound field at the focal spot, where cursors mark the −3dB points.
4.3

The 2.0-MHz probe was found to produce a beam with a horizontal width of 4.72 mm (0.19 in.) by vertical width of 4.18 mm (0.16 in.) at 45° at the −3 dB points. The 2.0-MHz probe is able to provide an effective sound field at distances from almost directly under the probe to a distance approximately 45 mm (1.8 in.) in front of the wedge. As with the 1.5-MHz probe, the ability of the probe to accurately measure crack width and depth improves with proximity between the probe focal spot and the flaw, as this is the location of tightest focusing and highest sensitivity.
4.4 1.5-MHz TRL Probe
This 1.5-MHz TRL probe was originally designed by PNNL for examinations of wrought stainless steels (WSS), and consists of two 1.5-MHz PA transducers mounted side-by-side on a Rexolite® wedge. The 1.5-MHz probes operated in the pitch-catch mode with wedges held together by an aluminum frame. The wedge dimensions were 49 50 mm (1.93 1.97 in.). Both transmit and receive probes were identical in design with a 310 element array, an active area of 35 17.5 mm (1.38 0.69 in.) and a greater than 60% bandwidth at −6 dB. The 1.5-MHz probe has been used in previous examinations of flaws on the near and far sides of austenitic welds in WSS. 1.5 MHz is, however, generally considered to be too high in frequency for examining CASS components which have larger and more complex grain structures than WSS. The 1.5-MHz TRL probe was included in this study because the probe has proven effective in examining materials of similar thickness to the surge line and provides a point of comparison for the other techniques. Skew angles of 10 degrees were possible with this array. The probe is shown in Figure 4.4.
Figure 4.4. 1.5-MHz TRL Probe Originally Designed for Wrought Stainless Steel Welds
Specific focal laws were generated for the surge line based on the thickness of the piping and the width of the weld in the surge line pipe-to-elbow weld. After the focal laws were developed, the ultrasonic field that would be produced by these laws was simulated to demonstrate that the probe and the focal laws are able to insonify the region of interest. The simulations indicated that the 1.5-MHz probe would be able to produce a well-focused beam at distances from directly below the probe to approximately 45 mm (1.8 in.) in front of the wedge. The probe produces a sound field that works best for detecting and sizing flaws on the near side of the weld, but it is also capable of detecting flaws from the far side of most welds in thinner materials, assuming that the microstructure allows the waves to form and propagate appropriately. Multiple focal laws were used in the examinations to obtain optimal results.
4.4

Example simulations of the 1.5-MHz probe steered to 30°, 45°, and 60°, focused at a depth of 36 mm (1.4 in.), is shown in Figure 4.5. The wavelength for a 1.5-MHz probe is 3.8 mm (0.15 in.). From Figure 4.6, the 1.5-MHz probe was found to produce a beam with a horizontal width of 5.01 mm (0.20 in.) by vertical width of 3.81 mm (0.15 in.) at 45° at the −3dB points.
30° 45°
60°
Figure 4.5. Simulations of the Beams Created by the 1.5-MHz TRL Arrangement for 30°, 45°, and 60°
Figure 4.6. Beam Simulations for the 1.5 MHz PA Probe at 45° Incidence in the Cast PZR Surge-Line
Specimen, Using a Half-Path Focus at 50 mm (1.97 in.). This is a cross-sectional view of sound field at the focal spot, where cursors mark the −3 dB points.
4.5

4.5 1.0-MHz TRL Probe
The 1-MHz TRL array (Figure 4.7) was originally designed for evaluating inspection effectiveness of PA methods on components with inlays, onlays, and overlays. It consists of two 5-element by 10-element matrix arrays. One array is used for transmitting, the other for receiving ultrasonic signals. This probe has a 58% BW at −6 dB and an approximately 50-mm2 (1.97-in.2) footprint with a customized wedge for data collection in tight geometrical configurations. This probe size generally allows insonification of the far side of a specimen even with a weld crown present, but can be prohibitive if the weld crown is too large. The probe’s nominal wavelength in stainless steel is 5.31 mm (0.21 in.) at its average center frequency of 1.1 MHz. Skew angles of 20 degrees were possible with this array.
Figure 4.7. 1.0 MHz, Phased-Array Probe, Originally Developed for Inlays, Onlays, and Overlays
Specific focal laws were generated for the PZR surge-line specimens based on the thickness of each specimen and the width of the welds in each specimen. A frequency of 1.0 MHz was chosen to more effectively complete the evaluation of the PA inspection over the entire frequency range between 800 kHz and 2.0 MHz. Thus, it was determined that 1.0-MHz data would provide valuable information to supplement data acquired between 800 kHz and 1.5 MHz. Based on the focal laws and the results of the simulation, it was determined that the 1.0-MHz probe was capable of effectively insonifying the region surrounding the weld in the PZR surge-line samples. The 1.0-MHz probe produces a wavelength that is generally the same size as the majority of average grain diameters in all three of thePZR surge-line specimens evaluated in this study. Example simulations of the 1.0-MHz beam using one set of focal laws are shown in Figure 4.8.
4.6

Figure 4.8. Un-normalized Beam Simulations for the 1.0-MHz PA Probe at 45° Incidence in the Cast
PZR Surge-Line Specimen, Using a Half-Path Focus at 50 mm (1.97 in.). Top: side-view of focused sound field at 45° incident angle in the part. Bottom: cross-sectional view of sound field at the focal spot, where cursors mark the −3 dB points.
The 1.0-MHz probe was found to produce a beam with a horizontal width of 6.16 mm (0.24 in.) by vertical width of 4.94 mm (0.19 in.) at 45° at the – 3dB points. The 1.0-MHz probe is able to provide an effective sound field at distances from almost directly under the probe to a distance approximately 45 mm (1.8 in.) in front of the wedge. The probes were designed at PNNL and built by Imasonic®. As with the 1.5-MHz probe, the ability of the probe to accurately measure crack width and depth improves with proximity between the probe focal spot and the flaw, as this is the location of tightest focusing and highest sensitivity.
4.6 800-kHz TRL Probe
The 800-kHz probe was designed to provide a more optimal wavelength to allow the ultrasound to penetrate the large grain structure of CASS and maintain suitable resolution allowing the probe to resolve smaller flaws. The probes were mounted on a Rexolite® wedge side-by-side to operate in a pitch-catch mode and are shown in Figure 4.9. The wedges were separated by cork and held together with an aluminum frame. The wedge dimensions were 63 63 mm (2.48 2.48 in.). The transmit-and-receive
4.7

probes were identical in design and consisted of a 10 5 element array with an active area of 43.2 21.2 mm (1.70 0.84 in.) and a greater than or equal to 50% bandwidth at −6 dB. The probes were designed at PNNL for this inspection and built by Imasonic®. The wedges were curved to match the approximate 318-mm (12.5-in.) diameter of the surge line piece.
Figure 4.9. 800-kHz TRL Probe
Specific focal laws were generated for the PZR surge-line specimens based on the thickness of each specimen and the width of the welds in each specimen. Based on the focal laws and the results of the simulation, it was determined that the 800-kHz probe was capable of effectively insonifying the region surrounding the weld in all three PZR surge-line samples. The 800-kHz probe produces a 7-mm (0.28-in.) wavelength in stainless steels, almost twice the wavelength of the 1.5-MHz probe. Example simulations of the 800-kHz beam using one set of focal laws are shown in Figure 4.10.
The 800-kHz probe is able to provide an effective sound field at distances from directly under the probe to a distance of 36 mm (1.42 in.) in front of the wedge. As with the 1.5-MHz probe, the ability of the probe to accurately measure crack width and depth improves with proximity between the probe focal spot and the flaw, as this is the location of tightest focusing and highest sensitivity. Because the 800-kHz beam focal zone does not extend as far out in front of the probe as the 1.5-MHz beam, it needs to be positioned closer to the flaw than the 1.5-MHz probe.
4.8

30° 45°
60°
Figure 4.10. Simulations of the Beams Created by the 800-kHz TRL Arrangement for 30°, 45°, and 60°
From Figure 4.11, the 800-kHz probe was found to produce a beam with a horizontal width of 7.19 mm (0.28 in.) by vertical width of 5.58 mm (0.22 in.) at 45° at the −3 dB points. Using the modeling and simulation capabilities of the Ultravision® software, the focal dimensions of the sound field as a function of frequency (probe) and incident angle were computed for the dimensions corresponding to both 9C-001 and 9C-002 CASS PZR specimens. The focal spot size was computed at both the −3 dB and −6 dB points in both horizontal and vertical planes. Table 4.2 summarizes the focal spot size data.
Figure 4.11. Beam Simulations for the 800 kHz PA Probe at 45° incidence in the Cast PZR Surge-Line
Specimen, Using a Half-Path Focus at 50 mm (1.97 in.). This is a cross-sectional view of sound field at the focal spot, where cursors mark the -3dB points.
4.9

4.10
Table 4.2. Theoretical Focal Spot Dimensions for all Probes Used in this Study
Sound Field Spot Size for 9C-001 and 9C-002 PZR Specimens -3 dB point -6 dB point PA Probe and
Incident Angle Horizontal Vertical Horizontal Vertical 800 kHz TRL mm in. mm in. mm in. mm in. 30 deg @ ID 7.02 0.28 4.06 0.16 14.22 0.56 8.11 0.32 45 deg 7.19 0.28 5.58 0.22 15.14 0.60 11.38 0.45 60 deg 6.11 0.24 7.7 0.30 14.78 0.58 16.38 0.64 1 MHz TRL 30 deg @ ID 5.89 0.23 3.46 0.14 12.49 0.49 7.95 0.31 45 deg 6.16 0.24 4.94 0.19 13.43 0.53 9.92 0.39 60 deg 5.61 0.22 7.4 0.29 12.57 0.49 15.36 0.60 1.5 MHz TRL 30 deg @ ID 4.99 0.20 2.86 0.11 10.94 0.43 5.92 0.23 45 deg 5.01 0.20 3.81 0.15 10.72 0.42 7.86 0.31 60 deg 4.94 0.19 6.33 0.25 10.59 0.42 12.8 0.50 2 MHz TRL 30 deg @ ID 4.2 0.17 2.62 0.10 10.11 0.40 5.79 0.23 45 deg 4.72 0.19 4.18 0.16 11.2 0.44 9.36 0.37 60 deg 4.02 0.16 2.4 0.09 9.98 0.39 6.49 0.26
The sound field dimensions at 30° were calculated at the ID surface rather than at the actual focal spot because the dimensions of the sound field extended past the ID for the 30° sound beam. The focal spot beyond the ID surface is not of interest. As anticipated, the sound field focal dimensions decrease with increasing frequency, and the focal spots are not symmetric. Focal laws were generated for each probe to insonify the weld region at a constant sound path from the probe (half-path focusing). The focal depth was set to 50 mm (1.97 in.). A review of Table 4.2 shows the resultant sound beam spot sizes for the 800-kHz probe at 45° as 7.2 mm by 5.6 mm (0.28 in. by 0.22 in.). The spot size for the 1.5-kHz probe at 45° was 5.0 by 3.8 mm (0.20 in. by 0.15 in.). These were measured at the approximately −3 dB points. The first dimension represents the primary axis of the probe and the second is the secondary axis of the probe; in this case, the circumferential direction. While the spot size in the circumferential direction is approximately 50% greater in the 800-kHz probe than in the 1.5-MHz probe, this represents only a 2-mm (0.08-in.) difference. A smaller spot size will give a more accurate length measurement, assuming the entire crack is detected. However, length-sizing measurements should be similar for the 800-kHz, 1.0-MHz, and 1.5-MHz probes, with a slightly more substantial difference between the 800-kHz and 2.0-MHz probes.

5.0 Data Acquisition Set-Up and Configuration
Phased-array data were acquired on specimens in the 305–356 mm (12–14 in.) diameter range using a manual track scanner. The laboratory setup for handling and data acquisition of the PZR surge-line specimens is described below.
5.1 Phase Array Data Acquisition
Setup and laboratory configuration for PA-UT data acquisition on the PZR surge lines required the use of the manual-encoded scanner mounted on an adjustable guide track or ring supported by a custom-designed floor-to-ceiling brace. The floor-to-ceiling brace was equipped with a translation slide providing additional control and degrees of freedom for movement both horizontally and vertically. This translation slide provided easy manipulation for fine-tuning of the guide-ring position, relative to the pipe specimen. The setup is shown in Figure 5.1 with the manual scanner on the guide ring section. The probe is mounted on an extension arm that is adjustable along the pipe axis. Two encoders on the manual track scanner provide positional information in either or both the axial and circumferential directions for line and raster scanning.
Figure 5.1. Photographs of the PZR Surge-Line Specimen 7C-059. Left: Configured for standard
PA-UT with the pipe-end on the right and the elbow-end on the left side of the photograph. Right: The guide ring, translation slide and floor-to-ceiling brace are shown to the left.
To establish adequate acoustic coupling between the probe wedge and the specimen surface, a flow loop was designed to pump water through nipple fixtures embedded on both sides of the wedge harness that direct the flow evenly over the surface of the specimen to be imaged. As the water couplant flowed off of the top of the specimen, it was collected in a tray, channeled back to the pump, and recycled. Data acquisition was accomplished using the low-frequency DYNARAY® system for all PA probes evaluated in this study. This commercially available system is equipped to accommodate a maximum of 256 channels from PA probes and requires the use of Ultravision® 3.1R4 software. Its frequency pulsing
5.1

5.2
electronics will drive probes in the 0.2–20 MHz range. Phased-array data were acquired over a range of inspection angles from 30° to 70°, in 1° increments. The laboratory workstation and DYNARAY® data acquisition system are shown in Figure 5.2.
Figure 5.2. Data Acquisition System and Laboratory Workstation. Left: DYNARAY® phased array
data acquisition system (courtesy of ZETEC®). Right: Laboratory workstation for both data acquisition and data analysis, with the DYNARAY® system on the lower shelf.

6.0 Specimens and Flaws Evaluated in this Study
The first CASS PZR specimen that was fabricated (7C-059) was comprised of moderately sized grains where the microstructure was believed to be less attenuative and thereby slightly less challenging to the PA inspection methods applied in the study. The four thermal fatigue cracks implanted in this specimen were specified to be deeper (ranging from 30% through-wall to 50% through-wall) to obtain some initial baseline PA data that was reported in a previous TLR submitted to the NRC (Diaz et al. 2008). Results from this initial assessment were very positive; therefore, subsequent flaw implantation in the two 9C specimens resulted in implantation of shallower cracks (ranging from 10% through-wall to 30% through-wall). This provided a more diverse set of flaws (depth-wise) in specimens with more challenging microstructures, effectively allowing the study to push the detection limits as well as the sizing limits for the PA approach. All of the flaws were specified to be implanted within the weld metal (with the exception of flaw number 2 in specimen 7C-059) to minimize the potential for disturbing the parent material or introducing implantation anomalies that might result in reflection of coherent sound energy.
6.1 CASS PZR Surge-Line Specimen 7C-059
This CASS PZR surge-line segment is 304.8-mm (12-in.) diameter Schedule 160 centrifugally cast stainless steel pipe, welded to statically cast stainless steel elbow. This pipe segment is approximately 457.2 mm (18 in.) in length, has a 323.9-mm (12.75-in.) OD (pipe side), and is approximately 31.8-mm (1.25-in.) in wall thickness on the centrifugally cast side of the weld. The CASS PZR surge-line weld specimen was salvaged from a cancelled plant and four TFCs were implanted into the weld region. The technique includes excavation of parent/weld material in the area targeted for implantation, and then subsequent insertion of the coupon containing the thermally induced fatigue crack (see Figure 6.1). The flaw implantation vendor (FlawTech®, Inc.) employs a unique proprietary process where heating/cooling under tension is used to initiate a TFC in a coupon. The number of cycles is controlled to obtain the desired crack depth and “roughness.” After taking exact physical measurements, the flaw implant is seal welded in place to establish final location and size. The remaining weld groove is then filled with a standard welding procedure. The disadvantage is that the coupon is surrounded by weld metal that may potentially introduce additional UT reflectors; however, for studies on coarse-grained CASS materials, it was assumed that any reflectors left over from the implantation process would not be detectable because of the noise level inherent in the cast microstructures of this specimen. Only flaw number 2 was implanted outside the weld, in the CCSS parent material.
6.1

Figure 6.1. Photographs of the Inside Surface of the CASS PZR Surge-Line after Excavation and
Preparation of the Areas Targeted for Flaw Implantation (courtesy of FlawTech®, Inc.)
Four implanted TFCs were introduced into this specimen. These cracks were inserted via a coupon-implant technique and were all circumferentially oriented flaws. A side view illustration of the four flaws depicting flaw position relative to the weldment and flaw depth is provided in Figure 6.2.
Figure 6.3 shows a full circumferential view of all flaw positions and extents on specimen 7C-059. This pipe end-view depicts the circumferential extent (length) of the implanted ID surface-connected cracks, relative to the radial position along the pipe circumference.
6.2

Figure 6.2. Side View Illustration of All Four Thermal Fatigue Cracks Implanted into PZR CASS
Specimen 7C-059 (courtesy of FlawTech®, Inc.)
6.3

Figure 6.3. End View Illustration of All Four Thermal Fatigue Cracks Implanted into PZR CASS
Specimen 7C-059 (courtesy of FlawTech®, Inc.).
6.2 CASS PZR Surge-Line Specimen 9C-001
This CASS PZR surge-line segment is 12-in. Schedule 160 pipe, with a CCSS pipe segment welded to a SCSS elbow. This CASS PZR surge-line specimen is approximately 762 mm (30 in.) in length, 324 mm (12.75 in.) OD, and is approximately 31.8-mm (1.25-in.) in wall thickness on the centrifugally cast side of the weld (pipe side). This pipe-to-elbow specimen was cut from a longer segment of a surge line salvaged from Washington Nuclear Power, Unit 3 (WNP-3). FlawTech®, Inc. performed all crack implantations in this specimen. Three implanted TFCs were introduced. These cracks were inserted via a coupon-implant technique and were all circumferentially oriented flaws. A side view illustration of the three flaws depicting flaw position relative to the weldment and flaw depth is provided in Figure 6.4.
6.4
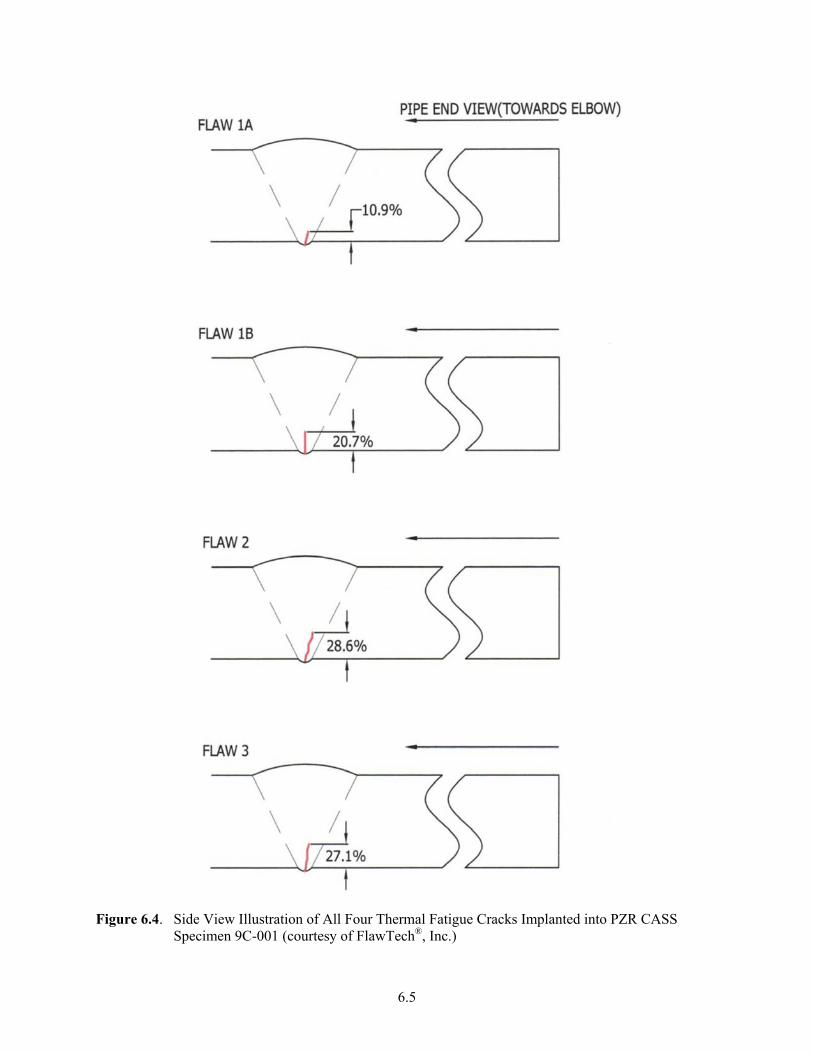
Figure 6.4. Side View Illustration of All Four Thermal Fatigue Cracks Implanted into PZR CASS
Specimen 9C-001 (courtesy of FlawTech®, Inc.)
6.5

Figure 6.5 shows a full circumferential view of all flaw positions and extents on specimen 9C-001. This pipe end-view depicts the circumferential extent (length) of the implanted ID surface-connected cracks, relative to the radial position along the pipe circumference.
Figure 6.5. End View Illustration of All Four Thermal Fatigue Cracks Implanted into PZR CASS
Specimen 9C-001 (courtesy of FlawTech®, Inc.)
6.3 CASS PZR Surge-Line Specimen 9C-002
This CASS PZR surge-line segment is 12-in. Schedule 160 pipe, with a CCSS pipe segment welded to a SCSS elbow. This CASS PZR surge-line specimen is approximately 762 mm (30 in.) in length, 324 mm (12.75 in.) OD, and is approximately 31.8-mm (1.25-in.) in wall thickness on the centrifugally cast side of the weld (pipe side). This pipe-to-elbow specimen was also cut from a longer segment of a surge line from WNP-3. As with the previous specimen described above, FlawTech®, Inc. performed all crack implantations, with three implanted TFCs being introduced into this specimen. These cracks were
6.6

inserted via a coupon implant technique and were all circumferentially oriented flaws. A side view illustration of the three flaws depicting flaw position relative to the weldment and flaw depth is provided in Figure 6.6.
Figure 6.6. Side View Illustration of All Four Thermal Fatigue Cracks Implanted into PZR CASS
Specimen 9C-002 (courtesy of FlawTech®, Inc.)
6.7

Figure 6.7 shows a full circumferential view of all flaw positions and extents on specimen 9C-002. This pipe end-view depicts the circumferential extent (length) of the implanted ID surface-connected cracks, relative to the radial position along the pipe circumference.
Figure 6.7. End View Illustration of All Four Thermal Fatigue Cracks Implanted into PZR CASS
Specimen 9C-002 (courtesy of FlawTech®, Inc.)
A summary of flaw position, location, orientation, length, and depth (flaw height) for all three PZR surge-line specimens is provided in Table 6.1. In Table 6.1, in the column depicting “Flaw,” the first number represents the specific CASS PZR surge-line specimen, while the second number represents the specific flaw within that specimen. Specimen 1 is 7C-059, specimen 2 is 9C-001, and specimen 3 is 9C-002; thus Flaw 2-3 would indicate Flaw 3 on Specimen 9C-001.
6.8

Table 6.1. Summary Table Depicting True-State Dimensions and Locations of All Flaws in All Three CASS PZR Surge-Line Specimens Examined in This Study
Flaw Flaw Type Flaw Location Flaw
Orientation Flaw
Length Flaw Depth
(Height) Degree
Location 1-1 Thermal Fatigue Weld Centerline Circumferential 10.2 cm
(4 in.) 35.2% T 45°
1-2 Thermal Fatigue Pipe Side Near Fusion Line
Circumferential 5.1 cm (2 in.)
30.3% T 120°
1-3 Thermal Fatigue Weld Centerline Circumferential 5.1 cm (2 in.)
29.8% T 210°
1-4 Thermal Fatigue Weld Centerline Circumferential 15.2 cm (6 in.)
30.4/50.2% T 300°
2-1 Thermal Fatigue Weld Centerline Circumferential 7.6 cm (3 in.)
10/20% T 0°
2-2 Thermal Fatigue Weld Centerline Circumferential 5.1 cm (2 in.)
28.6% T 90°
2-3 Thermal Fatigue Weld Centerline Circumferential 6.4–7.6 cm (2.5–3 in.)
27.1% T 270°
3-1 Thermal Fatigue Weld Centerline Circumferential 7.6 cm (3 in.)
16/25.1% T 0°
3-2 Thermal Fatigue Weld Centerline Circumferential 5.1 cm (2 in.)
20.6% T 90°
3-3 Thermal Fatigue Weld Centerline Circumferential 6.4–7.6 cm (2.5–3 in.)
16% T 270°
6.9

6.10

7.0 Data Analysis and Results: CASS PZR Surge Line
PA data were acquired and analyzed on the three CASS PZR surge-line specimens at all four inspection frequencies—800 kHz, 1.0 MHz, 1.5 MHz, and 2.0 MHz. The ZETEC DYNARAY® system was used to acquire the data, with each probe being driven at its optimum frequency. Line-scan data were collected and analyzed and are presented here in this report. Multiple line scans were acquired in each flaw region at different axial offsets from the plane of the flaw. Both pipe-side and elbow-side data were collected. The elbow sides of the two WNP-3 9C specimens exhibited surface undulations, leading to less effective coupling of the probes to the specimens. Coupling of the PA probes to the pipe-sides of all three specimens was relatively consistent. Merged PA data were used for detection and length sizing only.
7.1 800-kHz Phased-Array Data
Line scans were performed on the PZR surge-line piece from both the CCSS pipe side and from the SCSS elbow side of the weld as the refracted angle was swept from 30° to 70° in 1° increments. Multiple line scans were acquired with different axial offsets from the weld centerline. The separation between lines varied, but typical separations ranged from 10 mm to 15 mm (0.4 in. to 0.6 in.). Data normal to the weld centerline were acquired; however, no skew was implemented during data acquisition. The data were analyzed for flaw detection, length sizing, depth sizing, and signal-to-noise information.
Each of the specified flaw areas was scanned from both sides of the weld; however, the inner elbow radius (intrados) on specimen 7C-059 did not allow data collection on flaw number 3 from the SCSS elbow side of the weld, as the surface curvature precluded effective coupling of the probes to the part surface. An example of a merged data file analysis setup for flaw number 1 on specimen 9C-002 (pipe-side scan) is provided in Figure 7.1. Merged files are essentially composite images that use signal response information from all angles. Merged data were only used for length-sizing analysis. Figure 7.2 depicts images of the same flaw as scanned from the elbow-side of the weld. Data analyses of the entire set of 800-kHz phased-array composite images for all flaws was conducted using a consistent windowing scheme, and these images depict the composite (merged data from all angles) B-scan side view in the upper left portion of the analysis window. The composite C-scan (top-view) images are provided in the upper right portion of the analysis window. The composite D-scan (end-view) images are shown in the lower left portion of the analysis window. And finally, a sectioned polar view is provided in the lower left portion of the analysis window, showing the circumferential aspect of the flaw responses as a function of through-wall depth. In some image representations provided, the lower left portion of the analysis window shows a representative A-scan (ultrasonic waveform – time series) at a particular point on the flaw. Additionally, in other representations of the image analysis, the lower left portion of the analysis windows sometimes includes a frequency spectrum view, resulting from the computation of the Fast Fourier Transform using mathematical functions provided by the Ultravision® analysis software. The spectral views provide information associated with the frequency responses of the flaws. On the images shown here in Section 7.0, the corner trap signal response from the ID surface-connected crack is clearly evident in each of the three B-, C- and D-scan views, respectively. Image analysis employed various views of the detected flaws for both length and depth sizing.
7.1

Figure 7.1. 800-kHz Data on Pipe Side of 9C-002, Flaw 1, Merged Image for Length Sizing
Figure 7.2. 800-kHz Data on Elbow Side of 9C-002, Flaw 1, Merged Image for Length Sizing
The depth-contour of the flaw is seen in the D-scan end view and to a lesser degree in the polar view provided in Figure 7.2. This portion of the flaw signal accurately represents the transition of the depth of the flaw from one depth (approximately 15% through-wall) to the deeper portion of the flaw (approximately 25% through-wall). A red arrow indicates this feature in the lower-right portion of the analysis window in Figure 7.2. Additional views were employed for accurate depth sizing of the flaws, and examples of these views are presented in Figure 7.3 and Figure 7.4 for the same flaw in specimen 9C-002.
7.2

Figure 7.3. 0.8-MHz Data on Pipe Side of 9C-002, Flaw 1a on the Left and 1b on the Right for Depth Sizing
Figure 7.4. 0.8-MHz Data on Elbow Side of 9C-002, Flaw 1a on the Left and 1b on the Right for Depth
Sizing
The merged data images for each of the flaws from the CCSS and SCSS sides for 800-kHz data were also fully analyzed. The data set with an axial offset that best positioned the flaw response in the center of the side view was analyzed as well. As part of the data analysis, the flaw length and depth were sized and a signal-to-noise determination was made. Flaw length was measured at the half amplitude (−6 dB) points from the flaw corner signals. The results for all inspection frequencies and all specimens are listed in Table 7.1 and Table 7.2 (see Section 7.5) summarizing length measurements, depth measurements, and the calculated RMSE relative to the true-state data for the flaws. Where tip signals are not detected, the depths of the flaws (at the lower inspection frequencies) are based on a specular reflection from the upper portions of the flaws; therefore, the full extent of the crack depth may not be accurately measured. However, the results are still quite good and tend to oversize the crack depth, suggesting that indeed the top of the cracks were detected.
SNRs were calculated for the corner signals of the flaw responses from both the CCSS (pipe) and SCSS (elbow) sides. The SNR was determined from the peak signal response and an average noise value at the same part path. Summary SNR results for all inspection frequencies and specimens are listed in Table 7.3 (see Section 7.5). The lowest SNR for the 800-kHz probe across all flaws in these specimens was 21.7 dB (approximately an 11:1 ratio), while the highest SNR for the 800-kHz data was 33.6 dB (approximately a 45:1 ratio), indicating minimal sound field attenuation effects due to the microstructure.
7.3

7.2 1.0-MHz Phased Array Data
The 1.0-MHz data were also acquired with the DYNARAY® system and like the 800-kHz data discussed previously in Section 7.1, scans were performed on the PZR surge-line specimens from both the CCSS pipe side and from the SCSS elbow side of the weld as the refracted angle was swept from 30° to 70° in 1° increments. The same inspection protocols were employed, and multiple line scans were acquired with different axial offsets from the weld centerline. Each of the specified flaw areas was scanned from both sides of the weld.
An example of a merged data file analysis setup for flaw 1 on specimen 7C-059 (pipe-side scan) is provided in Figure 7.5. Figure 7.6 depicts images of the same flaw as scanned from the elbow-side of the weld. Data analyses of the entire set of 1.0-MHz phased-array composite images for all flaws were conducted using a consistent windowing scheme. Again, the corner trap signal response from the ID surface-connected crack is clearly evident in each of the three B-, C- and D-scan views, respectively. Image analysis employed various views of the detected flaws for both length and depth sizing. A comparative analysis of the pipe-side and elbow-side images visually shows the differences in background clutter between the CCSS and SCSS parent material.
Figure 7.5. 1.0-MHz Data on Pipe Side of 7C-059, Flaw 1, Merged Image for Length Sizing
7.4

Figure 7.6. 1.0-MHz Data on Elbow Side of 7C-059, Flaw 1, Merged Image for Length Sizing
While the 1.0-MHz data provided slightly enhanced resolution in contrast to the 800-kHz probe, tip-diffracted energy was not detected at this wavelength. Still, the clarity of the flaws against the parent material is very good. The lowest SNR for the 1.0-MHz probe across all flaws in these specimens was 18.5 dB (approximately an 8:1 ratio), while the highest SNR for the 1.0-MHz data was 32.3 dB (approximately a 40:1 ratio), indicating minimal sound field attenuation effects due to the microstructure.
7.3 1.5-MHz Phased Array Data
The 1.5-MHz data were again acquired with the DYNARAY® system and like the 800-kHz and 1.0-MHz data discussed previously in Sections 7.1 and 7.2, scans were performed on the PZR surge-line specimens from both the CCSS pipe side and from the SCSS elbow side of the weld as the refracted angle was swept from 30° to 70° in 1° increments. The same inspection protocols were employed, and multiple line scans were acquired with different axial offsets from the weld centerline. Each of the specified flaw areas were scanned from both sides of the weld.
An example of a merged data file analysis setup for flaw number 2 on specimen 9C-001 (pipe-side scan) is provided in Figure 7.7. Figure 7.8 depicts images of the same flaw as scanned from the elbow-side of the weld. Data analyses of the entire set of 1.5-MHz phased-array composite images for all flaws were conducted using a consistent windowing scheme, and again, the corner trap signal response from the ID surface-connected crack is clearly evident in each of the three B-, C-, and D-scan views, respectively. Image analysis employed various views of the detected flaws for both length and depth sizing. A comparative analysis of the pipe-side and elbow-side images visually shows the differences in background clutter between the CCSS and SCSS parent material and indicates a slightly more attenuative SCSS microstructure versus the CCSS microstructure.
7.5

Figure 7.7. 1.5-MHz Data on Pipe Side of 9C-001, Flaw 2, Merged Image for Length Sizing
Figure 7.8. 1.5-MHz Data on Elbow Side of 9C-001, Flaw 2, Merged Image for Length Sizing
7.6

Flaw length, depth, and signal-to-noise were determined from these data. Tables 7.1, 7.2, and 7.3 (see Section 7.5) show the summary length results, depth results, and SNR calculations for all data in this study. At 1.5 MHz, the length sizing is relatively similar to that of the other probes; however, depth sizing performance at 1.5 MHz is significantly improved over that of the lower-frequency, 800-kHz probe. Results from depth sizing at 1.5 MHz show that this probe out-performed all other probes in acquiring the most accurate depth-sizing results over all flaws studied here. This may, in fact, be attributed to the smaller spot size of the zone-focused insonification area for the 1.5-MHz probe over the 800-kHz probe, in addition to the detection of some tip-diffracted signals from the flaws at 1.5 MHz. Perhaps the 1.5-MHz probe provides the optimal balance between penetration and resolution with regard to inspection of these microstructures, because this probe showed slightly better depth measurement performance over that of the 2.0-MHz probe as well.
The 1.5-MHz data provided enhanced resolution in contrast to the 800-kHz and 1.0-MHz probes, as some tip-diffracted energy was detected at this wavelength. Also, the clarity of the flaws against the parent material was very strong. The lowest SNR for the 1.5-MHz probe across all flaws in these specimens was 21.7 dB (approximately a 12:1 ratio), while the highest SNR for the 1.5-MHz data was 31.0 dB (approximately a 36:1 ratio), indicating minimal sound field attenuation effects due to the microstructure.
7.4 2.0-MHz Phased Array Data
The 2.0-MHz data were also acquired with the DYNARAY® system and like the other data discussed previously in Sections 7.1, 7.2, and 7.3, scans were performed on the PZR surge-line specimens from both the CCSS pipe side and from the SCSS elbow side of the weld as the refracted angle was swept from 30° to 70° in 1° increments. The same inspection protocols were employed, and multiple line scans were acquired with different axial offsets from the weld centerline. Each of the specified flaw areas was scanned from both sides of the weld.
An example of a merged data file analysis setup for flaw number 2 on specimen 9C-002 (pipe-side scan) is provided in Figure 7.9. Figure 7.10 depicts images of the same flaw as scanned from the elbow-side of the weld. Analyses of the entire set of 2.0-MHz PA composite images for all flaws were conducted and, again, the corner trap signal response from the ID surface-connected crack is clearly evident in each of the three B-, C-, and D-scan views, respectively. However, as we increase the inspection frequency, we can see that at 2.0 MHz, signal response continuity and strength begin to decrease, relative to the other probes. This is anticipated, as the effects of the anisotropic and inhomogeneous microstructures begin to have a more adverse effect on sound field propagation with increased inspection frequency. Figure 7.11 depicts the analysis window employed for depth sizing. This image shows a strong tip-diffracted signal from the elbow side of the weld.
Image analysis employed various views of the detected flaws for both length and depth sizing. A comparative analysis of the pipe-side and elbow-side images in these figures visually shows the differences in background clutter between the CCSS and SCSS parent material and indicates that even at a relatively higher frequency, the PA results show that an effective inspection can be conducted and relatively accurate sizing data can be computed in these coarse-grained materials.
7.7

Figure 7.9. 2.0-MHz Data on Pipe Side of 9C-002, Flaw 2, Merged Image for Length Sizing
Figure 7.10. 2.0-MHz Data on Elbow Side of 9C-002, Flaw 2, Merged Image for Length Sizing
7.8

Figure 7.11. 2.0-MHz Data on Elbow Side of 9C-002, Flaw 2, for Depth Sizing
At 2.0 MHz, a review of the length-sizing results shows that this probe met the ASME Code-acceptable criterion across all inspection scenarios, with the exception of inspection from the CCSS pipe-side of specimen 9C-001. The length sizing criterion calls for an RMSE less than 19.05 mm (0.75 in.). Regarding depth sizing, the ASME Code Section XI criterion for acceptable depth sizing is 3.81 mm (0.125 in.). The 2.0-MHz probe met this criterion on all flaws in all three samples.
Like the 1.5-MHz probe, the 2.0-MHz array provided enhanced depth resolution in contrast to the 800-kHz and 1.0-MHz probes, as tip-diffracted energy was detected for all flaws at this wavelength. The clarity of the flaws against the parent material was not as strong as the other probes, but still well above the necessary visual contrast to consistently detect the flaws in these specimens. Acoustic noise and clutter typically resulting from coherent energy scattered by the coarse-grained microstructures was much lower than anticipated at this frequency. The lowest SNR for the 2.0-MHz probe across all flaws in these specimens was 24.6 dB (approximately a 16:1 ratio), while the highest SNR for the 2.0-MHz probe was 32.2 dB (approximately a 40:1 ratio), indicating minimal sound field attenuation effects due to the microstructure.
7.9

7.5 Summary of Results
Table 7.1 provides a summary of the length measurements for all flaws across all three specimens used in this study. This table also provides true-state flaw length data and RMSE calculations for inspections from either the CCSS pipe side or the SCSS elbow side of the surge lines, as a function of inspection frequency (PA probe). In this same format, Table 7.2 provides a summary of the depth measurements for all flaws evaluated here. This table also provides true-state flaw depth data and RMSE calculations for inspections from either the CCSS pipe side or the SCSS elbow side of the surge lines, as a function of inspection frequency. Finally, Table 7.3 summarizes the SNR in dB, for each flaw as a function of the PA probe (frequency) and scan orientation to the weld (e.g., pipe side, elbow side).
Table 7.1. Length Sizing Summary of Results
800 kHz 1.0 MHz 1.5 MHz 2.0 MHz
Specimen/ Flaw
True State Length (mm)
CCSS (mm)
SCSS (mm)
CCSS (mm)
SCSS (mm)
CCSS (mm)
SCSS (mm)
CCSS (mm)
SCSS (mm)
7C-059 1 101.6 104.7 114.9 116.1 112.9 116.5 102.4 119.3 96.6 2 50.6 63.0 19.1 69.2 61.4 34.8 34.8 36.0 57.1 3 50.6 72.0 -- 49.3 39.3 49.7 74.0 45.8 62.4 4 152.6 190.5 160.2 186.4 181.2 187.3 181.3 181.4 143.3 RMSE 14.4 20.2 20.6 17.3 20.5 20.1 18.6 8.6 9C-001 1 76.6 89.3 92.3 96.3 94.5 91.5 83.3 104.4 77.4 2 51.1 56.4 74.5 59.2 72.8 64.1 46.8 37.8 57.8 3 69.7 77.1 69.4 70.3 77.1 88.4 69.1 93.2 64.0 RMSE 9.0 16.3 12.3 16.8 15.7 4.6 22.4 5.1 9C-002 1 76.7 68.6 79.9 100.3 96.5 62.0 79.0 101.3 90.5 2 50.5 53.2 67.2 57.4 73.9 53.3 63.3 54.1 66.9 3 69.7 60.8 70.2 68.0 91.0 55.3 55.3 53.8 71.9 RMSE 7.1 9.8 14.2 21.6 12.0 11.2 17.0 12.4
A key benchmark used for determination of the effectiveness and utility of the inspection approach is to compare the composite length-sizing and depth-sizing results from the evaluation against the ASME Code Section XI acceptance criteria for both length and depth sizing. The length-sizing criterion calls for an RMSE less than 19.05 mm (0.75 in.), while the depth sizing criterion calls for an RMSE less than 3.81 mm (0.125 in.). Length sizing measurements (individual data files) were split among three different analysts, each taking specific portions of data to size. A majority of the data was straight forward and easily sized at the −6 dB level, but some data required interpretation due primarily to a noncontiguous signal. This interpretation is likely to add a human factors error into the data, either elongating or shortening the length values.
7.10

Table 7.2. Depth Sizing Summary of Results
800 kHz 1.0 MHz 1.5 MHz 2.0 MHz
Specimen/ Flaw
True State Length (mm)
CCSS (mm)
SCSS (mm)
CCSS (mm)
SCSS (mm)
CCSS (mm)
SCSS (mm)
CCSS (mm)
SCSS (mm)
7C-059 1 10.9 12.6 11.5 10.6 11.8 10.9 11.5 11.4 10.6 2 9.3 11.6 9.6 11.3 9.1 9.2 8.3 10.9 10.5 3 9.3 9.8 -- 10.4 10.0 10.6 10.0 11.1 10.3 4 15.6 16.3 14.5 15.0 14.7 14.5 14.9 15.0 15.3 RMSE 1.5 0.74 1.2 0.73 0.85 0.76 1.3 0.81 9C-001 1a 3.4 5.0 4.0 3.4 3.2 4.2 2.5 3.5 5.2 1b 6.4 7.5 7.9 5.8 6.2 5.7 7.7 6.1 6.9 2 8.9 8.6 8.0 7.7 7.1 8.1 9.2 11.5 11.2 3 8.3 11.1 7.2 9.7 9.0 8.8 7.7 10.3 9.0 RMSE 1.7 1.1 0.97 0.98 0.71 0.86 1.7 1.5 9C-002 1a 4.8 4.3 6.9 4.8 NA 4.3 4.5 4.4 5.8 1b 7.5 9.5 7.9 9.3 6.4 7.4 4.6 7.9 9.0 2 6.3 6.4 8.1 7.9 8.2 6.6 4.4 6.0 7.0 3 4.8 6.3 NA 6.5 3.6 5.3 5.1 6.0 6.9 RMSE 1.3 2.8 1.5 2.7 0.39 1.8 0.68 1.4
Regarding detection capability, all of the flaws were detected with the exception of flaw number 3 in specimen 7C-059 as seen from the SCSS elbow at 800 kHz. Data could not be collected on this flaw because of the large footprint of the probe and the elbow geometry on the intrados. Signal-to-noise values were very good showing that flaw detection was not an issue. The data show that flaws are detectable at frequencies up to 2.0 MHz in these surge-line specimens containing grain sizes as large as 41 mm (1.61 in.) and nominal wall thickness of 33 mm (1.30 in.). The detection and sizing performance is not degraded by using a 2.0-MHz inspection. A review of Table 7.2 shows that flaw-depth sizing was completely within the Code-allowable limit. Length sizing was primarily over the Code-allowable limit on specimen 7C-059 and generally within the limit on the two, 9C specimens. This is in part due to surface irregularities relative to the probe footprints, differences in surface finish (both of which impact coupling efficiency), and the unanticipated detection of artifacts and/or anomalies associated with the crack implantation process. While all of the flaws were specified to be implanted within the weld metal (with the exception of flaw number 2 in specimen 7C-059) to minimize the potential for disturbing the parent material or introducing implantation anomalies that might result in reflection of coherent sound energy, the data appear to indicate that these effects still exist and are detectable. A review of radiographs provided by FlawTech® indicated the existence of flaw implantation artifacts that were also detected with the PA ultrasonic method evaluated here.
7.11

Table 7.3. Signal-to-Noise Ratio Summary of Results
800 kHz 1.0 MHz 1.5 MHz 2.0 MHz Specimen/
Flaw CCSS (dB)
SCSS (dB)
CCSS (dB)
SCSS (dB)
CCSS (dB)
SCSS (dB)
CCSS (dB)
SCSS (dB)
7C-059 1 30.0 33.6 27.2 24.7 26.1 29.1 27.0 32.2 2 24.3 21.7 26.6 30.1 31.0 23.2 31.1 24.6 3 24.8 -- 23.6 18.5 27.8 29.7 30.9 29.7 4 27.3 33.5 28.3 29.1 28.5 29.0 26.3 30.1 9C-001 1 27.1 22.8 27.3 20.4 28.0 22.4 28.0 28.0 2 26.1 23.4 27.3 19.0 25.2 22.4 29.1 20.0 3 26.5 27.1 25.3 26.4 24.2 25.2 25.2 25.2 9C-002 1 30.1 33.6 31.0 32.3 23.7 21.7 32.1 28.2 2 28.1 29.1 27.7 32.0 29.8 30.4 32.1 27.3 3 26.2 33.2 30.0 29.9 23.0 24.7 28.4 29.9
The reported SNR values provided in Table 7.3 are higher than previously reported values on these CASS PZR surge-line specimens because of a software change with the new DYNARAY® data acquisition and analysis system. This system employs the Ultravision® version 3.1R4 analysis software. In this software, the mean noise values are calculated over a volume rather than for the displayed 2-D image. By including the volume, the noise levels are lower, leading to a larger SNR by typically more than 10 dB. Previously, the mean noise levels were calculated on the 2-D image of interest. This new method of calculating a mean noise level will be investigated more in the future to determine which method best represents the data. A review of Table 7.3 shows that flaw responses were strong throughout the study for all specimens, all flaws, and all probes evaluated here.
The SNRs were calculated from the peak signal response and the mean noise response at the same part path in dB. These calculated values are all very good, indicating minimal attenuation effects on sound field propagation over the frequency range from 800 kHz to 2.0 MHz. Flaw detection was not in question for the TFCs implanted in these specimens as shown by the high SNRs. The lower inspection frequencies (800 kHz and 1.0 MHz) showed a general trend for an improved SNR, but for the materials used in this study, adequate SNRs were achieved even at 2.0 MHz. If CASS piping with higher attenuative properties is encountered in the field, the use of lower frequencies (800 kHz to 1.0 MHz) would be more appropriate for inspection. The elbow configuration limited elbow-side access to flaw number 3 in specimen 7C-059 but all other flaws were detected from both the pipe and elbow side of the weld. The lowest SNR value for all signal responses in this study was computed to be 18.5 dB while the maximum SNR value was 33.6 dB.
Typically in CASS components, the issue of beam skew and the potential for error in the positional registration of data (flaw responses) relative to the true position of the probe on the part surface is a critical problem. To address this issue, an analysis of the measured flaw lengths and positions (localization data) was conducted. The measured localization data were compared to the true-state flaw position data on the specimens, and this information was plotted and analyzed to determine if beam skew and localization of the cracks were significantly affected by the microstructures. Length-sizing results are summarized in Table 7.1 with the RMSE calculated for each specimen by probe frequency and by
7.12

specimen side, CCSS (pipe) or SCSS (elbow). The measurements were based on a −6 dB drop method with some analyst interpretation involved to account for signal dropout or other anomalies in the signals. Figures 7.12 through 7.14 map the flaw length positional data with true state for each of the specimens. The pipe- and elbow-side data are separated as well as probe frequency. This mapping allows one to look for trends in over or under sizing of the flaws and for skewing of the data, which can be observed in cast material.
Figure 7.12. Map of True-State and Measured, Circumferential Flaw Localization Data for CASS PZR
Surge-Line Specimen 7C-059
Figure 7.13. Map of True-State and Measured, Circumferential Flaw Localization Data for CASS PZR
Surge-Line Specimen 9C-001
7.13

Figure 7.14. Map of True-State and Measured, Circumferential Flaw Localization Data for CASS PZR
Surge-Line Specimen 9C-002
For specimen 7C-059, the 0° reference point lies at the far left of the plot at 0 mm. For the 9C specimens, a flaw was centered at the 0° reference point so the horizontal axis was shifted to start at −150 mm. The horizontal line (X-axis) on the plots represents linear distance (corresponding to the circumferential position of the flaws) around the circumference of the pipe specimens in millimeters. Lines that are plotted above the X-axis are measured flaw lengths from each of the four PA probes acquired from data taken from the CCSS pipe side of the specimens. Lines that are plotted below the X-axis are measured flaw lengths from each of the four PA probes as obtained from the SCSS elbow side of the specimens. Lines that lie directly on the X-axis horizontal line represent the true-state lengths and circumferential positions of the flaws in the specimen. The true-state data regions are additionally marked as lighter shaded regions in the plots for easier data comparisons. Flaws are plotted in ascending order from left to right on each of the plots. Therefore, on specimen 9C-002 for example, flaw number 1 is centered at the 0-mm mark, flaw number 2 is centered at the 250-mm mark, and flaw number 3 is centered at the 750-mm mark.
In general, flaw number 4 at an 850-mm circumferential position in specimen 7C-059; flaw number 1 at a 0-mm circumferential position and flaw number 2 at 250-mm circumferential in specimen 9C-001; and flaw number 1 at a 0-mm circumferential position in specimen 9C-002 tend to be oversized. Flaw number 2 at a 340-mm circumferential position in specimen 7C-059 tends to be undersized. The remaining flaws were both over and undersized. A summary of the measured flaw start and end positions is shown in Table 7.4. This table shows the average start and end positions for each flaw as averaged over the four frequencies and attempts to highlight trends from the plots in Figures 7.12–7.14.
7.14

Table 7.4. Length Error Averaged over the Four Frequencies(a) (mm)
7C-059 9C-001 9C-002 Pipe Elbow Pipe Elbow Pipe Elbow
Flaw # (mm) (mm) (mm) (mm) (mm) (mm) 1 start 16.6 −0.8 11.9 −1.2 0.6 −6.5 1 end −4.0 5.9 6.9 11.5 5.7 16.2 2 start 2.3 3.4 1.9 2.8 7.8 16.8 2 end −2.1 −10.9 1.4 9.1 −3.8 0.5 3 start −2.3 −2.5 17.4 11.0 −7.5 −9.2 3 end 5.8 10.4 −4.9 −10.8 −2.7 11.5 4 start 14.3 4.6 4 end 19.6 9.4
(a) Positive numbers indicate over sizing; negative numbers indicate under sizing.
A trend toward over-sizing of the flaw lengths can be expected as the probe spot size will inherently be added to the ultrasonic measurement values. Additional errors could come from the flaw implantation technique itself because the specimen is excavated and the flaw coupon implanted via weld material. Ultrasound may be sensitive to the excavation boundary and/or the added weld material. Beam skewing does not seem to be an issue in this data. There does not appear to be a shift toward one side or the other in start or end positions of the mapped flaws. Axial offset due to beam skew or sound field redirection in the longitudinal axis of the pipe (flow direction) was not evaluated here; however, future work may evaluate positional error in measured flaw position versus true state in the orthogonal axis.
7.6 Baseline CASS Material Noise Analyses
Full circumferential PA scans were conducted at 800 kHz and 1.5 MHz on the CCSS pipe ends of the three surge-line specimens to assess baseline material noise. The corner response from the end of the pipe sections were recorded as the probe was scanned circumferentially in a full 360° path. From a geometrical perspective, the end of the pipe represents a full 100% through-wall flaw. The corner response from the ID was recorded with the axial probe offset selected to give the strongest response at approximately 45°. Ideally, the maximum signal reflection occurs at this position. In a homogeneous material, the corner signal response would be very similar over the entire 360° of the pipe. Variations in the corner response data from this cast material are seen in the following six figures. These variations can be attributed to the mixture of columnar and equiaxed fine- and coarse-grain structures (essentially the material’s anisotropy and inhomogeneity), but also to a lesser extent surface irregularities, undulations, surface finish, and coupling effectiveness where the water couplant may not fill all the gaps between the transducer wedge/face and the surface of the part on a consistent basis.
Figures 7.15 through 7.20 show the corner signal responses from the pipe ends of specimens 9C-001, 9C-002, and 7C-059 at both 800 kHz and 1.5 MHz. The images are of merged data (composite data using responses from all angles) and thus represent the full sweep of collected data from 30° to 70° with 1° increments. Circumferential data were acquired at a 1-mm resolution over the approximately 1017-mm (40.0-in.) circumference. The D-scan end-view image is shown on the left and a polar plot on the right. A loss of corner signal or signal dropout was measured from a contour line drawn through the end-view data. The contour line is displayed at the top of the D-scan end-view image. Data regions that fell below
7.15

a 10 dB level (31%) from the peak response were recorded as a loss or diminishing of the signal. The data from 9C-001 at 800 kHz show the most consistent response and have a diminished signal of only 0.2% of the circumference. Because the wavelength is longest at 800 kHz, sound field propagation should be inherently less sensitive to the effects of the grain boundaries within the microstructure of the CASS material. Therefore, this result was fully anticipated.
These data show that the corner response is detected at essentially 100% of the circumference at this inspection frequency. This drops to a 94.8% detection at 1.5 MHz, which is still very good. The worst response is in specimen 7C-059 at 1.5 MHz, which has a 60.9% diminished signal or conversely a 39.1% detection of the corner signal response (see Figure 7.20). This poor result is primarily due to the large amplitude response in a limited circumferential region. The high amplitude region is at approximately 60–110 mm (2.36–4.33 in.) and represents nominally 10% of the circumferential length. The inner corner of the pipe in this region is gouged and is likely causing the higher responses. Outside of this region, the end view shows that there are corner signal responses over much of the circumference. To account for this anomaly, the threshold for diminished signal determination was lowered to −12 dB (0.25 level) and the signal dropout recalculated at 31.4% (see Figure 7.21). This is perhaps a better representation of this data set. Results from the measurements are listed in Table 7.5. Regardless of the degree of correlation between the data in Table 7.5 and general detection capability, the results from the evaluation of PA ultrasonic inspection of smaller bore, CASS PZR surge-line components show that these components are inspectable over a wide range of frequencies, given the CASS materials available for this study.
7.16

Figure 7.15. Pipe End Corner Response on 9C-001 at 800 kHz. The end view is on the left and the
polar view on the right. A signal dropout of 0.2% is measured from the contour line in the end view.
Figure 7.16. Pipe End Corner Response on 9C-001 at 1.5 MHz. The end view is on the left and the
polar view on the right. A signal dropout of 5.2% is measured from the contour line in the end view.
7.17

Figure 7.17. Pipe End Corner Response on 9C-002 at 800 kHz. The end view is on the left and the
polar view on the right. A signal dropout of 14.4% is measured from the contour line in the end view.
Figure 7.18. Pipe End Corner Response on 9C-002 at 1.5 MHz. The end view is on the left and the
polar view on the right. A signal dropout of 27.9% is measured from the contour line in the end view.
7.18

Figure 7.19. Pipe End Corner Response on 7C-059 at 800 kHz. The end view is on the left and the
polar view on the right. A signal dropout of 22.5% is measured from the contour line in the end view.
Figure 7.20. Pipe End Corner Response on 7C-059 at 1.5 MHz. The end view is on the left and the
polar view on the right. A signal dropout of 60.9% is measured from the contour line in the end view at a −10 dB level (0.31).
7.19

7.20
Figure 7.21. Pipe End Corner Response on 7C-059 at 1.5 MHz. The end view is the same as in
Figure 7.20 but the threshold for the signal dropout measurements has been lowered to −12 db (0.25 level). A signal dropout of 31.4% is measured at the −12 dB level.
Results from the diminished signal measurements are listed in Table 7.5. In all specimens, higher frequencies result in more signal dropout, which one would expect. The higher frequency (1.5 MHz) is more sensitive to attenuation and beam redirection as the wavelength relative to the average grain diameters found in these specimens is much smaller. In previous work (Anderson et al. 2007), the median length of the diminished signal was suggested as an indication of flaw length that could go undetected due to a loss-of-signal effect from the coarse-material microstructure. With this assumption, the data show that a flaw less than 14.6 mm (0.57 in.) could go undetected in this material as a worst-case scenario. This is only 1.4% of the circumference and shows very good detection. Table 7.5. Regions of Diminished Signal as Observed from the Corner Response off the Pipe End of
the Surge-Line Specimens at a −10 dB Level
Measured Length of Diminished Signal Regions mm (in.)
Specimen Freq.
(MHz)
No. of Regions
Observed Minimum Maximum Average Median Percent Dropout
9C-001 0.8 2 1.0 (0.04) 1.0 (0.04) 1.0 (0.04) 1.0 (0.04) 0.2 1.5 18 1.0 (0.04) 7.0 (0.28) 3.0 (0.12) 3.0 (0.12) 5.2
9C-002 0.8 41 1.0 (0.04) 17.2 (0.68) 3.6 (0.14) 2.0 (0.08) 14.4 1.5 36 1.0 (0.04) 33.4 (1.31) 7.9 (0.31) 6.6 (0.26) 27.9
7C-059 0.8 27 1.0 (0.04) 28.2 (1.1) 8.5 (0.33) 6.8 (0.27) 22.5 1.5 27 1.0 (0.04) 171.2 (6.7) 23.0 (0.90) 14.6 (0.57) 60.9
Measured At A −12 Db Level 7C-059 1.5 34 1.0 (0.04) 29.1 (1.15) 9.41 (0.37) 7.3 (0.29) 31.4

8.0 Discussion and Conclusions
A technical evaluation of a phased-array ultrasonic inspection method was conducted to evaluate detection and sizing performance for inspection of small bore, CASS piping components. A set of thermal fatigue cracks were implanted into three CASS PZR surge-line specimens that were fabricated using vintage CASS materials, and PA-UT flaw responses from these cracks were used to evaluate detection and characterization performance. This effort included technical assessments and confirmatory research that addressed:
The use of microstructure knowledge (dimensional analysis, grain orientation, and grain type) and sound-field modeling to more effectively modify inspection parameters and enhance the inspection outcomes;
The use of PA-UT methods and advanced probe design/modeling to enhance detection and characterization of circumferentially oriented flaws in CASS PZR surge line piping specimens;
An analysis of flaw localization capability and performance for all probes on all flaws characterized in this study;
An analysis of flaw detection, length sizing, depth sizing, and signal-to-noise ratio for all flaws in all specimens, as a function of various inspection parameters; and
An analysis of the baseline CASS material noise and the potential impact on flaw detection as correlated to the specimens studied here.
The CASS PZR surge-line specimens used in this study were polished and chemically etched to bring out the microstructures of both pipe and elbow segments. This work included a thorough evaluation of the resulting micrographs to better understand the microstructural variability and range of grain sizes that were prevalent in the PZR surge-line components being evaluated. Because the analysis was conducted on CCSS parent material approximately 305 mm (12 in.) from the welds, some level of microstructural variability is expected; however, these data were used for acquiring a general understanding of grain orientation, type, and size and no specific conclusions can be made without direct destructive analysis of the parent material near the weld. Dimensional analyses were conducted, and results provided insights into the inspection wavelength-to-grain diameter ratios. Grain diameters ranged from very small 0.5 mm (0.02 in.) to very large 41.0 mm (1.61 in.). From the initial microstructural analysis, it was anticipated that the average grain diameters and overall microstructural variability of these segments would provide a more challenging inspection scenario; however, this was not the case.
The anticipated inspection challenges (based upon work conducted on thicker CASS reactor coolant loop piping) drove the efforts to develop more effective PA probes for application to smaller bore, relatively thin-walled, coarse-grained component inspections. Effective probe matrix design evolved as previous work shed light on inspection issues and critical aspects of probe performance in CASS materials. This evolution was important to the efforts reported here. Key elements included fabricating probes with minimal footprints, higher bandwidths, and improved beam steering and lateral skewing capabilities. The 800-kHz probe was designed to provide a more optimal wavelength to allow the ultrasound to penetrate the large grain structure of CASS and yet maintain suitable resolution allowing the probe to resolve smaller flaws. The 1.5-MHz probe employed in this study was originally designed for
8.1

far-side examinations of austenitic welds in WSS piping, but performed quite well on these coarse-grained specimens. Finally, both the 1.0-MHz and 2.0-MHz PA probes were originally designed for evaluating inspection effectiveness of PA methods on components with inlays, onlays, and overlays; however, these probes also performed quite well with regard to detection and flaw characterization in these materials.
A baseline CASS material noise analysis was also conducted. Full circumferential PA scans were acquired at 800 kHz and 1.5 MHz on the CCSS pipe ends of the three surge-line specimens to assess baseline material noise. In all specimens, the higher frequency resulted in more signal dropout, as anticipated. The higher frequency (1.5 MHz) is more sensitive to attenuation and beam redirection as the wavelength relative to the average grain diameters found in these specimens is much smaller. The median length of the diminished signal was suggested as an indication of flaw length that could go undetected due to a loss-of-signal effect from the coarse-material microstructure. With this assumption, the data show that a flaw less than 14.6 mm (0.57 in.) could go undetected in this material as a worst-case scenario. This is only 1.4% of the circumference and shows very good detection. The results showed that the lower frequency (800 kHz) was much more effective and consistent at detecting the corner response in all three specimens.
The detection and sizing data showed that all the implanted thermal fatigue cracks in all three specimens were detected from both the CCSS (pipe) and the SCSS (elbow) sides of the weld at 800 kHz, 1.0 MHz, 1.5 MHz, and 2.0 MHz. Data at 800 kHz were not collected on one of the cracks from the SCSS elbow side because of geometrical constraints that precluded effective coupling of the PA probe. The results reported here show that longitudinal mode, transmit-receive matrix PA probes over a wide frequency range, can provide effective sound fields for detection and characterization of TFCs in CASS PZR surge-line components. While the flaw depths of the implanted TFCs employed in this study ranged from approximately 10% through-wall to 50% through-wall, the majority of the cracks reported here were in the range of 20% to 30% through-wall, or approximately 6.4 mm (0.25 in.) to 10.2 mm (0.4 in.) deep. Flaw lengths ranged from approximately 50 mm (2.0 in.) to 150 mm (6.0 in.), with the majority of flaws in the 50 mm (2.0 in.) to 75 mm (3.0 in.) range. All but one flaw were positioned in the weld. PA-UT results were compared against true-state data for all flaws, and RMSE was computed as a metric for both length sizing and depth sizing of the flaws in this study. Also, signal-to-noise measurements were made and SNR values were computed and documented for all flaws and scanning scenarios.
A primary metric used for determination of the effectiveness and use of the inspection approach is to compare the composite length-sizing and depth-sizing results from the evaluation against the ASME Code Section XI acceptance criteria for both length and depth sizing. The length-sizing criterion calls for an RMSE less than 19.05 mm (0.75 in.), while the depth-sizing criterion calls for an RMSE less than 3.81 mm (0.125 in.). Length-sizing measurements were made by three different analysts, each taking different portions of the data to size. While much of the data were straightforward and easily sized at the −6 dB level, some data required interpretation due primarily to a noncontiguous signal (slight variations in judgment/interpretation and application of sizing criteria). Thus, sizing error due to variability in individual analyst interpretations of signal response is a factor that has not been quantified in this study. Human factors issues are considered outside the scope of this work; nevertheless, it is noted here. Regarding detection capability, all flaws were detected with the exception of flaw number 3 in specimen 7C-059 as seen from the SCSS elbow at 800 kHz. Data could not be collected on this flaw because of the large footprint of the probe and the elbow geometry on the intrados. Signal-to-noise values were very good showing that flaw detection was not an issue. The data show that flaws are detectable at frequencies
8.2

up to 2.0 MHz in these surge-line specimens containing grain sizes as large as 41 mm (1.61 in.) and nominal wall thickness of 33 mm (1.3 in.). The detection and sizing performance is not degraded by using a 2.0-MHz inspection. The higher frequencies (especially the 2.0-MHz probe) were able to detect tip-diffracted energy. Results show that all flaw depth sizing fell completely within the Code-allowable limit. Length sizing was primarily over the Code-allowable limit on specimen 7C-059 and generally within the limit on the two 9C specimens.
Length sizing was generally better from the CCSS pipe side at 800 kHz and 1.0 MHz than from the SCSS elbow side; however, this trend was reversed at the higher frequencies, as the 1.5- and 2.0-MHz probes resulted in more accurate length sizing in the SCSS material. The crack depth sizing was similar from both the CCSS and the SCSS sides over all frequencies with an approximate 1.3-mm (0.05-in.) average error. The SNRs were calculated from the peak signal response and the mean noise response at the same part path in dB. These calculated values are all very good, indicating minimal attenuation effects on sound field propagation over the frequency range from 800 kHz to 2.0 MHz. Flaw detection was not in question for the TFCs implanted in these specimens as shown by the high SNRs. The lowest SNR value for all signal responses in this study was computed to be 18.5 dB while the maximum SNR value was 33.6 dB.
The issue of beam skew and the potential for error in the positional registration of flaw responses relative to the true position of the probe on the part surface was also addressed. Because the coarse-grained microstructures can redirect, partition, and skew sound fields as they propagate through the part thickness, the issue of flaw localization performance was evaluated. To address this issue, an analysis of the measured flaw lengths and positions (localization data) was conducted. The measured localization data were compared to the true-state flaw position data on the specimens, and this information was plotted and analyzed to determine if beam skew and localization of the cracks were significantly affected by the microstructures. The results of the analysis indicated that a trend toward over sizing of the flaw lengths should be expected as the probe spot size will inherently be added to the ultrasonic measurement values. Additional sources of positional registration error could come from the flaw implantation technique itself because the specimen is excavated and the flaw coupon is implanted via weld material. Ultrasound may be sensitive to the excavation boundary and/or the added weld material. A flaw mapping exercise was conducted and the data showed that lateral beam skewing does not appear to be an issue in this study. There does not appear to be a shift toward one side or the other in start, or end, positions of the mapped flaws.
As with the inspection of all CASS components, the question remains regarding critical flaw size in these smaller-bore piping components. A rigorous flaw tolerance evaluation needs to be performed to address the question of critical flaw size, as this information can then be combined with microstructure knowledge, advanced probe design, and other state-of-the-art processes to build the foundation for a genuinely effective and reliable inspection technique that can pass a performance demonstration test and provide meaningful inspection results on these coarse-grained materials.
With respect to the evaluations conducted on the CASS PZR surge lines, the primary issues requiring more research include gaining a better understanding of the role of different microstructures in CASS components and the various casting processes, and how variations in these processes and microstructures affect crack initiation, crack growth, and inspection performance. Also, having some level of knowledge of the microstructure in the part being inspected is valuable, and can lead to improved inspection procedures. That being said, development and evaluation of in-situ methods for characterizing and/or
8.3

8.4
classifying the microstructures from the OD of a component would provide a great deal of valuable information for optimal tailoring of inspection parameters. While advances in phased-array inspection systems continue to improve general capabilities for crack detection and relatively accurate lateral resolution for length sizing, overcoming the main inspection challenges posed by coarse-grained microstructures requires finding the optimal balance between three key factors. Achieving suitable signal-to-noise ratio, obtaining effective penetration of the sound field from the OD, and acquiring optimal resolution for flaw localization and sizing are all critical toward improving flaw detection and sizing capabilities in CASS. Currently, this work has focused primarily on flaw detection and characterization of TFCs in the weld material. There are on-going efforts to address important inspection issues associated with the morphology of other cracking mechanisms (intergranular stress corrosion cracking, mechanical fatigue, primary water stress corrosion cracking, etc.) as well as crack growth/location in the parent material near the weld, and the impact on detection and characterization performance. Also, as PA-UT detection and sizing approaches evolve for smaller-bore components, and mitigation activities are being implemented on existing plant systems, further work should include evaluation of longer-wavelength techniques to address similar CASS components with full structural overlays. Work is planned for these areas.
Finally, this technical evaluation employed only three sample specimens, with a limited flaw set. The Electric Power Research Institute NDE Center has agreed to conduct an evaluation on these CASS PZR surge-line specimens over the coming months, and their data will include assessments of UT methods that have been successfully qualified through the industry’s Performance Demonstration Initiative. The results of their work will be made available to the NRC and PNNL so that joint conclusions can be made addressing smaller-bore CASS component inspections. The evaluation will be assessed relative to the development of a basis for a rigorous and statistically relevant set of recommendations for the inspection of CASS materials ≤ 2 inches in thickness.
In conclusion, based upon the results of this work, state-of-the-art phased-array inspection approaches are rapidly evolving and the capability to detect cracks in CASS components where the wall thickness is generally less than 50 mm (2.0 in.) has been demonstrated here. While additional questions remain to be answered, long-wavelength ultrasonic approaches coupled with advanced signal processing technologies are beginning to show signs of success toward addressing this challenging inspection issue.

9.0 References
Anderson MT, SL Crawford, SE Cumblidge, KM Denslow, AA Diaz and SR Doctor. 2007. Assessment of Crack Detection in Heavy-Walled Cast Stainless Steel Piping Welds Using Advanced Low-Frequency Ultrasonic Methods. U.S. Nuclear Regulatory Commission, Washington, D.C.
Anderson MT, SE Cumblidge and SR Doctor. 2003. "Applying Ultrasonic Phased Array Technology to Examine Austenitic Coarse-Grained Structures for Light Water Reactor Piping." In Third EPRI Phased Array Inspection Seminar. June 9-11, 2003, Seattle, Washington.
Diaz AA, AD Cinson, SL Crawford, SE Cumblidge, KM Denslow, M Morra, MS Prowant and MT Anderson. 2008. Technical Letter Report: Assessment of Ultrasonic Phased Array Testing for Cast Austenitic Stainless Steel Pressurizer Surge Line Piping Welds and Thick Section Primary System Cast Piping Welds. PNNL-17698, Pacific Northwest National Laboratory, Richland, Washington.
Diaz AA, SR Doctor, BP Hildebrand, FA Simonen, GJ Schuster, ES Andersen, GP McDonald and RD Hasse. 1998. Evaluation of Ultrasonic Inspection Techniques for Coarse-Grained Materials. NUREG/CR-6594, PNNL-11171, U.S. Nuclear Regulatory Commission, Washington, D.C.
Jeong YH. 1987. An Ultrasonic Material State Classifier for Elastically Anisotropic Materials. Ph.D. Thesis Thesis, Drexel University, Philadelphia, Pennsylvania.
Taylor TT. 1984. An Evaluation of Manual Ultrasonic Inspection of Cast Stainless Steel Piping. U.S. Nuclear Regulatory Commission, Washington, D.C.
9.1
