assessment of voluntary sustainability standards ... · factories) where the vss projects have been...
TRANSCRIPT

International Journal of Education and Research Vol. 3 No. 9 September 2015
439
Assessment of Voluntary Sustainability Standards implementation on the Environmental performance of the Tea sector in Rwanda:
A comparative study of Sorwathea and Mulindi tea factories in Rwanda
Gitau Wamukui
Jomo Kenyatta University of Agriculture and Technology, Kigali, Rwanda. Email: [email protected]
Jaya Shukla
Jomo Kenyatta University of Agriculture and Technology, Kigali, Rwanda. Email: [email protected]
Joseph Odour
Jomo Kenyatta University of Agriculture and Technology, Kigali, Rwanda. Email: [email protected]
ABSTRACT
The objective of this study is to assess the implementation of Voluntary sustainability standards projects on the environmental performance of tea production units in Rwanda. The key focus of implementation of the Voluntary Sustainable standards (VSS) projects is the improvement the economic, social and environmental performance of the industry that they are implemented. The study was done through a comparison of two operational tea factories (Sorwatea and Mulindi tea factories) where the VSS projects have been implemented at varied levels. The effects of these standards implementation was measured through the assessment the following specific environmental performance indicators: Water usage, Energy usage, waste generation and biodiversity loss whose trend changes were compared. The study is an exploratory research which is motivated by the confirmed gaps existing in the review of the effects of the implementation of the VSS projects in the country and the focus of going green in the tea sector in Rwanda. The research adopted a mix of both qualitative and quantitative approaches which are aimed ensuring that enough data was be gathered to cover the subject. The research strategy that has been adopted for this study is a comparative study for two tea production units (currently producing around 30% of Rwanda tea by volume). Data collection was both primary (Interviews, key informants) and secondary data (company data and other sourced data) collection methods. Data was be analyzed using a matrix table for the qualitative data and contemporary statistical tools (Student T test and correlation coefficient) for the quantitative data using the statistical Package for Social Science (SPSS) version18. The results of the study show that at least 72 % of the tea factories in Rwanda have implemented one or sacral of the VSS project in their firm. The leading firm in the implementation of the standards is Sorwatea which has 8 VSS implemented since they started the process in 2006. The key influences/drivers for the implementation of the standards were noted to be regulatory, social,

ISSN: 2411-5681 www.ijern.com
440
improved environmental an operational performance and commercial motivations. The key challenges of implementing VSS project in firms were noted to be Financial, Operational and Human resources. Sorwatea which has a longer history of implementing the VSS projects has managed to overcome most of the challenges in comparison to Mulindi which is just starting the journey. The research study found that there is a relationship between environmental performance and the implementation of VSS. Detailed analysis of various parameters well showed that Sorwatea has better environmental performance and this could be attributed to the implementation of VSS projects as the production for the two firms, locality, type of tea is all the same. This was evidenced by the following:
- The presence of robust Environmental management system at Sorwatea in comparison to Mulindi.VSS implementation as noted to lead to some sustainable actions like water metering and conservation, waste water analysis amongst others.
- The trend of water usage where it has declined overtime at Sorwatea as compared to Mulindi.
- There is a significant difference in water fuel, firewood and electivity usage between the two firms.
- Sorwatea has a functional waste water treatment plant and do undertake waste water analysis unlike Mulindi.
- Sorwatea has a robust Solid waste management system where there is separation of waste reuse recycling and as from this year (2005) they have started recording the quantities of waste generated in the firm. This was absent in Mulindi.
- Sorwatea has a biodiversity restoration program had have consistently been planting trees for firewood and general cover (indigenous ) trees for the last four years unlike Mulindi where this was absent .
As the research study has identified and can conclusively showed that that there a positive influence on Environmental performance due to implementation of VSS project in tea firms in Rwanda The study therefore recommends that other tea processing units should implement VSS projects so as to ensure improved environmental performance of their firms and also the greening of the industry as per the country aspirations.
KEYWORDS: voluntary Sustainable standards, environmental performance, biodiversity.
INTRODUCTION. Around the world agriculture is and was continue to be a major building block in the achievement of the Millennium Development Goals (MDGs). Kalunda (2014) notes that recent statistics show that agricultural production needs to increase by 70 percent by 2050 in order to feed the world, while demographic growth, climate change, and urbanization put pressure on available cultivable land (IFC, 2011). In Rwanda, agriculture is the largest economic sector and remains the best opportunity for economic growth and poverty alleviation.
The performance of the agriculture sector is therefore crucial and any activities that can go towards enhancing the sustainability and performance of these would greatly assist the agriculture sectors

International Journal of Education and Research Vol. 3 No. 9 September 2015
441
where the tea subsector lies. It is with this focus that internationally accepted voluntary sustainability standards (VSS) have been established and implemented in the agro based indeed industry. The VSS are aimed at helping the sector to achieving sustainability in the production of agricultural commodities is necessary to ensure food security, a healthy natural resource base and human wellbeing (IFC 2013). In Rwanda to meet these challenges of sustainability issues, the tea sector in particular has been adapting the VSS with varied success. This study therefore intends to see the effects of the implementation of the International VSS to the agro based industries with a specific focus to the tea sector in Rwanda. United Nations Forum on Sustainability Standards (UNFSS) defines Voluntary sustainability standards are standards specifying requirements that producers, traders, manufacturers, retailers or service providers may be asked to meet, relating to a wide range of sustainability metrics, including respect for basic human rights, worker health and safety, environmental impacts, community relations, land-use planning and other
Tea is the most popular of all non-alcoholic beverages in the world. The International Tea Committee notes that the global consumption of tea jumped by 60% between 1993 -2010 and significant growth is forecast as more people become consumers of tea. Two-thirds of the world populations drink tea. Tea 'Camellia sinensis' is believed to have originated from South East Asia. Economically speaking too, tea is an extremely valuable source of much needed foreign exchange. Globally 35 countries grow tea with Rwanda being one of them. In Rwanda tea has progressively provided the much need foreign exchanges with statistics from the National Agricultural Export Development Board (NAEB), on Tea, Coffee and Horticulture showing that the Tea exports value totaled approximately US$55.7m in 2010, US$61.9m in 2011, USD $ 65.7m and USD 56,243,600m in 2013 making it the leading export crop. The tea sector provides direct employment for about 70,000 people and several thousand more are hired as casual workers during the tea season.
History of the Tea Sector in Rwanda. NAEB has shown that the Rwandan tea is planted on hillsides at high altitude (between 1,900 and 2,500 m), and on well drained marshes at an altitude of between 1,550 and 1,800 m. Tea production in Rwanda was started by European and Asian investors in the mid-1950s. Sachin and Dimitri (2013) note that until the early 1970s, the output of the tea sector remained limited; in 1970 there were only three factories (Mulindi, Shagasha and Ntendezi) operating in the country. Tea became a priority sector in the late 1970s with the launch of the Second Development Plan and the subsequent establishment of Rwanda Tea Authority (OCIR-Thé) in 1978. They are also nine privately owned production units including Gisovu, Cyohoha (making up the company Société Rwandaise de Thé (SORWATHE), Pfunda (Pfunda Tea Company), Kitabi, Nyabihu, Rubaya (Rwanda Mountain Tea), Mata, Gisakura, and Nshili-Kivu. Efforts are currently underway to increase and develop more units as more areas are opened up for tea production.
Mulindi Tea Factory was the first tea unit was created in 1960 and it’s located in the Gicumbi District, Northern Province. NAEB 2013 statistics records show that MULINDI tea factory produces 13.13% of the National tea production in Rwanda. The company was recently privatized in 2013 and under the previous management of OCIR tea there was a move to implementation of ISO standards but no other international certifications have been recorded ever since.
Sorwathé tea factory is the oldest private tea company in Rwanda, Gathani and Stoelinga (2013) note that Sorwathé is a tea-growing and tea-processing company in Rwanda and was established in 1975. It is has been a pioneer in introducing new varieties of tea. The tea factory is located in

ISSN: 2411-5681 www.ijern.com
442
Kinihira, a small town 70 km north of Kigali. Sorwathé was the first private tea factory in Rwanda and currently produces about 3,200 tons of made tea per year (about 14% of Rwanda’s annual production). Most (95%) of Sorwathé tea is exported, with only 5% sold for local consumption. The company has implemented various international standards and continues to do so.
Statement of the Problem. The tea sector plays a fundamental role in the economic growth and the development prospects of Rwanda. Rwanda Environmental Management Authority (REMA, 2009) notes that that progress in environmental performance in the country has been rather slow but reassuring. Globally there is a move towards buying only Tea that is produced sustainably and Voluntary sustainability standards projects have been marketed as a key tool for the efficient operation of the ‘Green Economy’, which as noted is a key pillar of the country development. Environmental performance refers to what extent resources such as energy, water and land are used by a company and at the same time what emission of by-products such as waste, hazardous materials and air pollution it causes (Hubbard 2009). VSS projects have been described as an alternative way to promote better environmental performance by helping the consumers to identify “green” products (Melo, 2004). Standards systems should specify how their environmental standards (minimum requirements and improvement Standards) contribute to sustainable development. NAEB 2012 notes that though part of Rwanda tea is ISO certified, there is need for more certification programs like fair-trade and rainforest for all tea factories for better environmental performance and market access. This therefore calls for studies to show the key relationship or lack of it to assist in furtherance of these. Sorwathé and Mulindi tea factories combined produce close to 30 % of the total tea production in Rwanda (13% and 14% of the total tea production respectively). Mulindi Tea Factory which has just been privatized in 2013 has not implemented any of the VSS project while Sorwathé records show that it has implemented Six (6) VSS projects to-date. It is therefore important to compare the two and see if the international VSS projects have had have had any major effect on the environmental performance of the firms and what deduce what implication this has of this would be to the tea sector in Rwanda . The existence of a “global green market” is being driven, positioned and evidenced through the implementation of various certifications and implementation of VSS by the producers. A comparative study of two tea producers who are at two different levels of implementation of the VSS projects was inform if this assists in any changes in environmental performance. Key literature search has shown that few studies have been done on the effects of the implementation of the VSS to the environmental performance of the tea sector in Rwanda. They are more studies whose focus has been more of social and economic benefits of implementation of the VSS projects in the sector.
Objectives of the Study. General Objective. The objective of the study is to review the effects of implementation of International Standards (Voluntary Sustainable Standards projects) on the environmental performance of the tea Sector in Rwanda.
International Journal of Education and Research Vol. 3 No. 9 September 2015
443
The Specific Objectives The specific objectives of the study are:
1. To examine the relationship between the implementation of the VSS projects and environmental performance of the tea production units in Rwanda.
2. To compare the environmental performance between Sorwathé and Mulindi factory and contribution of the VSS implementation to this.
Research Questions The research questions stated in this sub-chapter are a systematic breakdown of the main problem statement. Together, the answers to these questions was provide the answer to the main problem. The research questions are;
1. How does the implementation of the VSS affect the performance tea production in Rwanda? 2. What is the relationship between performance of Mulindi and Sorwathé and how can this be
attributed to the implementation of VSS project?
Justification of the Study. Voluntary sustainability standards have the potential to generate significant environmental, economic and social benefits in developing countries and may have different implications for production, processing, retail and consumption in both developing and developed countries(UNFCC, 2013). Even though the environmental performance measurement is not as straight forward as the financial performance measurement, it can still be conducted by illustrating several different aspects of the environmental performance (Schmidt 2012). These are for example the CO2-Footprint, the Water Consumption Index and the Energy Consumption, which are presented by each one figure having the same unit. There is therefore a need for an evaluation of the effects of implementing VSS projects in the tea sector Rwanda especially in relationship to environmental performance which is one of their key selling points. This study aims to be to be a pace setter for similar studies to be embarked on the sectors in relation to other performance parameters (Economic and Social). This study informs and forms a key basis of reviewing the current sustainable agricultural practices as exemplified by the implementation of the VSS projects in the tea sector in Rwanda. The information gathered can be used to improve the tea sector in Rwanda and the country in general as it focuses towards implementation of green economy.
Significance of the Study. Current information's shows that there is a growing public awareness in the European Union (EU) and America of the social and human conditions associated with tea cultivation, and consumers are increasingly seeking to buy certified teas under various major certification schemes which include Fair-trade, Organic, Rainforest Alliance and UTZ. The market share of certified teas has grown from just 1% in 2007 to a projected 13% of global production by the end of 2011.The three biggest buyers of tea Unilever 12 %, Tata Tea 4 % and Twinings 3%, all have committed to ensuring purchase of sustainably produced tea and have all had almost 100% certification of their production lines since 2010 (Groosman, 2011).

ISSN: 2411-5681 www.ijern.com
444
Scope of the study. The scope of this study is the tea sector in Rwanda with a focus on two tea processing units (Mulindi and Sorwathé).
Literature/Theoretical underpinning. World Tea Economy World black tea production was projected to grow by 1.7 % annually from 2003 to reach 2.7 million tonnes in 2014, mainly due to improved yields as a result of high uptake of good agricultural practices (GAP) by farmers among countries in Africa. A significant growth in output was expected as tea bushes reached optimum producing age and smallholder skills were to be maximized through intensive capacity building (FAO- Intergovernmental meeting on tea, 2005). Waweru (2012) notes that the world black tea exports were projected to reach 1.3 million tonnes in 2014, reflecting an average annual increase of 1.4 percent per year from 2003. About half of the increase would originate in Africa, where production is likely to continue to grow while domestic consumption remains small. Rwanda Tea industry. Tea growing in Rwanda started in 1952. Since its introduction, tea production has increased steadily, from 60 tons of black tea in 1958, to 1,900 tons in 1990, to 14,500 tons in 2000, reaching a peak of 17,800 tons in 2001. Over 90% of the production is exported, but represents only a small share of the total volume traded in the international market, which is about 1.4 million tons representing a World share of 0.5%.Rwanda tea is planted on hillsides at high altitude (between 1,900 and 2,500 m), and on well drained marshes at an altitude of between 1,550 and 1,800 m. Tea is grown on 11 estates. A total area of approximately 12,500 ha is planted in the provinces of Byumba, Cyangugu, Gikongoro, Gisenyi and Kibuye. World Bank (2011), shows that Rwanda produces one of the highest quality teas in the world.
Voluntary sustainability standards (International standards). They are various international VSS sustainability initiatives that have emerged over the last decades which have broader multi-stakeholder participation. The stakeholders participating in the development of these VSS include the private sector, governments, intergovernmental agencies, multilateral institutions amongst other. The last decade has also shown many national governments and multilateral institutions having also initiated or played a key role in developing and driving the use of standards which are very well linked with the internationally accepted VSS.
The ITC standard map shows the presence of over 150 VSS with the sectors search indicating a total of 46 standard that relate to the area (www.standardsmap.org).IFC summarizes the different standard types as follows:

International Journal of Education and Research Vol. 3 No. 9 September 2015
445
Table 1: Types of VSS
Type of VSS Commons Standards Public ISO; MTCS ,(Malaysia),Lestari Tea; Organic standards Private & precompetitive
Global G.A.P.; SQF 1000; Starbucks C.A.F.E.; BSCI; Nespresso; SAI ( Social Accountability International)
Multi-stakeholder FSC; SPO; RTRS; RSB; 4C; BCI; UTZ Certified; FLO; Bonsucro; RA; MSC (Marine Stewardship Council)
Financial IFC Performance, Standards; Equator Principles; FSC. Source ITC standard map 2014
International standards adopted in the tea sector Some of the voluntary standards and their key attributes and objectives in the tea sector in the East African region include the following:
Table 2: VSS and their key attributes.
VSS Key attributes and objectives Ethical Tea Partnership (ETP
ETP began work in 1997 Vision of a socially just and environmentally sustainable tea
sector. Rainforest Alliance Certified
Began working with tea farmers in 2006 Environmental, social and economic standards set by the
Sustainable Agriculture Network (SAN) The SAN standards have a special emphasis on workers and
wildlife. UTZ CERTIFIED
Industry-producer partnership which has recently expanded its certification program to the tea sector. With a focus on traceability.
Organic
Strong emphasis on the protection of wildlife and the environment.
Often dual certified, matching organic with other certification schemes.
Fair trade Focus on poverty reduction and sustainable development. Good manufacturing/agricultural practices (GM/AP)
In order to meet these standards, good agricultural/ hygiene practices are done in the field and good manufacturing/hygiene practices in the factory.

ISSN: 2411-5681 www.ijern.com
446
VSS Key attributes and objectives 1SO (International Organization for Standardization)
ISO is the world's largest developer and publisher of International Standards.
ISO International Standards ensure that products and services are safe, reliable and of good quality. For business, they are strategic tools that reduce costs by minimizing waste and errors and increasing productivity. They help companies to access new markets, level the playing field for developing countries and facilitate free and fair global trade.
Source: Fair trade 2010 and ISO Standards websites
Theoretical Framework. The study is based on the key concepts of the three sides to sustainable agriculture which are that sustainable agriculture (leads to protection of environment, has key social impacts and leads to economic benefits) and the fact that it's a well-documented fact that sustainable production makes good business sense.
Sustainable agricultural practices and programs can help businesses ensure a reliable supply of food and open up new opportunities at the same time such as enhancing brands and meeting new market demands. As awareness is growing amongst business operators, sustainable sourcing has become a point of differentiation in the marketplace. Moreover, the consumers they serve are increasingly concerned about where their food comes from and pay great attention to whether it is produced in a responsible way, from farm to fork.
Sustainable agriculture has environmental, social and economic dimensions and all three must be considered together.
Protecting and improving the natural environment are fundamental, and issues like climate change, energy, water scarcity, pollution, and biodiversity and soil degradation need to be addressed.
The social dimension covers labor rights and the health of communities, including access to and affordability of food, labor rights and community health. Food quality, safety and animal welfare are also important social aspects.
On the economic side, sustainable agriculture is productive, efficient and competitive. The benefits should be seen in farm profitability, in thriving local economies, and throughout the whole value chain
Conceptual Framework.
The State-of-Knowledge Assessment of Standards and Certification (2012) study developed a model showing how the standards and certification system shows how these systems affect the practices and performance of producers, leading to impacts beyond the farm or enterprise level. COSA, 2008 further shows that the main categories covered by COSA’s environmental analysis include measures on:

International Journal of Education and Research Vol. 3 No. 9 September 2015
447
• Energy management (amount and kinds of energy used); • Water management (evidence of water conservation practices); • Soil resource management (erosion and coverage or prevention); • Biodiversity and resource management (percentage, quality and diversity); • Pollution reduction (record keeping, products and chemicals applied, IPM); • Recycling and re-using (systems in place); and • Carbon sequestration (vegetation density and quality).
This coupled with the model adopted from UNFSS and IFC (figure 4) have been used to conceptualize the needs for this study. As the study cannot cover all the aspects of sustainability and key specific indicators was be covered in this study as shown in the conceptual framework was be limited to the VSS impacts on the environmental performance measured through four key specific indicators: Water Use Energy use, Pollution impacts and biodiversity conversation. For this study the following conceptual frame work has been adopted. Independent variables Dependent variables
Figure 1: Conceptual framework
Key Literature gaps IFC 2014 study shows that there are no systematic studies are available to determine whether VSS succeed in keeping the worst environmental practices off the market (e.g. deforestation) and ensuring compliance with national environmental legislation (e.g. on conducting environmental impact assessments to acquire permits). Though the same study notes that there is evidence indicates that certification (Implementation of VSS projects) leads to adoption of more environmentally benign practices.
RESEARCH METHODOLOGY
Research Approach The main purpose of this study was to gain the deeper knowledge about the research problem but also describe the effects of implementation of the international standards VSS project’s to the environmental performance of the tea sectors in Rwanda. This study uses a mixed methods research design through using quantitative and qualitative data. A mixed methods research design has many advantages, the main one being that it gives the opportunity of triangulation (Mikkelsen,
Voluntary Sustainable Standard Projects
Environmental performance. Protection of biodiversity. Less pollution. Less energy use Reduced water consumption

ISSN: 2411-5681 www.ijern.com
448
2005).Literature was reviewed from scientific books, journal articles, and through project documents.
Type of data to be collected and used. Primary Data The primary data was collected through a questionnaire which was used to gather information on the current performance of the two operational Units with environmental data on water, energy (fire wood, fuel and electricity), Waste and Biodiversity being collected. This was done through Face to face Interviews at the factory premises and with. In addition to this NAEB was interviewed as the key informant.
Secondary data Various global reports on the impacts of VSS to the performance of the sector were sourced (research reports, textbooks analysis and website reviews) were used to either confirm or negates whatever the research findings the study got and reviewed.The data that reviewed includes as noted categorized into three namely: Global trends, Regional and National.
Data analysis The research study has generated two key types of data be collected in this baseline survey- Quantitative data and Qualitative data. The data collected was processed and analyzed in table forms, thematic areas and statically.The Quantitative data analyzed by using Statistical Package for the Social Sciences© (SPSS) 18. Outcome is generation of analysis tables, means, medians, frequencies, cross-tabulations, Percentages and descriptive representations of various statistical parameters. Correlation analysis has been adopted to test the relationship between the effects of implementation of VSS and the performance of the tea processing unit. And the Students T test was be used for comparison of difference in two means for the two firms in terms of environmental performance.
RESEARCH FINDINGS AND DISCUSSION For the two firms (Sorwatea and Mulindi tea factories) it was noted to have had implemented two standards in common the Good manufacturing /agricultural practices (GM/AP) and the FSMS (ISO 22000). In overall the study confirmed that Sorwatea has in place 8 VSS out of possible 11(88%) that were being reviewed as compared to Mulindi Tea factory which has only 2 (22%) as shown in table 4.
Table 3 :Extent of Implementation of VSS project in the Sorwatea and Mulindi
No VSS Year Implemented Sorwatea Mulindi
1 Ethical Tea Partnership (ETP) 2009 N/A
2 Rainforest Alliance 2012 In the initial implementation stage.
3 UTZ CERTIFIED NA N/A
4 Organic Certified 2012 N/A

International Journal of Education and Research Vol. 3 No. 9 September 2015
449
No VSS Year Implemented Sorwatea Mulindi
5 Fair Trade 2006 N/A
6 Good manufacturing /agricultural practices (GM/AP)
2009 2009
ISO (International Organization for Standardization)
7 QMS 2007 N/A
8 EMS NA N/A
9 OHS NA 2000
10 FSMS 2009 2010
11 RBS mark of Excellence 2011 NA
Source: Field Data 2015.
Objective Three and Four: Relationship between the adoption of the VSS projects and environmental performance and the comparison of environmental performance between Sorwathé and Mulindi. This being a comparative study it is particularly important to be clear about the levels and units of analysis. In this study the unit /indicators used were; Black tea Production in kgs, water usage per kg, Electricity used for tea production (kwh/kg), firewood used for tea productionM3//Kg, Diesel used for tea production, and Biodiversity increase as shown by the increase of Flora or Fauna. In 2011, the ISEAL Alliance published the results of a survey of 100 thought leaders on motivations for engaging with certification. Results showed that VSS are becoming a widely used tool to implement corporate social and environmental responsibility (IFC 2014). Comparison of production Data Table 4 : Production data of the two Sorwatea and Mulindi tea factories
Year Sorwatea Mulindi 2011 3302848 3,508,446 2012 2834200 3,024,264 2013 3025298 2,912,786 2014 3384936 3,551,460
Source: Field data 2015
Table 4 and figure 2 shows that the production between the two organizations is similar in terms of quantity of black tea produced in the last four years 2011 to 2014. Therefore it would be easy and fair to conclude that any reduction and difference in consumption of inputs would be due to other factors but not the quantity of tea being produced.

ISSN: 2411-5681 www.ijern.com
450
Figure 2: Comparison of Black tea Production between Sorwatea and Mulindi
Table 5 Difference on of tea production at Sorwatea and Mulindi factories
t-Test: Two-Sample Assuming Equal Variances Variable 1 Variable 2 Mean 3249239 3136686 Observations 4 4 Hypothesized Mean Difference 0
df 6 t Stat 0.543194 P(T<=t) one-tail 0.303286 Not Significant
P(T<=t) two-tail 0.606571 Not Significant
Further statistical analysis (table 5) of the production of Mulindi and SORWATEA shows that statistically there difference observed is not significant. Hence this affirms the observation that statistically the researcher is confident enough to say the two companies have the same production of black tea even if other cost, inputs and outputs (e.g. waste) are different from one another to produce a given quantity of tea.
Comparison of Key Environmental Indicators Water Use in Sorwatea and Mulindi. The results show that the two factories get water from their own sources though Mulindi started to meter their water consumption earlier than Sorwatea. Sorwatea informed the researcher that their water metering was due to the requirements of one of the VSS’s they have implemented.

International Journal of Education and Research Vol. 3 No. 9 September 2015
451
Table 6: Quantity and Source of Water used in M3/per year in Sorwatea and Mulindi Company Source /Year 2011 2012 2013 2014
Sorwatea Own Source in M3 NA 27,493 29,345 32,192.50
Mulindi Own Source in M3 4,800 4,460 3,800 5,100
Source: Field Survey 2015
Table 6 shows that the two companies source their own water and the absolute water quantities of water used. Though Sorwatea in terms of volumes uses more water this could be attributed to various other issues like more personal capacity of the Factory amongst others. Study results show that for the two organization employees were trained on the need for reducing the use of water in the two organizations, though at Sorwatea the researcher noted that they were very elaborate measures are in place to ensure water conservation was undertaken at all point of production .
Figure 3: Tea production vs water usage at Sorwatea and Mulindi
Table 7 shows that Sorwatea has a higher water average use per kgs of tea produced but the most critical is that the trend over the four yeas shows a lower water consumption. Table 8 does further analysis to see if this difference is significant or not.
Table 7: Average Water Use per Kg of tea (L/kg) at Sorwatea and Mulindi factories 2011 2012 2013 2014 Sorwatea NA 9.7 9.7 9.5 Mulindi 1.4 1.5 1.3 1.4
Source: Field Survey 2015
0
5000
10000
15000
20000
25000
30000
35000
40000
45000
50000
0
500000
1000000
1500000
2000000
2500000
3000000
3500000
4000000
2011 2012 2013 2014W
ater
in M
3
Qua
ntity
of T
ea p
rodu
ced
Years
Production and water usage over four years period
Production in Sorwatea Production in Mulindi T FWater in Sorwatea Water in Mulindi T F

ISSN: 2411-5681 www.ijern.com
452
Table 8: Difference on water use between Sorwatea and Mulindi factories
t-Test: Two-Sample Assuming Equal Variances
Variable 1 Variable 2
Mean 9.633333 1.4 Variance 0.013333 0.006667
Observations 3 4 Difference 5
t Stat 111.5832 P(T<=t) one-tail 0.0000 P(T<=t) two-tail 0.0000
From the observation of the data above table 13, it is observed that there is difference between water used per Kg of tea production between SORWATEA and MULINDI Tea Factory, but the Question is to know if this different is significant or no. By testing this equality assuming that the mean number of Liters used per Kg is equal and that the variance of the two companies are equal (T-test assuming equal variance), its observed that this difference is statistically significant at 0.05 (P value <0.05).
Energy indicators and measures Energy is a critical input for tea manufacture and it’s a key indicators of the environmental performance of tea factory depending on its consumption and mechanism that have been put in place to use it efficiently. They are three sources of energy in the tea sector Thermal, Fossil Oils (diesel) and Electricity. Thermal energy is required to remove the moisture from the green leaf as well as fermenting tea, whereas electrical energy is required at almost all stages of unit operations( running equipment’s) and for lighting, fuel is used to run the generators and for transportation of tea from the farms. It was well noted that for the two organizations staff awareness sessions were held and continue to be held with the key objective of training them on minimizing energy usage. The key difference of the energy usage in the tea sector is improved efficiency (energy conservation and energy management)) which VSS projects do assist in.
Firewood use at Sorwatea and Mulindi factories
Table 9 and figure 4 shows a comparison of the quantity of firewood used by the two factories vis a vis the production for period of five years. Firewood is used for the heating steam generation as the two firms use wood-fired steam boilers to generate heat in order to reduce the cost of tea production. Fuel wood use is dependent on various factors like boiler type and efficiency, the calorific value of the wood amongst others the two factories use mainly eucalyptus as source of the wood fuels which is expected to have the same characteristics. The results show that Mulindi uses more volume of Firewood in comparison to Sorwatea though the production of tea are almost similar. This could be attributed the efficiency of the boilers, the distribution systems of the generated steam where Sorwatea has an efficient leak free systems (due to robust maintenance systems), amongst other energy management measure that have been put in place.

International Journal of Education and Research Vol. 3 No. 9 September 2015
453
Table 9: Quantities of firewood used in M3 at Sorwatea and Mulindi
2010 2011 2012 2013 2014
Sorwatea M3 7952.72 7595.25 10797.49 9548.5 9758
Mulindi M3 NA 18,422 14,219 13,426 16,263
Source: Field Survey 2015.
Figure 4 : Firewood usage and tea production for Sorwatea and Mulindi.
Average use of firewood. The observation of the average use of firewood (table 10) shows for the two factories there is variance in the volumes of used. The trend on overall shows a decrease in the average volume of Firewood used at Sorwatea but a constant usage at Mulindi. Table 10: Average Firewood used in M3/kg at Sorwatea and Mulindi factories.
Year 2010 2011 2012 2013 2014
Sorwatea
M3/Kg 358.04
434.86 262.49 316.83 346.83
Mulindi M3/Kg NA 190.45 212.69 216.95 218.38
Source: Field Survey 2015
In order to test of the difference in this numbers had to be undertaking order to see if they are significant different as shown in table 11.
0
5000
10000
15000
20000
25000
30000
0500000
1000000150000020000002500000300000035000004000000
2011 2012 2013 2014
Fire
woo
d in
M3
Prod
uctio
n in
Kg
Years
Firewoods usage and tea production
Production in Sorwatea Production Mulindi T. F
Fire woods in Sorwatea. Fire woods in Mulindi TF

ISSN: 2411-5681 www.ijern.com
454
Table 11: Difference of firewood use at Sorwatea and Mulindi
t-Test: Paired Two Sample for Means
Variable 1 Variable 2
Mean 340.2525 209.6175 Variance 5196.487 169.1268 Observations 4 4 Hypothesized Mean Difference 0
df 3 P(T<=t) one-tail 0.025317 P(T<=t) two-tail 0.050634 t Critical two-tail 3.182446
The table 11, shows that there is significant difference in the amount of firewood used by the two firms taking into account that the tea production has been shown not to be significantly different. From the results it can be accepted that the mean number of M3 for Firewood used for a given production per Company are equal as significant level is slightly greater than 0.05 (The mean difference is equal to Zero) we are statistically confident to accept the Null hypothesis that the implementation for the VSS has led to Sorwatea performing better than Mulindi due to implementation of VSS projects.
Fuel Usage at Sorwatea and Mulindi factories. Fuel/Diesel as noted is used run the generators and also for transport that is use was be dependent on number of factors e.g. the number of electricity cuts in the area, the efficiency of the generators, and the maintenances of the generators amongst others. The VSS project have been known to lead to improvement of the generators functioning due to better maintenance schedules ,proper record keeping, good planning on transportation of goods amongst others. Table 12 and figure 5 shows the volumes of fuels used by the two firm’s annually where Mulindi is shown to use less fuel than Sorwatea.
Table 12: Volume of Diesel used by Sorwatea and Mulindi annually.
2010 2011 2012 2013 2014
Sorwatea 65,192 63,316 20,071 46,872 54,196
Mulindi NA 11,843 6,610 13,816 14,456
Source: Field Survey 2015
Table 12 and figure 5 shows that the trend in two factories is varied though the year 2012 has the lowest fuels use for the two firms. The trend though is more or less constant and this could be explained by the constancy of the total tea production within the same period.

International Journal of Education and Research Vol. 3 No. 9 September 2015
455
Figure 5: Fuel (diesel) is used for running the generators vs the production at Sorwatea and Mulindi factories
Table 13, shows that the average fuel usage L/Kg tea produced is higher at Mulindi than at Sorwatea. This could be explained by a number of factors ranging from efficiency of production, area coverage’s where they companies get their tea from, electricity connectivity and stability among many others. Table 14 shows further analysis of the difference to see if it’s of any significance.
Table 13 : Average fuel usage for production of tea (L/kg) Sorwatea and Mulindi factories 2010 2011 2012 2013 2014
Sorwatea L/Kg 43.68 52.16 141.21 64.54 62.45
Mulindi L/Kg NA 296.25 457.53 210.83 245.67
Source: Field Survey 2015
The trend above shows that Sorwatea apart from 2012 (and the case is similar to Mulindi ) where there was a sharp fuel increase which was explained by constant power cuts have a more gentle reduction and constancy in the average fuels usage.
Table 14 Difference in for fuel usage at Sorwatea and Mulindi.
t-Test: Two-Sample Assuming Equal Variances Variable 1 Variable 2
Mean 80.09 302.57 Variance 1689.57 11902.13 Observations 4 4
0
10000
20000
30000
40000
50000
60000
70000
0
500000
1000000
1500000
2000000
2500000
3000000
3500000
4000000
2011 2012 2013 2014
Fuel
in m
3
Prod
uctio
n in
Kg
Years
Fuel and Tea Production
Tea Production in SORWATEA Tea Production in SORWATEA
Diesel used in SORWATEA Diesel Used in MULINDI T F
ISSN: 2411-5681 www.ijern.com
456
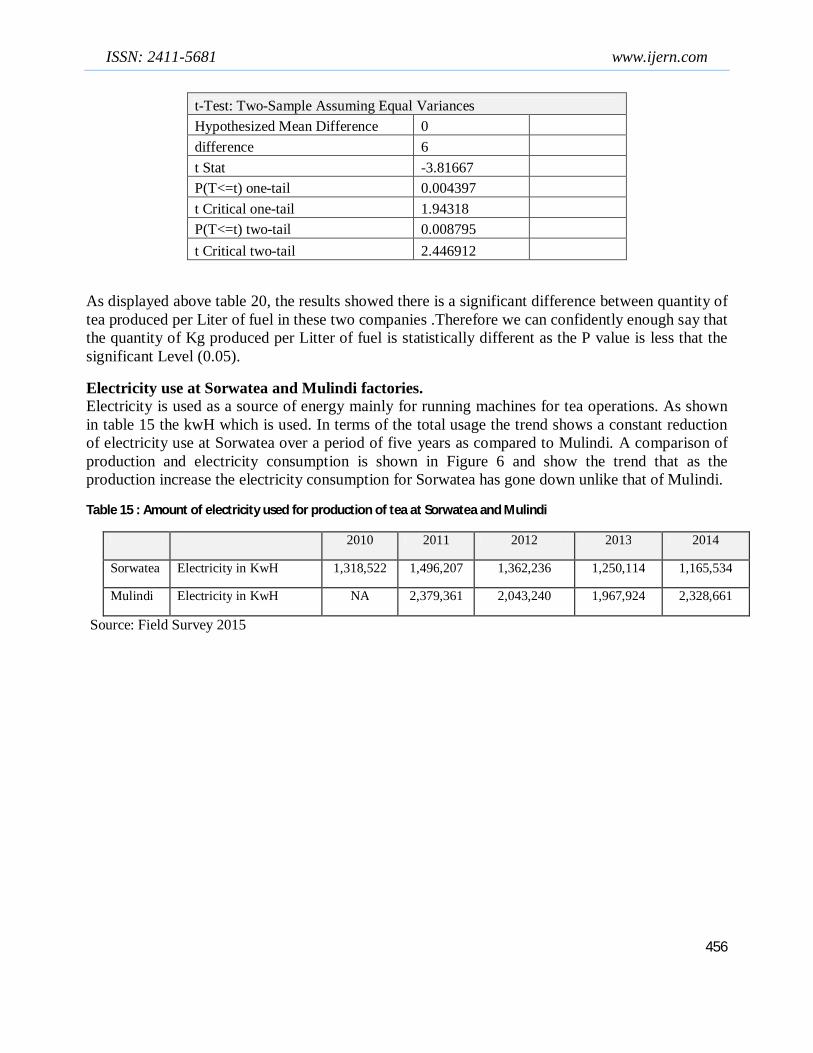
t-Test: Two-Sample Assuming Equal Variances Hypothesized Mean Difference 0
difference 6 t Stat -3.81667 P(T<=t) one-tail 0.004397 t Critical one-tail 1.94318 P(T<=t) two-tail 0.008795 t Critical two-tail 2.446912
As displayed above table 20, the results showed there is a significant difference between quantity of tea produced per Liter of fuel in these two companies .Therefore we can confidently enough say that the quantity of Kg produced per Litter of fuel is statistically different as the P value is less that the significant Level (0.05).
Electricity use at Sorwatea and Mulindi factories. Electricity is used as a source of energy mainly for running machines for tea operations. As shown in table 15 the kwH which is used. In terms of the total usage the trend shows a constant reduction of electricity use at Sorwatea over a period of five years as compared to Mulindi. A comparison of production and electricity consumption is shown in Figure 6 and show the trend that as the production increase the electricity consumption for Sorwatea has gone down unlike that of Mulindi.
Table 15 : Amount of electricity used for production of tea at Sorwatea and Mulindi
2010 2011 2012 2013 2014
Sorwatea Electricity in KwH 1,318,522 1,496,207 1,362,236 1,250,114 1,165,534
Mulindi Electricity in KwH NA 2,379,361 2,043,240 1,967,924 2,328,661
Source: Field Survey 2015

International Journal of Education and Research Vol. 3 No. 9 September 2015
457
Figure 6 : Electricity usage vs tea production at Sorwatea and Mulindi.
Table 16: Average annual electricity Sorwatea and Mulindi factories
2010 2011 2012 2013 2014
Sorwatea KwH/Kg 2.16 2.21 2.08 2.42 2.90
Mulindi KwH/Kg NA 1.47 1.48 1.48 1.53
Source: Field Survey 2015
Table 16 shows considering the average quantity of electricity used to produce tea, we observe a difference between the quantities produced per KwH even though this number has slightly changed within this period of four year. Mulindi has a lower electricity usage (KwH) per kg as compared to Sorwatea. This could be explained by the results shown in Table 18 where the fuels usage as higher for Mulindi which could imply more usage of generators as compared to Sorwatea.
Table 17 : Analysis of Differences between electricity use of Sorwatea and Mulindi
t-Test: Two-Sample Assuming Equal Variances Variable 1 Variable 2
Mean 2.4025 1.49 Variance 0.129625 0.000733 Observations 4 4 Hypothesized Mean Difference 0
Difference 6 t Stat 5.054678
05000001000000150000020000002500000300000035000004000000
0500000
1000000150000020000002500000300000035000004000000
2011 2012 2013 2014
KWT
Prod
uctio
n in
Kg
Years
Electricity Usage and Tea Production
Tea Production in SORWATEA Tea Production IN MULINDI T F
Electricity in SORWATEA Electricity in MULINDI T F

ISSN: 2411-5681 www.ijern.com
458
t-Test: Two-Sample Assuming Equal Variances Variable 1 Variable 2
P(T<=t) one-tail 0.001161 t Critical one-tail 1.94318 P(T<=t) two-tail 0.002323 t Critical two-tail 2.446912
Comparing these companies, table 17, we observe a statistical difference between the quantity produced in SORWATEA and MULINDI Tea Factory per KwH. Therefore we can conclude that the mean Kwh used Kg of tea produced is different within this two companies at 0.05 level of precision.
Biodiversity restoration and balance.
Biodiversity has become an increasingly important environmental impact to consider in environmental assessments. Loss of biodiversity is one of today’s most important environmental issues, both nationally and globally. There is significant biodiversity loss when high biodiversity areas such as forests are converted to tea plantations. Along with habitat conversion, logging for firewood to process tea, in particular, has causes extensive deforestation. Thus biodiversity regenerations and conservation is a key element and indicator of environmental sustainability and performance.
As noted wood fuel being the major energy source at the factories, all factories is expected to have adequate source of wood fuel, and implement sustainable wood fuel planting and harvesting policies. The study results show that Sorwatea which has implemented VSS has had a continuous program for biodiversity improvement through continued planting of trees (leading to increase in number of species) to replenish what is harvested on an yearly basis (Eucalyptus and Grievellia) for the use as firewood but also to increase the biodiversity through the planting of indigenous trees (mixed trees species) as shown in table 18, 19, 20 and 21 below.
Table 18 : Wood harvested and Planted trees in Sorwatea and Mulindi factories
2011 2012 2013 2014 Company Total wood harvested Sorwatea Total wood harvested in M3 7595 10797 11144 9370 Mulindi Total wood harvested in M3 6268 2846 1151 6951
Source: Field Survey 2015
Table 19: Total number of trees planted at Sorwatea and Mulindi factories
2011 2012 2013 2014
Sorwatea Total number of trees planted 36102 29812 27895 41689
Mulindi Nil Nil Nil Nil
Source: Field Survey 2015.

International Journal of Education and Research Vol. 3 No. 9 September 2015
459
Table 20 shows that Sorwatea has consistently been planting trees over the last four year period of study. This is unlike Mulindi where there was no evidence of them doing this. The researcher was informed that the last time Mulindi planted trees was in the year 2006. Sorwatea was noted to have a well-defined Biodiversity management policy as guided by some of the VSS project’s that they have implemented. This was noted to have led to increase in the Flora and Fauna in the area. Unilever 2003, Sustainability report shows that Productive fuel wood plantations have an important role in building self-sufficiency in renewable energy resource and Eucalyptus is retained as the principle genus for fuel wood production as it has been done by Sorwatea and Mulindi.
Table 20 : Variety of trees planted at Sorwatea and Mulindi factories
Type of trees and year 2011 2012 2013 2014 Sorwatea Eucalyptus 31,577 28,098 23,665 39,089 Grevellia 4,525 1,724 4,230 2,600 Indigenous tree 2000 7779 2787 654 Mulindi Eucalyptus Nil Nil Nil Nil Grevellia Nil Nil Nil Nil Indigenous tree Nil Nil Nil Nil
Source: Field Survey 2015
Table 20 shows there is a general increase in the Fauna in the Sorwatea area due to consistent planting of trees. Critical to this as shown above is that Sorwatea not only plants the Fuel wood trees but has also been planting a variety of indigenous trees within their catchment. Unilever 2003 Sustainability report shows that indigenous trees play a critical role in our environment, as a component of water catchment areas (assist water retention and stabilize soil profiles) and as a contributor to biodiversity.
Waste generation and management at Sorwatea and Mulindi factories. This is another indicators that the study used in order to order to review the impacts of VSS. Though it was noted that some aspects of waste management are undertaken in the two firms as shown in the tables below Sorwatea was noted to have a more robust system for both Solid and waste water management in comparison with Mulindi. Wouapi and Maimo 2006 note that an effective approach to improved environmental performance and effluent management comprises the integration of concepts related to end-of-pipe treatment and cleaner production. But these waste (effluent) management practices must be incorporated into the overall corporate management policy and as such constitute an environmental management system. An EMS has been noted to be is a voluntary tool used by enterprises to improve their environmental performance and ensure environmental legislation compliance. Sorwatea was noted to be participating for the last two years on a program with Rwanda Resource Efficiency and Cleaner Production Centre (RRECP).
ISSN: 2411-5681 www.ijern.com
460
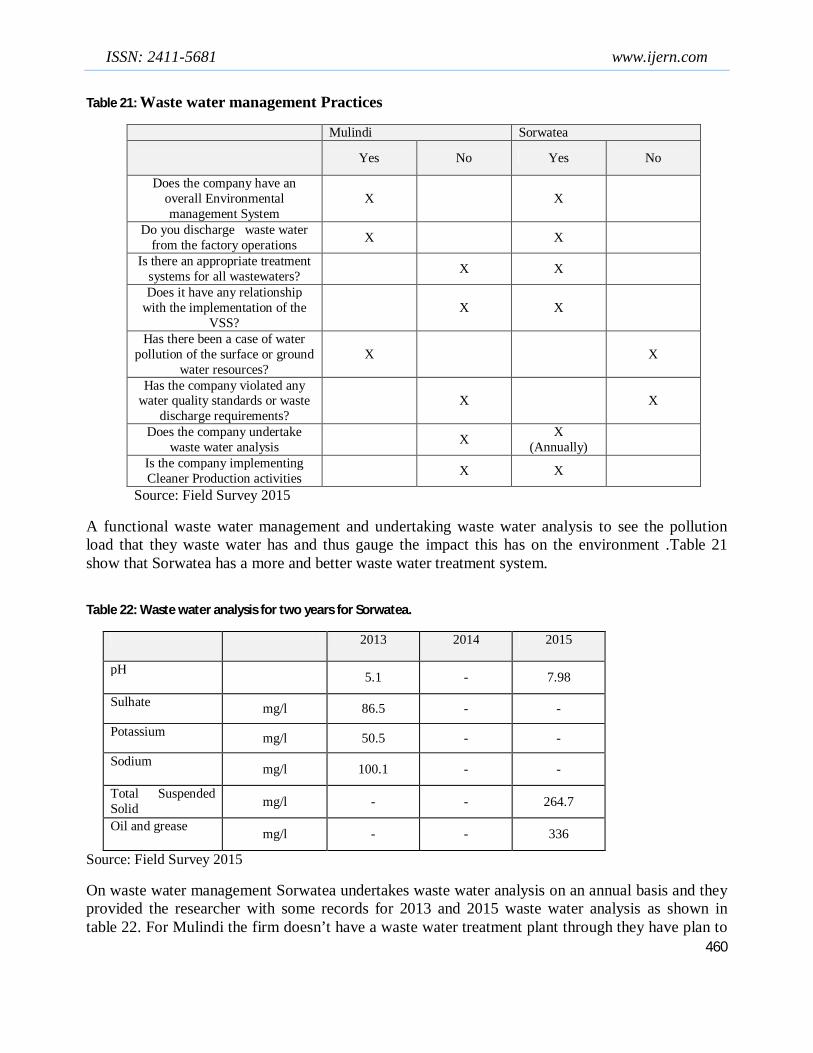
Table 21: Waste water management Practices
Mulindi Sorwatea
Yes No Yes No
Does the company have an overall Environmental management System
X X
Do you discharge waste water from the factory operations X X
Is there an appropriate treatment systems for all wastewaters? X X
Does it have any relationship with the implementation of the
VSS? X X
Has there been a case of water pollution of the surface or ground
water resources? X X
Has the company violated any water quality standards or waste
discharge requirements? X X
Does the company undertake waste water analysis X X
(Annually)
Is the company implementing Cleaner Production activities X X
Source: Field Survey 2015
A functional waste water management and undertaking waste water analysis to see the pollution load that they waste water has and thus gauge the impact this has on the environment .Table 21 show that Sorwatea has a more and better waste water treatment system.
Table 22: Waste water analysis for two years for Sorwatea.
2013 2014 2015
pH 5.1 - 7.98
Sulhate mg/l 86.5 - -
Potassium mg/l 50.5 - -
Sodium mg/l 100.1 - -
Total Suspended Solid mg/l - - 264.7
Oil and grease mg/l - - 336
Source: Field Survey 2015
On waste water management Sorwatea undertakes waste water analysis on an annual basis and they provided the researcher with some records for 2013 and 2015 waste water analysis as shown in table 22. For Mulindi the firm doesn’t have a waste water treatment plant through they have plan to

International Journal of Education and Research Vol. 3 No. 9 September 2015
461
construct one whereas there was no evidence of a waste water treatment unit or analysis at Mulindi. A further probe to the activities at Sorwatea informed the researcher that the waste water analysis was undertaken as part of the fulfillment of the requirements of one of the VSS project and also to meet the legal requirements on the same. Though doesn’t reflect on the key parameters that the study expected to use but it show positive improvements.
Solid waste management Sorwatea was noted to have a more elaborate systems for Solid waste as shown in table 23. With a more elaborate system.
Table 23: Type of waste produces and its treatment at Sorwatea and Mulindi Type of waste How waste is managed
Mulindi Sorwatea Paper Composted Burned in the boiler as fuel
Metal Sold as scrap Sold as scrap for recycling Organic Waste Used as compost Used as compost and taken back to the farm for
organic farming. Plastic/polythene Earth fill Sent for recycling in Kigali.
Glass No Defined action Stored in the factory Source: Field Survey 2015
The table 23 above shows the type of solid waste generated and the way they are waste and the way they are treated well shows the impact that implementation of VSS has had to Sorwatea on this indicators in comparison to Mulindi. It was well observed that the Solid waste management system at Sorwatea is elaborate. With the following was confirmed to be undertaken at Sorwatea Identification of waste types being generated by the operations of the organization Quantification of each type of waste generated per unit time. All waste generated was disposed of in an environmentally conscious manner e.g. Recycling
of waste, compositing, reuse.
Sorwatea informed the researcher that though they have had secondary data of waste records from the third party that they sell some waste to their records have not been very clear though clear records are being put in place as from 2015. For Mulindi no data is available at all on the solid waste management the company produces.
Conclusion of the analysis results The aim of this chapter was to present the results and analysis of the quantitative and qualitative research of this study. The study well shows that there is positive correlations between environmental performance and the implementations of the VSS projects on the various indicators that have been surveyed.
Sorwatea has implemented the most VSS project in the Rwandan tea Sector and the results of this are shown in improved environmental performance over the years (2010- 2014) as compared to Mulindi which is just starting to implement this. The study shows that implementation of VSS project’s lead to a processing firm to put in place a corporate environmental management System. A survey by COSA 2014 shows that the Environmental Criteria Coverage of VSSs on average is 66

ISSN: 2411-5681 www.ijern.com
462
% for the following parameters/indicators ;Soil, Waste, Synthetic inputs, Water, GMO prohibition, Biodiversity, Energy Greenhouse gas which the researcher has also used for this study. It is therefore can be concluded that implementation of VSS propjet’s is a key driver to attaining improved environmental performance in the tea sector in Rwanda CONCLUSIONS AND RECOMMENDATIONS The present study aimed to Assesses the implementation Voluntary Sustainability Standards Project on the Environmental performance of the Tea sector in Rwanda. The comparative study was undertaken because it was well found out that Sorwatea leads in the implementation of the VSS project’s in Rwanda and Mulindi is still lagging behind on this.
By reviewing the key environmental indicators used, reviewing the previous studies and the interviews with the implementers of the VSS project in the two firms, this research study has identified that there a positive influence on Environmental performance due to implementation of VSS project in tea firms in Rwanda.
The study well noted that continued implementation of the VSS project of different nature assist in overcoming some the challenges that firms have in the implementation of this project The experience obtained in VSS projects implementation especially conducing that they build on each other (and have the triple sustainability functions) lead to enhanced implementation performance with time.
This research further contributes to the closing of the gap in the knowledge of implementation of VSS projects and environmental performance in Rwanda tea sector. Further to this the research gives baseline knowledge for further areas of research which are not very clear. These research findings also set up a business case for implementation of the VSS projects in Rwanda especially taking into account the government green growth policy.
Implication to Research and Practice General
There has been no recorded previous study on the tea sector in Rwanda on the environmental performance of the tea sector in relation to implementation of the VSS project therefore this study greatly contributes to the environmental Knowledge field in the sector.
This research contributes to the closing of the gap in the knowledge of implementation of VSS projects and environmental performance in Rwanda tea sector. Further to this the research gives baseline knowledge for further areas of research which are not very clear. These research findings also set up a business case for implementation of the VSS projects in Rwanda especially taking into account the government green growth policy. The results are definitely expected to encourage the other tea factories to accelerate the implementation of the VSS projects in their firms.
The environmental performance and the Implementation of the VSS projects is not limited to the tea sector alone the same is applied in the coffee sector and many other crops. Thus this research forms a key learning document for the implementation of the VSS projects in other crops and sectors

International Journal of Education and Research Vol. 3 No. 9 September 2015
463
Recommendations from the research
To the tea Firms
Tea firms need to improve on their data collection to make it more Comprehensive and meaningful.
To overcome implementation challenges of VSS projects it is recommended that the processing firms could go for the implementation of more than one VSS project as they each build on each other, though they have difference emphasis of focus but all contribute to the enhancement of the sustainable agriculture and hence the overall performance of the firm
In order to also track performance vis a vis the benchmarks the tea firms need to come together and develop key bench marks that relate to specific indicators in Rwanda .e.g. Amount of water used to produce a kilogram of black tea , energy used etc. The government can also assist in this role.
It is crucial if the tea firms could develop a common forum where operational challenges would be shared and this would also be the best forum to exchange experiences and ideas on VSS implementation and promotion. To the government The government through the tea development agency NAEB was noted to have undertaken a key role in the initial implementation of the VSS project in various tea firms. Though the implementations of the VSS projects is voluntary theirs impacts to the country that has a green growth strategy are immense thus it is recommended that the government needs to play a more proactive role in continues implementation of the VSS in the tea sector. Recommendations for future research The study has covered a comparative analysis of only two firms to represent the whole of
the tea sectors further detailed analysis for the whole of the tea sector can be undertaken with the same perspective or a more.
The study analysis has only covered Rwanda but the secondary data shows that within the East African region there is similar trend it would be important for a comparative study of the tea sector in East Africa to be undertaken under the same parameters (environmental performance so as to review the impacts of VSS implantation in the region.
As the VSS project implementation are not limited to tea production only the same focus and further research can be undertaken for other crop and sectors which have relevance in the economy of Rwanda e.g. Coffee and also the tourism sector.
Since in this research various VSS have been reviewed and one of the key findings was that they are some VSS projects that are more dominant in the sector (Rani forest Alliance) a detailed analysis and study of the impacts of the implementation of this VSS to the three pillars of sustainability (Environment, Social and Economic) in Rwanda need further investigations.

ISSN: 2411-5681 www.ijern.com
464
References Andrew Scott (2011): A cup full of science and health ISO Focus. Amwayi Omukhweso WASIAM: The Role Of ISO Standards In Kenya’s Economy. Axel Marx and Jan Wouters: Competition and Cooperation in the Market of Voluntary
Sustainability Standards: UNFSS Discussion Papers No. 3, Leuven Centre for Global Governance Studies: Working Paper No. 135-April 2014.
Bart Doorneweert and YucaWaarts: Brewing business models for smallholder tea certification “A quick scan of models in Sri Lanka, Indonesia and Kenya” LEI Wageningen UR 2012. BSI 2013: How sustainability standards can drive business performance Cresswell, J. (2003). Research design. USA: Sage Publications. Christine Carey (2008) : The “Governmental Use of Voluntary Standards” Innovation in Sustainability Governance ISEAL Alliance D.D. Onduru, A. De Jager, S. Hiller and, R. Van den Bosch: Sustainability of smallholder tea
production in developing countries: Learning experiences from farmer field schools in Kenya: International Journal of Development and Sustainability Volume 1 Number 3 (2012): Pages 714-742
Denzin, N.K., 1989. Interpretive Interactionism. Stage, London, Dickson Malunda and Serge Musana(2012) : Rwanda Case Study on Economic Transformation Institute of Policy Analysis and Research – Rwanda (IPAR) Kigali, Rwanda. Daniele Giovannucci and Jason Potts with B. Killian, C.Wunderlich, G. Soto, S. Schuller, F. Pinard, K. Schroeder, I. Vagneron. 2008. Seeking Sustainability: COSA Preliminary Analysis of
Sustainability Initiatives in the Coffee Sector. Committee on Sustainability Assessment: Winnipeg, Canada.
Elizabeth Kalunda.(2014): Financial Inclusion Impact on Small-Scale Tea Farmers in Nyeri Country, Kenya: World Journal of Social Sciences Vol. 4. No. 1. March 2014 Issue. Pp. 130
-139 Economic, Social and Environmental Impact and Overall Sustainability of the Tea Manufacturing Industry in Sri Lanka 2013. FAO Regional Office for Asia and the Pacific (2008): A Practical Manual for Producers and
Exporters from Asia: Regulations, Standards and Certification for Agricultural Exports: Guy Salmon (2002): Voluntary Sustainability Standards and Labels (VSSLs): The case for Fostering Them: Organization for Economic Cooperation and Development (OECD) Gloria Otieno and Victor Ogalo (2009): Standards and Market Access under EPAs: Implications and Way Forward for EAC: CUTS Geneva Resource Centre: ISSD and IEED 2014: The State of Sustainability Initiatives Review 2014: Standards and the Green Economy: International Trade Centre (ITC -2008): Overview of Organic Agriculture in Rwanda and Options for Policy and Trade Development. Geneva: ITC, iv, 31 p. Jennifer Anne Keahey (2013): PhD Thesis’s Emerging Markets, Sustainable Methods: Political
Economy Empowerment in South Africa’s Rooibos Tea Sector Colorado State University Spring.
Jan Wasem Molenaar (Ed) 2013. Building a roadmap to sustainability in agro-commodity production: International Finance Corporation (IFC) Janaka Wijayasiri and Suwendrani Jayaratne(2011):Implications of agri-food standards for Sri
International Journal of Education and Research Vol. 3 No. 9 September 2015
465
Lanka: Case studies of tea and fisheries export industries: Asia-Pacific Research and Training Network on Trade Working Paper Series, No. 104, June 2011
Kenya Human Rights Commision 2008: A Comparative Study of the Tea Sector in Kenya: A Case Study of Large Scale Tea Estates. Loconto, A.M. and Simbua, E.F (2010): Organizing Smallholder Production For Sustainability:
Lessons Learned From Fairtrade Certification in Tanzanian Tea Industry ISDA 2010, Montpellier, June 28-30, 2010
Merlin Joseph (2010): PHD thesis. Problems And Prospects of Tea Plantation Industry in Kerala Cochin University of Science and technology,
Michael Groosman (2011): Tea Sector overview The Sustainable Trade Initiative (IDH): Mikkelsen, B.(2005): Methods for development work and research: A new guide for practitioners. SAGE Publications ltd. Michael D. Schmidt (2012): Master thesis Successfully Implementing Genuine &Strategic Approach to CSR Analysis of the Austrian Genussmittel Industry
Moore, SA (2010): The effect of knowledge sharing on the environmental performance of proactive environmental organizations', PhD thesis, Southern Cross University, Lismore, NSW.
Mohan Munasinghe, Yvani Deraniyagala, and Nisitha Dasanayake: SCI Research Study Report Murray, Thomas R., (2003): Blending Qualitative and Quantitative Methods in Theses and Dissertations, Corwin Press Ministry of Agriculture and Animal Resources (MINAGRI) and Office Du the- Rwanda Tea
Authority (OCIR) - 2008– A revised tea strategy for Rwanda 2009-2012- transforming Rwanda’s tea industry- December.
Peter Dauvergne and Jane Lister (2011): Big brand sustainability: Governance prospects and Environmental limits. Global Environmental Change pg 1-10 (www.elsevier.com) REPUBLIC OF RWANDA: Ministry Of Finance And Economic Planning: The Annual Economic Report Fiscal Year 2012/2013. REPUBLIC OF RWANDA: Economic Development and Poverty Reduction Strategy 2013-2018 Rwanda Development Board and Rwanda Tea Authority (2010): Opportunities for Investors in Rwanda’s Tea Sector Rwanda Education Alternatives For Children (Reach) Project 2012. Child Labor in the Tea
Sector: Case Study of Nyamasheke, Nyaruguru and Gicumbi, WINROCK INTERNATIONAL
Saunders, M., et al- (2007: 4th Edition): Research Methods for Business Students. Harlow, England: Pearson Education Limited. Sachin Gathani and Dimitri Stoelinga (2013): Understanding Rwanda’s Export Sectors: A Deep-
Dive Into Rwanda’s Merchandise Export Sector, Focusing on Destinations, And Products and Firms: International Growth Centre.
Sachin Gathani and Dimitri Stoelinga (2013): Understanding Rwanda’s Agribusiness and Manufacturing Sectors. The International Growth Centre. Savita Hanspal (2010): Consumer Survey on Sustainable Tea & Coffee Consumption: Partners in Change. Shaping globalization (Oct 2006): Impacts of voluntary standards International Conference report pg 24-25 Berlin. Standards and global trade: (2003) : A voice for Africa, World Bank.

ISSN: 2411-5681 www.ijern.com
466
The Sustainable Trade Initiative (IDH) - 2012: Cost-Benefit Analysis of Farmer Field Schools and Certification for Smallholder Tea Farmers in Kenya. The Sustainable Trade Initiative (IDH) 2013: Sustainable market transformation in action: Impact Studies.
Steering Committee of the State-of-Knowledge Assessment of Standards and ertification.(2012). Toward sustainability: The roles and limitations of certification. (Executive summary.) Washington, DC: RESOLVE, Inc.
The World Bank: Rwanda Economic (2011): Update is titled Seeds for Higher Growth. United Nations Environment Programme et al (2010): Carrots and Sticks – Promoting
Transparency and Sustainability: Approaches to Sustainability Reporting. An update on trends in Voluntary and Mandatory: KPMG Advisory N. V., Global Reporting Initiative, Unit for Corporate Governance in Africa,
Unilever Foundation (2013): UPDATE. Unilever sustainable living Plan 2013: Making progress, driving change Van der Wal, Sanne. June 2008. “Sustainability issues in the tea sector: A comparative analysis of six leading producing countries.” SOMO 7-110 retrieved 12 July 2014. V Nelson, Adrienne Martin, Carlos Barahona, Barry Pound and Claire Coote (2009): Assessing
the poverty impact of voluntary sustainability standards Conceptual and methodological framework DFID .
Waqas Khalid: Master Thesis (2010): On Branding in Small companies. A Case Study of Vital Tea, Pakistan.
Napi Wouapi and Tamo V. Maimo (2006) : Master’s thesis : Towards a comprehensive analysis of cleaner technology potentials to address industrial pollution arising from natural rubber processing industry: A case study of Cameroon Development Corporation - Rubber Factories 2006 : Department of Environmental, Social and Spatial Change - ENSPAC. Roskilde University, Denmark
Onduru, D.D., De Jager, A., Hiller, S. and Van den Bosch, R. (2012), “Sustainability of Smallholder tea production in developing countries: Learning experiences from farmer field schools in Kenya”, International Journal of Development and Sustainability, Vol. 1 No. 3, pp. 714-742.
Unilever 2013: Tea A Popular Beverage