assessment of watershed soundness by water balance using … · 2015. 10. 15. · youngsan river...
TRANSCRIPT

SESSION A3: HYDROLOGY
Room: Stewart 2782015 International SWAT Conference & Workshops
October 12-16, 2015
Purdue University, USA
2015 International SWAT Conference
Assessment of Watershed Soundness by Water Balance
Using SWAT Model for Han River Basin, South Korea
So Ra Ahn([email protected])
Ji Wan Lee, Chung Gil Jung, and Seong Joon Kim
Dept. of Civil & Environmental System Engineering
Konkuk University, SOUTH KOREA

Contents
Introduction (Why this study?)
Research procedure
Study area
SWAT model setup
Data for SWAT model evaluation
Spatial Calibration and Validation of the model
Water balance analysis (vertical and horizontal)
Impact of surface-groundwater exchange fluxes
Watershed soundness assessment
Summary and conclusions

Introduction (Why this study?)
3
With increasing concerns surrounding the global climate change, there has
been growing interests in the potential impacts to groundwater. It is
expected that the predicted global changes in temperature and precipitation
will alter the regional climates and water resources systems.
Therefore, the accurate understanding of hydrologic processes occurring in
basin is important to formulate the water resources policies, planning and
management decisions in the region.
We need to simulate the components of hydrologic cycle to determine the
impacts of land use changes, groundwater use, and dam operation of river
basin on water resources policies, planning and management.
The purpose of this study is to investigate the impacts of surface water and
groundwater interaction on water balance and groundwater recharge for
watershed soundness assessment of Han River basin (34,148 km²) in South
Korea by SWAT modeling.

5 Major River basins of South Korea
5 Major river basins in our
country (Han, Geum,
Yeongsan, Seomjin, and
Nakdong)
The global warming is now
warning the management
of streamflow (intensify
drought and flood)
Need to evaluate the
availability water resource
by water balance analysis
From the evaluation, find
out some insight and
prepare proper direction
for water management
system4
Han River
Nakdong RiverGeum River
Seomjin River
Yeongsan River
China
Japan
South Korea
North Korea
Seoul
Jeju island

5
North Korea
South Korea
Multi-purpose
DamMulti-function
weir
Han River Basin
At present, we have 20
multipurpose dams and 19
multifunction weirs in South
Korea.
They have been successfully
managed by both Korea Water
Resources Corporation (K-water)
and Korea Hydro & Nuclear
Power Co. Ltd. (KHNP) to fulfill
water demands, flood control
and hydropower generation.
Korea needs fundamental
countermeasures to mitigate
damages from repetitive floods
and droughts caused by climate
change.
Dams & Diversions of South Korea

Research procedure
6
SWAT Model
Weather data (1984-2014)
Evapotranspiration (2009-2013)
Soil moisture (2009-2013)
Groundwater level (2009-2013)
Observed Data
DEM, Soil, Land use
GIS Data
4 multipurpose water supply dams (1984-2014)
○ Dam inflow, storage, release
3 multifunction weirs (2012-2014)
○ Dam inflow, storage, release
Multipurpose Dam Data
Analysis of Water Balance
Vertical water budget and horizontal water transfers
Surface-groundwater exchange fluxes
Model Input
Model Process Dynamics
Vertical water budget : infiltration, evapotranspiration
Horizontal water transfer: surface runoff
Surface Processes Model run (1984-2014)
Warm-up (1984)
Calibration (2005-2009)
and validation (2010-2014)
○ Dam & weir inflow
○ Dam & weir storage
○ Evapotranspiration
○ Soil moisture
○ Groundwater level variation
Dam operation (2005-2014)
Vertical water budget : percolation, soil water storage,
Horizontal water transfer: lateral flow
Soil Water Dynamics
Vertical water budget : groundwater revap, groundwater recharge,
Horizontal water transfer: return flow
Groundwater Dynamics
Model Results
Watershed Soundness Assessment
Normalized metric value → sub-index
Watershed health index

Study area
China
Japan
South KoreaHan River
Nakdong River
Seomjin River
Youngsan
River
Geum River
The largest river basin in South Korea
(Han, Geum, Yeongsan, Seomjin, Nakdong)
Han River basin (34,148 km2)
Average precipitation 1254 mm
Average temperature 11.5℃ 7
Watershed
outlet
SM
CM
SWAT model
(237 sub-basins)
Namhan River
Bukhan River
Han River
SYD
HSD
CJD
KCW
YJW
IPW
PDD
Weather Station
Dam & Weir
Observation Station
Water Quality Station
Point Source
Watershed & Stream
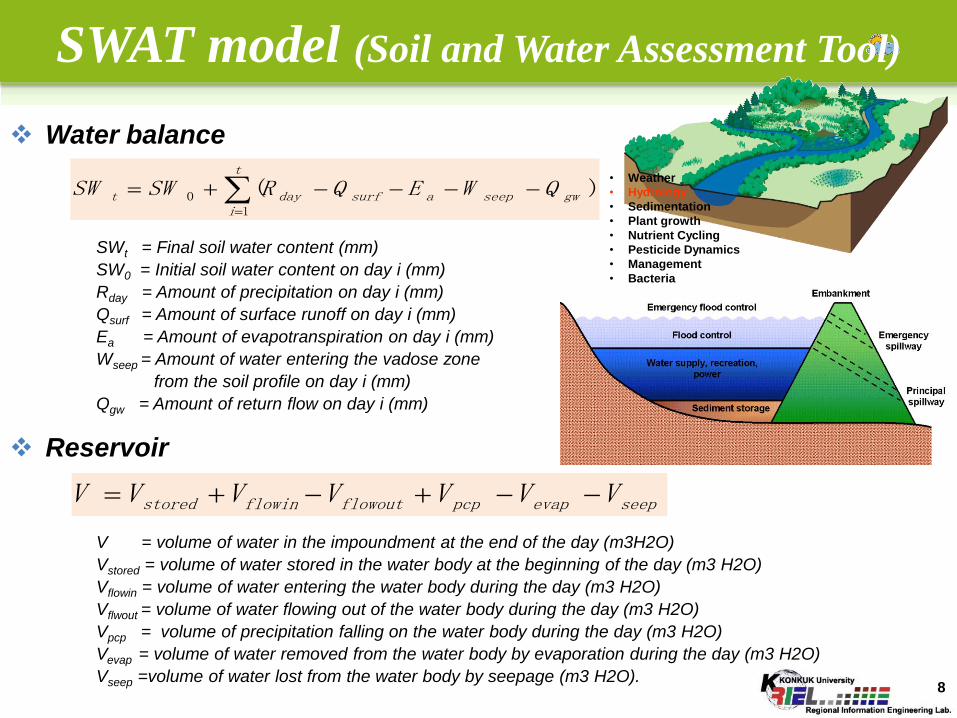
Water balance
Reservoir
SWAT model (Soil and Water Assessment Tool)
)(1
0 gwseepasurf
t
idayt QWEQRSWSW
SWt = Final soil water content (mm)
SW0 = Initial soil water content on day i (mm)
Rday = Amount of precipitation on day i (mm)
Qsurf = Amount of surface runoff on day i (mm)
Ea = Amount of evapotranspiration on day i (mm)
Wseep = Amount of water entering the vadose zone
from the soil profile on day i (mm)
Qgw = Amount of return flow on day i (mm)
seepevappcpflowoutflowinstored VVVVVVV
V = volume of water in the impoundment at the end of the day (m3H2O)
Vstored = volume of water stored in the water body at the beginning of the day (m3 H2O)
Vflowin = volume of water entering the water body during the day (m3 H2O)
Vflwout = volume of water flowing out of the water body during the day (m3 H2O)
Vpcp = volume of precipitation falling on the water body during the day (m3 H2O)
Vevap = volume of water removed from the water body by evaporation during the day (m3 H2O)
Vseep =volume of water lost from the water body by seepage (m3 H2O).8
• Weather
• Hydrology
• Sedimentation
• Plant growth
• Nutrient Cycling
• Pesticide Dynamics
• Management
• Bacteria

Data for SWAT model evaluation
Elevation : 0 - 1650m
(SRTM 90m grid size)
Soil : Loam (24%) and
sandy loam (58%)
Land cover (2008) : Forest
(73%) and paddy rice (6%)
Loam
Sandy loam
Forest
Paddy rice
GIS data
9

Data for SWAT model evaluation
4 Multipurpose dam data (area-level and storage-level relationship curve)
Hoengseong (HSD)
Chungju dam (CJD)
Soyang dam (SYD)
Paldang dam (PDD)
Total storage : 2.9 billion m3
Sub-basin area : 2,694 km2
(the largest in South Korea)
SYD
HSD
CJD
Total storage : 87 million m3
Sub-basin area : 209 km2
Total storage : 2.8 billion m3
Sub-basin area : 6,662 km2
(the second largest in South Korea)
Total storage : 244 million m3
Sub-basin area : 23,539 km2
Watershed
outlet
SYD
HSD
CJD
KCW
YJWIPW
PDD
SM
CM

Watershed
outlet
Data for SWAT model evaluation
3 Multifunction weir data (area-level and storage-level relationship curve)
Ipo weir (IPW)
Total storage : 17 million m3
Yeoju weir (YJW)
Total storage : 13 million m3
Kangcheon wier (KCW)
Total storage : 11 million m3
IPW
YJW
KCW
SYD
HSD
CJD
KCW
YJWIPW
PDD
SM
CM

Data for SWAT model evaluation
4 Multipurpose dam data (release and storage : 1984-2014)
12
Soyang dam (SYD) Hoengseong (HSD)
Chungju dam (CJD) Paldang dam (PDD)

Data for SWAT model evaluation
Ipo weir (IPW) Yeoju weir (YJW)
3 Multifunction weir data (release and storage : 2012-2014)
13
Kangcheon wier (KCW)

Watershed
outlet
SYD
HSD
CJD
KCW
YJWIPW
PDD
SM
CM
Model calibration and validation
Observed vs. simulated streamflow results of model calibration and validation
Calibration : 5 years (2005-2009) / Validation : 5 years (2010-2014)
Calibration period Validation period
Calibration period Validation period
Calibration period Validation period
Calibration period Validation period
SYD
HSD
CJD
PDD

Watershed
outlet
SYD
HSD
CJD
KCW
YJWIPW
PDD
SM
CM
Model calibration and validation
Observed vs. simulated streamflow results of model calibration and validation
Calibration : 2 years (2012-2013) / Validation : 1 year (2014)
Calibration period Validation period
Calibration period Validation period
Calibration period Validation period
IPW
YJW
KCW
15

Watershed
outlet
SYD
HSD
CJD
KCW
YJWIPW
PDD
SM
CM
Model calibration and validation
Fitted results of 4 multipurpose dams storage
Calibration period Validation period
Calibration period Validation period
Calibration period Validation period
Calibration period Validation period
SYD
HSD
CJD
PDD

Watershed
outlet
SYD
HSD
CJD
KCW
YJWIPW
PDD
SM
CM
Model calibration and validation
Fitted results of 3 multifunction weirs storage
Calibration period Validation period
Calibration period Validation period
Calibration period Validation period
IPW
YJW
KCW
17

Watershed
outlet
SYD
HSD
CJD
KCW
YJWIPW
PDD
SM
CM
Model calibration and validation
Observed vs. simulated ET & SM results of model calibration and validation
Calibration : 3 years (2009-2011) / Validation : 2 years (2012-2013)
18

Watershed
outlet
SYD
HSD
CJD
KCW
YJWIPW
PDD
SM
CM
Model calibration and validation
Observed vs. simulated groundwater level variation results of model calibration and validation
Calibration : 3 years (2009-2011) / Validation : 2 years (2012-2013)
19
Calibration period Validation period
Calibration period Validation period
Calibration period Validation period
Calibration period Validation period
Calibration period Validation period

1392.1 (100%)
458.0 (32.9%)
360.4 (25.9%)
321.5 (23.1%)
737.5 (53.0%)
360.4 (25.9%)16.7 (1.2%)
22.2 (1.6%)
Total Runoff (TQ)909.2 (65.3%)
209.2 (15.0%)
Water balance analysis
River basin water balance (water balance ratios based on precipitation)
30 years (1985-2014) simulated by SWAT
SYD
HSD
CJD
KCW
YJWIPW
PDD
SM
CM
Period
Total Surface Processes Soil Water Dynamics Groundwater Dynamics
P
(mm)
TQ
(mm)
INFILT
(mm)
ET
(mm)
SQ
(mm)
PERCOL
(mm)
SW
(mm)
LQ
(mm)
REVAP
(mm)
GR
(mm)
RQ
(mm)
Rainy Season
(Jun-Sept)1004.5
644.0
(66%)577.9
249.8
(25%)
179.4
(18%)258.9 77.8
280.0
(28%)12.1 69.2
204.7
(20%)
Dry season
(Oct-May)387.6
227.0
(59%)159.6
208.2
(54%)
29.8
(8%)74.9 80.8
80.4
(21%)4.7 -41.0
106.8
(30%)
Annual 1392.1909.2
(65%)737.5
458.0
(33%)
209.2
(15%)360.4 79.8
360.4
(26%)16.7 22.2
321.5
(23%)
Groundwater recharge (GR)Flow out of watershed
Reevaporation (REVAP)
Surface Processes
Soil Water Dynamics
Groundwater DynamicsPercolation (PERCOL)
Infiltration (INFILT)
Precipitation (P)
Evapotranspiration
(ET)
Surface runoff (SQ)
Lateral flow (LQ)
Return flow (RQ)
All Units mm
+29% +10%

Water balance analysis
Daily water balance (between surface water and groundwater)
Surface Processes
Soil Water Dynamics
Groundwater Dynamics
Surface Processes
Soil Water Dynamics
Groundwater Dynamics
22
ET: 23%
TQ: 75%
INFILT: 60%
PERCOL: 31%
Flood year (2011) Drought year (2014)
ET: 56%
TQ: 44%
INFILT: 38%
PERCOL: 15%

Impact of surface-groundwater exchange fluxes
Monthly average discharge (surface runoff, lateral flow, and return flow)
30 years (1985-2014) simulated by SWAT
Surface runoff
Lateral flow
Return flow
23
Higher discharges
Watershed
outlet
SYD
HSD
CJD
KCW
YJWIPW
PDD
SM
CM

Impact of surface-groundwater exchange fluxes
Monthly average exchange fluxes (between surface water and groundwater)
and groundwater recharge
30 years (1985-2014) simulated by SWAT
Exchange fluxes (between groundwater and surface water)
Groundwater recharge
24
(a) February to August
(b) September to January
↑ Positive
↓ NegativeWatershed
outlet
SYD
HSD
CJD
KCW
YJWIPW
PDD
SM
CM

Comparison of the water balance components 30 years (1985-2014), flood year (2011), drought year (2014)
Watershed Soundness Assessment
Precipitation (mm) Total Q (mm) Infiltration (mm) ET (mm) Surface runoff (mm)
Percolation (mm) SW storage(mm) Lateral Q (mm) Revap (mm) GW recharge (mm) Return Q (mm)
Surface Processes
Soil Water Dynamics Groundwater Dynamics
(a) 30yrs (a)
(b) 2011(flood)
(c) 2014(drought)
(b) (c)
(a)
(b) (c)
(a)
(b) (c)
(a)
(b) (c)
(a)
(b) (c)
(a)
(b) (c)
(a)
(b) (c)
(a)
(b) (c)
(a)
(b) (c)
(a)
(b) (c)
Total

Watershed soundness index (hydrology) 30 years (1985-2014)
Watershed Soundness Assessment
Surface
Processes
Soil Water
Dynamics
Groundwater
DynamicsTotal
Low
(0)
High
(1)
Watershed soundness
Normalized sub-index
Standard watershed 101306
Total 0.98
Surface Processes 0.99
Soil Water Dynamics 0.58
Groundwater Dynamics 0.72
Watershed soundness 0.96
Dam & Weir
Standard watershed 100902
Total 0.76
Surface Processes 0.43
Soil Water Dynamics 0.84
Groundwater Dynamics 0.09
Watershed soundness 0.29
Watershed soundness index
Normalized
component
value
Simulated value for watershed x
Max. value for all watersheds=
Sub-index
(Normalized value 1 + Normalized
value 2 + ... + Normalized value x)
Total number of normalized values=
Watershed
soundness
index
(Sub-index 1 + Sub-index 2 + … +
Sub-index x)
Total number of sub-indices=
Ref.) EPA 2012, Identifying and Protecting Healthy Watersheds

Summary and conclusions
In this study, the surface water and groundwater interaction modeling of Han River basin
in South Korea was performed using SWAT model.
The SWAT was calibrated using 4 measured dam and 3 weir operation data (storage and inflow)
and with spatial hydrologic component data (evapotranspiration and soil moisture).
The SWAT model was used in the analysis of the water balance by vertical water budget (INFILT,
ET, PERCOL, SW, REVAP and GR) and the horizontal water transfers (SQ, LQ and RQ).
During dry season (Oct. to May), the evapotranspiration and return flow was 29% and
10% higher compared to those of wet season. So, they should be treated as important
factors for the whole hydrological cycle.
The period of (a) February to August was characterized by net inflow of infiltration into
the groundwater. For the (b) September to January period, the groundwater flow into the
river of the basin showed net outflow. The whole period was nearly balanced by the net
flux. The groundwater recharge was found as an important factor to show the same
pattern of exchange fluxes during the hydrological year.
The results of this research is planned to investigate the impact of climate and
land use change scenarios on water resources and to assess the soundness
and vulnerability of watershed regions.
26

Thank you
Earth Information Engineering Lab.
Ahn, So RaDept. of Civil and Environmental System Engineering
Konkuk University, Seoul, South Korea
Phone: +82-2-444-0186
Email: [email protected],kr
Web: http://konkuk.ac.kr/~kimsj/