assessment of wind erosion risk on the agricultural area
TRANSCRIPT

Ž .Journal of Hazardous Materials 61 1998 139–153
Assessment of wind erosion risk on the agriculturalarea of the southern part of Hungary
Gabor Mezosi ), Jozsef Szatmari´ ¨ ´ ´UniÕersity of Szeged, Department of Physical Geography, Egyetem Str. 2, H-6722 Szeged, Hungary
Abstract
Wind erosion processes endanger nearly 23% of the total surface of the Danube-TiszaInterfluve region. Thus it is apprent that conservation of light sand soils against wind erosion isvital, so much as privatization started in the first years of this decade brought fundamental changesin facilities of soil protection. In 80’s a county-wide soil protection network directed the resaech to
Ž . Ž .reduce the damages. After the privatization 1988-89 the landuse type and structure waschanged. The results of this process were overlapped with the natural aridification tendency of theSouth Hungarian Region. Both changes indicated us to launch a research project with thefollowing aims: - to build up stations for measurements of deflation and accumulation of sandysoils, - to provide suitable information and advice for the private landowners - to assess the risk ofwind erosion in the Danube-Tisza Interfuve region for the regional development plan. In this studywe would like to summerize last problem, to border the territories endangered by wind erosion andalso to define the size of these areas. We marked out 64 km2 large area around the stations. Themonitoring methods of the test area were elaborated. After collecting and measuring of thegeomorphological, soil and landuse characteristics these data were transported to a database. Theidea of the analysis based on GIS and remote sensing methods. We selected the surfaces coveredby sandy soils, the surface was used as cultivated area and posited not in the depression betweensand dunes. There are the where the wind erosion might be active due to the ecological parametersŽ .ecologically critical areas ECA . Taking the Landsat and SPOT images the soil wetness indexŽ .SWI were calculated. On the SWI relates to canopy and soil moisture. We supposed that the
Ž .driest areas SWI -6% exposed to wind erosion a greater extent. Overlapping the maps ofphysical parametes by the SWI map and the landuse map good correlations were found betweenthe landuse and SWI indexes. q 1998 Elsevier Science B.V. All rights reserved.
Keywords: Wind erosion; Agricultural land; Hungary; Sandy soil
) Corresponding author.
0304-3894r98r$19.00 q 1998 Elsevier Science B.V. All rights reserved.Ž .PII S0304-3894 98 00118-6

( )G. Mezosi, J. SzatmarirJournal of Hazardous Materials 61 1998 139–153¨ ´140
1. Introduction
Wind erosion poses a serious problem in many parts of the world and is a dominantissue in Hungary too, where there are wind-blown areas of a considerable size. These
´Fig. 1. Feherto-Majsa Experimental Catchment A research station. 1:village; 2:sand; 3, 4, 5:alkaline soil;´ ´6:lake; 7:temporarily flooded area; 8:test area; 9:road; 10:road; 11:canal; 12:watershed divide; 13:weir;14:groundwater observation well; 15:archaeological excavations.

( )G. Mezosi, J. SzatmarirJournal of Hazardous Materials 61 1998 139–153¨ ´ 141
Ž .Fig. 2. The changes in land use caused by the privatization near the test area, South Hungary .
occupy nearly 23% of the total surface of the country. Agricultural land, which is mostsusceptible to wind erosion is situated in a large blown-sand area in the southern part of
Ž .Hungary, between the Danube and Tisza rivers Fig. 1 . Wind-blown sand areas play aconsiderable part in farming and their importance is ever growing. Thus conservation oflight sand soils against wind erosion is apparently vital, so much the more as theprivatization started in the first years of this decade brought fundamental changes infacilities of soil protection. In the ’80s a county-wide soil protection network directed
Ž .the research to reduce the damages. After the compensation 1990–1992 the land useŽ . Ž .type and structure was changed Fig. 2 . The results of this process were overlappedwith the natural aridification tendency of the South Hungarian Region. Both changesindicated us to launch a research project with the following aims:
–to build up stations for measurements of deflation and accumulation of sandy soils,–to provide suitable information and advice for the private landowners,–to assess the risk of wind erosion in the Danube-Tisza Interfuve region for theregional development plan.
2. Arrangements
The Department of Physical Geography launched a research project on wind erosionin 1994. To study deflation occurring in the Danube-Tisza Interfluve, a research stationwas located for measurements of deflation and accumulation of sandy soils, of meteoro-
Ž .logical and climatic conditions of wind erosion Fig. 3 .

( )G. Mezosi, J. SzatmarirJournal of Hazardous Materials 61 1998 139–153¨ ´142
Fig. 3. The hydro-meteorological station and the experimental parcel of measurements of wind erosion.
Experimental parcel was located next to the former hydro-meteorological station ofŽ .VITUKI Research Institute for Water Resources Development following the concept
of J. Karacsony. The main reason for our choice of this territory was that there has been´hydrological research since 1962 in the catchment area of Feherto-Majsa Main Canal,´ ´which provides us continuous hydrological, pedological and meteorological series ofdata on the area. Beside the traditional research methods, most up-to-date methodsshould also be applied, which enables us to gain information from isolated field datameasured on relatively small territories to bigger regions. The specific structure ofpedological, land use and water balance features defines the rate of extrapolation. Toestimate this rate, we suggest using Remote Sensing and GIS methods. Remote Sensingis proved to be a possible source of data from which updated land cover information can
w xbe obtained effectively 1 . With the help of satellite images we can investigate the mostimportant reasons of wind erosion, e.g. surface temperature, condition of vegetation andsoil moisture. By using aerial photos larger accumulated and eroded resultant forms can

( )G. Mezosi, J. SzatmarirJournal of Hazardous Materials 61 1998 139–153¨ ´ 143
be characterized. In order to characterise the surface state better, we must integrate dataother than remotely sensed ones, such as measured data derived from the field andlaboratory work.
3. The study area
3.1. Geomorphology and lithology
The test site is situated near Kiskunmajsa on the SE part of the Danube-TiszaInterfluve. The wind-blown sand areas can be investigated from the western border ofthe alluvial flood plain of the river Tisza. This area is the residue of the large alluvial fanof the river Danube, which was mainly formed during the Pleistocene. The sand andsandy silt deposits of the alluvial fan ridge have not been shaped by fluvial since the
Ž .middle of the Wurm up to the Interpleniglacial epoch . In this period, due to structural¨motions, the Danube gradually abandoned its alluvial fan in the Interfluve and assumed
w xa N–S direction of flow 2 . Particularly in the Late-Pleistocene and during the dryperiods of the Holocene the loose fluvial deposits of the alluvial fan were reworked bywind.
The thickness of the transported and accumulated blown sand ranges from 10 to 30m. The most characteristic landforms are windrift, residual ridges, sand hills as well assand dunes. From the aerial photos the long straight valleys can be studied well, opposedto the accumulated positive sand blown landforms. In these valleys, which are parallel to
Fig. 4. Geological profile of the test area. 1:calcareous mud; 2:wind-blown sand; 3:loessic sand; 4:typicalŽ w x.loess; 5:groundwater level after Ref. 4 .

( )G. Mezosi, J. SzatmarirJournal of Hazardous Materials 61 1998 139–153¨ ´144
the most characteristic NW wind direction, there are small lakes or sometimes smallerstreams. The valleys with infrequent ponds are not only parallel with the dominant winddirection, but indicate the general slope of the area. The lake basins should be regardedas depressions produced by wind erosion. In addition to deepening by wind erosion theevolution of these depressions is partly the result—in the periods of spring snowmelt
w xand rainy weather—of surface waterflow and ground water percolation 3 .
Ž .Fig. 5. a Extension of represented types of land cover on different topographic maps between 1782 and 1983.Ž .1a-2a-3a:forest; 1b:sand dunes; 2b–3b:vineyard, orchard; 4:village; 5:station; 6:road. b Extension of repre-
sented types of land cover on different topographic maps between 1782 and 1983. 1a-2a:temporarily floodeddepression; 3a:grassland; 1b-2b-3b:lake; 4:village; 5:station; 6:road.

( )G. Mezosi, J. SzatmarirJournal of Hazardous Materials 61 1998 139–153¨ ´ 145
Ž .Fig. 5 continued .
ŽThe soil of the territory consists predominantly of sand dominant grain-size is.0.1–0.2 mm with silt in spots. On the bottom of the valleys, silty–sodic sediments are
Žbeing formed containing dolomite silt carbonate content of it reaches 80% at certain.places and clay. The thickness of silty and alkaline soil layers generally does not exceed
Ž .0.5–1.0 m Fig. 4 .
3.2. EnÕironmental degradation caused by man
Lack of palaeosol soil prevents us having precise chronological data on sandmovements in the Holocene. After the Holocene Atlantic phase due to the strengthening

( )G. Mezosi, J. SzatmarirJournal of Hazardous Materials 61 1998 139–153¨ ´146
of the vegetation, sand movement could have only been caused by anthropogenicw xactivities 5 .
Observing soil profiles of archaeological excavations near the study area, we came tothe conclusion that the possibilities of accumulation of several-metre-thick wind blownsand on these surfaces have been very little in the latest 2000 years.
The deforestation, which extended to larger and larger areas in the 16th century,completely changed the state of land cover. Wind blown sand covered the surface of theGreat Hungarian Plain as thick as 20–300 cm. There were devastating dust storms in theDanube-Tisza Interfluve in 1756–1758, which were caused by the destruction of
w xgrassland downtrodden and poached by inconsiderate grazing 6 .Deforestation in the 18th century was extended to dune surfaces with higher relief
w xenergy, in order to conquer newer and newer territories for agriculture 2 . Studying Fig.5 and Table 1, we can follow changes in land use on the area if we compare the
Ž . Ž .appropriate classes of first 1782 and third 1881 military mapping and a topographicalmap from 1983. At the end of the 18th century primaeval forests partially hindered sandmovement. In the following century most of these forests were cut and planted vineyardsand orchards in several areas, though vast territories were still exposed to damagescaused by wind erosion.
Ž .Today the NE part of the test area Kompoci-erdo and the SW part of the test area¨ ¨ ˜Ž .Aranyhegyi-szolok, Csolyosi-erdo are protected against wind erosion. In Fig. 5b we˜ ˜ ´ ˜can study the changing extension of grasslands, temporarily and permanently floodedareas. Comparing these map information with the weather conditions of the period andits meteorological data series we can get a more precise picture of the landscape changew x7 .
The most attractive interferences within the agricultural landscape, however, werethose of the modern times in which the territories most threatened by wind erosion were
w xthe most intensively used agricultural lands with the highest production 8 . The largestintervention within the structure of farm plots, however, was that of the collectivizationperiod which features the agriculture of this country between 1960–1989. The spreadingof plant cultivation technologies necessitated the creation of larger fields, whichincreased the length of affected areas. Large areas of fields on which there was novegetation in repeated seasons have been now exposed to wind erosion.
The structure of land use in the early 1960s with much smaller fields and with aŽ . Ž .dense tanya grange network and rows of trees shelter belts approached the optimal
Table 1Extension of represented types of land cover
2Ž .Land cover km Year of mapping
1782 1881 1983
Forest 3.30 1.30 9.67Vineyard, orchard 0.00 1.70 4.76
aŽ .Swamp semlyek 1.52 7.25 17.04´Lake 0.04 0.75 0.19
aGrassland with swamps.

( )G. Mezosi, J. SzatmarirJournal of Hazardous Materials 61 1998 139–153¨ ´ 147
Ž .organization of plough-fields. We compared the topographic maps scale of 1:100 000of the test area mapped before the collectivization and mapped much later, in the 1980s.The number of granges on this area was 160 at the end of the 19th century, 340 in theearly 1960s whereas this number is nowadays 190. The disappearance of the grangeswas accompanied with a significantly decreasing length of rows of trees and shelter-be-lts. A way to improve the spatial organization, which is unfavourable today, is to form a
w xcomplex shelter-belt system in all the areas sensitive to wind erosion 9 .
3.3. Climate
The average annual precipitation for this area is lower than 550 mm. The averagemonthly and annual precipitation figures show the presence of a dry period in earlyspring, middle summer, late summer and early autumn. In the second half of the summerthe probability of a rainless period is much higher here than in other regions of Hungary.
The investigated area has a continental climate and may be characterized as a warmsand steppe with hot summers. In warm years mean annual temperature is above 11.58C.
Ž .July mean temperature is above 228C. The largest number of summer days 85–90 isfound here and hot days are more than 30 annually. A long, warm autumn is typical; thedaily temperature sinks below 108C after October 25. Winter is moderately cold, themean temperature for January is y1.58C. In spring the daily mean temperature risesabove 108C as early as April 5.
The potential and actual evapotranspiration show a considerable water deficit in theŽ . Ž .area from May 10 mm to September in August 48.8 mm . Consequently, the soil
surface totally dries up during this period, the grains of the upper sandy soil lose theirwater content which is necessary for bonding. In this way, wind erosion can remove,
w xblow out, transfer and accumulate sand 10 .The prevailing wind is the NW, while the second most frequent direction is the SE,
w xwith higher frequencies in the spring and autumn months 11 . The strong NW andŽ . w xNNW above 58B winds are most frequent between June and September 3 .
w xBased on the data series of measurement between 1963 and 1973 12 , the weeklyŽ .frequencies of winds higher than 3 mrs daily averages and the averages of dry soil
w xstate 6 were compared. The values clearly indicate that the months of April, OctoberŽ .and November are critical from the aspect of wind erosion Fig. 6 .
Comparing relationships between the frequency of different wind velocity with thefrequency of values of soil moisture the correlation coefficients show significantrelationship between the winds which are stronger than 3–4 mrs with the dry soil stateŽ . Ž .0.6–0.7 . There was a weaker correlation 0.4 in the case of weekly frequencies ofwinds with higher than 6 mrs velocity, suggesting that the strongest occurrences of
Ž .wind February–April, November do not coincide with the driest periods of soil state inŽ .the area July–August .
The climatological prognostics suggest 1 mm annual precipitation loss for the nextdecades and the predicted rise in temperature is 0.58C in 20 years and 1.08C rise in 50years in the Danube-Tisza Interfluve. All these mean that the annual rainfall will dropbelow 500 mm and that will not cover the water demand of the region. They result in agrowing aridification and in dropping of the groundwater table, which is to mobilize the

( )G. Mezosi, J. SzatmarirJournal of Hazardous Materials 61 1998 139–153¨ ´148
Ž . Ž .Fig. 6. Weekly frequencies of wind velocity wv and the averages of dry soil state soil-moisturessm-6%between 1963–1973.
sand movement in the region. Due to the changing climatic conditions 30–50% increasew xof the wind erosion rate may be predicted 13 .
4. Methods
The purpose of our research is to work out the wind erosion model of theDanube-Tisza Interfluve: to mark the territories endangered by wind erosion and todefine the size of these areas and the mass of sandy soils removed by the wind. Between1995–1998, we have been drawing up and testing the methods of wind erosionmonitoring on the test area at Kompoc.¨ ¨
We started this job by having a parcel formed out next to the Hydro-meteorologicalstation at Kompoc, where we measure the intensity of wind erosion and the quantity of¨ ¨the soil transported by wind. On the 50 m by 100 m parcel we set 1-m-high stakesbeside which we weekly measure the eroded and the accumulated quantity of sand. Onepart of the parcel is agriculturally cultivated where we plant different types of crops eachyear. The other part is an uncultivated control area where we can measure erosion arisenon strongly erodible soil surface.
Ž .Continuous observation was carried out on the parcel from 31 May 1995 Fig. 7 .These data were computerized by Surfer software. Fig. 8 shows that within the

( )G. Mezosi, J. SzatmarirJournal of Hazardous Materials 61 1998 139–153¨ ´ 149
Fig. 7. Contour map and surface of the parcel showing the differences between 3 Apr–14 Apr 1997.A saccumulation, Dsdeflation.
Ž .two-week-long observation interval from 3 April 1997 till 14 April 1997 sand wasŽ .eroded on the parcel by an extremely strong wind effects 235 tons from the test parcel .
The quantity of eroded soil was ca. 1000 trha, which seems to high, but there were thestrongest wind in the last decade, the average was over 8 mrs. Data series of two yearsmakes us assume that this surface is a depositional area of the sediment removed bywind, which supposition must be supported by further sedimentological analysis. At theborder of the control and the cultivated areas, a deep, deflational zone was formed whichproves that the densely planted wheat has wind driving effect. We have calculated themass of accumulated and eroded sand on the 2750 m2 large uncultivated plot. In 1995,the cultivated part of the parcel was sown by wheat and sand movement practically wasnot learnt here. In the fall of 1995 we planted clover to this area. A storm-wind at thebeginning of November 1995 totally eroded the first sowing so it had to be repeated inspring. Though there was no wind erosion on the parcel partially due to tillage problems.
Next we marked out a 64 km2 large test area which has the parcel within its centre.The monitoring methods of the test area were elaborated. We prepare the geomorpholog-ical, soil and land use maps of this area. These data form the basis of the remote sensing
Ž .analysis. We collected airborne photos 1964, 08r05r1988, 04r05r1992 , LANDSATŽ . Ž .TM satellite images 03r08r1985, 29r08r1992 and SPOT image 21r09r1993 of
the test area and we are paying attention to obtaining the latest images as well.

( )G. Mezosi, J. SzatmarirJournal of Hazardous Materials 61 1998 139–153¨ ´150
Ž . Ž . Ž 2 . Ž .Fig. 8. Area of accumulation A and deflation D on the experimental parcel m and mass m of theŽ .accumulated and eroded soil ton between 31 May 1995 and 20 May 1997.
We have produced several thematic maps and layers of the test area using ERDASIMAGINE 8.2 software:
Ž .–two photo maps scale of 1:25 000 showing the differences of land use, the spatialstructure of farming, wind breaking systems, etc. of the state of 1964 and 1992 years;–different real colour and infra-red images are used to compare the yearly andseasonal changes;–airborne photos, satellite images and topographical maps are used to define the
Ž .different classes of land use maps Table 2 ;Ž .–thematic layers based on different indices VGI, SWI, etc. and
Ž .–soil temperature maps LANDSAT Band 6 .
Table 2Ž . Ž .Land use classes in 1965 on the catchment area of the main canal and in 1992 on the test area
Ž .Year Land use %
Arable Garden Built-up Vineyard Orchard Grassland Forest
1965 64 1 8 24 31992 33 14 5 7 24 17
( )G. Mezosi, J. SzatmarirJournal of Hazardous Materials 61 1998 139–153¨ ´ 151
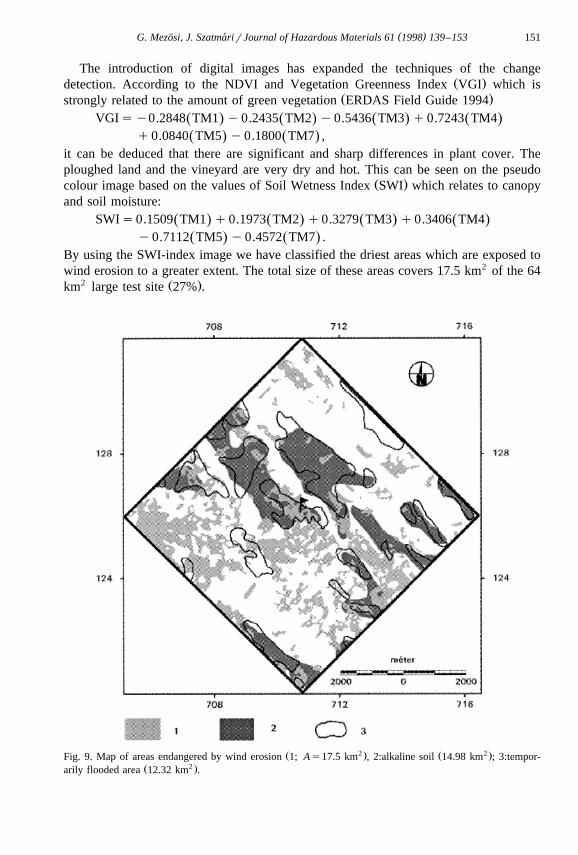
The introduction of digital images has expanded the techniques of the changeŽ .detection. According to the NDVI and Vegetation Greenness Index VGI which is
Ž .strongly related to the amount of green vegetation ERDAS Field Guide 1994VGIsy0.2848 TM1 y0.2435 TM2 y0.5436 TM3 q0.7243 TM4Ž . Ž . Ž . Ž .
q0.0840 TM5 y0.1800 TM7 ,Ž . Ž .it can be deduced that there are significant and sharp differences in plant cover. Theploughed land and the vineyard are very dry and hot. This can be seen on the pseudo
Ž .colour image based on the values of Soil Wetness Index SWI which relates to canopyand soil moisture:
SWIs0.1509 TM1 q0.1973 TM2 q0.3279 TM3 q0.3406 TM4Ž . Ž . Ž . Ž .y0.7112 TM5 y0.4572 TM7 .Ž . Ž .
By using the SWI-index image we have classified the driest areas which are exposed towind erosion to a greater extent. The total size of these areas covers 17.5 km2 of the 64
2 Ž .km large test site 27% .
Ž 2 . Ž 2 .Fig. 9. Map of areas endangered by wind erosion 1; As17.5 km , 2:alkaline soil 14.98 km ; 3:tempor-Ž 2 .arily flooded area 12.32 km .

( )G. Mezosi, J. SzatmarirJournal of Hazardous Materials 61 1998 139–153¨ ´152
On Fig. 9 we signed with the help of remotely sensed data those territories which areendangered by wind erosion. We have also indicated the extension of alkaline soils andthe temporarily flooded areas. Comparing Figs. 5 and 9 we can conclude that remotesensing procedure showed that those agricultural lands are exposed to erosion whichwere classified neither as afforested nor as temporarily or permanently flooded areas noras grassland by topographic and field data. In the orchard–vineyard category there wassome overlap as these sand surfaces are dry but are less endangered by wind erosion,and they cannot be separated clearly from ploughed lands because of their scatteredvegetation.
5. Discussion
w xResearch on aridification processes in the Carpathian Basin 14–16 predicts gener-ally drier conditions in the following decades. Consequently, soil protectionists faceincreasing work, of which we would like to take our shares. Our long-run aim is to buildan observational network on wind erosion in the Danube-Tisza Interfluve. The first
Ž .steps, which have already been taken, are: 1 to collect field data of fundamentalŽ .importance by making measurements on the parcel; 2 to mark out large territories
which are endangered by wind erosion, using remote sensing which proved to be aŽ .reliable means; 3 we assume that satisfactory results can be gained from a continuous
monitoring of the Danube-Tisza Interfluve based on field experiments, up-to-date remotesensing data and GIS methods. It could be reached only if sciences and their expertsconcerned cooperated more efficiently than today.
References
w x1 Y. Smara, et al., Methodology for degradation monitoring in an arid and semi arid region, in: Proc. ofEARSeL ’95 Conf., Czech Republic, 1995, pp. 30–39.
w x2 Z. Borsy, Phases of blown-sand movement in the NE part of the Great Hungarian Plain, Acte Geogr.Ž .DeBreaia xx 1982 35–50.
w x3 L. Jakucs, Physico-geographical and climatological landscape analysis in the sand areas of Csongrad´county with special regard to prevention of wind erosion, Acta Geogr. Szegediensis XXVIII–XXXŽ .1990 3–30.
w x Ž .4 L. Kuti Ed. , Geologic Map of the Great Hungarian Plain, Scale of 1:100000, 1980.´w x5 J. Loki, Mezogazdasag-kozpontu termeszetfoldrajzi vizsgalatok a Duna-Tisza koze E-i felenek peldajan,´ ¨ ´ ¨ ´ ´ ¨ ´ ¨ ´ ´ ´ ´
Kandidatusi ertekezes, Debrecen, 1994, p. 199.´ ´ ´w x w6 I. Bodolay, Szelerozio elleni vedekezes ontozott homokteruleteken, Protection from wind erosion in´ ´ ´ ´ ´ ¨ ¨ ¨ ¨
x Ž . Ž .irrigated sand areas Agrokemia es Talajtan 14 1–2 1965 1–15.´ ´w x7 J. Szatmari, A termeszeti taj ember altali atalakıtasanak hatasa a szelerozio dinamikajara Duna-Tisza kozi´ ´ ´ ´ ´ ´ ´ ´ ´ ´ ´ ´ ´ ´ ¨
mintateruleten, in: Geografus Doktoranduszok Elso Orszagos Konferenciajanak Eloadasai, Pecs, 1996.¨ ´ ¨ ´ ´ ´ ¨ ´ ´w x8 M. Hradek, R. Svehlık, Dust storms in Moravia and Silesia, in: Natural Hazards in the Czech Republic,´
Brno, 1995, pp. 81–109.w x9 T. Bauko, P. Beregszaszi, Simplifying agricultural patterns—increasing damage by wind in Bekes´ ´ ´ ´
Ž .county, Kornyezetgazdalkodasi evkonyv 1990 87–95.¨ ´ ´ ´ ¨w x10 L. Mucsi, Soil erosion and sand movement in the Southern part of Hungary, in: Proc. of EARSeL ’93
Conf., Dundee, 1993, pp. 189–200.

( )G. Mezosi, J. SzatmarirJournal of Hazardous Materials 61 1998 139–153¨ ´ 153
w x w11 K. Tar, Magyarorszag szelklımajanak komplex statisztikai elemzese, A complex statistical analysis of´ ´ ´ ´ ´ ´x Ž .wind climatology in Hungary OMSZ kisebb kiadvanyai 67 1991 28–88.´
w x Ž .12 G. Kienitz Ed. , Data of Representative and Experimental basins: I. Feherto-Majsa Experimental´ ´Catchment, Budapest, 1974, pp. 105–472.
w x13 G. Mezosi, The predicted wind erosion rate in the Carpathian Basin, Abs. of the IAG ERC ’96, Budapest,1996, p. 86.´ ´w x Ž . Ž .14 A. Kertesz, Az aridifikacio fogalmanak ertelmezese, Foldrajzi Ertesıto XLV 1–2 1996 5–9.´ ´ ´ ´ ´ ´ ¨ ´ ¨
w x15 G. Mezosi, F. Kevei, R. Geczi, A Duna-Tisza koz nehany taji ertekenek prognosztizalhato valtozasa, in:´ ¨ ´ ´ ´ ´ ´ ´ ´ ´ ´ ´Ž .L. Szabo Ed. , A Termofold Vedelme, Godollo, 1996, pp. 34–48.´ ¨ ¨ ´ ¨ ¨ ¨
w x w16 J. Mika, Az Alfold eghajlatanak megvaltozasa a globalis klımavaltozas osszefuggeseben, Climatic¨ ´ ´ ´ ´ ´ ´ ´ ´ ¨ ¨ ´ ´x Ž .changes in the Alfold in relation to global climatic change Alfoldi Tanulmanyok, Bekescsaba XV 1993¨ ¨ ´ ´ ´
11–31.